Article

Design and Research of an Intelligent Detection Method for Coal Mine Fire Edges

1
School of Safety Engineering, China University of Mining and Technology, Xuzhou 221116, China
2
National Mine Emergency Rescue National Energy Shendong Team, Ordos 017200, China
3
School of Information and Control Engineering, China University of Mining and Technology, Xuzhou 221116, China
4
CUMT-IoT Perception Mine Research Center, China University of Mining and Technology, Xuzhou 221116, China
*
Author to whom correspondence should be addressed.
Appl. Sci. 2025, 15(19), 10589; https://doi.org/10.3390/app151910589
Submission received: 21 May 2025 / Revised: 27 June 2025 / Accepted: 3 July 2025 / Published: 30 September 2025

Abstract

Mine fire is caused by external heat source or coal seam spontaneous combustion, and there are serious hidden dangers in mining operation. The existing detection methods have high cost, limited coverage and delayed response. An edge intelligent fire detection system based on multi-source information fusion is proposed. We enhance the YOLOv5s backbone network by (1) optimized small-target detection and (2) adaptive attention mechanism to improve recognition accuracy. In order to overcome the limitation of video only, a dynamic weighting algorithm combining video and multi-sensor data is proposed, which adjusts the strategy according to the real-time fire risk index. Deploying quantitative models on edge devices can improve underground intelligence and response speed. The experimental results show that the improved YOLOv5s is 7.2% higher than the baseline, the detection accuracy of the edge system in the simulated environment is 8.28% higher, and the detection speed is 26% higher than that of cloud computing.

1. Introduction

Traditional fire detection primarily relies on sensors to identify the physical characteristics of a fire. While this method can achieve high accuracy when a large number of sensors are deployed, it comes with significant costs and may fail to detect fires promptly when the sensors are located far from the source. With advancements in deep learning and artificial intelligence, conventional fire detection methods are gradually being replaced by video-based approaches. Deep learning has made groundbreaking progress in various computer vision tasks, including image classification [1], object detection [2], instance segmentation, and image retrieval. In some cases, it has even surpassed human performance. Fire detection as an object recognition task presents a particularly complex challenge in computer vision. This is because fire recognition requires learning distinctive features of flames from images and leveraging these features to identify real-world combustion scenarios. However, the shape and color of flames are highly variable, making it essential for models to extract deep-level features while integrating contextual background information and domain-specific knowledge for comprehensive analysis and accurate judgment.
The underground mining environment is highly complex and constantly changing. As mining operations expand and extraction depths increase, high humidity, elevated temperatures, and excessive dust frequently occur, leading to reduced sensor accuracy. Furthermore, during the early stages of a mine fire, smoldering combustion (often producing low-visibility smoke) may impair the reliability of visual detection methods, delaying fire identification. Consequently, relying on a single indicator is inadequate for precise fire detection. To ensure measurement robustness, a multi-sensor data fusion approach is essential for cross-validating environmental parameters. Compared with other logic systems, fuzzy logic algorithm can make decisions more accurately. Fuzzy logic is applicable because it uses nonlinear linguistic values. At the same time, the use of membership function allows fuzzy logic to objectively observe the subjective value. Because the previous research is aimed at multi-source data fusion between different sensors, and this research fuses video data on the basis of sensor networks, fuzzy logic method is used for multi-source data fusion.
Different from the traditional target detection task, fire detection requires strict real-time performance due to the rapid spread of flame. Early and accurate fire detection in the controllable stage can significantly reduce the risk of catastrophic events. However, the cloud based fire detection system [3] is prone to data and response delays in the mining environment where the limited network bandwidth reduces the data transmission efficiency. With the advent of the era of the Internet of things, edge computing has emerged as a paradigm shift, making it possible to localize data processing and instant decision-making. Compared with the cloud centric method, edge computing reduces the communication delay and bandwidth consumption to the greatest extent, which is very suitable for real-time fire detection in underground mines. In view of these challenges, this paper develops a fire detection framework for edge deployment by integrating the functions of mine Internet of things system, edge intelligence, computer vision, and multi-sensor data. The system combines video analysis with heterogeneous sensor data at the edge of the network to achieve early fire prediction and real-time monitoring. This method not only reduces casualties and economic losses, but also improves the overall safety of the mine. The main contributions of this paper are as follows:
  • By incorporating an additional small-object detection layer and introducing an adaptive attention mechanism into the classical YOLOv5s model, this paper enhances the YOLOv5s algorithm to achieve precise detection of small-scale flames while effectively reducing interference from non-fire light sources in underground environments.
  • This method dynamically weights the results of video-based and sensor-based detection, adapting in real time based on incoming data. By employing this dynamic fusion approach, the system effectively mitigates potential failures of individual video or sensor data, thereby improving the reliability and accuracy of fire detection in complex underground environments.
  • To meet the real-time requirements of fire detection, the proposed fire detection algorithm is deployed on an intelligent edge processor. By processing and analyzing video and sensor data directly at the edge, this approach eliminates the data transmission delays and response latency associated with cloud-based solutions, thereby significantly improving fire detection speed.

2. Related Work

2.1. Video-Based Fire Detection Methods

Khan Muhammed et al. [4] proposed cost-effective fire detection CNN architecture for surveillance videos. The model was specifically optimized and adjusted for computational complexity and detection accuracy. However, this study lacks the capability to detect smoke. Goel et al. [5] developed an advanced fire detection system based on an improved YOLOv4 architecture, incorporating a custom multi-scale dataset and integrating chromatic-motion features for enhanced flame recognition. However, the study lacks in-depth research on deploying the fire detection model to edge devices. Zhao et al. [6] proposed Fire-YOLO model, integrating EfficientNet with YOLO-V3 to enhance small fire/smoke detection. However, its detection accuracy declines for occluded targets and under extreme lighting conditions, indicating a need for improved robustness and occlusion handling.
In [7], Hikmat Yar et al. proposed an improved YOLOv5s architecture through three structural modifications: incorporating a Stem module in the backbone network, substituting larger kernels with smaller ones in the SPP layer, and extending the detection head with a P6 module. Zhang et al. [8] proposed an improved YOLOv5 algorithm that expands the head layers and incorporates the SE (Squeeze-and-Excitation) layer, accelerating the convergence of classification and detection while capturing more comprehensive sampling information. Deng et al. [9] proposed an intelligent fire and smoke detection algorithm for highway tunnels based on an improved YOLOv5s model. By incorporating a Transformer Encoder module, the algorithm enhances global feature extraction capabilities. Additionally, it employs the lightweight GSConv to reduce the number of parameters and integrates the ECA attention mechanism to improve small-object detection performance.
Hou et al. [10] proposed an improved Faster R-CNN method that integrates deep and shallow feature fusion across multiple scales to enhance fire recognition accuracy. However, this approach incurs a substantial increase in network parameters and computational complexity, resulting in slower detection speed. Liu et al. [11] proposed a lightweight forest fire video monitoring method by replacing the backbone network of YOLOv5 with MobileNetV3 and incorporating a Global Attention Mechanism (GAM). Fan et al. [12] proposed a mine fire monitoring method based on visible-light visual feature fusion. By improving the Seed Region Growing (RSG) algorithm, the method precisely segments fire source regions and integrates both dynamic and static features, including flame texture, sharp edges, and flickering frequency, to construct multi-dimensional feature vectors. A Backpropagation (BP) neural network is then employed to achieve high-precision fire detection.
To address the limitations of the aforementioned methods and adapt to the specific application scenario of this study, an improved YOLOv5s algorithm is proposed. The enhancements optimize the accuracy of small fire detection and significantly improve the efficiency of mine fire detection.

2.2. Sensor-Based Multi-Source Information Fusion Methods

Su et al. [13] proposed a fire detection method based on multi-sensor data fusion, in which multiple sensors are employed to collect multidimensional data, which is then processed using an improved adaptive filter and a fuzzy Bayesian logical inference algorithm to achieve fusion, thereby establishing a fire detection model based on multi-sensor data integration. Liu et al. [14] presented a new multi-sensor fire detection method based on long short-term memory (LSTM) networks that integrates environmental information fusion. They used LSTM networks to process multi-sensor time series data to extract the time series characteristics of environmental information, including environmental indicator variation information and environmental level information. Zhang et al. [15] proposed a data center fire detection algorithm based on multi-sensor data fusion, in which the Sparrow Search Algorithm (SSA) was utilized to optimize the weights and thresholds of the Extreme Learning Machine (ELM), significantly enhancing the accuracy and generalization capability of fire probability prediction at the feature level. Duan et al. [16] proposed a fusion method combining fuzzy set theory and Dempster–Shafer (D-S) evidence reasoning. Multiple sensors assessed fire conditions, with fuzzy membership functions calculating sensor reliability. The obtained values were converted into basic probability assignments, and evidence reasoning was applied to enhance detection accuracy. Li et al. [17] proposed a multi-sensor data fusion algorithm (MSDF) based on D-S theory, where the trust function is derived by calculating data distances to eliminate anomalies, and the basic probability distribution function is computed from the filtered data as the original evidence body.
The aforementioned studies have improved fire detection accuracy to some extent; however, their decision-making process fundamentally relies solely on sensor-collected data. This approach necessitates a sufficiently large number of sensors, leading to increased costs. Moreover, when sensors are positioned far from the fire source, timely detection becomes challenging.

3. Architecture Design of the System

The proposed system architecture, as illustrated in Figure 1, consists of four core components: (1) a video detection module, (2) a multi-sensor module, (3) an edge computing unit, and (4) an intelligent management platform. The video-based fire detection algorithm and multi-sensor data fusion algorithm are deployed on an Extrobox210 edge computing device. This setup facilitates direct communication between surveillance cameras and the edge device, enabling offline detection while ensuring real-time monitoring of the underground mining environment. Processed monitoring data is transmitted via Ethernet to the intelligent management platform, enabling operators to monitor the working environment in real-time and issue operational commands as needed. The subsequent sections will elaborate on the detailed design of the video detection and multi-sensor modules, including hardware selection criteria and deployment parameters.

4. Improved YOLOv5s Model

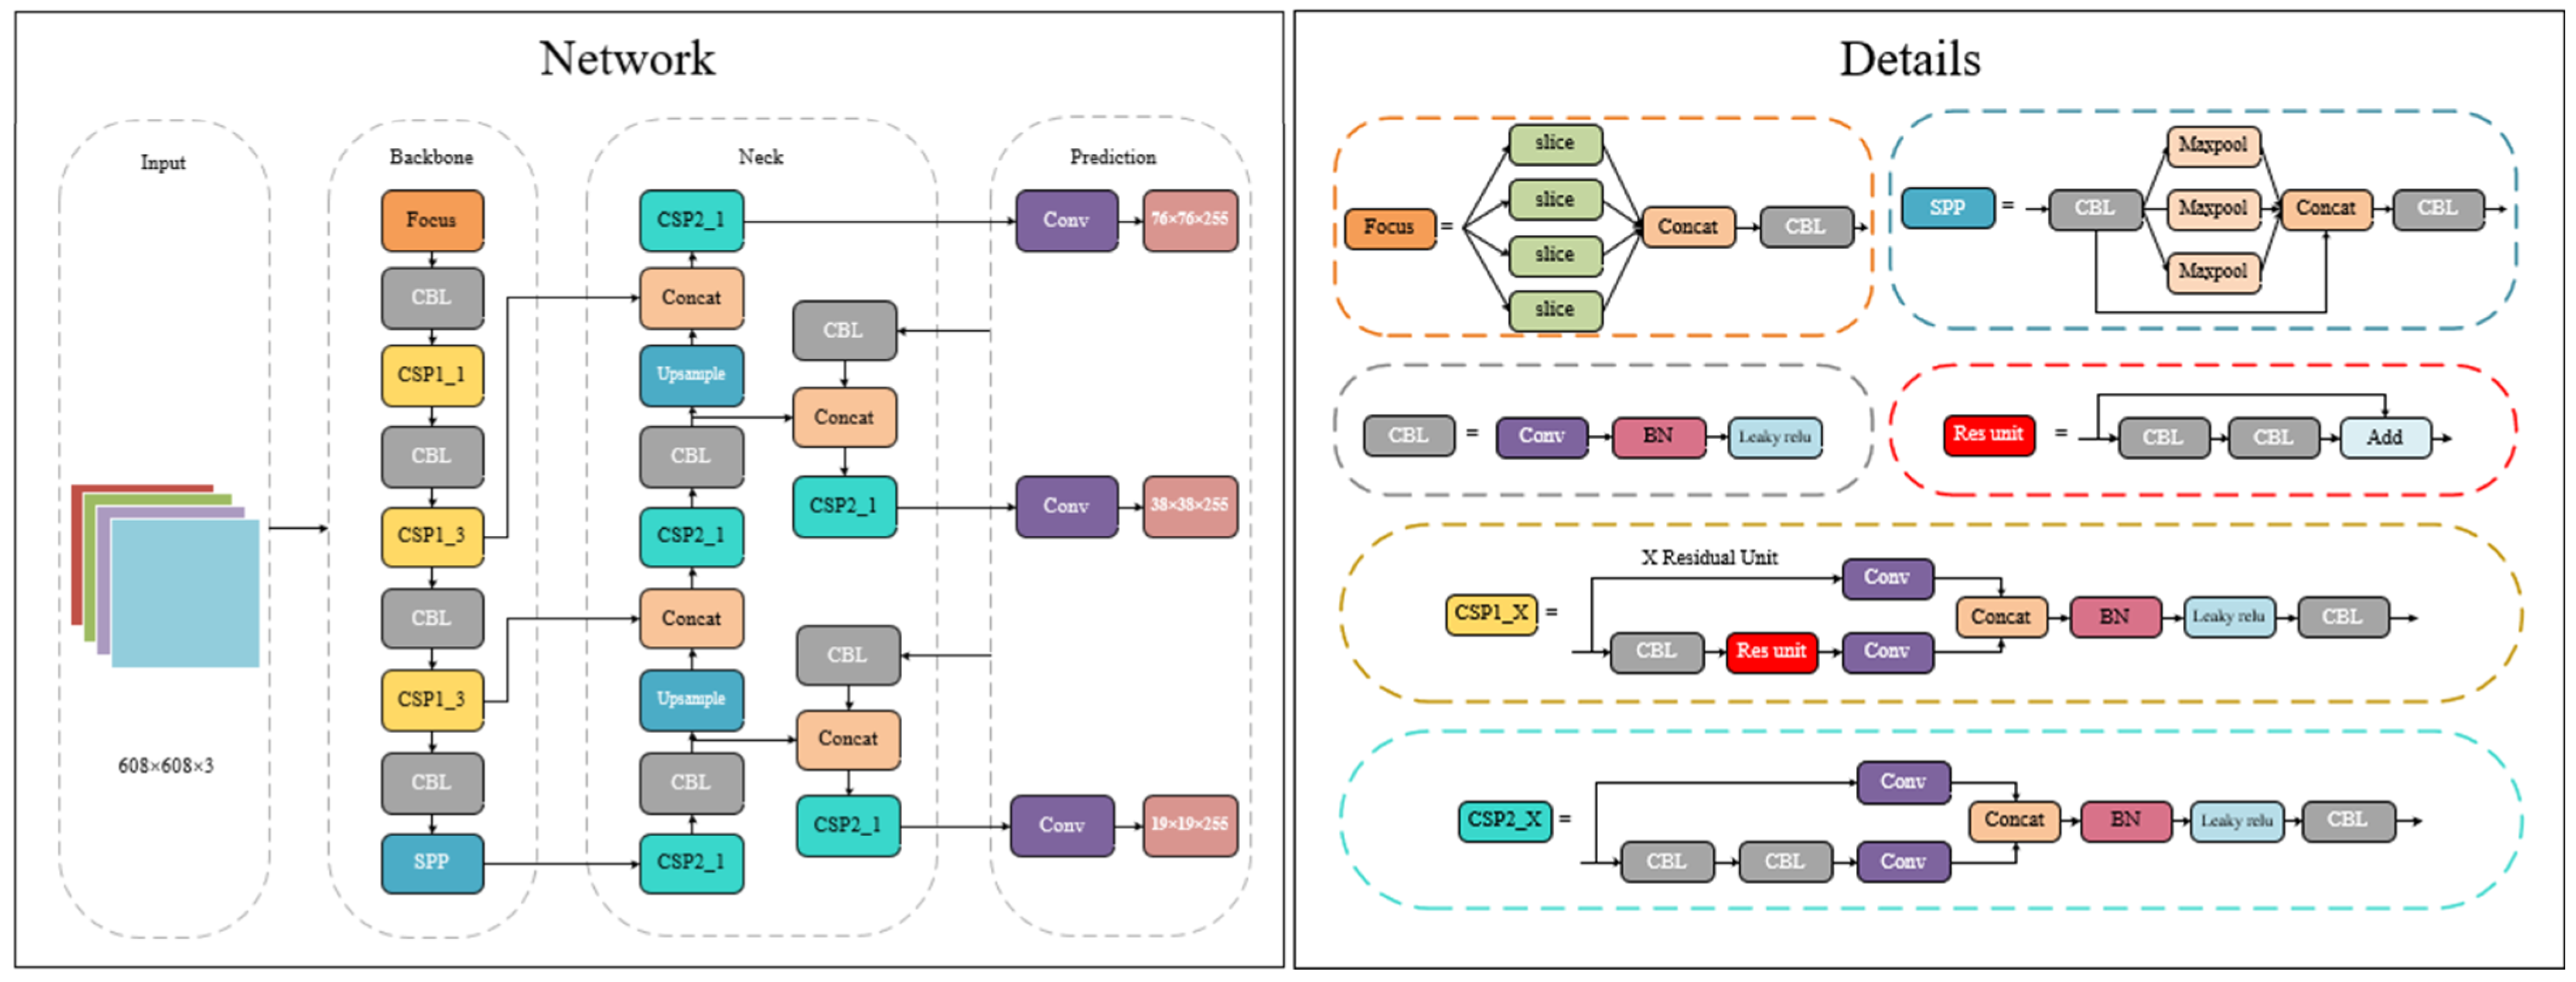
The fundamental framework of YOLOv5s can be divided into four key components: Input, Backbone, Neck, and Prediction, as illustrated in Figure 2.
At the input stage, the model employs Mosaic data augmentation, which enhances the dataset diversity through random scaling, cropping, and arrangement of images. This approach not only enriches the training dataset but also imposes low computational overhead and minimal hardware requirements.
The backbone primarily consists of CSP modules and utilizes the CSPDarknet53 [18] architecture for feature extraction. This structure effectively mitigates computational bottlenecks, reduces memory consumption, and enhances model efficiency.
In the neck section, a combination of Feature Pyramid Networks (FPN) and Path Aggregation Networks (PANet) [19] is employed to strengthen feature fusion across different scales.
The prediction stage is centered around the loss function, where Complete Intersection over Union (CIOU_Loss) is utilized as the bounding box regression loss function, ultimately refining the final output predictions.

4.1. Small-Target Detection Layer

The best early warning for fire is to carry out real-time and accurate detection of small-area flame in the early stage of the fire. However, the accuracy of small-target detection by YOLOv5s is not high, mainly because the small-target sample size is small, the downsampling multiple of YOLOv5s is large, and it is difficult to learn the feature information of small targets in the deep-feature map. Therefore, it is proposed to fully learn the shallow features by adding the feature scale with smaller resolution.
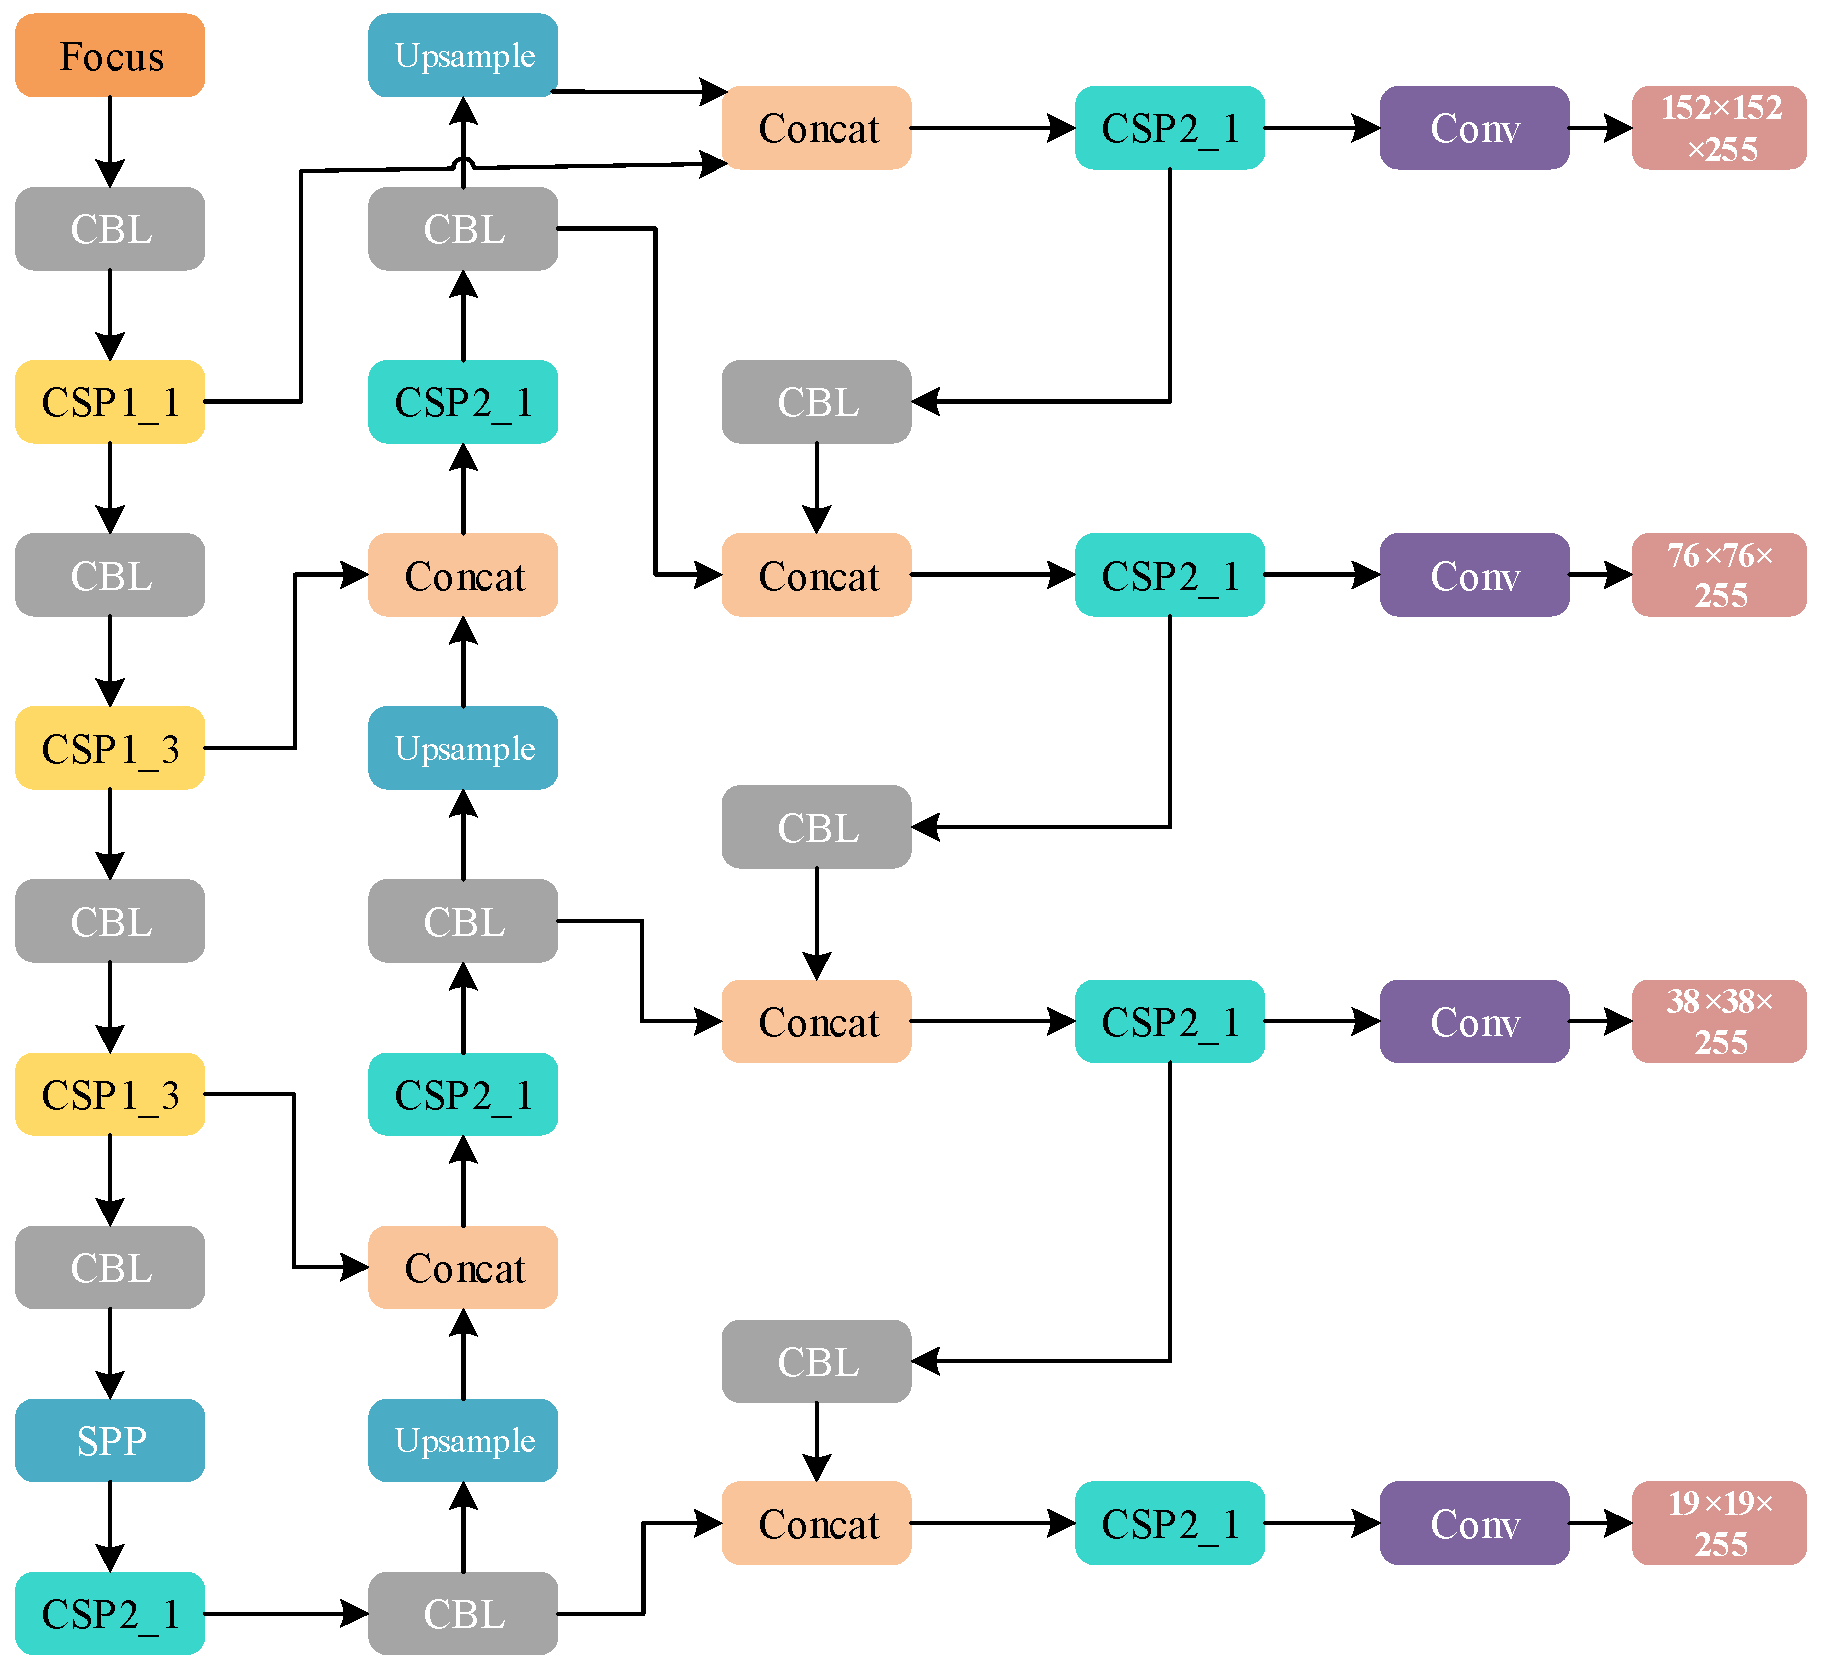
YOLOv5s uses the fusion method of three scales (76 × 76, 38 × 38, 19 × 19) in multi-scale detection. The feature scale with the smallest resolution is 76 × 76, corresponding to the input 608 × 608, and the receptive field of the feature map is 608/76 = 8 × 8. Considering the requirements of flame detection accuracy and speed, this paper adds a 152 × 152 feature scale and improves it to four-scale detection. At this time, the corresponding receptive field is 4 × 4, which fully learns the shallow features and improves the small-target detection performance. The improved network model is shown in Figure 3.

4.2. Adaptive Attention Module

Attention mechanism has been widely used in fields such as image processing and speech recognition Attention mechanism is to focus on something at a certain time, and ignore or reduce attention to something unimportant The attention mechanism can quickly screen out the most critical information from a large amount of information, suppress the attention to other information, and even directly ignore the information unrelated to the task, greatly improving the efficiency and accuracy of processing tasks.
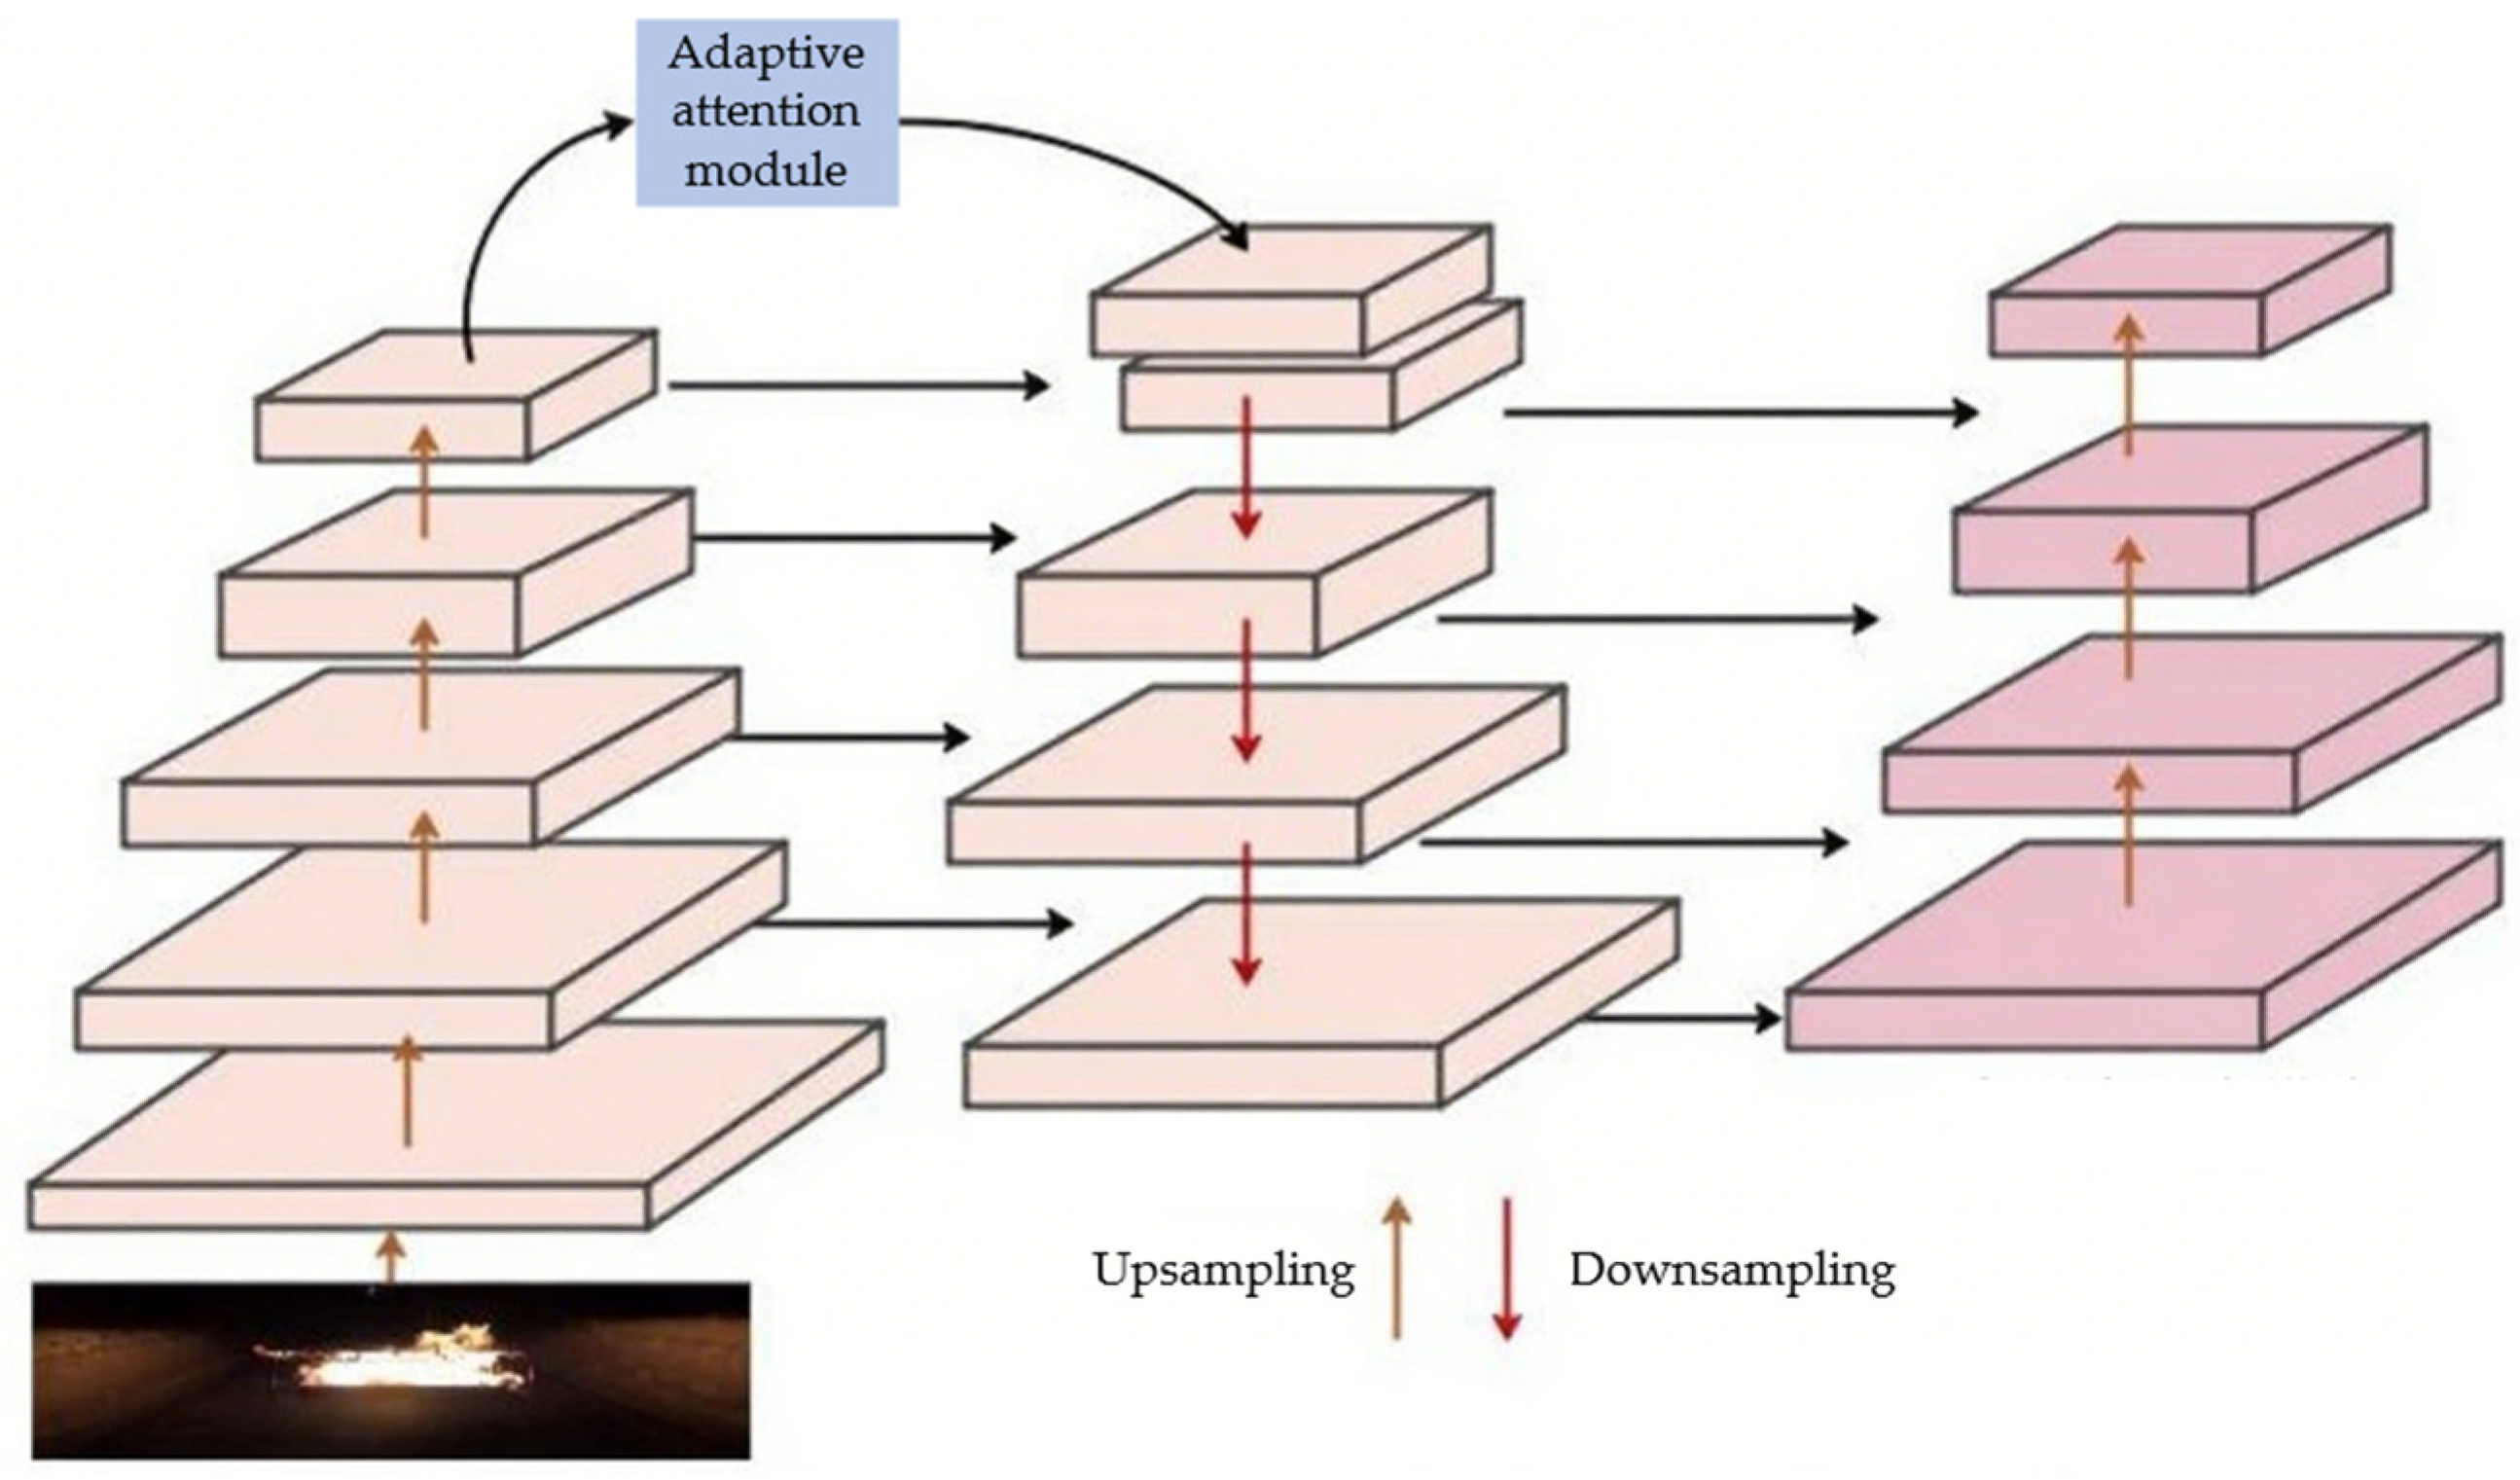
In the neck part of the network, YOLOv5s uses the feature pyramid network (FPN) and path aggregation network (PANet) to enhance the feature fusion ability of the network, as shown in Figure 4. However, the traditional feature pyramid network has some disadvantages. In the sampling process, the high-level feature map will cause the loss of context information with the reduction in the number of feature channels, which will affect the detection accuracy of the model. In view of the above problems, this paper adds an adaptive attention module on the basis of the original feature pyramid network, uses the spatial attention mechanism to generate a spatial weight graph for each feature graph, uses the weight graph to fuse the context features, and generates a new feature graph containing multi-scale context information, so as to reduce the loss of context information.
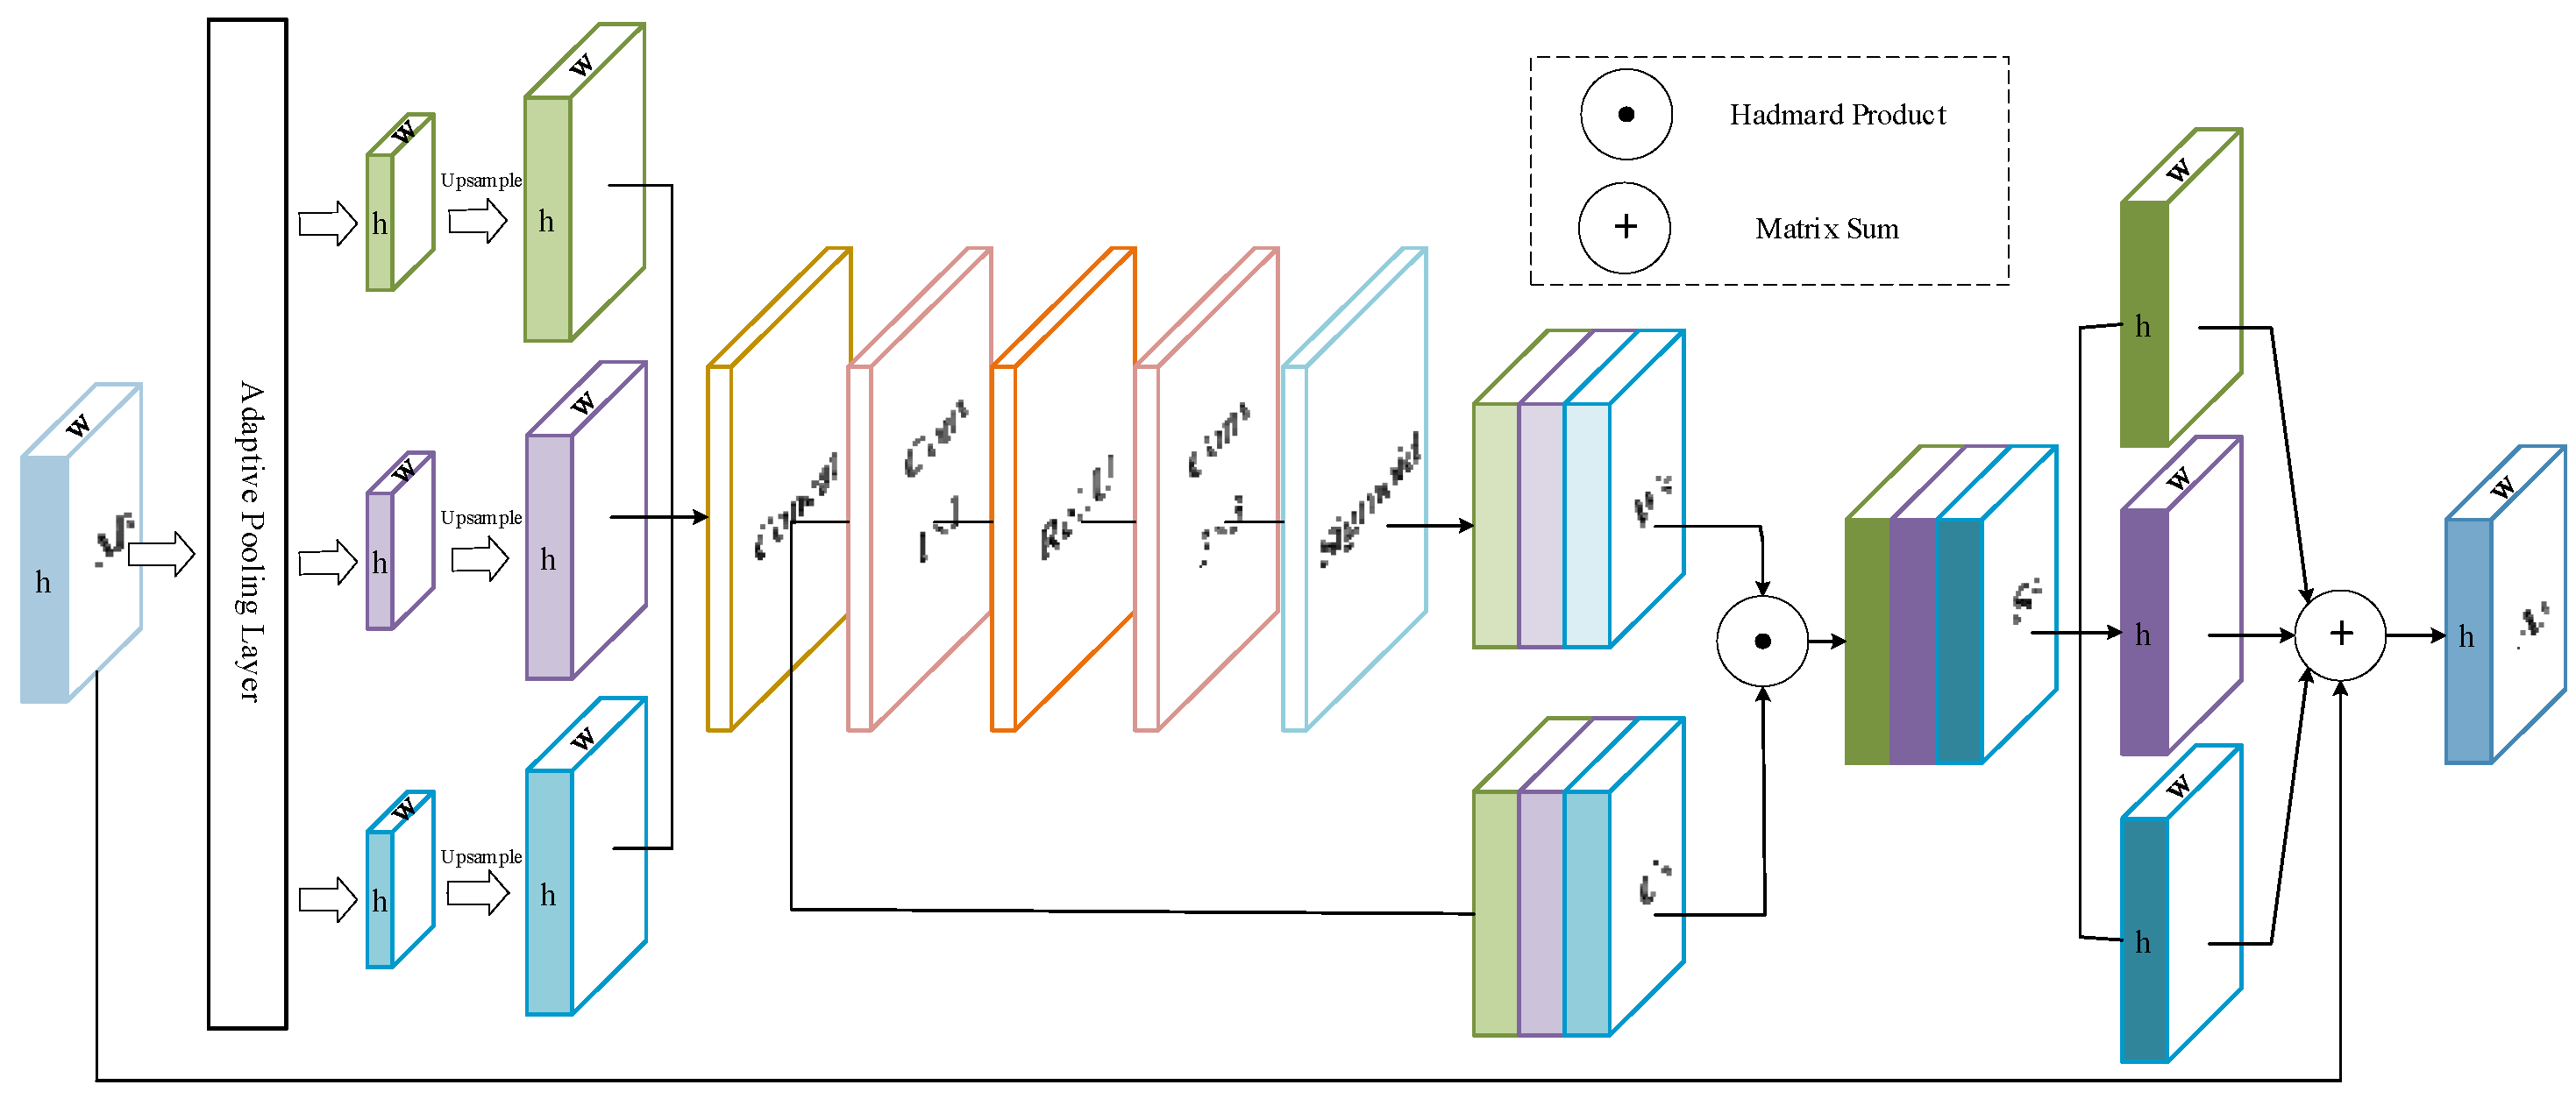
The original image is first subsampled to five feature maps (M1, M2, M3, M4, M5), and then input the feature map into the adaptive attention module to obtain the feature map with spatial weight. Then the spatial weight map is fused by upsampling. Finally, through subsampling, the pan structure is used to aggregate the features of different detection layers again, and finally a new feature map containing multi-scale context information is generated. The structure of the adaptive attention module is shown in Figure 5.
Firstly, the extracted feature map M5 (with dimensions S = h × w) is processed through an adaptive average pooling layer to obtain multiple context features at different scales (a1 × S, a2 × S, a3 × S). The pooling coefficient a can be adaptively changed according to the target size in the dataset, and the value range is [0.1, 0.5]. Secondly, each feature map is upsampled, and the sampled feature map is merged through the concat layer to obtain the feature map C5. The characteristic diagram formula of the m-th output channel of concat layer output as (1)
O m = i = 1 T 1 X i K X i m + j = 1 T 2 Y j K Y j m + + k = 1 T n Z k K Z k m
where K m is the weight of the input channel corresponding to the convolution kernel, represents convolution operation, + represents element by element addition, and the total number of channels is T 1 + T 2 + + T n .
Then C5 passes through the 1 × 1 convolution layer, the relu activation layer, the 3 × 3 convolution layer, and the sigmoid activation layer in turn to obtain the corresponding spatial weight map W5. Finally, the product of C5 and the weight map W5 are obtained by Hadamard operation. The detailed equations are as follows
Re L U x = max 0 , x
S 5 = W 5 · C 5
where · represents Hadamard product operation, which means that two matrices are multiplied by elements After obtaining S5, it is separated and added to the feature graph M5 to obtain a new feature graph A5 containing multi-scale context information. The feature graph A5 carries rich multi-scale context information, which alleviates the loss of context information caused by the reduction in the number of channels to a certain extent and improves the detection accuracy of the model.

5. Multi-Source Information Fusion

Current mine fire detection methods mainly rely on video processing, but underground conditions—such as dust, mist, and poor lighting—often degrade video quality and reduce accuracy. To address this, we propose a multi-source information fusion approach that enhances fire detection by supplementing video data with a limited number of strategically placed sensors within the camera’s field of view.

5.1. Multi-Source Information Fusion Module

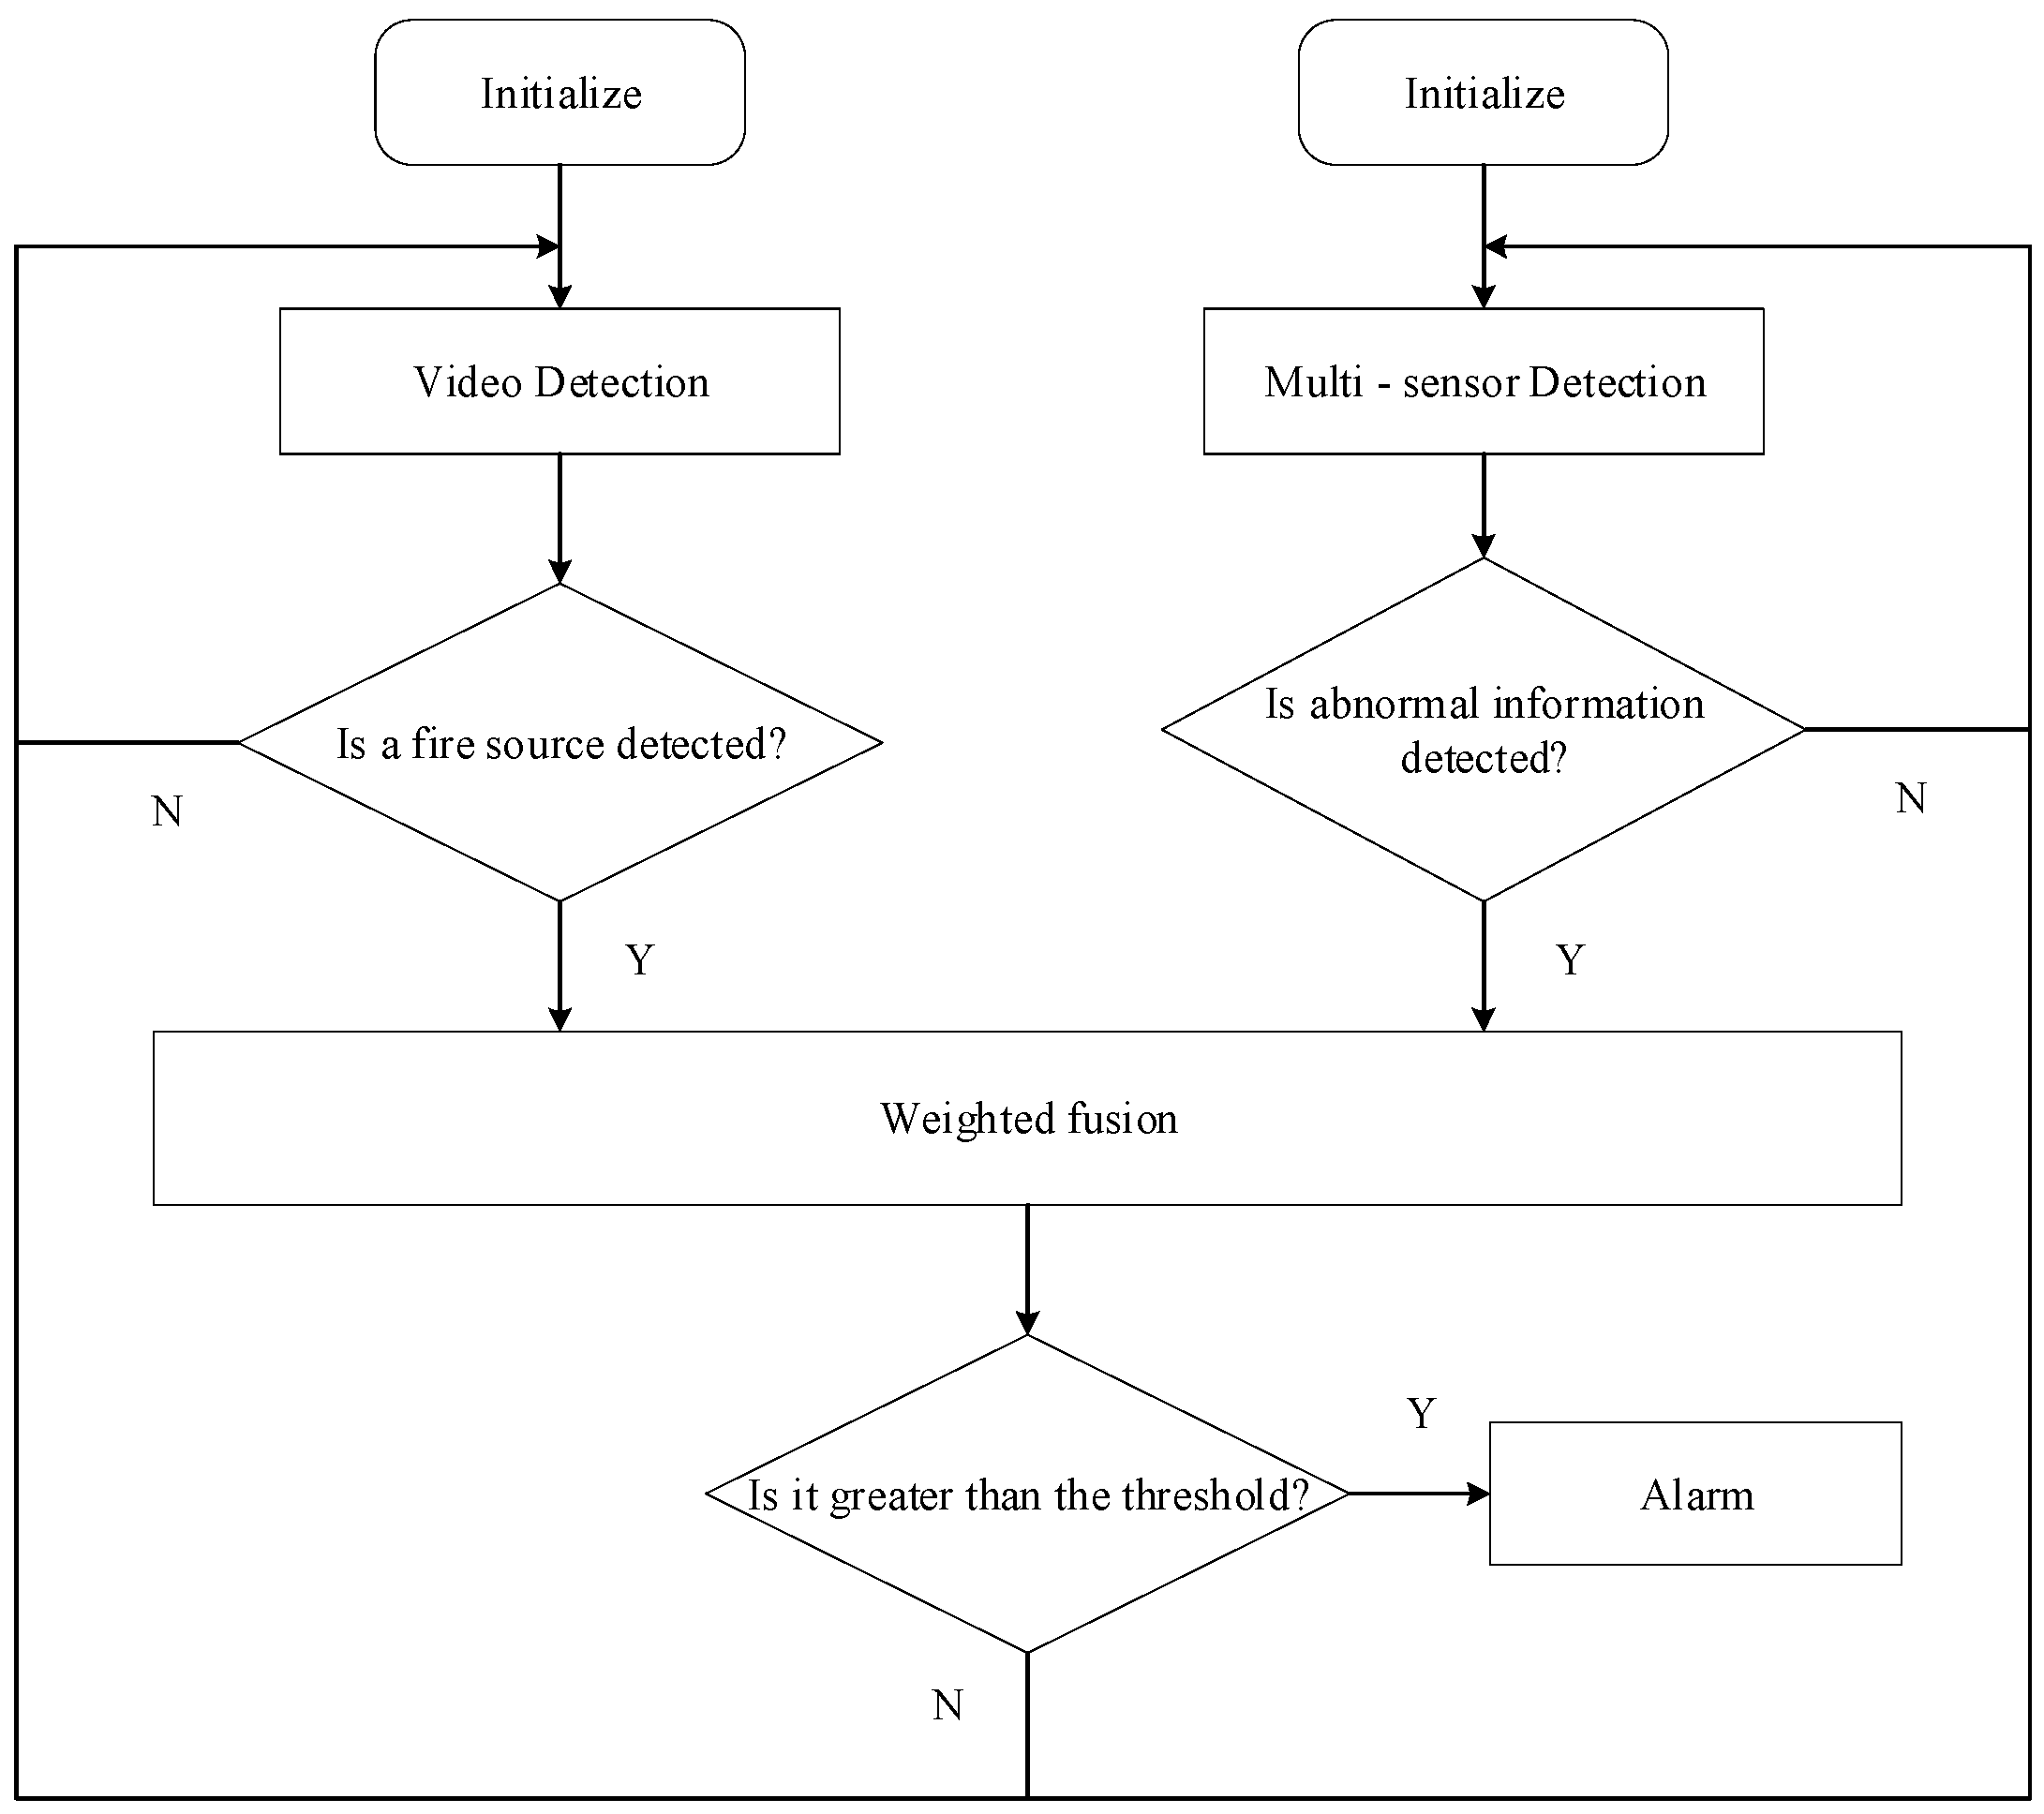
The system fuses data from the camera and multiple sensors using a weighted algorithm and compares the result to a predefined threshold to determine whether to trigger an alarm. The decision-making process is dynamic: when the camera detects a potential fire, its output and any abnormal sensor readings are assigned different weights, summed, and evaluated against the threshold. If the result exceeds the threshold, an alarm is triggered; otherwise, monitoring continues. The full process is illustrated in Figure 6.

5.2. Multi-Source Information Fusion Algorithm

In this study, a fuzzy data fusion-based algorithm is utilized to determine thresholds during the fusion process. Sensor credibility is evaluated using fuzzy membership functions. Suppose the system includes m fire detection sensors (e.g., video, temperature, smoke, and CO sensors) generating n detection outcomes. The set of sensors forms the factor set V = { v 1 , v 2 , , v m }, and the evaluation set for detection states is U = { u 1 , u 2 , , u n }. Each sensor evaluates the states in U, resulting in a fuzzy relation matrix Rm×n, where each element r i j denotes the degree of membership of sensor v i to state u j . For this system, the factor set is defined as V = {Video, Temperature Sensor, Smoke Sensor, CO Sensor}, The evaluation set U = {Fire, No Fire}. The normalized evaluation vector for each sensor v i is defined as r i = r i 1 , r i 2 , , r i n , and the collection of these vectors forms the decision matrix:
R m × n = r 11 r 12 r 1 n r 21 r 22 r 2 n r m 1 r m 2 r m n
In a multi-source information fusion system, sensor contributions vary in significance. To reflect their relative importance, weight values are introduced. A larger weight indicates greater influence in decision-making. Thus, the weight vector is defined as W = w 1 , w 2 , , w m , where w i = u v i ,   i = 1 , 2 , , m and i = 1 m w i = 1 ,   w i 0 . In this study, the weight vector is w, where w 1 is the weight value of video, w 2 is the weight value of temperature sensor, w 3 is the weight value of smoke sensor, and w 4 is the weight value of CO sensor.
The common determination methods of weight value include subjective method and objective method. The subjective weight determination methods mainly include analytic hierarchy process, fuzzy cluster analysis, and the Delphi method. The objective weight mainly includes gray correlation analysis method, variation coefficient method, and entropy method. Because this paper hopes that the weight value of video is the largest and has a certain subjectivity, we decided to choose the analytic hierarchy process to determine the weight value of each index.
The analytic hierarchy process (AHP) constructs a judgment matrix by comparing the elements of each level according to the membership function relationship between the upper and lower levels, and finally determines the weight of each index by using the combination of mathematical methods and qualitative analysis. We combine the 1–9 scaling method [20], and the criteria of the 1–9 scaling method are shown in Table 1.
Since the flame characteristics cannot be detected in smoldering fire or early fire video, we adopt different judgment matrices to determine the weight value of each index according to different situations. In the first case, the video detected abnormal information, but the temperature sensor, CO sensor, and smoke sensor did not exceed the limit. We directly assigned the weight of the video to 1. In the second case, the video, temperature sensor, CO sensor, and smoke sensor all detect abnormal information. At this time, we determine the weight value according to the judgment matrix. Here we believe that video accounts for the largest weight value. The judgment matrix is as follows:
C 1 = 1 9 9 9 1 / 9 1 3 3 1 / 9 1 / 3 1 3 1 / 9 1 / 3 1 / 3 1
At this point, the weight vector is W 1 = w 1 , w 2 , w 3 , w 4 = 0.73 , 0.14 , 0.08 , 0.05 . The third case is that the video does not detect abnormal information, but the temperature sensor, CO sensor, and smoke sensor all detect abnormal information. At this time, th fire is ongoing, and the temperature rises sharply. Therefore, we give higher weight to the temperature sensor. The judgment matrix is as follows:
C 2 = 1 7 7 1 / 7 1 1 1 / 7 1 1
At this time, the weight vector is W 2 = w 2 , w 3 , w 4 = 0.78 , 0.11 , 0.11 . The fourth case is that the video and temperature sensors do not detect abnormal information, but both the CO sensor and the smoke sensor detect abnormal information. This is the initial stage of flame combustion. Since the smoke sensor can detect abnormal information earlier than the CO sensor [21], we give the smoke sensor a higher weight. The judgment matrix is as follows:
C 3 = 1 2 1 / 2 1
At this time, the weight vector is W 3 = w 3 , w 4 = 0.67 , 0.33 . The three judgment matrices have passed the consistency test, and the weight calculation result is valid through calculation. In this paper, Gaussian function is selected as the fuzzy membership function of fire judgment. The Gaussian function is as follows:
μ x = 0 , x c 1 e x c σ 2 ,   x > c
According to Table 2 and the fuzzy membership function, we can calculate the membership of each index to form a decision matrix. Through the weight vector and the decision matrix, we can get the fusion membership value. We use the calculated fusion membership value as the initial alarm threshold of the dynamic weighting algorithm. The fuzzy relation operation formula and dynamic weighting algorithm formula between weight vector w and decision matrix are as follows:
B = w 1 , w 2 , , w m r 11 r 12 r 1 n r 21 r 22 r 2 n r m 1 r m 2 r m n = b 1 , b 2 , , b n
F = α 1 , α 2 , α 3 , α 4 w 1 , w 2 , w 3 , w 4 T
where α = α 1 , α 2 , α 3 , α 4 represents the fire detection result vector obtained from the video, temperature sensor, smoke sensor, and CO sensor, respectively. Each α i has only two values: 0 and 1. Value 1 indicates abnormal detection, and 0 indicates normal conditions.
In this study, the alarm thresholds are set at 30 °C for temperature, 1 mg/m3 for smoke, and 24 ppm for CO concentration [22].
To improve fire detection accuracy and reduce false alarms, this study adopts the Exponentially Weighted Moving Average (EWMA) method for dynamic threshold adjustment, as shown in Equation (11):
E W M A t = γ x t + 1 γ E W M A t 1
Here γ represents the smoothing factor, which is typically set to γ = 0.3 in fire detection for coal mine environments. This selection effectively balances the need to prevent delayed warnings caused by the slow smoldering of coal self-ignition while also mitigating the impact of fluctuations in individual sensor data on the detection results. In the equation, x t denotes the fire anomaly score at time t, corresponding to the weighted value F. The initial threshold is denoted as EWMA0, and subsequent values are iteratively updated to achieve adaptive thresholding. This approach enhances system stability, reduces false positives, and improves sensitivity to real fire events. For experimental comparison, we express the enhanced model as YOLOv5s-a, and the model after the fusion of YOLOv5s-a and multi-source information fusion algorithm is called YOLOv5s-as.
In this experiment, three combustion conditions were compared. The first is normal combustion with large flame. The second is the initial ignition, characterized by a small-target flame. The third is early smoldering without an obvious flame. Each of the three experiments tested 50 groups, respectively, and the models involved in the experiment were also three: YOLOv5s, YOLOv5s-a, and YOLOv5s-as. For the statistics of correct detection times, the counting method is used in this experiment. The background counts the number of fire tags, sensor abnormal information, and alarm times of video output, and finally compares with the actual results. The sensor is deployed 1.5 m away from the fire source, and the camera is fixed at a height of 2 m with a bracket. The experimental results are shown in Figure 7, and the comparison of test results is shown in Table 3.
From the results, the detection accuracy of the YOLOv5s model is the lowest, because the detection effect of the YOLOv5s model is not ideal for small targets. The YOLOv5s-a model is specially improved and optimized for small targets, so the detection accuracy has been greatly improved compared with the YOLOv5s. The detection accuracy of the YOLOv5s am is the highest, because it uses multi-sensor to assist in detection. When the video does not detect small flames, the multi-sensor detects the physical characteristics of combustion. In this case, the fusion algorithm is dynamically adjusted to rely only on the sensor information to judge. When the weighted sum exceeds the threshold, it is judged as the fire source, which improves the accuracy.

6. Experimentation and Analysis

6.1. Dataset and Experimental Environment

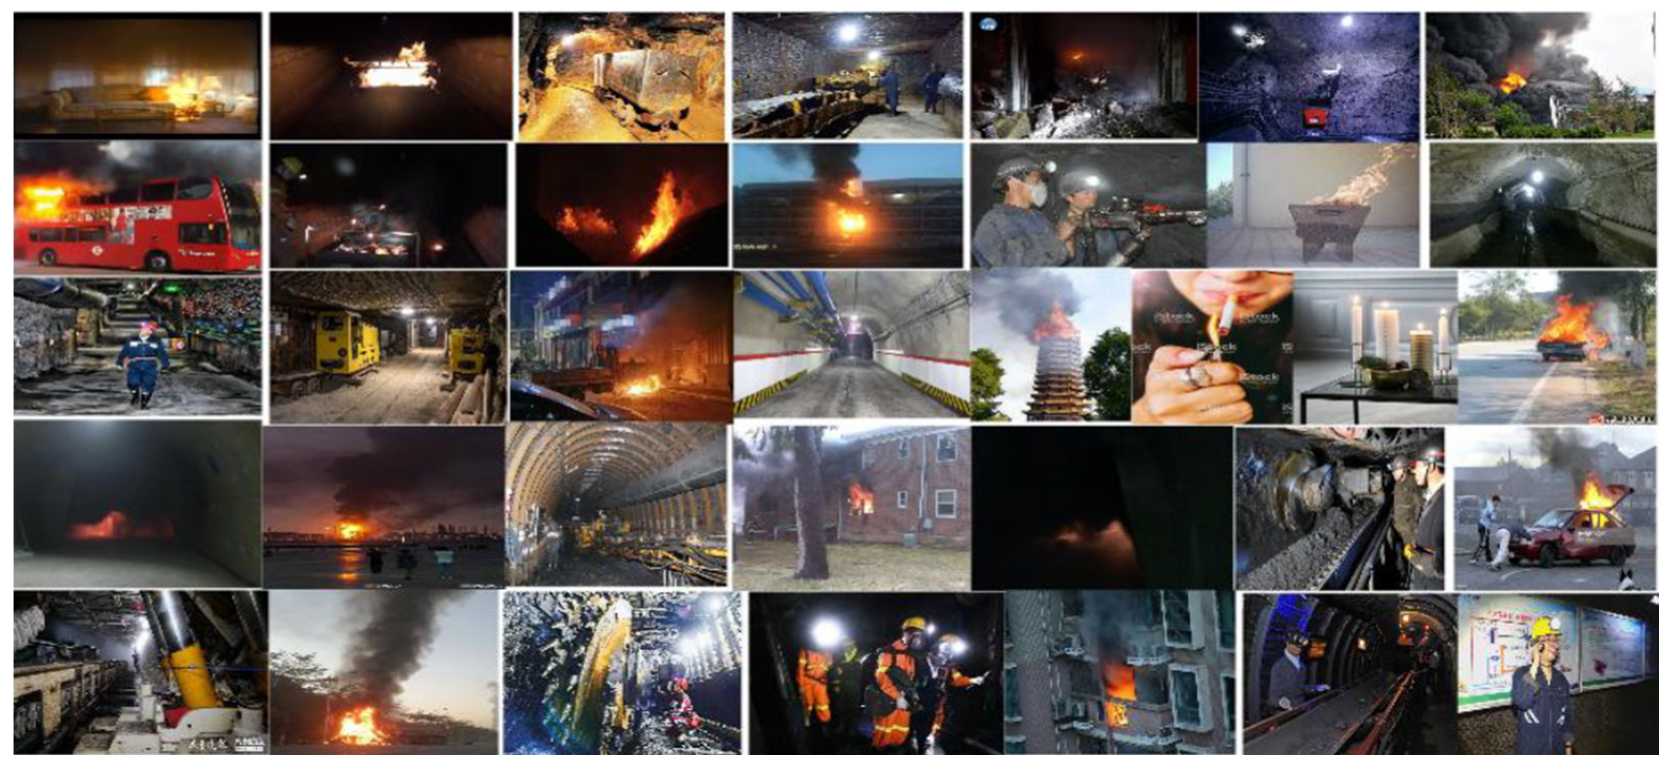
To improve the performance of the coal mine flame detection model, a combustion dataset was constructed to simulate the underground environment. This dataset contains 9000 images that capture the entire process of flame combustion from early stages to complete development and ultimately extinguishing. There are a total of 2841 fire images and 6159 non-fire images, including road lighting, searchlights on workers’ heads, lights, etc., which have characteristics similar to flames and are unrelated to flames, such as rock excavation machines, hydraulic anchor drills, scraper conveyors, etc., as shown in Figure 8.
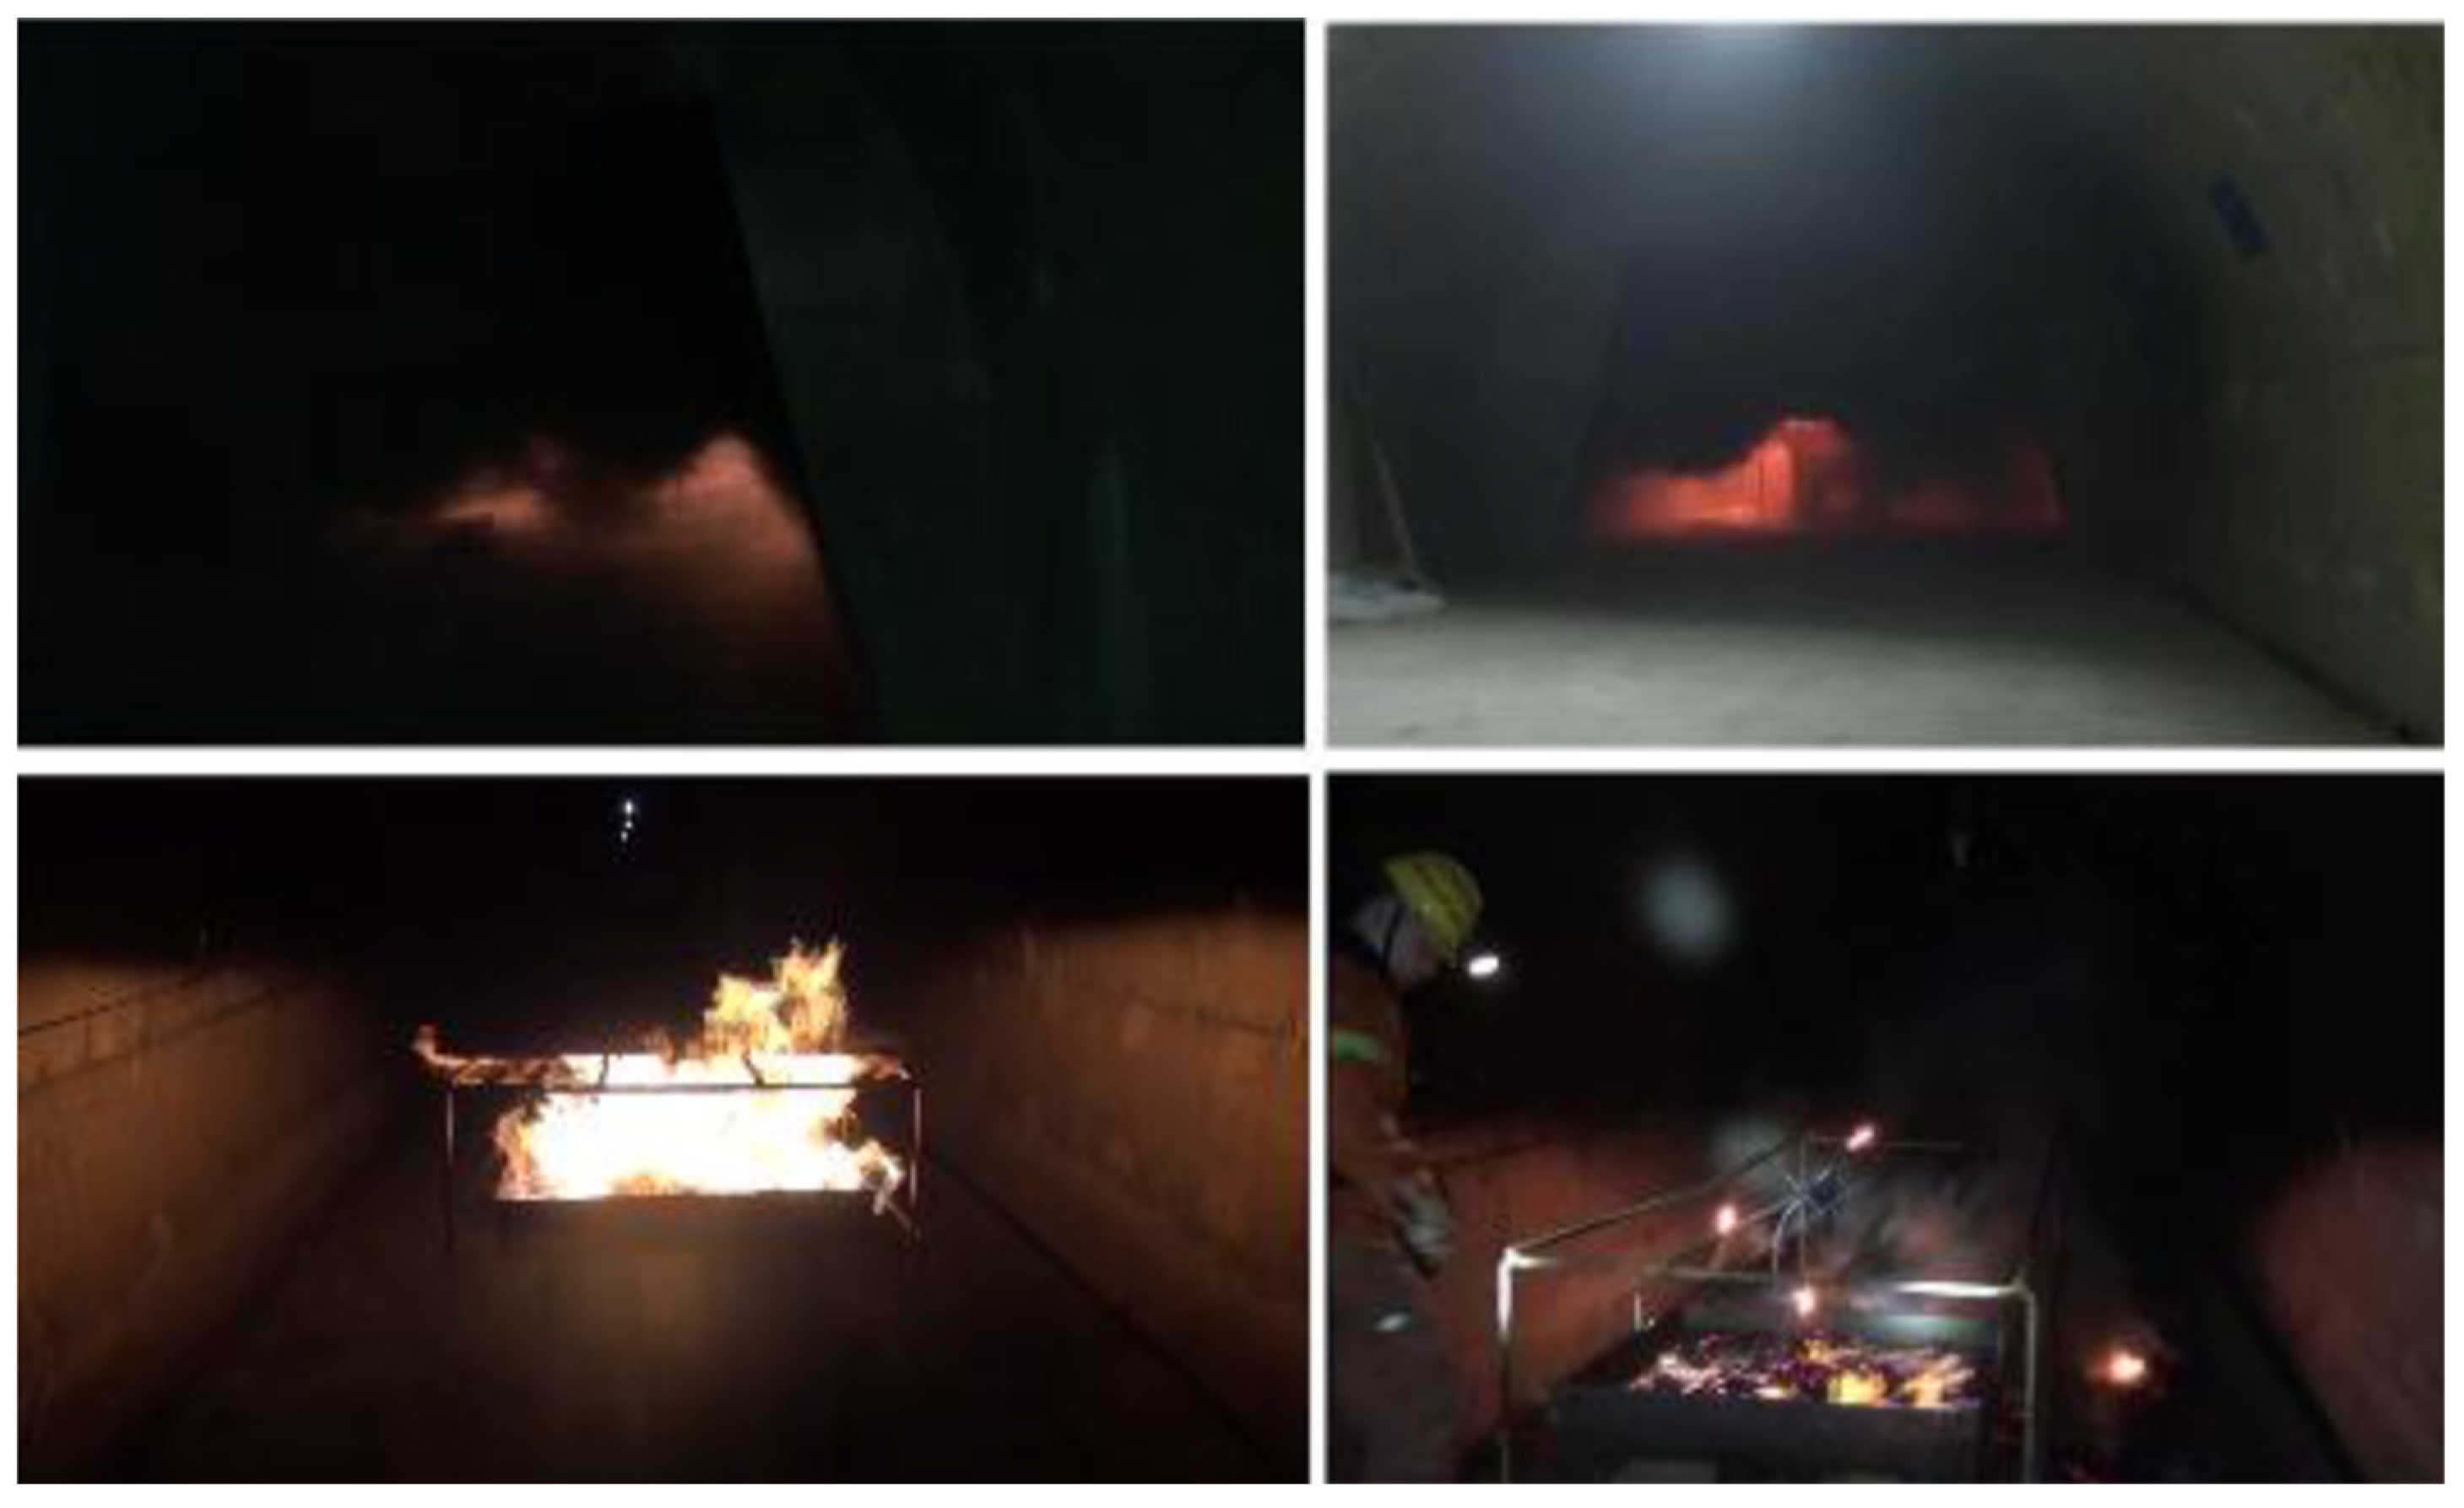
To more accurately simulate the underground environmental conditions in coal mines [23], the dataset for this study was collected in simulated tunnels. Before conducting the combustion experiment, the environmental humidity was controlled at 80%, the visibility was 20 m, and the total dust concentration was set to 25–50 mg m−3 to ensure the rigor of the experimental dataset. The image of the simulated tunnel is shown in Figure 9. Meanwhile, the camera’s shooting angle and other parameters were carefully adjusted to ensure consistency with the actual underground scene. In the tunnel, the closer to the excavation face, the higher the total dust concentration. This study setup cameras at different positions, under different lighting conditions, and with different total dust concentrations to collect data. The specifications of the dataset shooting parameters are detailed in Table 4.
Cameras 1 and 2 were installed at a height of 0, positioned directly facing the flame. Cameras 3 and 4 were placed at forward and backward 45° angles, capturing flames from different perspectives to simulate diverse viewing conditions.
In this study, LabelImg tool is used to label the pictures. The completed dataset is shown in Table 5.
The underground coal mine environment contains various objects such as tunnel lighting, headlamps, and vehicle headlights, which exhibit flame-like visual features. Additionally, machinery like roadheaders, bolting rigs, and conveyors may interfere with detection. These visually similar elements pose challenges for accurate flame recognition.
To enhance the model’s accuracy and improve its generalization ability, this paper proposes a hybrid training approach. A total of 2937 images were randomly selected from the VOC2007 dataset, all resized to 608 × 608 to meet the training requirements. These images were then integrated with the previously constructed dataset. Furthermore, to enhance the model’s ability to distinguish flames from visually similar objects, various underground lighting images were collected from online sources. These images were processed in the same manner and incorporated into the dataset, ensuring balanced sample distribution.
The training batch size for all models was set to 16, with a learning rate of 0.001 and an IoU threshold of 0.5. The model was trained for 100 epochs on an NVIDIA TITAN Xp GPU.

6.2. Evaluation Metrics

Before deploying the selected portable model, we evaluated its performance using R (recall), mAP@0.5 (mean average precision), and inference time as key metrics to validate the effectiveness of the proposed improved YOLOv5s model. After deployment, the system’s evaluation is based on the actual fire detection mean precision and inference time. In this paper, the formula for R is given in Equation (12).
R = n T P n F N + n T P
where n T P denotes the number of true positive samples correctly identified by the model, and n F N represents the number of false negative samples that are actual positives but were not detected. The total number of positive samples, i.e., all annotated bounding boxes, is given by n T P + n F N . mAP serves as an indicator of multi-class prediction performance, with higher mAP values reflecting better model performance. In this paper, we employ mAP@0.5, which represents the mAP when the IoU threshold is set to 0.5. The computation formula is provided in Equation (13).
A P = 0 1 R × n T P n F P + n T P d r
where FP refers to the number of negative samples incorrectly predicted as positive, indicating false positives. n F P denotes the number of false positive samples classified as positive by the model. The variable r is an integral parameter ranging from 0 to 1.
To objectively compare the processing performance of algorithms, we select standard deviation σ and confidence interval (CI). Standard deviation is the most commonly used measure of dispersion in statistics, and confidence interval is an interval estimate of a population parameter of a sample, showing the degree to which the true value of the parameter has a certain probability of falling around the measurement result. In this experiment, we selected α = 0.05, which means the confidence level is 95%, corresponding to z = 1.96. We mainly analyzed the standard deviation and confidence interval of the average accuracy. The standard deviation formula and confidence interval formula are as follows:
σ = 1 N i = 1 N x i μ 2
C I = μ ± z × σ n

6.3. Comparative Experiment

6.3.1. Comparative Experiment Based on Different Models

Under the condition that all training parameters remain consistent, we compared the recall, mean average precision (mAP), and inference time of YOLOv5s-a before deployment with YOLOv5s, YOLOv3-SPP [24], and SSD [25]. The inference time was measured using a previously recorded flame combustion video, which consists of 2000 frames. The experimental comparison results are presented in Table 6.
As shown in Table 6, YOLOv5s-a achieves the highest mean precision while maintaining an inference speed only slightly slower than YOLOv5s. This slight reduction in speed is due to modifications made to the network, which increased the number of model parameters. However, considering overall performance, YOLOv5s-a effectively balances accuracy and efficiency, achieving the highest precision and stability while maintaining a relatively high inference speed.
After comparing the experimental results of each model before deployment, all models were subsequently deployed on edge devices. To further evaluate their performance, 50 fire experiments were conducted in a coal mine safety laboratory, simulating an underground tunnel environment. The data collected from these experiments were used to measure the inference time and mean precision of each model. The experimental results are presented in Table 7.
As shown in Table 7, the inference speed of all models improved after deployment, primarily due to model quantization, which reduced the number of parameters. However, this optimization inevitably led to a slight decrease in mean precision.
Notably, YOLOv5s-as—the proposed detection method in this paper—exhibited a slightly slower inference speed compared to YOLOv5s. This is because the proposed approach integrates sensor data with video-based detection, resulting in a marginal increase in processing time. Nevertheless, it achieved a 7.2% improvement in detection accuracy. Additionally, compared to the pre-deployment YOLOv5s model, YOLOv5s-as demonstrated a 17% increase in inference speed, further validating the superiority of the proposed detection method. Meanwhile, due to YOLOv5s-as adopting a multi-source data fusion approach, it can effectively detect any period of fire occurrence, ensuring the stability of the proposed method.
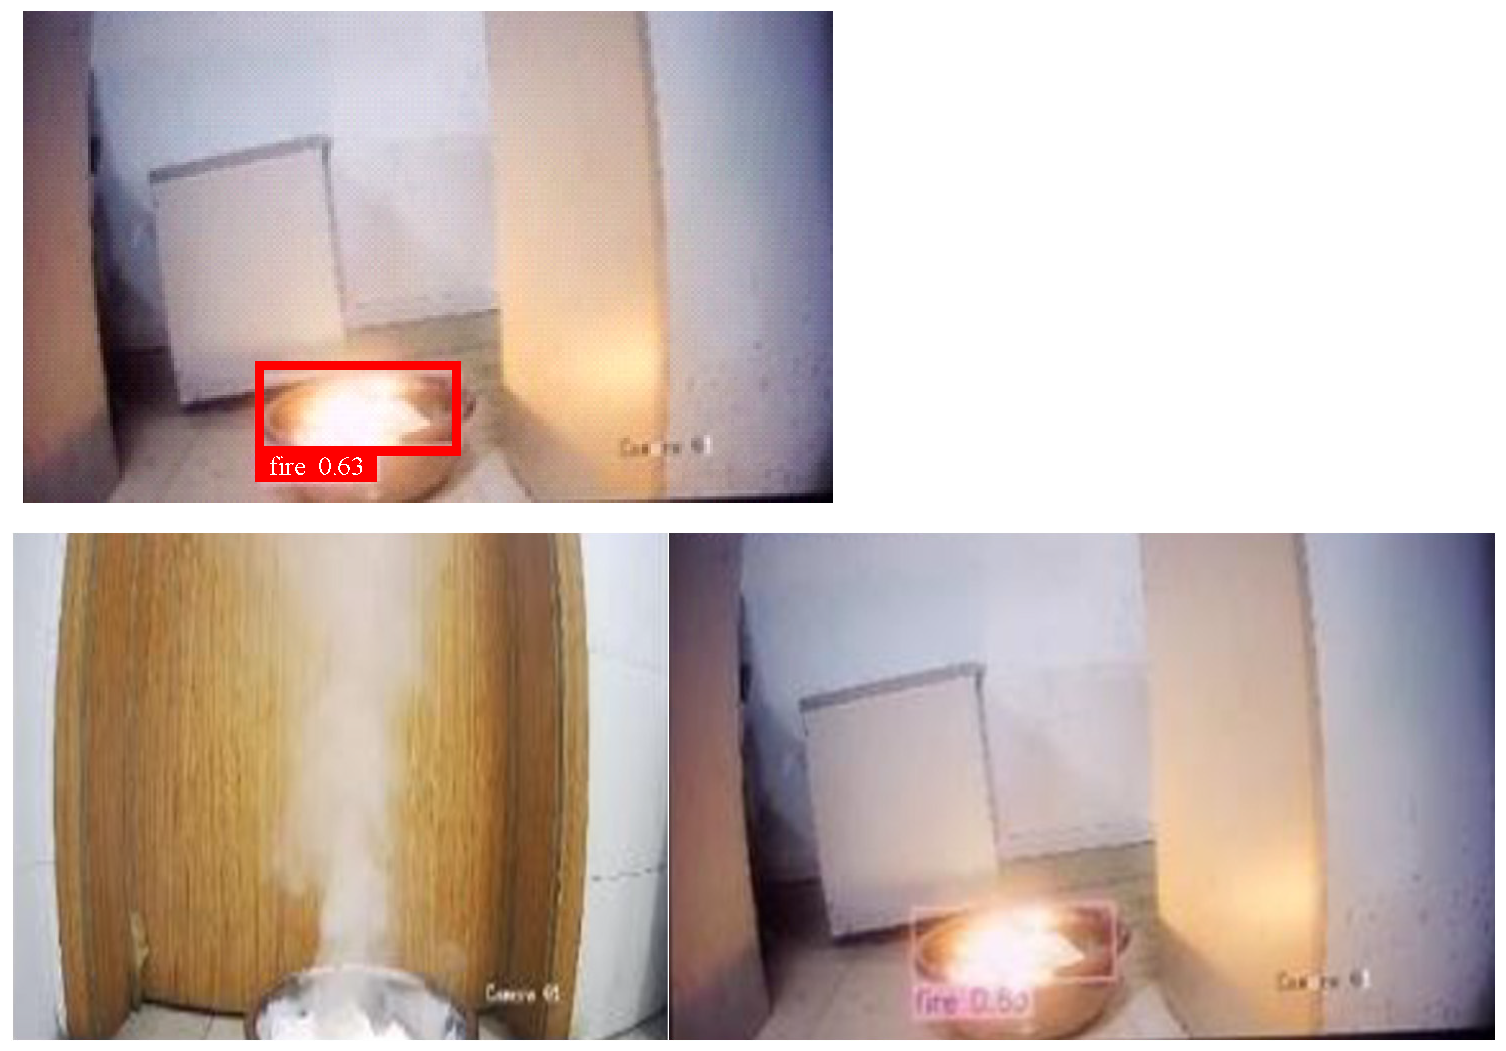
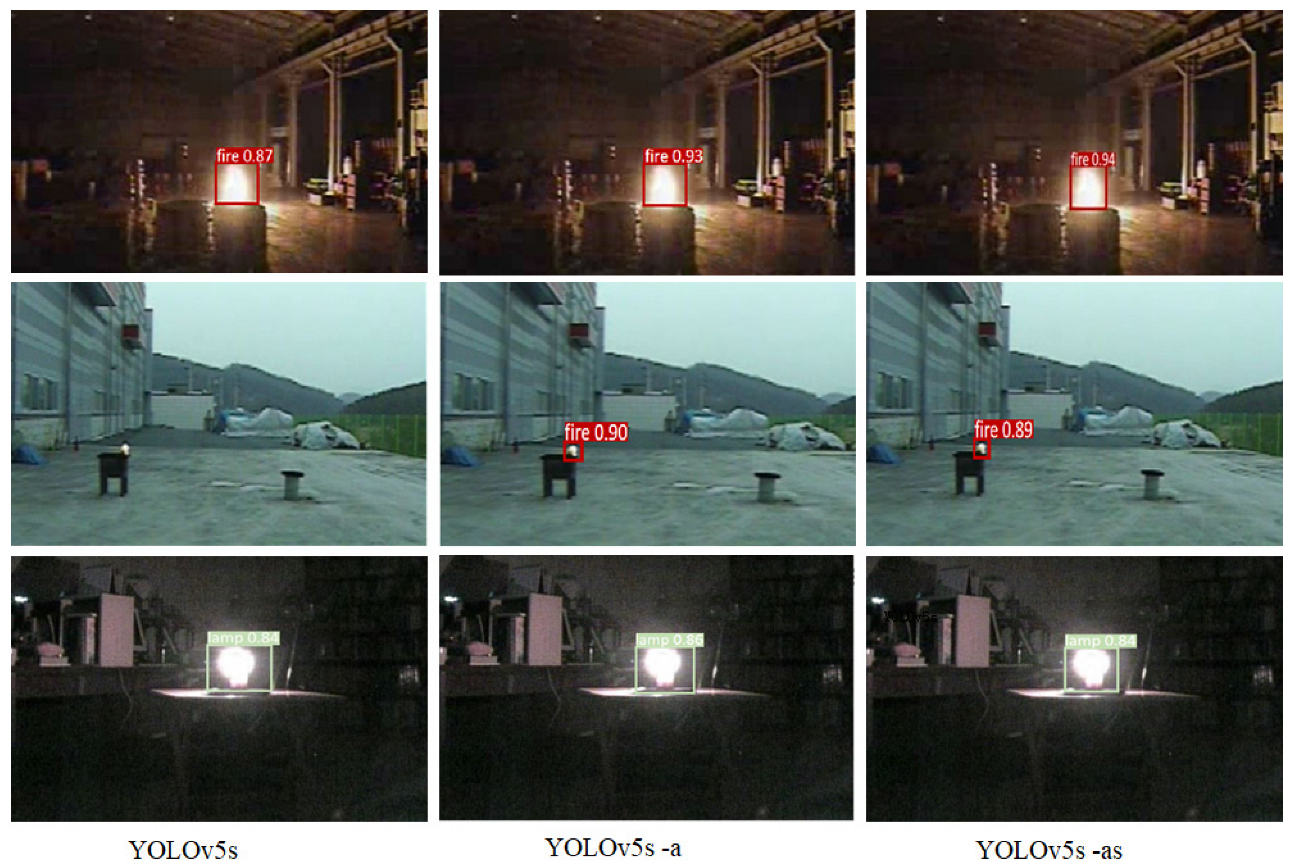
To assess the generalization capability of the proposed approach, additional experiments were conducted in different scenarios. The results of these tests are illustrated in Figure 10.
As illustrated in Figure 10, all three models—YOLOv5s, YOLOv5s-a, and YOLOv5s-as—successfully detected large flames. However, YOLOv5s failed to detect small flames due to its limited capability in small-object recognition, while YOLOv5s-a effectively identified them, confirming improved performance. To further evaluate robustness, a controlled scenario was designed in which flames resembled artificial lighting. Both YOLOv5s and YOLOv5s-a misclassified the flame as a lamp. In contrast, the proposed method, despite initial misidentification, leveraged multi-sensor data to detect combustion features. Through information fusion, it correctly identified the fire and triggered an alarm, demonstrating superior accuracy and reliability.

6.3.2. Performance Comparative Experiment of Edge Devices

To verify the low-latency performance of the proposed edge-based fire detection method, the system was also deployed on a cloud computing platform for comparison, and data transmission volume and processing time were recorded. Cloud-based fire detection typically involves five steps: data acquisition, uploading, cloud processing, result feedback, and alarm response. In contrast, the edge-based method performs all computations locally, eliminating the need for cloud upload and enabling real-time decision-making. Only the final detection results and corresponding images are transmitted to the cloud for storage or review.
The cloud server hardware configuration included an Intel® Xeon® E5-2609 CPU, 64 GB RAM, a 1 TB solid-state drive, and an NVIDIA TITAN Xp GPU. The network testing environment featured a 300Mbps bandwidth.
As shown in Table 8, the image capture and processing time of the fire detection system is defined as the response cycle. The response cycle for cloud-based computing was measured at 411 milliseconds, whereas the detection cycle using edge computing required only 304 milliseconds. Compared to the cloud-based detection method, the edge computing approach successfully reduced latency by 37.8%.

7. Conclusions

This paper proposes an edge intelligence-based fire detection system for underground coal mines, enhancing the YOLOv5s model to improve early-stage small-flame detection. The backbone network is modified to better capture shallow features, thereby boosting small-object detection. An adaptive attention module is introduced into the neck of the network, using spatial attention to enhance contextual information and mitigate information loss.
To improve robustness under low lighting and variable camera angles, a multi-source information fusion method is applied, integrating video and sensor data through a normalized weighted algorithm with dynamic threshold adjustment.
For deployment, the model is quantized and deployed on edge devices to support fast offline detection. Experimental results demonstrate that the proposed system meets the real-time and accuracy requirements of underground fire detection. Future work will focus on optimizing smoke detection performance.
Future research will focus on the dynamic adaptive weight value and smoothing factor. At the same time, more attention should be paid to the construction of experimental scenes, which should be close to the real coal mine scene in humidity, dust, intermittent WiFi and other environmental conditions. In future research, we should pay more attention to the comprehensiveness and error analysis of evaluation indicators.

Author Contributions

Conceptualization, Y.Y. and D.Z.; methodology, Y.Y. and D.Z.; software, Y.Y.; validation, Y.Y. and D.Z.; formal analysis, Y.Y. and D.Z.; investigation, Y.Y., D.Z. and T.L.; resources, Y.Y., D.Z., and Y.G.; data curation, Y.Y., Y.G., and T.L.; writing—original draft preparation, Y.Y., Y.G., and T.L.; writing—review and editing, D.Z., Y.G., and T.L.; visualization, Y.Y.; supervision, D.Z.; project administration, Y.Y. and D.Z.; funding acquisition, D.Z. All authors have read and agreed to the published version of the manuscript.

Funding

This research was funded by the National Key Research and Development Program of China, No.2022YFC3004803 and the Fundamental Research Funds for the Central Universities, No.2021ZDPY0208.

Institutional Review Board Statement

Not applicable.

Informed Consent Statement

Not applicable.

Data Availability Statement

The original contributions presented in this study are included in the article. Further inquiries can be directed to the corresponding author.

Conflicts of Interest

The authors declare no conflicts of interest.

References

  1. He, K.; Feng, X.; Gao, N.; Ma, T. Fine-Grained Image Classification Algorithm Using Multi-Scale Feature Fusion and Re-Attention Mechanism. J. Tianjin Univ. (Sci. Technol.) 2020, 53, 1077–1085. [Google Scholar]
  2. Huang, C.; Chen, S.; Xu, L. Object Detection Based on Multi-Source Information Fusion in Different Traffic Scenes. In Proceedings of the 2020 12th International Conference on Advanced Computational Intelligence (ICACI), Dali, China, 14–16 August 2020; pp. 213–217. [Google Scholar]
  3. Zhang, K.; Ye, Y.; Zhang, H. Forest fire monitoring system based on edge computing. Big Data Res. 2019, 5, 79–88. [Google Scholar]
  4. Muhammad, K.; Ahmad, J.; Mehmood, I.; Rho, S.; Baik, W. Convolutional Neural Networks Based Fire Detection in Surveillance Videos. IEEE Access 2018, 6, 18174–18183. [Google Scholar] [CrossRef]
  5. Goel, A. An Emerging Fire Detection System based on Convolutional Neural Network and Aerial-Based Forest Fire Identification. In Proceedings of the IEEE International Conference on Computer Vision and Machine Intelligence, Gwalior, India, 10–11 December 2023; pp. 1–5. [Google Scholar]
  6. Zhao, L.; Zhi, L.; Zhao, C.; Zheng, W. Fire-YOLO: A Small Target Object Detection Method for Fire Inspection. Sustainability 2022, 14, 4930. [Google Scholar] [CrossRef]
  7. Yar, H.; Khan, Z.A.; Ullah, F.U.M.; Ullah, W.; Baik, S.W. A modified YOLOv5 architecture for efficient fire detection in smart cities. Expert Syst. Appl. 2023, 231, 120465. [Google Scholar] [CrossRef]
  8. Zhang, Z.; Feng, W. An Improved YOLOv5 video real-time flame detection algorithm. Comput. Appl. Softw. 2024, 41, 225–260+302. [Google Scholar]
  9. Deng, Q.; Ding, H.; Jiang, P.; Yang, M.; Liu, S.; Chen, Z.; Li, F. Intelligent Detection Algorithm for Fire Smoke in Highway Tunnel Based on Improved YOLOv5s. China J. Highw. Transp. 2024, 37, 194–209. [Google Scholar]
  10. Hou, C.; Wang, Q.; Wang, K. Improved multi-scale flame detection method. Chin. J. Liq. Cryst. Disp. 2021, 36, 751–759. [Google Scholar] [CrossRef]
  11. Liu, Y.; Wu, X.; Zhao, J.; Cheng, P.; Wang, S. Research on the Lightweight Forest Fire Video Monitoring Method by MobileNet. Microcomput. Appl. 2024, 40, 5–8. [Google Scholar]
  12. Fan, Q.; Li, Y.; Liu, Y.; Weng, Z. Mine external fire monitoring method using the fusion of visual features. J. Min. Sci. Technol. 2023, 8, 529–537. [Google Scholar]
  13. Su, Q.; Hu, Z.; Liu, X. Research on fire detection method of complex space based on multi-sensor data fusion. Meas. Sci. Technol. 2024, 35, 085107. [Google Scholar] [CrossRef]
  14. Liu, P.; Xiang, P.; Lu, D. A new multi-sensor fire detection method based on LSTM networks with environmental information fusion. Neural Comput. Applic. 2023, 35, 25275–25289. [Google Scholar] [CrossRef]
  15. Zhang, R.; Wu, T.; Yu, C.; Xv, X. Fire detection algorithm in computer rooms based on multi-sensor data fusion. J. Wuhan Inst. Technol. 2024, 46, 79–84. [Google Scholar]
  16. Duan, L.; Yang, K.; Mao, D.; Ren, P. Fuzzy evidence theory-based algorithm in application of fire detection. Comput. Eng. Appl. 2017, 53, 231–235. [Google Scholar]
  17. Li, X.; Zhao, C.; Fan, C.; Qiu, X. Multi-sensor Data Fusion Algorithm Based on Dempster-Shafer Theory. In Proceedings of the 2021 7th International Conference on Computer and Communications (ICCC), Chengdu, China, 10–13 December 2021; pp. 288–293. [Google Scholar]
  18. Wang, C.-Y.; Liao, H.-Y.M.; Wu, Y.-H.; Chen, P.-Y.; Hsieh, J.-W.; Yeh, I.-H. CSPNet: A New Backbone that can Enhance Learning Capability of CNN. In Proceedings of the 2020 IEEE/CVF Conference on Computer Vision and Pattern Recognition Workshops(CVPRW), Seattle, WA, USA, 14–19 June 2020; pp. 1571–1580. [Google Scholar]
  19. Liu, S.; Qi, L.; Qin, H.; Shi, J.; Jia, J. Path Aggregation Network for Instance Segmentation. In Proceedings of the 2018 IEEE/CVF Conference on Computer Vision and Pattern Recognition(CVPR), Salt Lake, UT, USA, 18–23 June 2018; pp. 8579–8768. [Google Scholar]
  20. Chen, Y.M.; Huang, H.C. Fuzzy logic approach to multisensor data association. Math. Comput. Simul. 2000, 52, 399–412. [Google Scholar] [CrossRef]
  21. Conti, R.S. , Litton, C.D. A Comparison of Mine Fire Sensors; U.S. Department of the Interior, Bureau of Mines: Washington, DC, USA, 1995. [Google Scholar]
  22. Wang, H.; Zhang, Y.P.; Xie, J.H.; You, H.D. Application of WSN Hierarchical Clustering Data Fusion in Coal Mine Fire Monitoring. Coal Technol. 2019, 38, 68–70. [Google Scholar]
  23. Wang, Y.; Wang, W. Mine Fire Simulation and Analysis. Coal Technol. 2012, 31, 77–79. [Google Scholar]
  24. Howard, A.G.; Zhu, M.; Chen, B.; Kalenichenko, D.; Wang, W.; Weyand, T.; Andreetto, M.; Adam, H. Mobilenets: Efficient Convolutional Neural Networks for Mobile Vision Applications. arXiv 2017, arXiv:1704.04861. [Google Scholar]
  25. Liu, W.; Anguelov, D.; Erhan, D.; Szegedy, C.; Reed, S.; Fu, C.Y.; Berg, A.C. Ssd: Single shot multibox detector. In Proceedings of the Computer Vision–ECCV 2016: 14th European Conference, Amsterdam, The Netherlands, 11–14 October 2016; pp. 21–37. [Google Scholar]
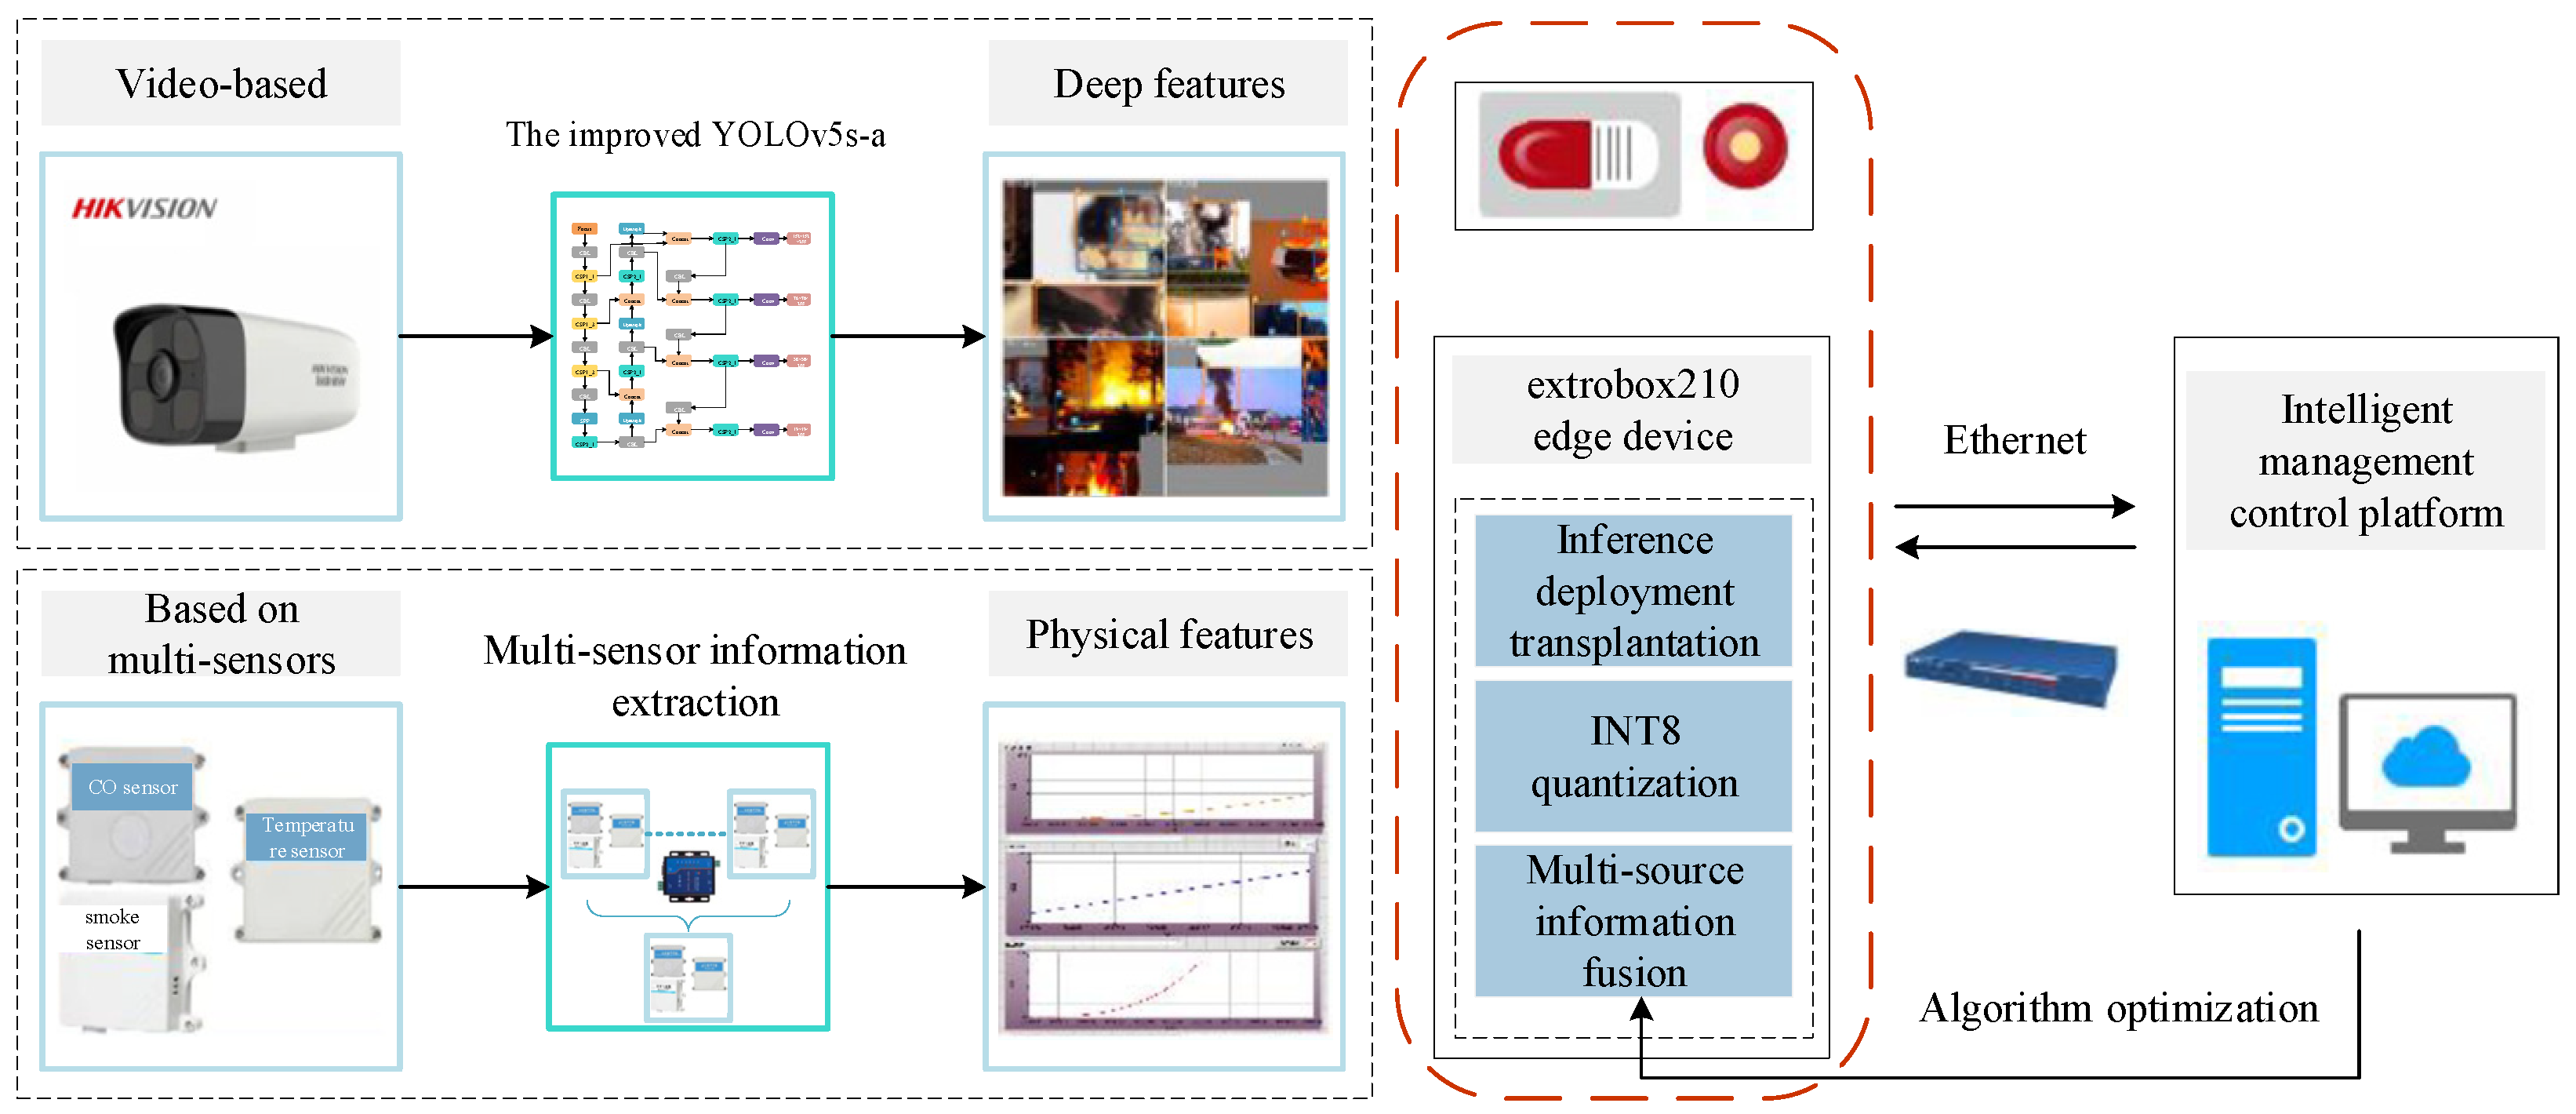
Figure 1. Overall system architecture design.
Applsci 15 10589 g001
Figure 2. YOLOv5s network structure diagram.
Applsci 15 10589 g002
Figure 3. Structure diagram of YOLOv5s network for 4-scale detection.
Applsci 15 10589 g003
Figure 4. Improved network structure diagram of FPN + PANet.
Applsci 15 10589 g004
Figure 5. Adaptive attention module structure diagram.
Applsci 15 10589 g005
Figure 6. Flow chart of weighted decision algorithm when fire information is detected in video.
Applsci 15 10589 g006
Figure 7. Experiment result diagram.
Applsci 15 10589 g007
Figure 8. Dataset case diagram.
Applsci 15 10589 g008
Figure 9. An example of a picture taken.
Applsci 15 10589 g009
Figure 10. Test result diagram.
Applsci 15 10589 g010
Table 1. Meaning of score.
ScoreMeaning
1Equally important
3Slightly important
5Quite important
7Obviously important
9Absolutely important
2, 4, 6, 8Median of above standard
Table 2. Fire test data.
NumberTemperature/°CSmoke Concentration
/mg m−3
CO Concentration/ppm
124.50.0512
228.70.3734
329.40.5545
431.20.7657
534.91.0569
Mean value29.70.5743.4
Table 3. Comparison of experimental results of each algorithm.
Big FlameResultSmall FlameResultSmolderingResult
YOLOv5s49/50YOLOv5s29/50YOLOv5s1/50
YOLOv5s-a49/50YOLOv5s-a46/50YOLOv5s-a3/50
YOLOv5s-as49/50YOLOv5s-as48/50YOLOv5s-as28/50
Table 4. Dataset make parameters.
Camera Serial NumberCamera AngleInstallation Height (m)Number of ImagesLightingDust
1Horizontal01000NormalLittle
2Horizontal02000DarkerMuch
3Front 45°2.101200NormalMuch
4Front 45°2.101000DarkerLittle
5Rear 45°2.101000NormalMuch
6Rear 45°2.102000DarkerMuch
Table 5. Dataset completion.
DatasetTraining SetValidation SetTest SetTotal Number
Number of images630018009009000
Number of annotated samples11,0213458193416,413
Table 6. Comparison of detection results before transplantation of each algorithm (z = 1.96).
ModelRmAP@0.5 σ CIInference Time (ms)
SSD 300 (VGG16)76.4%73.2%3.2%(0.723,0.741)26
SSD 521 (VGG16)77.9%75.1%3.3%(0.742,0.760)62
YOLOv3-SPP82.5%81.1%3.0%(0.802,0.820)24
YOLOv5s91.5%90.7%2.6%(0.900,0.914)18
YOLOv5s-a96.7%94.1%2.4%(0.934,0.948)20
Table 7. Comparison of detection results of each algorithm after transplantation (z = 1.96).
ModelmAP@0.5 σ CIInference Time (ms)
SSD 300 (VGG16)71%5.1%(0.696,0.724)19
SSD 521 (VGG16)74.2%4.4%(0.730,0.755)53
YOLOv3-SPP80.3%4.3%(0.791,0.815)18
YOLOv5s87%3.3%(0.861,0.880)11
YOLOv5s-a93.3%3.2%(0.924,0.942)12
YOLOv5s-as94.2%2.9%(0.934,0.950)15
Table 8. Response time statistics of extrobox210 edge computing and cloud computing platforms.
ProcessEdge ProcessingCloud Computing Processing
Step 1Image and data acquisition = > 41 msImage and data acquisition = > 41 ms
Step 2Edge computing processing = >166 msUpload raw images and data = >162 ms
Step 3Alarm response = >49 msCloud computing processing = >53 ms
Step 4Upload detection pictures = >158 ms
(Alarm completed, not calculated as processing cycle)
Detection result feedback = >110 ms
Step 5Detection result feedback = > 61 ms
(Alarm completed, not calculated as processing cycle)
Alarm response = >45 ms
Response cycle304 ms411 ms
Disclaimer/Publisher’s Note: The statements, opinions and data contained in all publications are solely those of the individual author(s) and contributor(s) and not of MDPI and/or the editor(s). MDPI and/or the editor(s) disclaim responsibility for any injury to people or property resulting from any ideas, methods, instructions or products referred to in the content.