Article

Analysis of the Influence of RTK Observations on the Accuracy of UAV Images

by
Magdalena Pilarska-Mazurek
* and
Dawid Łoza
Faculty of Geodesy and Cartography, Warsaw University of Technology, 00-661 Warsaw, Poland
*
Author to whom correspondence should be addressed.
Appl. Sci. 2025, 15(19), 10559; https://doi.org/10.3390/app151910559
Submission received: 22 August 2025 / Revised: 24 September 2025 / Accepted: 28 September 2025 / Published: 29 September 2025
(This article belongs to the Special Issue Technical Advances in UAV Photogrammetry and Remote Sensing)

Abstract

Real-time kinematic (RTK) unmanned aerial vehicles (UAVs) have become more popular in recent years, mostly because they can reduce the number of ground control points (GCPs) that have to be measured in the field and are required for aerial triangulation. Additionally, thanks to RTK technology, every image has its exterior orientation parameters measured with centimeter accuracy; thus, the block is more stable and there is a lower risk of some geometric distortions appearing within the block, especially in its central part. In this article, the influence of RTK observations on image orientation is analyzed based on a planned UAV test field in Józefosław, near Warsaw, Poland. As part of the experiment, UAV flights with DJI Phantom 4 RTK and DJI Phantom 4 Pro V2.0 were conducted, and 38 GCPs were located in the area. The results show that RTK observations from UAVs can significantly improve the accuracy of aerial triangulation, as inclusion of oblique images also does. For Phantom 4 RTK images, a single GCP was generally sufficient to achieve satisfactory accuracy, whereas six GCPs were required for the Phantom 4 Pro V2.0.

1. Introduction

Unmanned aerial vehicles (UAVs) are widely used in many applications due to their rapid data collection, high resolution of acquired data, and the growing variety and quality of sensors [1,2]. In particular, real-time kinematic (RTK) UAVs are becoming more popular as they can provide centimeter-accuracy image positions, thus reducing the number of ground control points (GCPs) required to be measured in the field and used for aerial triangulation. Previously, the exterior orientation parameters (EOPs) were also measured during the flight in most cases; however, to acquire accurate positions of the images and generated products, GCPs measured in the field are needed or post-processing kinematic (PPK) calculations must be performed. However, gathering and measuring GCPs in the terrain and on images can be time-consuming; furthermore, in forested areas, it may even be impossible.
In the image adjustment process, if the camera positions are determined during the flight using RTK technology or after the flight using PPK, direct georeferencing can be implemented. For commercial solutions like DJI UAVs [3], a base station can be purchased together with the UAV, which has been tested for its accuracy in [4]. Nevertheless, there is a necessity to use some checkpoints to evaluate the aerial triangulation accuracy. If there is a problem with image orientation or direct georeferencing, GCPs must be used as control points. To reduce the misalignment along the vertical Z axis, one GCP should be sufficient to determine the Z offset. In cases when the errors of the checkpoints are higher than expected, especially in the horizontal direction, more GCPs have to be used as control points to adjust the block in the reference frame.

1.1. Direct Georeferencing of UAV Images

Research comparing the PPK and direct georeferencing of images from RTK UAVs is presented in the literature. Most of the articles concern small RTK UAVs with integrated cameras. For larger UAVs with cameras on gimbals, the positional uncertainty can be higher, and lever arm corrections and positioning of the global navigation satellite system (GNSS) RTK reference center can be challenging [5]. In the case of smaller UAVs, these aspects can be solved during self-calibration with the bundle adjustment process. In [6], the image adjustment was completed using different approaches, i.e., using GCPs, PPK, and PPK with one GCP. The results showed that, in the case of the DJI Phantom 4 Pro V 2.0 with a single-frequency GNSS onboard, the accuracy achieved using GCPs for georeferencing was slightly better than that using the direct method. However, the differences were approximately 10% for vertical root mean square errors (RMSEz) of point positions in the point clouds and digital surface model (DSM) and horizontal root mean square errors (RMSExy) for points on the orthomosaic. In [7], flights over forested areas were performed, for which GCP distribution can be difficult or even impossible. The research aimed to compare direct georeferencing using RTK observations and five PPK methods. The results showed that the short-baseline PPK method yielded the best results; however, analyzing the errors on checkpoints, the results were very close to the those obtained using the RTK method with one GCP. For four out of five PPK methods, the use of a GCP together with camera parameters reduced errors, especially in the Z direction, which proves that a single GCP can be sufficient to achieve accurate image orientation with the RTK or PPK method. According to the study presented in [8], an RTK-GNSS UAV can provide sufficient results for many geographical applications without any GCPs used for image orientation. A similar conclusion was drawn in another study [9].

1.2. Influence of GCP Distribution and Flight Geometry

A variety of experiments can be found in the literature concerning the impact of different flight parameters on the image block accuracy, including combinations with the number of GCPs [10,11,12]. In [13], several flight altitudes, overlap settings, and the use (or lack) of GCPs were tested. The optimum scenario would be an even GCP distribution over the flight area [14], but this is not always possible. In [15], the optimal number of GCPs and their distribution were examined for areas in which only the outer edge of a particular area is available. In [16], DJI Phantom 4 RTK was also evaluated in urban areas, using six checkpoints, and the differences between the terrain and photogrammetric measurements were ±2.5 cm for horizontal and ±3.5 cm for vertical accuracy. In [17], 32 flights with different flight altitudes, overlaps, and numbers of images were experimented on for the resulting map accuracy. Four checkpoints and three control distances were used for accuracy assessment. The results showed that the average error for the Phantom 4 RTK was 3.65 cm, which is 0.27% with respect to in situ measurements. Additionally, according to the article, it is recommended to use some ground control checkpoints (1–2 GCPs) to ensure accuracy. In [18], the number of GCPs and image overlap for cadastral mapping using different cameras were tested. According to the results, with five GCPs, all datasets demonstrated a significant improvement in the vertical RMSE. After seven GCPs, the vertical residuals stabilized within the range of 1 ground sampling distance (GSD). Thus, seven GCPs were recommended for use in image adjustment.
In most of the experiments described above, only nadir images were used for the evaluation. In the case of blocks of nadir images, cross flights can improve the block geometry and accuracy [19]. However, it is known that oblique images can also have a positive impact [20], especially on the self-calibration process and focal length determination, which can be particularly important for self-calibration of images acquired over relatively flat areas [21]. The correlation between focal length and altitude is a common ambiguity in the self-calibration process, especially for flat areas without height objects. Oblique images, even taken for flat areas, are characterized by non-uniform scale. Joining nadir and oblique images reduces or eliminates systematic dome errors during UAV data processing, and results in more corresponding points being found on the images because of different perspectives [22]. Similar experiments to those presented in this article were described by [23], in which both nadir and oblique images were used, as well as a different number of GCPs used for image adjustment. The results showed that including both nadir and oblique images caused higher accuracy in the vertical direction. A more comprehensive study was conducted by [24], who performed both laboratory and field surveys to compare the Phantom 4 and Phantom 4 RTK in open-source and commercial software. Similar conclusions regarding the vertical RMSE error can be drawn from the previous article, i.e., the vertical error was smaller for joint nadir and oblique image orientation.
Many aspects can influence the accuracy of image aerial triangulation. Image quality, GNSS accuracy, and the number and distribution of the GCPs can influence the accuracy of UAV image adjustment. The UAVs can be tested over areas of interest (AOIs), on which GCPs are measured in the terrain. However, some UAV tests are likely to be performed on stabilized test fields; for example, in [25], the influence of the control point configuration as well as self-calibration results on RTK image aerial triangulation were assessed. Research on the number of GCPs that are necessary to obtain accurate image aerial triangulation has been conducted for years, and there have been a number of different attempts to determine the number of GCPs, e.g., per m2 [26] or number of images per 1 GCP [27].
Different geometries of blocks can also influence the aerial triangulation results, especially linear flights, which are more difficult blocks to process. An example was presented in [28], in which 7 GCPs were necessary to provide stable horizontal accuracy and 9–10 GCPs were needed for stable vertical accuracy. Based on the results, it was recommended to place GCPs on each side of the road and separate them by a distance, with a pair of GCPs placed at each end of the corridor.
GCP distribution and thus aerial triangulation results influence product accuracy. Geometric reconstruction based on the images and product generation like dense point cloud and orthomosaic depend on image block parameters and georeferencing [19]. The study presented in [29] assessed the accuracy of photogrammetric products and showed that fewer GCPs (three GCPs) were necessary for the orthomosaic, and more (five GCPs) for the digital terrain model (DTM) to achieve centimeter accuracy. Moreover, UAVs are often tested over test fields, which include stabilized GCPs that have a proper number, distribution, and accuracy [30,31,32]. In an optimal scenario, the test field can serve for both images and light detection and ranging (LiDAR) point clouds.

1.3. Aim of the Article

All of the aforementioned research mostly focused on accuracy analysis of the Phantom 4 RTK and the possibility of GCP exclusion from the image adjustment process in the case of different application scenarios. In this study, we performed a complex analysis of the number of GCPs and distribution on the test area, as well as types of images taken (nadir/oblique) to plan a calibration field with stabilized GCPs. Such a calibration field should be useful for both RTK and non-RTK UAVs; thus, two DJI Phantom 4 UAVs were tested. We focused more on the aerial triangulation results than product accuracy, and considered only one area, in order to determine the optimum GCP distribution in the case of a planned calibration field.

2. Materials and Methods

2.1. Test Area and UAVs

The planned test field for UAVs will be located in Józefosław near Warsaw, Poland, on the terrain of the Research Centre of Warsaw University of Technology. The area is flat, with one big building; part of the area is wooded, and there is also a test field consisting of gabled and cuboid elements for UAV laser scanning point cloud assessment. The area’s characteristics need to be taken into account while performing aerial triangulation and the analysis of results (Figure 1). In the area, 38 GCPs were distributed. Whenever possible, they were evenly spaced across the site and marked with a black-and-white chessboard pattern. The GCPs were measured with a Leica Gs07 GNSS receiver (Heerbrugg, Switzerland) [33], and check distances were measured with a Leica TS16 total station [34].
The UAVs used for data acquisition were the DJI Phantom 4 Pro V 2.0 (further mentioned as P4 Pro) and the DJI Phantom 4 RTK (further mentioned as P4 RTK). The main difference between the UAVs is that P4 RTK can acquire image positions with centimeter accuracy during flight, which should help to reduce the number of GCPs. The camera parameters are provided in Table 1.

2.2. GCP Location and Flight Mission Planning

As a first step, the GCP location and flight missions with different parameters were planned. The GCP location was limited by the available area; e.g., wooded areas and their closest neighborhood were excluded. The GCPs were planned to be evenly distributed in the test area. The flights were conducted with DJI P4 Pro and DJI P4 RTK UAVs. The missions were planned in the DJI Ground Station Pro application [35]. For both UAVs, flights with the same parameters were planned. Overlap between the images was 80/80% for both frontal and side overlap. Images were acquired from 5 flight heights: 50, 60, 70, 80, and 90 m above ground level (AGL). To fully evaluate the image adjustment, oblique images were also acquired; however, due to the time constraints necessary to perform all flights, oblique images were acquired for just two flight altitudes: 60 m and 80 m AGL. A summary of the images that were acquired at different flight heights AGL is presented in Table 2.
Then, different variants of the GCP distribution were planned. The aim of this research was to prepare the GCP distribution over the test area to plan the calibration field for UAV cameras and what flights should be conducted with what parameters (mainly what flight heights and if oblique images should be used). The test area is approximately 6 km from the airport; thus, the maximum flight AGL for UAVs without an earlier planned mission is 100 m AGL. Therefore, many GCPs were located in a relatively small area, and the height of the flights was planned taking into account the safety and legal considerations. Additionally, selected altitudes should cover most of the potential UAV flight scenarios and applications, especially taking into account the smaller UAVs with integrated cameras, such as the DJI Phantom 4.
Regarding the GCP distributions, 10 different variants were planned, taking into account different numbers (no GCPs and 1, 3, 6, and 12 GCPs, with the rest of the points being treated as checkpoints) as well as different geometric aspects, i.e., GCP locations in the area of interest (e.g., GCPs only in corners, on the left/right side of the block) were examined (Figure 1, Table 3). The abovementioned GCP variants were selected for the following reasons: 1 GCP should be enough for RTK images to achieve satisfactory aerial triangulation results; 3 GCPs is the minimum number required in aerial triangulation; 6 GCPs, according to the literature review, can be sufficient for accurate aerial triangulation of GPS images; and 12 is a number that should guarantee sufficient accuracy of image aerial triangulation. Moreover, different geometric distributions of the GCPs were analyzed, as the geometric distribution influences the image adjustment accuracy, especially in GPS image blocks. All the variants can provide reliable analysis.
The results were analyzed based on the errors of GCPs and checkpoints after image aerial triangulation. Both horizontal and vertical errors were analyzed and presented as histograms or tables. In summation, 10 nadir flights (5 for P4 Pro and 5 for P4 RTK) for 10 GCP variants were used, which gives 100 variants. Additionally, 4 oblique blocks (2 for P4 Pro and 2 for P4 RTK) were analyzed for all 10 variants, which gave 40 additional variants. Moreover, 6 check distances were measured on the orthomosaic generated from the images and compared to the terrain measurements. The check distance measurements were conducted between the GCPs; thus, the start and end points were clearly visible on the orthomosaic. Different lengths of the distances were used (Table 4). The location of the check distances depended on the possibilities of their measurement (i.e., visibility in the terrain). A chart presenting the experimental workflow is presented in Figure 2.

2.3. Data Processing

The images were processed using the Agisoft Metashape Professional software, version 1.8.4 [36]. For every GCP variant, one project was created, in which chunks for every UAV flight were included. External orientation parameters of the images, as well as their accuracy, provided in Exchangeable Image File Format (EXIF) files, were used for the initial image alignment. The external orientation parameters in Agisoft were transformed to the coordinate system in which the GCPs were measured. Additionally, the difference between the geoid and ellipsoid was included in the transformation, using a known value of the undulation and a simple Python script in Agisoft. The undulation value was added to the ellipsoid height, resulting in the geoid height of external orientation parameters. Then, the GCPs’ coordinates were imported into the projects, and their accuracy was set to 5 cm. The accuracy resulted from the GCP measurement accuracy (2–3 cm, depending on the GCP) and the stability of the GCPs, which were located on ground with short grass but were easy to interpret both in the images and also in the terrain (a chessboard was used). The initial orientation of the images was conducted using external orientation parameters of the images and full image resolution. The key point limit was set to 40,000, and the tie point limit was set to 10,000.
Afterwards, GCPs were measured and precisely marked on all images where it was possible to interpret them. When a GCP had already been measured on 12 to 15 images, the error stabilized. Images on which the GCPs were ambiguously identifiable were omitted from the measurement process, so as not to lower the accuracy of the final results. Almost all measured GCPs were labeled with black-and-white cheeseboards to facilitate the measurement. Only a few GCPs were in the form of field details, i.e., manholes. After GCP measurement, image blocks were adjusted using a particular GCP variant. Together with the aerial triangulation process, camera self-calibration was performed.
For selected image blocks, an orthomosaic was generated. On the orthomosaic, check distances were measured to complete the accuracy assessment. Only a few alignment results were selected in order to compare the best alignment results. Firstly, the dense point cloud was generated using the original image resolution. Then, a digital elevation model (DEM) was produced; finally, the orthomosaic was prepared. The spatial resolution of the orthomosaic was the same as the image GSD.

3. Results

3.1. Nadir Images and Influence of RTK Observations on Aerial Triangulation Results

In the first step, aerial triangulation of nadir images from both GPS and RTK UAV was conducted and analyzed. Firstly, the height Z errors for the nadir images were examined. For variant 1, where nadir images without GCPs were processed, the errors were the highest when compared with the results obtained in variants 2–10. Notably, a lack of GCPs results in randomness for height errors. In general, for GPS technology, the height errors are higher and tend to increase with flight altitudes. Particularly high errors are observed for flights at 60 and 90 m AGL, where the values oscillate around 20 m. For RTK technology, the errors are considerably lower than those for GPS on each of the tested flight heights, proving the positive influence of RTK observations on aerial triangulation results. The highest errors for RTK occur for an altitude of 90 m, but these are still significantly smaller compared to the errors for GPS (Figure 3).
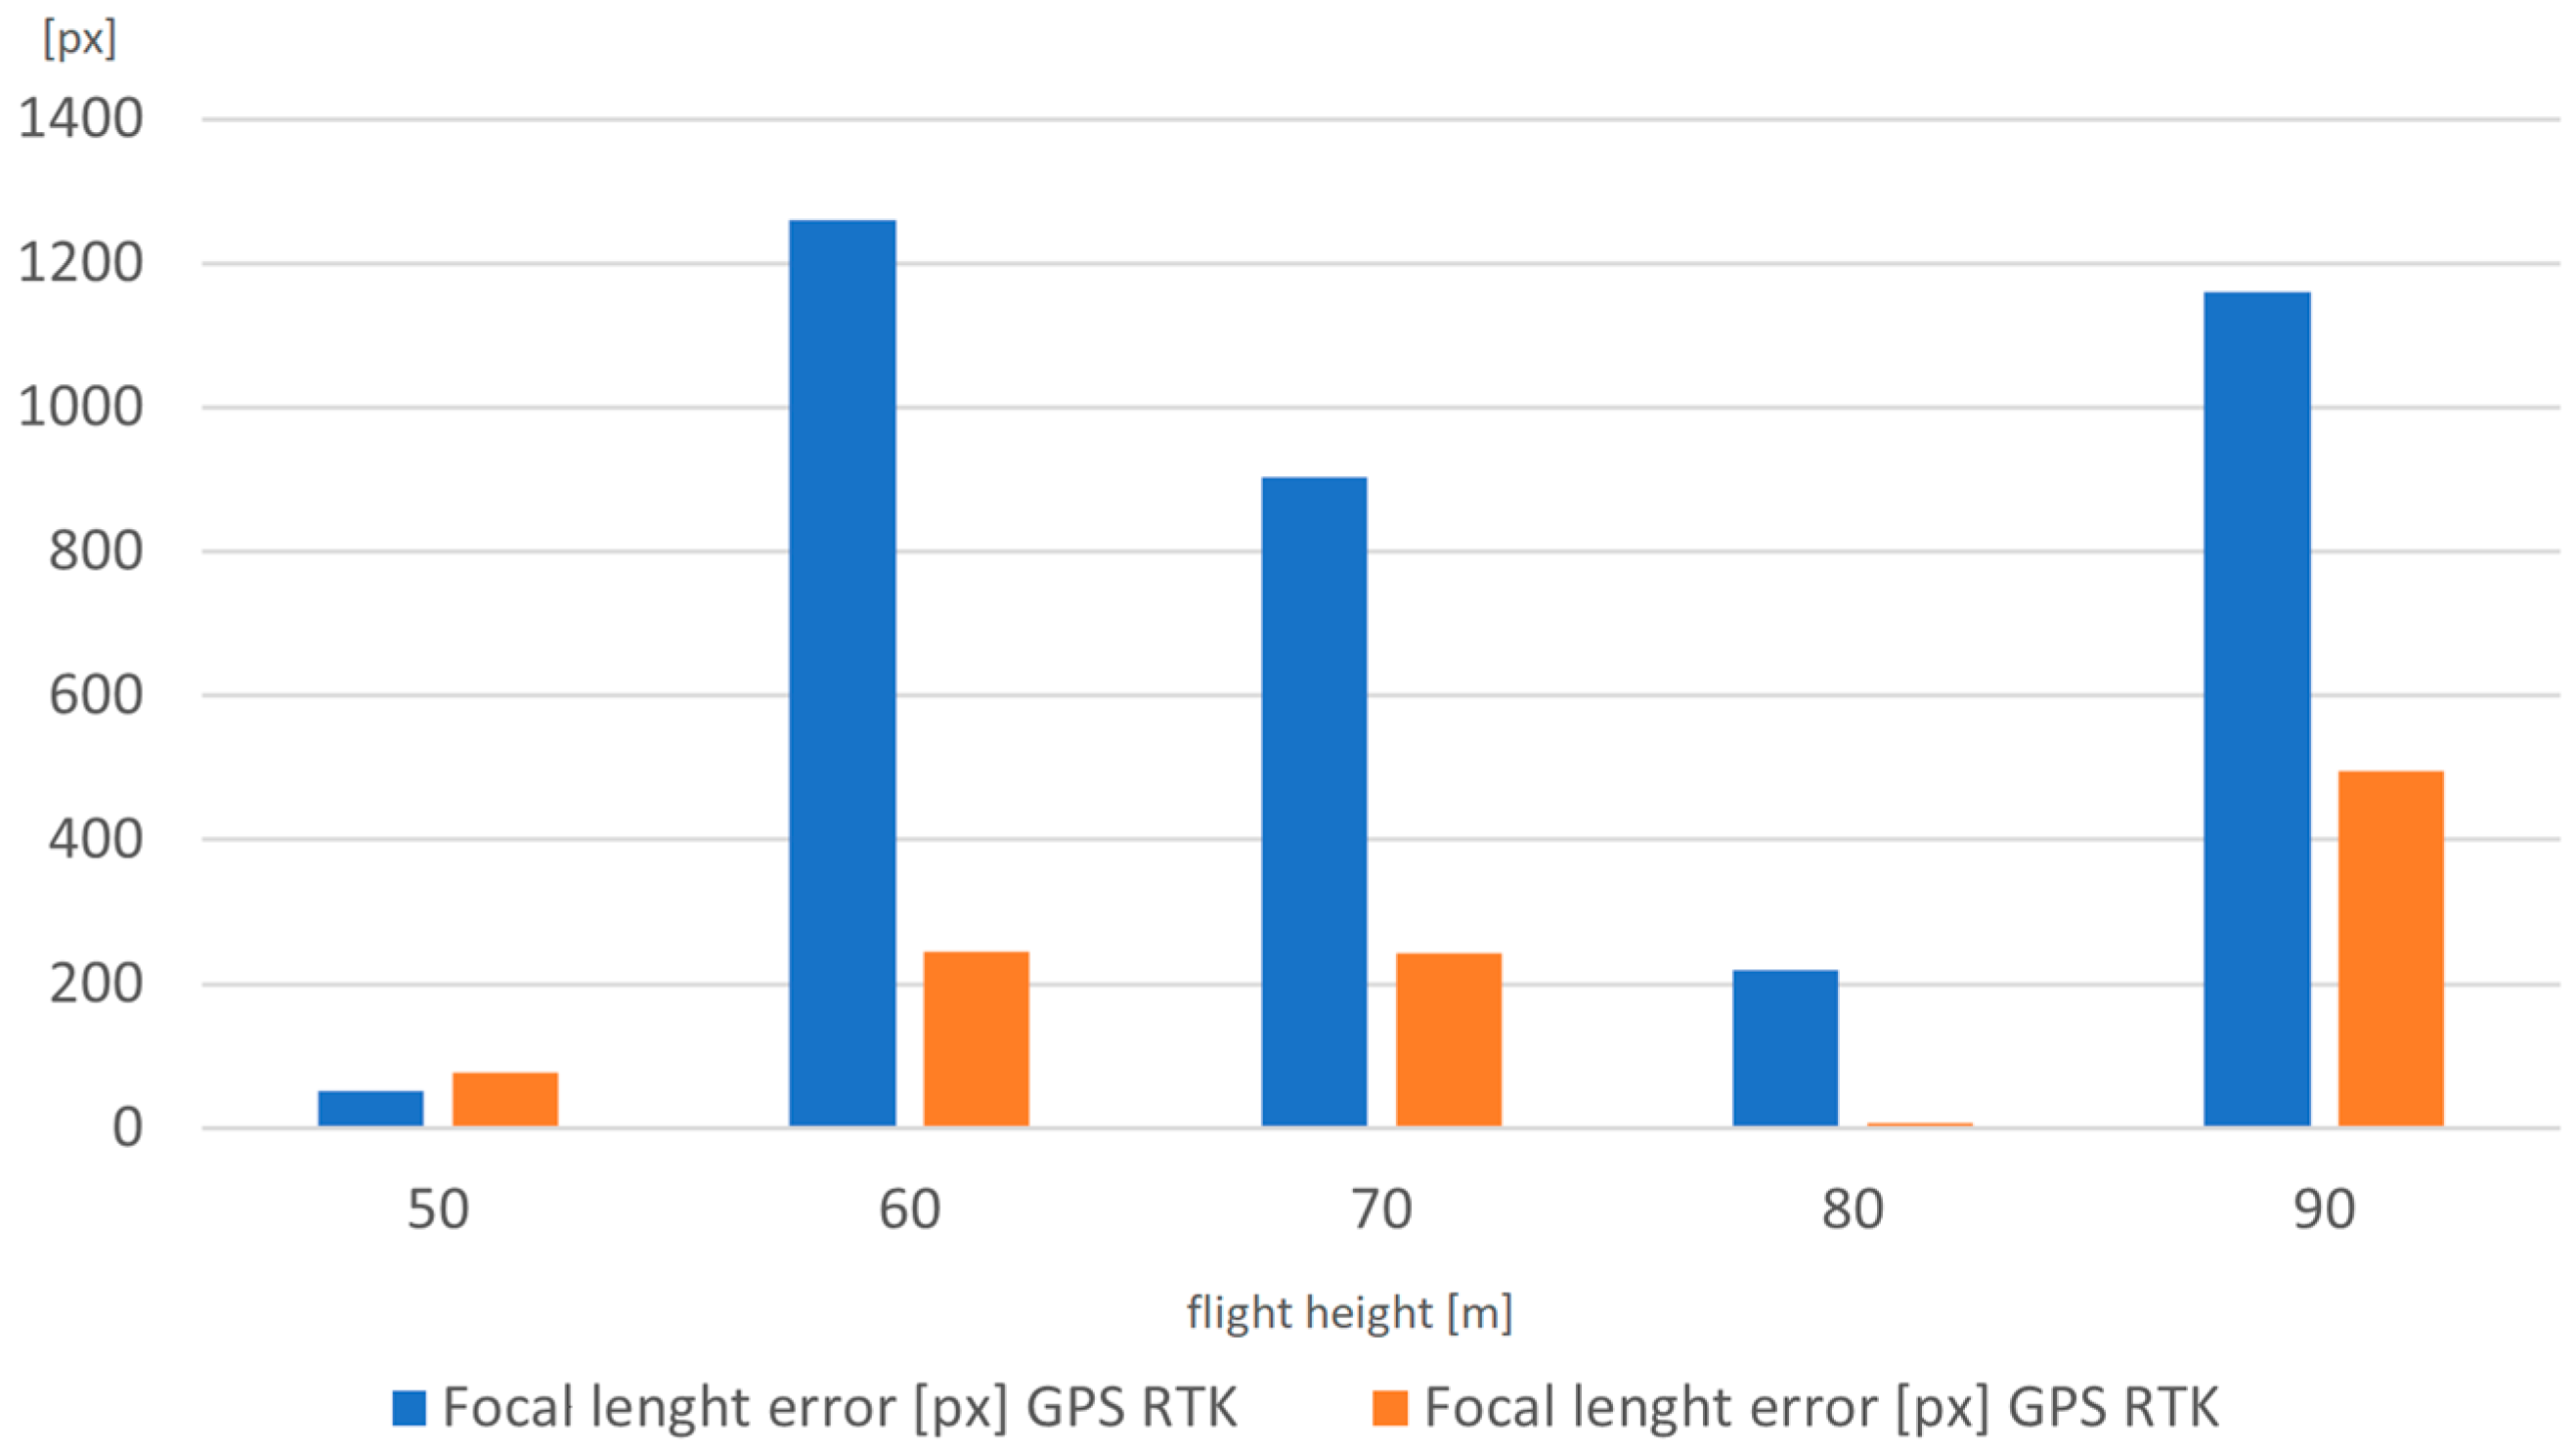
In order to show what the height errors are related to, the difference between the initial focal length and the adjusted focal length, which was determined during the self-calibration process, was assessed. Looking at the height errors (Figure 3), it can be seen that the focal length error (Figure 4) correlates with the height error of the checkpoints: if the height error is growing, the difference between the initial and calculated focal length is also increasing. However, this error is larger in the GPS than in the analogous RTK variant. With even a single GCP, the error becomes negligible. This error is significantly noticeable only for the nadir image variants without GCPs (60 GPS, 70 GPS, 90 GPS, and 90 RTK). In the variants of only oblique images, as well as nadir and oblique images, the difference between the original and calculated focal length is negligible; then, it no longer has a significant impact on the aerial triangulation results.
In the results shown in Figure 3 and Figure 4 and Table 5 and Table 6, the focal length f is determined in the self-calibration process. The results showed that such a procedure in the variant without GCPs can cause instability in the results. This can be due to the fact that if the terrain is almost flat, there are no GCPs, and, as in the variant with GPS, the image coordinates are characterized by low accuracy and the correlation between focal length and flight height is close to unity, so the observation system is numerically unstable. If the terrain were flat, this system would be unsolvable (focal length and Z coordinate would be linearly dependent). Thus, GCPs should be used in such cases.
In Table 5 and Table 6, errors on checkpoints for X, Y, and Z coordinates for variants 1 and 2 are presented. Based on these values, it can be concluded that higher errors occurred for Z coordinates, for both variants and adjusted focal length, than for X and Y coordinates. Smaller Z errors on checkpoints were calculated for P4 RTK and variant 2, in which one GCP was used. For X and Y coordinates, for both variants, the checkpoint errors for P4 RTK were smaller than for P4 Pro. However, for variant 2, in which one GCP was used, for some flight heights, the errors of P4 Pro images were close to P4 RTK, except 60 and 90 m AGL. The results show that for most flight heights, while using P4 RTK, the Z error can be satisfactory while, in the case of P4 Pro, none of the results were accurate enough. The positive influence of the RTK observations is evident here.
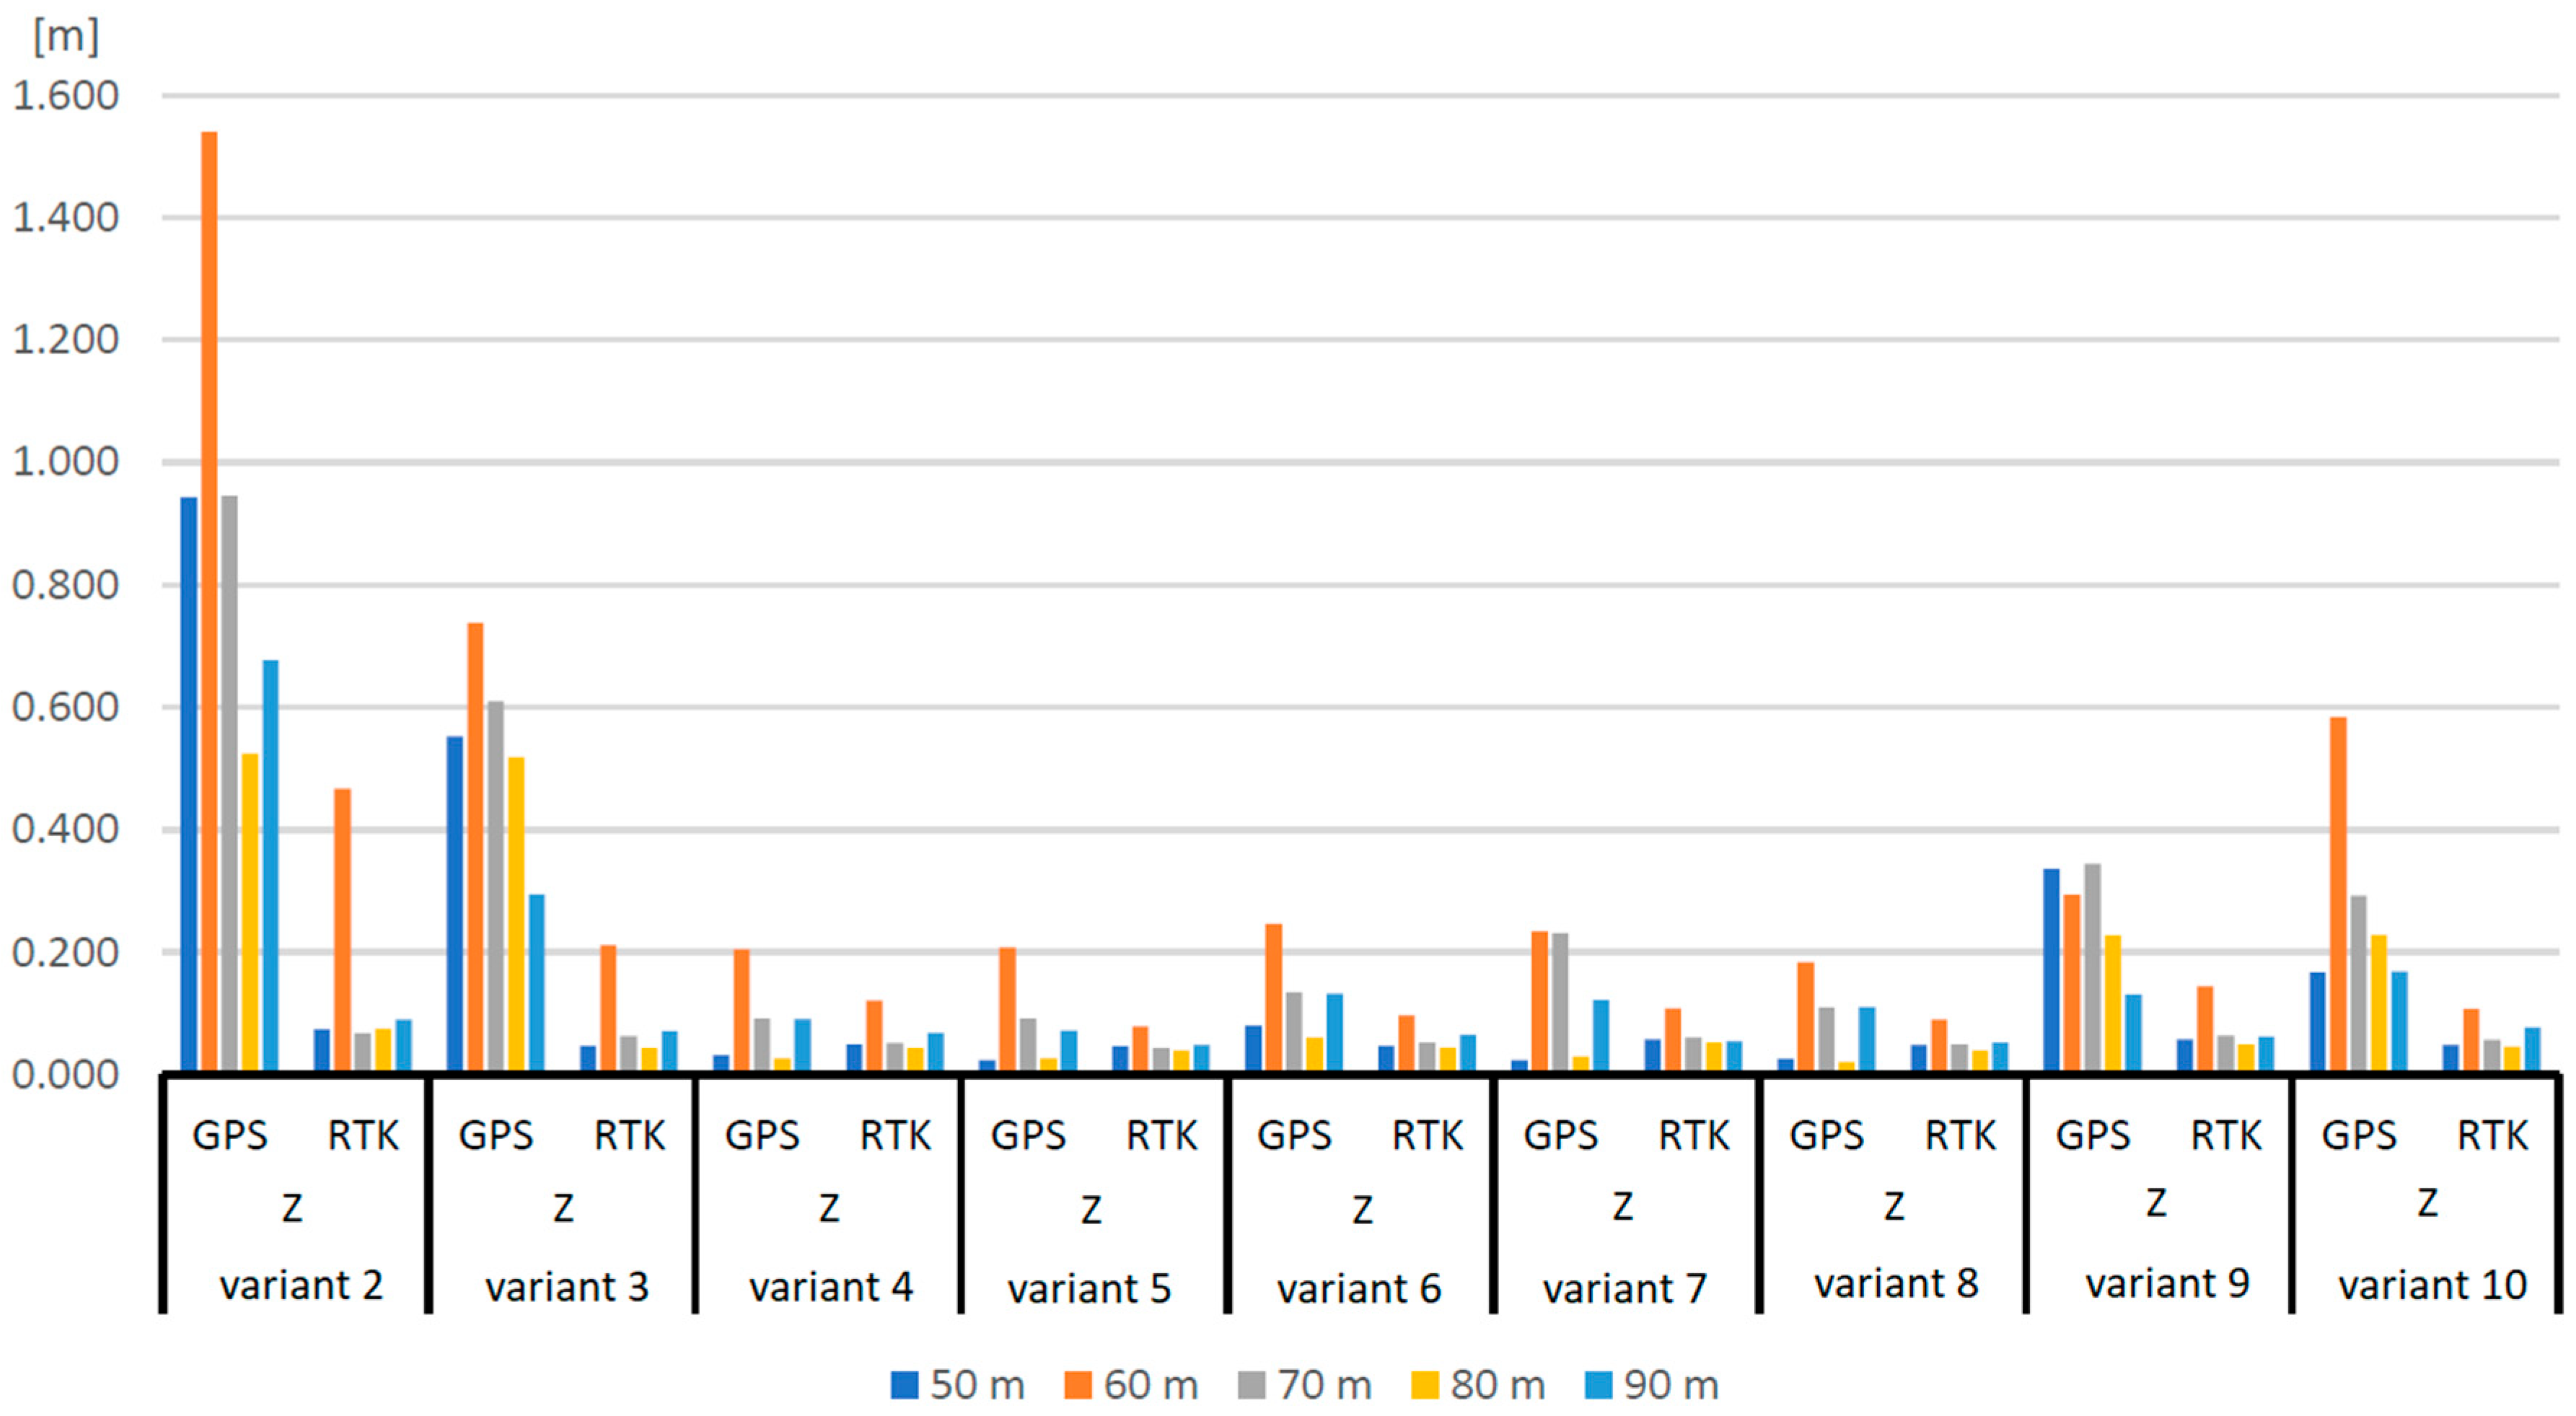
Figure 5 shows that for almost all flight heights in all variants, the RTK technology consistently provides lower altitude errors compared to GPS. The lowest errors for both technologies (GPS and RTK) are achieved at 50 m AGL, which may reflect the higher accuracy of measurements taken at lower altitudes. For the flight at an altitude of 60 m, significantly higher errors occurred on the GPS technology compared to the other altitudes. This is particularly evident in variants 2 (one GCP in the middle of the block) and 10 (six GCPs only on the left side of the block). Also, for RTK flights, slightly higher errors occurred for 60 m flight (variants 2 and 3). Variant 5 (12 GCPs) for RTK flight made the accuracy for 60 m flight comparable to other flight altitudes. For all variants presented in Figure 5 (variants 2–10), except flights at 60 m AGL, the Z error on checkpoints for P4 RTK image blocks was smaller than 10 cm. For P4 Pro, the errors depend on the variant, i.e., GCP distribution. The smallest errors are for variants 4 and 5.
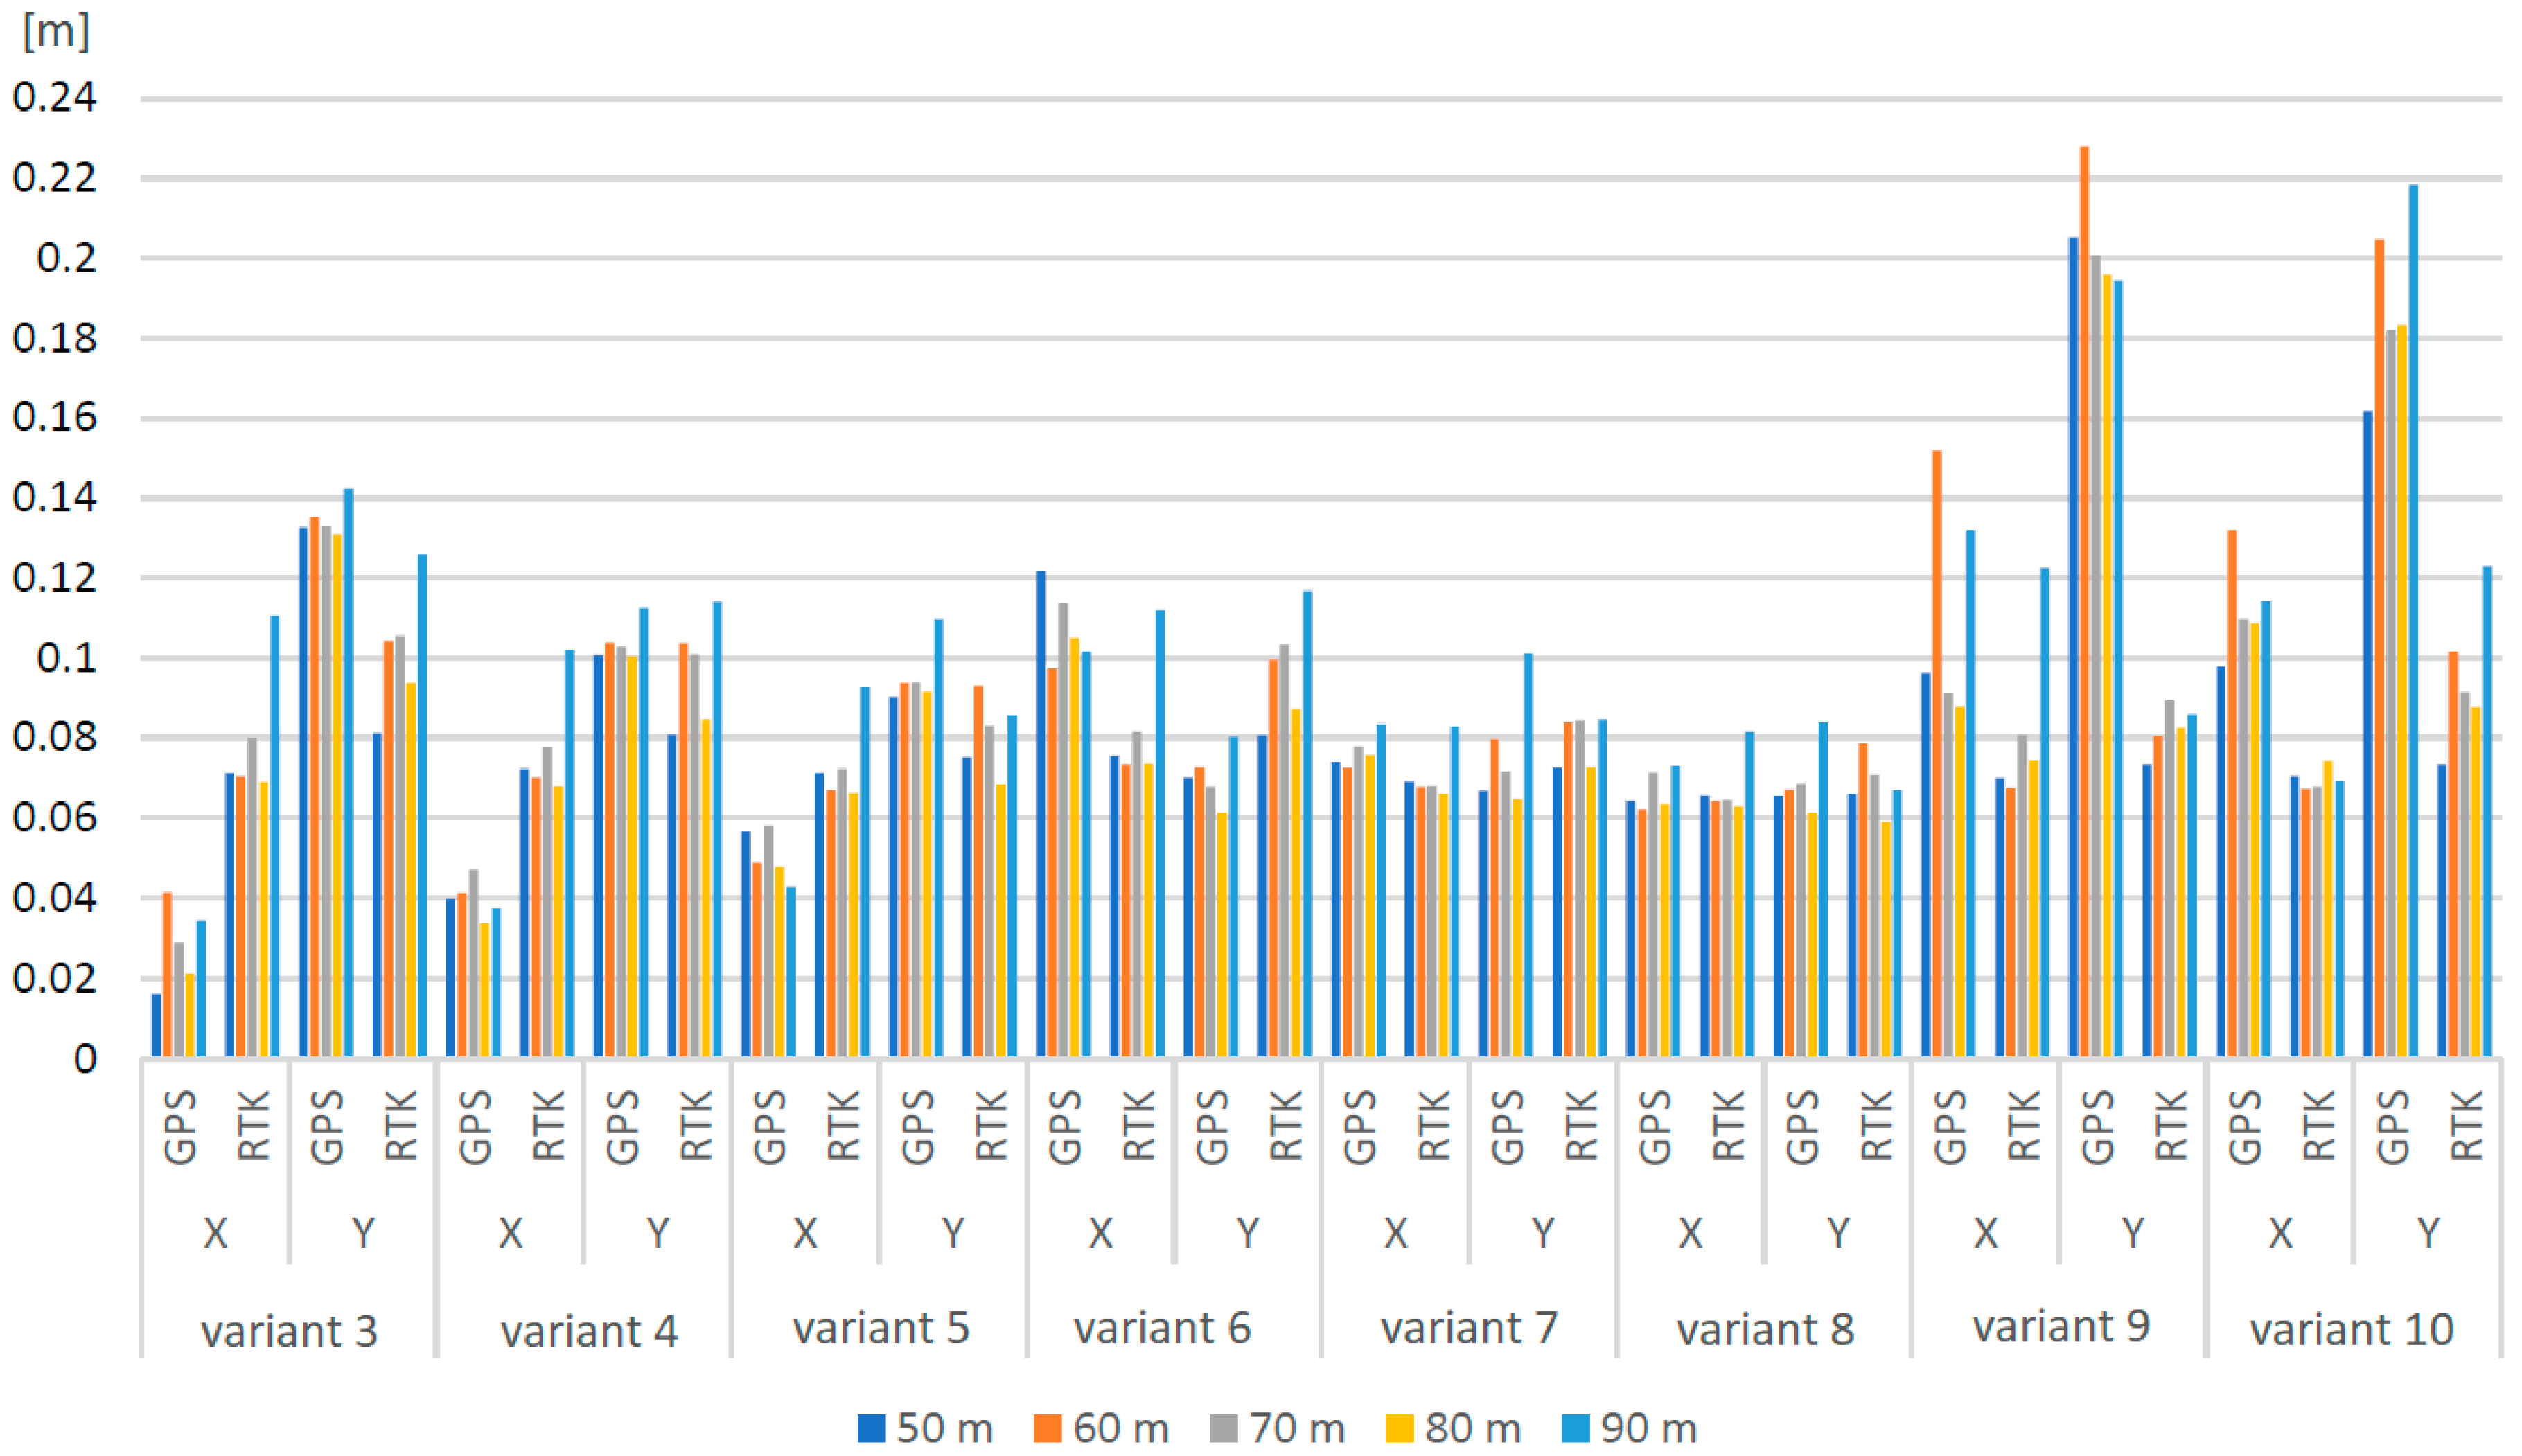
Figure 6 presents the X and Y errors on checkpoints for variants 3–10. For variants 3–5, the X errors are bigger for RTK flights than for GPS; for the rest of the variants, the errors are comparable. For the Y coordinates, the trend is not visible, and for variants 3–8, the Y errors for RTK and GPS are similar. For variants 9–10, where Y errors are higher for P4 Pro, this may be a result of the GCPs’ distribution (GCPs on the left/right part of the block) and error propagation. Additionally, for the presented variants, a tendency towards higher errors at higher flight altitudes is noticeable (for 90 m flights). Variants 7 and 8 show the closest errors and closest results, independent of the flight height, coordinate, and GPS/RTK technology, which proves that GCPs on the block edges are very important in image adjustment process.
In summary, the errors obtained from P4 RTK decrease significantly after using one GCP which, in the case of P4 Pro, is not achievable: for P4 Pro, at least six evenly distributed GCPs are required. A non-uniform distribution of GCPs increases the error for P4 Pro more than in the case of P4 RTK. The results can also be proved by statistics presented in Appendix A Table A1, where mean error, standard deviation, and RMS are included. In Variant 4, the errors were smallest across all flight heights, while in Variant 2 they were smallest for most RTK flights and also for the nadir–oblique image combination.

3.2. Role of Oblique Images in Aerial Triangulation Results

In the next step, aerial triangulation using nadir images was compared to nadir and oblique images. As a first step, variant 1 was analyzed, which was problematic in the case of only the nadir image approach (Table 7). Z errors achieved on checkpoints in variant 1 show that for P4 Pro, Z errors are significantly higher for nadir images at 60 m (60n) compared to a combination of nadir and oblique images at the same height (60no). A similar trend is observed at an altitude of 80 m (80n and 80no), where the errors for nadir and oblique images together are smaller. For P4 RTK, altitude errors are much smaller compared to the GPS. The use of nadir and oblique imagery improves the camera calibration during the self-calibration process, and thus significantly reduces Z errors for checkpoints.
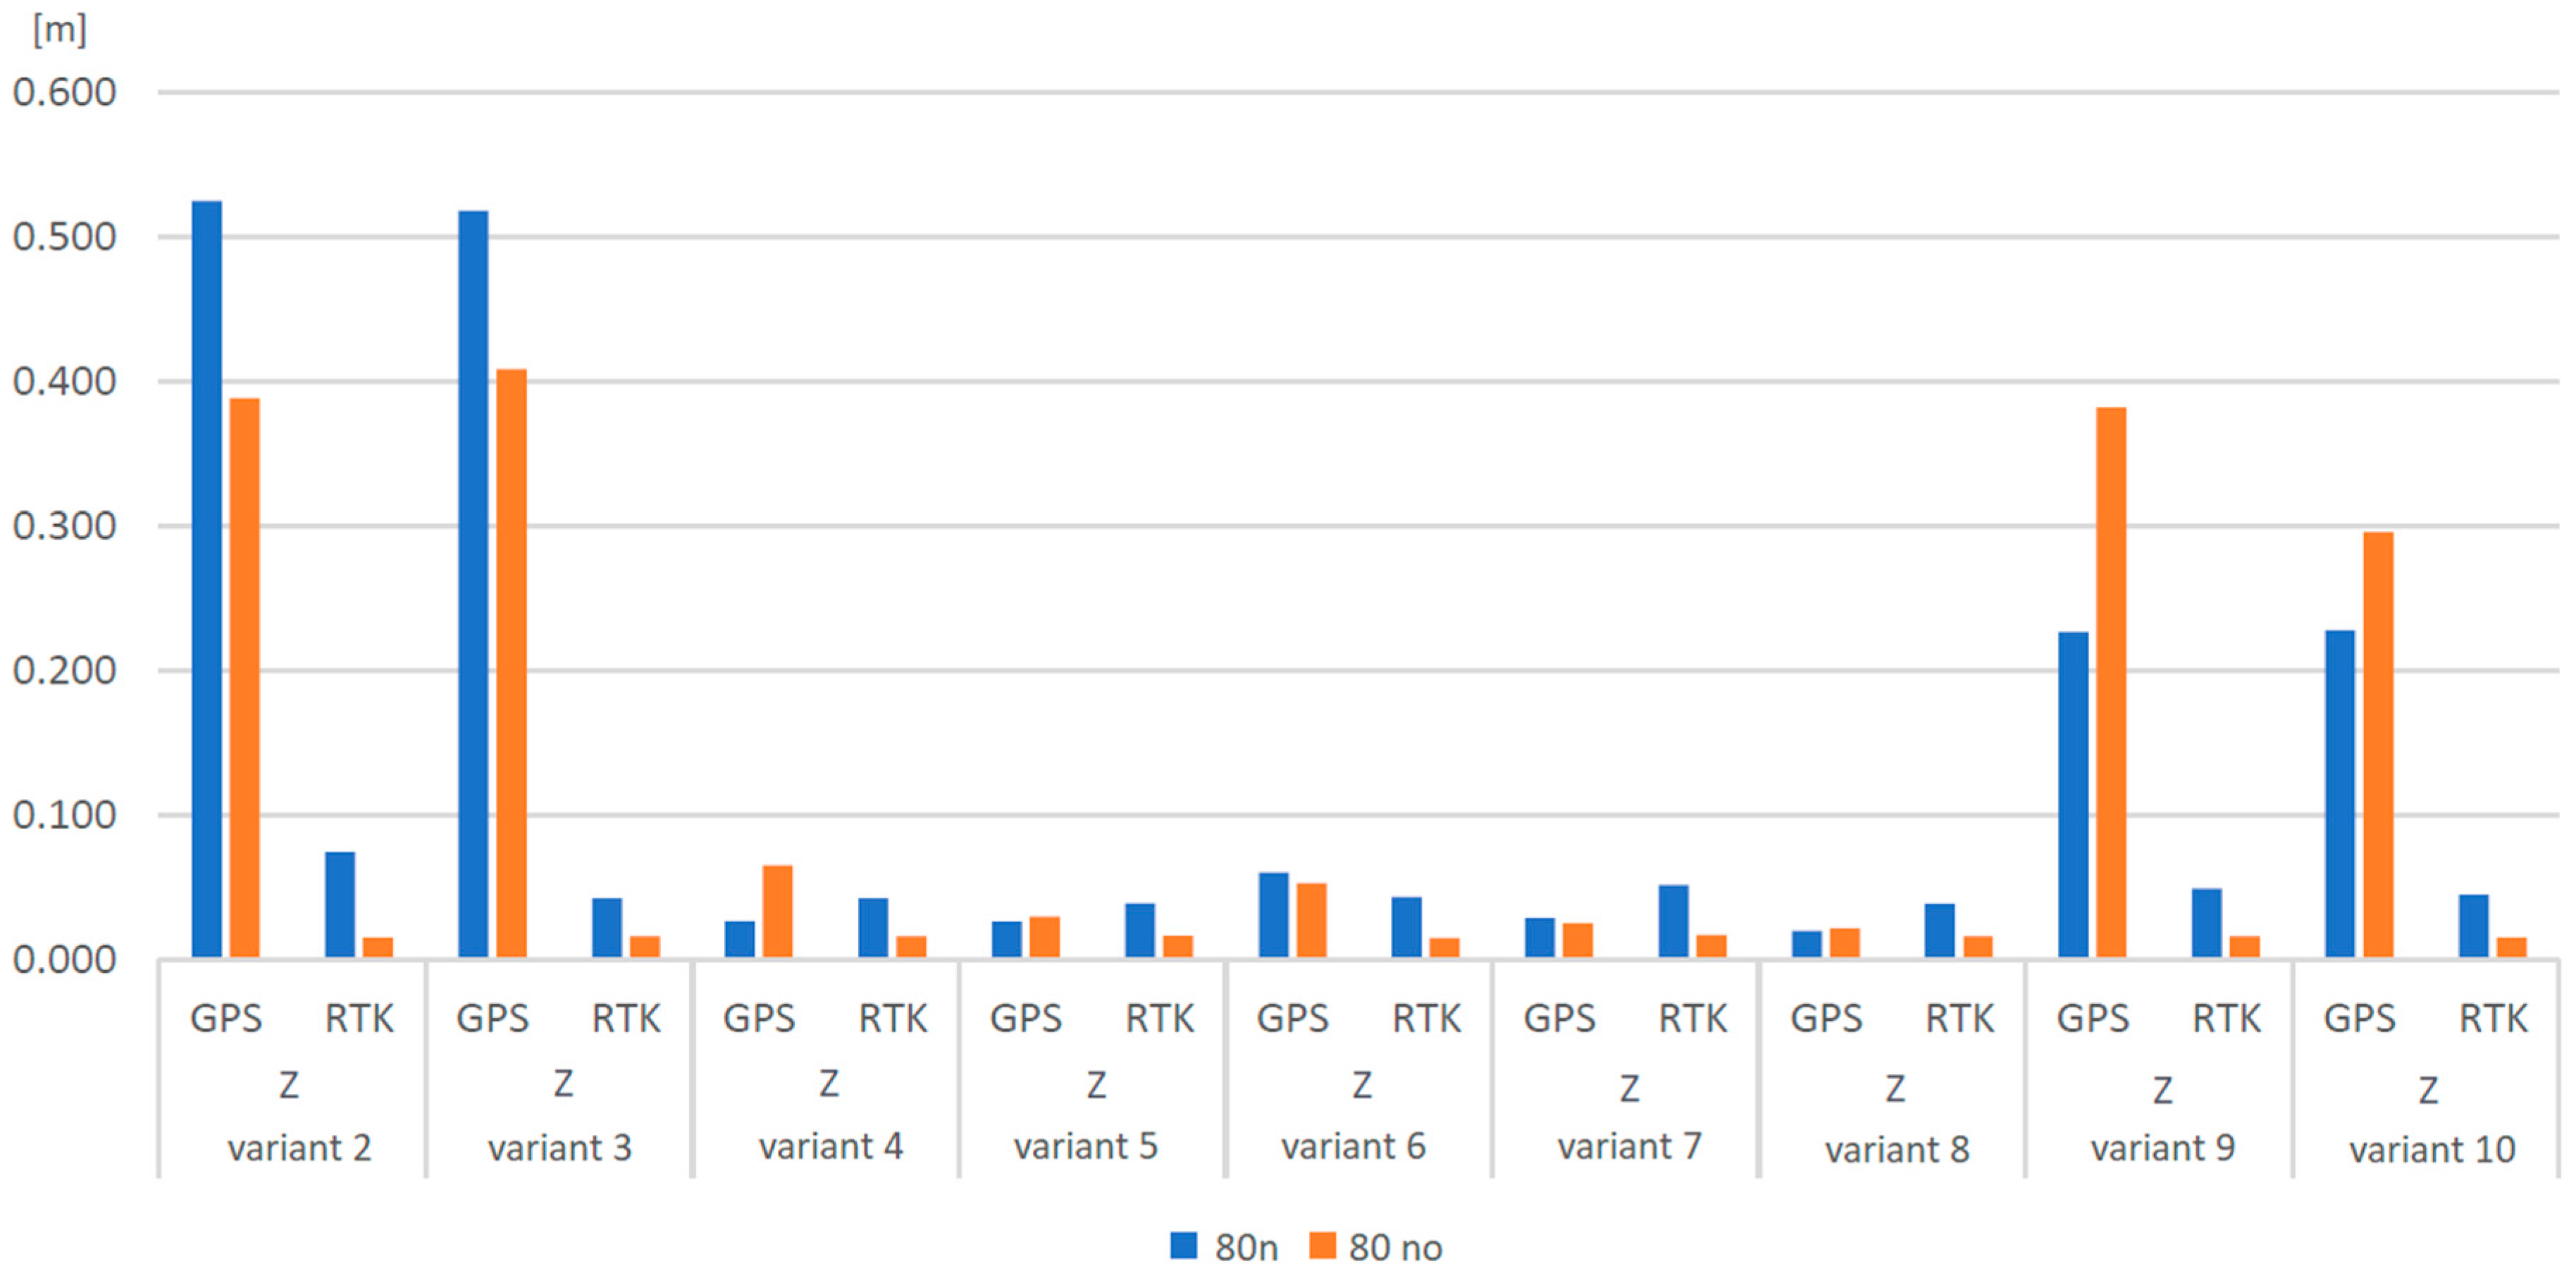
Figure 7 and Figure 8 proves that, in most variants, elevation errors are smaller for Phantom with RTK technology than with GPS. A trend can be observed that for nadir and oblique imagery, elevation errors are lower than for analogous ones with nadir imagery alone. Variants 2 and 3 for both flying altitudes show the highest errors for GPS for both only nadir and the nadir and oblique image combination, which is higher than 30 cm. Increasing the GCPs to 6 significantly reduces the error to lower than 10 cm for nadir and oblique blocks. This may indicate that a small number of GCPs does not provide sufficient accuracy in case of P4 Pro data, even after adding oblique images. For variants 4–8 for GPS flights, the accuracy improvement is noticeable. For variant 9 for the 60 m flight and variants 9 and 10 for the 80 m flight, oblique images decrease the accuracy, which proves that the distribution of non-unique GCPs should not be used. The Z error for RTK flights including nadir and oblique imagery is lower than 5 cm for all variants.
In case of RTK flights, oblique images noticeably increase the Z accuracy. For each variant, the accuracy increases after including oblique images, especially in variant 2. The results for all variants for both flight heights and accuracy for the Z coordinate is acceptable, even without GCPs in the adjustment process. Additionally, the asymmetrical distribution of GCPs does not affect the elevation accuracy for RTK flights.
In Table 8, the X and Y errors on checkpoints for variants 1 and 2 are reported. Nadir and oblique images acquired with RTK accuracy have significantly smaller errors and show bigger stability than GPS approaches. For variant 1, RTK technology generally shows smaller errors than GPS, both in the X and Y axis. This is particularly evident at a 60 m flight height, where RTK errors are significantly lower. The X and Y errors for blocks including both nadir and oblique images from P4 RTK are approximately 2 cm, while for P4 Pro images they range from 8 cm up to 1 m. Errors for P4 RTK for nadir and oblique images are five times smaller than for nadir images only. Further on, a noticeably higher error is seen for the nadir images at 60 m altitude for variant 2 for P4 Pro data. However, the addition of oblique images already decreases this error.
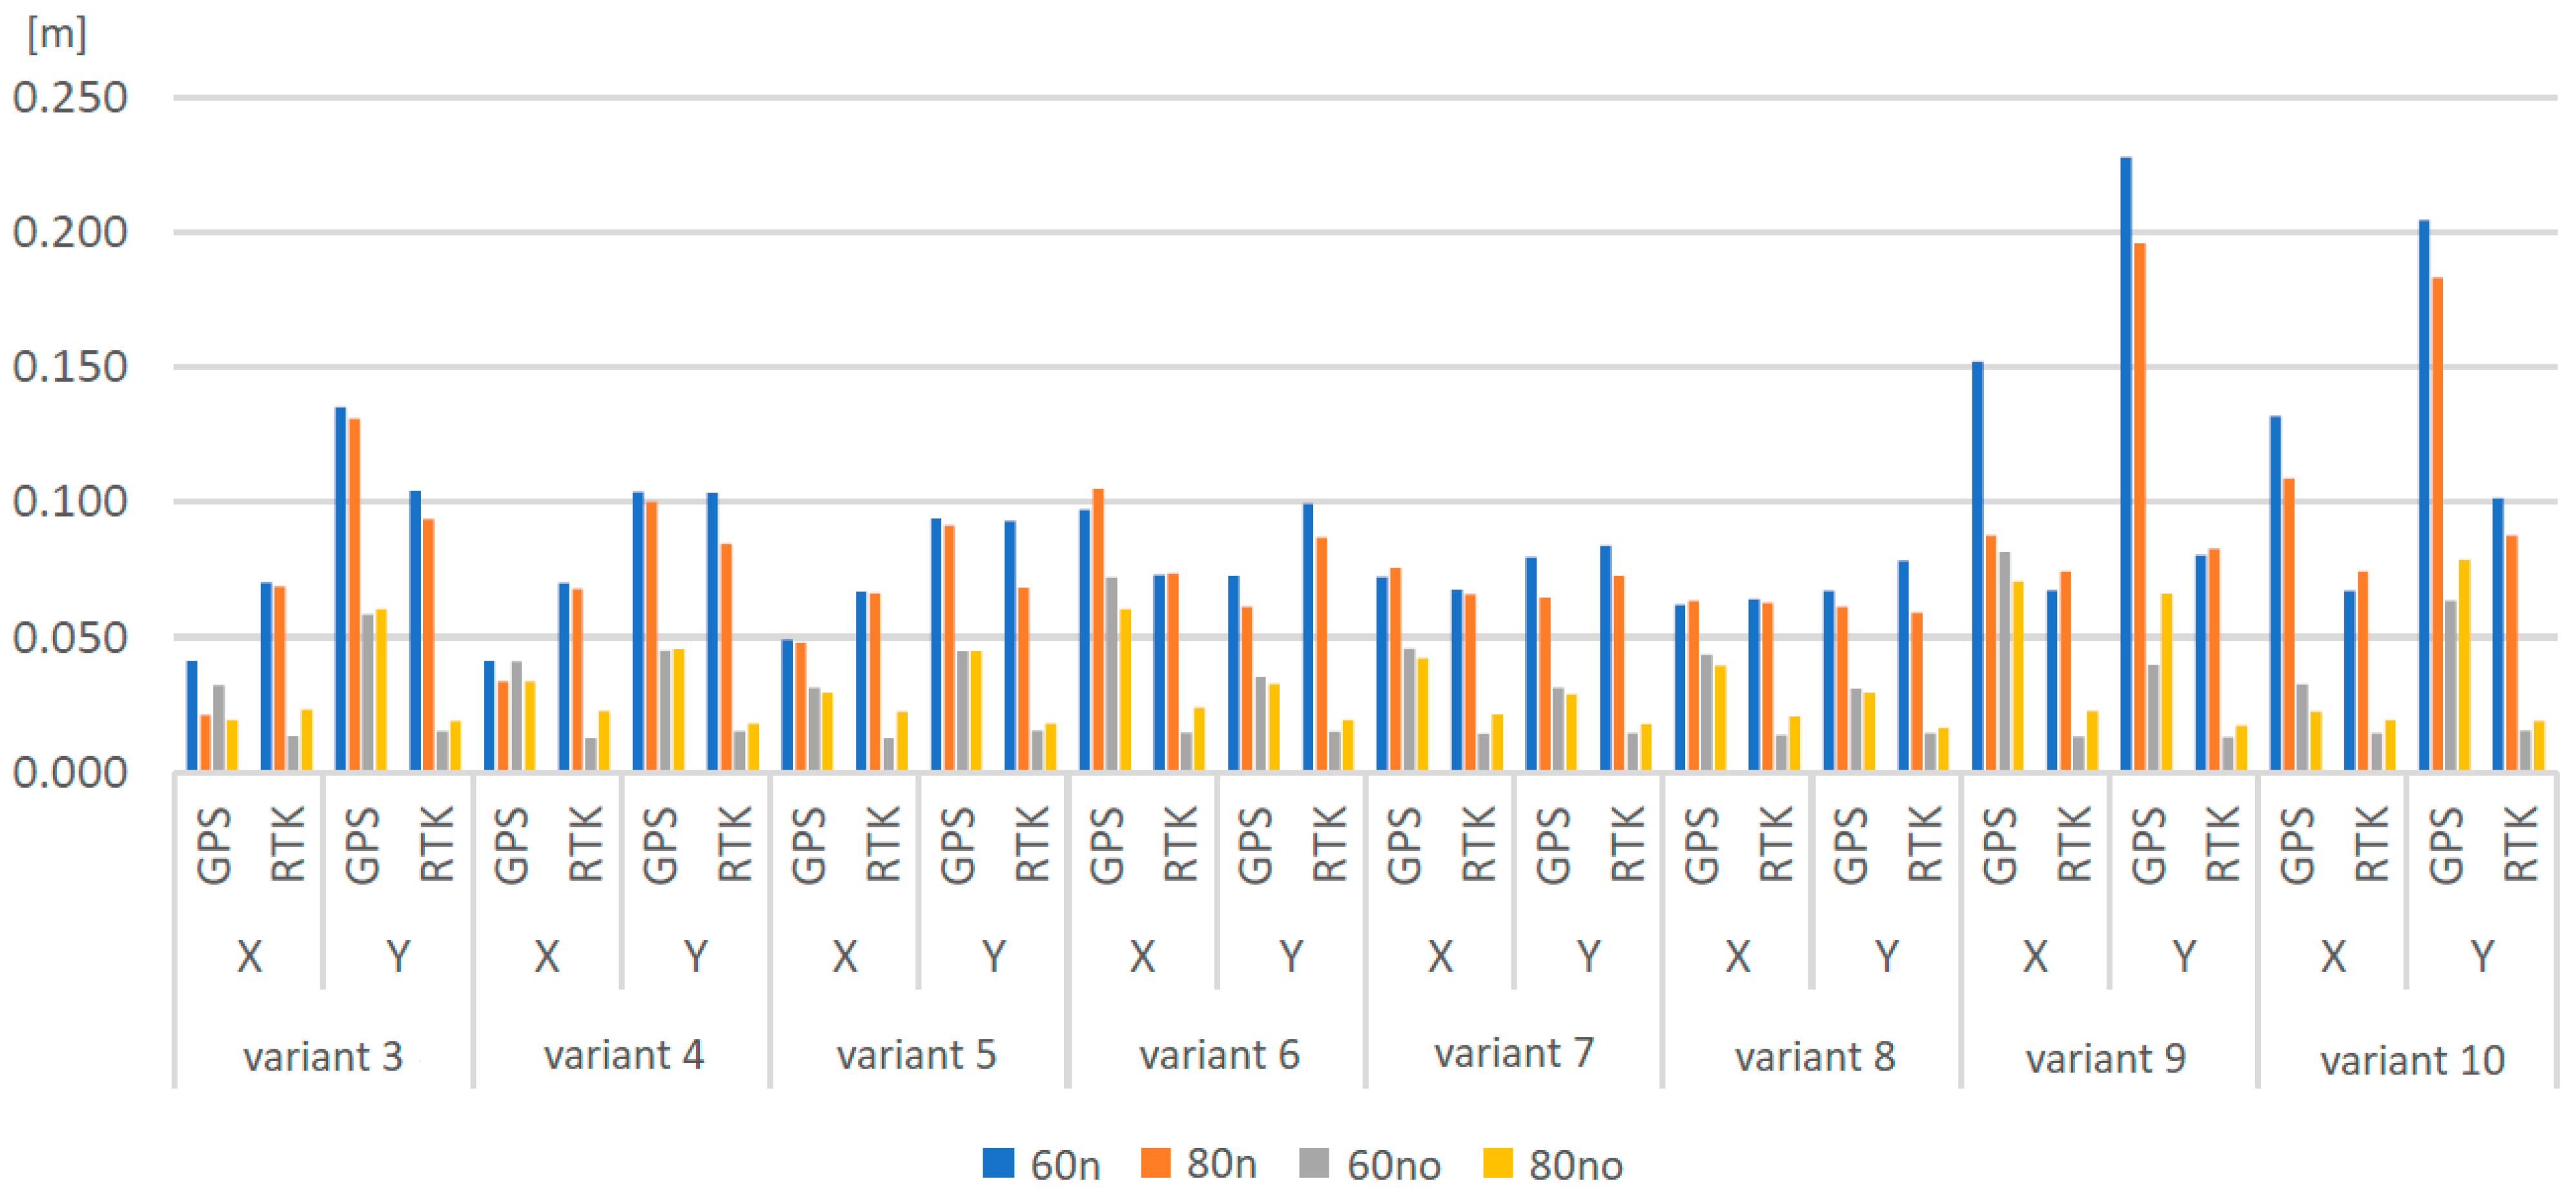
According to Figure 9, horizontal errors for RTK technology are generally smaller than those for GPS in all variants and for both coordinates, confirming the higher accuracy of RTK regardless of the flight and GCP variant. Additionally, higher accuracy was achieved for the nadir and oblique image combinations for both GPS and RTK flights. Errors in the X and Y axes show differences depending on the variant, but there is no clear tendency indicating that one coordinate is consistently more erroneous. The lowest accuracy can be observed in variants 9 and 10, which again may suggest that the asymmetric distribution of GCPs negatively affects the aerial triangulation accuracy. However, this influence is more noticeable for the GPS variant than for the RTK variant. Variants 3, 4, and 5, which include 3, 6, and 12 evenly located GCPs, show relatively small horizontal errors. In addition, variants 6, 7, and 8 also present similar results to variants 3, 4, and 5. Small errors at the checkpoints indicate that the placement of GCPs in the corners or at the edge of the block is crucial. For most variants from 3 to 8, the X and Y errors for oblique and nadir images for both P4 RTK and P4 Pro were smaller than 5 cm.
The results are reinforced by the statistics presented in Appendix A Table A2, including the mean error, standard deviation, and RMS. For variants 1 and 2, the errors are significantly higher, especially in the case of GPS images. For variants 3 and others, the errors for the X and Y coordinates for all analyzed flight heights are comparable.

3.3. Orthomosaic Quality Check Based on the Check Distances

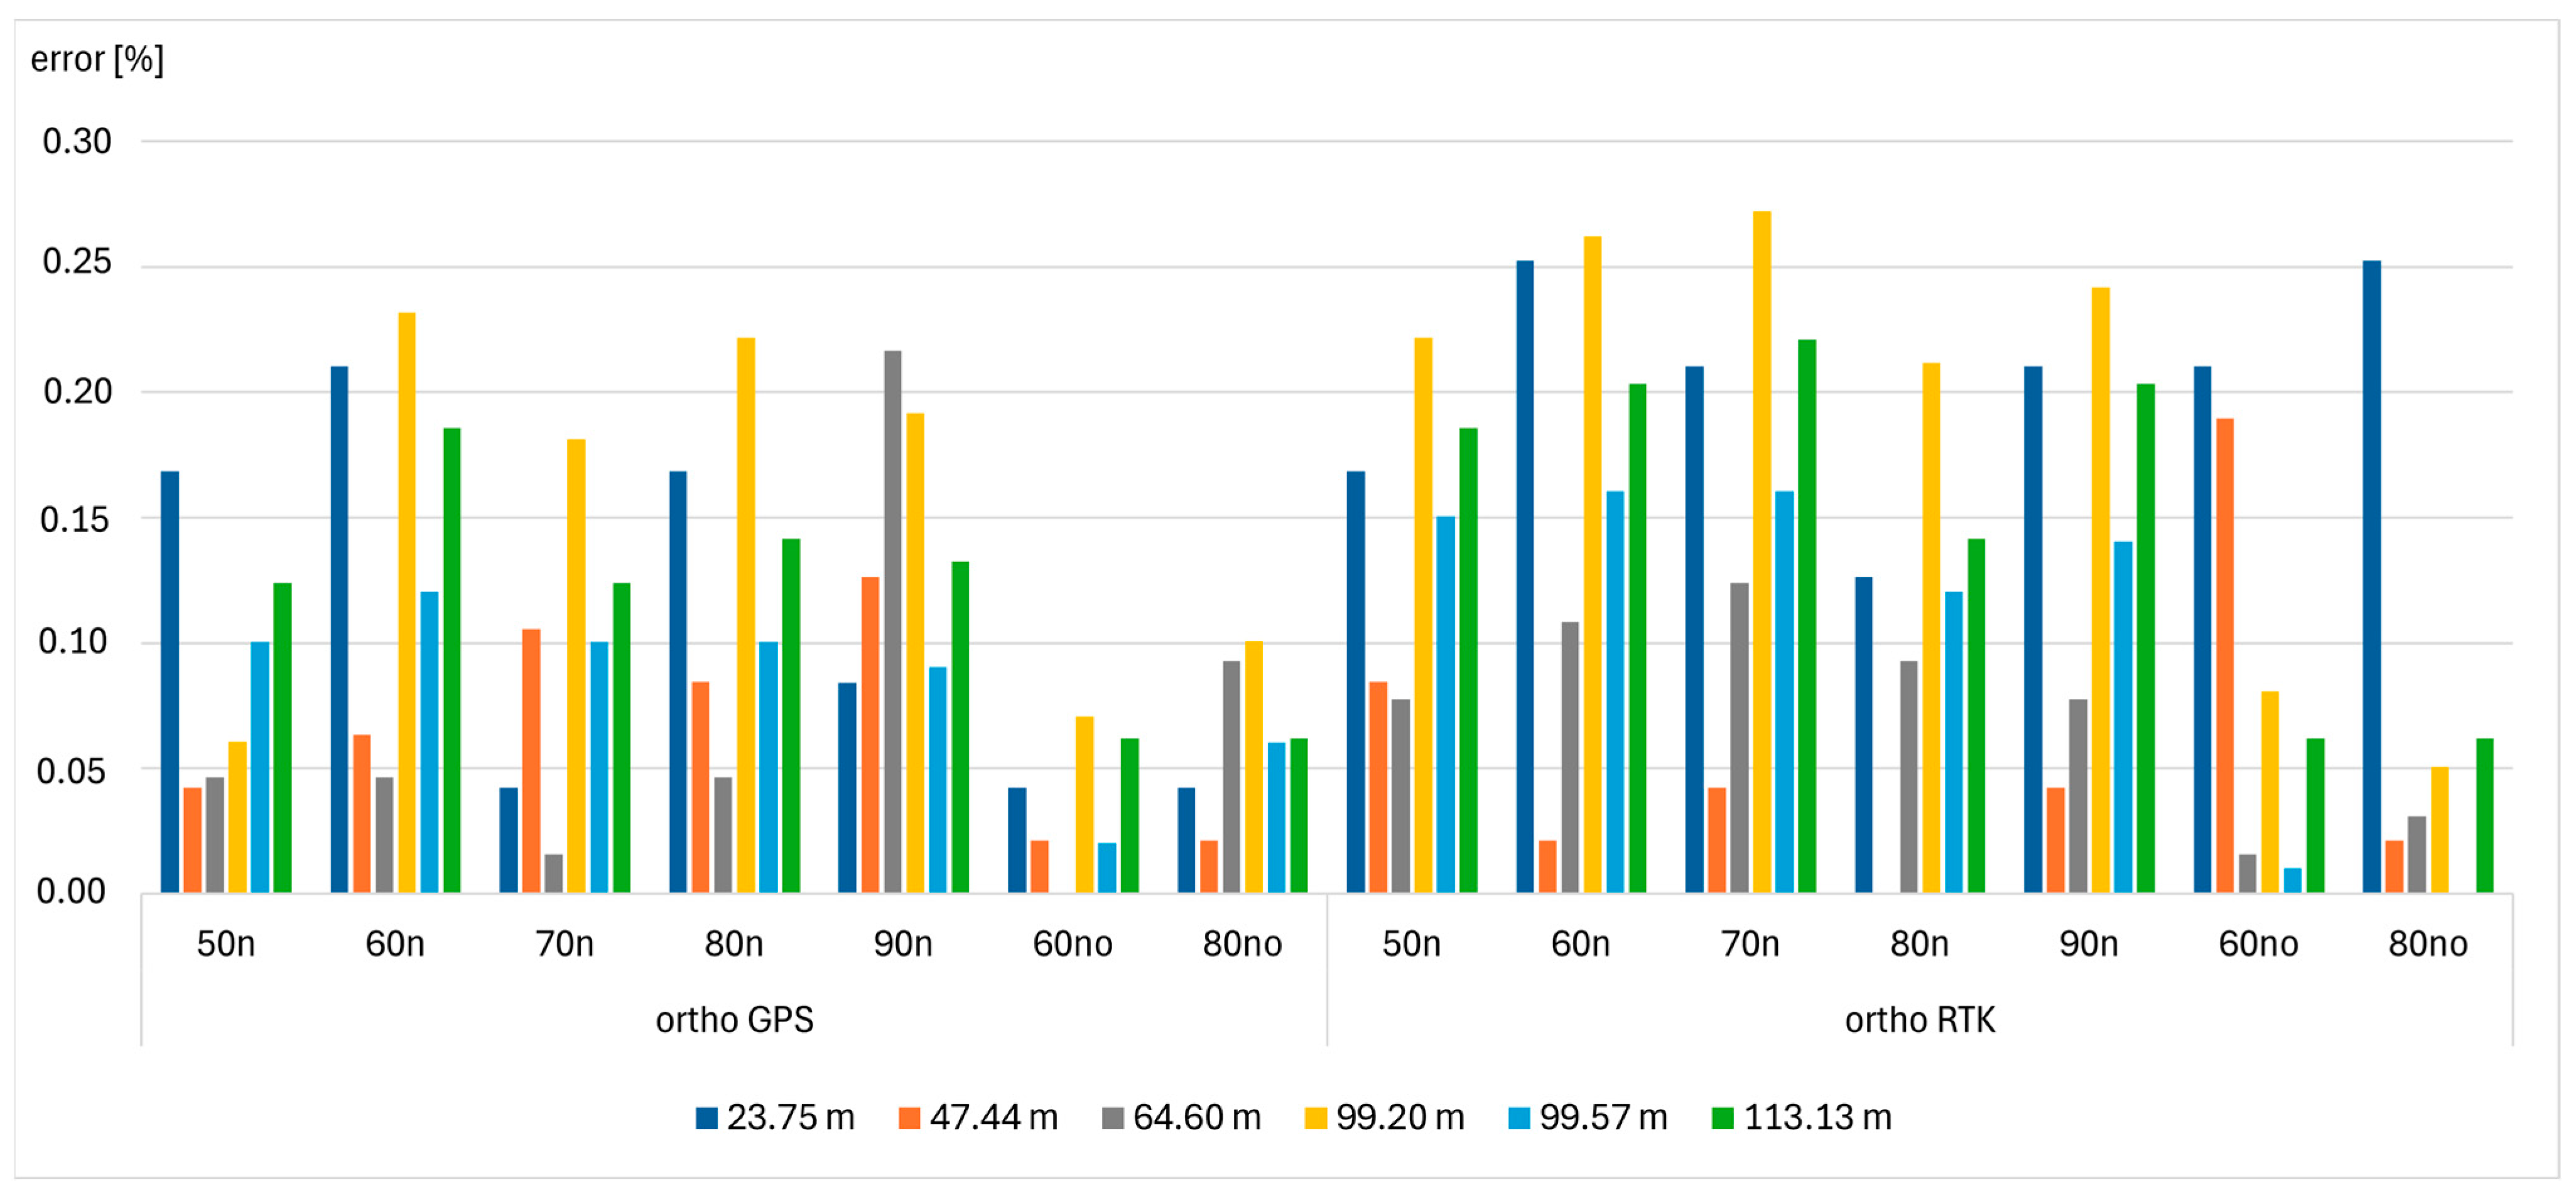
The last part of the experiment involved a comparison of the lengths of the check distances. The distances were measured on the orthomosaics generated for all nadir blocks from both UAVs and all flight heights, and also combined nadir and oblique image blocks. The distances were measured between the GCPs marked in the terrain, and were thus easily identifiable. The differences between the terrain and orthomosaic measurements are presented as percentages, as a relative difference to the length of the distance (Figure 10).
By analyzing Figure 10, it can be noticed that the errors are relatively low and do not exceed 0.30% of the measured distance, and for most cases, even 0.20%. There are two check distances for which the errors stand out from the rest—23.75 m (the shortest one) and 99.20 m (one of the longest). For the shortest measured distance, it can be quite obvious because there can be some systematic errors that influence the distance regardless of its length. What would be expected is that with growing length of the check distance, the error should decrease while, in Figure 10—especially for a distance equal to 99.20 m—the error is growing. The selection of GCPs could be the reason for this error. This check distance had its beginning in GCP number 30 which, according to the aerial triangulation report, is characterized by high error compared to other GCPs. Thus, this could influence the error in the check distance.
In general, errors on the check distances are slightly higher for P4 RTK image blocks (ortho RTK), which can mean that while having enough GCPs, good orthomosaic quality can be achieved. Another observation is that the errors on check distances are smaller for blocks that included nadir and oblique images, especially on orthomosaics generated from P4 Pro (ortho GPS).

4. Discussion

Similar experiments have been conducted previously in the literature, where the authors tried to indicate how many GCPs are necessary and/or how their distribution affects the aerial triangulation accuracy [14,26,27]. In the available research, similar conclusions were drawn as in this article; for example, relating to the number of GCPs. In the presented study, one GCP in the case of P4 RTK was necessary, while six evenly distributed GCPs were needed for P4 Pro. Similar results according to the distribution of GCPs have been presented in [14]. Regarding the number of GCPs, in [18], seven GCPs were recommended; in [6], nine GCPs were evaluated and gave satisfactory results; and in [29], four GCPs stabilized the Z error based on checkpoint error at a centimeter level (less than 5 cm). According to [10], six GCPs and more gave comparable results; however, four GCPs also gave centimeter errors, but higher than 5 cm (approximately 6–8 cm depending on the block). In [26], the errors stabilized after using seven GCPs; in [18], errors stabilized after using between five and seven GCPs, depending on the dataset and analyzed area. It can be concluded that the results presented in this article are consistent with those reported in other studies. The abovementioned experiments were conducted for different study areas: in [14,24], the test areas were quarries; in [6], an open area near a forest was used; and in [18], a cadastral application is presented. Thus, regardless of the potential application, the topic is still important, and a similar number of GCPs is necessary to obtain sufficient results. In the research presented in the literature, similar algorithms and software based on similar algorithms are used in UAV image aerial triangulation and product generation, which makes the results comparable.
The influence of oblique imagery was also examined. In [23], including oblique images in aerial triangulation improved the Z error on checkpoints in direct georeferencing from almost 23 cm to 5.5 cm. In this article, the improvement was even more noticeable: for 60 m, AGL ranged from almost 5 m up to 2.2 cm; and for 80 m, AGL spanned from 1 m up to 1.6 cm. For images without RTK observations, in [23], after using four GCPs and combined oblique and nadir images, the accuracy at checkpoints was at the 1 cm level, while in the presented study, six GCPs were used to obtain centimeter accuracy; however, nine GCPs provided even lower errors, comparable to RTK imagery. In [24], similar conclusions were drawn; i.e., accuracy increased after including oblique images in block adjustment. In [23], the flight height was 35 m AGL, while in [24], different flight heights were examined, but the lowest one was 50 m AGL, which can explain the smaller errors obtained in [23]. Moreover, in most of the presented experiments, regarding the nadir and oblique imagery, both types of images were acquired from the same height; only in [24] did one combination of nadir and oblique images include a combination of different flight heights.
Regarding the check distances measured, in [17], a similar experiment was shown, and the differences between the field measurements were below 0.30% of the distance length, which is comparable to the results presented in this article where, regarding the flight configuration and flight height, the errors were below 0.30%.

5. Conclusions

In this article, aerial triangulation of nadir and oblique images from a DJI Phantom 4 RTK (P4 RTK) and a DJI Phantom 4 Pro 2.0 (P4 Pro) using different GCP distributions was assessed. The experiment aimed to analyze the distribution and number of GCPs, as well as the flight height and the type of images that should be acquired. Based on the experiment, a UAV test field was prepared. Aerial triangulation was analyzed using 38 GCPs. Depending on the variant, a different number of control and checkpoints was used in the image adjustment process. The results underscore the positive influence of RTK observations on the image orientation. For P4 RTK nadir images, one GCP was sufficient to stabilize the Z error, which was below 10 cm for most flight heights; meanwhile, for P4 Pro images, six evenly distributed GCPs were necessary to achieve similar accuracy. The aerial triangulation accuracy of images from P4 Pro was also more dependent on the distribution of GCPs.
In a further part of the experiment, in which oblique images for two flight altitudes were included, the errors of checkpoints showed a high influence of combined aerial triangulation on the accuracy. Oblique images are characterized by a non-uniform scale. Joining nadir and oblique images can reduce or eliminate systematic dome errors while UAV data processing, and break the correlation between focal length and altitude, thereby stabilizing the self-calibration process. For RTK images, the error was approximately 2 cm, even without using the GCPs in the adjustment process. In the case of the GPS image block, the oblique imagery also played an important role; however, at least three evenly distributed GCPs were necessary while, for RTK images, aerial triangulation without control points resulted in 2 cm accuracy for X, Y, and Z coordinates.

Author Contributions

Conceptualization, M.P.-M.; methodology, M.P.-M. and D.Ł.; software, D.Ł.; validation, M.P.-M.; formal analysis, M.P.-M.; investigation, M.P.-M.; resources, M.P.-M. and D.Ł.; data curation, D.Ł.; writing—original draft preparation, M.P.-M. and D.Ł.; writing—review and editing, M.P.-M. and D.Ł.; visualization, M.P.-M. and D.Ł.; supervision, M.P.-M. All authors have read and agreed to the published version of the manuscript.

Funding

This paper was co-financed under the research grant of the Warsaw University of Technology supporting the scientific activity in the discipline of Civil Engineering, Geodesy and Transport.

Institutional Review Board Statement

Not applicable.

Informed Consent Statement

Not applicable.

Data Availability Statement

The raw data supporting the conclusions of this article will be made available by the authors on request.

Conflicts of Interest

The authors declare no conflicts of interest.

Appendix A

Table A1. Mean, standard deviation (STD), RMS errors [m], and Moran’s statistic calculated for the Z coordinate (green color—values between −0.1 m and 0.1 m, orange: between −0.1 and −0.5 m, and between 0.1 and 0.5 m, pink: below −0.5 m and above 0.5 m).
50 GPS50 RTK60 GPS60 RTK70 GPS70 RTK80 GPS80 RTK90 GPS90 RTK60 GPS no60 RTK no80 GPS no80 RTK no
ZZZZZZZZZZZZZZ
variant 1Mean1.16−0.23−19.824.9217.065.73−3.551.19−24.2113.261.500.020.510.01
STD0.210.050.290.070.330.071.050.050.390.130.260.020.150.01
RMS1.180.2419.824.9217.065.733.701.1924.2113.261.530.020.530.02
Moran0.460.240.200.170.260.340.640.320.370.310.720.160.560.06
variant 2Mean0.26−0.06−1.240.46−0.20−0.03−0.01−0.060.68−0.030.130.020.050.01
STD0.920.050.930.060.940.060.530.05−0.490.090.270.020.390.01
RMS0.940.071.540.470.950.070.520.070.470.090.300.020.390.02
Moran0.650.240.450.350.620.520.550.280.500.590.560.240.530.08
variant 3Mean0.020.00−0.020.200.050.040.020.000.000.030.050.020.020.01
STD0.560.050.750.060.620.050.530.040.300.070.280.020.020.01
RMS0.550.050.740.210.610.060.520.040.290.070.290.020.020.02
Moran0.560.240.540.290.540.460.550.240.520.510.560.100.100.00
variant 4Mean0.00−0.010.010.110.000.020.00−0.010.010.030.010.020.000.01
STD0.030.050.210.050.090.050.030.040.090.060.050.020.070.01
RMS0.030.050.200.120.090.050.030.040.090.070.050.020.070.02
Moran0.440.230.190.300.220.450.150.230.010.550.520.080.52−0.01
variant 5Mean0.000.000.080.06−0.030.010.010.00−0.010.020.010.020.010.01
STD0.020.050.200.050.090.040.020.040.070.040.030.020.030.01
RMS0.020.050.210.080.090.040.030.040.070.050.030.020.030.02
Moran0.190.030.160.060.180.260.19−0.02−0.250.300.320.040.27−0.07
variant 6Mean0.05−0.010.120.08−0.07−0.010.04−0.010.070.020.030.010.020.01
STD0.060.050.220.060.120.050.050.040.110.060.040.020.050.01
RMS0.090.050.270.110.150.060.070.050.150.070.060.020.060.02
Moran0.330.200.090.250.200.490.190.220.070.610.490.080.480.00
variant 7Mean0.010.04−0.090.090.180.040.020.04−0.01−0.010.030.020.010.01
STD0.020.040.220.060.140.040.020.030.120.060.020.010.020.01
RMS0.020.060.230.110.230.060.030.050.120.050.030.020.030.02
Moran0.260.270.100.470.190.48−0.130.200.290.400.190.080.30−0.03
variant 8Mean−0.010.03−0.020.070.060.030.010.020.000.000.020.020.010.01
STD0.020.040.190.050.090.040.020.030.110.050.020.010.020.01
RMS0.020.050.180.090.110.050.020.040.110.050.030.020.020.02
Moran0.380.18−0.110.520.140.48−0.190.070.220.300.260.120.170.02
variant 9Mean0.270.04−0.160.140.280.050.190.02−0.010.030.400.020.330.01
STD0.210.050.250.050.200.040.120.050.130.060.230.010.200.01
RMS0.340.060.290.140.340.060.230.050.130.060.460.020.380.02
Moran0.630.250.360.450.550.410.600.300.260.350.600.180.590.04
variant 10Mean−0.150.02−0.480.09−0.25−0.02−0.190.01−0.13−0.03−0.050.01−0.260.01
STD0.080.040.330.060.160.050.120.050.110.070.040.020.150.01
RMS0.170.050.580.110.290.060.230.050.170.080.060.020.300.02
Moran0.440.260.350.340.400.550.470.410.120.670.500.210.490.04
Table A2. Mean, standard deviation (STD), RMS errors [m], and Moran’s statistic calculated for the X and Y coordinates (green color—values between −0.07 m and 0.07 m, orange: between −0.7 and −0.15 m, and between 0.07 and 0.15 m, pink: below −0.15 m and above 0.15 m).
50 GPS50 RTK60 GPS60 RTK70 GPS70 RTK80 GPS
XYXYXYXYXYXYXY
variant 1Mean0.860.810.00−0.010.800.63−0.01−0.020.960.800.01−0.01−0.09−0.89
STD0.190.160.070.080.310.490.070.090.250.420.070.100.020.14
RMS0.880.830.070.080.860.790.070.090.990.900.060.100.090.90
Moran0.670.720.670.630.550.690.670.600.520.700.610.610.420.52
variant 2Mean0.020.010.000.000.200.280.00−0.030.010.010.02−0.010.020.03
STD0.220.150.080.082.233.260.070.100.100.130.090.120.120.22
RMS0.210.150.070.082.213.220.070.100.100.130.090.120.120.22
Moran0.710.730.680.630.570.730.650.620.630.650.590.670.570.62
variant 3Mean0.010.030.000.000.010.020.00−0.030.010.020.02−0.010.010.01
STD0.010.130.070.080.040.140.070.100.030.130.080.110.020.13
RMS0.020.130.070.080.040.140.070.100.030.130.080.100.020.13
Moran0.180.560.680.640.490.560.650.62−0.140.550.590.650.440.55
variant 4Mean0.010.010.000.000.010.010.00−0.030.010.000.02−0.010.010.00
STD0.040.100.070.080.040.100.070.100.050.100.080.100.030.10
RMS0.040.100.070.080.040.100.070.100.050.100.080.100.030.10
Moran0.700.570.700.670.700.560.680.620.530.560.660.670.700.55
variant 5Mean−0.020.000.000.000.000.030.00−0.020.000.020.010.000.000.02
STD0.060.090.070.080.050.090.070.090.060.090.070.080.050.09
RMS0.060.090.070.080.050.090.070.090.060.090.070.080.050.09
Moran0.720.540.630.580.740.510.620.500.580.500.600.550.730.51
variant 6Mean−0.040.010.000.000.010.040.00−0.02−0.010.030.020.000.000.03
STD0.120.070.080.080.100.060.070.100.120.060.080.100.110.06
RMS0.120.080.080.090.110.080.080.110.130.080.090.110.120.07
Moran0.740.640.670.590.740.440.630.570.750.500.590.620.750.51
variant 7Mean−0.010.00−0.01−0.01−0.02−0.020.00−0.030.000.000.01−0.02−0.02−0.02
STD0.070.070.070.070.070.080.070.090.080.070.070.080.070.06
RMS0.070.070.070.070.070.080.070.090.080.070.070.080.080.06
Moran0.700.510.690.610.710.550.640.620.690.510.670.620.710.50
variant 8Mean0.010.010.000.000.010.010.00−0.020.020.010.01−0.010.000.00
STD0.060.070.070.070.060.070.070.080.070.070.060.070.060.06
RMS0.060.070.070.070.060.070.060.080.070.070.060.070.060.06
Moran0.650.460.660.560.670.460.630.550.630.420.660.540.650.44
variant 9Mean0.080.170.010.020.130.180.020.000.080.170.040.020.080.16
STD0.050.110.070.070.080.150.070.080.050.110.070.090.050.11
RMS0.100.210.070.070.150.230.070.080.090.200.080.090.090.20
Moran0.610.580.690.600.570.630.670.600.480.560.630.610.600.56
variant 10Mean−0.07−0.14−0.02−0.03−0.11−0.18−0.02−0.05−0.09−0.16−0.02−0.05−0.09−0.16
STD0.060.080.070.070.070.110.070.090.070.090.060.080.060.09
RMS0.100.160.070.070.130.200.070.100.110.180.070.090.110.18
Moran0.640.470.640.520.540.520.580.530.620.510.600.560.610.50
80 RTK90 GPS90 RTK60 GPS no60 RTK no80 GPS no80 RTK no
XYXYXYXYXYXYXY
variant 1Mean0.01−0.011.710.720.070.010.64−0.240.000.001.210.170.020.00
STD0.080.120.700.880.070.120.090.040.010.020.090.030.020.02
RMS0.080.121.851.120.090.120.650.240.010.021.210.170.020.02
Moran0.620.650.610.680.530.600.720.650.340.350.720.700.460.48
variant 2Mean0.01−0.011.381.900.08−0.060.06−0.040.000.000.040.000.020.00
STD0.080.120.120.180.110.170.160.110.010.020.120.080.020.02
RMS0.080.121.401.920.130.180.170.120.010.020.120.080.020.02
Moran0.620.670.590.720.560.680.720.720.350.360.730.740.460.50
variant 3Mean0.01−0.010.020.020.07−0.050.030.000.000.000.000.000.020.00
STD0.070.090.030.140.090.120.010.060.010.020.010.020.020.02
RMS0.070.090.030.140.110.130.030.060.010.020.010.020.020.02
Moran0.670.640.100.490.610.650.480.580.360.280.360.280.450.44
variant 4Mean0.00−0.010.000.010.06−0.040.030.000.000.000.020.010.020.00
STD0.070.090.040.110.090.110.030.050.010.020.020.050.020.02
RMS0.070.080.040.110.100.110.040.040.010.020.030.050.020.02
Moran0.710.660.580.460.660.650.690.560.420.250.700.550.480.46
variant 5Mean0.000.000.000.050.05−0.020.010.010.000.000.010.020.020.00
STD0.070.070.040.100.080.090.030.040.010.020.030.040.020.02
RMS0.070.070.040.110.090.090.030.040.010.020.030.040.020.02
Moran0.670.550.680.520.630.520.710.580.320.270.710.560.410.45
variant 6Mean0.010.00−0.010.030.07−0.030.020.010.000.000.020.020.020.00
STD0.070.090.100.070.090.110.070.030.010.020.060.030.020.02
RMS0.080.100.110.090.120.130.080.040.020.020.070.040.030.02
Moran0.670.590.770.280.600.600.760.710.300.350.770.620.410.46
variant 7Mean−0.01−0.01−0.01−0.050.04−0.040.02−0.010.000.000.010.000.020.00
STD0.070.070.080.090.070.080.040.030.010.010.040.030.010.02
RMS0.070.070.080.100.080.080.050.030.010.010.040.030.020.02
Moran0.690.600.700.490.670.560.700.480.370.270.710.470.480.40
variant 8Mean0.000.000.01−0.020.04−0.020.020.000.000.000.010.000.020.00
STD0.060.060.070.080.070.060.040.030.010.010.040.030.010.02
RMS0.060.060.070.080.080.070.040.030.010.010.040.030.020.02
Moran0.660.530.680.350.640.450.660.440.410.180.660.430.500.30
variant 9Mean0.030.030.110.140.100.010.070.020.010.000.060.050.020.00
STD0.070.080.080.130.080.090.050.030.010.010.040.040.010.02
RMS0.070.080.130.190.120.090.080.040.010.010.070.070.020.02
Moran0.700.600.600.570.620.580.720.510.410.230.720.510.510.41
variant 10Mean−0.03−0.05−0.10−0.190.01−0.100.01−0.050.000.00−0.01−0.070.010.00
STD0.070.070.060.110.070.080.030.040.010.020.020.040.020.02
RMS0.070.090.110.220.070.120.030.060.010.020.020.080.020.02
Moran0.640.520.480.460.640.540.690.540.240.270.640.420.330.41

References

  1. Kovanič, Ľ.; Topitzer, B.; Pet’ovský, P.; Blišt’an, P.; Bindzárová Gergel’ová, M.; Blišt’anová, M. Review of Photogrammetric and Lidar Applications of UAV. Appl. Sci. 2023, 13, 6732. [Google Scholar] [CrossRef]
  2. Mohsan, S.A.H.; Khan, M.A.; Noor, F.; Ullah, I.; Alsharif, M.H. Towards the Unmanned Aerial Vehicles (UAVs): A Comprehensive Review. Drones 2022, 6, 147. [Google Scholar] [CrossRef]
  3. DJI—Official Website. Available online: https://www.dji.com/ (accessed on 5 September 2025).
  4. Zhao, B.; Li, J.; Wang, L.; Shi, Y. Positioning Accuracy Assessment of a Commercial RTK UAS. In Autonomous Air and Ground Sensing Systems for Agricultural Optimization and Phenotyping V; SPIE-Intl Soc Optical Eng: Bellingham, WA, USA, 2020; p. 8. [Google Scholar]
  5. Ekaso, D.; Nex, F.; Kerle, N. Accuracy Assessment of Real-Time Kinematics (RTK) Measurements on Unmanned Aerial Vehicles (UAV) for Direct Geo-Referencing. Geo-Spat. Inf. Sci. 2020, 23, 165–181. [Google Scholar] [CrossRef]
  6. Dinkov, D. Accuracy Assessment of High-Resolution Terrain Data Produced from UAV Images Georeferenced with on-Board PPK Positioning. J. Bulg. Geogr. Soc. 2023, 2023, 43–53. [Google Scholar] [CrossRef]
  7. Eker, R.; Alkan, E.; Aydın, A. A Comparative Analysis of UAV-RTK and UAV-PPK Methods in Mapping Different Surface Types. Eur. J. For. Eng. 2021, 7, 12–25. [Google Scholar] [CrossRef]
  8. Stott, E.; Williams, R.D.; Hoey, T.B. Ground Control Point Distribution for Accurate Kilometre-Scale Topographic Mapping Using an RTK-GNSS Unmanned Aerial Vehicle and SfM Photogrammetry. Drones 2020, 4, 55. [Google Scholar] [CrossRef]
  9. Teppati Losè, L.; Chiabrando, F.; Giulio Tonolo, F. Are Measured Ground Control Points Still Required in UAV Based Large Scale Mapping? Assessing the Positional Accuracy of an RTK Multi-Rotor Platform. Int. Arch. Photogramm. Remote Sens. Spat. Inf. Sci.—ISPRS Arch. 2020, 43, 507–514. [Google Scholar] [CrossRef]
  10. Liu, Y.; Han, K.; Rasdorf, W. Assessment and Prediction of Impact of Flight Configuration Factors on UAS-Based Photogrammetric Survey Accuracy. Remote Sens. 2022, 14, 4119. [Google Scholar] [CrossRef]
  11. Liu, X.; Lian, X.; Yang, W.; Wang, F.; Han, Y.; Zhang, Y. Accuracy Assessment of a UAV Direct Georeferencing Method and Impact of the Configuration of Ground Control Points. Drones 2022, 6, 30. [Google Scholar] [CrossRef]
  12. Dai, W.; Zheng, G.; Antoniazza, G.; Zhao, F.; Chen, K.; Lu, W.; Lane, S.N. Improving UAV-SfM Photogrammetry for Modelling High-Relief Terrain: Image Collection Strategies and Ground Control Quantity. Earth Surf. Process. Landforms 2023, 48, 2884–2899. [Google Scholar] [CrossRef]
  13. Mesas-Carrascosa, F.J.; García, M.D.N.; De Larriva, J.E.M.; García-Ferrer, A. An Analysis of the Influence of Flight Parameters in the Generation of Unmanned Aerial Vehicle (UAV) Orthomosaicks to Survey Archaeological Areas. Sensors 2016, 16, 1838. [Google Scholar] [CrossRef]
  14. Villanueva, J.K.S.; Blanco, A.C. Optimization of Ground Control Point (GCP) Configuration for Unmanned Aerial Vehicle (UAV) Survey Using Structure from Motion (SFM). Int. Arch. Photogramm. Remote Sens. Spat. Inf. Sci.—ISPRS Arch. 2019, 42, 167–174. [Google Scholar] [CrossRef]
  15. Zhang, K.; Okazawa, H.; Hayashi, K.; Hayashi, T.; Fiwa, L.; Maskey, S. Optimization of Ground Control Point Distribution for Unmanned Aerial Vehicle Photogrammetry for Inaccessible Fields. Sustainability 2022, 14, 9505. [Google Scholar] [CrossRef]
  16. Llabani, A.; Abazaj, F. Evaluating UAV RTK Photogrammetry Mapping Accuracy in Urban Areas without Ground Control Points. Int. Res. J. Innov. Eng. Technol. 2024, 8, 82–87. [Google Scholar] [CrossRef]
  17. Mulakala, J. Measurement Accuracy of the DJI Phantom 4 RTK & Photogrammetry; DroneDeploy: San Francisco, CA, USA, 2019. [Google Scholar]
  18. Stöcker, C.; Nex, F.; Koeva, M.; Gerke, M. High-Quality UAV-Based Orthophotos for Cadastral Mapping: Guidance for Optimal Flight Configurations. Remote Sens. 2020, 12, 3625. [Google Scholar] [CrossRef]
  19. Cramer, M.; Zhang, S.; Meißner, H.; Reulke, R. Quality Assessment of High-Resolution UAV Imagery and Products. In Proceedings of the 40. Wissenschaftlich-Technische Jahrestagung der DGPF in Stuttgart, Stuttgart, Germany, 4–6 March 2020; pp. 33–46. [Google Scholar]
  20. Gerke, M.; Przybilla, H.J. Accuracy Analysis of Photogrammetric UAV Image Blocks: Influence of Onboard RTK-GNSS and Cross Flight Patterns. Photogramm. Fernerkund. Geoinf. 2016, 2016, 17–30. [Google Scholar] [CrossRef]
  21. Zhou, Y.; Rupnik, E.; Meynard, C.; Thom, C.; Pierrot-Deseilligny, M. Simulation and Analysis of Photogrammetric UAV Image Blocks-Influence of Camera Calibration Error. Remote Sens. 2020, 12, 22. [Google Scholar] [CrossRef]
  22. Nesbit, P.R.; Hugenholtz, C.H. Enhancing UAV-SfM 3D Model Accuracy in High-Relief Landscapes by Incorporating Oblique Images. Remote Sens. 2019, 11, 239. [Google Scholar] [CrossRef]
  23. Niu, Z.; Xia, H.; Tao, P.; Ke, T. Accuracy Assessment of UAV Photogrammetry System with RTK Measurements for Direct Georeferencing. ISPRS Ann. Photogramm. Remote Sens. Spat. Inf. Sci. 2024, 10, 169–176. [Google Scholar] [CrossRef]
  24. Peppa, M.V.; Hall, J.; Goodyear, J.; Mills, J.P. Photogrammetric Assessment and Comparison of DJI Phantom 4 Pro and Phantom 4 RTK Small Unmanned Aircraft Systems. Int. Arch. Photogramm. Remote Sens. Spat. Inf. Sci.—ISPRS Arch. 2019, 42, 503–509. [Google Scholar] [CrossRef]
  25. Przybilla, H.J.; Bäumker, M.; Luhmann, T.; Hastedt, H.; Eilers, M. Interaction between Direct Georeferencing, Control Point Configuration and Camera Self-Calibration for RTK-Based UAV Photogrammetry. Int. Arch. Photogramm. Remote Sens. Spat. Inf. Sci.—ISPRS Arch. 2020, 43, 485–492. [Google Scholar] [CrossRef]
  26. Oniga, V.-E.; Breaban, A.-I.; Statescu, F. Determining the Optimum Number of Ground Control Points for Obtaining High Precision Results Based on UAS Images. Proceedings 2018, 2, 352. [Google Scholar] [CrossRef]
  27. Sanz-Ablanedo, E.; Chandler, J.H.; Rodríguez-Pérez, J.R.; Ordóñez, C. Accuracy of Unmanned Aerial Vehicle (UAV) and SfM Photogrammetry Survey as a Function of the Number and Location of Ground Control Points Used. Remote Sens. 2018, 10, 1606. [Google Scholar] [CrossRef]
  28. Ferrer-González, E.; Agüera-Vega, F.; Carvajal-Ramírez, F.; Martínez-Carricondo, P. UAV Photogrammetry Accuracy Assessment for Corridor Mapping Based on the Number and Distribution of Ground Control Points. Remote Sens. 2020, 12, 2447. [Google Scholar] [CrossRef]
  29. Garcia, M.V.Y.; Oliveira, H.C. The Influence of Ground Control Points Configuration and Camera Calibration for DTM and Orthomosaic Generation Using Imagery Obtained from A Low-Cost UAV. ISPRS Ann. Photogramm. Remote Sens. Spat. Inf. Sci. 2020, 5, 239–244. [Google Scholar] [CrossRef]
  30. Kersten, T.; Wolf, J.; Lindstaedt, M. Investigations into the accuracy of the UAV system DJI Matrice 300 RTK with the sensors Zenmuse P1 and L1 in the Hamburg test field. Int. Arch. Photogramm. Remote Sens. Spat. Inf. Sci.—ISPRS Arch. 2022, 43, 339–346. [Google Scholar] [CrossRef]
  31. Przybilla, H.J.; Gerke, M.; DIkhoff, I.; Ghassoun, Y. Investigations on the Geometric Quality of Cameras for UAV Applications Using the High Precision UAV Test Field Zollern Colliery. Int. Arch. Photogramm. Remote Sens. Spat. Inf. Sci.—ISPRS Arch. 2019, 42, 531–538. [Google Scholar] [CrossRef]
  32. Wiącek, P.; Pyka, K. The Test Field for UAV Accuracy Assessments. Int. Arch. Photogramm. Remote Sens. Spat. Inf. Sci.—ISPRS Arch. 2019, 42, 67–73. [Google Scholar] [CrossRef]
  33. Leica GS07 Website. Available online: https://leica-geosystems.com/products/gnss-systems/smart-antennas/leica-gs07-made-for-you (accessed on 5 September 2025).
  34. Leica TS16: Robotic Total Station Website. Available online: https://leica-geosystems.com/products/total-stations/robotic-total-stations/leica-ts16 (accessed on 5 September 2025).
  35. DJI Ground Station Pro Website. Available online: https://www.dji.com/pl/ground-station-pro (accessed on 5 August 2025).
  36. Agisoft Metashape Website. Available online: https://www.agisoftmetashape.com/ (accessed on 5 September 2025).
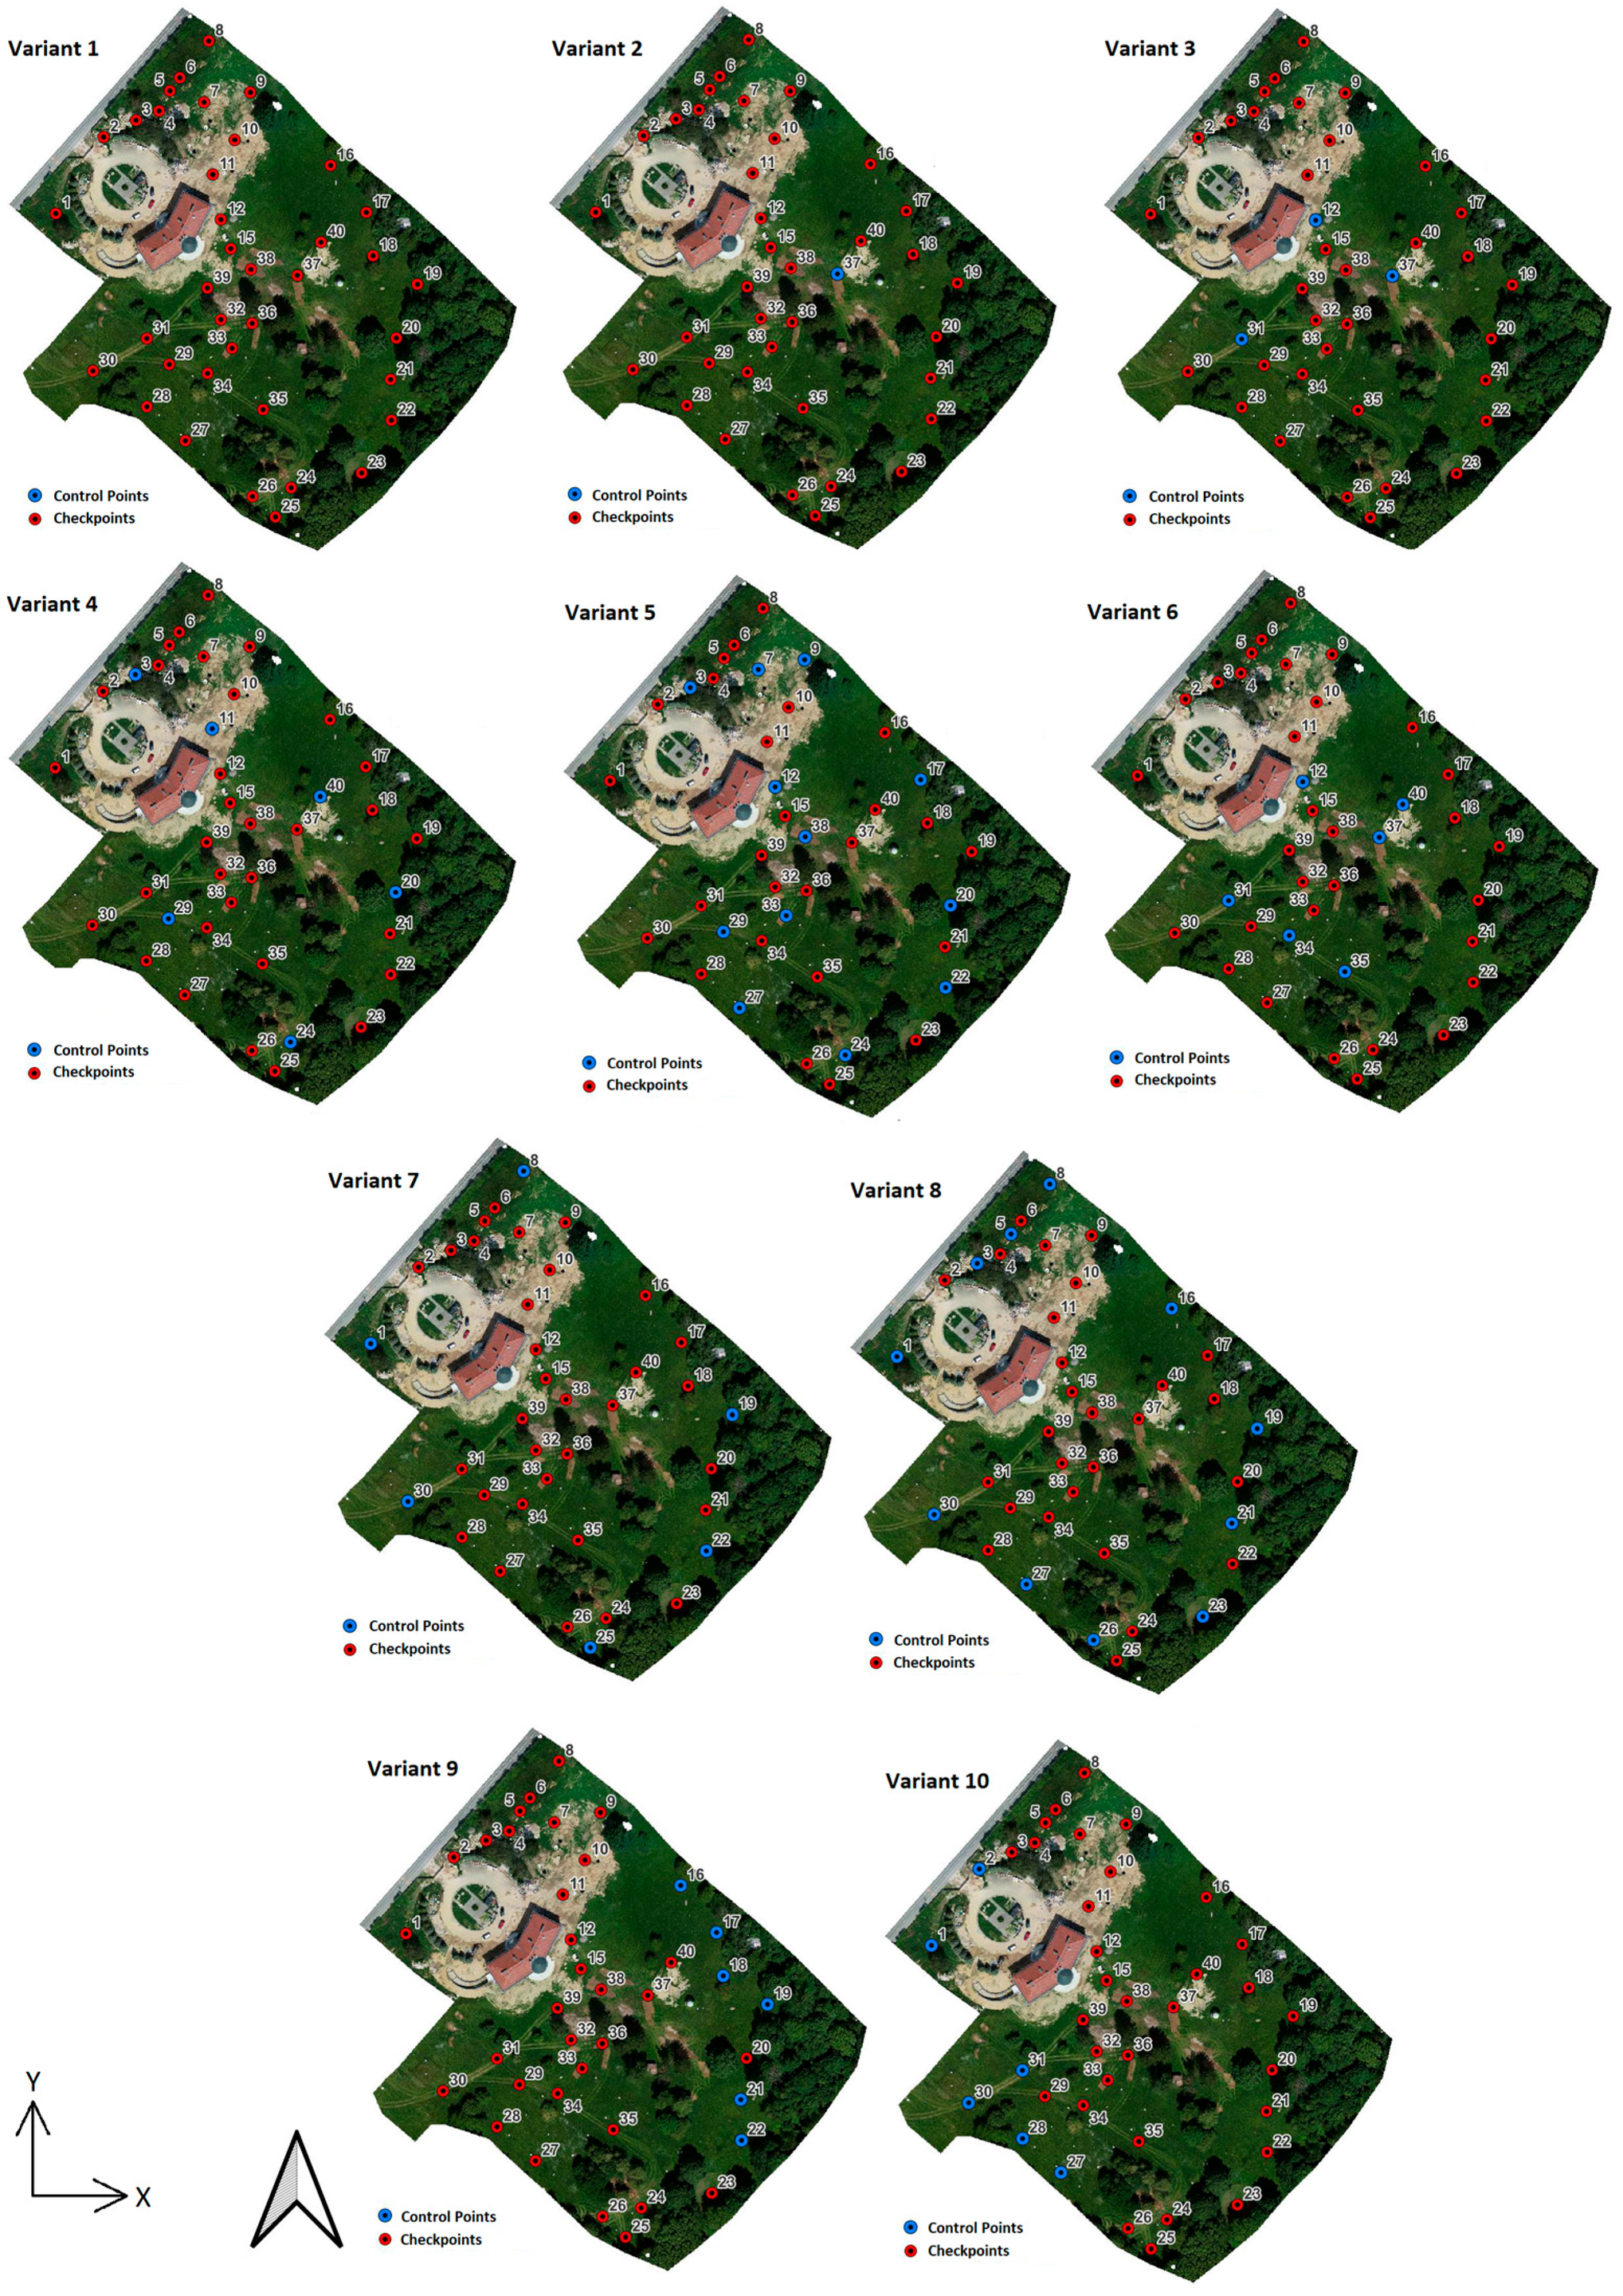
Figure 1. Distribution of GCPs used for aerial triangulation.
Applsci 15 10559 g001
Figure 2. Chart presenting the workflow of the research, from data acquisition to quality analysis.
Applsci 15 10559 g002
Figure 3. Z error for checkpoints for variant 1—nadir images without GCPs.
Applsci 15 10559 g003
Figure 4. Focal length error for variant 1—nadir images without GCPs.
Applsci 15 10559 g004
Figure 5. Z error on checkpoints for variants 2–10 (nadir images).
Applsci 15 10559 g005
Figure 6. X and Y error on checkpoints for variants 3–10 (nadir images).
Applsci 15 10559 g006
Figure 7. Z error on checkpoints for variants 2–10 (60n—nadir images only, 60no—nadir and oblique images).
Applsci 15 10559 g007
Figure 8. Z error on checkpoints for variants 2–10 (80n—nadir images only, 80no—nadir and oblique images).
Applsci 15 10559 g008
Figure 9. X and Y error on checkpoints for variants 3–10 (60n, 80n—nadir images only, 60no, 80no—nadir and oblique images).
Applsci 15 10559 g009
Figure 10. Measurement errors for check distances depending on the image block (ortho GPS—Phantom 4 Pro, ortho RTK—Phantom 4 RTK).
Applsci 15 10559 g010
Table 1. DJI Phantom 4 camera parameters.
ParameterPhantom 4 Pro V2.0/Phantom 4 RTK
Lens8.8 mm/24 mm (35 mm format equivalent) f/2.8–f/11
Image resolution13.2 × 8.8 mm, 5472 × 3648 px
Pixel size2.41 μm
Effective pixels20 Mpx
Sensor1-inch CMOS
Field of view (FOV)84°
Shutter speedMechanical: 8-1/2000 s, electronic: 8-1/8000 s
Max f-stop1:2.8
Table 2. Types of images that were acquired from different flight heights AGL (X—used images).
Flight Altitude (AGL) [m]Nadir ImagesOblique Images
50X
60XX
70X
80XX
90X
Table 3. Variants of GCP locations used in aerial triangulation.
VariantDescriptionNo. of GCPsNo. of Checkpoints
1No GCPs in aerial triangulation038
21 GCP in the middle137
33 evenly distributed GCPs335
46 evenly distributed GCPs632
512 evenly distributed GCPs1226
6Without GCPs in corners (GCPs in the middle part of the area)632
7GCPs only in corners632
8GCPs in the corners and on the edges1127
9GCPs on the right side of the block632
10GCPs on the left side of the block632
Table 4. Check distances used for the orthomosaic quality check.
Check Distance (Start and End GCP)Length of the Distance [m]
38–3923.75
37–1247.44
12–3364.60
12–3099.20
11–3499.57
30–37113.13
Table 5. Z errors on checkpoints depending on the flight height, GCP variant, and fixed or adjusted focal length f.
Flight
Height [m]
Variant 1
(Adjusted f)
Variant 1
(Fixed f)
Variant 2
(Adjusted f)
Variant 2
(Fixed f)
Z Error [m]
GPSRTKGPSRTKGPSRTKGPSRTK
501.180.240.530.810.940.070.950.72
6019.824.920.971.121.540.471.130.86
7017.065.731.341.190.950.071.040.76
803.701.191.331.330.530.080.670.70
9024.2113.261.481.510.680.090.810.59
Table 6. X and Y errors on checkpoints depending on the flight height and GCPs variant, with adjusted focal length f.
Flight
Height [m]
Variant 1 (Adjusted f)Variant 2 (Adjusted f)
X Error [m]Y Error [m]X Error [m]Y Error [m]
GPSRTKGPSRTKGPSRTKGPSRTK
500.880.070.830.080.220.080.150.08
600.860.070.790.092.210.073.230.11
700.990.070.900.100.100.090.130.12
800.090.080.900.120.120.080.220.12
901.850.091.130.121.380.131.900.18
Table 7. Height Z errors on checkpoints for variant 1 for two flight heights (60 m and 80 m) and image types—nadir images only (n), nadir and oblique images (no).
Flight Height [m]Flight
Variant
Z Error [m]
GPSRTK
60n19.8214.923
80o3.7001.192
60no1.5260.022
80no0.5330.016
Table 8. X and Y error on checkpoints for variants 1 and 2 (60n, 80n—nadir images only, 60no, 80no—nadir and oblique images).
Flight
Variant
GCP VariantGCP Variant 2
X Error [m]Y Error [m]X Error [m]Y Error [m]
GPSRTKGPSRTKGPSRTKGPSRTK
60n0.860.070.790.092.210.073.230.11
80n0.090.080.900.120.120.080.220.12
60no0.650.020.240.020.170.020.120.02
80no1.210.020.170.020.120.020.080.02
Disclaimer/Publisher’s Note: The statements, opinions and data contained in all publications are solely those of the individual author(s) and contributor(s) and not of MDPI and/or the editor(s). MDPI and/or the editor(s) disclaim responsibility for any injury to people or property resulting from any ideas, methods, instructions or products referred to in the content.