Abstract
This paper presents a comprehensive sensitivity analysis of the pioneering real-world deployment of computer vision-enabled construction waste sorting in Finland, implemented by a leading provider of robotic recycling solutions. Building upon and extending the findings of prior field research, the study analyzes an industry flagship case to examine the financial feasibility of computer vision-enabled robotic sorting compared to conventional sorting. The sensitivity analysis covers cost parameters related to labor, wages, personnel training, machinery (including AI software, hardware, and associated components), and maintenance operations, as well as capital expenses. We further expand the existing cost model by integrating the net present value (NPV) of investments. The results indicate that the computer vision-enabled automated system (CVAS) achieves cost competitiveness over conventional sorting (CS) under conditions of higher labor-related costs, such as increased headcount, wages, and training expenses. For instance, when annual wages exceed EUR 20,980, CVAS becomes more cost-effective. Conversely, CS retains cost advantages in scenarios dominated by higher machinery and maintenance costs or extremely elevated discount rates. For example, when the average machinery cost surpasses EUR 512,000 per unit, CS demonstrates greater economic viability. The novelty of this work arises from the use of a pioneering real-world case study and the improvements offered to a comprehensive comparative cost model for CVAS and CS, and furthermore from clarification of the impact of key cost variables on solution (CVAS or CS) selection.
1. Introduction
Construction and demolition (C&D) waste accounts for more than one-third of the total waste generated in the European Union [1]. If not properly managed, it contributes to environmental problems such as soil and water contamination, greenhouse gas emissions, and the unnecessary depletion of resources [2]. Improving C&D waste management is therefore essential for advancing circular economy (CE) goals, which emphasize recycling, reuse, and reduced reliance on virgin materials [3].
Conventional C&D waste-sorting methods, however, remain labor-intensive, costly, and prone to inconsistent performance, while also posing occupational safety risks [4,5,6,7]. Traditional systems combine mechanical equipment such as crushers, magnetic separators, and conveyors but still rely heavily on manual intervention in the final sorting stages [8,9,10]. These limitations increase costs, reduce recovery rates, and hinder the efficiency of recycling processes [2].
Computer vision (CV)-enabled robotics has emerged as a promising solution to these challenges. By enabling autonomous systems to detect, identify, and classify waste materials with higher precision, CV technologies can improve sorting accuracy and consistency, while reducing dependence on human labor [11,12]. Machine learning (ML) models, particularly deep learning algorithms, further enhance these systems by improving recognition speed, adaptability, and performance in real-world environments [13,14]. Benchmarking studies have shown that artificial intelligence (AI)-powered sorting solutions can outperform conventional methods in terms of both accuracy and operational efficiency [2,12]. Nevertheless, the detailed economic implications of deploying CV-enabled solutions in construction waste recycling require further investigation.
To achieve this, we address the following research questions:
RQ1: What is the impact of varying discount rates on the cost competitiveness of CV-enabled robotic systems in construction waste recycling versus CS?
RQ2: In the presence of capital expenses, what is the impact of varying other costs related to headcount, wages, personnel training, machinery, and maintenance operations on the competitiveness of the CV-enabled waste recycling system in construction?
2. Literature Review
2.1. Construction Waste Management
The increasing importance of sustainability has led industries to realign their practices with the principles of the CE, emphasizing resource efficiency, waste reduction, and economic development [15]. CE promotes the continual use of resources by minimizing waste, extending product life cycles, and encouraging recycling and reuse [13]. Within the construction sector, CE is crucial due to the industry’s significant material consumption and waste generation, accounting for approximately 30–40% of global natural resource extraction and 25–40% of total solid waste production [11]. The construction industry’s role in global greenhouse gas emissions, resource depletion, and landfill pressure makes sustainable C&D waste management a priority [16].
Scholars have highlighted that embracing CE principles can significantly improve environmental and economic outcomes by closing material loops, extending product lifetimes, and optimizing waste recovery [17]. ML is increasingly recognized as a critical enabler in this transition, supporting decision-making and operational optimization in circular supply chains [13].
Historically, construction waste management has evolved from simple landfill disposal towards more sustainable strategies emphasizing recycling and resource recovery. Initially, recycling efforts were limited and often hindered by heterogeneous waste streams and inefficient manual sorting processes [5]. With the increasing urbanization and aging building stock, renovation activities have emerged as a significant source of waste generation, necessitating specific pre-renovation waste auditing practices to improve recycling and resource efficiency [18]. Hence, emerging solutions such as on-site recycling and advanced sorting technologies have been promoted to overcome traditional limitations [19].
2.2. Artificial Intelligence and Robotics in Operations
Artificial intelligence is increasingly transforming industries by enhancing automation, efficiency, and sustainability. In manufacturing, ML-driven predictive maintenance reduces machine downtime and operational costs by identifying potential failures before they occur [20]. In construction, ML and AI have been leveraged for risk assessment, project cost estimation, and supply chain and logistics management, enhancing decision-making in complex projects [21].
Particularly in the context of construction waste management, AI has enabled more accurate forecasting of waste generation, improved handling logistics, and optimized recycling processes [4]. AI applications such as regression models, support vector machines, and deep learning architectures have significantly improved the estimation, classification, and prediction of C&D waste [17]. However, while these approaches demonstrate strong predictive and classification performance, most studies stop short of linking such improvements to their economic or operational consequences. In other words, high accuracy rates are well established, but it remains unclear under which financial or labor market conditions these technologies outperform conventional methods. These studies rarely evaluate cost implications, which remains a key gap in the literature.
Recent studies have emphasized that AI can achieve high accuracy rates (often exceeding 90%) in waste quantity predictions and classification tasks, demonstrating their strong potential for construction sustainability initiatives [16]. Furthermore, AI’s application in construction supply chains enhances transparency, efficiency, and resource optimization, crucial elements for advancing CE objectives [13].
In parallel, robotics has gained traction in waste management, offering solutions to the labor-intensive, hazardous, and inconsistent manual sorting processes traditionally used on construction sites. Robots equipped with advanced CV models can navigate construction environments, recognize waste materials, and perform sorting tasks with higher efficiency and safety [19]. Robotics systems use techniques such as 3D object detection cameras and grasping optimization integrating deep learning methods to enhance sorting precision and achieve grasping success rates exceeding 90% [22]. Yet, these performance metrics are often reported in isolation from cost or risk considerations. For instance, grasping success above 90% does not necessarily translate into financial feasibility once machinery costs, training requirements, or system downtime are considered.
The combination of CV and robotics in waste management has led to significant advancements. Recent efforts using convolutional neural networks, deep residual networks, and knowledge transfer techniques have improved the classification accuracy of mixed construction waste types to around 73–90%, depending on the model and dataset [11,23]. Studies also show that integrating CV with sensor-enabled technologies (e.g., 3D laser triangulation) enables real-time monitoring and quality control during recycling processes [24].
As the construction industry moves towards more sustainable practices, the integration of CV and robotics into waste management represents a transformative approach that supports the goals of the CE and advances environmental, economic, and operational sustainability [2,12,17].
Overall, the lack of integration between technical performance and cost competitiveness highlights a key gap: while AI and robotics demonstrate strong technical potential, the economic and operational feasibility of deploying such systems in real-world construction waste management remains underexplored. Our study directly addresses this gap by extending cost models to capture how wages, training, maintenance, and discount rates influence competitiveness.
2.3. Gap in the Literature
Despite the growing body of literature on AI-enabled sorting in construction waste management, most studies focus primarily on technical performance or classification accuracy (e.g., Lin et al. [23]; Nežerka et al. [11]). Far fewer works examine the economic or operational feasibility of deploying these technologies in diverse real-world contexts, particularly when such investments may not generate cost savings. For example, Ku et al. [22] and Demetriou et al. [8] provide insights into robotic system performance but do not connect these findings to cost–benefit tradeoffs under varying economic conditions. Such figures are often obtained under controlled conditions and may not fully reflect operational feasibility in real recycling environments. This disconnect highlights a significant gap: a lack of comprehensive models linking AI/robotics accuracy, downtime, and throughput variability to overall cost competitiveness. Furthermore, there has been little investigation into negative or neutral deployment outcomes, cases where AI-enabled systems fail to outperform conventional methods economically or operationally.
The financial barrier to adoption also remains underexplored. High initial investment in CV software, hardware, and robotics continues to limit adoption, compounded by recurring expenses such as maintenance, training, and infrastructure [2]. Cost models are especially sensitive to parameters like workforce size, wages, training costs, facility investments, and discount rates, yet existing studies rarely test these systematically. Throughput rates are equally critical: although CV-enabled systems demand higher upfront investment, their long-term efficiency gains and reduced labor dependence may offset initial costs [2].
Overall, the existing literature [1,2,7,8,11,12,14,16,17,19,22,23] has not yet investigated the impact of the time value of money on the competitiveness of CV-enabled waste recycling, nor has it addressed the implications of deployment in lower-wage countries.
This paper responds to these gaps by extending the cost model of Farshadfar et al. [2] and conducting a comprehensive sensitivity analysis. We systematically evaluate variations in headcount, wages, training, machinery, maintenance, and discount rates to clarify under which conditions CV-enabled systems are competitive, and when they are not. In doing so, the study provides a more robust understanding of the financial feasibility and limitations of AI-driven automation in waste sorting.
3. Materials and Methods
The case study in this research is the implementation of the ZenRobotics CVAS system in a Finnish construction waste recycling center reported by Farshadfar et al. [2]. ZenRobotics (ZenRobotics Ltd., Vantaa, Finland), a Finnish manufacturer of CVAS robots, has created the Zen recycle. Figure 1 shows an intelligent robotic system that automates the sorting of recyclable construction waste, replacing dangerous and expensive manual processes [25].
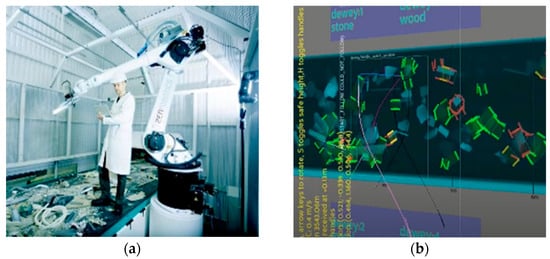
Figure 1.
ZenRobotics waste recycling system. (a) Robot recycler. (b) Recycler vision output.
The original case data was collected by Farshadfar et al. [2] through primary and secondary sources, including interviews, site visits, and data from the case studies websites, industry documents, reports, and public videos from sources such as YouTube.
3.1. Comparative Cost Model
A mathematical cost model published by Farshadfar et al. [2] is used as the foundation for this research. Building on their model, we extend the comparative cost model by incorporating the time value of money and conducting a sensitivity analysis on key cost parameters. This methodological extension directly addresses our research questions: RQ1 examines how varying discount rates affect cost competitiveness, which we capture by introducing an NPV framework into the model. RQ2 focuses on the impact of labor, training, machinery, and maintenance costs. These are systematically varied in the sensitivity analysis to assess their influence on the comparative cost trajectories of CVAS and CS.
3.2. Data
The case data used in this paper is presented in Table 1. Since this study aims to compare the financial performance of two alternative methods, we focus solely on the cost components associated with the stages of processes that are different between the two methods, and we ignore the cost associated with the stages of processes that are similar among the two methods. For the CS method, as suggested by Farshadfar et al. [2], we consider three process stages: (1) granulation adaptation for sorting by shredder, (2) material separation by size and screening by human labor, (3) final quality control and manual sorting by labor. For CVAS, the stages are as follows: (1) material separation based on optical properties and composition by optical and NIR sensor, (2) final automated sorting by Zen robots. By isolating the differences, this approach enables a more precise and concise comparison of the economic impact of CVAS and CS.

Table 1.
Utilized data [2].
The empirical data underlying this analysis were collected in a prior case study by Farshadfar et al. [2]. Primary data included eight semi-structured interviews (60–90 min each) with managers, scientists, and professionals from a Finnish recycling facility and ZenRobotics, as well as two site visits (90 min each) to the recycling facility. In addition, secondary sources such as 25 industry documents, company reports, and 4 YouTube videos (77 min total) were analyzed. This mixed-methods design provided both qualitative and quantitative inputs. All process maps and cost assumptions were validated with interviewees and industry benchmarks, ensuring robustness of the dataset.
The data used for these different phases is similar to that used by Farshadfar et al. [2], except for three differences. First, training costs have been revised to better reflect current industry practices, with the ratio between general training and digital transformation skills training adjusted to 2:1 [26]. Second, annual machinery maintenance costs have been increased from 0.5% to 5% of the machinery acquisition cost to align with more realistic long-term maintenance expectations. Finally, the capital discount rate has been adjusted from 0% to 4.5%, providing a more pragmatic representation of the time value of money in financial assessments. In Table 1, values marked with an asterisk (*) indicate data that have been modified from the original data.
To provide a clear composition of total cost between the two sorting methods, it is necessary to first examine their total comparative cost under the utilized data (Table 1). Figure 2 shows the 7-year total comparative cost calculated by the utilized values for two methods, which are derived from the base model by Farshadfar et al. [2]. It should be noted that the data presented in the previous paper are based on the throughput of the CVAS and CS methods, which are 30 tons/hour and 70 tons/hour, respectively, presenting the actual operational data of the case company. Hence, to ensure a fair cost comparison that reflects throughput differences, the CS method’s total cost is divided by a factor of 2.3, corresponding to the capacity ratio between the two methods. This normalization factor (2.3) directly reflects the actual operational throughput difference observed at the case facility by Farshadfar et al. [2].
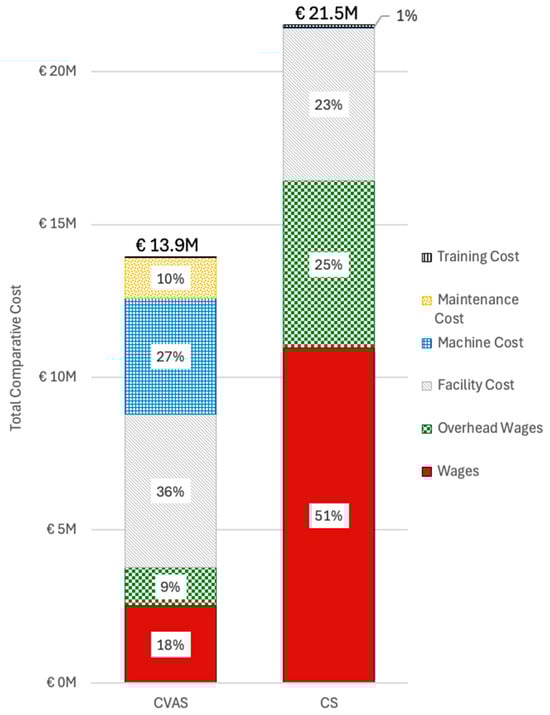
Figure 2.
The comparative cost components of CVAS and CS methods over a 7-year time span.
Figure 2 presents that the majority of CVAS’s comparative cost is machine cost. The machinery cost contributes 27% of the CVAS total comparative cost. For CS, the major costs are total wages and overhead wages which reach 76% of CS’s total comparative cost.
3.3. Sensitivity Analysis
A local sensitivity analysis is performed to examine the impact of variations in key cost components on the total cost. The selected independent variables in the cost model are presented in Table 2.
Table 2.
Selected parameters for sensitivity analysis.
After confirming the key cost parameters, we set four different assumption values (lowest, lower, higher, and highest) for each component, along with the utilized data as the baseline, to explore the impact of these variables on the cost of the CVAS and CS methods. Each set of assumption values is proportionally increased or decreased from the baseline to ensure consistency and comparability across scenarios. This part provides a detailed, parameter-by-parameter comparison to investigate the cost-effectiveness of CVAS.
4. Results
In this paper, the cost calculation is performed over a 7-year time horizon. To overcome the financial limitations of the previous model [2] and incorporate the time value of money, we extend the original framework by introducing a time dimension and applying a discount rate based on NPV. In addition to these extensions, we implement two further modifications: first, we define distinct phases corresponding to each major stage of the sorting process, enabling a more accurate allocation of costs; second, we optimize the facility cost calculations to better represent facility-related expenses over different sorting phases and time.
The accumulated NPV of the total cost is calculated as follows:
- Notations:
- Ci,k,t: Cost per employee of type i, process phase k, year t;
- ni,k,t: Number of employees of type i, process phase k, year t;
- Cj,k,t: Cost per machine of type j, process phase k, year t;
- mj,k,t: Number of machines of type j, process phase k, year t;
- Cf,k,t: Facility costs of process phase k, year t;
- E: Set of all employee types;
- F: Set of all machinery types;
- G: Set of all process phases;
- N: Set of all project years.
- E, F, G, N ⊆ {1, 2, 3, …}
This modification allows us to evaluate the impact of the time value of money on the total cost over time, providing a more comprehensive understanding of the long-term financial feasibility of the CVAS system compared to the CS method.
The results of the sensitivity analysis are presented in this section. In each subsection, we analyze specific cost components supported by comparative data, graphical representations, and implications on competitiveness. In the presented sensitivity analysis graphs of the impact of different variables on the comparative cost of CVAS and CS methods in the following section, we apply dual x-axes for the values of variables in some of these graphs. The reason behind the adoption of dual x-axes is the utilization of different and proportionally changed baseline values for the variables of the CVAS and CS methods.
4.1. Sensitivity Analysis of Labor Costs
The labor cost variables include annual wages, number of employees (NoE), and training costs per person. The four assumption values, along with the baseline for these components, are shown in Table 3.
Table 3.
Labor cost with baseline and assumption values.
4.1.1. Number of Employees
As presented in Figure 3, the number of employees has a linear and direct impact on the total comparative cost. This is because the cost model presented in Section 3 is applied. The two scenarios represent different levels of automation, which is the main reason for the expected nonlinear relationship between workforce and throughput, a pattern that does not appear when each scenario is analyzed in isolation without changes in automation level.
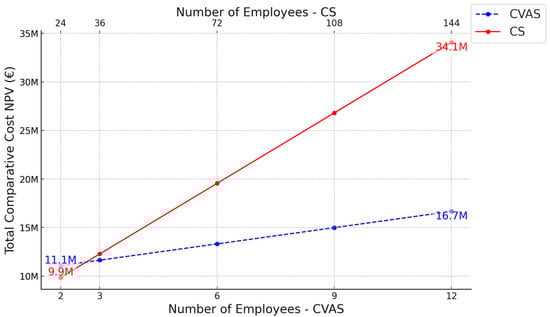
Figure 3.
Effects of the number of employees.
The CS line is significantly steeper than that of CVAS. The slope of the CS line is 558,209, meaning that for each additional employee, the total comparative cost increases by approximately EUR 558,209 over the 7-year period. In contrast, the CVAS line has a slope of 201,670, indicating a smaller increase of about EUR 201,670 per additional employee. This proves that CS is far more sensitive to changes in workforce size. This is because increasing the number of employees leads to a sharp rise in total expenses due to higher wages, overhead, and training costs. The rate of increase in the number of employees for CS is higher than that of CVAS.
CS relies heavily on manual labor, requiring a significantly larger workforce compared to CVAS. In the baseline values for the comparative stages, CS employs 72 employees, while CVAS operates with only 6, representing a 91.7% reduction in workforce size when switching to the automated method. This major decrease in labor utilization contributes substantially to the overall cost advantage of CVAS. As a result, the cost increase for CVAS remains relatively moderate, even as the number of employees fluctuates, while CS costs rise rapidly due to its labor-intensiveness.
On the lowest end of the sensitivity analysis, the total cost of CS is slightly lower than that of CVAS. However, even a small increase in the number of employees causes the total cost of CS to surpass that of CVAS. This means the CS process for recycling 30 tons of construction waste needs to utilize around 24 employees or less to become competitive with a similarly efficient CVAS, employing only 2 employees. Nevertheless, for CS, reducing the number of the employees by 66.7% (from 72 to 24) while performing the same amount of work is currently impossible.
To better understand the composition of cost changes for the two scenarios at the lowest end of the sensitivity analysis, we use Figure 4 to provide a breakdown of the total comparative costs.
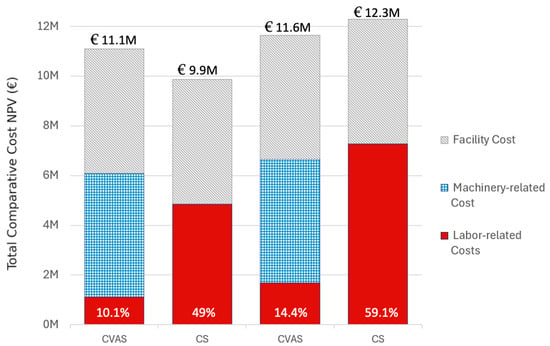
Figure 4.
Cost breakdown under lowest and lower workforce scenarios.
Figure 4 highlights the impact of workforce size on cost structure. For CS, a 50% increase in the number of employees raises the labor-related cost share from 49% to 59.1%, resulting in a EUR 2.4 million increase in total cost. This reflects the combined impact of labor and training expenses in an employee-intensive system. In contrast, CVAS shows higher reliance on initial investment in machinery, which does not exist in CS.
4.1.2. Wages
The impact of variations in annual personnel wages on the total comparative cost is shown in Figure 5. This component represents a major share of labor-related expenses. Variations in wages have a significant impact on the total cost, particularly for the CS method. Figure 5 illustrates a linear correlation between total comparative cost and wages for CS and CVAS, but the CS cost trajectory is substantially steeper due to its larger workforce. The slope of the CS line for wages is 289.2, indicating that for every EUR 1000 increase in annual wages, the total cost over the 7-year period rises by approximately EUR 289,150. The high sensitivity of CS to wage changes highlights its dependence on labor, making it vulnerable to wage fluctuation. As wages rise, CS becomes increasingly costly, reducing its long-term economic competitiveness.
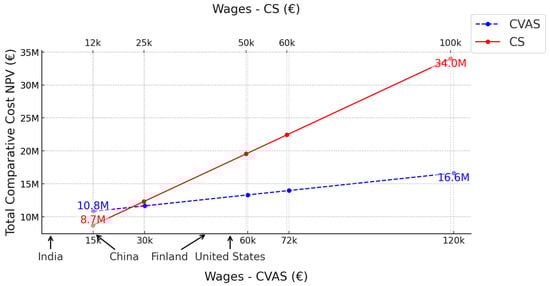
Figure 5.
Effects of annual personnel wages.
For CVAS, the slope is much lower, at 55.4, reflecting its reduced sensitivity to wage changes due to fewer employees. The effect of wage variation is relatively limited. With fewer employees needed for the system, changes in wage levels have a modest impact on the overall cost.
In the baseline scenario wages, although the CVAS wages are higher than those in CS, EUR 50,000 annual personnel wages for CS versus EUR 60,000 for CVAS (reflecting the need for more skilled technical staff), this does not result in a significant increase in total comparative cost. This is because CVAS requires far fewer personnel due to its high level of automation. When these two factors, wages and workforce size, are considered together, the higher per-person wages in CVAS are more than offset by the dramatic reduction in the number of employees.
To put this into perspective, we marked the names of the countries with different wage levels in Figure 5. All wage data are drawn from the 2024 Global Wage Report [27] and converted to nominal EUR using the 2024 yearly average currency exchange rates published by the U.S. Internal Revenue Service [28]. For example, the case company is based in Finland, where the annual wage is EUR 48,084. In contrast, the average annual wages in China (EUR 15,763) and India (EUR 2657) are significantly lower. Labor-related costs thus have a substantially larger impact on total comparative costs in high-wage economies such as the United States, where the average annual wage is EUR 55,776.
In China and India, which are low-wage countries, the wages result in the cost-competitiveness of CS over CVAS. Therefore, it is economically feasible to operate CS operations. EUR 20,980 is the breakeven value of wages for CVAS and CS. For higher wage levels that exceed EUR 20,980 (such as in Finland and the US), CVAS becomes more competitive, while for lower wages, CS gains competitiveness. International Labour Organization [27] reports that approximately 62% of the 79 countries surveyed in 2023 had an average annual wage below EUR 20,980. It should be noted that these cross-country wage comparisons are illustrative of labor cost sensitivity rather than full country-level assessments.
4.1.3. Training Cost
As shown in Figure 6, there is a linear relationship between the training cost and the total comparative cost of both CS and CVAS, and the impact of training cost variation is more pronounced for CS as it involves a higher number of employees. The slope of the CS line is 31.3, meaning that for each additional EUR 1000 spent per employee on training, the total cost increases by approximately EUR 31,304. For CVAS, the slope is 6, indicating a much lower impact.
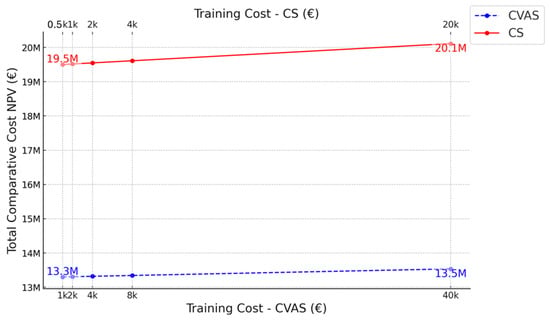
Figure 6.
Effects of training cost.
While CS and CVAS currently rely on traditional in-person training, a potential shift to virtual training can impact recurring costs, shorten preparation time, and standardize knowledge delivery across operators, resulting in a significant reduction in the overall cost of training. However, as Figure 6 presents, training costs represent only a small portion of the total comparative cost for CS and CVAS; therefore, its impact on overall financial outcome remains limited.
4.2. Sensitivity Analysis of Machinery Costs
4.2.1. Machinery Costs
Machinery costs here refer to the purchase of machinery and systems used in both CVAS and CS methods. As shown in Table 4, the baseline data from the previous study indicate a significant gap in both unit cost and the number of machines required for each method. For the CVAS method, two complementary machine types—Type 1 and 2 (a total of 14 units of machines where Type 1 comprises the optical and NIR sensor units, which perform material detection and identification, and Type 2 comprises the Zen robots’ sorting arms, which execute the physical pick-and-place of identified fractions) are required with prices of EUR 100,000 and EUR 300,000. The CS method relies on a single type of conventional mechanical sorting unit (shredder), with a baseline cost of EUR 50,000 per machine.
Table 4.
Machinery costs with baseline and assumption values.
This difference in initial investment structure creates a notable financial contrast between the two methods at the start of the 7-year cost analysis period. CVAS’s reliance on high-tech machinery results in a much higher initial investment requirement. CS, on the other hand, is apex-heavy and capex-light due to its simpler and lower cost of equipment and higher operational cost.
Figure 7 presents how varying machine costs affect financial outcomes. We use the average price of machinery for the CVAS x-axis. As expected, CVAS and CS cost trends are linear; CVAS is more sensitive to increases in machine unit price due to its reliance on high-tech equipment. The slope of the CVAS line is 20, indicating that for every EUR 100,000 reduction in machine unit cost, the total comparative cost declines by approximately EUR 2 million, whereas CS machinery is generally simpler, cheaper, and has lower price sensitivity with a slope of 0.5, showing a slight fluctuation for the same unit cost change. CVAS maintains its competitiveness when the average price of the machine is lower than EUR 512,000 (breakeven point). In contexts where government subsidies or technological advancements reduce the procurement costs of automated machinery, the initial investment barrier for CVAS is lowered, which in turn improves CVAS’s competitiveness.
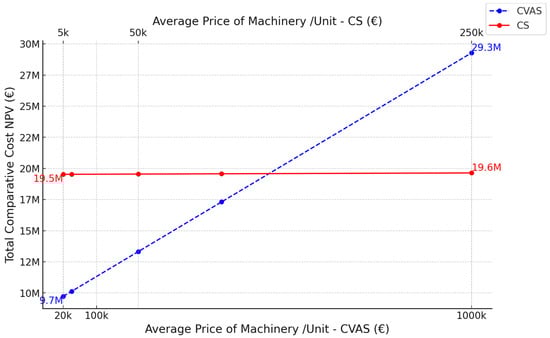
Figure 7.
Effects of machinery price.
4.2.2. Maintenance Costs
Table 5 outlines the maintenance cost assumptions used in the sensitivity analysis, which are calculated by different percentages of machinery value.
Table 5.
Maintenance costs with baseline and assumption values.
Due to the correlation between machine cost and maintenance cost, the variation trends in maintenance costs closely resemble those of machinery costs. As shown in Figure 8, both CVAS and CS exhibit linear trends, but the CVAS method is significantly more sensitive to maintenance cost fluctuations. This is primarily due to the greater complexity and higher value of the equipment involved.
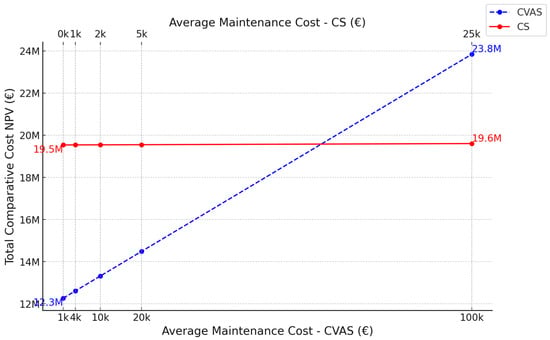
Figure 8.
Effects of maintenance costs.
4.3. Sensitivity Analysis of Discount Rate
The discount rate reflects the time value of money and plays a critical role in evaluating the NPV of long-term investments. As presented in Table 6, we use different discount rates to assess how the timing of project costs affects the total financial burden of the CVAS and CS methods. For simplicity, wage levels are assumed to remain constant over the seven years of the project span.
Table 6.
Discount rate with baseline and assumption values.
We use the NPV of comparative costs for CVAS and CS projects and compare them using the discount rate presented in Table 6. As illustrated in Figure 9, both CVAS and CS costs exhibit a nonlinear correlation with discount rates. As the discount rate increases, total comparative cost declines. This relationship follows a power function, where the rate of cost reduction slows as the discount rate grows.
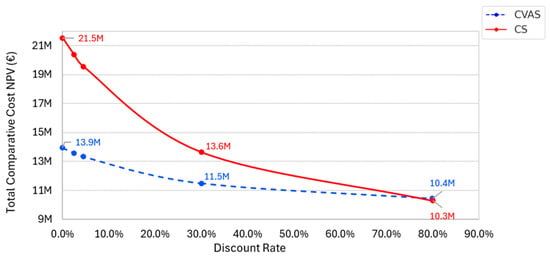
Figure 9.
Effects of discount rate on the competitiveness for CVAS and CS in Finland.
Notably, the CVAS cost curve appears flatter, indicating that its NPV is less sensitive to changes in the discount rate. This is primarily because CVAS incurs a large proportion of its total costs upfront, particularly through high initial investments in machinery. Since these early-stage expenses occur at the beginning of the project timeline, they are minimally affected by the discount rate. In contrast, the CS cost curve exhibits a steeper decline, especially at lower discount rates, reflecting greater sensitivity to discount rate variations. This is due to CS’s operational cost structure, which is driven by labor costs and maintenance expenses. As the discount rate rises, these operational costs are discounted more aggressively, resulting in a sharper reduction in their present value.
Quantitatively, increasing the discount rate from 0% to 80% results in a 52.1% reduction in the NPV of total cost for CS, compared to a 25.2% reduction for CVAS. CS benefits more significantly from higher discount rates due to the deferral of its major expenses. However, such extreme discount rates are uncommon in real-world financial settings. Therefore, CVAS remains more financially viable under most practical scenarios.
To better relate these findings to real-world conditions, we incorporate national-level discount rates into the analysis. For example, if all other variables assumed to remain constant, the cost-competitiveness gap of CS is smallest under Turkey’s discount rate (46%). This gap widens against CVAS as lower discount rates are applied in India (6%), the United States (4.5%), Europe (2.4%), and China (1.8%) [29,30,31,32,33]. This is due to the levels of the discount rate. In advanced countries with lower discount rates, CVAS remains more competitive than CS under the same baseline scenario. According to data from the European Central Bank [32], a 2.1% decrease in discount rates between 2023 and 2025 led to an NPV increase of EUR 0.3 million for CVAS and EUR 0.9 million for CS. Overall, the lower the discount rate, the more competitive CVAS becomes.
4.4. Summary of Results
Table 7 summarizes a consolidated overview of the findings across all discussed parameters.
Table 7.
Summary of sensitivity analysis results (7-year NPV-based comparison of CVAS vs. CS).
We conducted a real-world sensitivity analysis of a computer vision-enabled automated sorting (CVAS) deployment for construction waste recycling in Finland and compared it to a conventional sorting (CS) method. Building upon the cost model developed by Farshadfar et al. [2], we extended the analytical framework by incorporating NPV analysis to account for the time value of money and implemented a structured, phase-based approach to more accurately isolate and compare distinct operational phases.
The sensitivity analysis evaluated key variables, including the number of employees, wages, personnel training, initial machinery investment, maintenance operations, and discount rate. The results show that CVAS has a better economic performance in scenarios with higher labor-related costs (higher wages, number of employees, and training expenses) due to CVAS’s low labor dependency. The international wage data [27] utilized in this study provided further insight into how regional labor costs influence the relative financial viability of sorting methods. Specifically, in lower-wage countries such as China or India, the labor cost advantages of CS become more prominent, reducing the relative cost competitiveness of CVAS due to its smaller potential labor savings. Conversely, in higher-wage economies like Finland and the United States, CVAS clearly demonstrates its economic strengths, justifying its initial higher capital investment through substantial reductions in labor-related operational expenses. Furthermore, CVAS exhibits greater resilience to variations in the discount rate, highlighting its suitability for long-term financial stability. Based on data from the European Central Bank [32], a 2.1% decrease in the euro area discount rate between 2023 and 2025 increased the competitiveness of CVAS by increasing its total comparative cost by EUR 300,000 versus an increase of EUR 900,000 for CS. This underscores CVAS’s advantage in maintaining cost efficiency in interest rate changes. It should be noted that while discount rates above 40% are unusual in project finance, some emerging economies have reported such levels (e.g., Turkey reached around 46% in 2024). For this reason, our upper-bound value of 80% should be interpreted as a stress-test scenario to illustrate model robustness under extreme financial conditions, rather than as a decision-relevant benchmark.
Our findings also indicate scenarios where CS maintains cost advantages when machinery prices and maintenance expenses are the dominant cost components. In contexts characterized by lower upfront capital availability or limited technological infrastructure, CS remains economically attractive in the short term due to its simpler and more affordable machinery.
5. Discussion
5.1. Theoretical Implications
In high-wage, technologically advanced economies such as Finland, waste-management companies face two persistent pressures: increasingly stringent circular-economy regulation and ongoing labor shortages [34,35]. Drawing on disruption theory [36], we can see how the currently expensive, technology-intensive CVAS solution could become a disruptive force. Disruption typically begins at the top of the market, where the most sophisticated offerings compete, and then moves down the market as costs fall and access improves. Entering from the high end, CVAS for waste sorting can diffuse downward as the technology becomes more affordable, ultimately displacing labor-intensive methods in advanced economies where wages are high.
As the solution improves and is increasingly commoditized, adoption can extend to lower-wage countries as well. In this sense, early deployments in countries like Finland can serve as test beds for high-end sustaining innovations that may ultimately reshape the global waste-management industry.
Analyzing the case from the point of view of Roger’s innovation diffusion model [37,38], we can offer additional insights. In the CVAS case, the perceived relative advantage comes from higher sorting accuracy, stable throughput, and labor substitution versus manual picking; these benefits dominate adopter narratives while reliability concerns and ML upkeep still elevate perceived complexity. Because CVAS can be retrofitted into belt-and-pick workflows and plant control systems, compatibility is reasonably high; pilotable single-line deployments increase trialability, and line-level performances (purity, recovery, throughput) make performance observable, aligning neatly with Rogers’ five attributes that shape adoption speed.
Our comparative cost lens is consistent with early, high-capex process innovations: CVAS competitiveness rises with wages and personnel costs but weakens as machinery and maintenance outlays grow; over time, “learning-by-using” and experience-curve effects lower unit costs and improve uptime, shifting perceived risk and pushing diffusion from early- to late-majority adopters. Finnish automation pioneers like ZenRobotics in waste sorting [2] illustrate both the capital intensity and the data/service maturation path in this domain, while European Union waste policy [39] and EPR (extended producer responsibility) pressures increase the payoff of the accuracy and throughput improvements that automation delivers.
5.2. Practical Implications
From a solution-evolution perspective, and given current technical barriers, the next wave of developments may combine vison with LLM-based language-based reasoning [40]. Waste-sorting software can progressively shift from narrow, label-intensive CV toward vision-language models (VLMs) trained on aligned image–text data. Operationally, this enables faster onboarding of new waste fractions and labels with less relabeling, greater flexibility and accuracy in complex settings through richer contextual understanding, and a shorter positive feedback loop.
In this trajectory, a CV-VLM architecture can first handle only waste detection for sorting, then extend the VLM component capability to real-time robotic arm motion and approach planning [41,42,43]. This would allow the VLMs to coordinate multiple stations with many robotic arms for more efficient waste sorting [44]. Current VLMs’ shortcomings include the need for case-specific contextual training data, higher inference costs compared with conventional CV models, and a reliance on cloud rather than edge deployment. The emergence of small language models (SLMs)—an active and rapidly growing research area—can help to address localized deployment requirements [45,46].
5.3. Limitations and Future Research
This study contributes to the existing literature by providing a comprehensive financial sensitivity framework, which integrates detailed cost modeling, international contextualization, and practical cost-competitiveness insights. While this study is based on a single case, its representativeness lies in the fact that the analysis is grounded in a real-world deployment by a leading provider of robotic recycling solutions. As such, the findings capture the dynamics of a flagship implementation that sets technological and operational benchmarks for the industry.
Nevertheless, we acknowledge that broader external validity requires validation across multiple facilities, waste streams, multi-parameter scenarios, and national contexts. The applied scaling factor of 2.3 is case-specific, reflecting the throughput difference reported in the investigated facility. While this approach aligns with prior comparative studies, throughput values may vary across facilities and waste streams; future research should therefore test alternative scaling assumptions to enhance generalizability. In addition, downtime and failure rates were not explicitly modeled due to limited data, though their economic impact may be substantial. These effects are partly reflected in maintenance cost sensitivity, but future studies should explicitly integrate reliability and system availability metrics into cost models.
To further strengthen external validity and capture a wider range of operational and economic conditions, future research should validate the model across diverse geographical contexts, waste stream compositions, and facility types. Other valuable directions include analyzing real-world operational performance data to verify modeled assumptions, assessing regional variations in return on investment (ROI), and exploring the scalability and adaptability of CVAS across different global markets. Because detailed sector-specific wage data and vendor-style operating expense breakdowns were not available, we approximated these effects by applying higher overall wage levels for CVAS and modeling maintenance at 5% of machinery acquisition cost, validated through industry interviews. Future work should refine the model with more granular data when available. While our paper focuses primarily on cost, future research could extend the framework to include revenue-side impacts. Also, this analysis is deterministic and does not include confidence intervals; future research should apply probabilistic methods to capture uncertainty ranges.
6. Conclusions
We present a comprehensive sensitivity analysis of a real-world deployment of a CVAS system for construction waste management in Finland. By extending prior cost models with an NPV framework, the study systematically evaluated the economic feasibility of CVAS compared to CS under varying labor, training, machinery, maintenance, and discount rate.
The results show that CVAS becomes increasingly cost-competitive in contexts characterized by high labor intensity, elevated wage levels, and significant training requirements. For example, when annual wages exceed EUR 20,980, CVAS demonstrates clear cost advantages, primarily due to its ability to reduce workforce size by up to 91.7% in same throughput. This effect is especially relevant in high-wage contexts such as Finland (EUR 48,084) and the United States (EUR 55,776). Conversely, CS retains financial benefits when capital-intensive factors dominate, such as in scenarios with average machinery costs above EUR 512,000 per unit or with unusually high discount rates. These findings highlight the critical role of contextual factors such as wage levels, investment environments, and equipment pricing in shaping the relative competitiveness of automated versus conventional approaches.
Overall, this research bridges a critical gap in the literature by linking technical advancements in AI- and robotics-enabled sorting with their financial implications. The findings provide practical guidance for policymakers, facility operators, and technology providers considering the large-scale deployment of CVAS. Future studies should extend this work by testing the model across diverse geographical contexts, incorporating real-world reliability and downtime data, and assessing revenue-side benefits such as improved material recovery rates and market value of the sorted outputs.
Author Contributions
Conceptualization, X.L., Z.F. and S.H.K.; Data curation, X.L. and Z.F.; Formal analysis, X.L., Z.F. and S.H.K.; Funding acquisition, S.H.K.; Investigation, Z.F. and S.H.K.; Methodology, X.L., Z.F. and S.H.K.; Project administration, S.H.K.; Resources, Z.F. and S.H.K.; Software, X.L.; Supervision, S.H.K.; Validation, X.L., Z.F. and S.H.K.; Visualization, X.L.; Writing—original draft, X.L. and Z.F.; Writing—review and editing, X.L. and S.H.K. All authors have read and agreed to the published version of the manuscript.
Funding
This research received no external funding.
Data Availability Statement
The data presented in this study are reflected in the main text.
Conflicts of Interest
The authors declare no conflicts of interest.
Abbreviations
| NPV | Net present value |
| C&D | Construction and demolition |
| CE | Circular economy |
| CS | Conventional sorting |
| CV | Computer vision |
| ML | Machine learning |
| AI | Artificial intelligence |
| CVAS | Computer vision-enabled automated sorting |
| EPR | Extended producer responsibility |
| VLMs | Vision-language models |
| SLMs | Small language models |
References
- Demetriou, D.; Mavromatidis, P.; Petrou, M.F.; Nicolaides, D. CODD: A Benchmark Dataset for the Automated Sorting of Construction and Demolition Waste. Waste Manag. 2024, 178, 35–45. [Google Scholar] [CrossRef]
- Farshadfar, Z.; Khajavi, S.H.; Mucha, T.; Tanskanen, K. Machine Learning-Based Automated Waste Sorting in the Construction Industry: A Comparative Competitiveness Case Study. Waste Manag. 2025, 194, 77–87. [Google Scholar] [CrossRef]
- Ortiz, O.; Pasqualino, J.C.; Castells, F. Environmental Performance of Construction Waste: Comparing Three Scenarios from a Case Study in Catalonia, Spain. Waste Manag. 2010, 30, 646–654. [Google Scholar] [CrossRef]
- Gao, Y.; Wang, J.; Xu, X. Machine Learning in Construction and Demolition Waste Management: Progress, Challenges, and Future Directions. Autom. Constr. 2024, 162, 105380. [Google Scholar] [CrossRef]
- Sirimewan, D.; Bazli, M.; Raman, S.; Mohandes, S.R.; Kineber, A.F.; Arashpour, M. Deep Learning-Based Models for Environmental Management: Recognizing Construction, Renovation, and Demolition Waste in-the-Wild. J. Environ. Manag. 2024, 351, 119908. [Google Scholar] [CrossRef]
- Sarc, R.; Curtis, A.; Kandlbauer, L.; Khodier, K.; Lorber, K.E.; Pomberger, R. Digitalisation and Intelligent Robotics in Value Chain of Circular Economy Oriented Waste Management—A Review. Waste Manag. 2019, 95, 476–492. [Google Scholar] [CrossRef] [PubMed]
- Davis, P.; Aziz, F.; Newaz, M.T.; Sher, W.; Simon, L. The Classification of Construction Waste Material Using a Deep Convolutional Neural Network. Autom. Constr. 2021, 122, 103481. [Google Scholar] [CrossRef]
- Demetriou, D.; Mavromatidis, P.; Robert, P.M.; Papadopoulos, H.; Petrou, M.F.; Nicolaides, D. Real-Time Construction Demolition Waste Detection Using State-of-the-Art Deep Learning Methods; Single–Stage vs Two-Stage Detectors. Waste Manag. 2023, 167, 194–203. [Google Scholar] [CrossRef]
- Hu, K.; Chen, Y.; Naz, F.; Zeng, C.; Cao, S. Separation Studies of Concrete and Brick from Construction and Demolition Waste. Waste Manag. 2019, 85, 396–404. [Google Scholar] [CrossRef]
- Hyvärinen, M.; Ronkanen, M.; Kärki, T. Sorting Efficiency in Mechanical Sorting of Construction and Demolition Waste. Waste Manag. Res. 2020, 38, 812–816. [Google Scholar] [CrossRef] [PubMed]
- Nežerka, V.; Zbíral, T.; Trejbal, J. Machine-Learning-Assisted Classification of Construction and Demolition Waste Fragments Using Computer Vision: Convolution versus Extraction of Selected Features. Expert Syst. Appl. 2024, 238, 121568. [Google Scholar] [CrossRef]
- Dong, Z.; Yuan, L.; Yang, B.; Xue, F.; Lu, W. Benchmarking Computer Vision Models for Automated Construction Waste Sorting. Resour. Conserv. Recycl. 2025, 213, 108026. [Google Scholar] [CrossRef]
- Farshadfar, Z.; Mucha, T.; Tanskanen, K. Leveraging Machine Learning for Advancing Circular Supply Chains: A Systematic Literature Review. Logistics 2024, 8, 108. [Google Scholar] [CrossRef]
- Ranjbar, I.; Ventikos, Y.; Arashpour, M. Deep Learning-Based Construction and Demolition Plastic Waste Classification by Resin Type Using RGB Images. Resour. Conserv. Recycl. 2025, 212, 107937. [Google Scholar] [CrossRef]
- HaitherAli, H.; Anjali, G. Sustainable Urban Development: Evaluating the Potential of Mineral-Based Construction and Demolition Waste Recycling in Emerging Economies. Sustain. Futur. 2024, 7, 100179. [Google Scholar] [CrossRef]
- Lakhouit, A.; Shaban, M. Exploring Sustainable Solutions with Machine Learning Algorithms: A Focus on Construction Waste Management. Clean Technol. Environ. Policy 2025, 27, 1297–1310. [Google Scholar] [CrossRef]
- Samal, C.G.; Biswal, D.R.; Udgata, G.; Pradhan, S.K. Estimation, Classification, and Prediction of Construction and Demolition Waste Using Machine Learning for Sustainable Waste Management: A Critical Review. Constr. Mater. 2025, 5, 10. [Google Scholar] [CrossRef]
- Lu, W.; Long, W.; Yuan, L. A Machine Learning Regression Approach for Pre-Renovation Construction Waste Auditing. J. Clean. Prod. 2023, 397, 136596. [Google Scholar] [CrossRef]
- Chen, X.; Huang, H.; Liu, Y.; Li, J.; Liu, M. Robot for Automatic Waste Sorting on Construction Sites. Autom. Constr. 2022, 141, 104387. [Google Scholar] [CrossRef]
- Ige, A.B.; Adepoju, P.A.; Akinade, A.O.; Afolabi, A.I. Machine Learning in Industrial Applications: An In-Depth Review and Future Directions. Int. J. Multidiscip. Res. Growth Eval. 2025, 6, 36–44. [Google Scholar] [CrossRef]
- Datta, S.D.; Islam, M.; Sobuz, M.H.R.; Ahmed, S.; Kar, M. Artificial Intelligence and Machine Learning Applications in the Project Lifecycle of the Construction Industry: A Comprehensive Review. Heliyon 2024, 10, e26888. [Google Scholar] [CrossRef] [PubMed]
- Ku, Y.; Yang, J.; Fang, H.; Xiao, W.; Zhuang, J. Deep Learning of Grasping Detection for a Robot Used in Sorting Construction and Demolition Waste. J. Mater. Cycles Waste Manag. 2021, 23, 84–95. [Google Scholar] [CrossRef]
- Lin, K.; Zhao, Y.; Zhou, T.; Gao, X.; Zhang, C.; Huang, B.; Shi, Q. Applying Machine Learning to Fine Classify Construction and Demolition Waste Based on Deep Residual Network and Knowledge Transfer. Environ. Dev. Sustain. 2023, 25, 8819–8836. [Google Scholar] [CrossRef]
- Kroell, N.; Thor, E.; Göbbels, L.; Schönfelder, P.; Chen, X. Deep Learning-Based Prediction of Particle Size Distributions in Construction and Demolition Waste Recycling Using Convolutional Neural Networks on 3D Laser Triangulation Data. Constr. Build. Mater. 2025, 466, 140214. [Google Scholar] [CrossRef]
- McNicoll, A.; Blendis, S. Green Machine: Intelligent Robot System Recycles Waste. CNN. 2013. Available online: https://edition.cnn.com/2013/06/07/tech/zenrobotics-recycling-robot (accessed on 22 August 2025).
- Kau, W. Vocational Education and Training—The European Research Field; Office for Official Publ. of the European Communities: Luxembourg, 1998; ISBN 978-92-828-3613-2. [Google Scholar]
- International Labour Organization. Global Wage Report 2024/25: Wage Inequality Decreasing Globally. Available online: https://www.ilo.org/publications/flagship-reports/global-wage-report-2024-25-wage-inequality-decreasing-globally (accessed on 22 August 2025).
- Internal Revenue Service. Yearly Average Currency Exchange Rates. U.S. Department of the Treasury; 2024. Available online: https://www.irs.gov/individuals/international-taxpayers/yearly-average-currency-exchange-rates (accessed on 22 August 2025).
- Trading Economics. India Interest Rate. 2025. Available online: https://tradingeconomics.com/india/interest-rate (accessed on 25 August 2025).
- Trading Economics. Turkey Interest Rate. 2025. Available online: https://tradingeconomics.com/turkey/interest-rate (accessed on 25 August 2025).
- Federal Reserve. Selected Interest Rates (H.15). Board of Governors of the Federal Reserve System; 2024. Available online: https://www.federalreserve.gov/releases/h15/ (accessed on 25 August 2025).
- European Central Bank. Key ECB Interest Rates. 2025. Available online: https://www.ecb.europa.eu/stats/policy_and_exchange_rates/key_ecb_interest_rates/html/index.en.html (accessed on 20 August 2025).
- People’s Bank of China. Loan Prime Rate (LPR) Data. 2024. Available online: http://www.pbc.gov.cn/zhengcehuobisi/125207/125213/125440/125838/125885/125896/5217456/index.html (accessed on 25 August 2025).
- European Commission. 2023 Country Report—Finland; European Economy, Institutional Paper 250; Publications Office of the European Union: Luxembourg, 2023; ISBN 978-92-68-03217-6. Available online: https://economy-finance.ec.europa.eu/system/files/2023-06/ip250_en.pdf (accessed on 25 August 2025).
- European Labour Authority (EURES). Labour Market Information: Finland. Available online: https://eures.europa.eu/living-and-working/labour-market-information/labour-market-information-finland_en (accessed on 25 August 2025).
- Christensen, C.M. The Innovator’s Dilemma: When New Technologies Cause Great Firms to Fail; Harvard Business Review Press: Boston, MA, USA, 2015. [Google Scholar]
- Rogers, E.M. Chapter 7. In Diffusion of Innovations; Free Press of Glencoe (The Macmillan Company): New York, NY, USA, 1962; pp. 240–270. [Google Scholar]
- Rogers, E.M. Chapter 3. In Diffusion of Innovations; Free Press of Glencoe (The Macmillan Company): New York, NY, USA, 1962; pp. 86–133. [Google Scholar]
- European Union. Directive (EU) 2018/851 of the European Parliament and of the Council of 30 May 2018 amending Directive 2008/98/EC on waste. Off. J. Eur. Union 2018, L 150, 109–140. Available online: https://eur-lex.europa.eu/eli/dir/2018/851/oj/eng (accessed on 20 August 2025).
- Faqeer, H.A.; Khajavi, S.H. Digital Twin and Computer Vision Combination for Manufacturing and Operations: A Systematic Literature Review. Appl. Sci. 2025, 15, 10157. [Google Scholar] [CrossRef]
- Brohan, A.; Brown, N.; Carbajal, J.; Chebotar, Y.; Dabis, J.; Finn, C.; Gopalakrishnan, K.; Hausman, K.; Herzog, A.; Hsu, J.; et al. RT-1: Robotics Transformer for Real-World Control at Scale. arXiv 2023, arXiv:2212.06817. [Google Scholar] [CrossRef]
- Huang, W.; Wang, C.; Zhang, R.; Li, Y.; Wu, J.; Fei-Fei, L. VoxPoser: Composable 3D Value Maps for Robotic Manipulation with Language Models. arXiv 2023. [Google Scholar] [CrossRef]
- Rana, K.; Haviland, J.; Garg, S.; Abou-Chakra, J.; Reid, I.; Suenderhauf, N. SayPlan: Grounding Large Language Models Using 3D Scene Graphs for Scalable Robot Task Planning. arXiv 2023. [Google Scholar] [CrossRef]
- Ichter, B.; Brohan, A.; Chebotar, Y.; Finn, C.; Hausman, K.; Herzog, A.; Ho, D.; Ibarz, J.; Irpan, A.; Jang, E.; et al. Do As I Can, Not As I Say: Grounding Language in Robotic Affordances. arXiv 2023. [Google Scholar] [CrossRef]
- Lu, Z.; Li, X.; Cai, D.; Yi, R.; Liu, F.; Liu, W.; Luan, J.; Zhang, X.; Lane, N.D.; Xu, M. Demystifying Small Language Models for Edge Deployment. Assoc. Comput. Linguist. 2025, 1, 14747–14764. [Google Scholar] [CrossRef]
- Radford, A.; Kim, J.W.; Hallacy, C.; Ramesh, A.; Goh, G.; Agarwal, S.; Sastry, G.; Askell, A.; Mishkin, P.; Clark, J.; et al. Learning Transferable Visual Models from Natural Language Supervision. In International Conference on Machine Learning; PmLR: Cambridge, MA, USA, 2021; Volume 139, pp. 8748–8763. [Google Scholar]
Disclaimer/Publisher’s Note: The statements, opinions and data contained in all publications are solely those of the individual author(s) and contributor(s) and not of MDPI and/or the editor(s). MDPI and/or the editor(s) disclaim responsibility for any injury to people or property resulting from any ideas, methods, instructions or products referred to in the content. |
© 2025 by the authors. Licensee MDPI, Basel, Switzerland. This article is an open access article distributed under the terms and conditions of the Creative Commons Attribution (CC BY) license (https://creativecommons.org/licenses/by/4.0/).