1. Introduction
Shoulder radiography remains a fundamental modality for initial diagnosis in the musculoskeletal domain. The true anteroposterior (true-AP) view plays a particularly crucial role in evaluating the glenohumeral joint and subacromial space, serving as an essential tool for detecting pathological findings such as joint space narrowing, Hill–Sachs lesions, and changes in acromiohumeral distance [
1,
2]. Despite its diagnostic importance, obtaining consistently adequate image quality presents significant challenges in clinical practice. Even slight deviations in radiographic positioning parameters, including trunk rotation, X-ray tube angulation, and upper extremity rotation, can cause anatomical structure overlap, compromising diagnostic accuracy and necessitating retake examinations [
3].
In general projection radiography, retakes are reported at approximately 10% depending on facility and study period [
4,
5]. Although shoulder-specific breakdowns are limited, suboptimal positioning is a common contributor, and appropriate positioning remains essential for shoulder projections, including the true anteroposterior view. This elevated retake rate represents a multifaceted problem in clinical radiology. It increases cumulative patient radiation exposure, reduces examination efficiency, prolongs patient wait times, and results in inefficient utilization of medical resources. The cumulative effect of these issues impacts both patient care quality and healthcare system efficiency, highlighting the need for systematic approaches to quality improvement in shoulder radiography [
4].
Traditional quality assurance in radiography has relied primarily on the empirical judgment of experienced radiographers and retrospective quality audits. While these approaches have served as the cornerstone of radiographic quality control, they possess inherent limitations. The subjective nature of visual assessment leads to inter-observer variability, even among experienced professionals. Additionally, the dependency on human resources constrains scalability and real-time feedback capabilities, particularly in high-volume clinical settings or facilities with limited expert staffing [
6,
7]. These limitations underscore the need for objective, automated quality assessment systems that can provide consistent and immediate feedback.
Recent advances in deep learning technology have demonstrated promising applications in medical image quality assessment. Convolutional neural network (CNN)-based systems have achieved significant success in chest radiography and mammography, where automated quality evaluation has shown clinical utility in detecting positioning errors, identifying artifacts, and ensuring diagnostic adequacy [
8,
9]. These successes suggest the potential for similar applications in musculoskeletal imaging. However, the translation of these technologies to musculoskeletal radiography, particularly shoulder imaging, remains relatively unexplored.
The availability of large-scale annotated datasets has been a critical factor in advancing deep learning applications in medical imaging. The MURA (musculoskeletal radiographs) dataset, comprising 40,561 upper extremity radiographs from 12,173 patients across seven anatomical regions, represents a valuable resource for developing and validating AI systems in musculoskeletal imaging [
10]. In upper-limb radiography, deep-learning studies have primarily focused on abnormality detection, fracture identification, and disease classification [
10,
11,
12]. The specific challenge of automated quality assessment for immediate retake determination—a practical need at the point of image acquisition—has received limited attention in the literature.
The implementation of AI systems in clinical radiology faces a critical requirement beyond performance metrics: explainability. Healthcare professionals require understanding of AI decision-making processes to trust and effectively utilize these systems [
13,
14]. The “black box” nature of deep learning models poses a significant barrier to clinical adoption, particularly in scenarios where AI recommendations directly influence patient care decisions. Visualization techniques such as gradient-weighted class activation mapping (Grad-CAM) have emerged as valuable tools for interpreting CNN decisions by highlighting image regions that contribute to model predictions [
15]. However, the application of these explainability methods in musculoskeletal radiography quality assessment remains largely unexplored.
A key gap in current explainability research is the lack of quantitative validation against expert judgment. While many studies present qualitative visualizations of model attention, few have established objective metrics to measure the concordance between AI-generated attention maps and the regions that expert radiographers consider diagnostically relevant [
16]. This gap is particularly pronounced in shoulder radiography, where the complex anatomical relationships and subtle positioning variations require precise localization of assessment criteria. The development of quantitative explainability metrics that align with expert consensus represents a critical need for advancing clinically acceptable AI systems.
The anatomical complexity of the shoulder joint presents unique challenges for automated quality assessment. Unlike chest radiography, where standardized landmarks are relatively consistent across patients, shoulder anatomy exhibits significant individual variation in bone morphology, joint angles, and soft tissue profiles. This variability necessitates approaches that can adaptively focus on relevant anatomical structures while maintaining robustness to patient-specific variations. The concept of anatomical localization—explicitly identifying and focusing on specific joint structures—mirrors the visual workflow of experienced radiographers who systematically evaluate specific anatomical relationships when assessing image quality.
Current object detection technologies, particularly those based on the YOLO (you only look once) family of architectures, have demonstrated remarkable success in identifying and localizing anatomical structures in medical images [
17,
18]. The evolution to YOLOX represents further improvements in detection accuracy and computational efficiency [
19]. Similarly, advanced CNN architectures combining inception modules with residual connections, such as Inception-ResNet-v2, have shown superior performance in medical image classification tasks [
20,
21,
22,
23]. The integration of these complementary technologies—object detection for anatomical localization and sophisticated CNNs for quality classification—presents an opportunity to develop systems that mirror human visual assessment workflows. Rather than proposing a new algorithm, we present a task-tailored two-stage pipeline that adapts established detection/classification models to shoulder true-AP QA and integrates Grad-CAM-based explanations.
The clinical workflow implications of automated quality assessment extend beyond technical performance. An effective system must provide immediate feedback at the point of image acquisition, enabling radiographers to make informed decisions about retake necessity before patient departure. This requirement necessitates not only accurate assessment, but also computational efficiency compatible with clinical imaging systems. Furthermore, the system must provide interpretable outputs that radiographers can understand and verify, supporting rather than replacing professional judgment [
24,
25].
The purpose of this study is to develop and validate an automated quality assessment system for shoulder true-AP radiographs that addresses these multifaceted challenges. Our approach employs a two-stage deep learning pipeline designed to mirror the human visual assessment process: first localizing the relevant anatomical region, then performing focused quality evaluation. This methodology aims to achieve three critical objectives: (1) providing objective, consistent quality assessment that reduces unnecessary retake examinations; and (2) ensuring clinical interpretability through quantitative explainability metrics that align with expert judgment. By addressing these objectives, this research seeks to establish a foundational framework for AI-assisted quality control in shoulder radiography, with potential implications for broader applications in musculoskeletal imaging.
2. Materials and Methods
2.1. Study Design and Workflow Overview
This retrospective study utilized the publicly available MURA v1.1 (musculoskeletal radiographs) dataset [
10]. The dataset comprises 40,561 upper-extremity radiographs from 12,173 patients, covering seven anatomical regions: elbow, finger, forearm, hand, humerus, shoulder, and wrist. For this analysis, we focused exclusively on anteroposterior shoulder radiographs from the “SHOULDER” folder within the MURA dataset. We initially identified 2956 shoulder AP radiographs. Of these, 59 images were excluded due to negative–positive inversion, excessive metallic implants, extreme over- or under-exposure, or presumed fluoroscopic acquisition. Three radiographers independently reviewed all remaining images and assigned OK/NG quality labels by consensus. We then constructed a class-balanced dataset of 2800 shoulder radiographs (1400 OK and 1400 NG) for model development. Pre-adjudication inter-rater agreement statistics were not recorded for all cases.
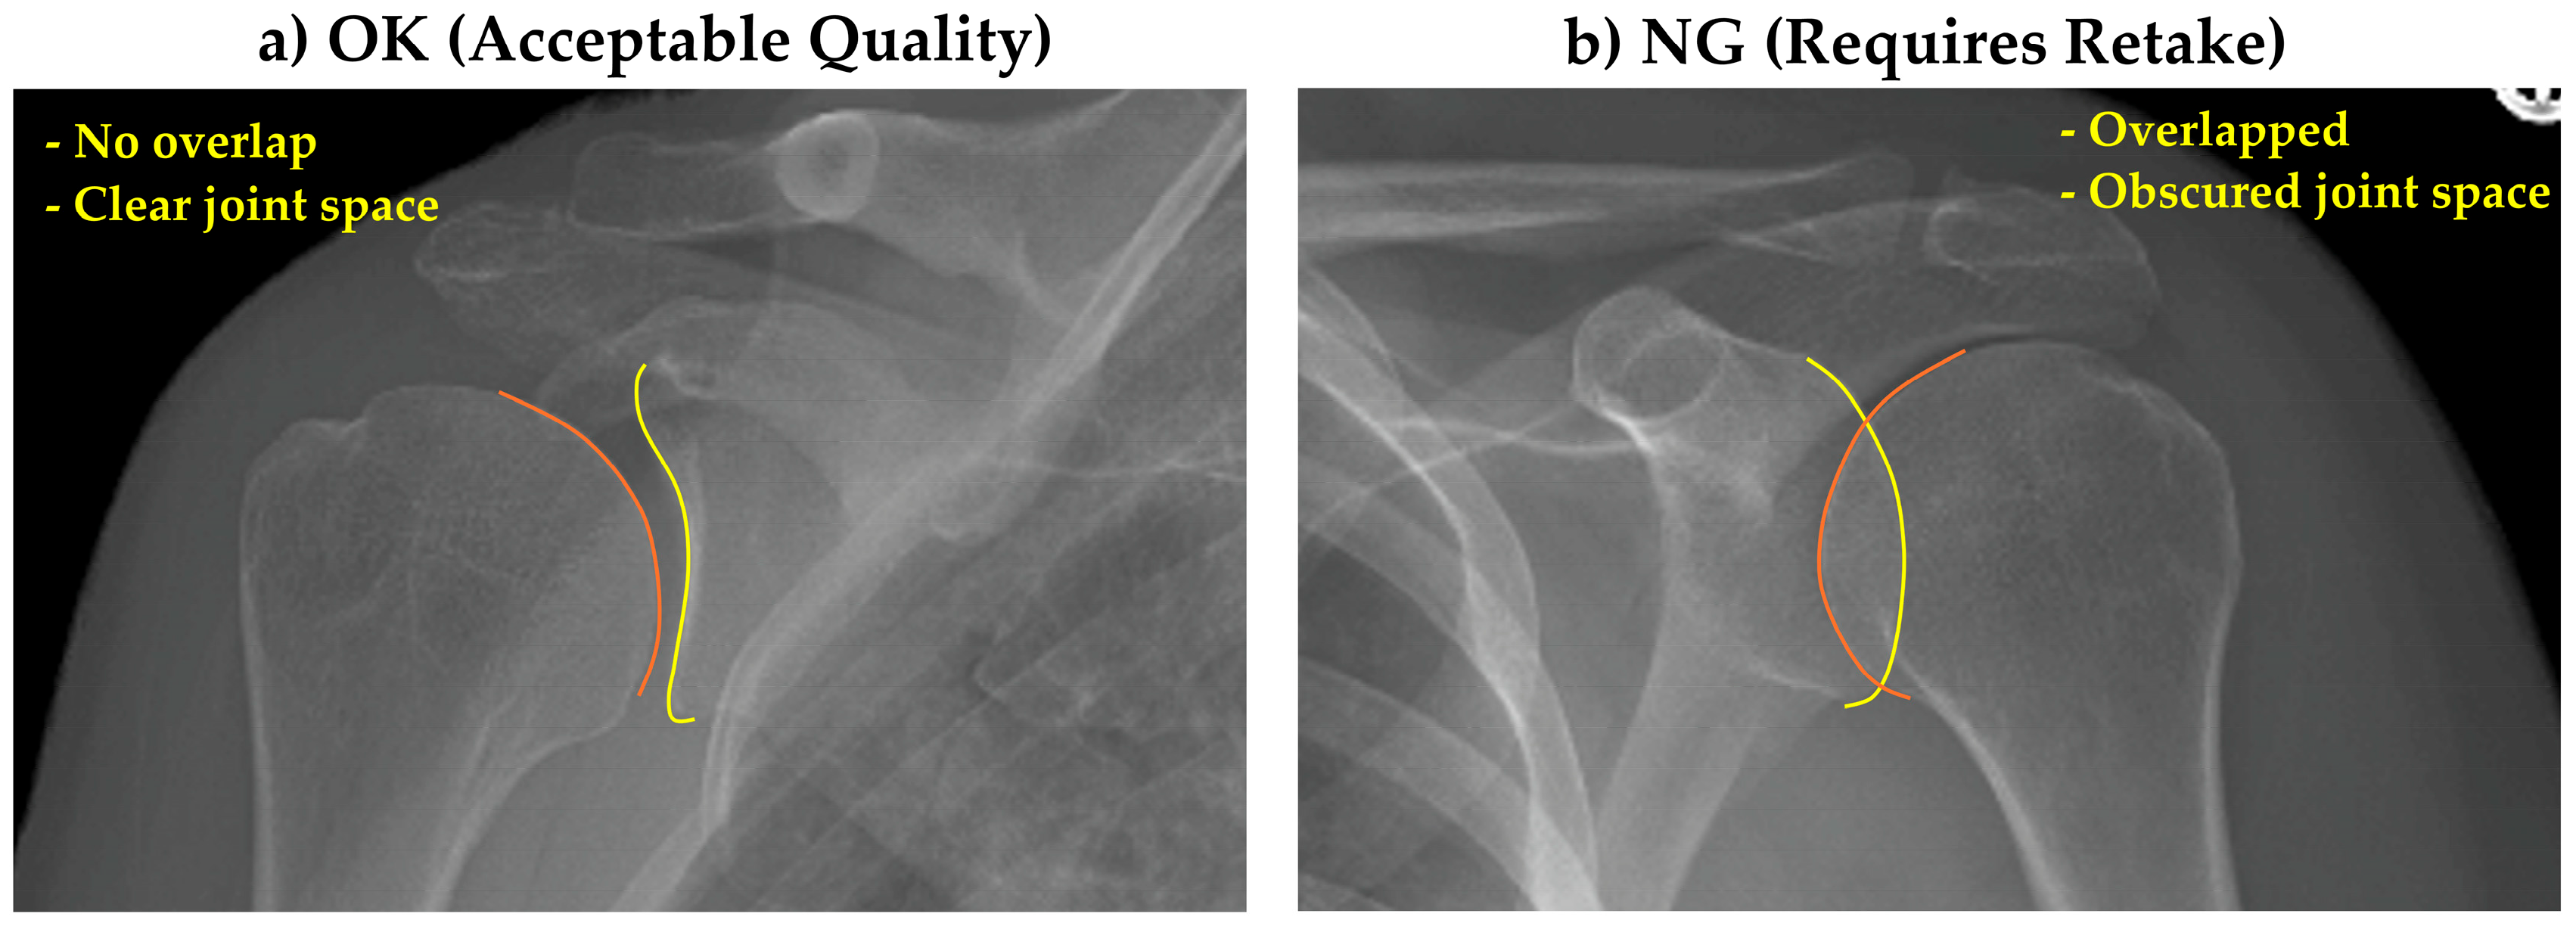
All images were provided in PNG format with varying dimensions. As preprocessing steps, rectangular images were zero-padded to create square dimensions, then resized to 512 × 512 pixels. Single-channel images were replicated across three channels for consistency. Image quality assessment criteria were established through consensus among three radiographers. Images showing clear glenohumeral joint space without excessive overlap between the humeral head and glenoid were classified as “OK” (acceptable quality), while those with significant anatomical overlap obscuring the joint space were classified as “NG” (requiring retake) (
Figure 1).
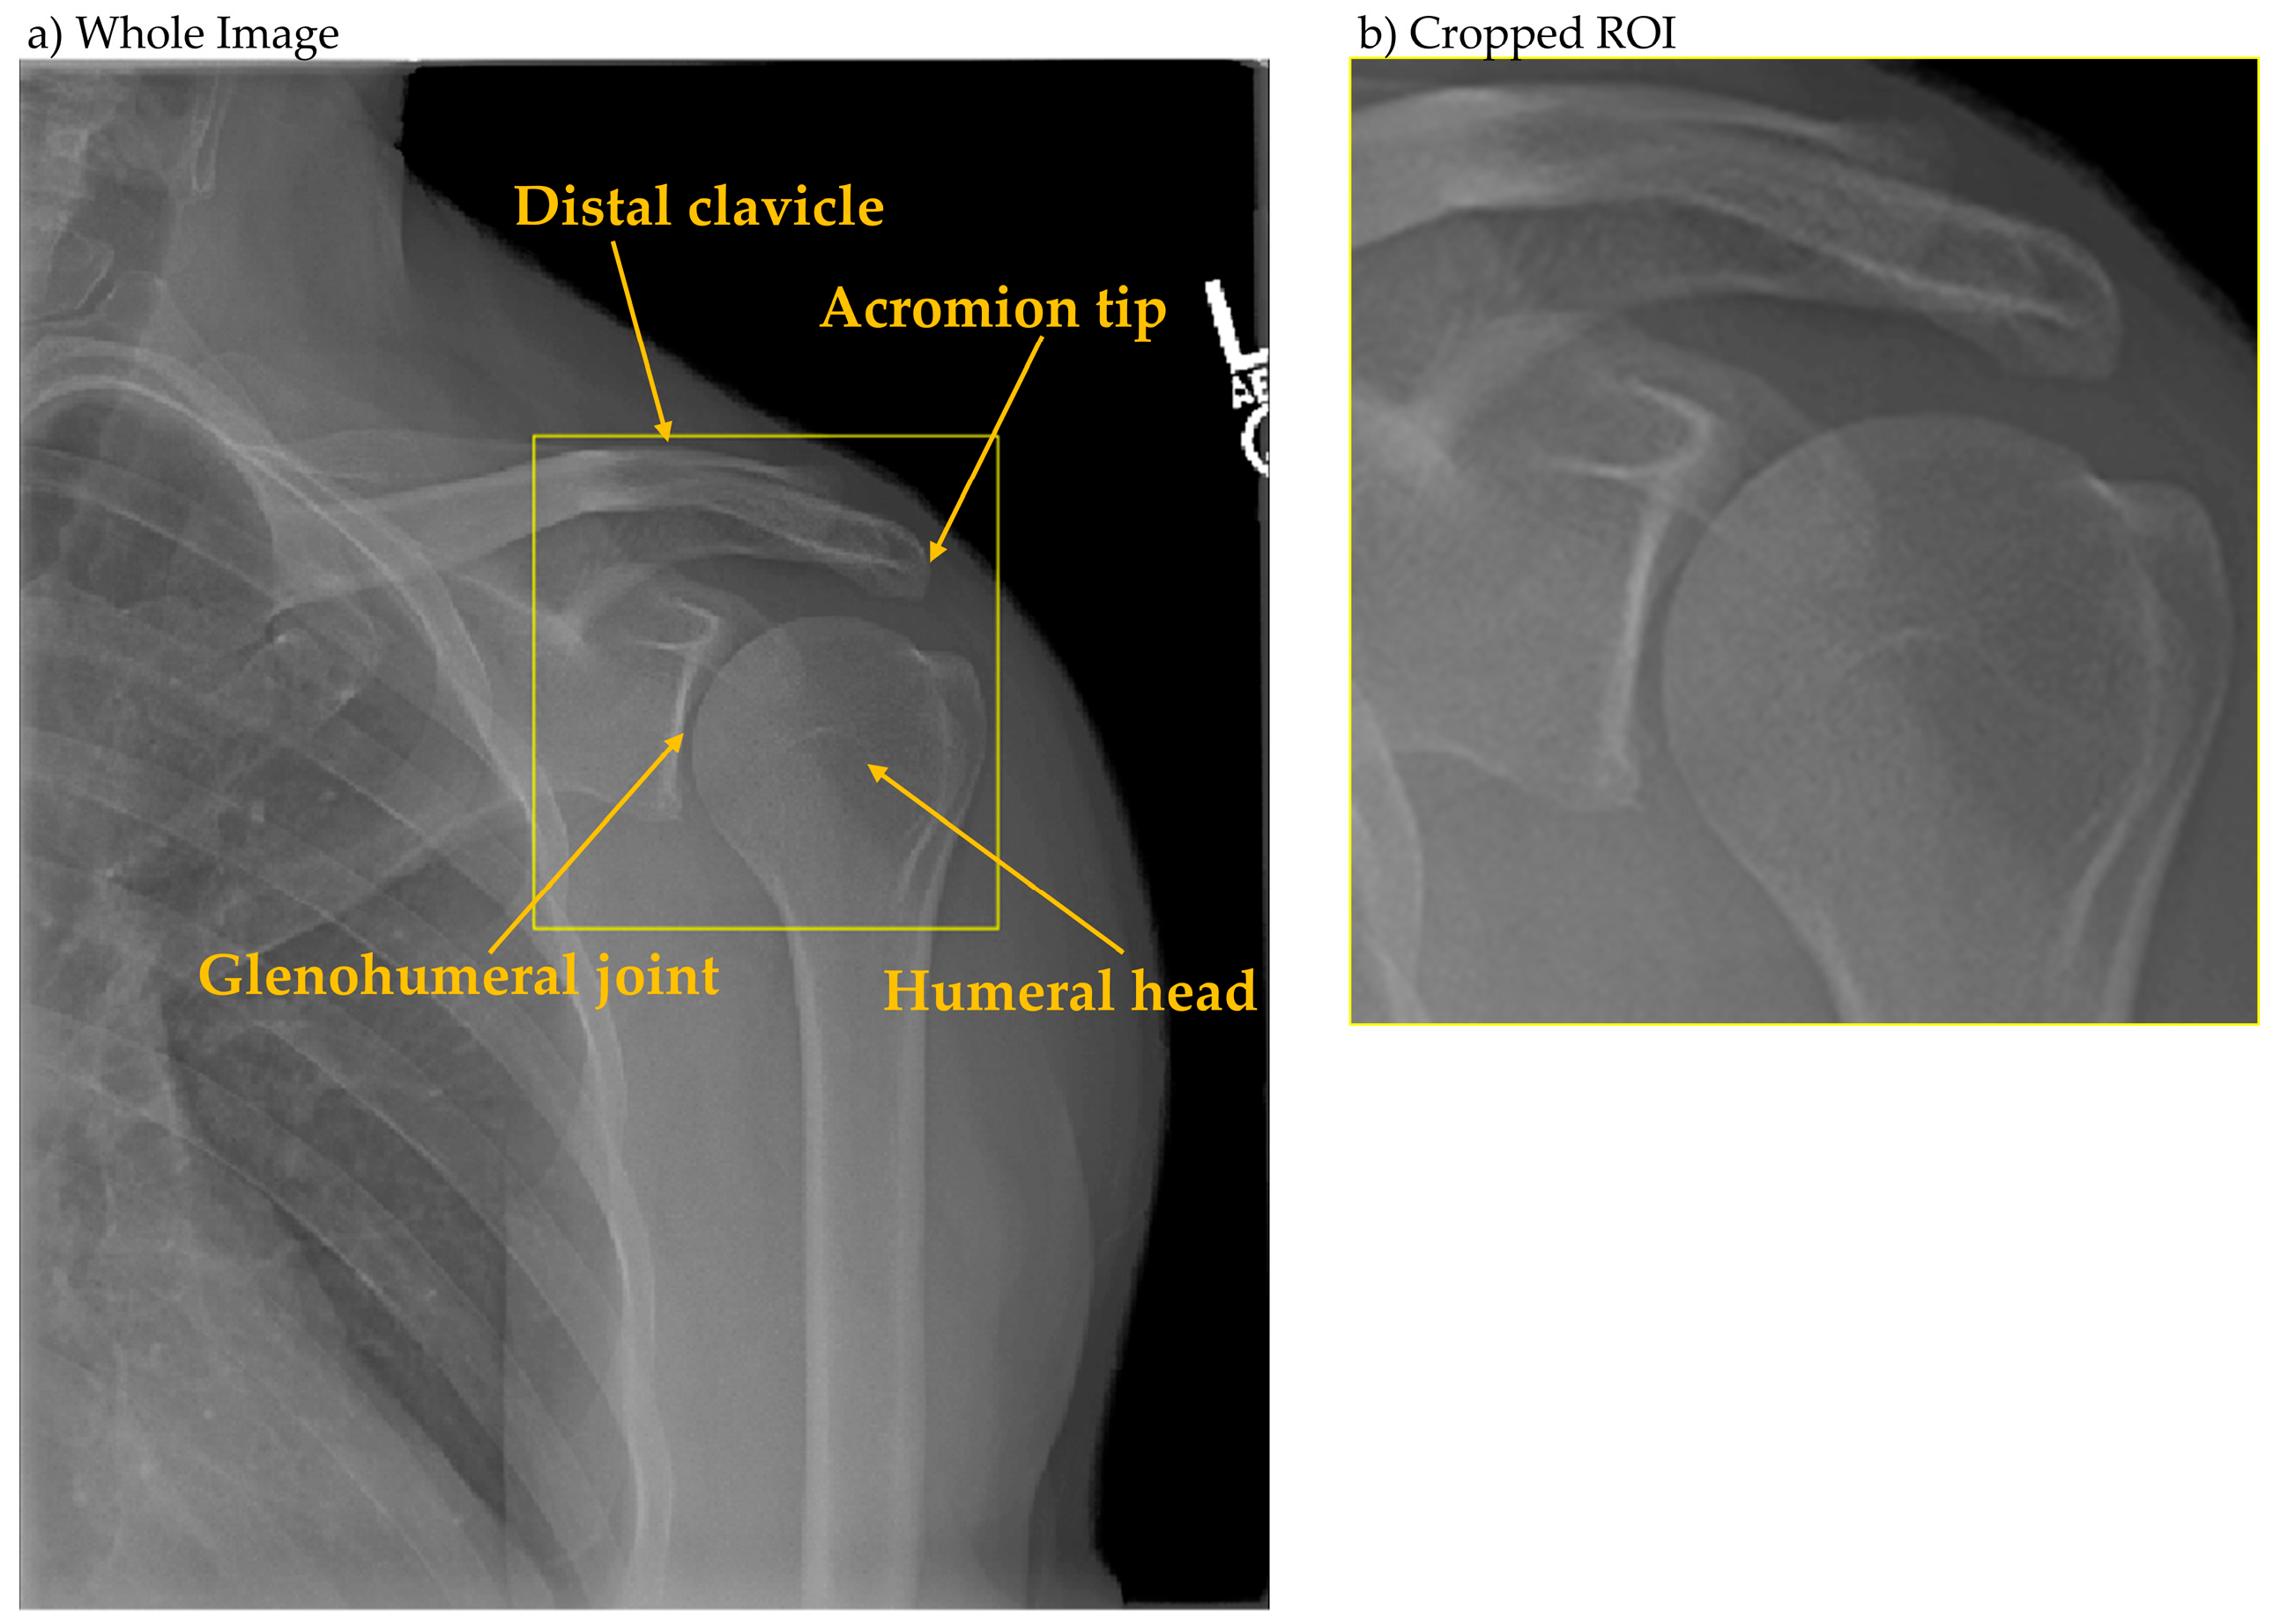
The analytical framework employed a two-stage deep learning pipeline. Stage one utilized YOLOX [
19] for glenohumeral joint detection, with the region of interest defined as encompassing the acromion tip, humeral head, and glenohumeral joint space (
Figure 2). Ground truth bounding boxes were established through consensus annotation by three radiographers. Stage two employed Inception-ResNet-v2 [
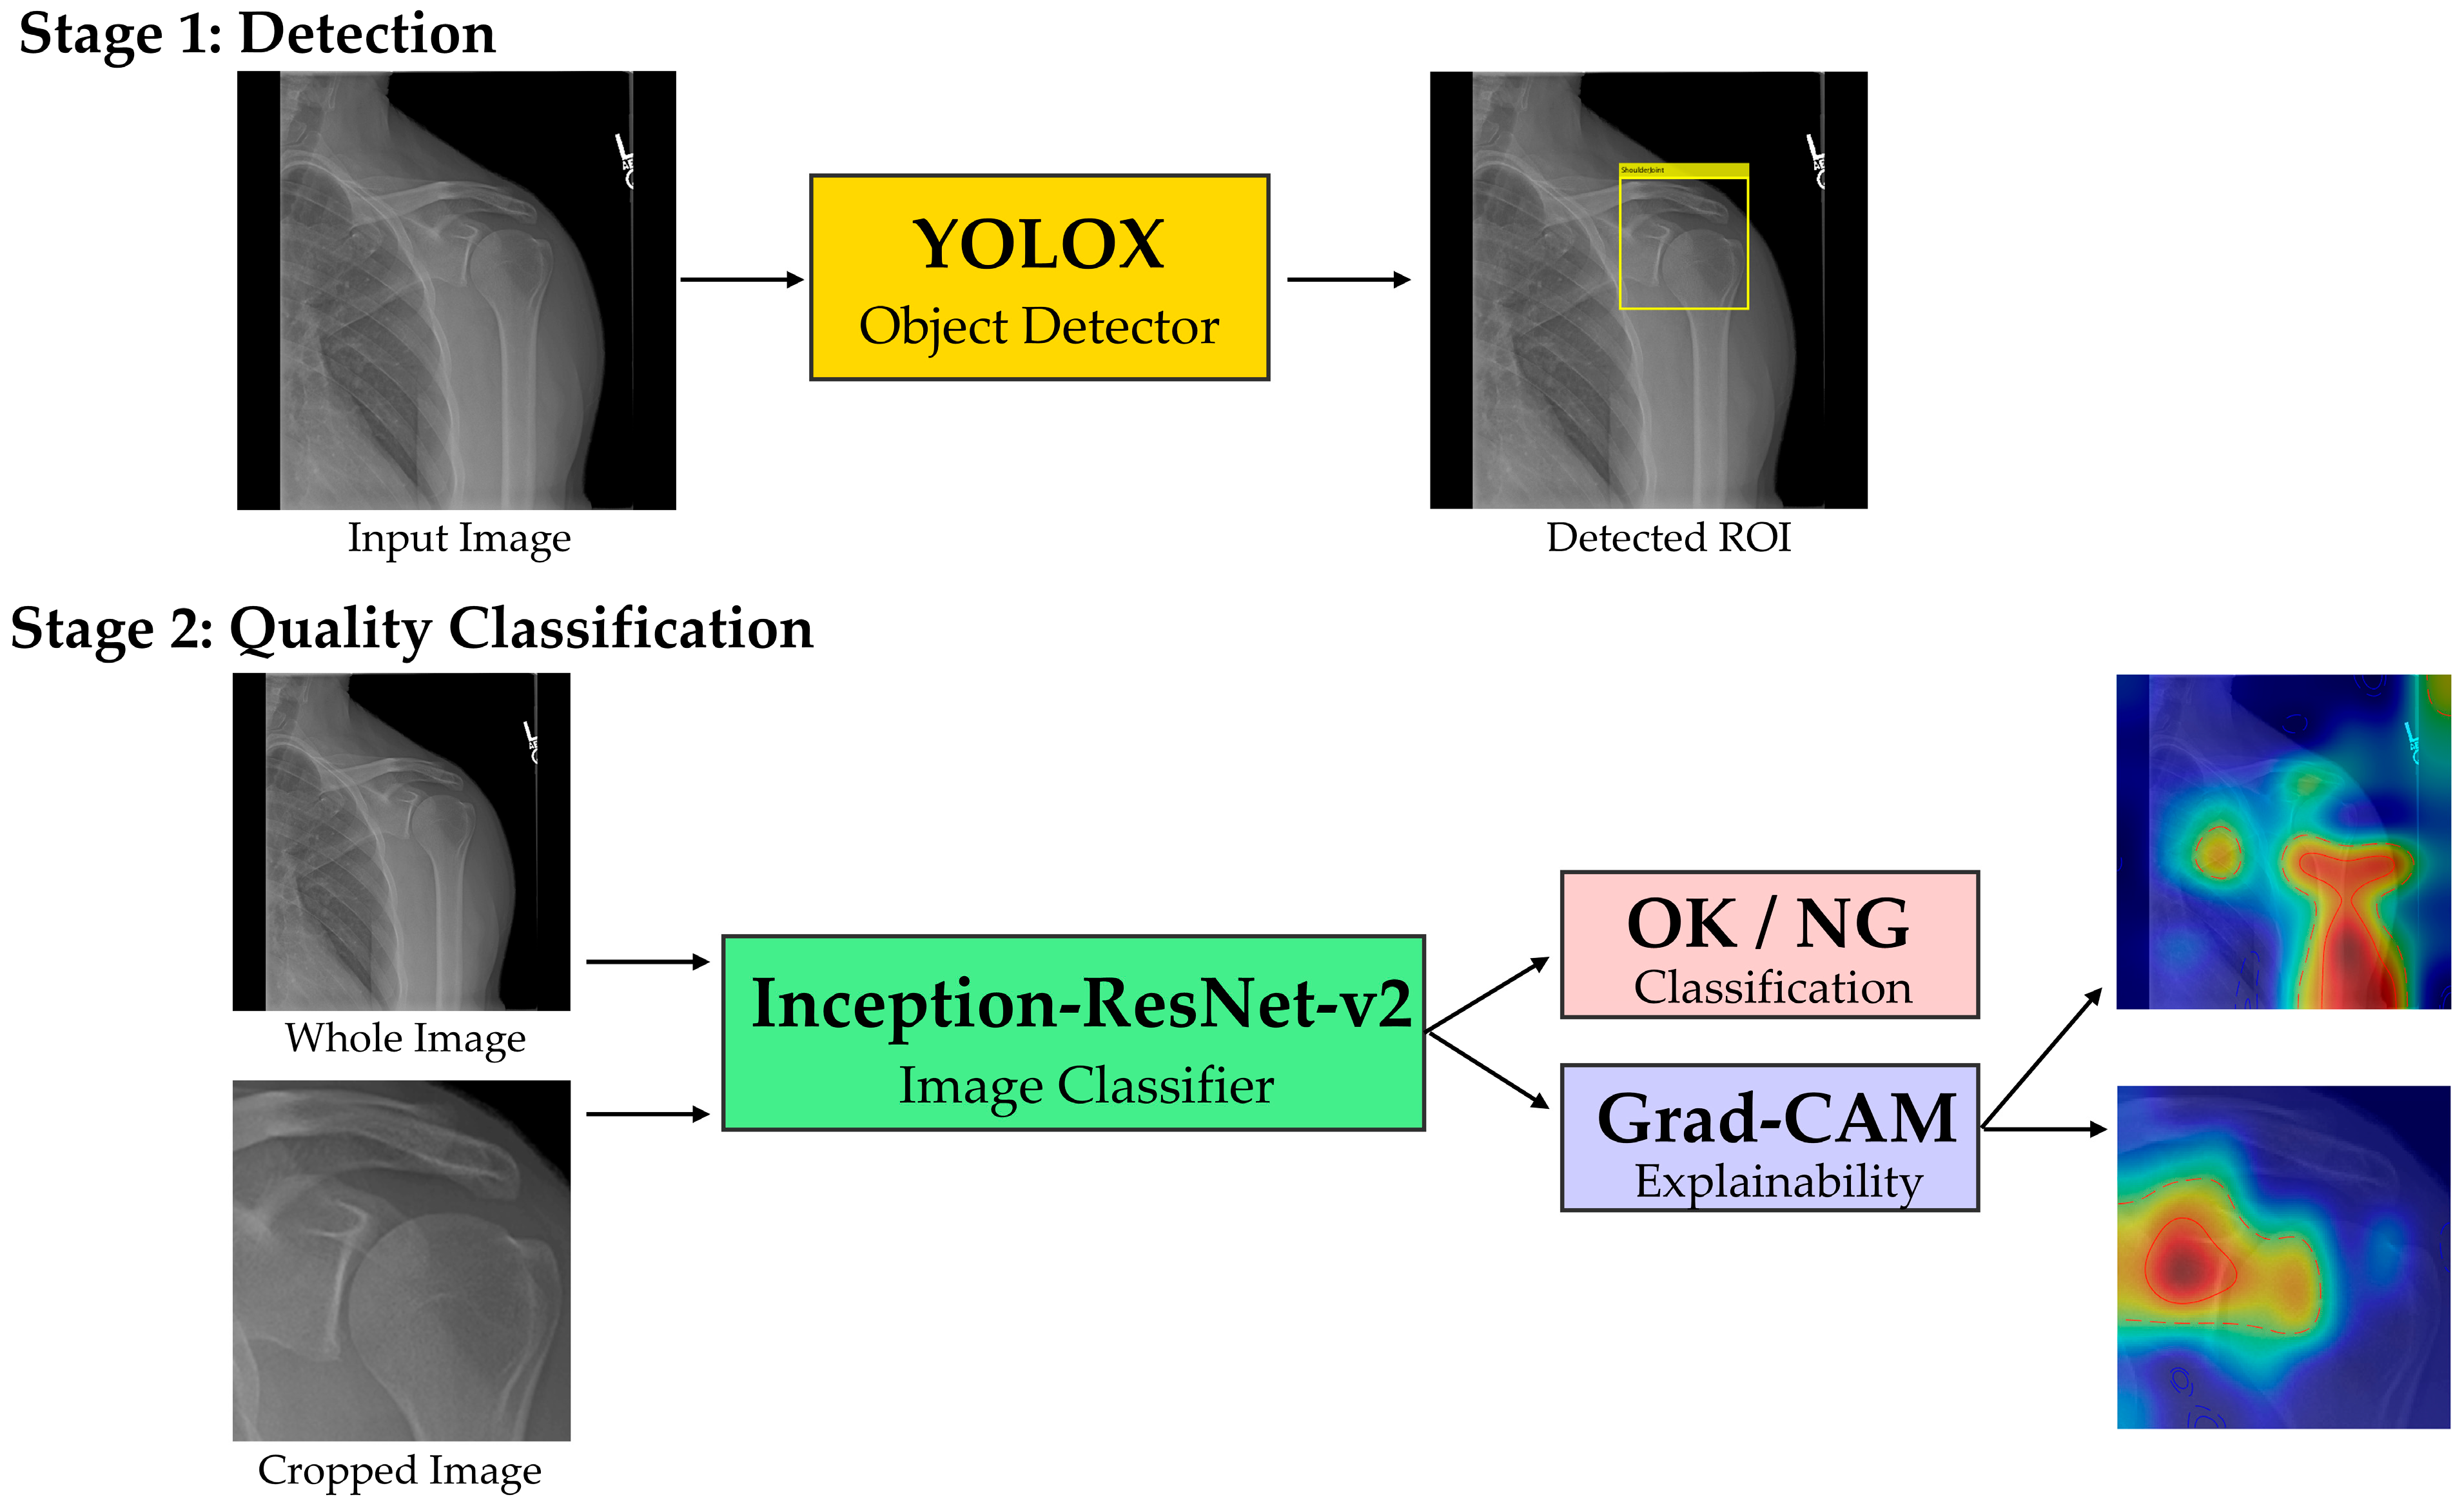
20] for binary quality classification (OK/NG), processing both whole images and locally cropped regions extracted using stage-one detection boxes, both of which were resized to 299 × 299 pixels to match the input resolution of Inception-ResNet-v2. The overall workflow of our two-stage pipeline is illustrated in
Figure 3. Explainability was implemented via Grad-CAM for both classifiers; maps were overlaid and summarized using coverage metrics as detailed in
Section 3.3.
Data partitioning followed a 5-fold cross-validation scheme. Each fold contained 2240 training images (1120 OK, 1120 NG) and 560 test images (280 OK, 280 NG). Offline data augmentation was applied to training data through brightness scaling (0.50, 0.75, 1.00, 1.25, 1.50) and horizontal flipping, resulting in a 10-fold increase in training samples. No online augmentation was performed during training. Computational resources included two NVIDIA RTX A6000 GPUs (NVIDIA, Santa Clara, CA, USA) for parallel processing. Model development, training, evaluation, and software integration were performed using MATLAB (version 2025a; MathWorks, Inc., Natick, MA, USA). No deployment-context runtime profiling was conducted in this study.
2.2. Object Detection for Glenohumeral Joint Localization
Detection principle; we adopt an anchor-free, one-stage YOLOX detector with a decoupled head that jointly predicts objectness/class probabilities and bounding-box geometry on dense, multi-scale feature maps. During inference, per-cell predictions are filtered by confidence and consolidated with non-maximum suppression to yield the glenohumeral joint box. We developed a single-class object detector based on YOLOX architecture to automatically localize the glenohumeral joint region from shoulder anteroposterior radiographs. The detector was trained to identify a single class labeled “ShoulderJoint.” The complete dataset of 2800 images (1400 OK, 1400 NG) was stratified by quality labels and divided into five equal subsets for 5-fold cross-validation. Each fold utilized 2240 images for training and 560 for testing.
The YOLOX model employed CSPDarknet53 as the backbone network with feature pyramid network (FPN) for multi-scale feature fusion. Initial weights were transferred from COCO pre-trained models [
26]. The loss function followed YOLOX specifications, utilizing complete IoU (CIoU) loss for bounding box regression and binary cross-entropy for objectness and class predictions. Optimization was performed using stochastic gradient descent (SGD) with momentum 0.9 and weight decay 5 × 10
−4. The initial learning rate was set to 0.01 with cosine annealing schedule. Training proceeded for 3 epochs with batch size 128.
Detector configuration and training protocol; we developed a single-class YOLOX detector (“ShoulderJoint”) to localize the glenohumeral joint on shoulder AP radiographs using five-fold cross-validation (2240 train/560 test per fold, stratified by OK/NG). The model used a CSPDarknet53 backbone with FPN, initialized from COCO pre-trained weights. Following YOLOX specifications, losses comprised CIoU for box regression and binary cross-entropy for objectness/class. Optimization employed SGD (momentum 0.9, weight decay 5 × 10⁻⁴) with an initial learning rate 0.01 and cosine annealing. Training ran for 3 epochs with batch size 128. No Bayesian optimization or systematic hyperparameter search was conducted; the above settings were fixed a priori based on prior reports and preliminary sanity checks. Inference used the default YOLOX post-processing (confidence filtering and NMS). Performance was evaluated per fold using AP@0.5 and the Dice similarity coefficient between predicted and ground-truth boxes.
Performance evaluation was conducted on test sets from each fold. Primary detection metrics included average precision at IoU threshold 0.5 (AP@0.5). Additionally, we calculated the Dice similarity coefficient (DSC = 2|A∩B|/(|A| + |B|)) between predicted and ground truth bounding boxes, reporting the average DSC across all test images. This detector provides the region-of-interest crop for the local classifier (
Section 2.3); the end-to-end inference protocol is described in
Section 2.4.
2.3. Image Classification for Quality Assessment
A binary classifier was developed to assess radiographic quality (OK/NG) in shoulder anteroposterior images. The dataset of 2800 images (1400 OK and 1400 NG) was stratified by quality labels and divided into five subsets for cross-validation. Each fold contained 2240 training images (1120 OK, 1120 NG) and 560 test images (280 OK, 280 NG). The aforementioned offline augmentation expanded the training set by 10-fold.
The classification architecture employed Inception-ResNet-v2, leveraging its hybrid inception modules and residual connections for enhanced feature extraction. The network was modified with a two-class softmax output layer for binary classification. Training utilized a batch size of 128 for 3 epochs with Adam optimizer, initial learning rate 0.001, and categorical cross-entropy loss. During inference, the class with maximum probability was assigned as the predicted label.
Evaluation metrics included recall, precision, F1 score, and area under the receiver operating characteristic curve (AUC). To address potential class imbalance effects, all classification metrics except AUC were calculated using macro-averaging. Metrics were computed for individual folds and summarized as mean ± standard deviation across folds.
2.4. Integrated System Development and Explainability Assessment
We operationalized the two-stage design into a fixed inference protocol that links detection and classification (
Figure 3). This system mimics the radiographer’s visual workflow by first localizing the anatomical region of interest, then performing focused quality assessment. The evaluation framework rigorously followed the 5-fold cross-validation structure to ensure unbiased assessment.
For each test image in each fold, the workflow proceeded as follows: (1) whole image classification using the fold-specific model, generating Grad-CAM visualizations for the predicted class; (2) glenohumeral joint detection using the fold-specific detector; (3) extraction of the local region using detected bounding boxes; and (4) local image classification using a separately trained fold-specific model on cropped images, generating corresponding Grad-CAM visualizations. This approach enabled paired comparison of whole-image and local-image attention patterns for identical cases.
Explainability validation focused on quantifying agreement between Grad-CAM attention regions and expert-defined anatomical relevance. Three radiographers established consensus assessments through the following protocol: Grad-CAM activations were normalized to [0,1] range, and contour lines at thresholds τ = 0.50 and τ = 0.75 were evaluated for overlap with the glenohumeral joint region. Each image–model combination (whole/local) received binary scoring (0/1), indicating presence or absence of joint coverage. Mean scores across all test images defined the joint ROI coverage metrics: Coverage@50 (τ = 0.50) and Coverage@75 (τ = 0.75). Assessment was performed blind to classification outcomes and confidence scores to minimize observation bias.
Statistical analysis employed a two-tier approach. Primary analysis used McNemar’s test with continuity correction to evaluate paired binary outcomes (whole vs. local coverage) within each fold-class combination. Secondary analysis aggregated fold-level differences (d = Local − Whole) by quality class (OK/NG), applying paired t-tests to estimate mean differences with 95% confidence intervals. All statistical tests used two-sided significance level α = 0.05. This comprehensive evaluation framework determined whether localized or whole-image models provide more anatomically relevant attention patterns for quality assessment decisions.
4. Discussion
Our study demonstrates the successful development and validation of a two-stage deep learning system for automated quality assessment in shoulder true-AP radiographs. The integration of anatomical localization through object detection with focused quality classification represents a methodologically novel approach that mirrors the visual workflow of experienced radiographers. The exceptional detection performance (AP@0.5 = 1.00, mean DSC = 0.967) and robust classification metrics (AUC = 0.977, F1 = 0.943) establish the technical feasibility of automated quality assessment in shoulder radiography.
The near-perfect glenohumeral joint detection achieved in our study surpasses previously reported performance for anatomical localization in musculoskeletal radiographs. While previous studies using YOLO-based architectures for skeletal structure detection reported AP@0.5 values ranging from 0.85 to 0.93 [
27], our refined approach with YOLOX and carefully curated annotations achieved consistent perfect detection across all folds. This improvement likely reflects both architectural advances in YOLOX and the focused nature of single-joint detection compared to multi-structure localization tasks. The high Dice coefficients (>0.96) indicate precise boundary delineation, critical for ensuring that subsequent quality assessment focuses on diagnostically relevant anatomy.
Our shoulder-specific system achieved a mean AUC of 0.977 on the held-out test set, indicating strong discriminative performance in absolute terms. While prior reports in other radiographic QA domains (e.g., chest radiography) have listed AUCs around 0.89–0.94 [
28,
29], these figures are not directly comparable to our setting due to differences in anatomy, label definitions (binary vs. multi-grade), dataset composition, and evaluation protocols; we therefore cite them only as background context. Within our task, the observed balance of precision and recall reflects threshold selection on the internal test set; any inference about clinical retake rates would require prospective validation.
The most significant contribution of our work lies in the quantitative demonstration of improved explainability through anatomical localization. ‘XAI-enhanced’ in our context refers to the systematic use of Grad-CAM and coverage analyses within the two-stage pipeline rather than the proposal of a new XAI algorithm. The substantial improvements in Coverage@50 (+0.141 to +0.229) and Coverage@75 (+0.449 to +0.469) metrics for local versus whole-image models provide empirical evidence that focused analysis yields more clinically relevant attention patterns. This finding aligns with cognitive studies in radiology showing that expert radiographers employ systematic search patterns focused on specific anatomical regions rather than global image assessment [
30,
31]. Previous explainability studies in medical imaging have primarily relied on qualitative visual assessment of attention maps [
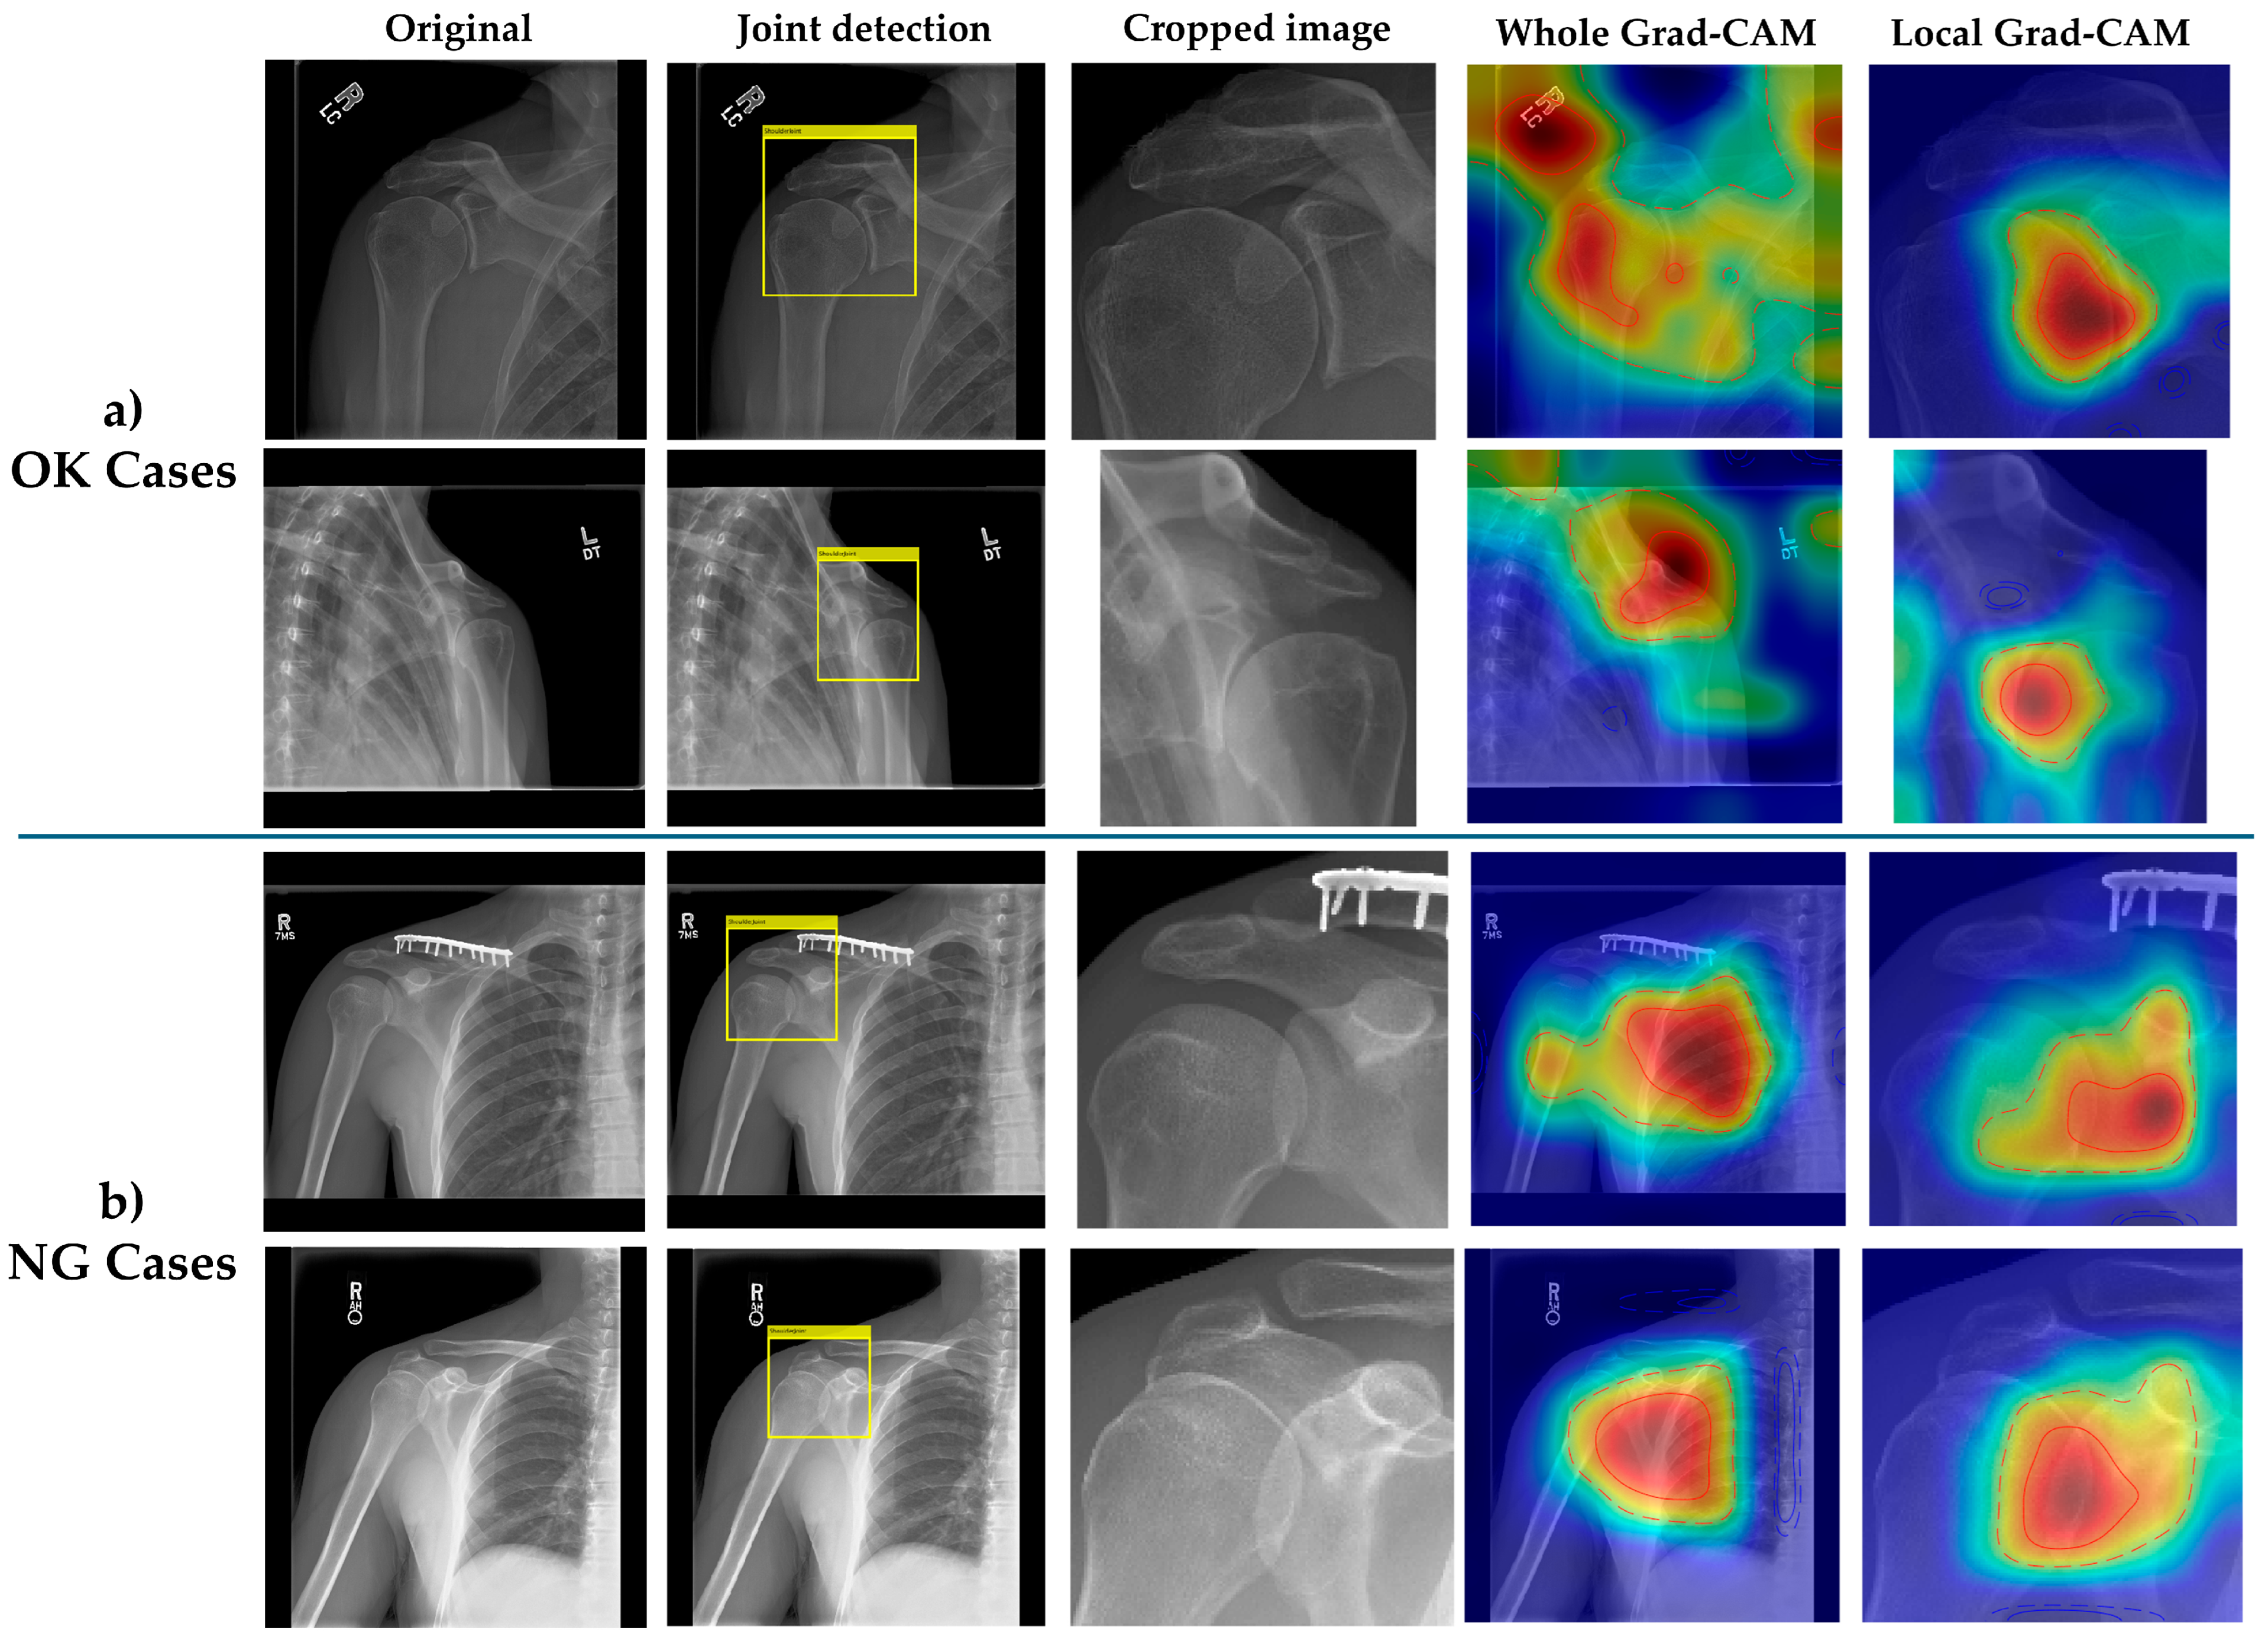
32]; our quantitative coverage metrics, combined with the visual evidence in
Figure 4, establish an objective framework for evaluating and comparing explainability across different architectural approaches.
The consistency of explainability improvements across both OK and NG image categories strengthens the clinical validity of our approach. Interestingly, NG images showed slightly lower coverage improvements compared to OK images, possibly reflecting the greater anatomical variability in malpositioned radiographs. This observation underscores the value of explicit anatomical localization in handling positioning variations, a critical requirement for clinical deployment where patient positioning cannot be perfectly standardized. The visual evidence presented in
Figure 4 further substantiates our quantitative findings. The comparison between whole-image and local Grad-CAM visualizations reveals distinct patterns of model attention. In whole-image classification, activation patterns tend to be diffuse and often extend beyond the glenohumeral joint region, potentially incorporating clinically irrelevant areas such as soft tissue shadows or rib cage structures. In contrast, the local model’s Grad-CAM activations demonstrate concentrated focus on the anatomically critical region, specifically the glenohumeral joint space, humeral head, and glenoid fossa. This focused attention pattern is consistent across both OK and NG cases, though NG cases show slightly more dispersed activations, likely reflecting the anatomical distortion present in malpositioned radiographs. The visual concordance between local model attention and expert-defined regions of interest provides intuitive validation of our coverage metrics and supports the clinical interpretability of the system. Related work on interpretable hybrid architectures in other mission-critical domains further underscores the value of combining transparent attention mechanisms with task-specific modeling [
33]. Generalizability and reuse; the proposed two-stage paradigm—task-specific joint/landmark localization followed by quality classification with Grad-CAM explanations—is directly reusable for other anatomies (e.g., hip, knee, wrist) by (i) specifying anatomy-appropriate image-quality criteria, (ii) annotating the target region(s) for detection, and (iii) fine-tuning the classifier on curated OK/NG labels. Only minor code changes are required beyond detector/classifier configuration and threshold calibration; however, anatomy-specific external validation will be necessary to confirm robustness across scanners, protocols, and institutions.
Several limitations warrant consideration in interpreting our findings. First, this study utilized a single publicly available dataset (MURA), which, while comprehensive, may not fully represent the imaging characteristics and quality variations encountered across different institutions and equipment manufacturers. The generalizability to other imaging protocols, particularly those using different exposure parameters or digital radiography systems, requires further validation. Because this study relies on a single-source dataset with internal splits, generalizability to other institutions and acquisition protocols requires external validation. Accordingly, because the present study was designed to characterize method behavior under controlled conditions (fixed internal splits), its findings should not be interpreted as evidence of transportability; confirming robustness will require external, multi-institutional validation across scanners, protocols, and patient populations. Second, our binary quality classification (OK/NG) represents a simplification of the continuous spectrum of image quality encountered in clinical practice. Radiographers often make nuanced decisions based on specific clinical indications and patient factors not captured in our model. This deliberate focus on the operational decision boundary does not capture intermediate grades; future prospective work should adopt validated multi-grade schemes with consensus protocols and inter-rater reliability to reflect the continuous nature of quality. Third, the ground truth annotations for both detection boxes and quality labels were established through consensus among three radiographers from a single institution, potentially introducing institutional bias in quality standards. Inter-observer variability in quality assessment, a well-documented challenge in radiography [
34], was not formally quantified in our study. Because individual pre-adjudication labels were not retained for all cases, inter-rater agreement (e.g., κ statistics) could not be computed; prospective studies will log rater-wise labels to quantify agreement prior to consensus. Fourth, the computational requirements of the two-stage pipeline, while suitable for modern clinical workstations, may present implementation challenges in resource-constrained settings. Regarding hyperparameter optimization, we did not perform a systematic hyperparameter search or architecture sweep (Bayesian optimization or grid/random search). Consequently, our results may not reflect the best-achievable configuration. Future work will incorporate structured optimization and ablation studies (backbone/scale variants, learning-rate schedules, post-processing thresholds) to characterize sensitivity and maximize performance. Moreover, we did not perform a head-to-head comparison with state-of-the-art methods on an identical dataset; this lack of a direct benchmark is a limitation of the present study, reflecting the absence of a matched, shoulder true-AP dataset and the non-transferability of existing public implementations to our binary-label setting. Moreover, although the pipeline is designed to transfer to other body parts with modest adaptation, performance will depend on anatomy-specific quality definitions and data distributions; therefore, external validation per anatomy is warranted. We did not perform deployment-context latency benchmarking; because end-to-end time is strongly influenced by I/O, preprocessing, and system scheduling, real-time feasibility should be established prospectively on the target clinical stack. Finally, our explainability metrics, while quantitative, still require human interpretation and may not capture all aspects of clinical decision-making in quality assessment. While Grad-CAM offered a practical, architecture-agnostic choice that we quantified via coverage, explanation stability remains method-dependent; benchmarking alternative methods (e.g., Score-CAM, SmoothGrad, LIME) and reporting stability/uncertainty summaries constitute important future methodological work.
The clinical implications of our findings extend beyond technical performance metrics. The demonstrated alignment between AI attention patterns and expert judgment suggests that our system could serve as an effective training tool for novice radiographers, providing visual feedback on anatomical regions critical for quality assessment. Selective quality review workflows—in which only images flagged as potentially problematic receive manual inspection—could significantly reduce the cognitive burden on radiographers while maintaining high quality standards. This approach could significantly reduce the cognitive burden on radiographers while maintaining high quality standards.
Future research directions should address the identified limitations while expanding the scope of application. Multi-institutional validation studies incorporating diverse imaging equipment and protocols would strengthen evidence for generalizability. Development of continuous quality scoring systems, potentially incorporating multiple quality dimensions, could provide more nuanced assessment aligned with clinical practice. Beyond the immediate accept-versus-retake decision modeled here, clinically calibrated multi-grade quality scales (e.g., good/acceptable/unacceptable) warrant prospective development with harmonized criteria and reliability assessment to capture meaningful gradations. Integration with radiographic positioning feedback systems could enable real-time guidance for technologists during image acquisition. Extension of the methodology to other shoulder projections and anatomical regions would demonstrate the broader applicability of the two-stage localization–classification framework.


