Article

Probabilistic Analysis of Wedge Failures and Stability of Underground Workings with Combined Support Under Thrust Faulting Conditions

1
Department of Information and Computing Systems, Abylkas Saginov Karaganda Technical University, Karaganda 100027, Kazakhstan
2
Department of Mining Safety, Ural State Mining University, 620144 Yekaterinburg, Russia
*
Author to whom correspondence should be addressed.
Appl. Sci. 2025, 15(19), 10533; https://doi.org/10.3390/app151910533
Submission received: 30 August 2025 / Revised: 22 September 2025 / Accepted: 25 September 2025 / Published: 29 September 2025
(This article belongs to the Special Issue Rock Mechanics and Mining Engineering)

Abstract

Ensuring the stability of surrounding rock in underground excavations is a critical prerequisite for safe mining operations. This study examines the mechanisms of wedge failure formation and determines the performance of a combined support system (rock bolts + shotcrete) through probabilistic analysis. Field investigations in the Zhylandy ore field (Kazakhstan) included fracture mapping, rock mass quality assessment (RQD), fracture frequency (FF), and in situ stress measurements, which confirmed a thrust-faulting regime. Numerical modeling with Dips ver.8 and UnWedge ver.6 software (Rocscience) identified critical excavation orientations of 120° and 141° associated with maximum-volume wedge formation, as well as a “safe orientation window” of 70° ± 10°. The probabilistic analysis showed that rock bolts alone yield a factor of safety (FS) < 1.2, whereas the combined support system increases FS to 2.4–3.5, significantly reducing the likelihood of wedge failures. An adaptive framework integrating numerical modeling with intelligent monitoring (“monitor → update model → adjust support”) is proposed, allowing real-time adjustment of support parameters and optimization of material consumption. The practical significance of this work lies in providing design-ready recommendations for support selection and excavation orientation, contributing to accident prevention and sustainable mining operations.

1. Introduction

The stability of surrounding rock at underground excavation boundaries is one of the central issues in mining, as loss of stability is directly linked to personnel safety and equipment preservation [1,2,3]. Even local roof or wall collapses can cause worker injuries, halt stoping or development operations, and lead to substantial economic losses [4,5]. Under these conditions, reliable support design and effective hazard prevention are of particular importance.
Recent studies highlight the advantages of probabilistic and reliability-based approaches for assessing the stability of underground excavations, including rock bolt + shotcrete support systems [6,7,8,9,10,11,12,13,14,15,16,17]. Their strength lies in the formalization of reliability criteria and support design procedures. However, many such studies are limited to generalized scenarios and often lack integration of field geomechanical data for vein-type ore bodies under thrust-faulting stress regimes. In addition, they typically do not provide operational recommendations on excavation orientation relative to fracture systems or on comparing the effectiveness of combined versus bolt-only support in preventing wedge failures and ensuring rock mass stability.
Quantitative measures of rock mass disturbance—such as RQD (Rock Quality Designation, the percentage of intact core pieces longer than 10 cm relative to total core length), fracture frequency (FF, fractures per meter), and scanline mapping [18,19] are useful for parameterizing model input data. However, such parameterization is rarely extended into practical guidelines for support design and excavation alignment with respect to wedge failures.
Research on regional stress conditions and Anderson’s faulting regimes [20,21,22] rightly emphasizes the need to account for the stress field, but seldom connects this to probabilistic wedge failure analysis or to the selection of support schemes for specific mining sites. Likewise, advances in block mechanics, 3D extensions of block theory, and integration with DFN/DEM approaches [23,24,25,26,27] improve predictive realism but often remain at a methodological level, without offering applied guidance on excavation azimuths and their linkage to combined support systems.
Studies of rock–support interaction and reliability-based optimization, including data-driven and hybrid approaches [28,29,30], provide valuable design tools but frequently lack site-specific validation for tectonized vein-type ore deposits and rarely transfer results into operational practice with elements of computer-aided support optimization.
This study seeks to address these gaps. Field fracture mapping and in situ stress measurements were integrated with probabilistic wedge analysis in Dips and UnWedge software [31,32], enabling the formulation of practical recommendations on excavation orientation and justification of a combined support system as part of disaster prevention.
The aim of this research is to enhance the safety and stability of underground excavations by reducing the risk of wedge failures. To this end, a comprehensive approach was applied, combining geomechanical surveys of excavations with probabilistic modeling to justify optimal support parameters and assess rock failure risks. The study was carried out in the mines of the Zhylandy ore field (Republic of Kazakhstan).

2. Materials and Methods

2.1. Observations of Rock Pressure Manifestations and Maintenance of Excavation Stability

The Zhylandy ore field is located in central Kazakhstan (Karaganda region) and is geologically associated with Paleozoic fold-and-thrust structures. The deposits are vein-type, controlled by regional fault zones, with host rocks represented by Carboniferous gray sandstones and siltstones. Accessory minerals in fracture infill include calcite, quartz, and minor clay gouge, which locally reduce rock mass strength and adhesion with support elements. Mining is conducted at depths of 200–300 m, with further development planned at deeper horizons. The tectonic framework is characterized by thrust faulting and flexural structures, which strongly influence fracture geometry and excavation stability.
A survey of operating excavations and an analysis of rock pressure manifestations during development works highlighted several complicating factors: the rock mass is dissected by differently oriented intersecting fractures, including faults; large inclined fractures are present, either unfilled, filled with vein minerals, or along slip surfaces with clay gouge; water-bearing zones are encountered; and flexural structures further contribute to instability.
The following types of support are used: steel–polymer anchor support (SPAS), shotcrete (as isolating support), and combined systems (SPAS + shotcrete). Stopes and intersections are reinforced with concrete, while strong and stable rock is typically supported with bolts and shotcrete.
Based on field observations and incident reports related to rock falls, displacements, and collapses, the following manifestations of rock pressure were identified: appearance of new fractures; widening of existing fractures; slab formation; vaulted roofs; local and large-scale falls; and exposure of fresh rock surfaces, including in stope roofs [33].
Excavation stability is often maintained by attempting to form a stable natural arch through contour blasting with reduced explosive charges in the roof. However, this method does not always produce consistent results.
To prevent small rock fragments from falling and to increase the load-bearing capacity of the support, the use of metal mesh or reinforcement frames with combined support (SPAS + shotcrete) is recommended. This practice has not yet been implemented at the Zhylandy mine.
Ensuring stability with SPAS requires forming a load-bearing beam of roof and wall rock at the excavation face. For this purpose, anchors with high pre-tension are needed: threaded rebar steel bolts (2.4 m length, 22 mm diameter) with cast hemispherical nuts, calibration pins, and 150 × 150 × 4 mm bearing plates. The currently used anchor type, equipped with a forged nut, cannot fully form a load-bearing beam due to design limitations, which contributes to rock falls.
Shotcrete is prepared by the wet-mix method: aggregate and cement are mixed with water in a mixer and applied in two spraying passes, reaching a thickness of 3 cm. Additives (accelerators, plasticizers, or fibers) are not used, which significantly reduces the strength and adhesion of the shotcrete.
Failures of excavations and support are not caused by critical in situ stresses since workings are relatively shallow (200–300 m). Roof and wall failures mainly occur at contacts between ore bodies and host rock, where fracturing is more intense. In such cases, shaping the roof as a slab improves stability.
The inspection of excavations, especially in areas of tectonic disturbances and cross-cutting fractures, showed that in places of rock falls SPAS anchors were exposed; anchors were left hanging, with unsecured and unreinforced failures, and emergency conditions were not eliminated.
In general, wedge-shaped rock falls are observed in the Zhylandy ore field even where anchor support is installed. The installed bolt length is not always sufficient to maintain roof stability. After collapses, the workings often remain with unremoved “domes.” Such areas are secured and reinforced with shotcrete in combination with SPAS. When combined with mesh, this system allows effective control and stability of excavation roofs.

2.2. Methods for Assessing Rock Mass Fracturing and Determining the Factor of Safety of Wedges

To study the stress fields in the Zhylandy deposit mines, two measurement points were selected at horizons 123.5 m and 42.1 m (in transfer chambers), where boreholes with a diameter of 76 mm and a depth of 12 m each were drilled.
The condition of exploration borehole cores was examined to evaluate the degree of disturbance using RQD (%) and fracture frequency (FF, fractures/m), as well as to identify cases of core disking in panel 6 (north), at the 42.1 m horizon.
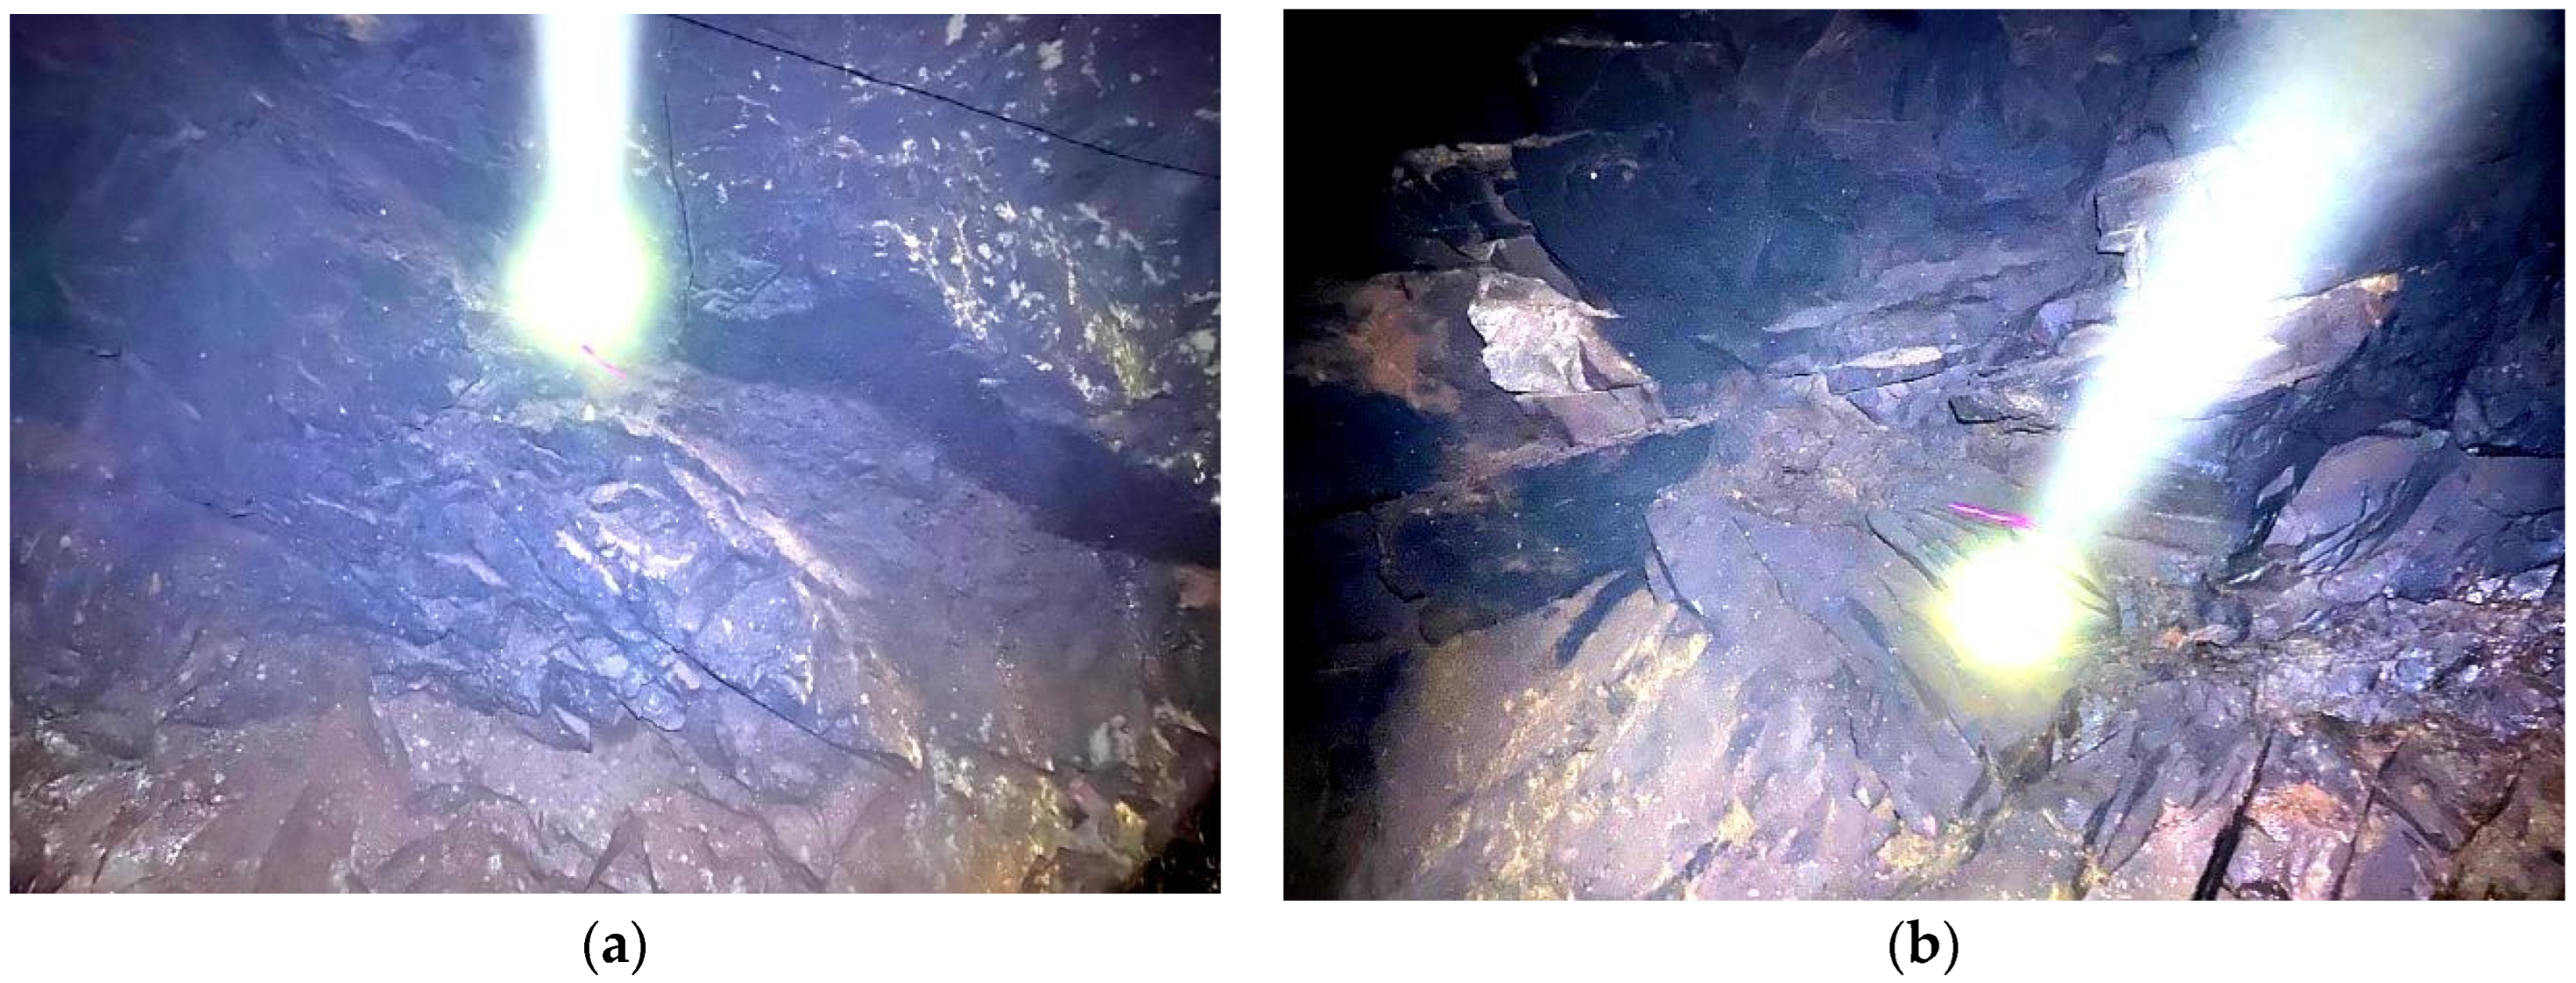
Based on geomechanical logging of exploration borehole cores, data processing was carried out to assess rock mass fracturing. The rocks of the deposit vary from moderately fractured to massive and are characterized by an average RQD value. According to core drilling data, RQD is defined as the percentage ratio of the total length of core fragments longer than 100 mm to the total core length. The obtained values are in the range of approximately 70–80%. Photographs of rock mass fracturing are shown in Figure 1 (a: panel 6, north; b: 123.5 m horizon) and in Figure 2 (a–b: 41 m horizon).
The presented photographs show fragments of the rock mass with a characteristic fracture system, confirming uneven disturbance and indicating the presence of potential instability zones.
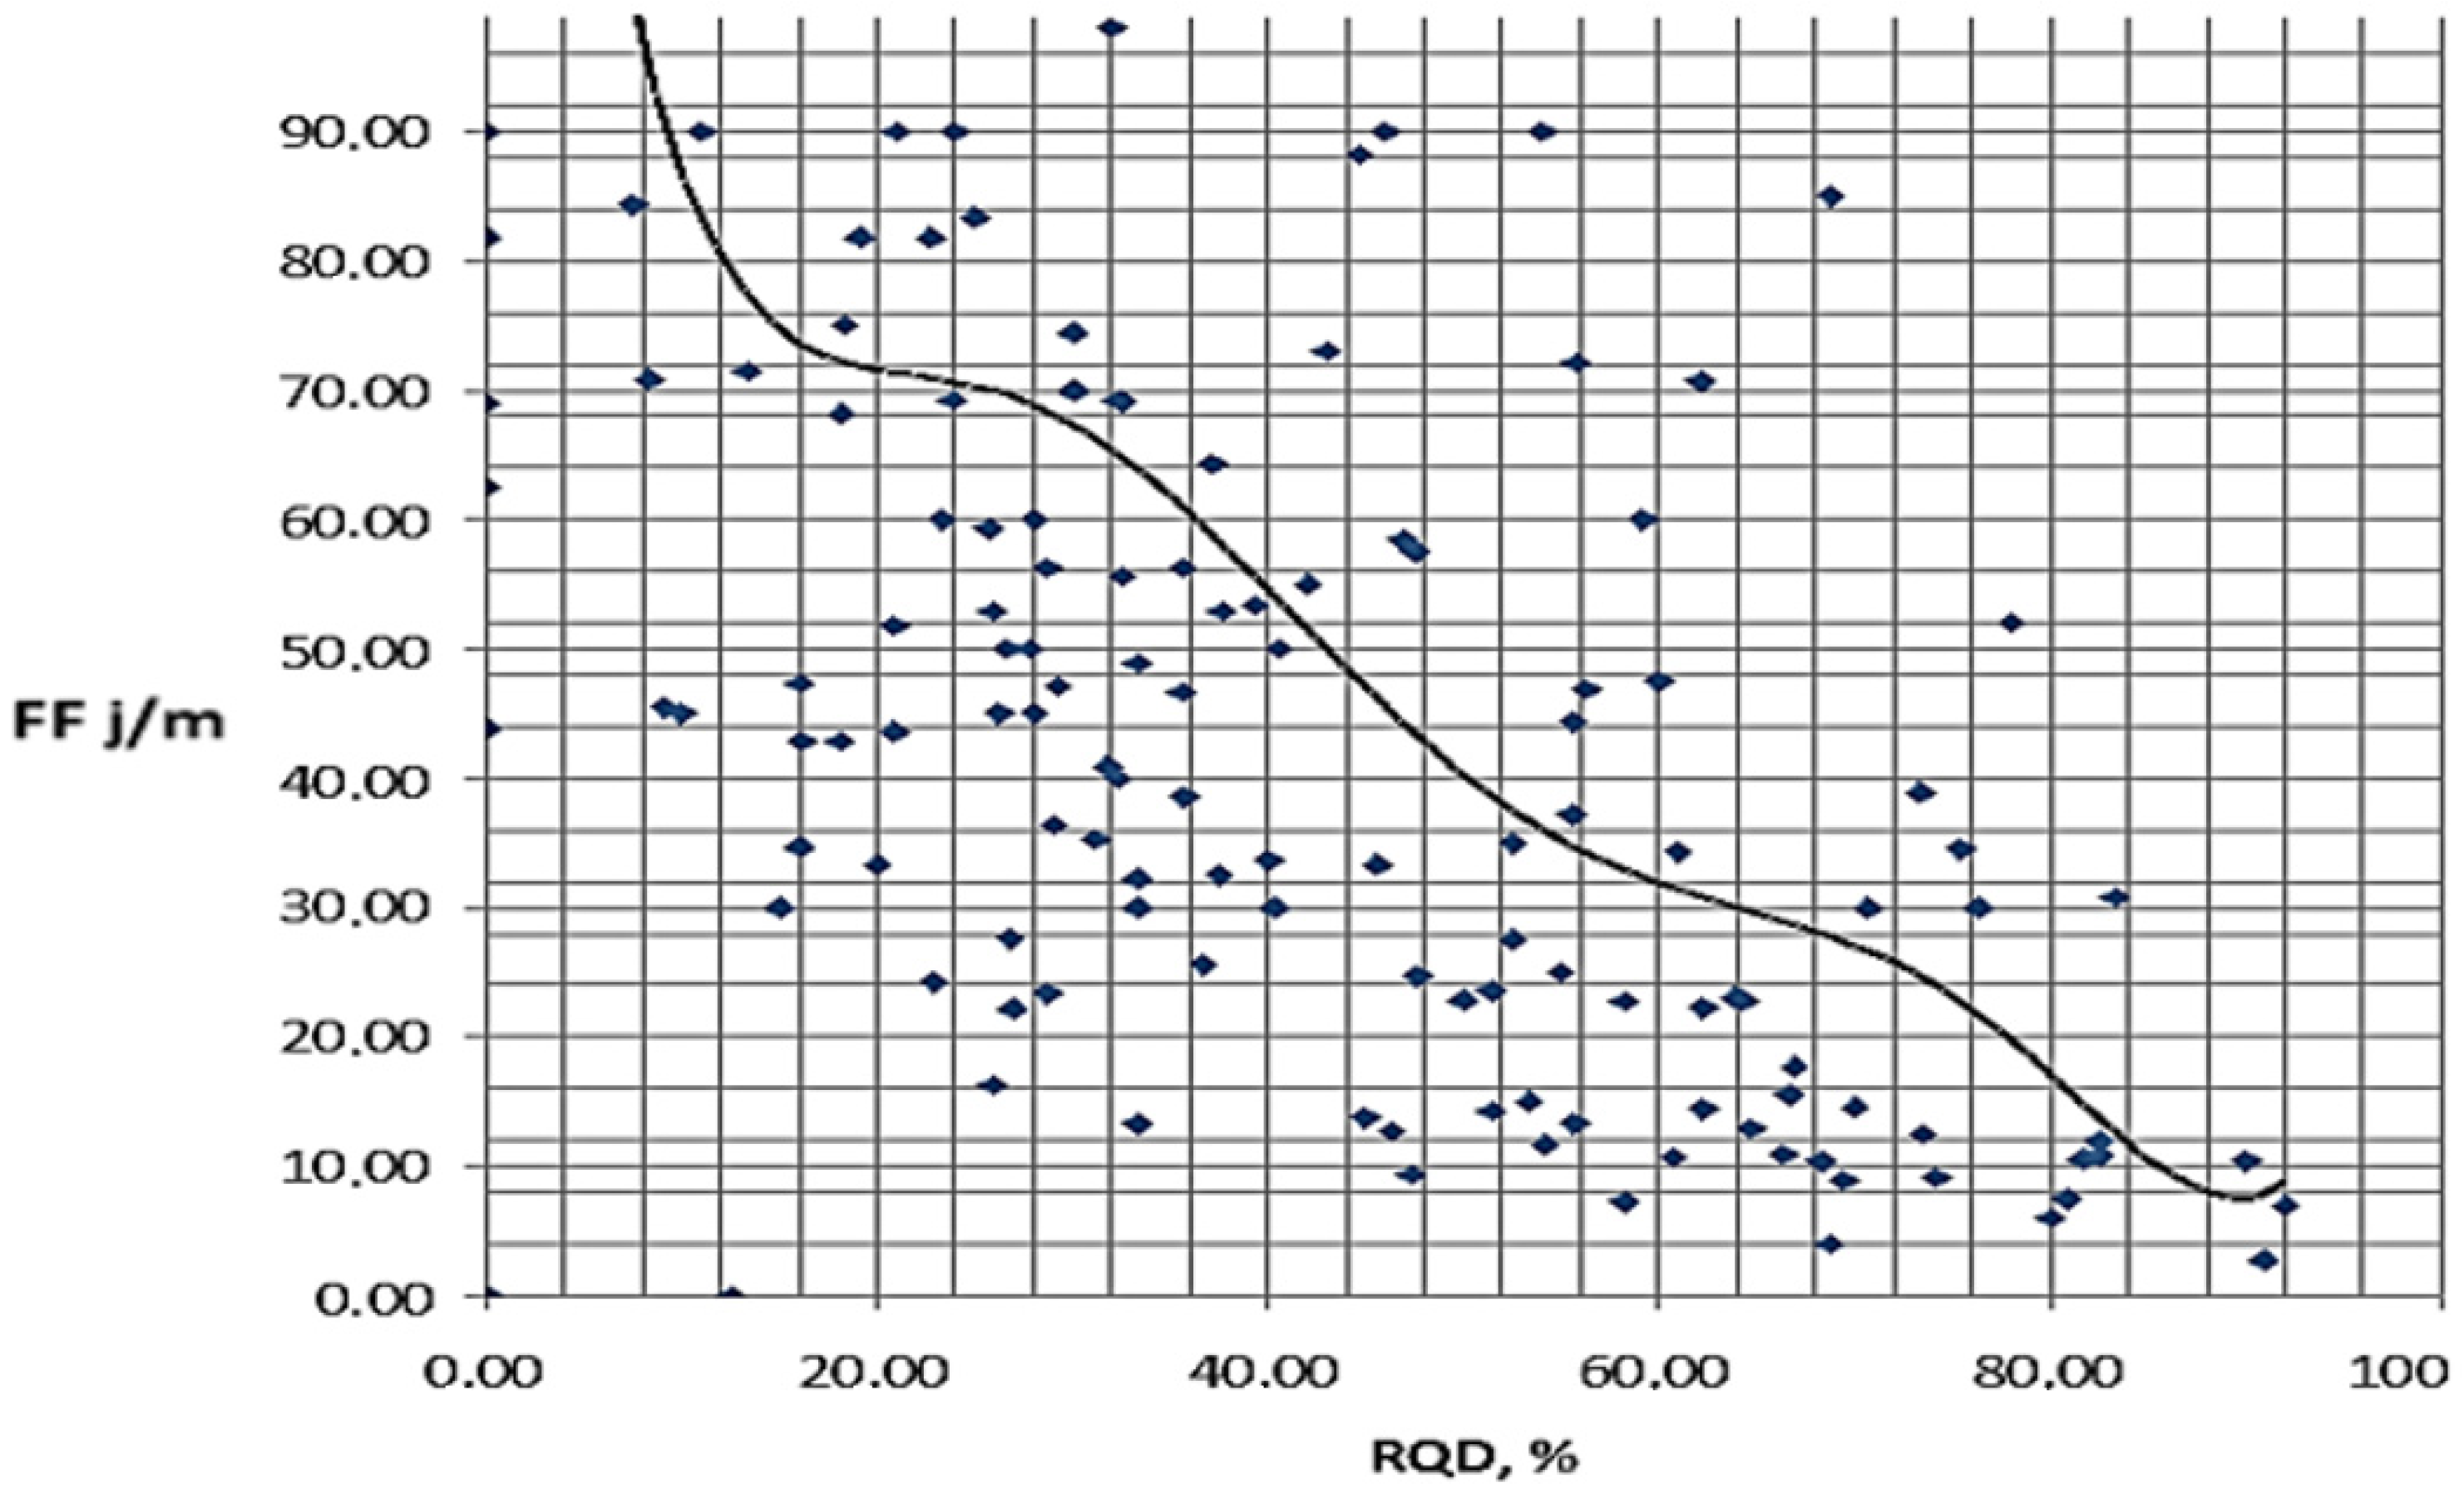
Figure 2 shows a local fracture zone, with a clearly traceable irregular distribution of fractures that contributes to the formation of wedge failures. Fracture frequency (FF, fractures/m) data for comparison were limited to a value of 99 due to the technical counting threshold; actual values exceeded 150–200 fractures/m (see Figure 3).
The graph illustrates the inverse relationship between rock mass quality (RQD) and fracture frequency (FF). At FF < 50 fractures/m, RQD values remain in the range of 70–80%, which corresponds to massive rock of good quality. With an increase in FF to 150–200 fractures/m, RQD decreases below 60%, indicating medium-quality rock and an increased risk of instability. In Figure 3, the blue squares represent individual measurement points obtained from borehole core logging (each point corresponds to one RQD–FF pair), while the solid line indicates an empirical trend fitted through these data; no specific theoretical model was applied.
Fracture mapping was conducted by scanline surveys on several panels and horizons, including panel 6 at the 41 m and 123.5 m horizons, panel 3 at the 300 m horizon, and panels 5–6 at the 200 m horizon. RQD and FF values were obtained from both core logging and scanline mapping; average RQD was 70–80%, while local FF values exceeded 150–200 fractures/m. Stress measurements by hydraulic fracturing (HF) were carried out at two monitoring stations (41 m and 123.5 m horizons, borehole depth ~12 m), providing principal stress data up to ~310 m depth.
Rock mass fracturing was assessed using the scanline mapping method in underground excavations in accordance with the ISRM Suggested Methods [34]. Surveys were carried out using the linear sampling method; for each fracture, dip and dip direction were measured instrumentally with a geological compass. Statistical processing of fracture spacing and trace length was performed following the methodology of Priest & Hudson [35], with correction for sampling bias. Rose diagrams/stereonets and data processing were conducted using the Dips software (Rocscience Inc.: Toronto, ON, Canada) [36,37].
The factor of safety (FS) of wedges was determined by probabilistic analysis of joint-controlled wedge failures in UnWedge [31,32], under the assumption that wedges are primarily subjected to gravitational loading; by default, the in situ stress field is not considered. This assumption provides conservative estimates (i.e., underestimated factor of safety). UnWedge was applied to justify the parameters of rock bolt and shotcrete support. In global practice, the critical threshold for FS is taken as 1.2: when FS < 1.2, the probability of wedge failure is high and reinforcement is required.
The FS is calculated in UnWedge using the limit equilibrium method as
F S = i = 1 m ( c i · A i + σ n , i · tan φ i · A i ) i = 1 m T i , σ n , i = σ n , i u i
where ci, φi, and Ai are the cohesion, internal friction angle, and contact area on the i-th plane; ui is the pore pressure; Ti is the total shear force along the potential sliding direction; m is the number of active contact planes of the wedge; σ′n,i and σn,i are the effective and total normal stresses on the i-th plane, respectively.
Note: in the absence of pore pressure (ui = 0), then σ′n,i = σn,i.
If the wedge stability analysis yields FS < 1.2, the program calculates the support parameters required to ensure stability.

2.3. Intelligent Monitoring (Concept and Integration with Modeling)

Instrumental observations in underground excavations (fracture opening, convergence measurements, and water inflow mapping) provide input data for the intelligent monitoring framework, which follows the cycle of monitor → update model → adjust support.
In this approach, monitoring acts as a rule-based subsystem: field stability indicators (fracture geometry changes, occurrence of falls or slabs, and signs of moisture) are compared with Dips/UnWedge analyses and the current support design. When unfavorable conditions are detected, the system updates input data (fracture orientations/conditions) and re-evaluates FS for the actual support scheme. This enables timely adjustment of support parameters without excessive material consumption.
The next section presents the results of the stability assessment and probabilistic analysis of rock mass failure in the Zhylandy ore field.

3. Results

3.1. Assessment of Mining–Geological Conditions and Rock Mass Fracturing

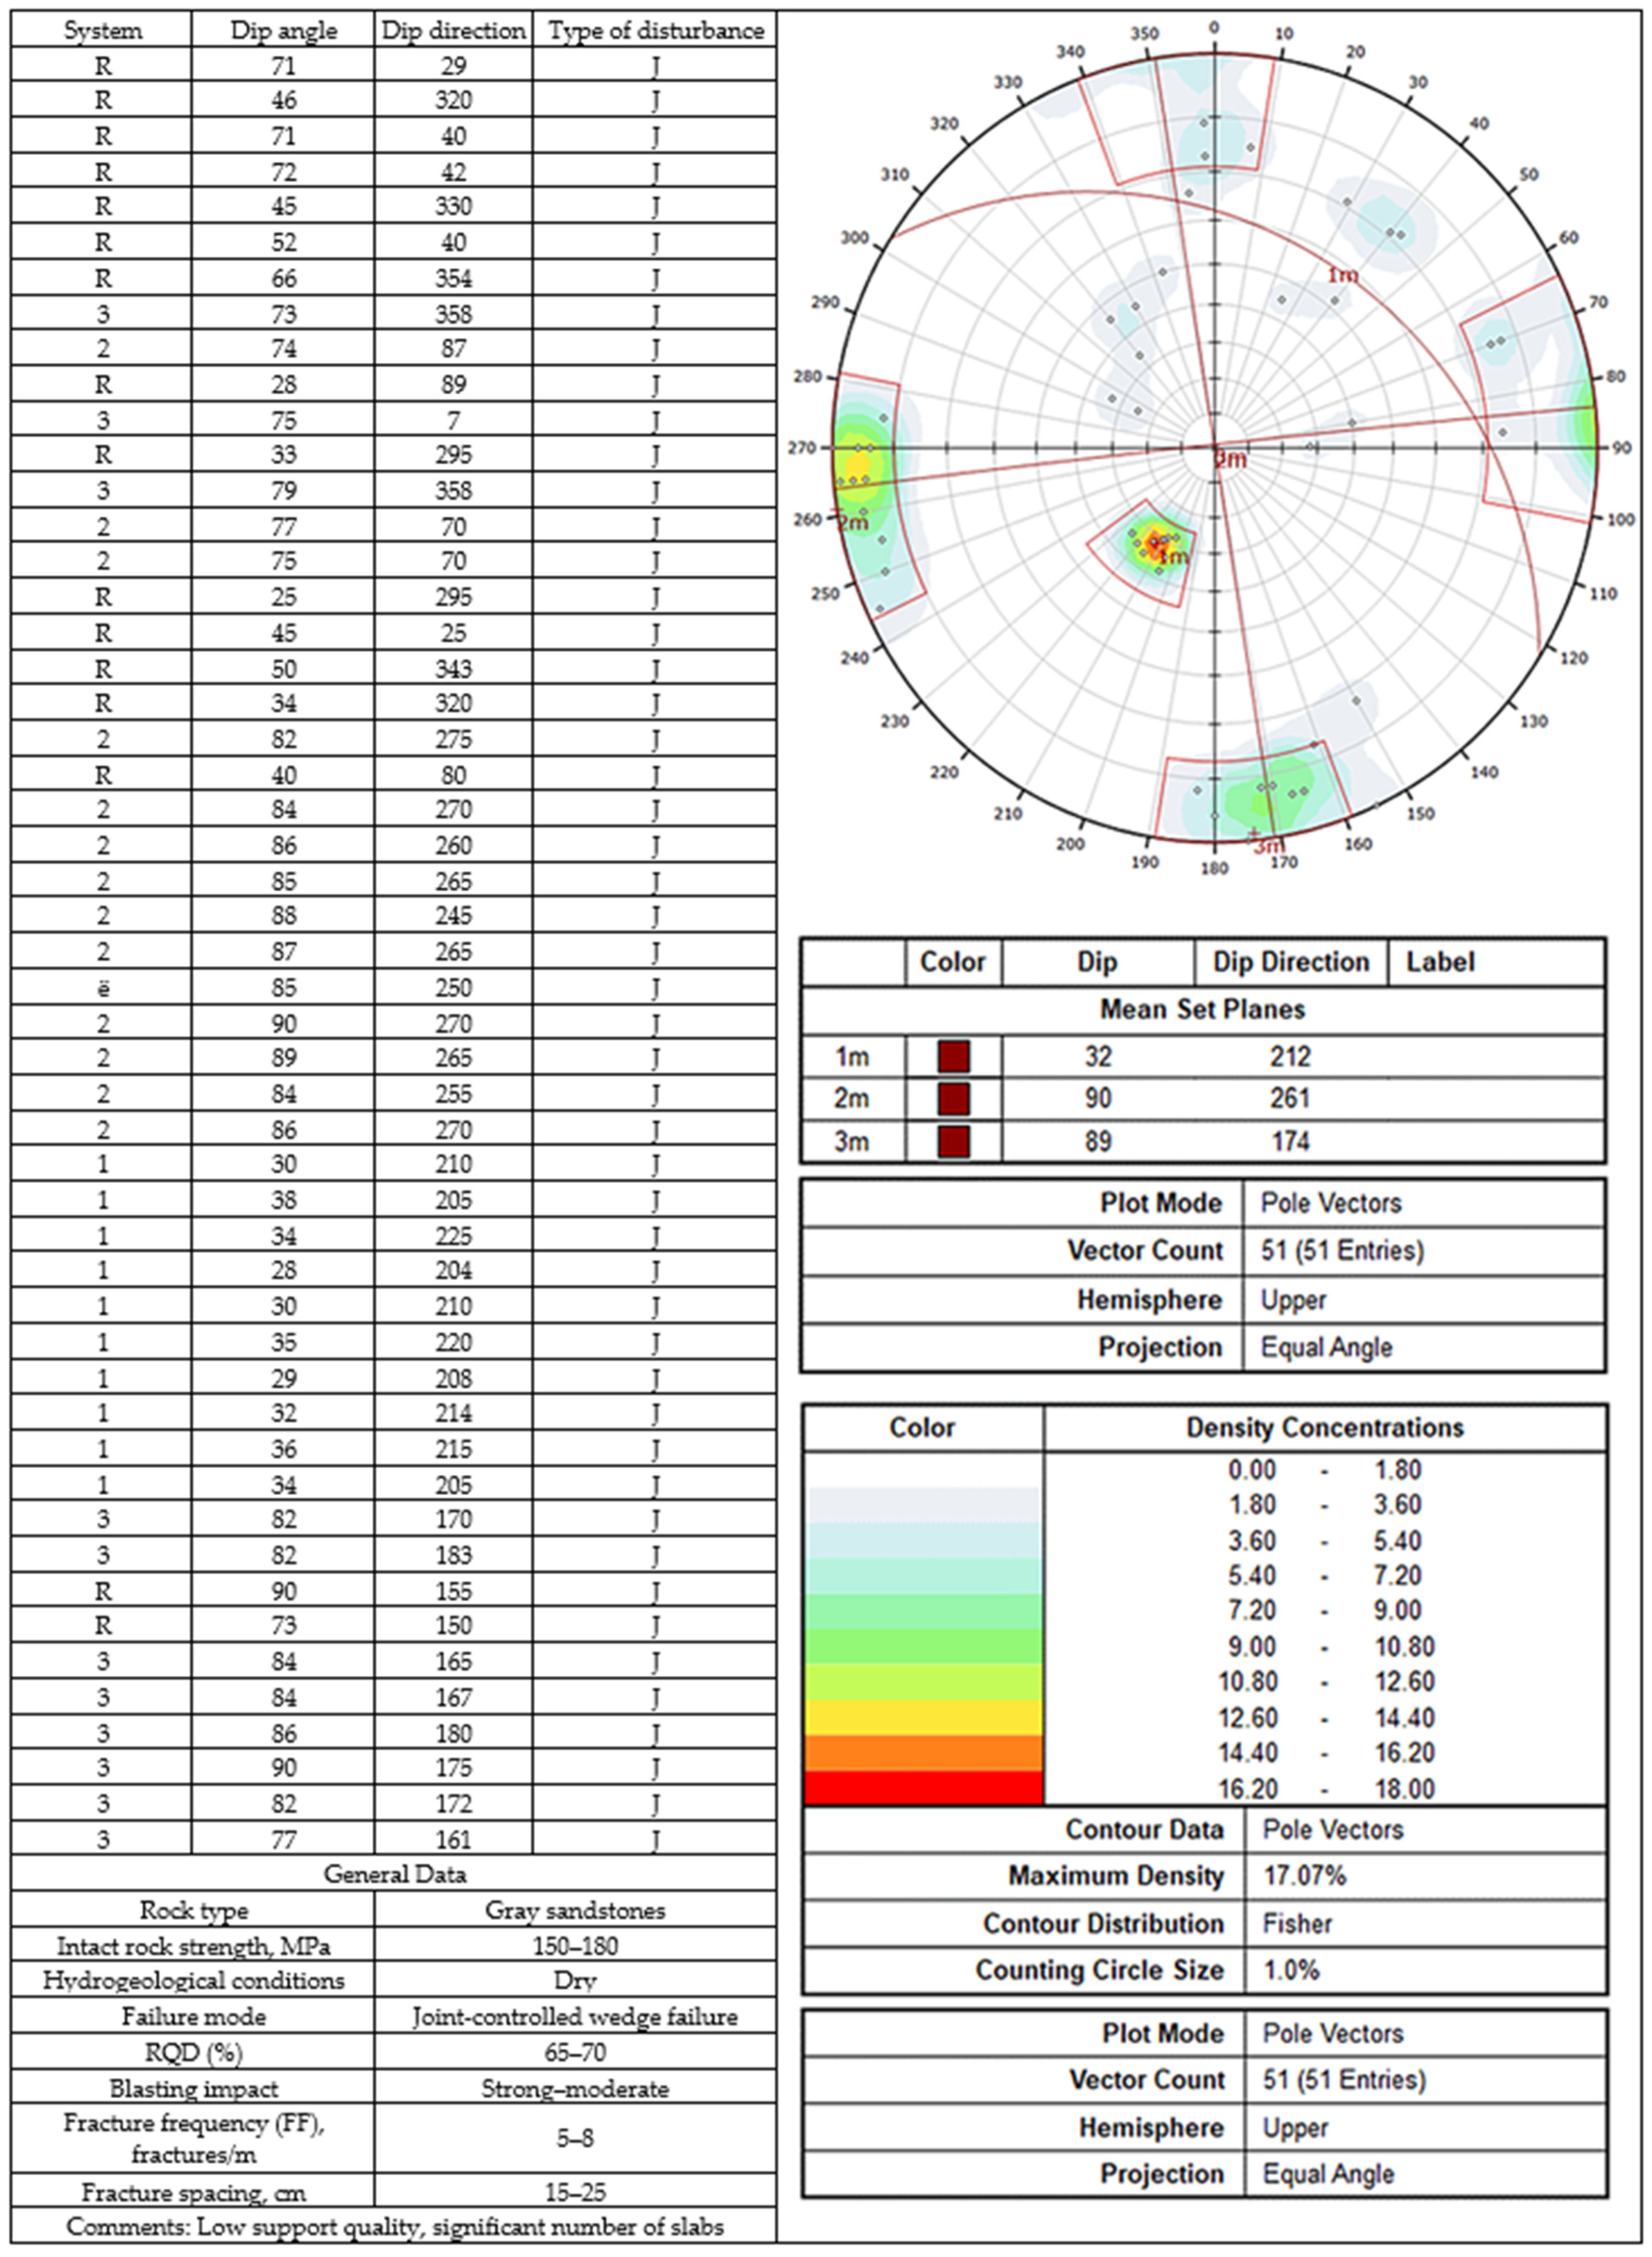
Processing of survey results and evaluation of rock mass disturbance performed in Dips showed that fracturing in the measurement area is of a local nature. Pole diagrams of fracture orientations are presented as follows: for panel 3, ore body I–III (Figure 4); and for panel 6, ore body I–I (Figure 5). As shown in Figure 4, the fracture system is associated with low support quality and the formation of a significant number of slabs. Similarly, Figure 5 illustrates fracture orientations in panel 6, which also indicate low support quality and slab formation.
The pole diagram identifies several dominant fracture systems typical of gray sandstones with a strength of 150–180 MPa. In this case, RQD = 65–70%, the average fracture spacing is 15–25 cm, and FF = 5–8. Such a configuration results in low support quality and the formation of a considerable number of slabs, which significantly increases the likelihood of wedge failures in the roofs and walls of excavations.
The obtained data indicate the presence of several fracture systems with dip angles ranging from 25° to 90° and various dip directions, pointing to the tectonic nature of rock mass disturbance. The rocks are represented by gray sandstones with a strength of 150–180 MPa. RQD is 65–70%, the average fracture spacing is 15–25 cm, and FF = 5–8 fractures/m. This configuration is associated with low support quality and the formation of slabs, which increases the likelihood of wedge failures.
Analysis of the data confirms the presence of a significant number of slabs caused by low support quality. At the same time, the rock mass is generally characterized as medium quality based on RQD, while its stability is strongly influenced by fracture characteristics (filling type, micro-roughness). Uneven tectonic fracturing is typical for the rock mass, with an average intensity of 10–25 fractures/m depending on lithological variations.

3.2. Probabilistic Analysis of Wedge Stability in the Rock Mass

To determine the formation of wedge-shaped failures in the excavation roof depending on the excavation azimuth and rock mass fracturing, numerical modeling was performed using the UnWedge software.
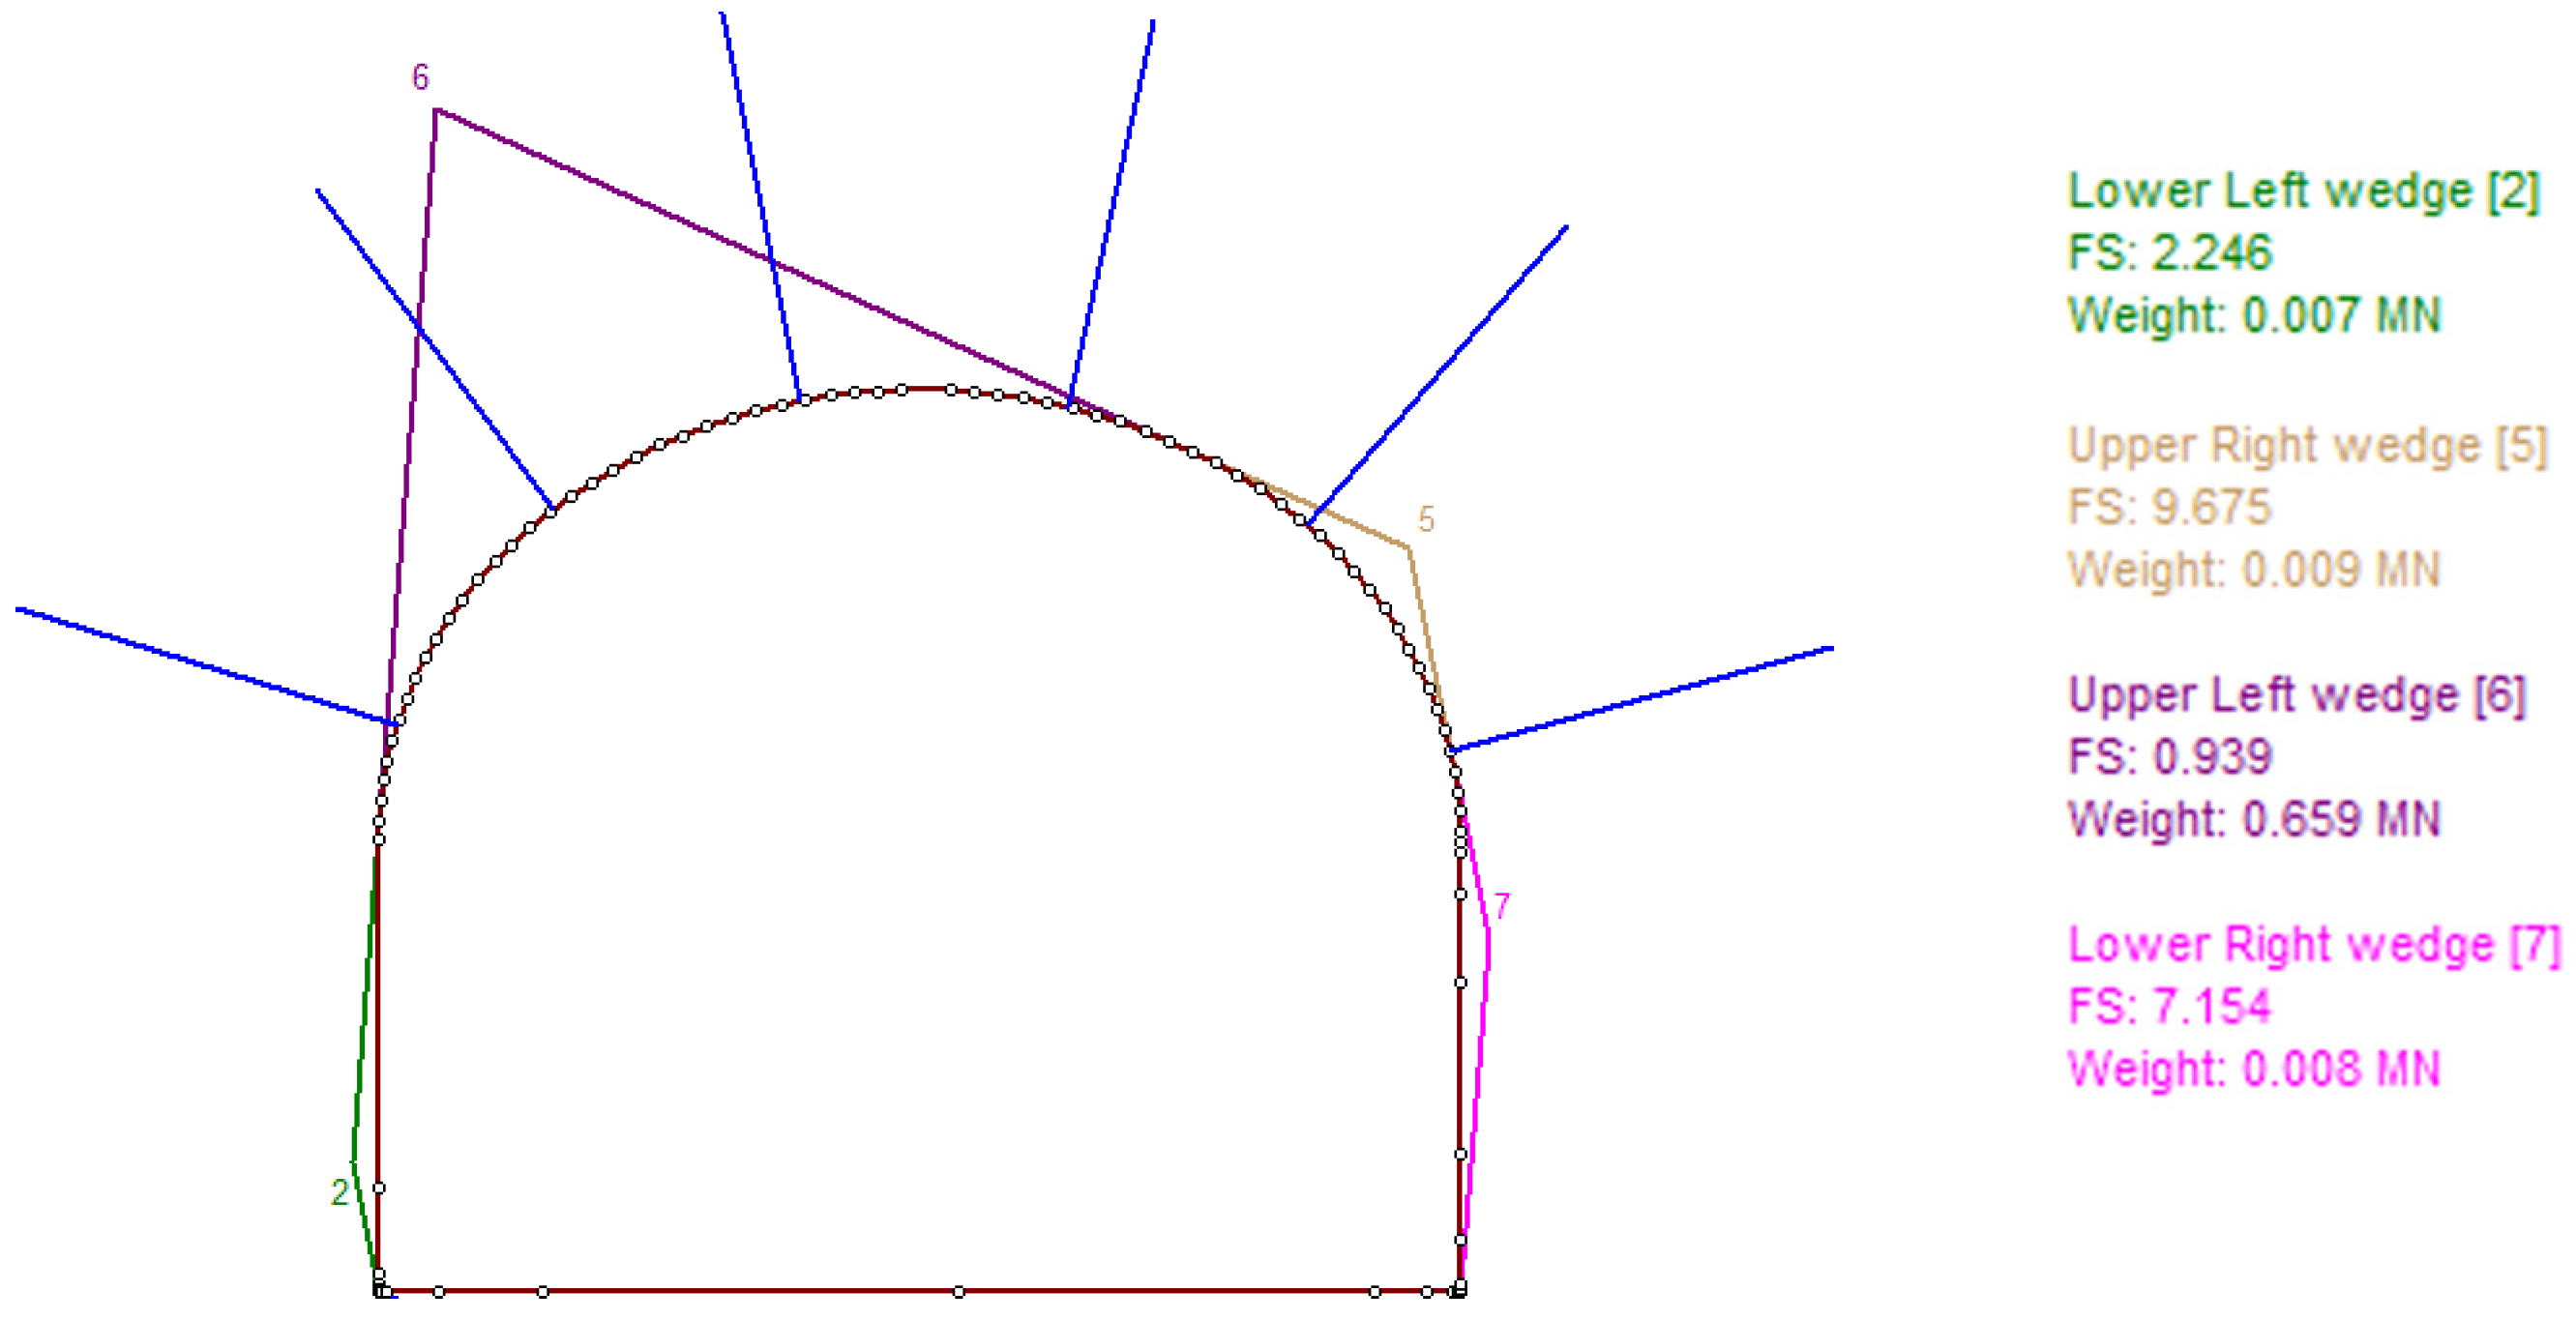
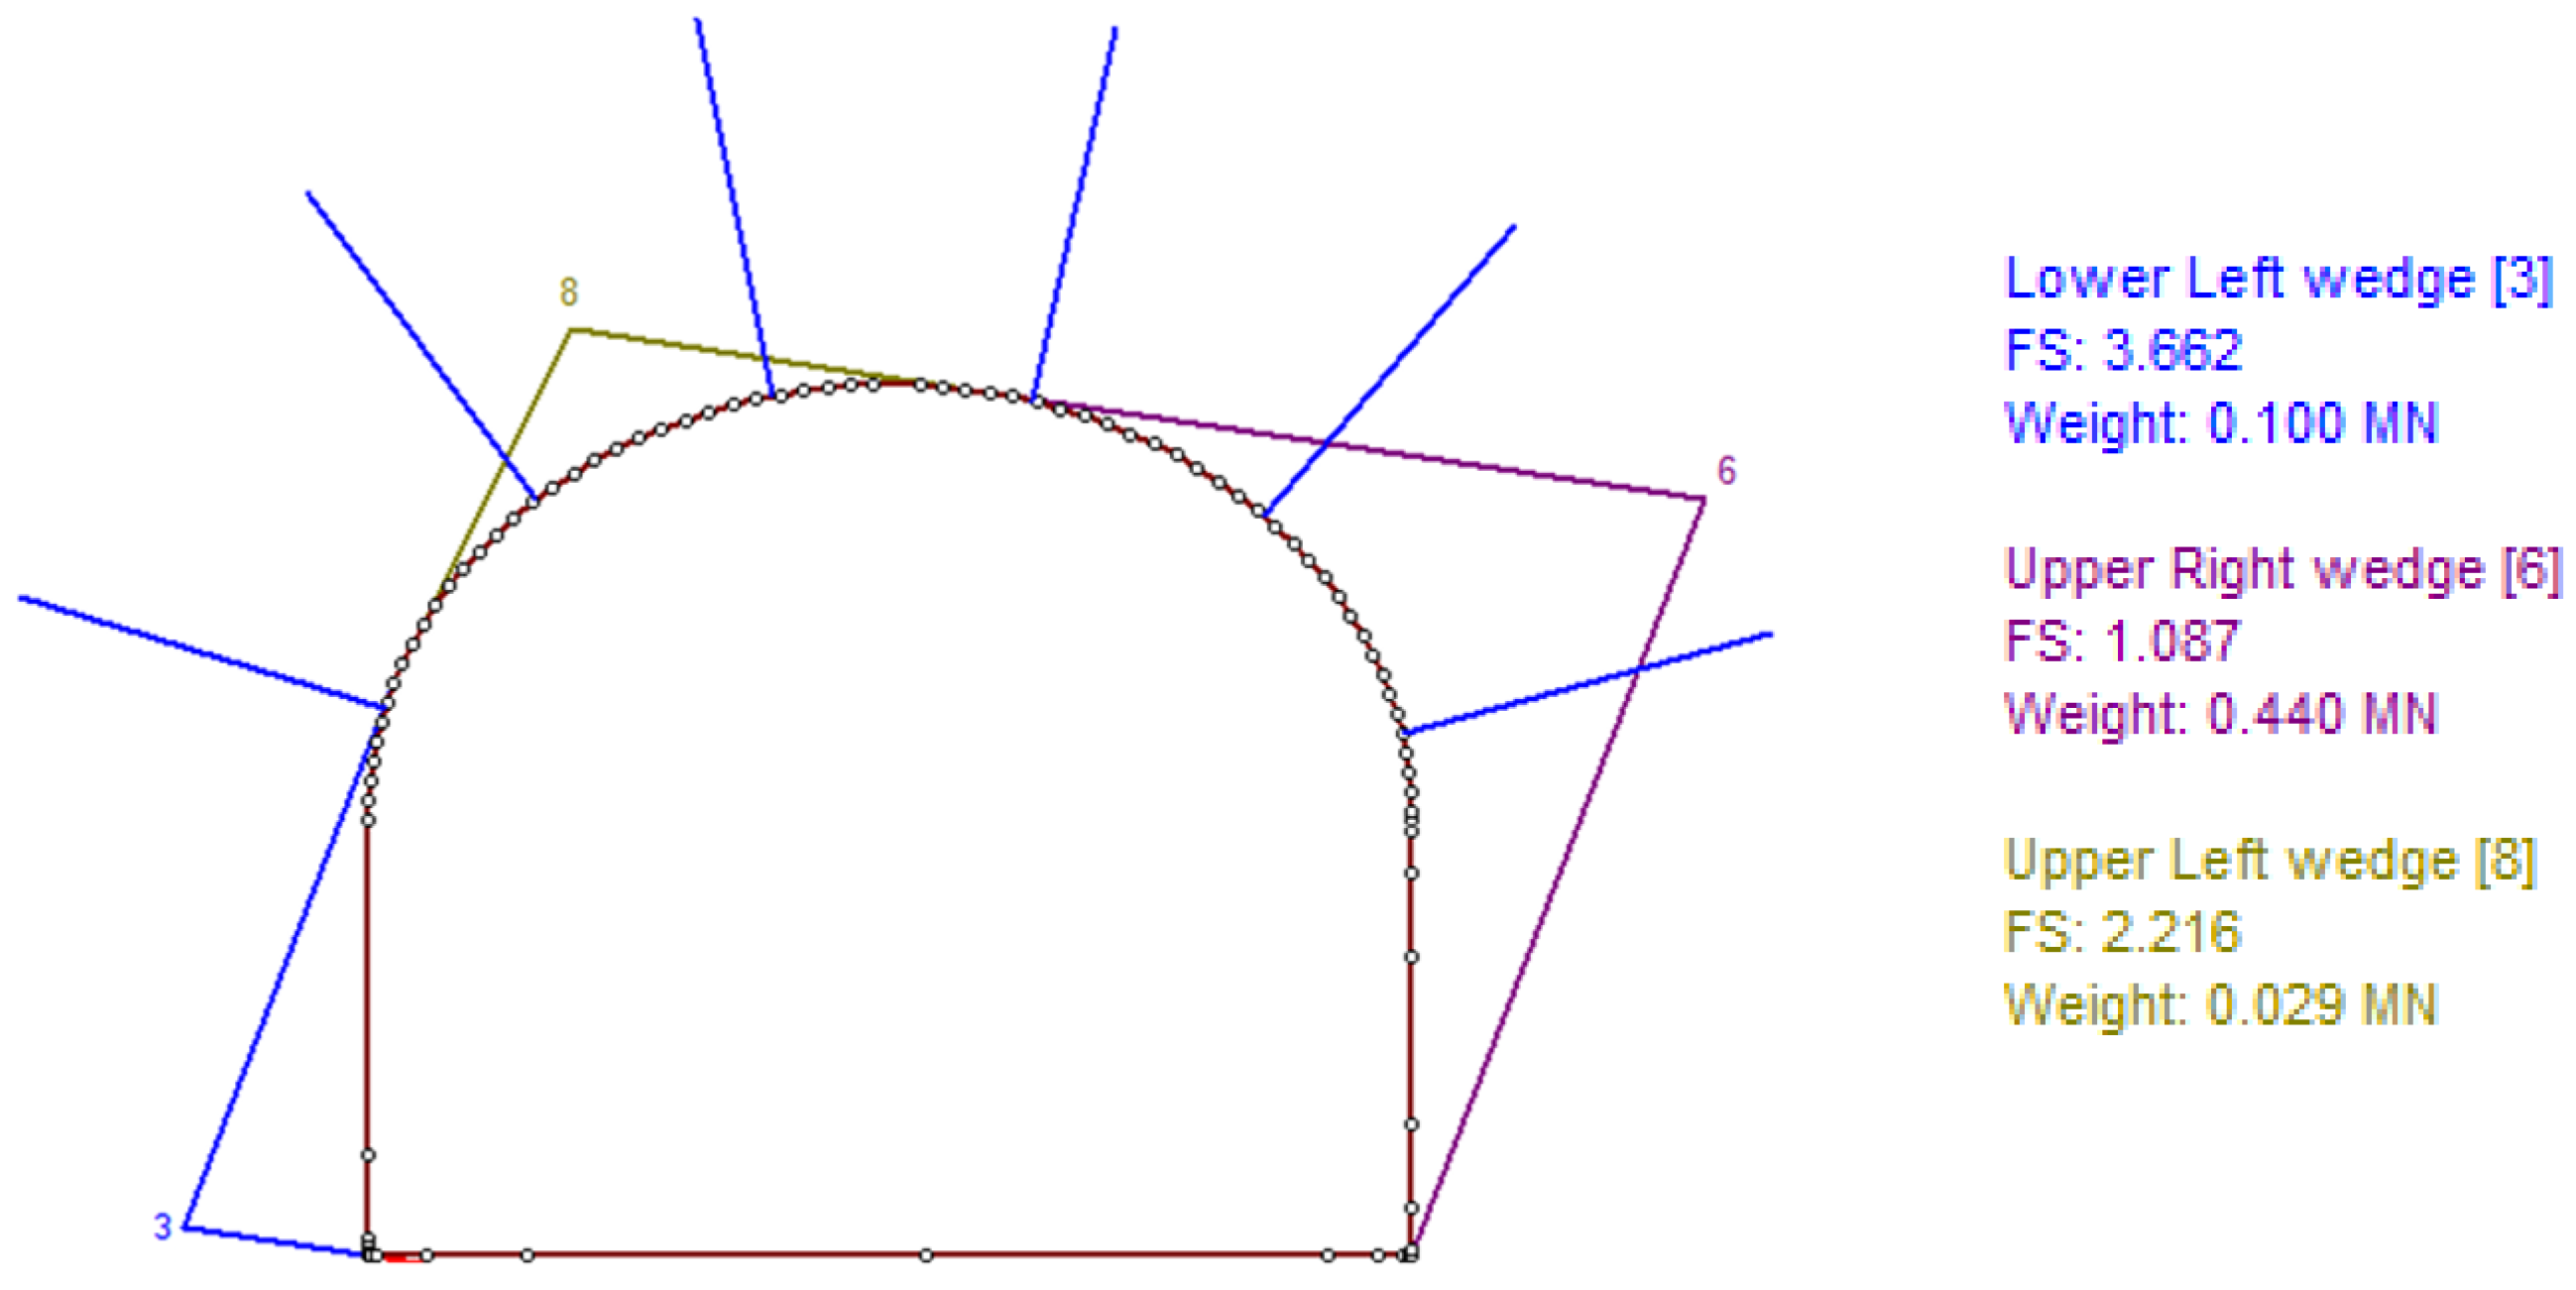
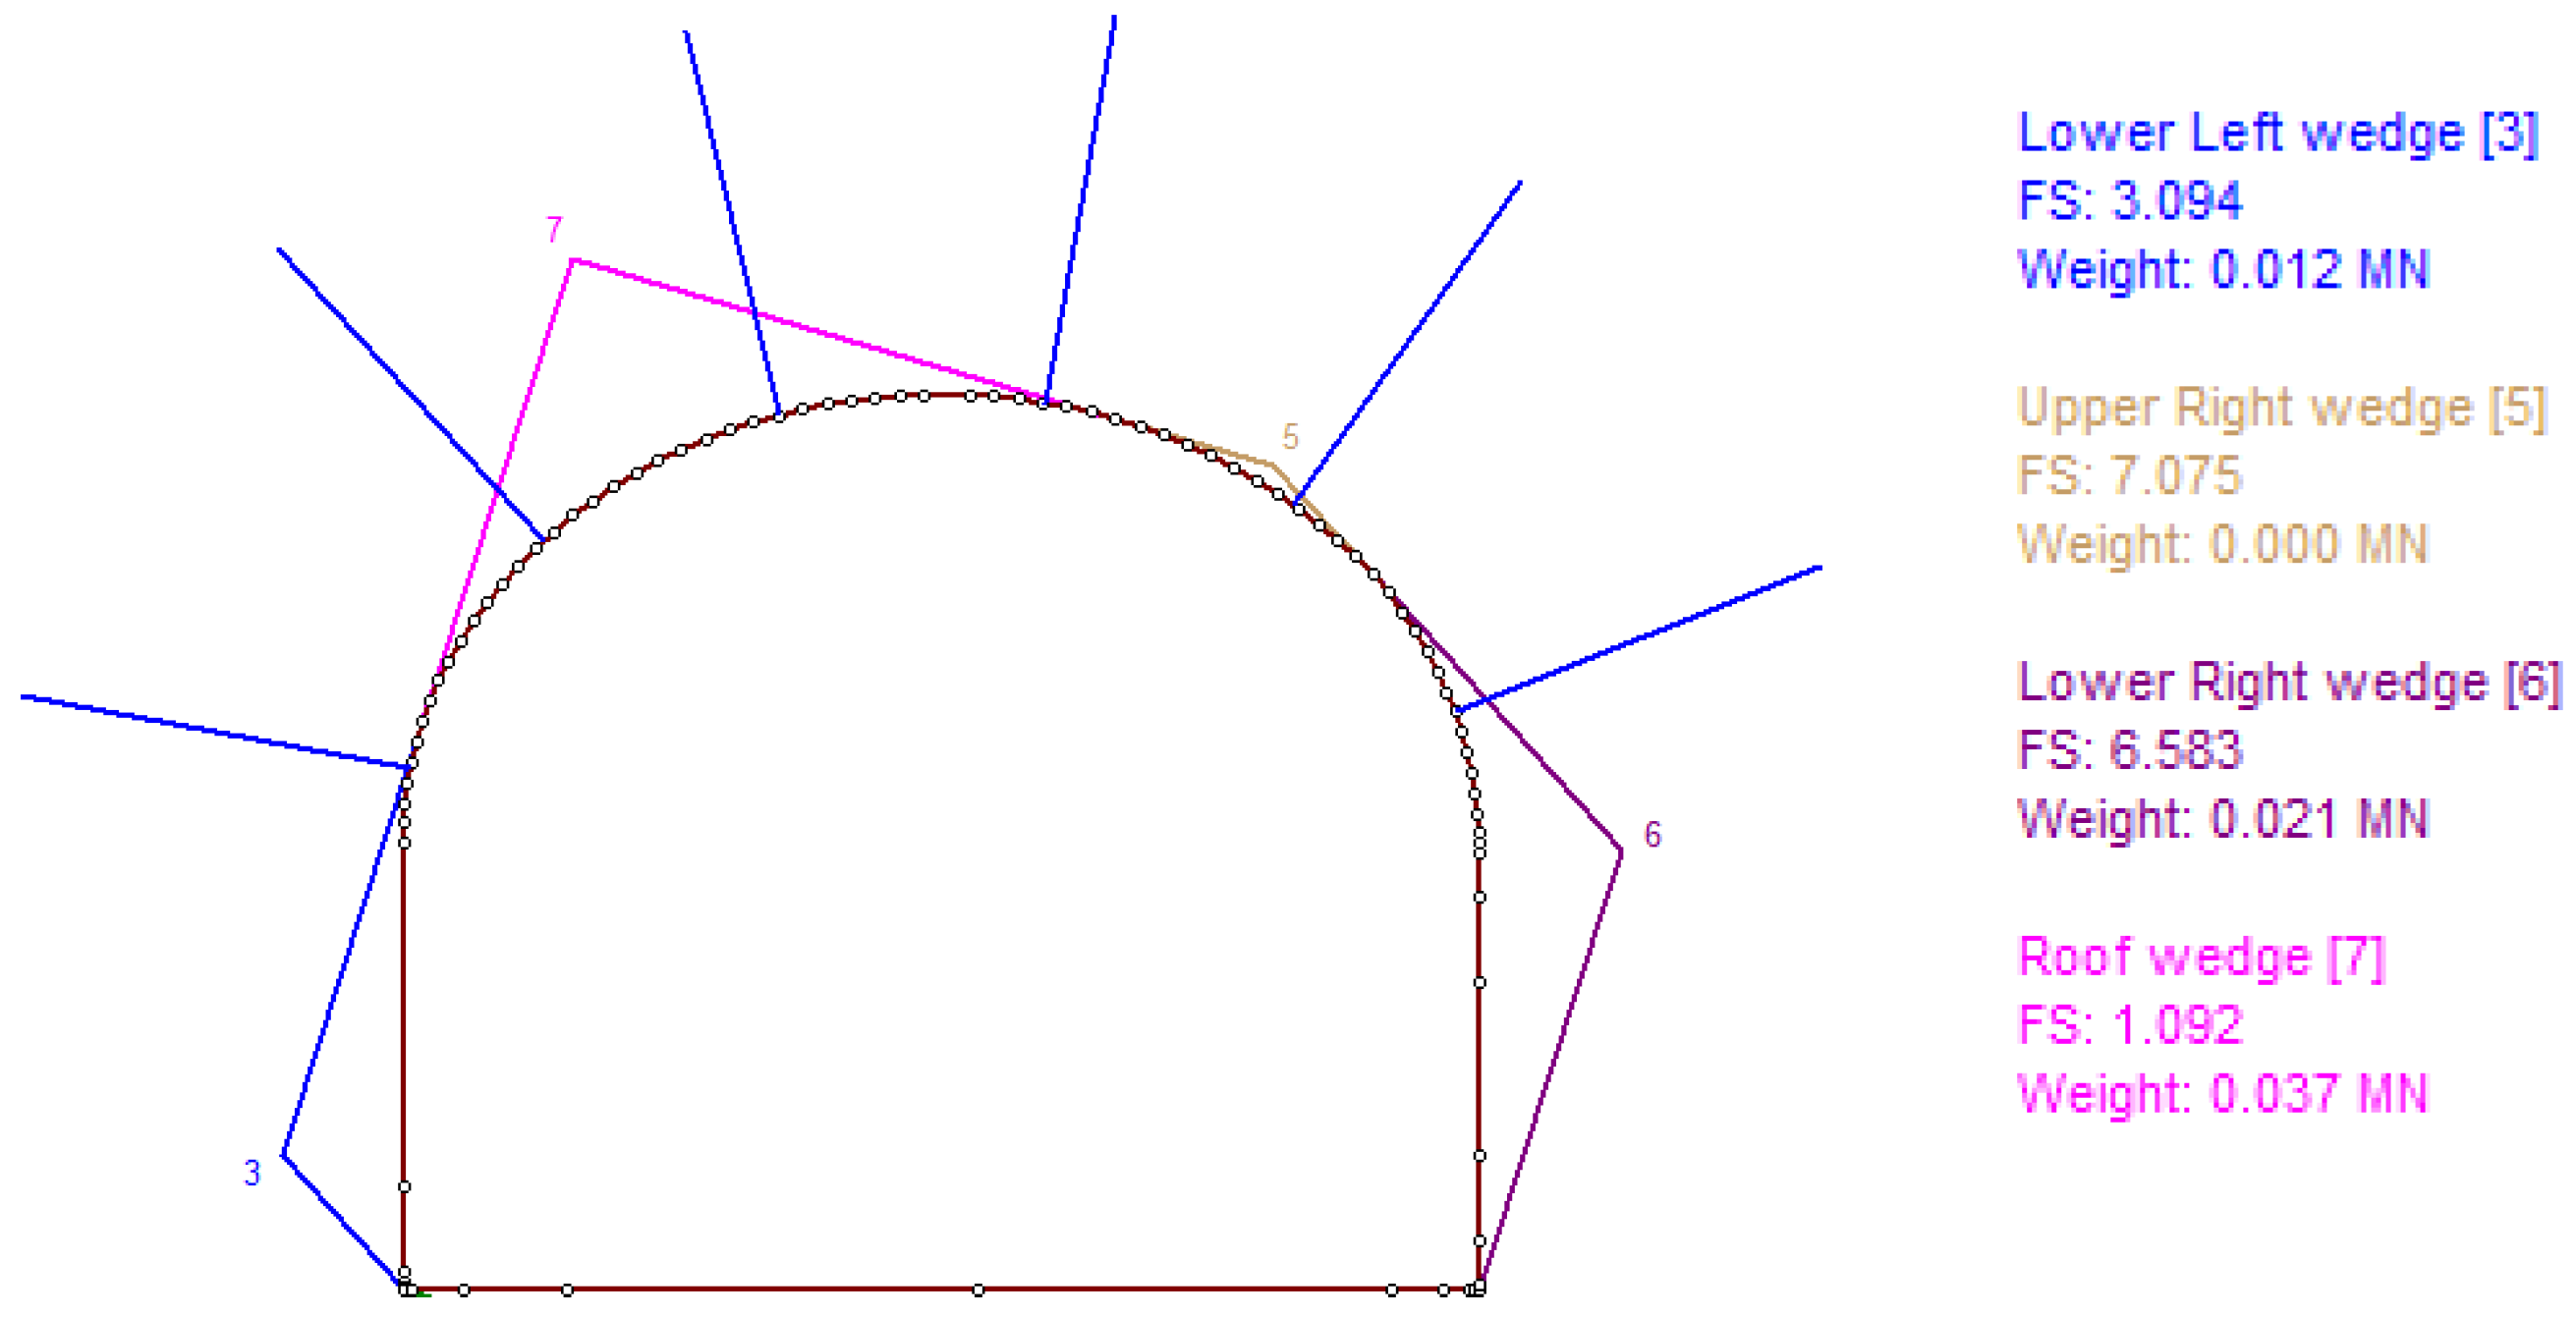
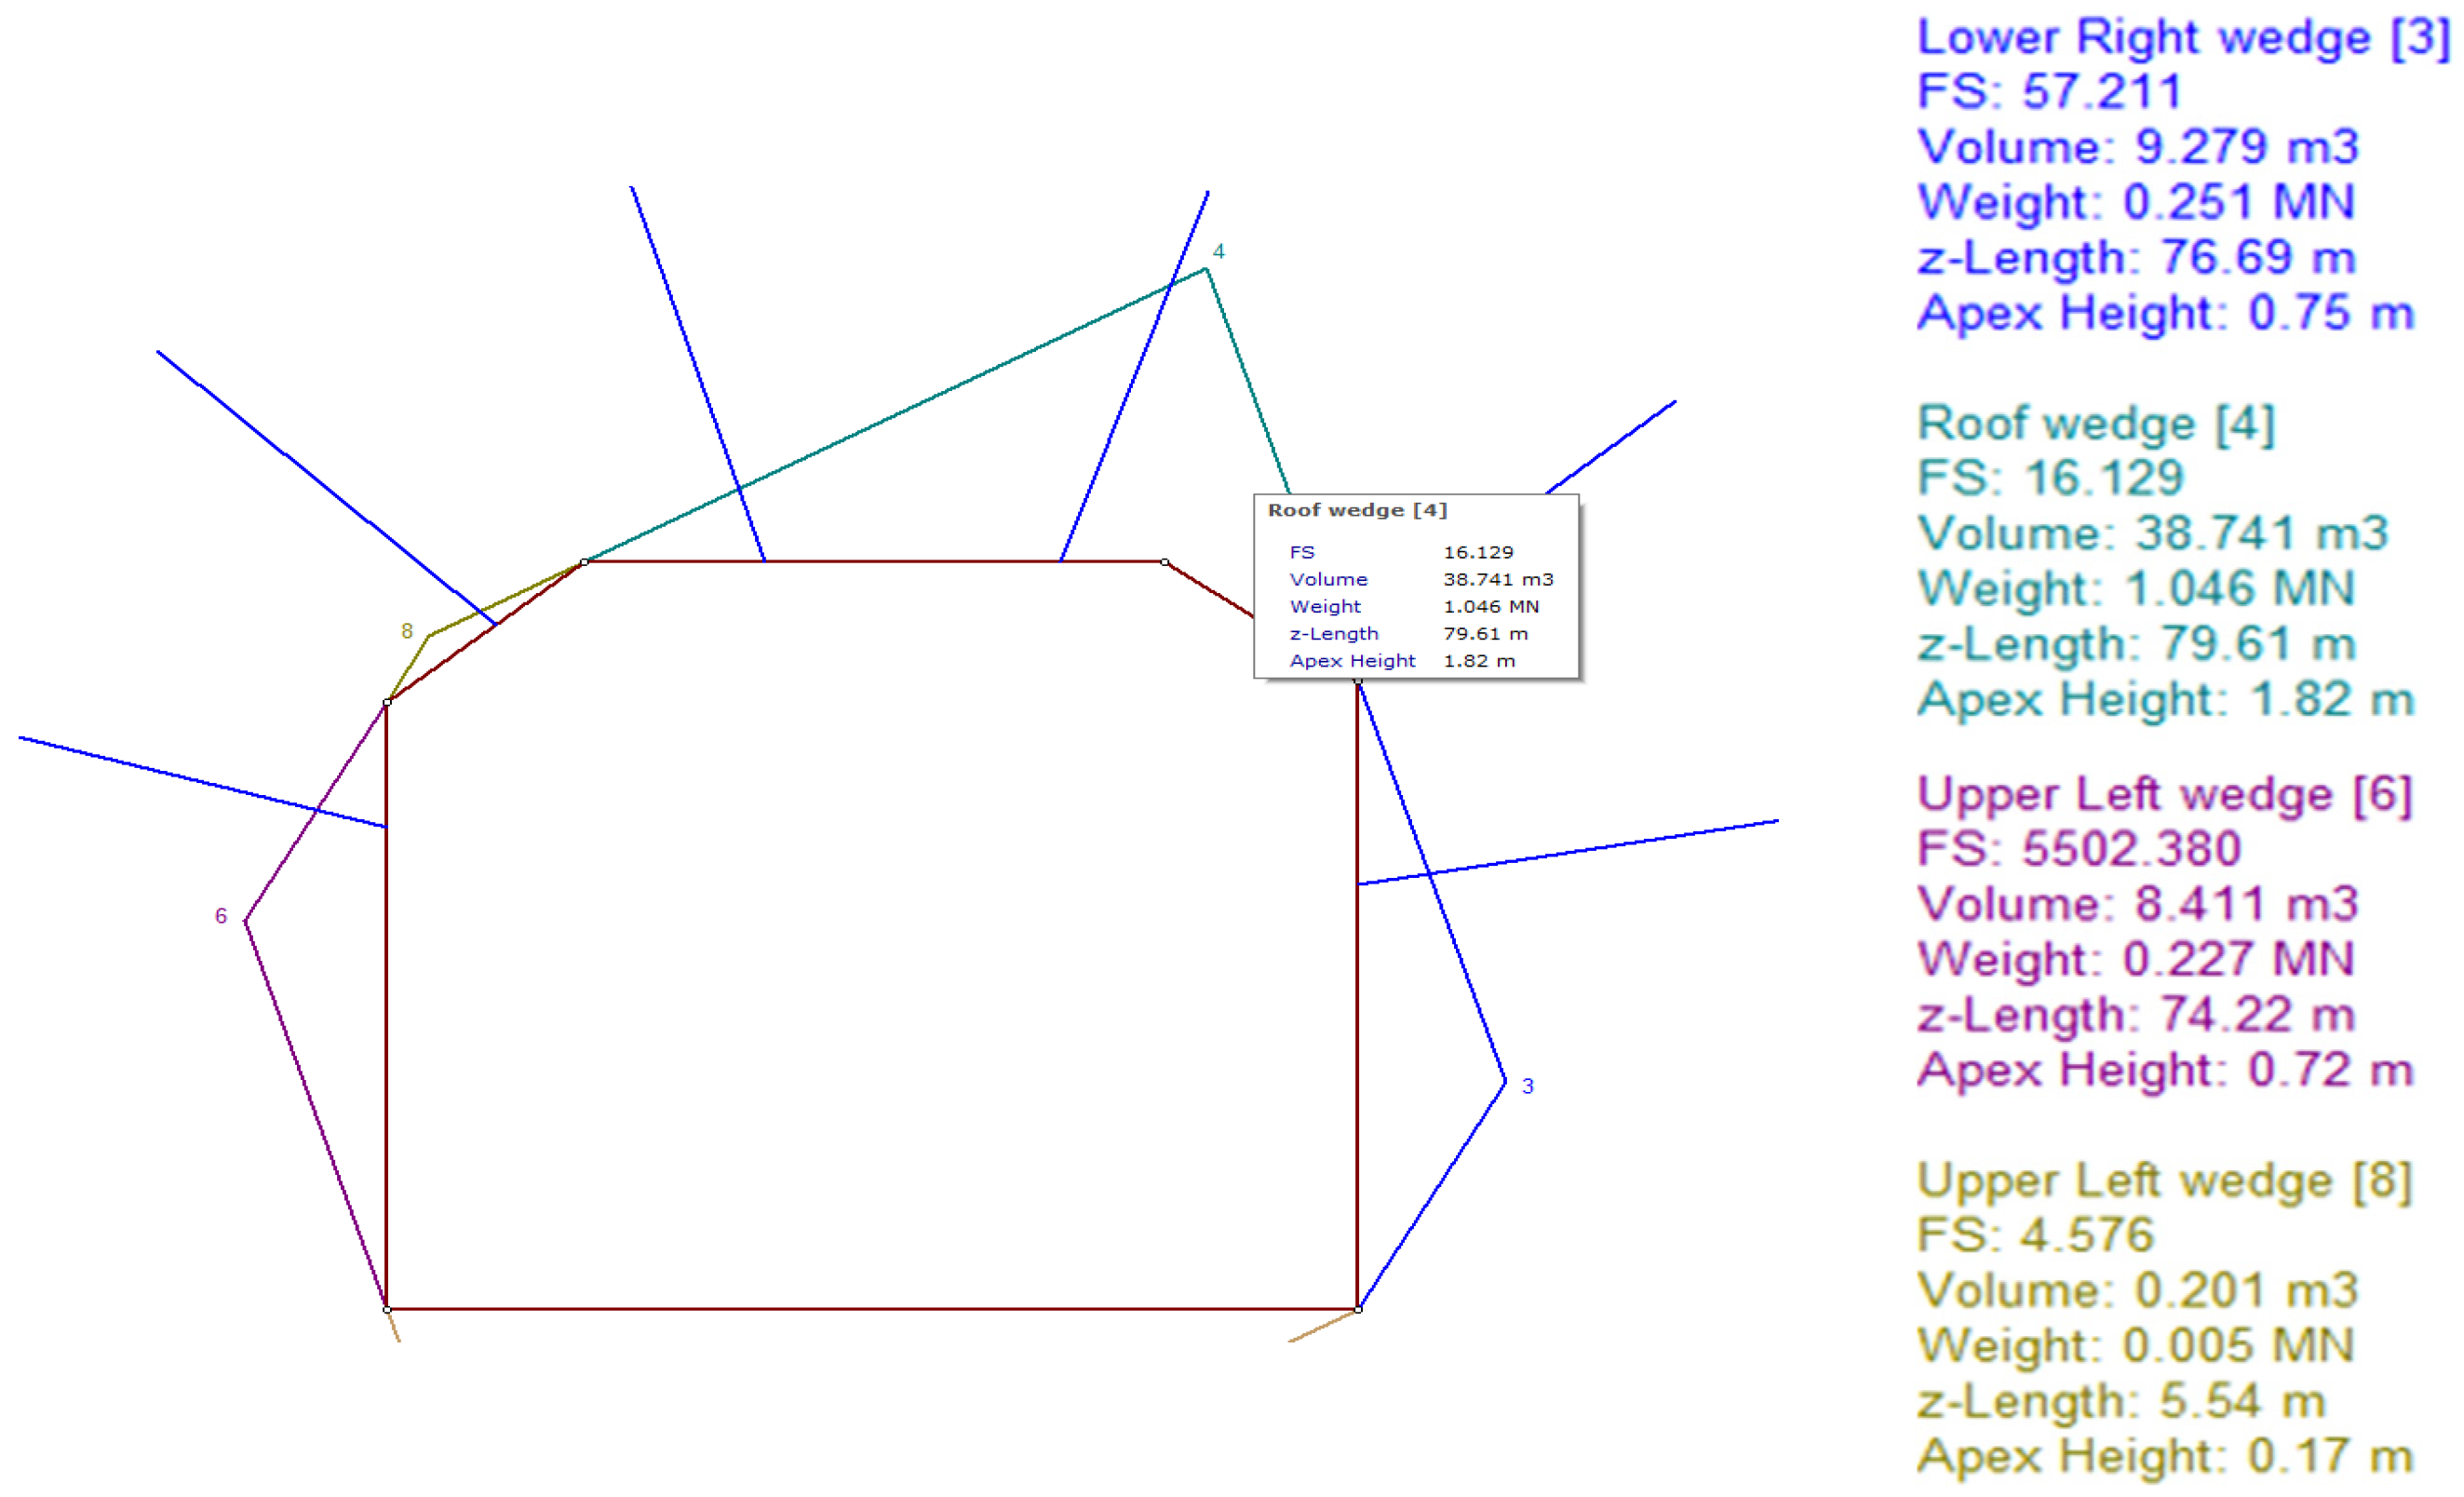
Figure 6, Figure 7, Figure 8 and Figure 9 present the results of the probabilistic analysis conducted in UnWedge to justify the optimal parameters of rock bolt and shotcrete support. In the UnWedge output diagrams, the blue lines indicate the orientations of fracture planes that define potential wedges. These lines should not be confused with support elements (rock bolts); they represent discontinuities in the rock mass included in the probabilistic stability analysis.
Figure 6, Figure 7, Figure 8 and Figure 9 present the results of the probabilistic stability analysis in UnWedge. The calculations show that when using only rock bolt support, the factor of safety (FS) of wedges does not exceed 1.09–1.17, which is below the threshold value of 1.2 and indicates a risk of collapse. At the same time, the combination of rock bolts and shotcrete support (SCL) with a thickness of at least 0.05 m increases FS to 2.4–3.5, ensuring reliable rock mass stability and reducing the probability of wedge failures.
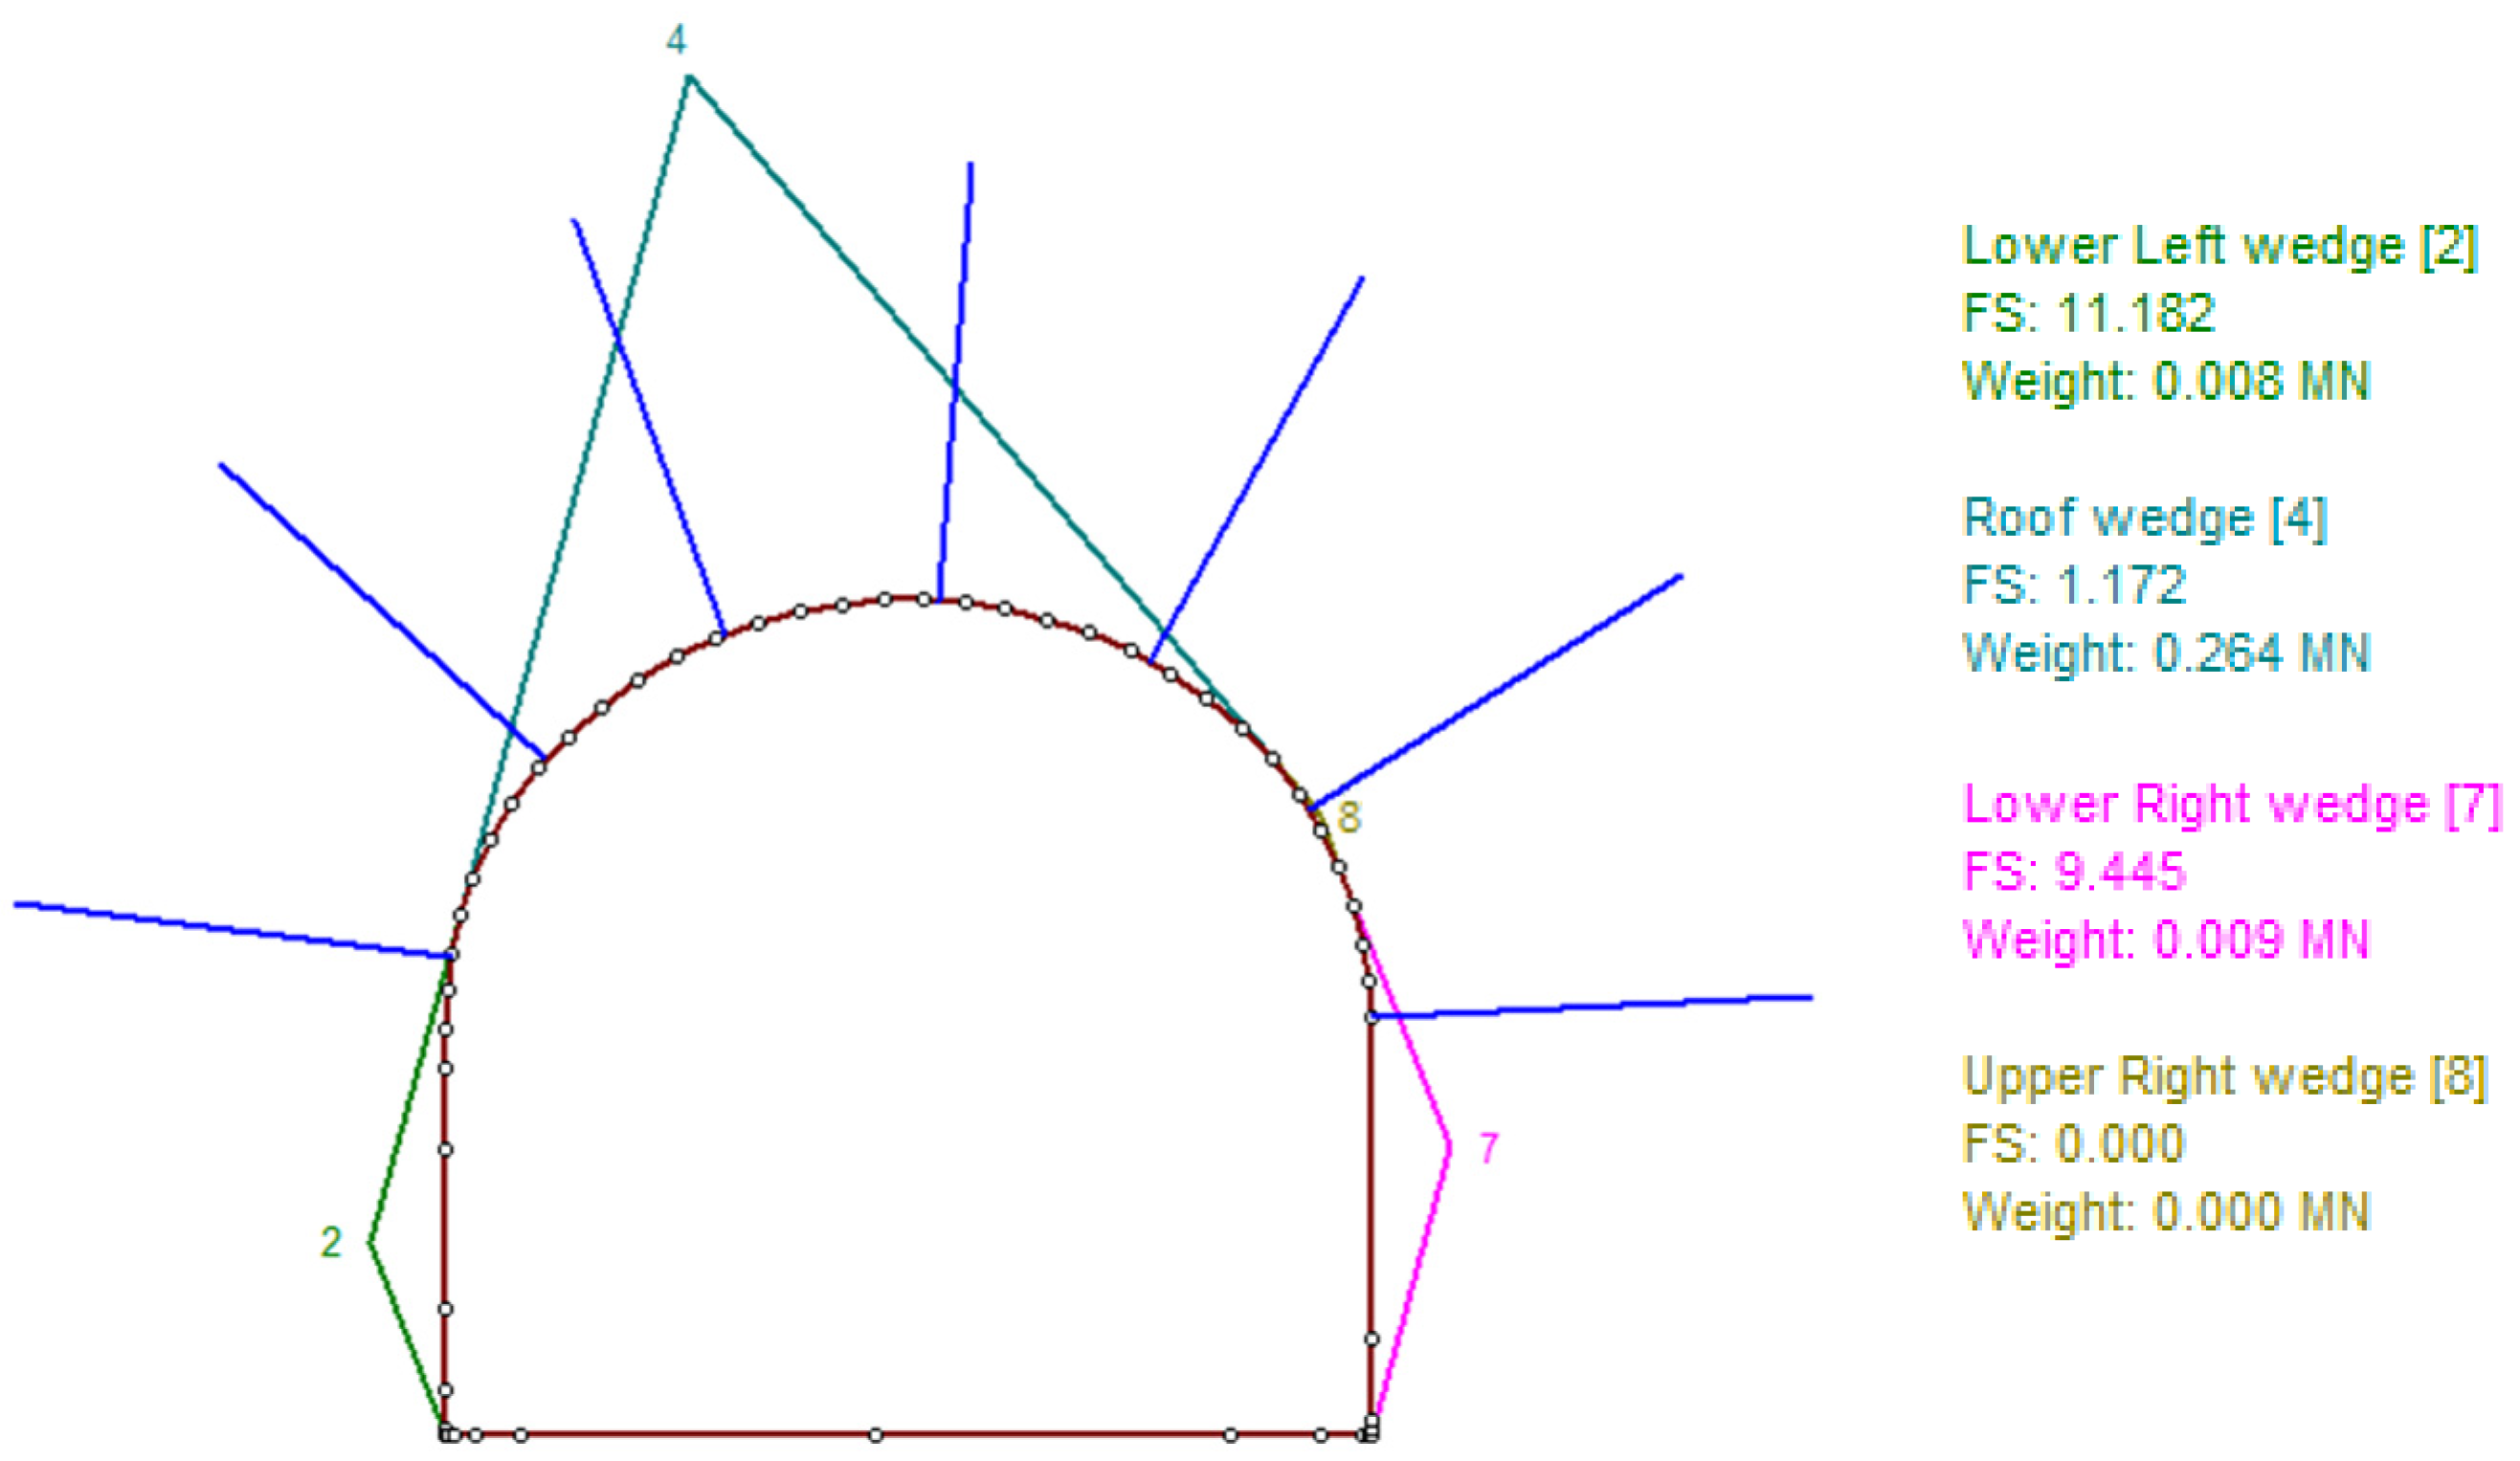
The results for the 270 m horizon (Figure 10) show that when only rock bolt support is applied, FS = 1.172, i.e., at the threshold level of 1.2. Additional application of shotcrete increases FS to 3.461, which is more than three times the normative value and confirms the high efficiency of combined support at this horizon.
Engineering interpretation. The presence of water-bearing fractures (increased pore pressure) and the growth of in situ stresses, according to general geomechanical considerations, reduce the calculated FS and narrow the “safe orientation window.” For sections with signs of moisture and/or elevated stresses, it is recommended to adopt combined support (rock bolts + shotcrete) as the baseline scheme, with provision for local reinforcement by reducing bolt spacing, increasing bolt length, and upgrading shotcrete class and thickness.
Table 1 summarizes the final FS values: with SPAS alone, FS < 1.2; with a combination of anchors and shotcrete of at least 0.05 m thickness, the stability of the surrounding rock mass is ensured (FS > 1.2). FS values are given with corresponding uncertainties (±0.05–0.1) reflecting input variability and numerical approximation in UnWedge. Uncertainties (±) represent generalized values adopted from probabilistic simulations.
Link to monitoring: field recording of moisture and slab failure indicators in problematic areas was used to update the input data for probabilistic analysis and to confirm the necessity of combined support in critical orientations. Thus, monitoring acts as a trigger for revising the support scheme when FS decreases.
Figure 11 below shows the dynamics of FS for different support options.
Figure 11 below shows the dynamics of FS for different support options. The x-axis in Figure 11 (“probabilistic analysis index”) represents case numbers corresponding to excavation conditions listed in Table 1. The graph clearly demonstrates a significant difference in wedge stability under different support schemes: for the bolt-only option, FS = 0.94–1.17 (insufficient), whereas combined support (rock bolts + shotcrete ≥0.05 m) provides FS = 2.4–3.5, confirming the feasibility of the combined scheme. Error bars indicate uncertainties (±0.05 for bolts; ±0.1 for bolts + shotcrete) arising from input data variability and numerical approximation. In this analysis, shotcrete thickness was fixed at ≥0.05 m. Therefore, the results primarily contrast with bolt-only and combined support schemes. Interactions between support parameters, such as shotcrete thickness and bolt spacing or bolt length, were not explicitly explored here but represent an important direction for further refinement of combined support design.
According to the probabilistic analysis, for the “bolts-only” case FS < 1.2; therefore, to maintain stability and reduce the risk of collapse, a combination of bolts and shotcrete is required.
The determination of wedge failures depending on excavation azimuth and rock mass fracturing was carried out in UnWedge considering the presence of three to four fracture systems (Figure 12 and Figure 13).
Modeling in UnWedge showed that at an azimuth of 120°, wedge-shaped blocks of significant volume are formed due to the intersection of three to four fracture systems. Under these conditions, with the “bolts-only” option, FS < 1.2, indicating a high probability of collapse; combined support with shotcrete is required.
The direction of 141° is classified as critical, as wedge-shaped blocks of maximum size are formed. With the “bolts-only” option, FS < 1.2, indicating a high risk; combined support with shotcrete is required.
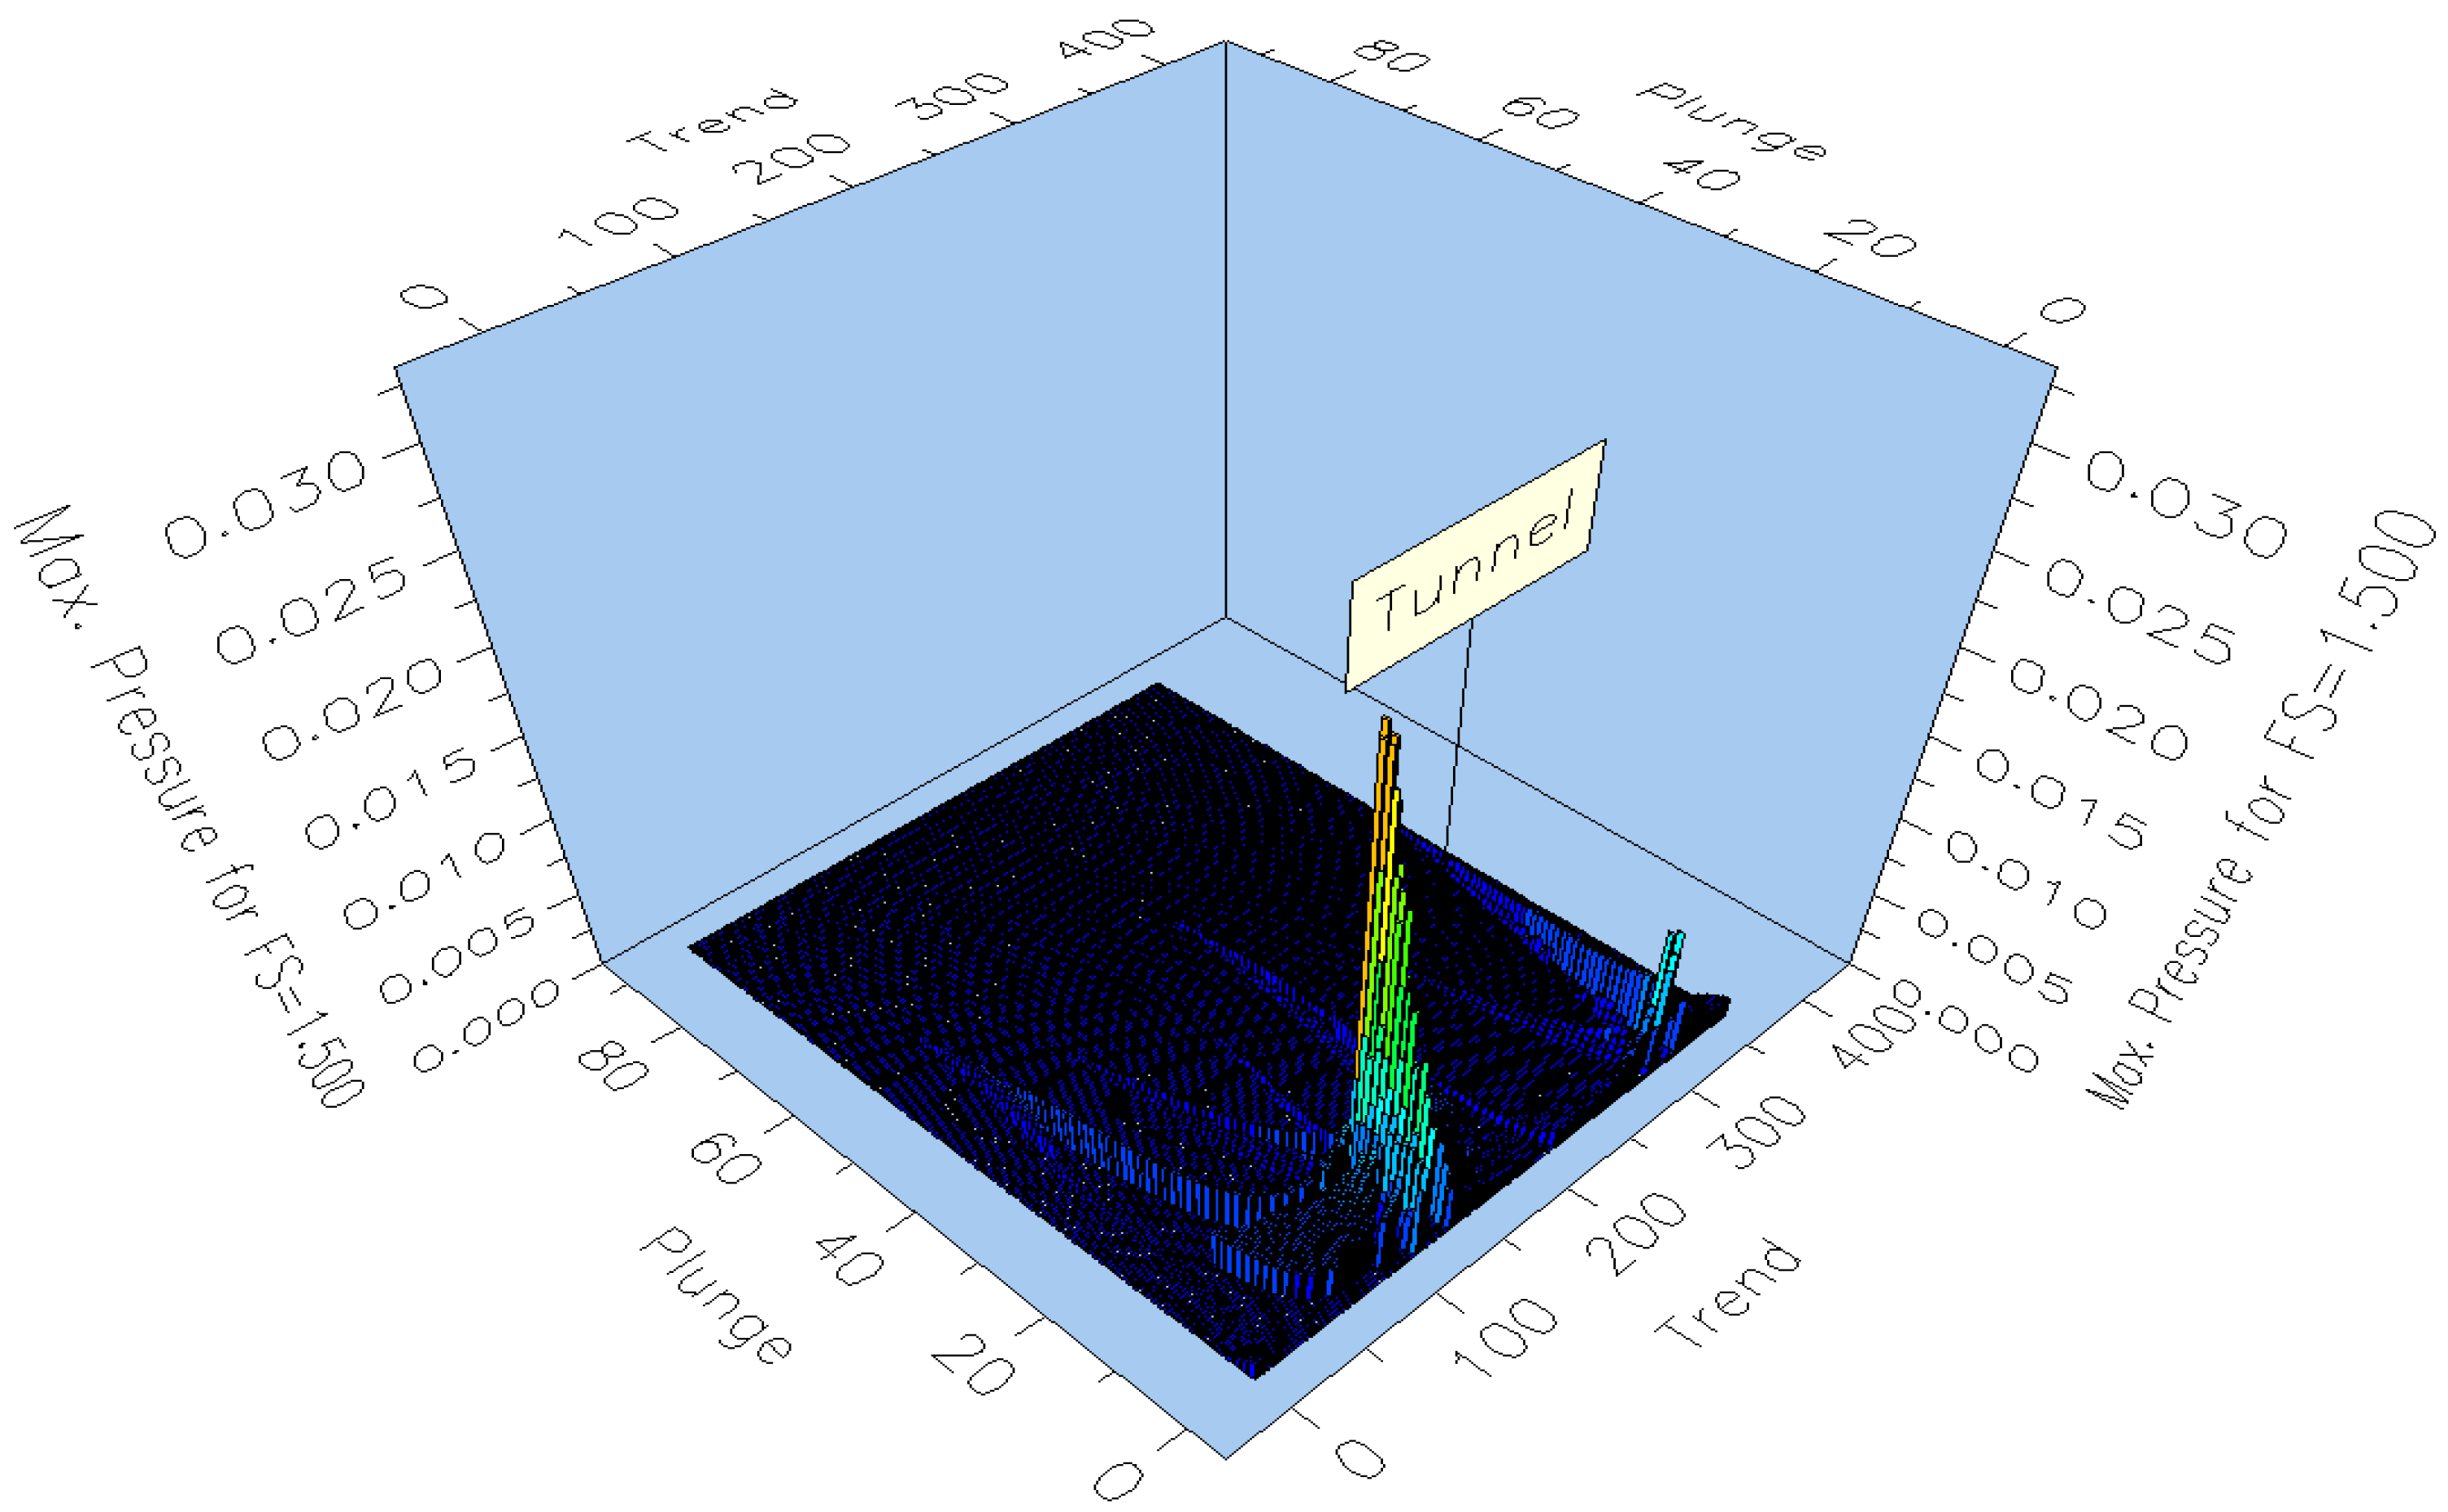
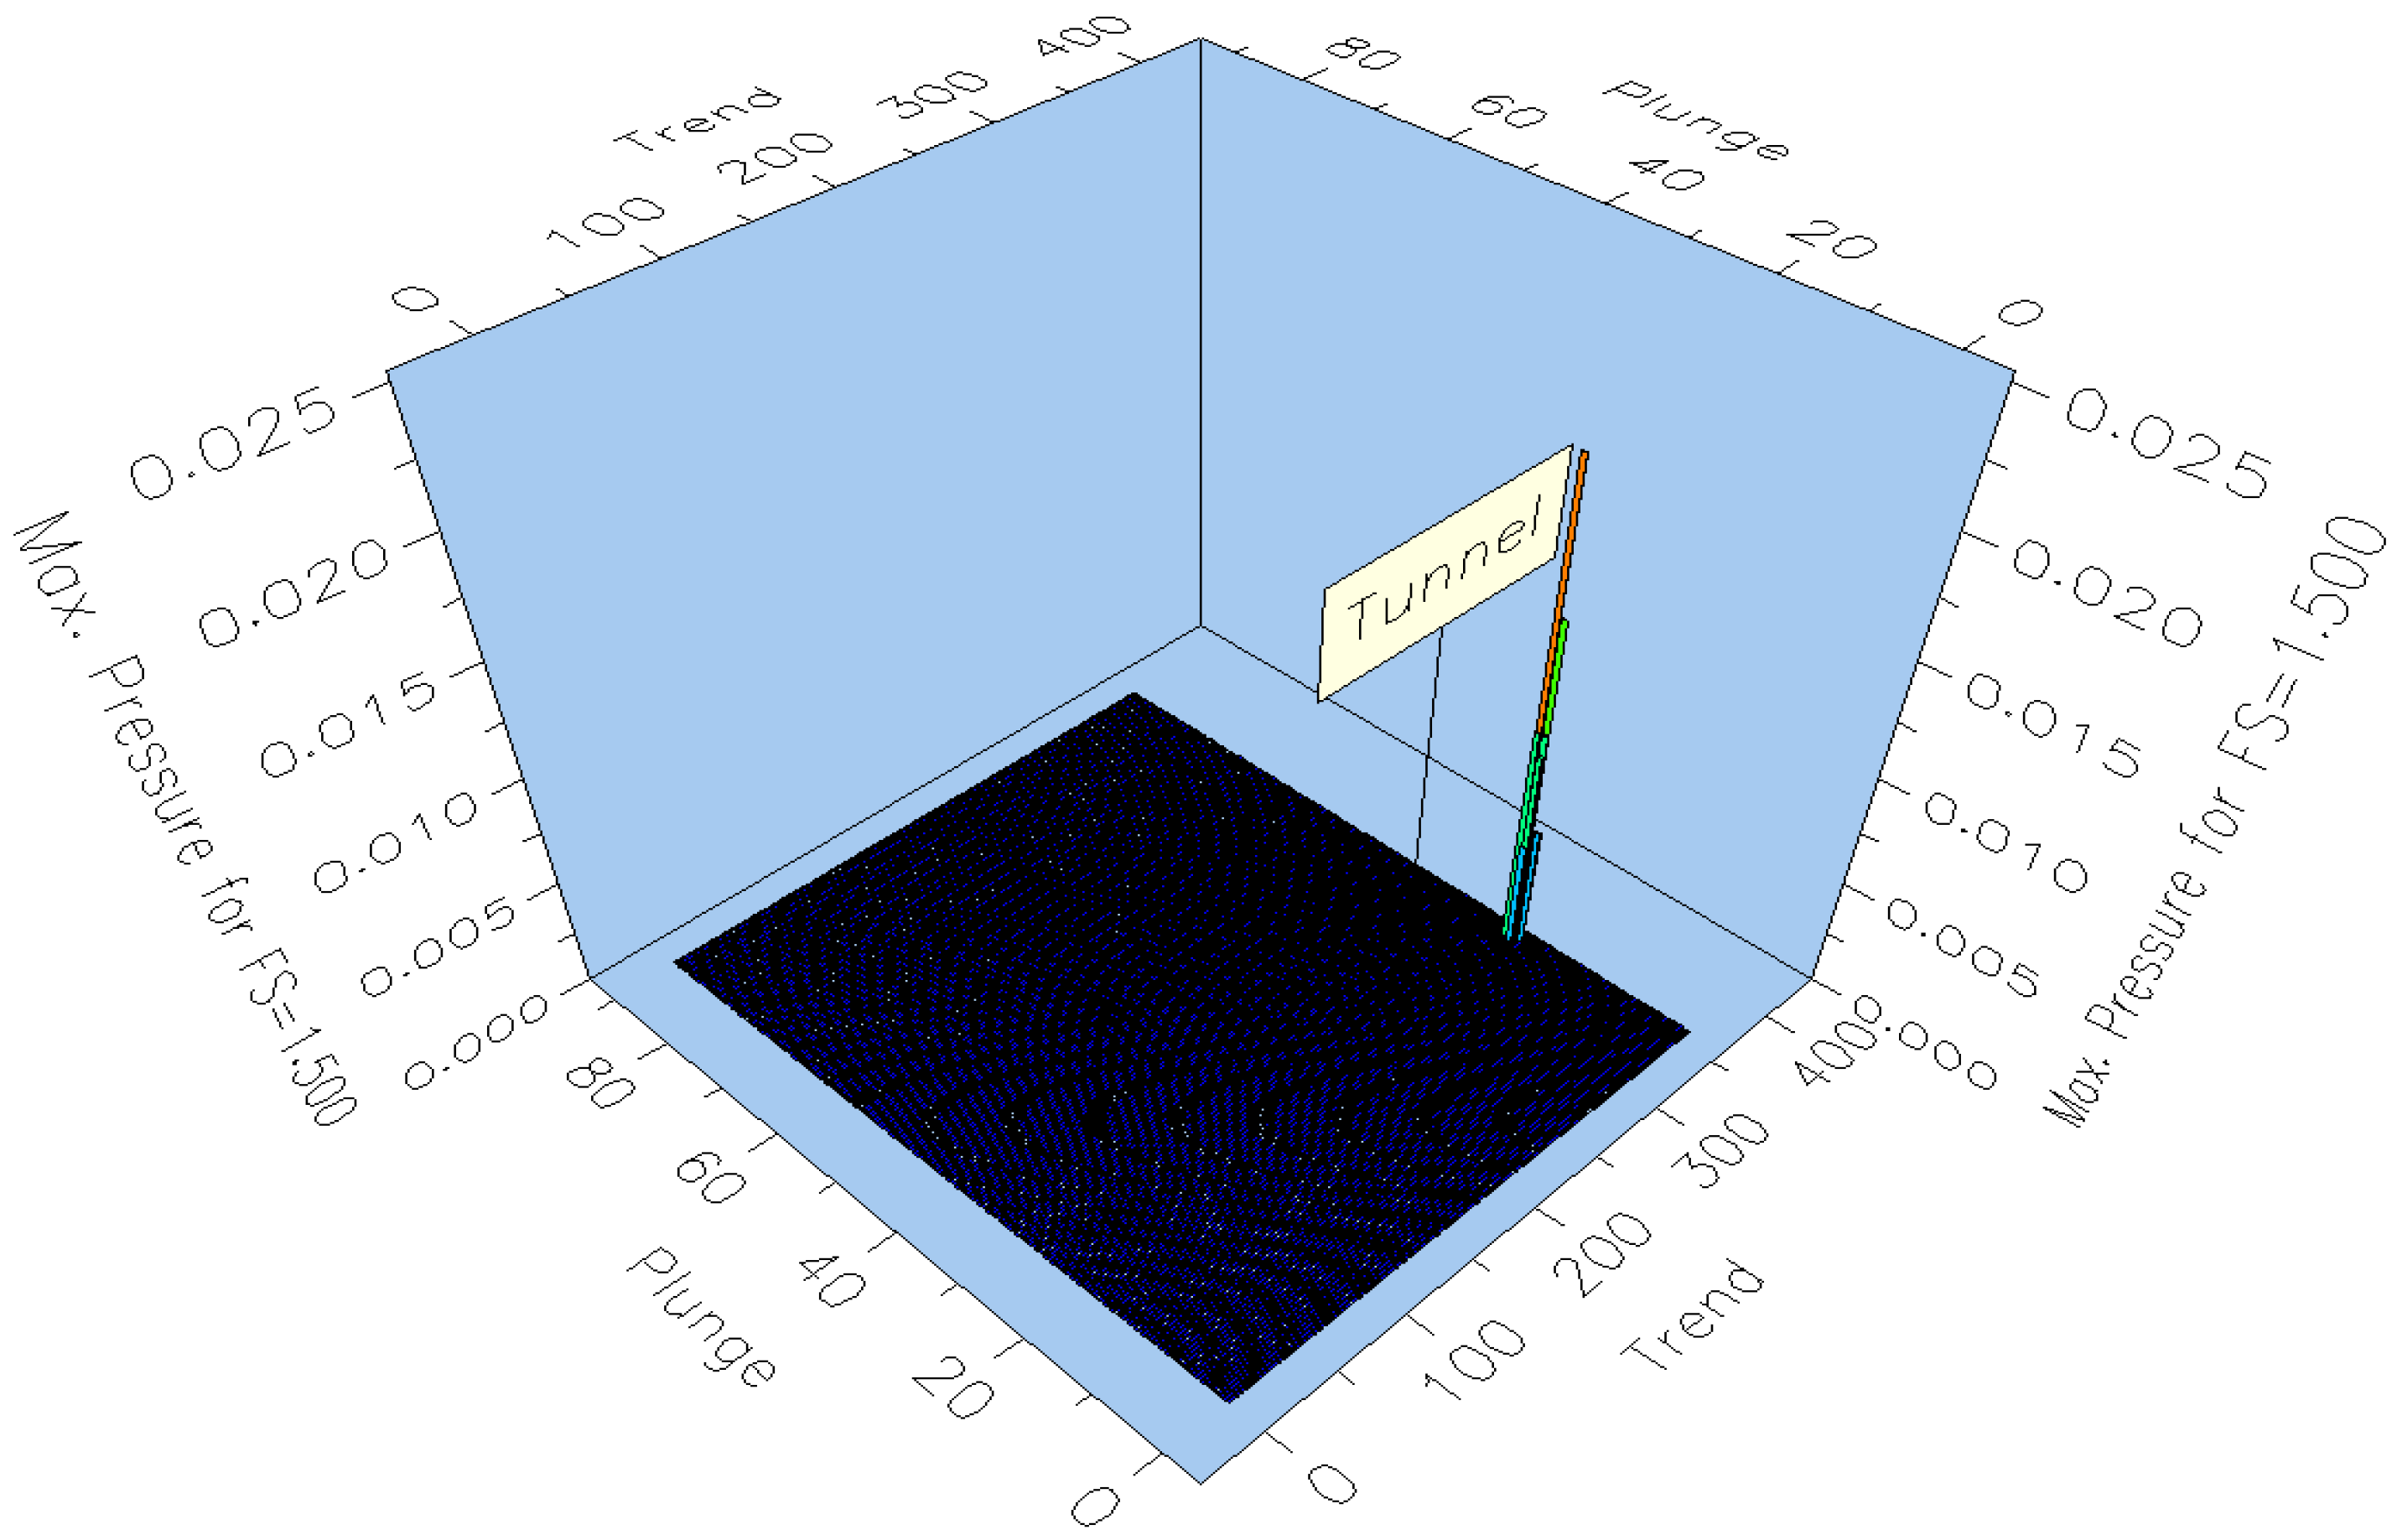
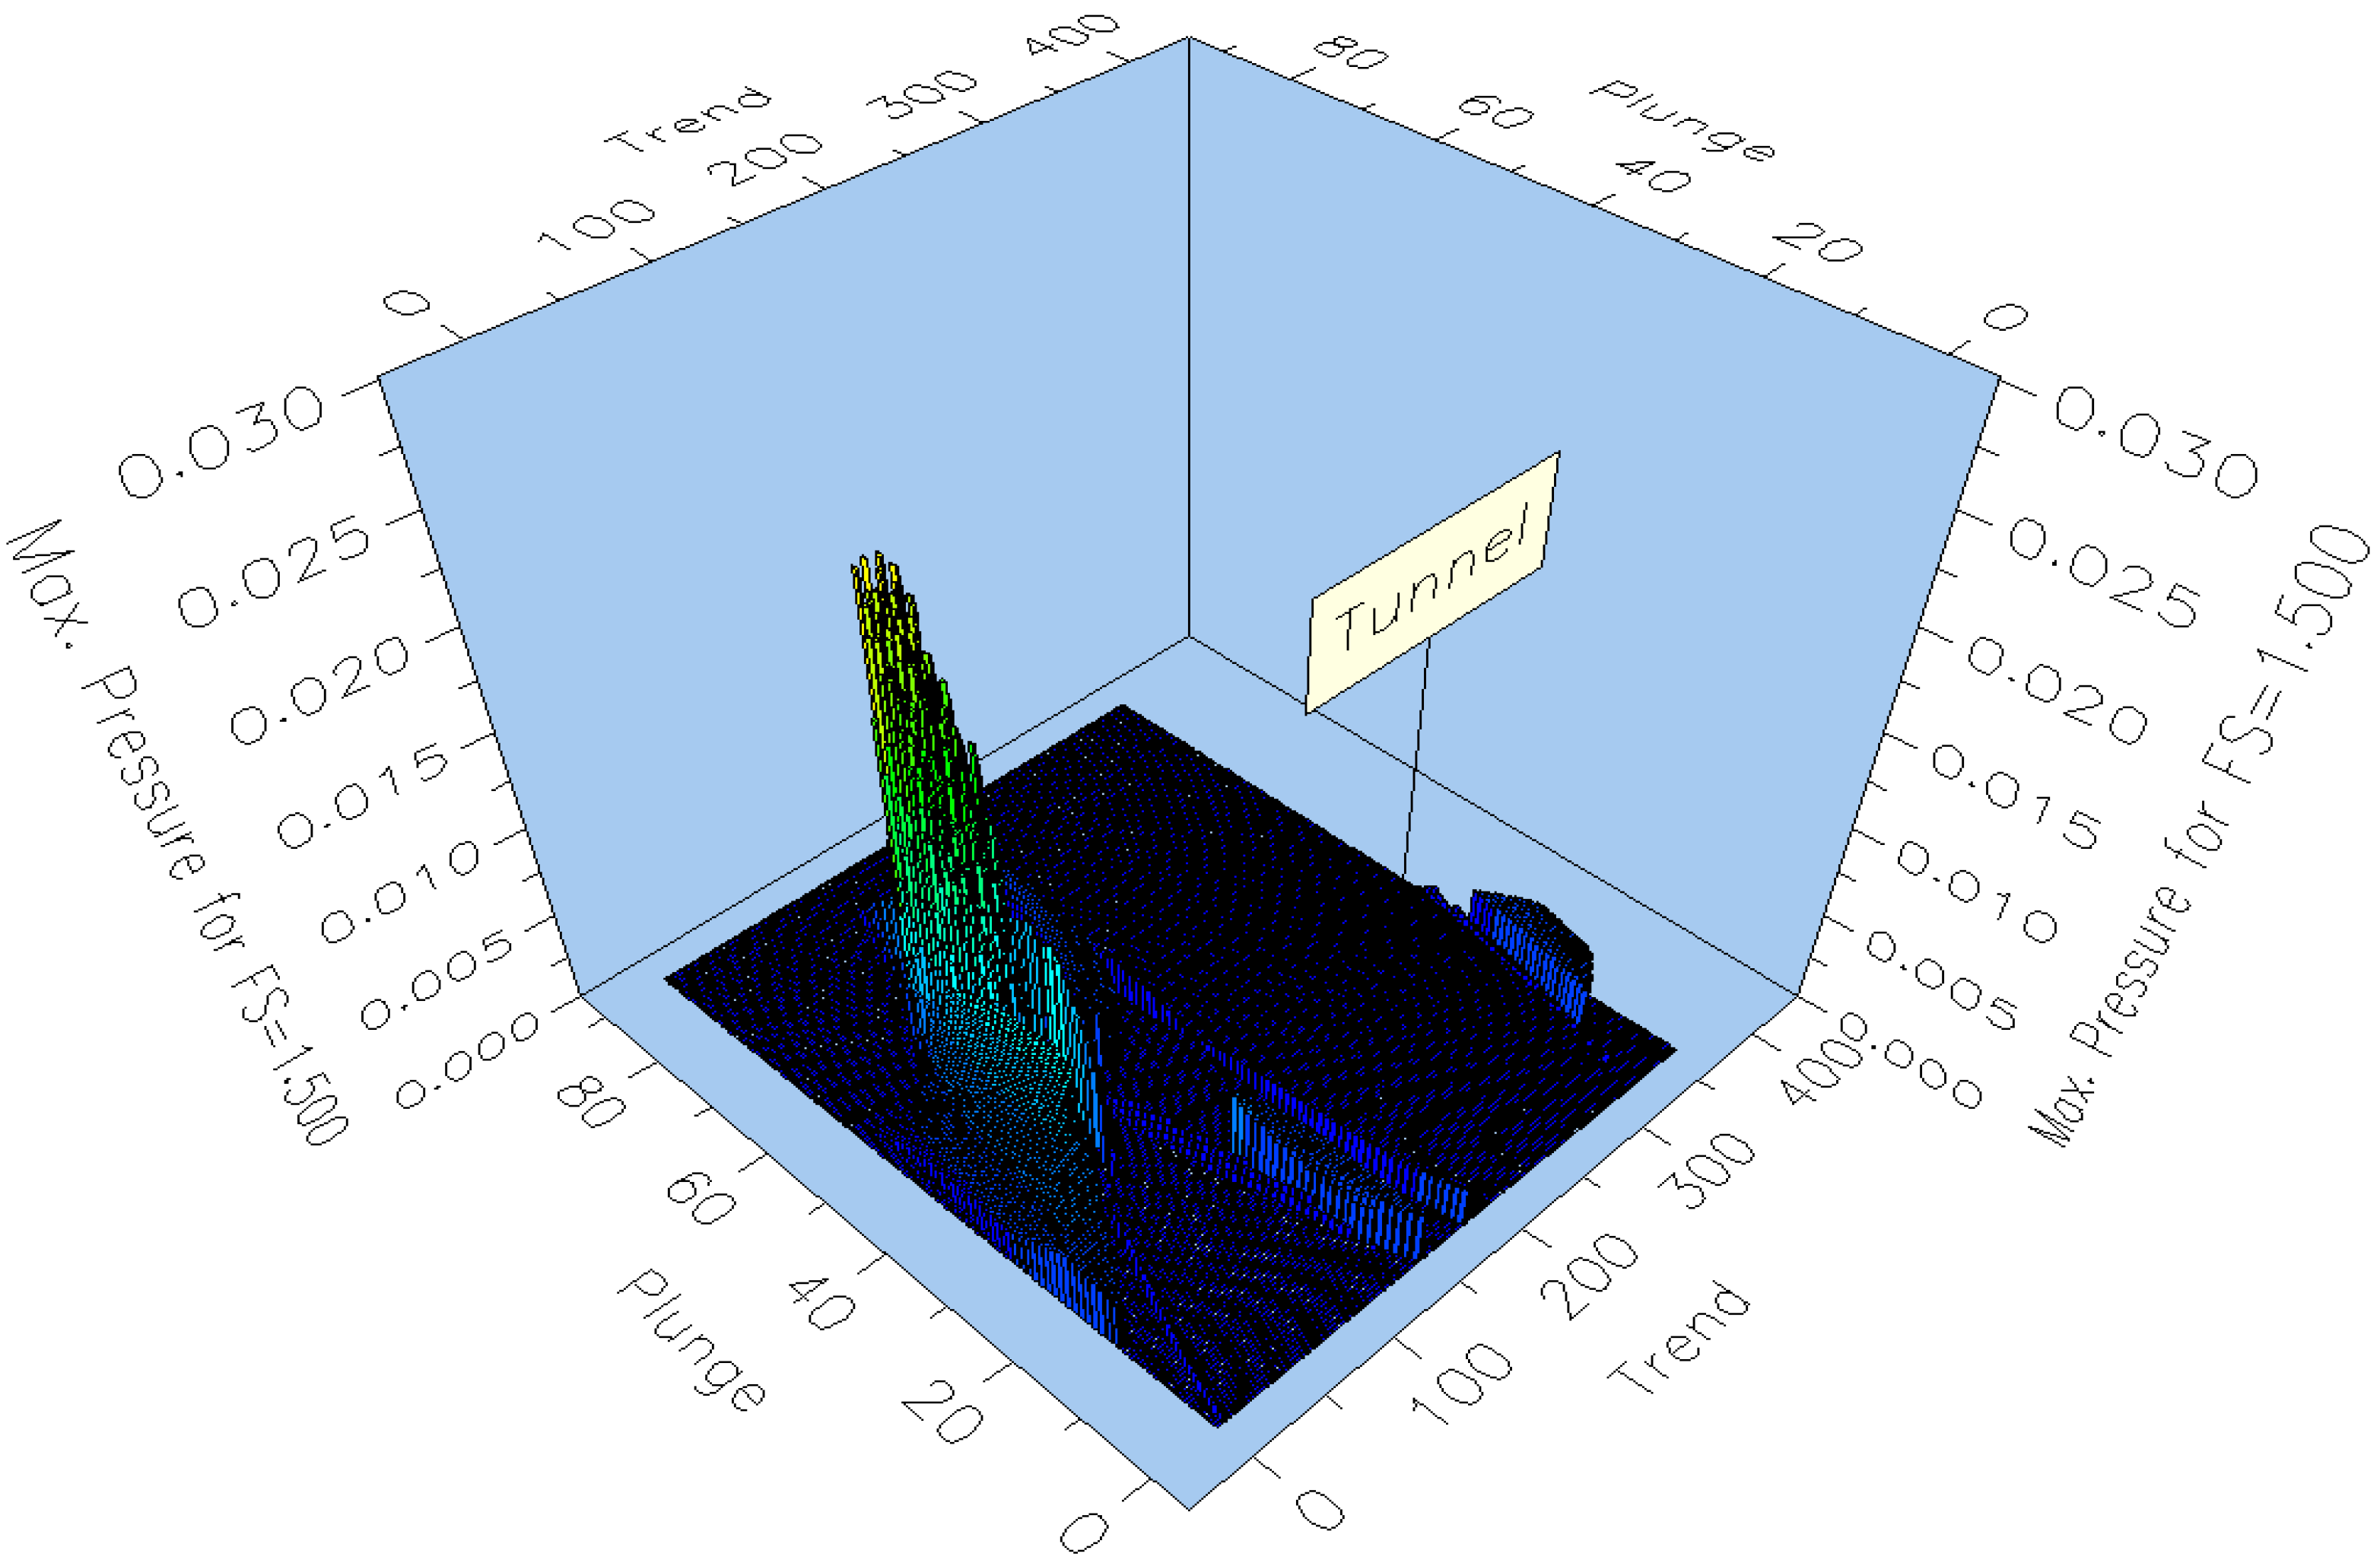
The modeling results identified critical orientations along existing fracture systems where maximum wedges are formed (Figure 14, Figure 15 and Figure 16), as well as a “safe orientation window” of 70° ± 10°, where wedge volumes are minimal.
Modeling confirmed that within panel 3 (300 m horizon), excavation orientations can be identified where wedge-shaped excavation blocks of significant volume are formed. The critical azimuths coincide with the orientation of dominant fracture systems; their intersection leads to the formation of maximum wedges. Under these conditions, with the “bolts-only” support option, FS falls below the normative value, indicating a high risk of collapse and the necessity of combined support.
The analysis revealed zones of wedge-shaped block formation with increased hazard. Under these conditions, with the “bolts-only” support option, FS remains below the critical value of 1.2, which is associated with a high probability of collapse. The application of combined support with shotcrete more than doubles FS and ensures control of rock mass stability.
Modeling showed that the size and configuration of wedges strongly depend on the excavation orientation relative to fracture systems. At unfavorable azimuths, wedge-shaped blocks of significant volume are formed; for these, with the “bolts-only” support option, FS falls below the normative value (FS < 1.2). This requires consideration of excavation orientation in design and the use of combined support, which provides a sufficient safety margin.
Stress measurements in the Zhylandy ore field confirmed a thrust-faulting regime according to Anderson’s classification (σ1 > σ2 > σ3), where σ1 and σ2 are the horizontal principal stresses (σHmax, σHmin), and σ3 is the vertical stress (σv). This finding is consistent with the linear “stress–depth” relationship (see Table 2 and Figure 17). At depths of 100 and 310 m, the following values were obtained: σ1 = 6.0–18.0 MPa, σ2 = 4.0–11.0 MPa, and σ3v) = 2.7–8.3 MPa; the thrust-faulting regime remains valid. The reported uncertainties (±) reflect measurement errors and the variability of hydraulic fracturing (HF) stress determination.
The presented dependence indicates a thrust-faulting regime in which horizontal stresses exceed the vertical stress. This confirms the tectonic nature of the rock mass stress state and suggests that stability will be further reduced with increasing mining depth.
Direct measurements at the deposit revealed the presence of three to four fracture systems. Modeling results established critical orientations along these fracture systems where maximum wedges are formed, which are associated with the risk of large wedge failures. Critical excavation orientations were determined (see Figure 14, Figure 15 and Figure 16): azimuths corresponding to the largest and smallest wedge volumes, with a “safe window” of 70° ± 10°.
Prospective extension of the analysis. For scenarios involving moisture and elevated stresses, calculations are recommended within the effective stress framework σ′ = σ − u, where σ is the total normal stress and u is the pore pressure. In such cases, variations in joint friction angle and joint cohesion (software terms: Joint Friction Angle/Joint Cohesion), as well as scaling of in situ stresses according to the measured “stress–depth” trend (see Figure 17), should be considered. In this study, these scenarios are addressed at the level of engineering recommendations, without additional simulations.

4. Discussion

4.1. Comparison with Existing Methods

The probabilistic approach provides a more realistic assessment of stability compared to deterministic models, as it accounts for the variability of fracture system geometry and properties. The threshold stability criterion is interpreted as a normative reliability level: bolt-only support under well-developed fracturing tends to provide insufficient safety margins, whereas consideration of excavation orientation and combined support schemes enables risk control of wedge failures (detailed quantitative results—see Section 3.2 and Table 1).

4.2. Advantages of the Proposed Approach

An end-to-end engineering workflow was applied: field fracture mapping (scanline; RQD, FF) → stereographic analysis in Dips → probabilistic wedge evaluation in UnWedge → verification of support design options. This workflow directly links surrounding rock stability with support design, taking into account the identified type of regional stress regime. The practical novelty lies in the orientation-controlled logic of support selection: first, the kinematic compatibility of fracture systems and excavation alignment is checked, and then the parameters of the combined support scheme are assigned (details—see Section 3.2 and Table 1).
Dips and UnWedge were selected because they are widely recognized industry-standard tools that allow direct incorporation of field fracture data into kinematic and probabilistic stability analyses. Although UnWedge does not explicitly include the full in situ stress field, it is appropriate under thrust-faulting conditions, where wedge failures are primarily governed by fracture geometry and kinematics. Stress effects were indirectly addressed by combining fracture mapping with probabilistic variation in joint strength parameters.

4.3. Limitations and Model Sensitivity

The analysis has several limitations. First, in the basic UnWedge setup, the gravitational scenario dominates without the explicit inclusion of the complete stress field; therefore, the estimates are conservative. Second, the field fracture data were collected over limited areas, which requires expansion of the dataset to improve representativeness. Third, the results are sensitive to the accuracy of fracture angle/azimuth measurements and to support quality; these factors should be taken into account when transferring the conclusions into practice.

4.4. Multi-Field Sensitivity

In areas with local water inflow and/or temperature effects, degradation of effective shear resistance along wedge contact planes may occur, increasing the probability of instability and narrowing the “safe orientation window.” From a practical perspective, it is advisable to (1) include moisture/water inflow scenarios in the probabilistic analysis using the effective stress approach (σ′ = σ − u), varying the ranges of φ′ (effective internal friction angle) and c′ (effective cohesion) along fracture planes; (2) provide monitoring of water inflow and fracture moisture indicators (inspections, aperture measurements, inflow mapping); and (3) in the presence of inflows, adjust the parameters of the combined support (bolt spacing/length, shotcrete class and thickness, use of mesh/reinforcement frames).

4.5. Guidelines for Support and Orientation (Design-Ready)

Table 3 below presents the rules for applying the results (numerical benchmarks and azimuths, see Section 3.2 and Table 1).
The current thickness of 0.03 m is insufficient according to FS analysis; the recommended minimum thickness is 0.05 m. The stability threshold is set at FS ≥ 1.2; bolt-only support is not recommended for critical orientations or under moisture conditions.

4.6. Practical Value and Prospects for Development

The results provide design-ready support for decisions on excavation alignment and selection of combined support within the framework of hazard prevention, reducing the probability of wedge failures while maintaining operational efficiency. Further development includes: (1) incorporation of the complete stress field and deep-level scenarios; (2) expansion of the dataset (panels/horizons) and integration of geophysical data; (3) consideration of hydro- and thermo-coupling in probabilistic analysis; and (4) implementation of the loop “modeling → monitoring → support adjustment” for adaptive risk management.
In practical operations, this is realized as the loop “intelligent monitoring → model update → support adjustment,” where threshold indicators (FS-based stability, visual indicators, signs of water inflow) serve as triggers for switching between support schemes. Excavation orientation within the “safe window” and targeted reinforcement of support reduce material overconsumption, which is consistent with the principles of sustainable/green mining. The recommended loop is “monitor → update model → adjust support,” with threshold intervention indicators (fracture aperture, local falls, inflow mapping).
In practical terms, the intelligent monitoring framework may rely on threshold indicators such as fracture aperture exceeding 5–10 mm, displacement rates above 1–2 mm/day, or calculated FS dropping below 1.2. These thresholds can serve as triggers for model updates and support adjustment, although their precise values should be calibrated for specific site conditions.
The present study is limited by the number of surveyed horizons and panels. Expanding field data coverage in future investigations could strengthen the general applicability of the proposed safe orientation window and provide a more comprehensive basis for excavation design. In addition, while a shotcrete thickness of ≥0.05 m was adopted in this study, thicker layers may be required under more severe geological and stress conditions to further enhance excavation stability. These aspects should be considered in follow-up studies to extend the practical relevance of the results.
Given the observed stress–depth trend (σ1 increasing from 6 MPa at 100 m to 18 MPa at 310 m), the recommended support parameters may need to be scaled for deeper excavations. For instance, thicker shotcrete layers (>0.05 m), reduced bolt spacing, or longer and stronger bolts may be required to maintain the required safety factor at depths beyond 310 m. These considerations highlight the long-term relevance of the study for mine extension planning.
The safe orientation window (70° ± 10°) and the support parameters identified in this study are site-specific to the Zhylandy mine, which is characterized by thrust-faulting stress regimes and vein-type ore bodies with high fracture frequency. For mines with different geological settings, such as varying fracture frequencies, stress orientations, or host rock types, these recommendations should be adapted by recalibrating the probabilistic analysis using site-specific mapping and stress data. Thus, the methodological framework is transferable, while the numerical values require adjustment to local conditions.

5. Conclusions

This study addressed the problem of identifying the conditions for wedge failure formation and justifying support parameters that ensure normative rock mass stability.
  • At the deposit, a thrust-faulting regime was established (σ1 > σ2 > σv). With increasing depth from 100 to 310 m, stress components also increase (σ1: 6 → 18 MPa; σ2: 4 → 11 MPa; σv: 2.7 → 8.3 MPa). The rock mass is characterized by RQD = 65–70%, FF = 5–8, and fracture spacing of 15–25 cm, indicating medium rock quality and a predisposition to wedge failures.
  • Probabilistic analysis showed that with bolt-only support, FS = 0.939–1.172 (< 1.2), whereas combined support (bolts + shotcrete ≥ 0.05 m) increases FS to 2.389–3.461, thereby ensuring normative stability of the surrounding rock mass. Under the studied conditions, the combined support scheme is therefore recommended.
  • Critical excavation orientations correspond to azimuths of 120° and 141°, where wedges of maximum size are formed. A “safe orientation window” of 70° ± 10° was identified, within which wedge volumes are minimal.
  • The obtained quantitative benchmarks (stress parameters, fracture indices, FS ranges, and azimuth ranges), together with the framework integrating results with intelligent monitoring, can be applied to practical support design and excavation alignment aimed at reducing the risk of wedge failures.

Author Contributions

Conceptualization, A.T.; data curation, A.T. and A.A.; methodology, V.D. and N.T.; software, T.D.; supervision, A.K.; writing—original draft, V.D. and N.T.; writing—review and editing, A.K. and N.M. All authors have read and agreed to the published version of the manuscript.

Funding

This research was supported by the Ministry of Science and Higher Education of the Republic of Kazakhstan under grant funding for scientific and scientific-technical projects for 2023–2025, Grant No. AP19680292: “Development of the expert system for making decision of fixing and maintaining mine workings.”.

Institutional Review Board Statement

Not applicable.

Informed Consent Statement

Not applicable.

Data Availability Statement

The data presented in this study are available from the corresponding author upon reasonable request.

Conflicts of Interest

The authors declare no conflicts of interest.

References

  1. LLP R&D Center “GeoMark”. Instruktsiya po Krepleniyu Gornykh Vyrabotok na Rudnike “Zhomart”; GeoMark: Zhezkazgan, Kazakhstan, 2020; p. 149. (In Russian) [Google Scholar]
  2. Industrial Safety Rules for Hazardous Facilities Conducting Mining and Geological Exploration; Ministry for Investment and Development of the Republic of Kazakhstan: Astana, Kazakhstan, 2015; 147p. (In Russian)
  3. Makarov, A.B. Prakticheskaya Geomekhanika: Posobie dlya Gornykh Inzhenerov; Gornaya Kniga: Moscow, Russia, 2006; p. 391. (In Russian) [Google Scholar]
  4. Shaposhnik, Y.N.; Neverov, S.A.; Neverov, A.A.; Konurin, A.I. Reitingovaya otsenka massiva gornykh porod Veduginskogo mestorozhdeniya. Fundam. Appl. Min. Sci. 2020, 7, 202–208. (In Russian) [Google Scholar] [CrossRef]
  5. Onuprienko, V.S.; Eremenko, A.A.; Shaposhnik, Y.N.; Kopytov, A.I. Vybor tipov i parametrov krepei v usloviyakh podzemnoi otrabotki apatit-nefelinovykh. Bull. Kuzbass State Tech. Univ. 2023, 2, 56–70. (In Russian) [Google Scholar] [CrossRef]
  6. Bjureland, W. Reliability aspects of rock tunnel design with the observational method. Int. J. Rock Mech. Min. Sci. 2017, 98, 102–110. [Google Scholar] [CrossRef]
  7. Bjureland, W.; Johansson, F.; Sjölander, A.; Spross, J.; Larsson, S. Probability distributions of shotcrete parameters for reliability-based analyses of rock tunnel support. Tunn. Undergr. Space Technol. 2019, 87, 15–26. [Google Scholar] [CrossRef]
  8. Spross, J.; Gasch, T.; Johansson, F. Implementation of reliability-based thresholds to excavation of shotcrete-supported rock tunnels. Georisk Assess. Manag. Risk Eng. Syst. Geohazards 2023, 17, 361–375. [Google Scholar] [CrossRef]
  9. Do, D.P.; Guo, X.; Dias, D. Probabilistic stability analysis of deep rock tunnel excavated by mechanized tunneling considering anisotropic initial stresses. Appl. Sci. 2022, 12, 7479. [Google Scholar] [CrossRef]
  10. Villaescusa, E.; Thompson, A.; Windsor, C. Probabilistic estimate of rock mass static and dynamic demands for underground excavation stabilisation. J. Rock Mech. Geotech. Eng. 2019, 11, 481–493. [Google Scholar] [CrossRef]
  11. Tiwari, G.; Pandit, B.; Latha, G.M.; Babu, G.L.S. Probabilistic analysis of tunnels considering uncertainty in peak and post-peak strength parameters. Tunn. Undergr. Space Technol. 2017, 70, 375–387. [Google Scholar] [CrossRef]
  12. Qin, W.; Chen, E.J.; Wang, F.; Zhou, C. Data-driven models in reliability analysis for tunnel structure: A systematic review. Tunn. Undergr. Space Technol. 2024, 152, 105928. [Google Scholar] [CrossRef]
  13. Li, M.; Wang, G.; Ma, Z.; Kang, F.; Li, J. Reliability analysis of tunnels considering the rock-support interaction using a metamodel-based reliability method. Comput. Geotech. 2024, 170, 106325. [Google Scholar] [CrossRef]
  14. Low, B.K.; Boon, C.W. Probability-based design of reinforced rock slopes using coupled FORM and Monte Carlo methods. Rock Mech. Rock Eng. 2024, 57, 1195–1217. [Google Scholar] [CrossRef]
  15. Zhou, M.; Jiang, A.; Zhou, X.; Qiu, H.; Jiang, W. Probabilistic analysis of tunnel roof deflection under sequential excavation using ANN-based Monte Carlo simulation and simplified reliability approach. J. Risk Uncertain. Eng. Syst. Part A Civ. Eng. 2021, 7, 04021030. [Google Scholar] [CrossRef]
  16. Wu, B.; Zhu, R.; Wang, W.; Zeng, J.; Liu, C. Quantitative analysis of construction risks in shallowly buried biased tunnel portal section. Sci. Rep. 2024, 14, 21974. [Google Scholar] [CrossRef]
  17. Terrón-Almenara, J.; Skretting, E.; Holter, K.G.; Høien, A.H. Design of rock support in hard and layered rock masses using a hybrid method: A study based on the construction of the New Skarvberg Tunnel, Norway. Rock Mech. Rock Eng. 2024, 57, 10491–10532. [Google Scholar] [CrossRef]
  18. Narimani, S.; Davarpanah, S.M.; Bar, N.; Vásárhelyi, B. Analyzing drill core logging using Rock Quality Designation—60 years’ experience from modifications to applications. Appl. Sci. 2025, 15, 1309. [Google Scholar] [CrossRef]
  19. Salmi, E.F.; Sellers, E.J.; Esmaieli, K.; Evans, A.M. A review of the methods to incorporate the geological and geotechnical characteristics of rock masses in blastability assessments for selective blast design. Eng. Geol. 2021, 281, 105970. [Google Scholar] [CrossRef]
  20. Morawietz, S.; Heidbach, O.; Reiter, K.; Ziegler, M.; Rajabi, M.; Zimmermann, G.; Müller, B.; Tingay, M. An open-access stress magnitude database for Germany and adjacent regions. Geotherm. Energy 2020, 8, 25. [Google Scholar] [CrossRef]
  21. Ferrill, D.A.; Smart, K.J.; Cawood, A.J.; Morris, A.P. The fold-thrust belt stress cycle: Superposition of normal, strike-slip, and thrust faulting deformation regimes. J. Struct. Geol. 2021, 148, 104362. [Google Scholar] [CrossRef]
  22. Escuder-Viruete, J.; Fernández, F.J.; Pérez Valera, F.; McDermott, F. Active tectonics, Quaternary stress regime evolution and seismotectonic faults in southern central Hispaniola: Implications for the quantitative seismic hazard assessment. Geochem. Geophys. Geosyst. 2024, 25, e2023GC011003. [Google Scholar] [CrossRef]
  23. Berisavljević, Z.; Bajić, D.; Jovičić, V. Development and application of methodology for quantification of overbreaks in hard rock tunnel construction. Appl. Sci. 2023, 13, 1379. [Google Scholar] [CrossRef]
  24. Hekmatnejad, A.; Crespin, B.; Vallejos, J.A.; Opazo, A.; Adoko, A.C. A hybrid predictive model of unstable rock blocks around a tunnel based on estimated volumetric fracture intensity and circular variance from borehole data sets. Tunn. Undergr. Space Technol. 2021, 111, 103865. [Google Scholar] [CrossRef]
  25. Yang, Y.; Wang, S.; Zhang, M.; Wu, B. Identification of key blocks considering finiteness of discontinuities in tunnel engineering. Front. Earth Sci. 2022, 10, 794936. [Google Scholar] [CrossRef]
  26. Yang, Y.; Zhang, M.; Wang, S.; Zha, W. A parametric method for maximum key block on tunnels excavation and its verification. Tunn. Undergr. Space Technol. 2025, 163, 106608. [Google Scholar] [CrossRef]
  27. Ma, G.; Li, M.; Wang, H.; Chen, Y. Equivalent discrete fracture network method for numerical estimation of deformability in complexly fractured rock masses. Eng. Geol. 2020, 277, 105784. [Google Scholar] [CrossRef]
  28. Wang, H.; Wang, W.; Yang, J.; Wu, Y. A deterministic–stochastic DFN–DEM numerical modeling method with application in stability of fractured rock slope in BDa hydropower station. Eng. Geol. 2025, 353, 108111. [Google Scholar] [CrossRef]
  29. Wang, D.-J.; Zhang, Y.-H.; Cheng, Z.-Y.; Wang, Y.-L. Probabilistic failure assessment of bolt-stabilized pro-dip slopes considering shear effect. Sci. Rep. 2025, 15, 18288. [Google Scholar] [CrossRef]
  30. Hamdi, P.; Ufrecht, S.; Achtziger-Zupančič, P.; Bröker, K.; Ma, X.; Amann, F. Understanding the regional stress in active tectonic regime using 3D numerical modeling: Case study of BedrettoLab, Switzerland. Rock Mech. Rock Eng. 2025, 1–20. [Google Scholar] [CrossRef]
  31. Rocscience Inc. Dips, Version 8.0; Rocscience Inc.: Toronto, ON, Canada, 2022. Available online: https://www.rocscience.com/software/dips (accessed on 15 August 2025).
  32. Rocscience Inc. UnWedge, Version 6.0; Rocscience Inc.: Toronto, ON, Canada, 2022. Available online: https://www.rocscience.com/software/unwedge (accessed on 15 August 2025).
  33. Expert PRO LLC. Razrabotka Resursosberegayushchei Tekhnologii Krepleniya Gorno-Podgotovitel’nykh Vyrabotok v Geomekhanicheskikh Usloviyakh Mestorozhdeniya “Zhilandy”: Otchet NIR (Promezhutochnyi Etap III); Expert PRO LLC: Ust’-Kamenogorsk, Kazakhstan, 2023; p. 321. (In Russian) [Google Scholar]
  34. International Society for Rock Mechanics (ISRM). Suggested Methods for the Quantitative Description of Discontinuities in Rock Masses. Int. J. Rock Mech. Min. Sci. Geomech. Abstr. 1978, 15, 319–368. [Google Scholar] [CrossRef]
  35. Priest, S.D.; Hudson, J.A. Estimation of Discontinuity Spacing and Trace Length Using Scanline Surveys. Int. J. Rock Mech. Min. Sci. Geomech. Abstr. 1981, 18, 183–197. [Google Scholar] [CrossRef]
  36. Rocscience Inc. Dips, Version 8.029; Rocscience Inc.: Toronto, ON, Canada, 2025. Available online: https://www.rocscience.com/software/dips (accessed on 15 August 2025).
  37. Goodman, R.E.; Shi, G. Block Theory and Its Application to Rock Engineering; Prentice-Hall: Englewood Cliffs, NJ, USA, 1985. [Google Scholar]
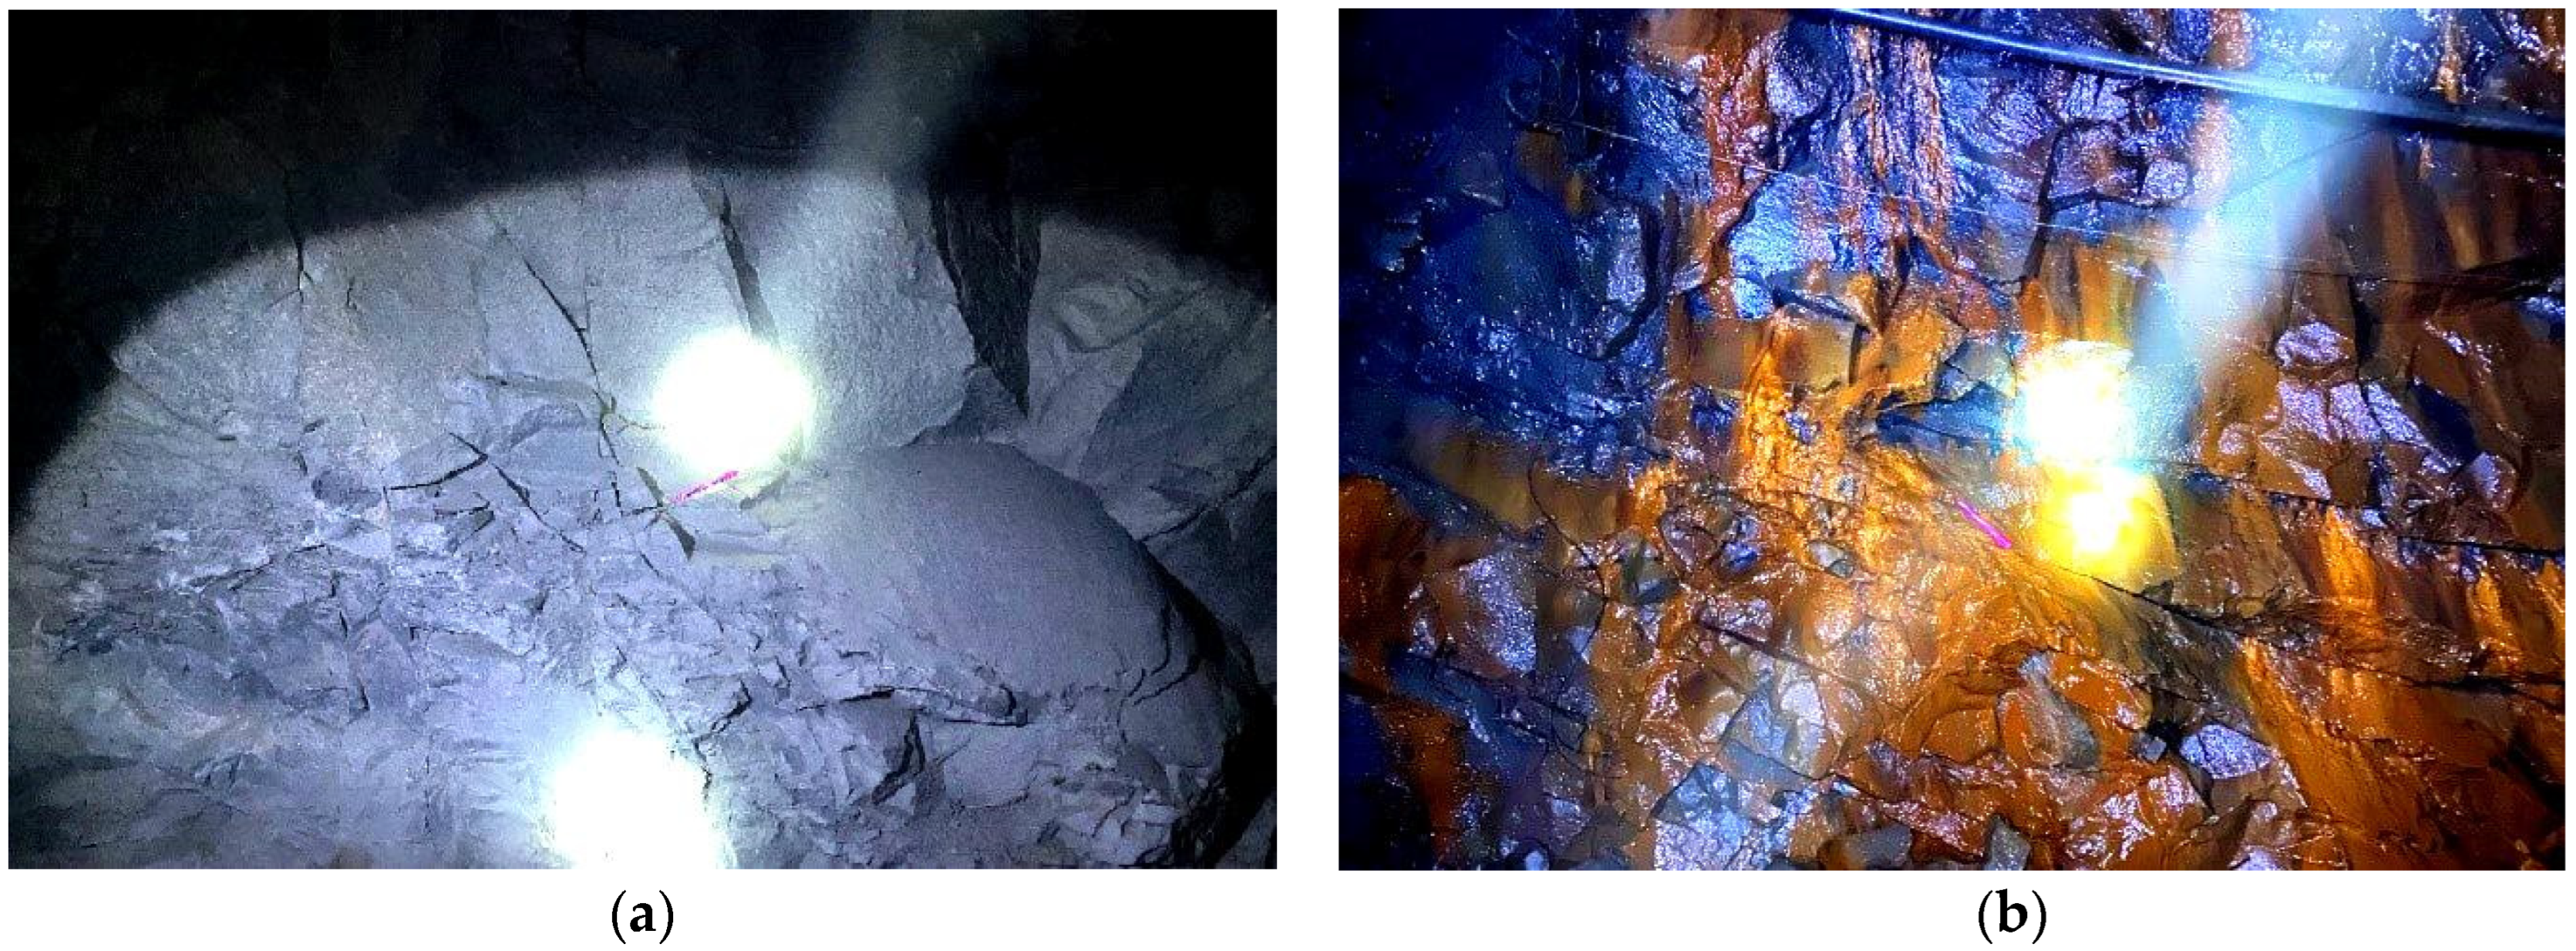
Figure 1. Rock mass fracturing at (a) panel 6 (north) and at the (b) 123.5 m horizon.
Applsci 15 10533 g001
Figure 2. Rock mass fracturing at the (a), (b) 41 m horizon, sectors 1 and 2.
Applsci 15 10533 g002
Figure 3. Relationship between RQD and fracture frequency (FF) based on borehole data from the deposit.
Applsci 15 10533 g003
Figure 4. Fracture systems at panel 3, 300 m horizon, ore body I–III.
Applsci 15 10533 g004
Figure 5. Fracture systems at panel 6, 200 m horizon, ore body I–I.
Applsci 15 10533 g005
Figure 6. Probabilistic analysis at the 300 m horizon, panel 1.
Applsci 15 10533 g006
Figure 7. Probabilistic analysis at panel 1, chamber 25, pillar 43–44.
Applsci 15 10533 g007
Figure 8. Probabilistic analysis at the 300 m horizon, panel 2.
Applsci 15 10533 g008
Figure 9. Probabilistic analysis at panel 7, pillar 190–191.
Applsci 15 10533 g009
Figure 10. Probabilistic analysis at the 270 m horizon.
Applsci 15 10533 g010
Figure 11. Dynamics of factor of safety (FS) variation with error bars.
Applsci 15 10533 g011
Figure 12. Wedges formed at an excavation azimuth of 120°.
Applsci 15 10533 g012
Figure 13. Wedges formed at an excavation azimuth of 141°.
Applsci 15 10533 g013
Figure 14. Critical orientations of fracture systems forming maximum wedges (panel 3, 300 m horizon, ore body I–III).
Applsci 15 10533 g014
Figure 15. Results of wedge analysis at panel 6, 240 m horizon, ore body I–III.
Applsci 15 10533 g015
Figure 16. Results of wedge analysis at panel 5, 200 m horizon, ore body I–I.
Applsci 15 10533 g016
Figure 17. Linear trends of principal stresses σ1, σ2, and σ3 with depth. Stress magnitudes increase with depth, while the relationship σ1 > σ2 > σ3, characteristic of the thrust-faulting regime, is maintained. Error bars correspond to the uncertainties given in Table 2.
Applsci 15 10533 g017
Table 1. Results of probabilistic analysis by horizons, panels, chambers, and pillars.
NameFS (Rock Bolts)FS (Rock Bolts + Shotcrete Support)
300 m horizon, panel 10.939 ± 0.053.117 ± 0.10
Panel 1, chamber 25, pillar 43–441.087 ± 0.052.908 ± 0.10
300 m horizon, panel 21.092 ± 0.052.389 ± 0.10
Panel 7, pillar 190–1911.02 ± 0.052.529 ± 0.10
270 m horizon1.172 ± 0.053.461 ± 0.10
Table 2. Results of principal stress measurements by hydraulic fracturing (HF).
Depth, mσ1, MPaσ2, MPaσ3, MPa 1
1006.0 ± 0.34.0 ± 0.22.7 ± 0.2
31018.0 ± 0.911.0 ± 0.68.3 ± 0.4
1 In this study, σ3 ≡ σv (vertical stress), while σ1 and σ2 represent horizontal stresses (σHmax and σHmin).
Table 3. Guidelines for support and orientation.
ConditionOrientationSupport SchemeNotes/Risks
“Safe window”70° ± 10°Rock bolts + shotcrete ≥ 0.05 mLow risk; baseline configuration
Critical orientations120°; 141°Rock bolts + shotcrete ≥ 0.05 mHigh risk without reinforcement; increase bolt density/length; apply mesh/reinforcement frames
Water-bearing fracturesCombined support; increase shotcrete class/thicknessReduced friction and cohesion expected; monitor for inflows
Elevated stressesCombined support; check bolt spacing/lengthScale σ with depth; recheck FS
Disclaimer/Publisher’s Note: The statements, opinions and data contained in all publications are solely those of the individual author(s) and contributor(s) and not of MDPI and/or the editor(s). MDPI and/or the editor(s) disclaim responsibility for any injury to people or property resulting from any ideas, methods, instructions or products referred to in the content.