Article

Denoising of Partial Discharge Signal in Stator Using Wavelet Transform with Improved Thresholding Function

1
State Key Laboratory of Low-Carbon Smart Coal-Fired Power Generation and Ultra-Clean Emission, China Energy Science and Technology Research Institute Co., Ltd., Nanjing 210023, China
2
The College of Electrical Engineering, Sichuan University, Chengdu 610065, China
*
Author to whom correspondence should be addressed.
Appl. Sci. 2025, 15(19), 10509; https://doi.org/10.3390/app151910509
Submission received: 26 August 2025 / Revised: 26 September 2025 / Accepted: 26 September 2025 / Published: 28 September 2025
(This article belongs to the Section Energy Science and Technology)

Abstract

Partial discharge (PD) signals are used to evaluate the insulation condition of stators in electrical machines. Their measurements are often heavily corrupted by ambient noise, making denoising essential for effective detection and analysis of PD signals. Wavelet thresholding techniques are widely applied to denoise PD signals. However, existing hard and soft thresholding functions introduce oscillation or deviation into PD signals after wavelet reconstruction, particularly under high-noise conditions. This paper proposes an improved thresholding function for the wavelet threshold denoising method that effectively overcomes the oscillation issue associated with the hard thresholding function and the constant deviation of the soft thresholding function. Additionally, wavelet basis selection based on the correlation coefficient and an adaptive threshold value is integrated with the improved thresholding function to implement the wavelet threshold denoising method. The proposed technique is applied to both simulated and real-world measured PD signals to evaluate its performance across different signal-to-noise ratio (SNR) levels. Compared with traditional soft and hard thresholding functions, simulation results confirm the superiority of the improved thresholding function, especially under high-noise conditions. At an input Gaussian noise level of −10 dB, the proposed method yielded an SNR that was 1.20 dB and 2.66 dB higher than those of the hard and soft thresholding functions, respectively.

1. Introduction

Partial discharge (PD) is a key indicator of insulation defects in the stator of an electrical machine, as it shortens the lifetime of electrical machines and induces cumulative damage to stator components [1]. PD monitoring is an effective approach for detecting insulation degradation and identifying potential faults in stator systems.
To detect the PD of stators, the electrical, acoustic, and electromagnetic techniques, among others, are employed. The electrical technique measures the apparent charge value, which is translated from the transient current impulse in a PD event via a coupling capacitor. However, the inevitable presence of noise with frequencies within its measurement band limits its wide application in on-site diagnosis [2]. The acoustic technique primarily uses piezoelectric transducers to convert acoustic waves (or mechanical vibrations) into electrical signals via piezoelectric materials; these acoustic waves are generated by the energy released during a PD event [3]. Nevertheless, piezoelectric transducers have a narrow measurement-frequency bandwidth and are severely disturbed by surrounding environmental noise. The electromagnetic technique utilizes ultra-high-frequency (UHF) sensors to capture the electromagnetic (EM) waves emitted by PD pulses, and UHF sensors have gained considerable popularity over other nonconventional techniques due to the noise immunity in the UHF band and the relative ease of sensor deployment [2]. However, ambient electrical noise in non-UHF bands often corrupts on-site PD measurements, necessitating the use of advanced denoising techniques to ensure accurate analysis of PD signals.
PD denoising approaches primarily include classical, deep learning, and hybrid-based techniques. (1) Classical approaches predominantly apply signal-processing methods such as Wiener filtering, Fourier transform [4], wavelet analysis [5], empirical mode decomposition (EMD) [6], and variational mode decomposition (VMD) [7,8]. These methods leverage mathematical transformations and statistical filtering principles to suppress noise while preserving critical features of the PD signal. (2) Deep learning techniques, such as convolutional neural networks (CNNs) [9], artificial neural networks [10], and autoencoders [11], autonomously learn feature representations to reconstruct pristine signals from noisy PD measurements. (3) Hybrid methodologies integrate classical signal processing with optimization and machine/deep learning algorithms, for example, combining total variation denoising filters with autoencoders (AEs) [12], Aquila Optimizer–VMD [13], particle swarm optimization (PSO)-enhanced wavelet thresholding [14], and wavelet analysis combined with convolutional neural networks [15].
Typically, classical signal-processing-based approaches offer the advantages of computational efficiency and interpretability. Although their denoising performance degrades in highly non-stationary noise environments, they have been widely applied in scenarios requiring fast, explainable, and data-independent solutions. While hybrid or deep learning approaches demonstrate improved denoising accuracy and robustness in handling diverse patterns and noise types associated with PD signals, certain challenges, such as parameter tuning, high computational complexity, heavy data dependence, and the need to ensure real-time performance hinder their application in real-world industrial scenarios. For more detailed reviews of these PD-denoising approaches, please refer to [16].
Due to its high computational efficiency and interpretability in real-world industrial scenarios, the wavelet threshold denoising approach is utilized for denoising of partial discharge (PD) signals in this work. However, the performance of wavelet threshold denoising depends on several factors, such as the wavelet basis function and the threshold value [16,17,18]. Thus, various improved strategies have been proposed for denoising of PD signals, such as an automated wavelet selection and thresholding method based on prior knowledge of the original PD waveform [16,18]. Additionally, the correlation coefficient and dynamic time warping methods were used to select the optimal wavelet [19]. Furthermore, threshold-selection rules such as Stein’s unbiased likelihood estimation (Rigsure), length logarithmic threshold (Sqtwolog), heuristic sure threshold (Heursure), and minimax variance threshold (Minimax) were investigated in [20], while a histogram-based threshold-estimation method was proposed in [21]. These approaches are computationally efficient, but some rely heavily on prior knowledge of PD signals or noise characteristics, and their effectiveness needs to be further verified in high-noise scenarios.
Additionally, the thresholding function significantly influences the performance of wavelet threshold denoising approaches [22]. Commonly, hard and soft thresholding functions are utilized in PD-signal denoising. However, the hard thresholding function causes discontinuity at the threshold value, leading to oscillation of the signal after reconstruction. Meanwhile, the soft thresholding function results in the loss of some useful information due to the shrinkage of large wavelet coefficients, which introduces a deviation between the reconstructed PD signals and the true ones, especially in situations with high noise levels.
To address the limitations of the commonly used hard and soft thresholding functions, some improved thresholding functions have been proposed, such as the sigmoid function-based function [23], a bilateral enhanced wavelet threshold function [24], and the sinusoidal thresholding function [25]. Although these functions show better denoising performance than hard and soft thresholding functions, their performance improvement largely depends on the proper tuning of related parameters and they are difficult to apply in real scenarios without knowledge of the signal and noise characteristics. To tackle this issue, we propose an improved thresholding function that requires no additional parameter setting for wavelet threshold denoising of noisy PD signals, while also aiming to overcome the discontinuity of the hard thresholding function and the constant deviation of the soft thresholding function. Furthermore, this work employs the correlation coefficient to select the optimal wavelet basis and an adaptive threshold-calculation algorithm. Both numerical simulations and real-world results demonstrate that the proposed thresholding function can effectively retain useful signals and enhance the performance of wavelet threshold denoising for PD signals, particularly under high-noise conditions.
The rest of this article is organized as follows. Section 2 presents an overview of the wavelet threshold denoising technique. Section 3 introduces the detailed PD-denoising algorithm with the proposed improved thresholding function. Section 4 presents the experimental results on simulated and real-world PD data, comparing the proposed algorithm with traditional soft and hard thresholding functions under different noise levels. Finally, conclusions are drawn in Section 5.

2. Wavelet Threshold Denoising Technique

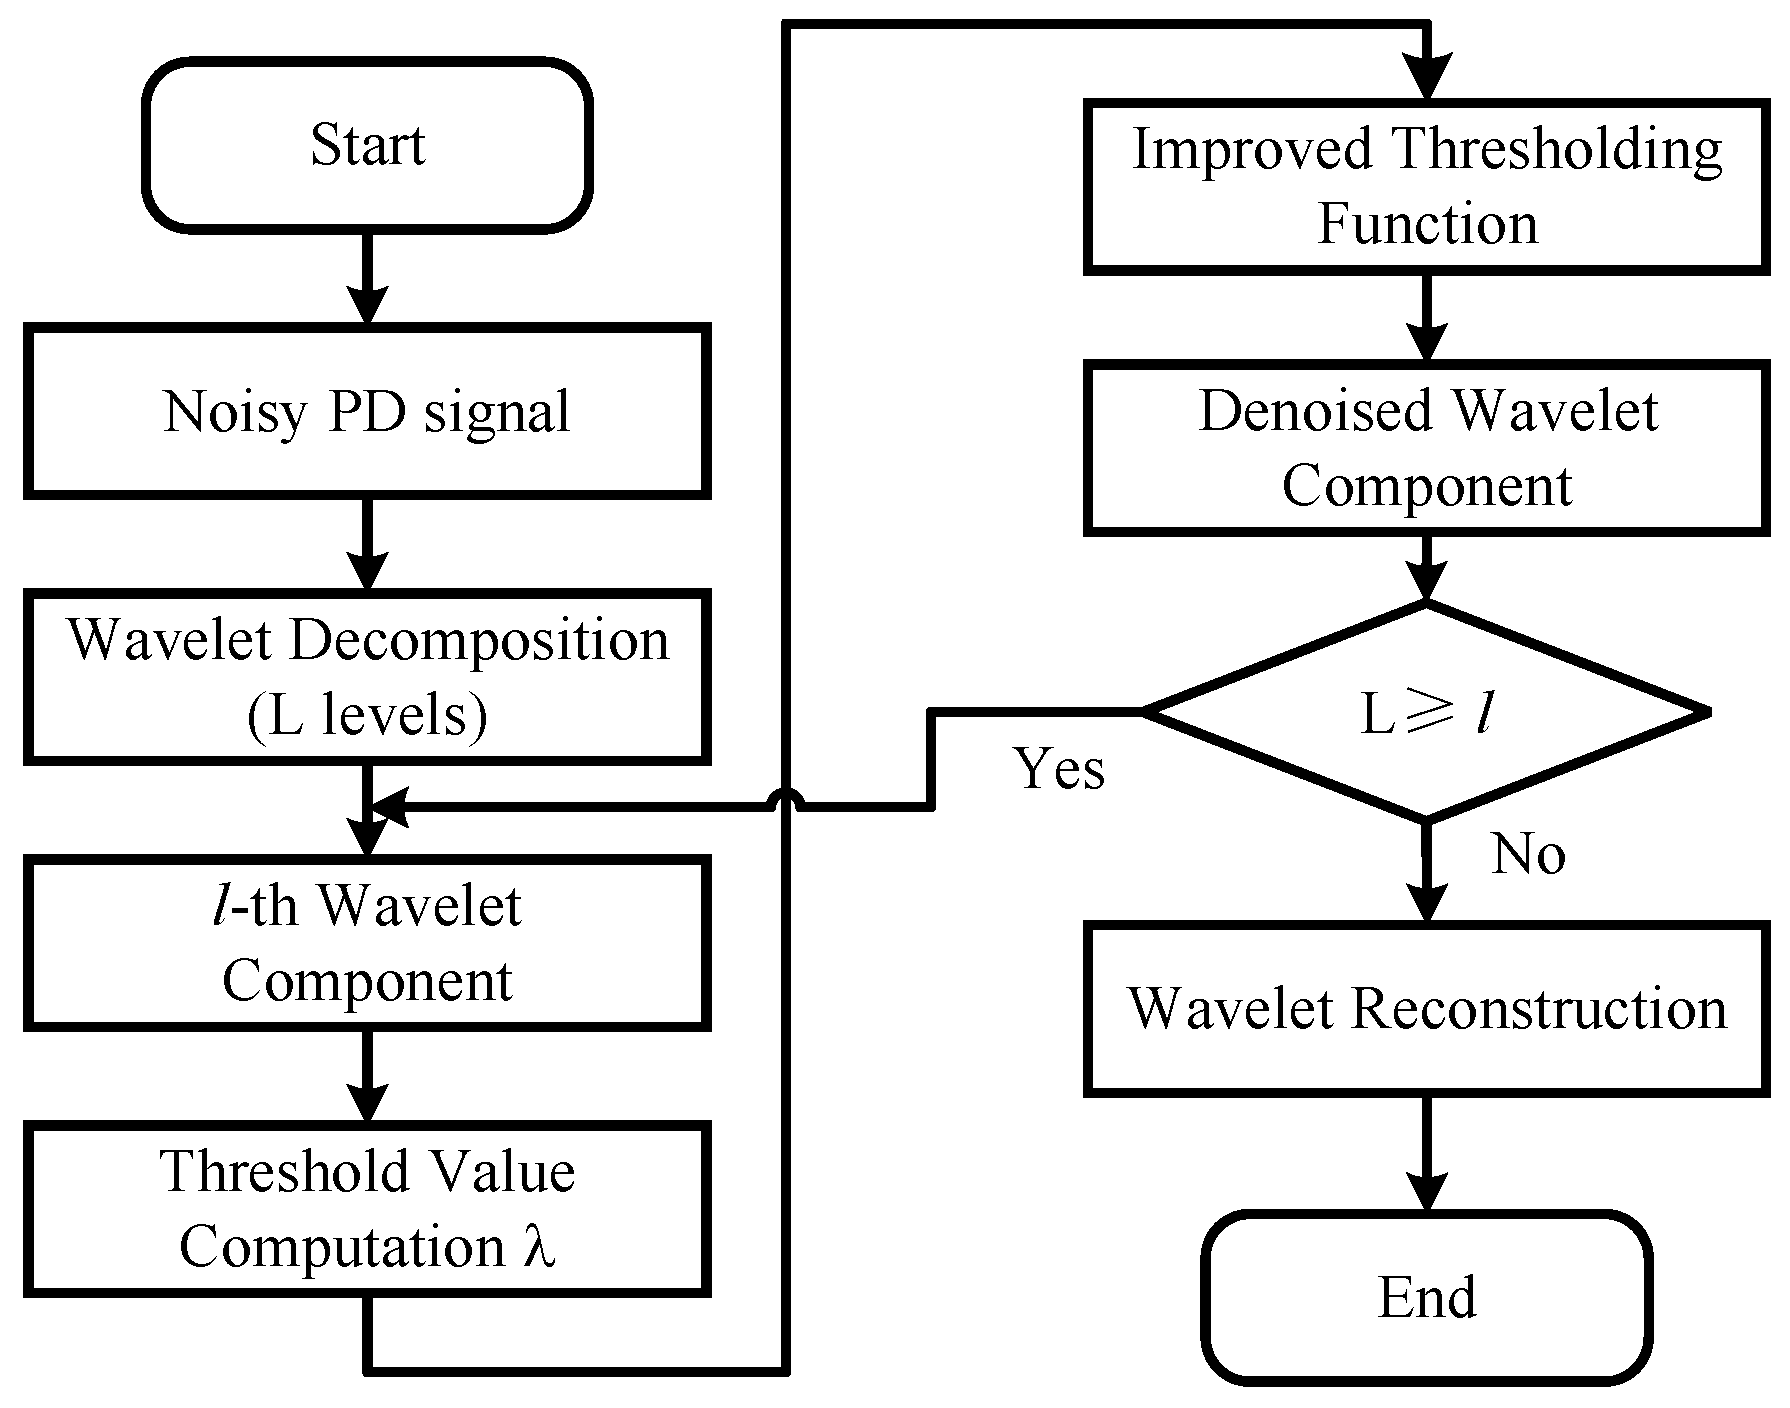
PD signals are often contaminated by ambient noise during the measurement process. The wavelet threshold denoising approach has been widely utilized to perform PD-signal denoising due to its powerful time–frequency-analysis capabilities. Figure 1 illustrates the flowchart of wavelet threshold denoising, which primarily consists of three steps: wavelet decomposition, threshold processing, and wavelet reconstruction.

2.1. Wavelet Decomposition

Once the appropriate wavelet basis function and number of decomposition levels have been determined, the noisy PD signal is decomposed via wavelet transform into various frequency components. After L-layer decomposition, a single approximation component and multiple detail components corresponding to distinct frequency bands are generated and the PD signal S can be expressed as follows:
S = A L + D L + D L 1 + + D 1 ,
where A L is the approximation component at the L-th level and D 1 to D L are the detail components from the 1-st level to L-th level.
Let f s be the sampling frequency; the frequency band of A L lies within the range of ( 0 , f s / 2 j + 1 ) , capturing lower-frequency content, while the frequency band of D j falls within the range of ( f s / 2 j + 1 , f s / 2 j ) ( j = 1 , 2 , , L ) , capturing higher-frequency content. Thus, different frequency components and noise can be extracted through wavelet transform, making it suitable for denoising applications.

2.2. Threshold Processing

Traditionally, the hard and soft thresholding functions are used to filter the noise from measured PD signals. The hard thresholding function is given by
α ˜ j = α j | α j | λ 0 | α j | < λ ,
and the soft thresholding function is given by
α ˜ j = sign ( α j ) ( | α j | λ ) | α j | λ 0 | α j | < λ ,
where α j is a wavelet coefficient vector at the l-th level of wavelet decomposition, i.e., the wavelet-decomposed coefficients { D L , D L 1 , , D 1 } in (1); α ˜ j is the wavelet coefficient vector after the threshold λ has been used on α j ; and sign ( · ) denotes the signum function, which returns the sign of a real number.
The characteristics of the hard and soft thresholding functions are shown in Figure 2, which demonstrates the discontinuity of the hard thresholding function and the constant deviation in the soft thresholding function. Such discontinuity or deviation can lead to poor signal reconstruction after the thresholding function has been applied for denoising.

2.3. Wavelet Reconstruction

To obtain the denoised signal S ^ , an inverse wavelet transform is performed on the denoised wavelet coefficients, as given by
S ^ = InvWT ( A L , D ˜ L 1 , , D ˜ 1 ) ,
where InvWT denotes the inverse wavelet transform and ( D ˜ L , D ˜ L 1 , , D ˜ 1 ) are the denoised wavelet coefficients, obtained by applying the thresholding function in Section 2.2.

3. PD Denoising Algorithm with Proposed Improved Threshold Function

To overcome the discontinuity of the hard thresholding function and the constant deviation of the soft thresholding function, an improved thresholding function is proposed to achieve more effective denoising of PD signals, especially under conditions of high noise or a low signal-to-noise ratio (SNR). Additionally, since the wavelet basis function and threshold settings can affect denoising performance, the selection of these factors is also considered.

3.1. Improved Wavelet Threshold Function

The core role of the wavelet thresholding function is to filter out relatively small noise coefficients as much as possible while effectively preserving relatively large signal coefficients. To overcome the drawbacks of the hard thresholding function’s discontinuity and the soft thresholding function’s constant deviation, a new wavelet thresholding function f ( α j ) with a given threshold λ is proposed in this study. This function is given by
α ˜ j = α j 2 1 + e 2 ( | α j | λ ) 1 | α j | λ 0 | α j | < λ .
From (5), when α j ± λ , it follows that
lim α j ± λ f ( α j ) = lim α j ± λ α j 2 1 + e 2 ( | α j | λ ) 1 = lim α j ± λ α j 2 1 + 1 1 = 0 ,
i.e., lim α j + λ f ( α j ) = lim α j λ f ( α j ) = 0 , which is equal to the value when | α j | < λ . This demonstrates that the proposed thresholding function in (5) is continuous over the real number domain, as shown in Figure 2.
When | α j | ± , it follows that
lim α j ± f ( α j ) = lim α j ± α j 2 1 + e 2 ( | α j | λ ) 1 = lim α j ± α j 2 1 + 0 1 = α j ,
which demonstrates that the proposed thresholding function in (5) asymptotically approaches the identity function for large magnitudes, preserving signal fidelity.
Additionally, Figure 2 compares the characteristics of the proposed improved thresholding function with those of the hard and soft thresholding functions. As shown in Figure 2, the proposed improved thresholding function smoothly approaches 0 at the threshold value, which can overcome the discontinuity and fixed-deviation issues associated with the existing hard and soft thresholding functions. Additionally, no additional parameters are needed to control the thresholding function. These factors ensure that the proposed improved thresholding function can provide good denoising results, as demonstrated in our experiments.

3.2. Selection of Wavelet Basis Function

The wavelet basis function chosen should align with the characteristics of the PD signals. Pearson correlation is also employed as a criterion to select the optimal wavelet basis from multiple wavelets in our work. For the PD signal s and wavelet parameters y associated with a specific wavelet basis ψ , their correlation coefficient R s y is calculated as
R s y = [ ( s s ¯ ) ( y y ¯ ) ] ( s s ¯ ) 2 ( y y ¯ ) 2 ,
where s ¯ and y ¯ denote the mean values of s and y, respectively. Before the correlation coefficient R s y is calculated, both the PD signal s and the wavelet parameters y should be normalized such that the magnitude of each value in s and y is strictly less than 1. A value of | R s y | close to 1 implies that s and y are strongly correlated, and the corresponding wavelet basis is consistent with the PD signals.
For multiple wavelets { ψ i : i = 1 , 2 , , M } , the wavelet basis ψ with the maximum correlation to the PD signal is selected as the best one for the denoising task.

3.3. Adaptive Threshold Value Calculation

The setting of the threshold value should effectively filter noise while maintaining the PD-signal amplitude as much as possible. A higher threshold may mistakenly remove useful PD information with noise, whereas a lower threshold may retain excessive noise in the PD signal. In the wavelet threshold denoising algorithm, the fixed threshold value λ = σ 2 ln N is commonly used for all wavelet coefficients across different decomposition levels [26], where σ denotes the standard deviation of the noise and N is the length of the PD signal.
Due to the variation in wavelet coefficients across decomposition scales, applying a uniform threshold λ can reduce denoising performance. To address this, an improved threshold-setting algorithm that incorporates the decomposition level is utilized; this is calculated as [27]
λ j = σ j 2 ln N log 2 ( j + 1 ) ,
where j denotes the decomposition level.
Further, considering that the data volume of noise is typically larger than that of PD signals, σ j in (9) is estimated using the median of the wavelet coefficients at the j-th decomposition level, expressed as
σ j = median ( | α j | ) 0.6754 ,
where median ( · ) denotes the median operator.

3.4. Denoising Procedure

With the selected wavelet basis ψ , the procedure of the wavelet threshold denoising algorithm with improved thresholding function proposed in this work can be summarized as follows:
  • Input noised PD signal S, the selected wavelet basis ψ , and decomposition level L;
  • Decompose the PD signal by applying wavelet transform;
  • Calculate the threshold value λ according to (9) at different decomposition levels;
  • Utilize the improved wavelet thresholding function in (5) to perform denoising at each decomposition level;
  • Reconstruct the denoised signal by applying the inverse wavelet transform.
Figure 3 shows the flowchart of the proposed denoising approach with the improved thresholding function.

3.5. Evaluation Criteria

Three evaluation indices, signal-to-noise ratio ( SNR out ), mean square error (MSE), and correlation coefficient (CC), are utilized to evaluate the denoising performance of the proposed approach with the improved thresholding function.
(1) SNR out is defined as
S N R o u t = 10 log 10 n S 2 ( n ) n | S ^ ( n ) S ( n ) | 2 ( dB ) ,
where S ^ ( n ) and S ( n ) denote the denoised PD signal and the pure PD signal, respectively, and S ^ ( n ) S ( n ) denotes the remaining noise after PD-signal denoising. The greater the value of SNR out , the better the denoising performance.
(2) MSE is defined as
M S E = 1 N n S ^ ( n ) S ( n ) 2 ,
where N is the length of the analyzed time windows. The smaller the MSE, the smaller the difference between the samples of the denoised and the true PD signals.
(3) CC is defined as
C C = n ( S ^ ( n ) S ^ ¯ ( n ) ) ( S ( n ) S ¯ ( n ) ) n ( S ^ ( n ) S ^ ¯ ( n ) ) 2 n S ( n ) S ¯ ( n ) 2 .
where S ^ ¯ ( n ) and S ¯ ( n ) denote the mean values of denoised PD signal S ^ ( n ) and the pure PD signal S ( n ) , respectively. As in SNR out , the greater the value of CC, the better the denoising performance.

4. Experiments and Results

To evaluate the denoising performance of the proposed approach with the improved thresholding function, the approach was tested using two types of simulated noisy PD signals and real PD signals acquired from three-phase hairpin stators of automotive traction machines.

4.1. Simulation Experimental Results

Based on the characteristics of PD signals, two simulation signals are generated from the mathematical models of the PD signal [20,28], defined as
S 1 = A 1 e 10 6 t cos ( 2 π f t ϕ ) e 10 7 t cos ( ϕ )
S 2 = A 1 e t t 0 τ cos ( 2 π f ( t t 0 ) ) t t 0 0 t < t 0
where A 1 = 2.0 represents the amplitude of the PD signal, f = 1 MHz denotes the oscillation frequency, ϕ denotes the initial phase, τ = 2 μs denotes the attenuation coefficient, t 0 = 2 μs is the delay time, and 100 MHz is the sampling rate.
Based on the simulated PD signals in (14) and (15), the optimal wavelet basis function is selected using Pearson correlation. Using the selected wavelet basis and the calculated adaptive threshold value, the denoising performance of the proposed improved thresholding function is evaluated on noisy PD signals, which are generated by adding three different types of noise (i.e., Gaussian white noise, impulse noise, and Rayleigh noise) to the pure PD signals. Then, its performance is compared with those of the hard and soft thresholding functions in the following experiments.

4.1.1. Wavelet Basis Selection

Various wavelet basis functions are available for signal decomposition. Prior to wavelet threshold denoising, the best wavelet basis function is selected based on the Pearson correlation criterion [20], as described in Section 3.2. Previous studies have shown that Daubechies wavelets are applicable to PD-signal denoising [20,28]. In addition, orthogonal Symlet wavelets are considered in our work. Therefore, Daubechies and Symlet wavelets with order numbers ranging from 2 to 10 (i.e., db2–db10 and sym2–sym10) are included as candidate basis functions, and the best wavelet basis is selected from among them.
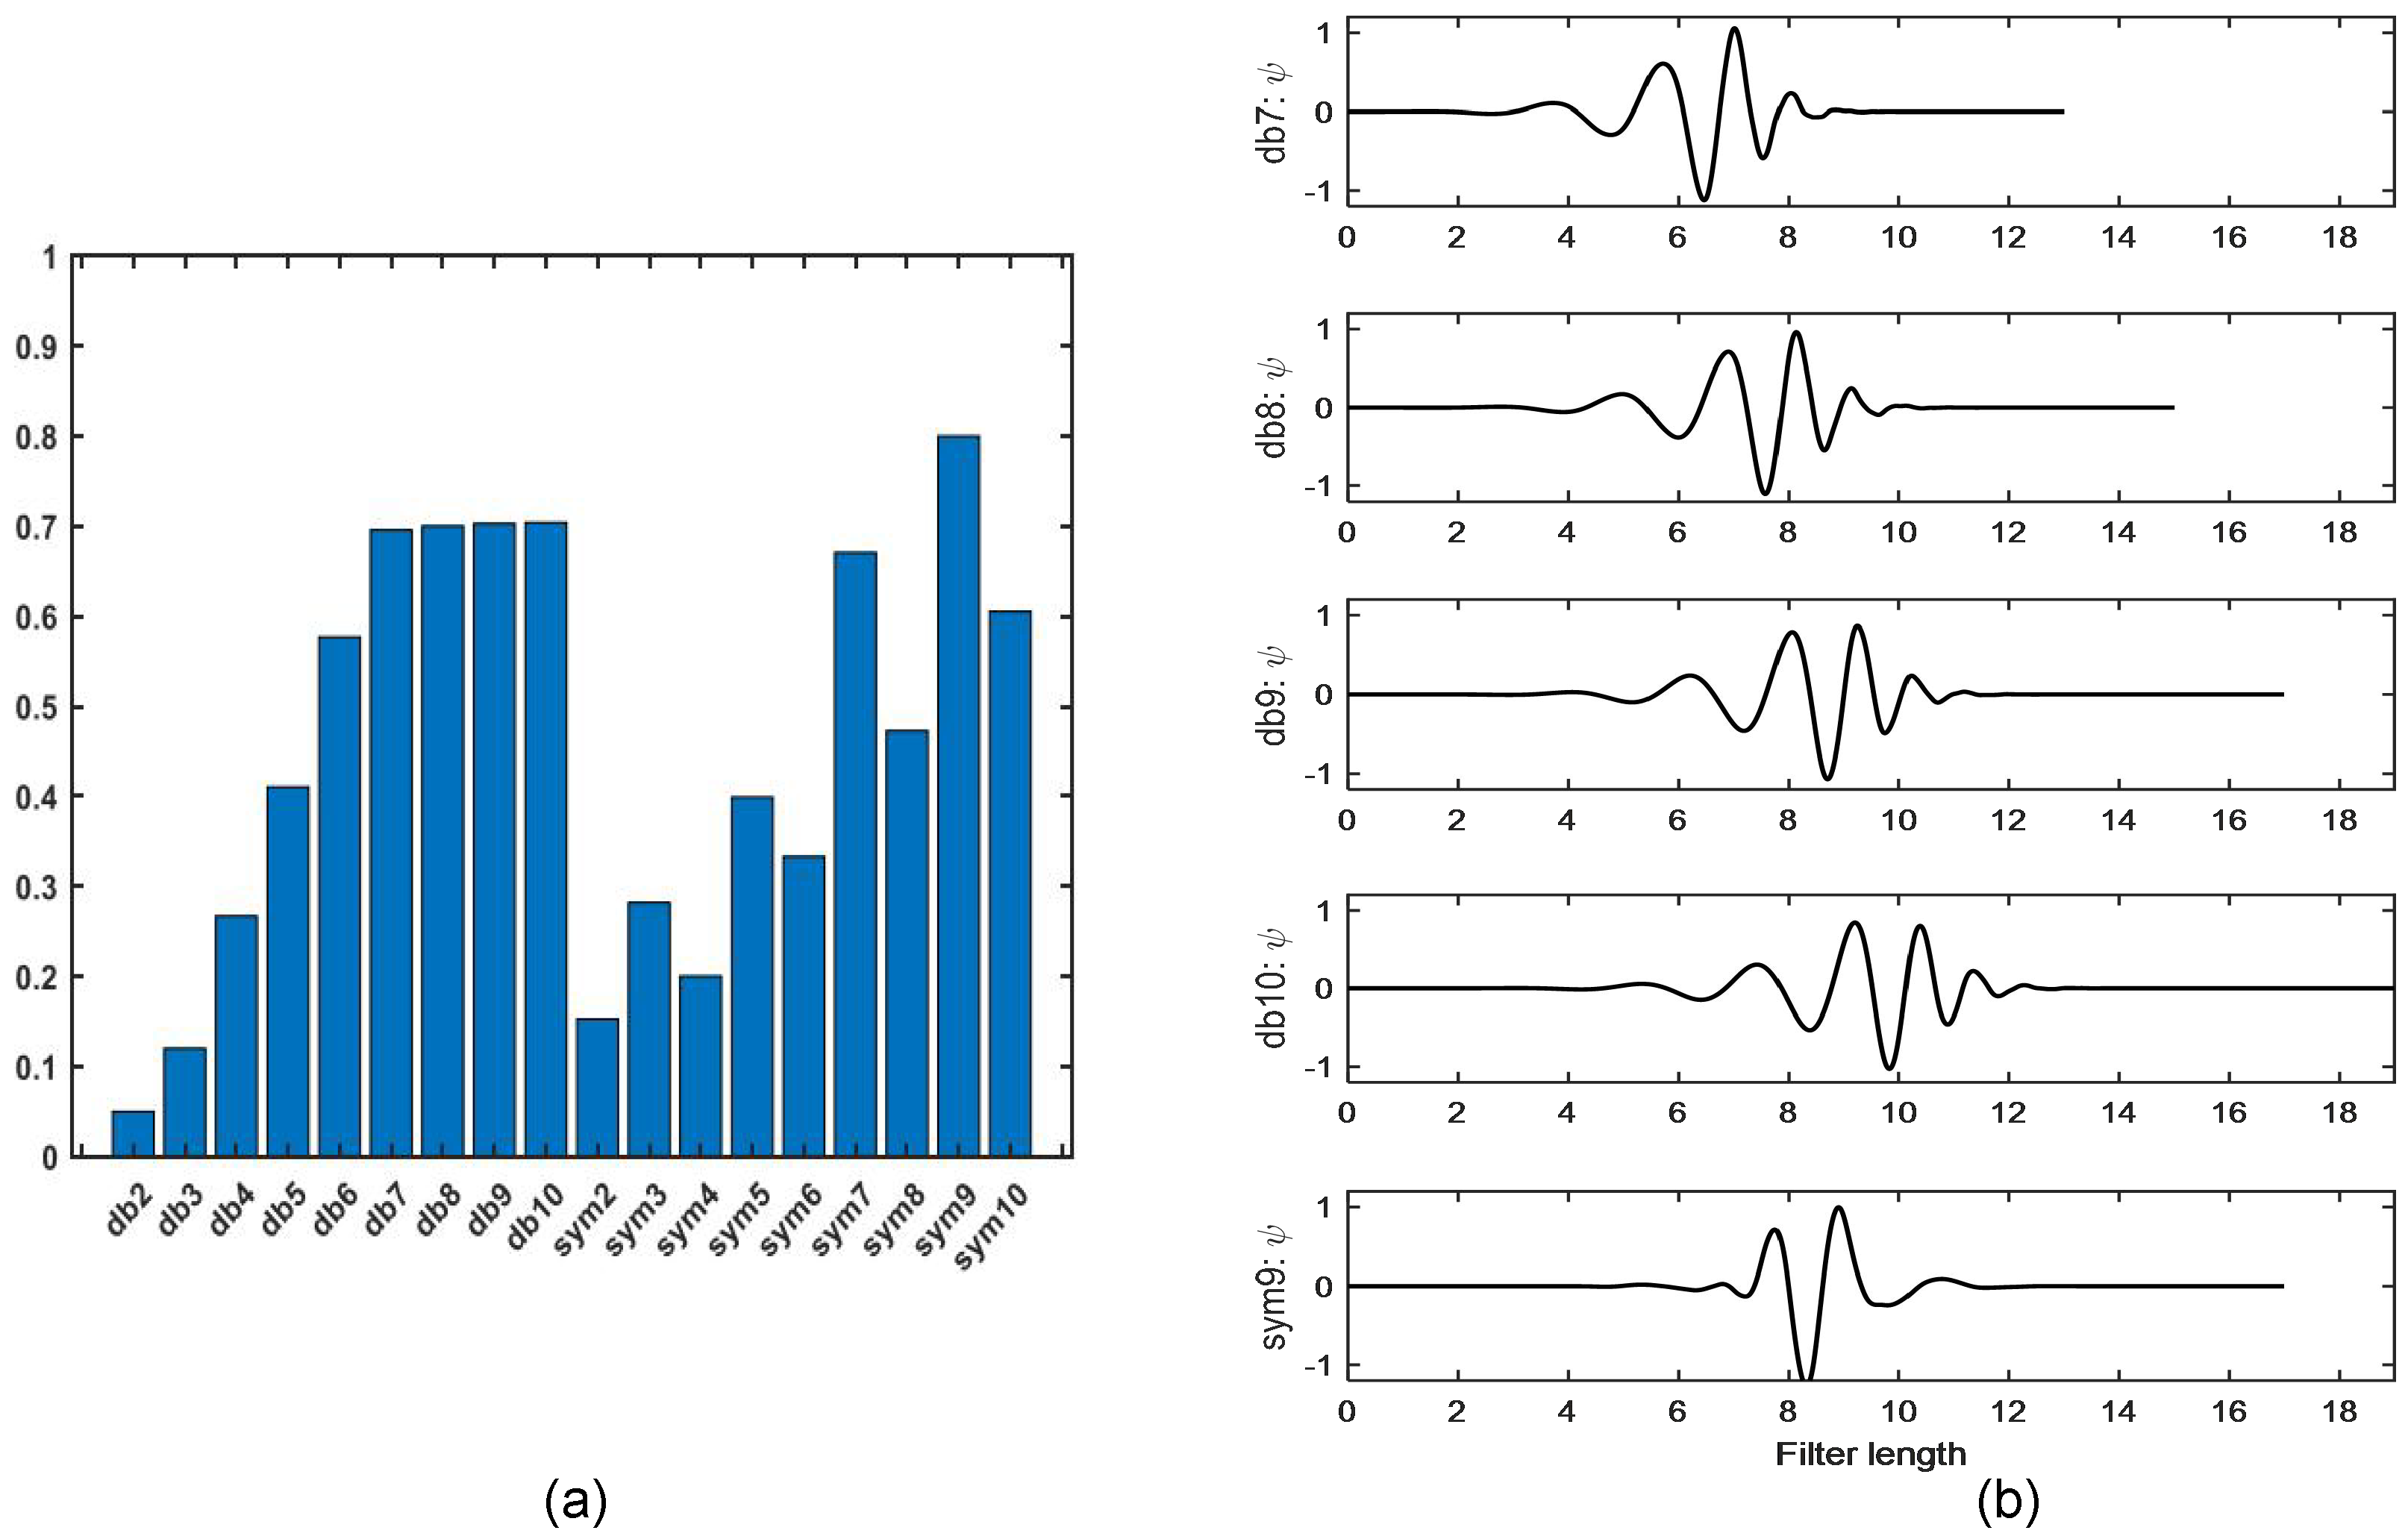
Figure 4a shows the mean correlation values between each wavelet basis function and the two simulated PD signals. As observed in Figure 4a, the correlation coefficients of db7–db10 and sym9 are relatively high, indicating that these wavelet basis functions are suitable for simulated PD signals. Figure 4b shows the five wavelet basis functions. From Figure 4b, it can be observed that the filter length is twice their order; for example, db7 has a length of 14 and db10 has a length of 20. Compared with sym9, db7–db10 have wider supports (characterized by non-zero filter parameters), which is conducive to improving frequency resolution and reducing edge effects. To verify the effectiveness of the approach using correlation-based wavelet basis selection, all wavelet candidates are utilized for denoising using the improved threshold function in (5) and the thresholding value in (9). Considering that PD signals are affected by high noise levels in high-voltage environments in real applications, the SNR i n is set to −10 dB. To address the randomness of white noise, the experiments for each wavelet candidate are repeated 100 times to calculate the denoising-performance indices and the results are averaged. The corresponding means and standard deviations are shown in Table 1.
From Table 1, it can be seen that the db9 wavelet basis yields the best performance, with the highest SNR, highest CC, and lowest MSE for the PD signal S 1 , which is consistent with the correlation results in Figure 4a. For the PD signal S 2 , the sym9 wavelet basis yields the best performance, while the db9 wavelet also yields satisfactory results. Given that db9 has a wider support than sym9 (as shown in Figure 4b) and that Daubechies wavelet families are also widely used in PD denoising, db9 was selected as the fixed wavelet basis. This selection ensures fair comparisons across different noise levels, threshold values, and thresholding functions in subsequent experiments.

4.1.2. Influence of Threshold Value on Proposed Improved Threshold Function

Since the proposed improved thresholding function is related to the threshold value, we evaluated its denoising performance using different threshold values. In addition to the threshold value in (9), values for this experiment were generated by four other threshold-calculation methods that are commonly used in wavelet-based denoising algorithms: Rigsure, Sqtwolog, Heursure, and Minimax [21].
As in the previous experiment, noisy PD signals were generated by adding Gaussian white noise with SNR in = 10 dB to the two types of simulated PD signals. For the wavelet-based denoising algorithm, the db9 wavelet basis function and eight decomposition levels, as determined through extensive experiments, were used. For each threshold value, the experiments were repeated 100 times to calculate the indices of denoising performance, and the statistical results are presented in Table 2.
The results in Table 2 indicate that, for the improved thresholding function, the threshold-value algorithm described in Section 3.3 achieves the best denoising performance among the five threshold-selection approaches. For instance, for each noisy PD signal, the mean values of SNR out and CC of the algorithm in Section 3.3 are larger than those of the other four methods, while its RMSE values are smaller. Therefore, among the five threshold-selection methods, the algorithm in Section 3.3 yields better denoising results when combined with the proposed improved thresholding function.

4.1.3. Effectiveness of the Proposed Improved Thresholding Function

To demonstrate the effectiveness of the proposed threshold function, its denoising performance is compared with those of the hard and soft thresholding functions using simulated PD signals with added Gaussian noise. Based on the results of the above two experiments, the db16 wavelet basis function, eight decomposition levels, and the threshold-value setting from Section 3.3 were used in this experiment. Additionally, white noise at varying levels with SNR in ranging from −15 dB to 5 dB was added to the two types of PD signals.
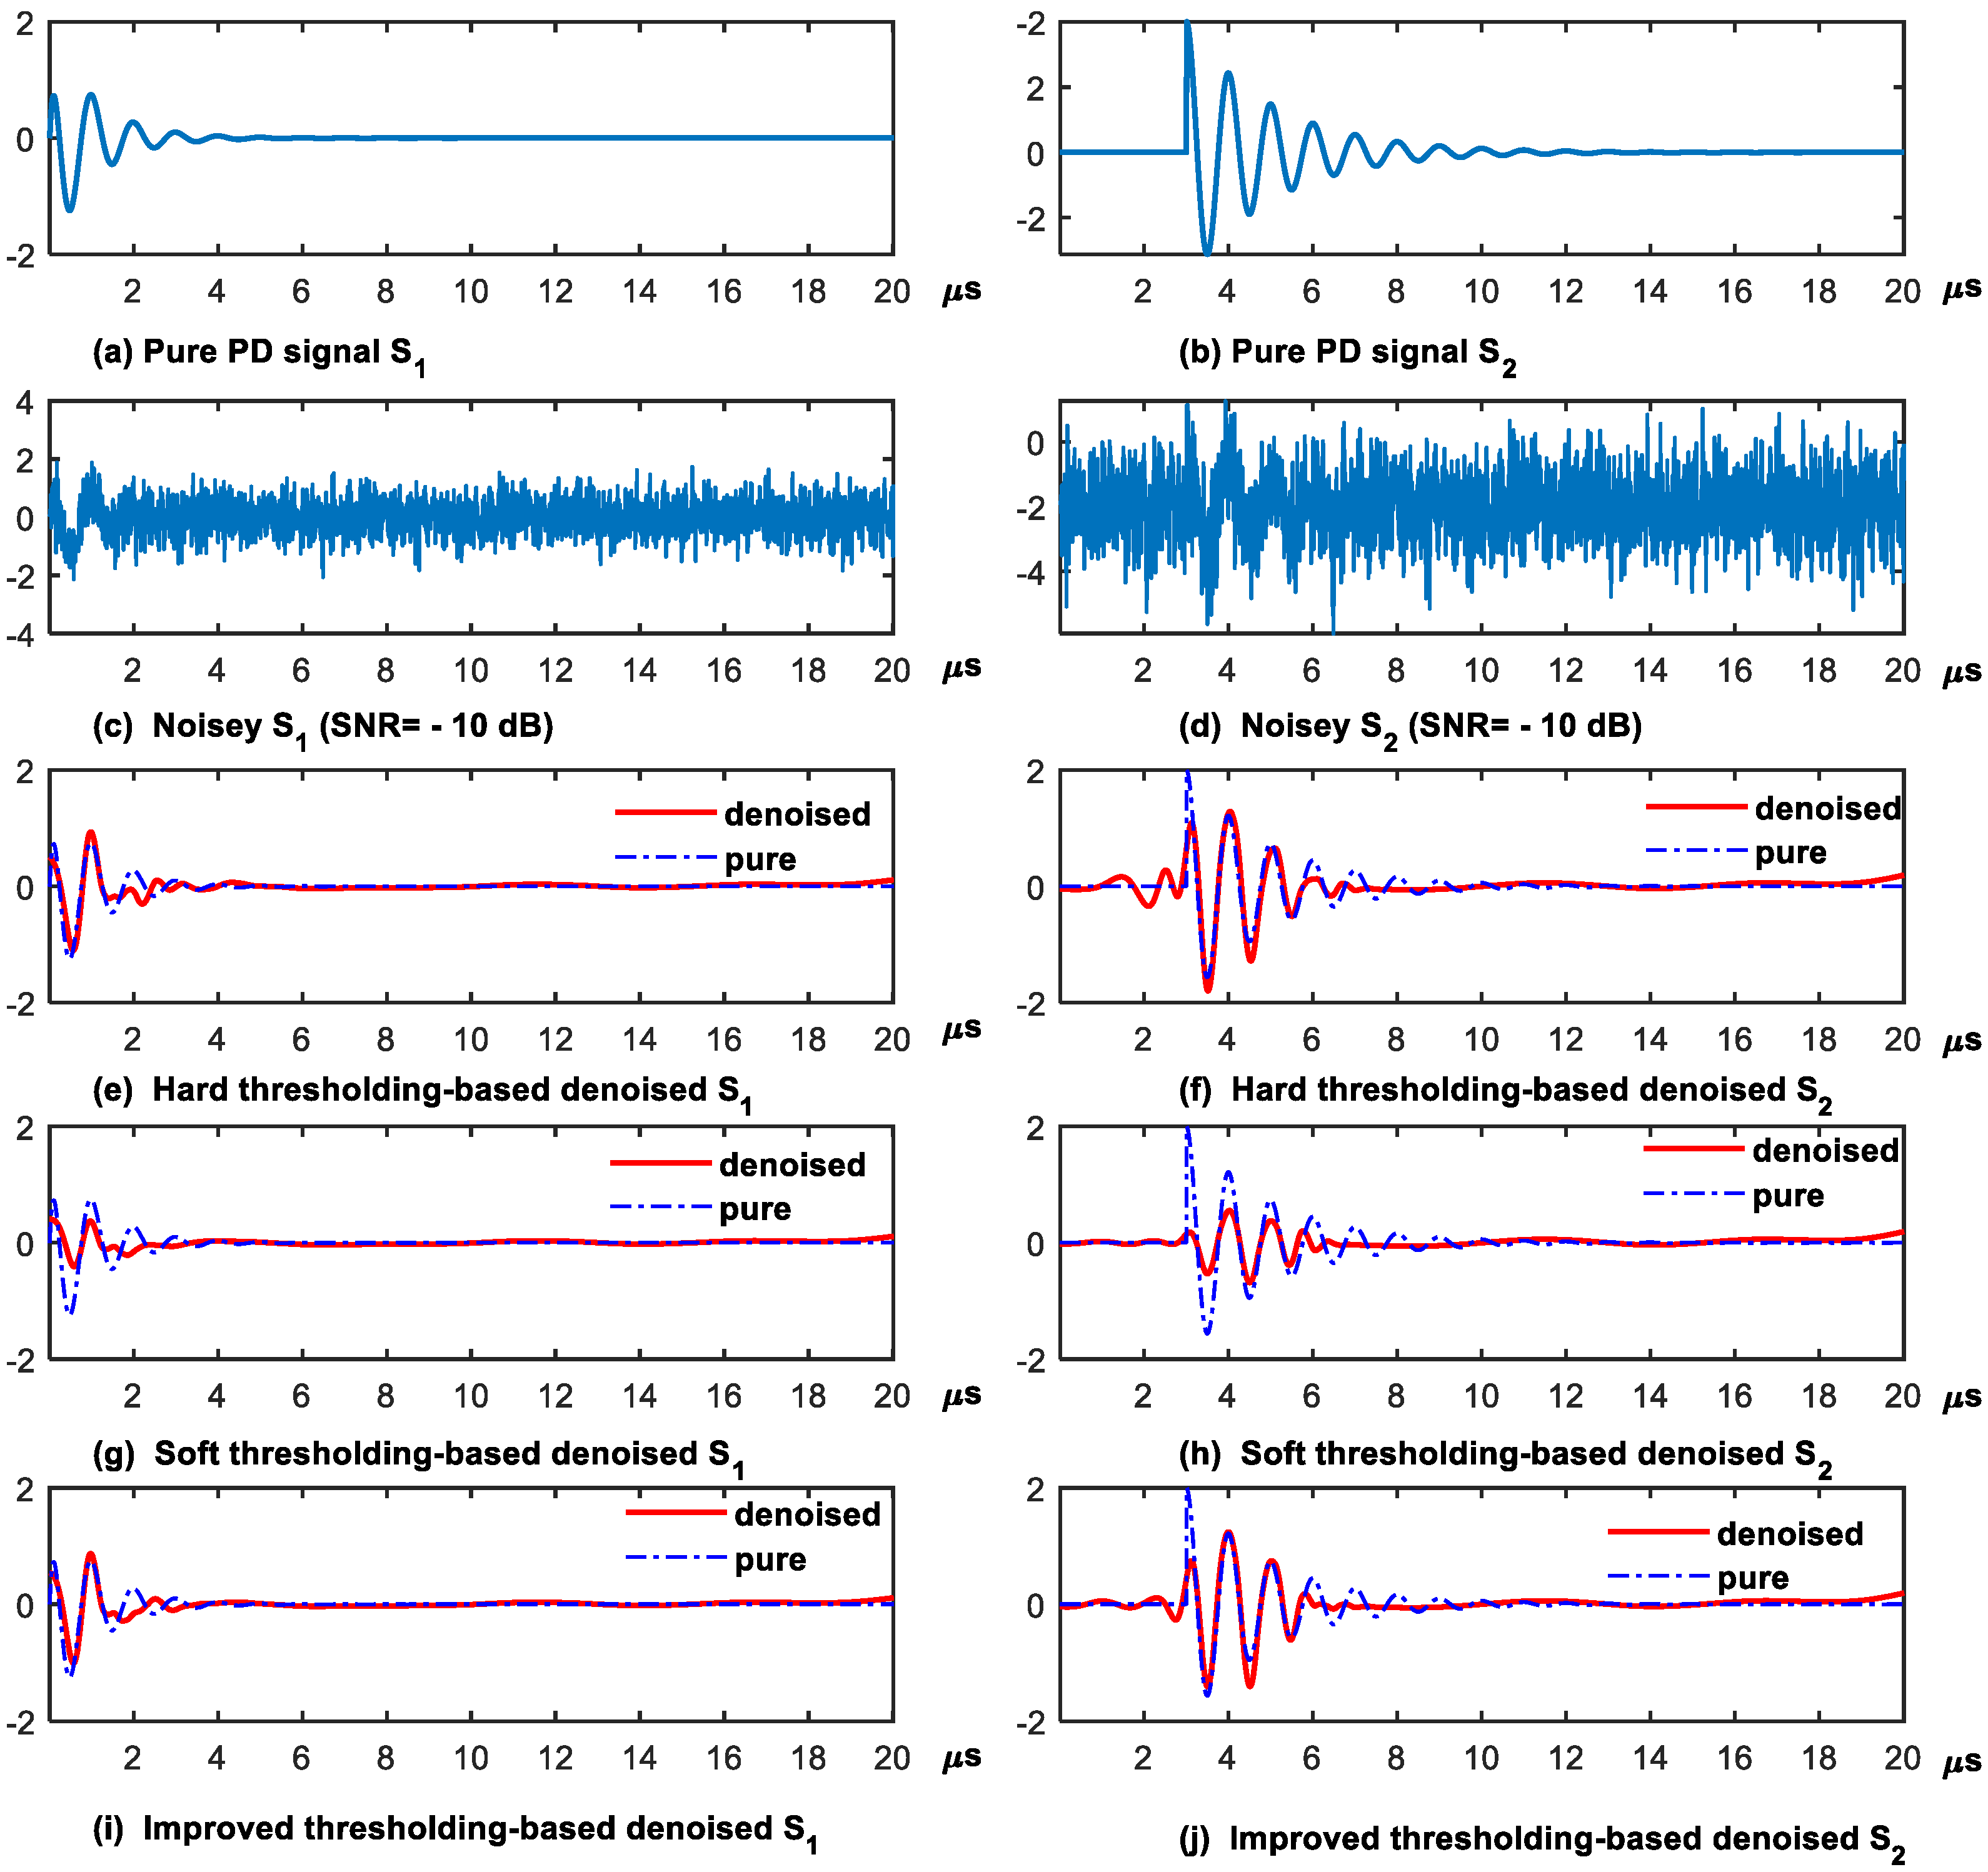
Figure 5 presents the denoised results of two simulation PD signals, S 1 and S 2 in (14) and (15), using three thresholding functions at SNR in = 10 dB. As observed in Figure 5a, when the magnitude of the PD signal is smaller than that of the noise, the improved thresholding function yields a denoised waveform that more closely resembles the original signal. In contrast, the hard and soft thresholding functions result in significant distortion, which is particularly evident in the latter segments of the denoised waveform. Conversely, when the PD signal is strong, no notable differences are observed among the three thresholding functions. Similar phenomena are observed in the denoised results for the PD signal S 2 , as illustrated in Figure 5b. These results demonstrate that the improved wavelet thresholding function is more effective under high-noise conditions.
Table 3 presents three denoising indices (i.e., SNR out , CC, and MSE) for two types of PD signals under various SNR in levels. For each PD signal, white noise at each SNR in level is randomly generated 100 times and added to the pure PD signal to generate a noisy PD signal, and the denoised results are statistically analyzed to compute the mean and standard deviation of each performance index.
From Table 3, it is evident that the improved thresholding function achieves the best denoising performance, as characterized by the highest SNR out , highest CC, and smallest MSE, when the noise level is high (i.e., at low SNR in levels such as −15 dB–−5 dB). Conversely, when the noise is weak (i.e., at high SNR in levels such as 0 dB and 5 dB), the hard thresholding function yields the best denoising results, followed by the improved thresholding function. Table 3 demonstrate that the improved thresholding function is suitable for scenarios with high noise levels and low SNRs, whereas the hard thresholding function is more appropriate for scenarios with weak noise and high SNR in .

4.1.4. Comparison with Other Denoising Approaches

The proposed denoising approach is further compared with EMD-based and VMD-based denoising approaches for PD signals under different Gaussian noise levels. The EMD-based approach utilizes EMD, Hurst analysis, and spectral subtraction to implement signal denoising [29], while the VMD-based approach first estimates the noise distribution from predominantly noisy modes via the Cramer–Von Mises (CVM) statistic, then detects and rejects noise from the remaining modes using VMD [30]. The corresponding codes (https://www.mathworks.com/matlabcentral/fileexchange/52502-denoising-signals-using-empirical-mode-decomposition-and-hurst-analysis, accessed on 5 October 2015, https://www.mathworks.com/matlabcentral/fileexchange/81728-a-statistical-approach-to-signal-denoising-using-vmd-and-cvm, accessed on 12 November 2020) are simply adjusted to apply to the two simulated PD signals. The settings of some key parameters follow the codes: for the EMD-based approach, only one parameter, the spectral threshold value, is set to 0.5; for the VMD-based approach, the number of modes K, window length L, and iteration number N p are set to K = 9 , L = 32 , and N p = 16 , respectively. For a time window length N of the analyzed signal, the computational costs of the three denoising approaches are presented in Table 4. From this table, it can be seen that the proposed approach has the fastest operational speed with the lowest computational complexity, while the VMD-based approach has the slowest speed with the highest computational complexity among the three approaches.
Figure 6 shows the results of three denoising approaches on two simulated PD signals at SNR in = 10 dB. As observed in Figure 6, for the VMD-based approach, there is less deviation from the original signal between [0, 2] μs in S 1 and [3, 6] μs in S 2 compared with the EMD-based and improved approaches. However, more noise remains within the time segments without PD signals. This demonstrates that the VMD-based approach can effectively recover PD signals with a certain frequency but is ineffective for constant zero-magnitude, zero-frequency signals under high-noise conditions. One reason is that VMD is not effective at segregating useful signals from high noise levels within each frequency range. The EMD-based approach has an issue similar to that of the VMD-based approach. In contrast, the DWT-based improved approach can overcome this limitation, showing better denoising results across all time segments and frequency ranges.
Table 5 presents three performance indices of the three denoising approaches under various input SNR in levels, which are statistically calculated from 100 experiments. Compared with the EMD-based and VMD-based denoising approaches, the improved DWT-based approach shows better denoising performance in low- SNR in conditions with high noise levels, characterized by a higher SNR out , higher CC, and lower RSE. This is consistent with the results in Figure 6. Moreover, the VMD-based method shows a trend of improved denoising performance as the SNR in increases, as observed for S 2 at SNR in = 5 dB. Table 5 demonstrates that, although the VMD-based method can achieve better denoising performance at high SNR in , the improved approach is more suitable for denoising in low- SNR in scenarios with high noise levels.

4.1.5. Comparison Under Different Noise Types

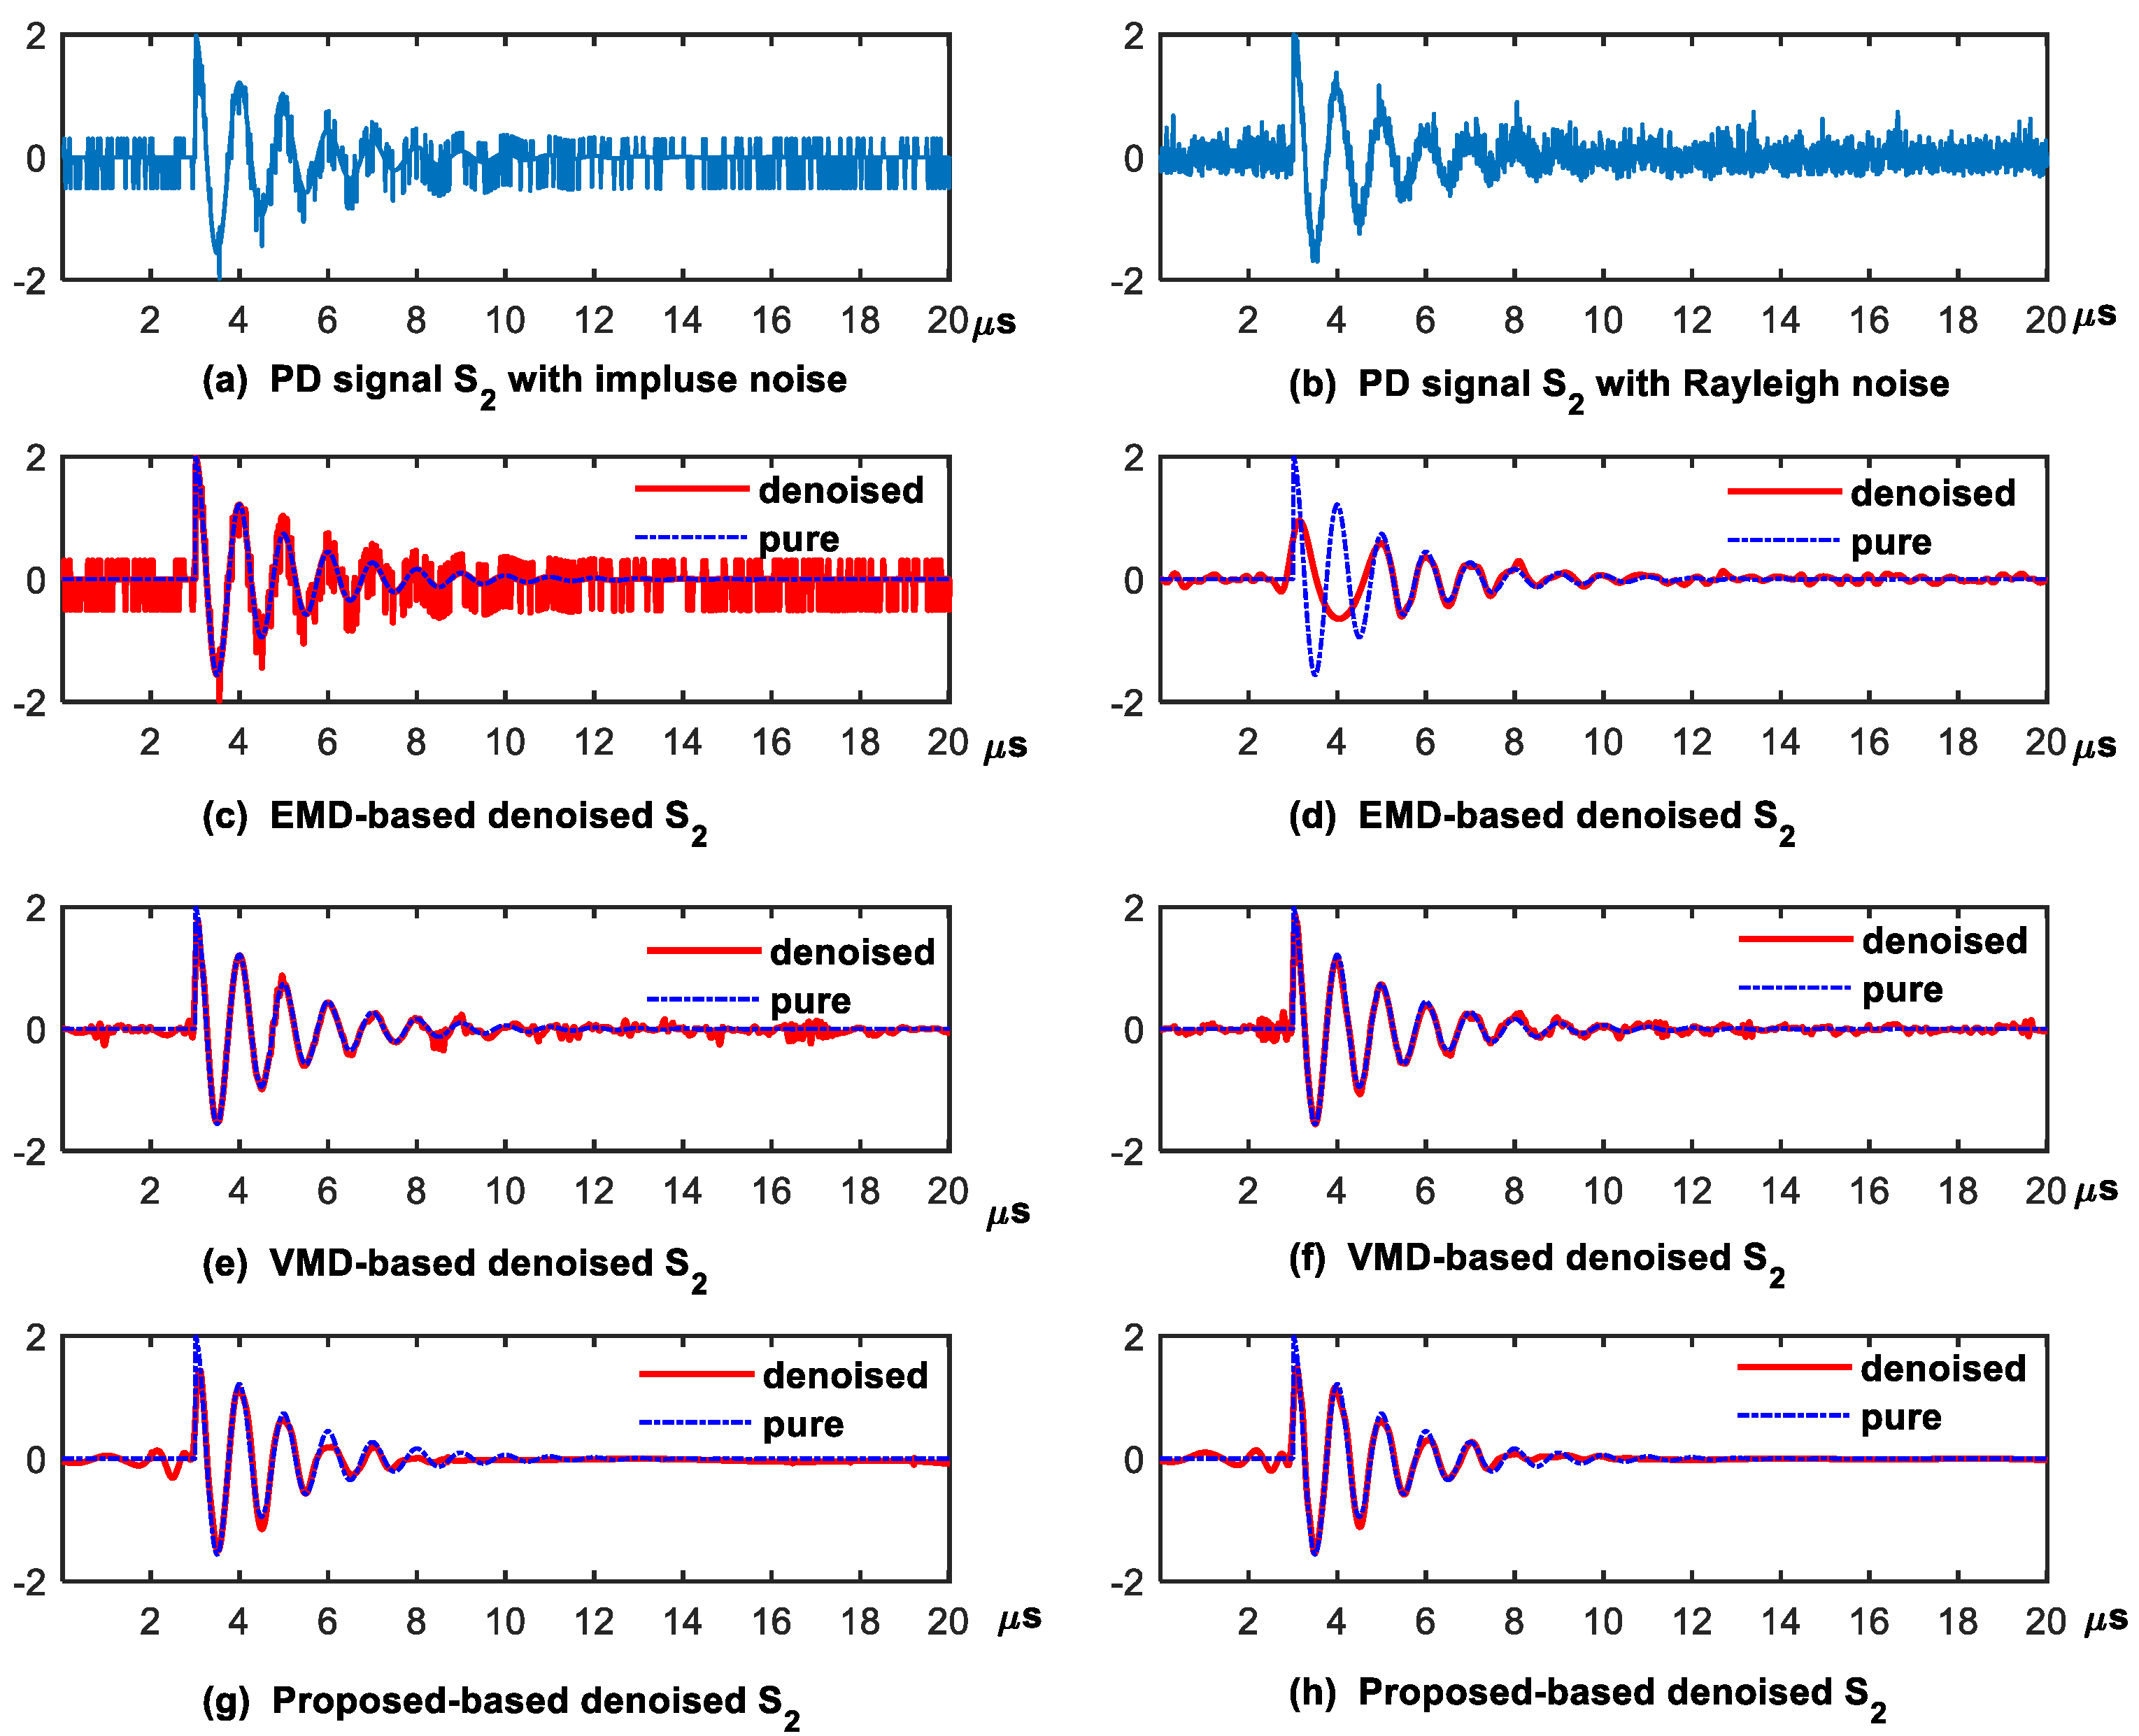
In addition to Gaussian noise, impulse and Rayleigh noises with various SNR in values are considered to evaluate the performance of the proposed approach with the improved thresholding function, in comparison with EMD-based and VMD-based denoising approaches. Taking the PD signal S 2 as an example, Figure 7 shows the denoised results of the three approaches under impulse and Rayleigh noises with SNR in = 10 dB . Figure 7c shows that the EMD-based approach cannot effectively remove impulse noise. This is because it utilizes the extreme values of the analyzed signal to extract intrinsic mode functions and fails under conditions of high impulse noise. Although the VMD-based approach can recover the PD signal, impulse noise still remains in the zero-frequency time segment, as shown in Figure 7e. For the case with Rayleigh noise, the EMD-based and VMD-based approaches exhibit improved denoising performance compared with those in the case with impulse noise. However, whether for high impulse noise or Rayleigh noise, the proposed approach achieves better denoising results, especially in the zero-frequency time segment, consistent with the statistical results in Table 6.
As shown in Table 6, although the VMD-based approach yields more satisfactory denoising indices under the high- SNR in = 5 dB condition, the proposed approach demonstrates better denoising performance that is applicable to different noise types, particularly under high-noise conditions.

4.2. Application on Real Signal

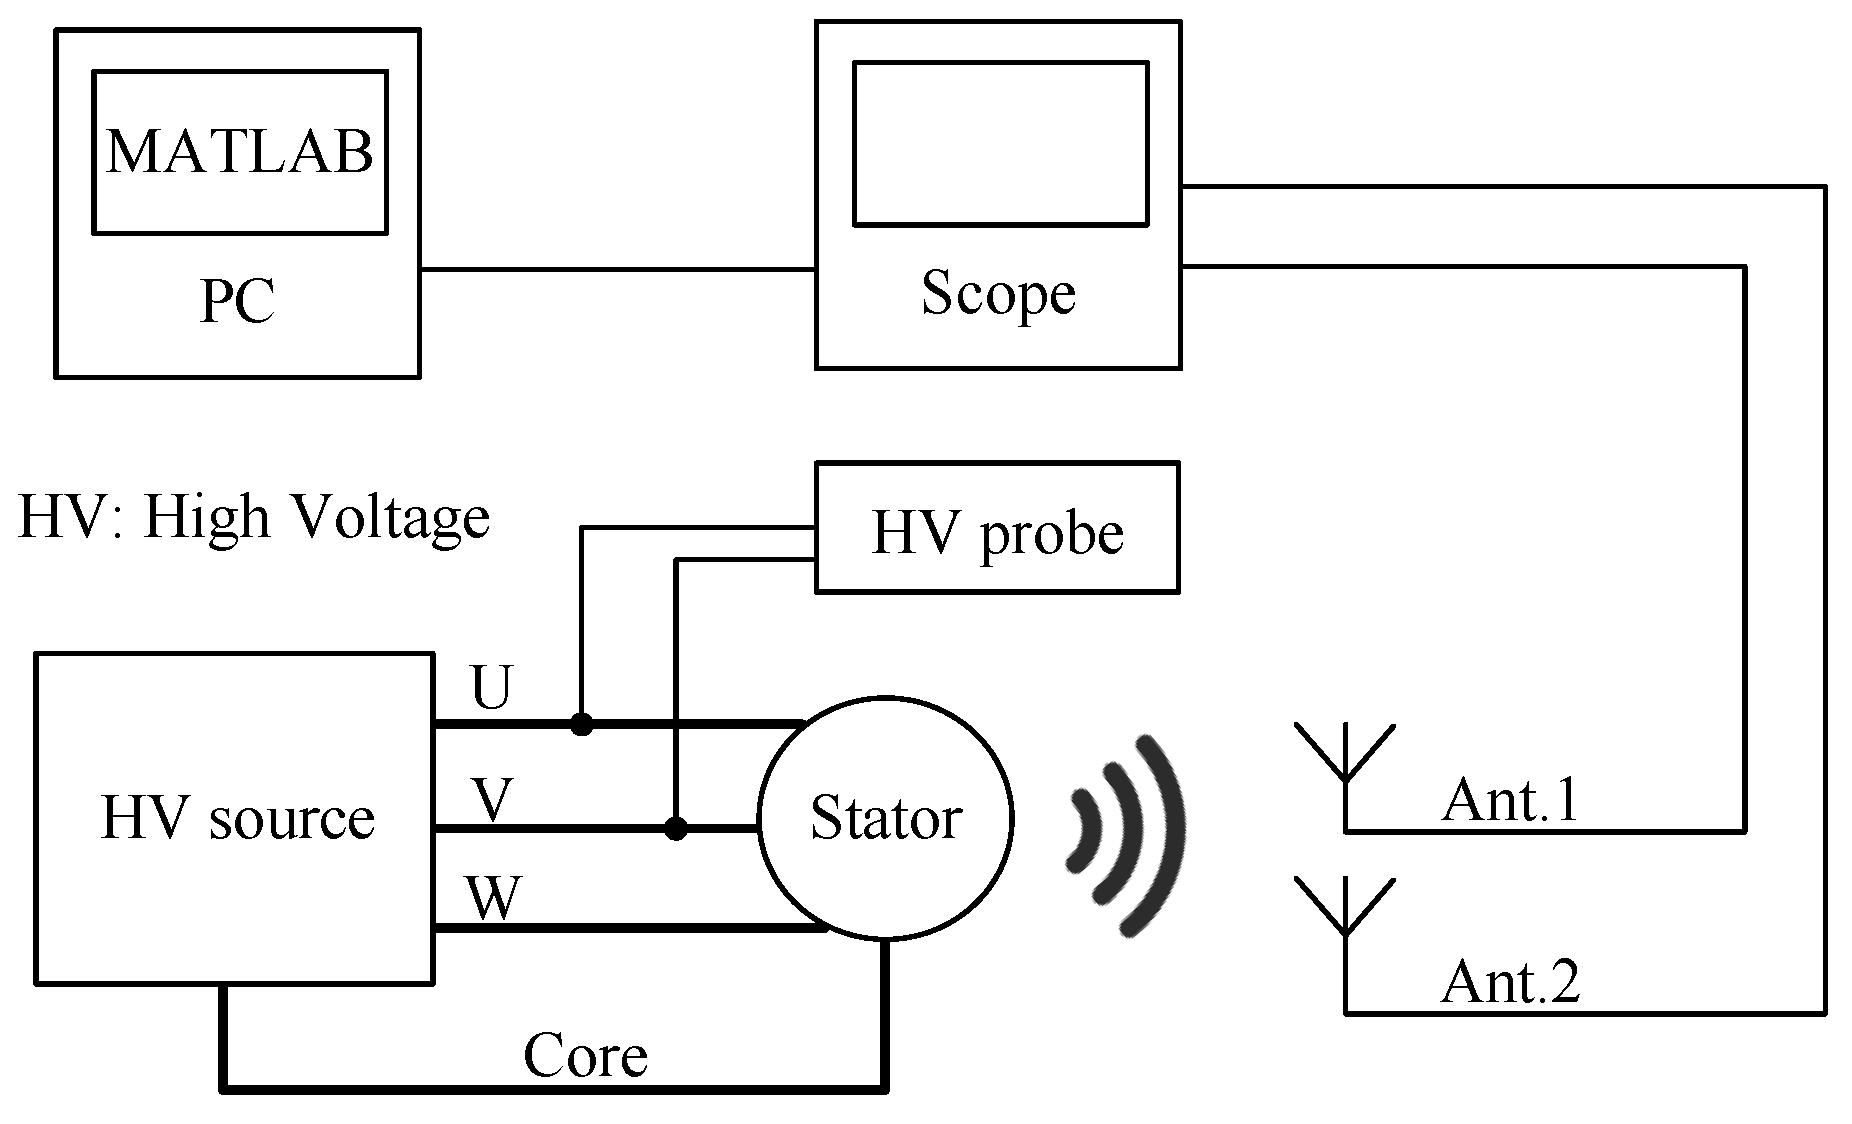
To further verify the denoising effectiveness of the improved thresholding function, we utilized real-world PD signals acquired during testing on three-phase hairpin stators of automotive traction machines, which served as the devices under test (DUT) [31]. A schematic of the PD test setup for data acquisition is shown in Figure 8. A high-voltage (HV) surge generator (ST3810 from SPS electronic, equipped with a 10 nF surge capacitor) was connected to various combinations of phases U, V, W, and the laminated core to subject different parts of the stator insulation to electrical stress. The terminal voltage of the DUT was monitored using the HV probe TeledyneHVD3605A. Given that PD events emit electromagnetic impulses, two UHF broadband antennas were positioned around the DUT to capture these signals. To mitigate distortions caused by HV pulses, the antenna outputs were passed through analog high-pass filters with a 200 MHz cutoff frequency. The HV probe and antennas were connected to a 4 GHz, 12 bit digital oscilloscope Teledyne WaveProHD, which digitized and recorded their signals for each HV surge at a sampling frequency of 10 GHz. The recorded data were post-processed in MATLAB R2021a and are available per the Data Availability Statement.
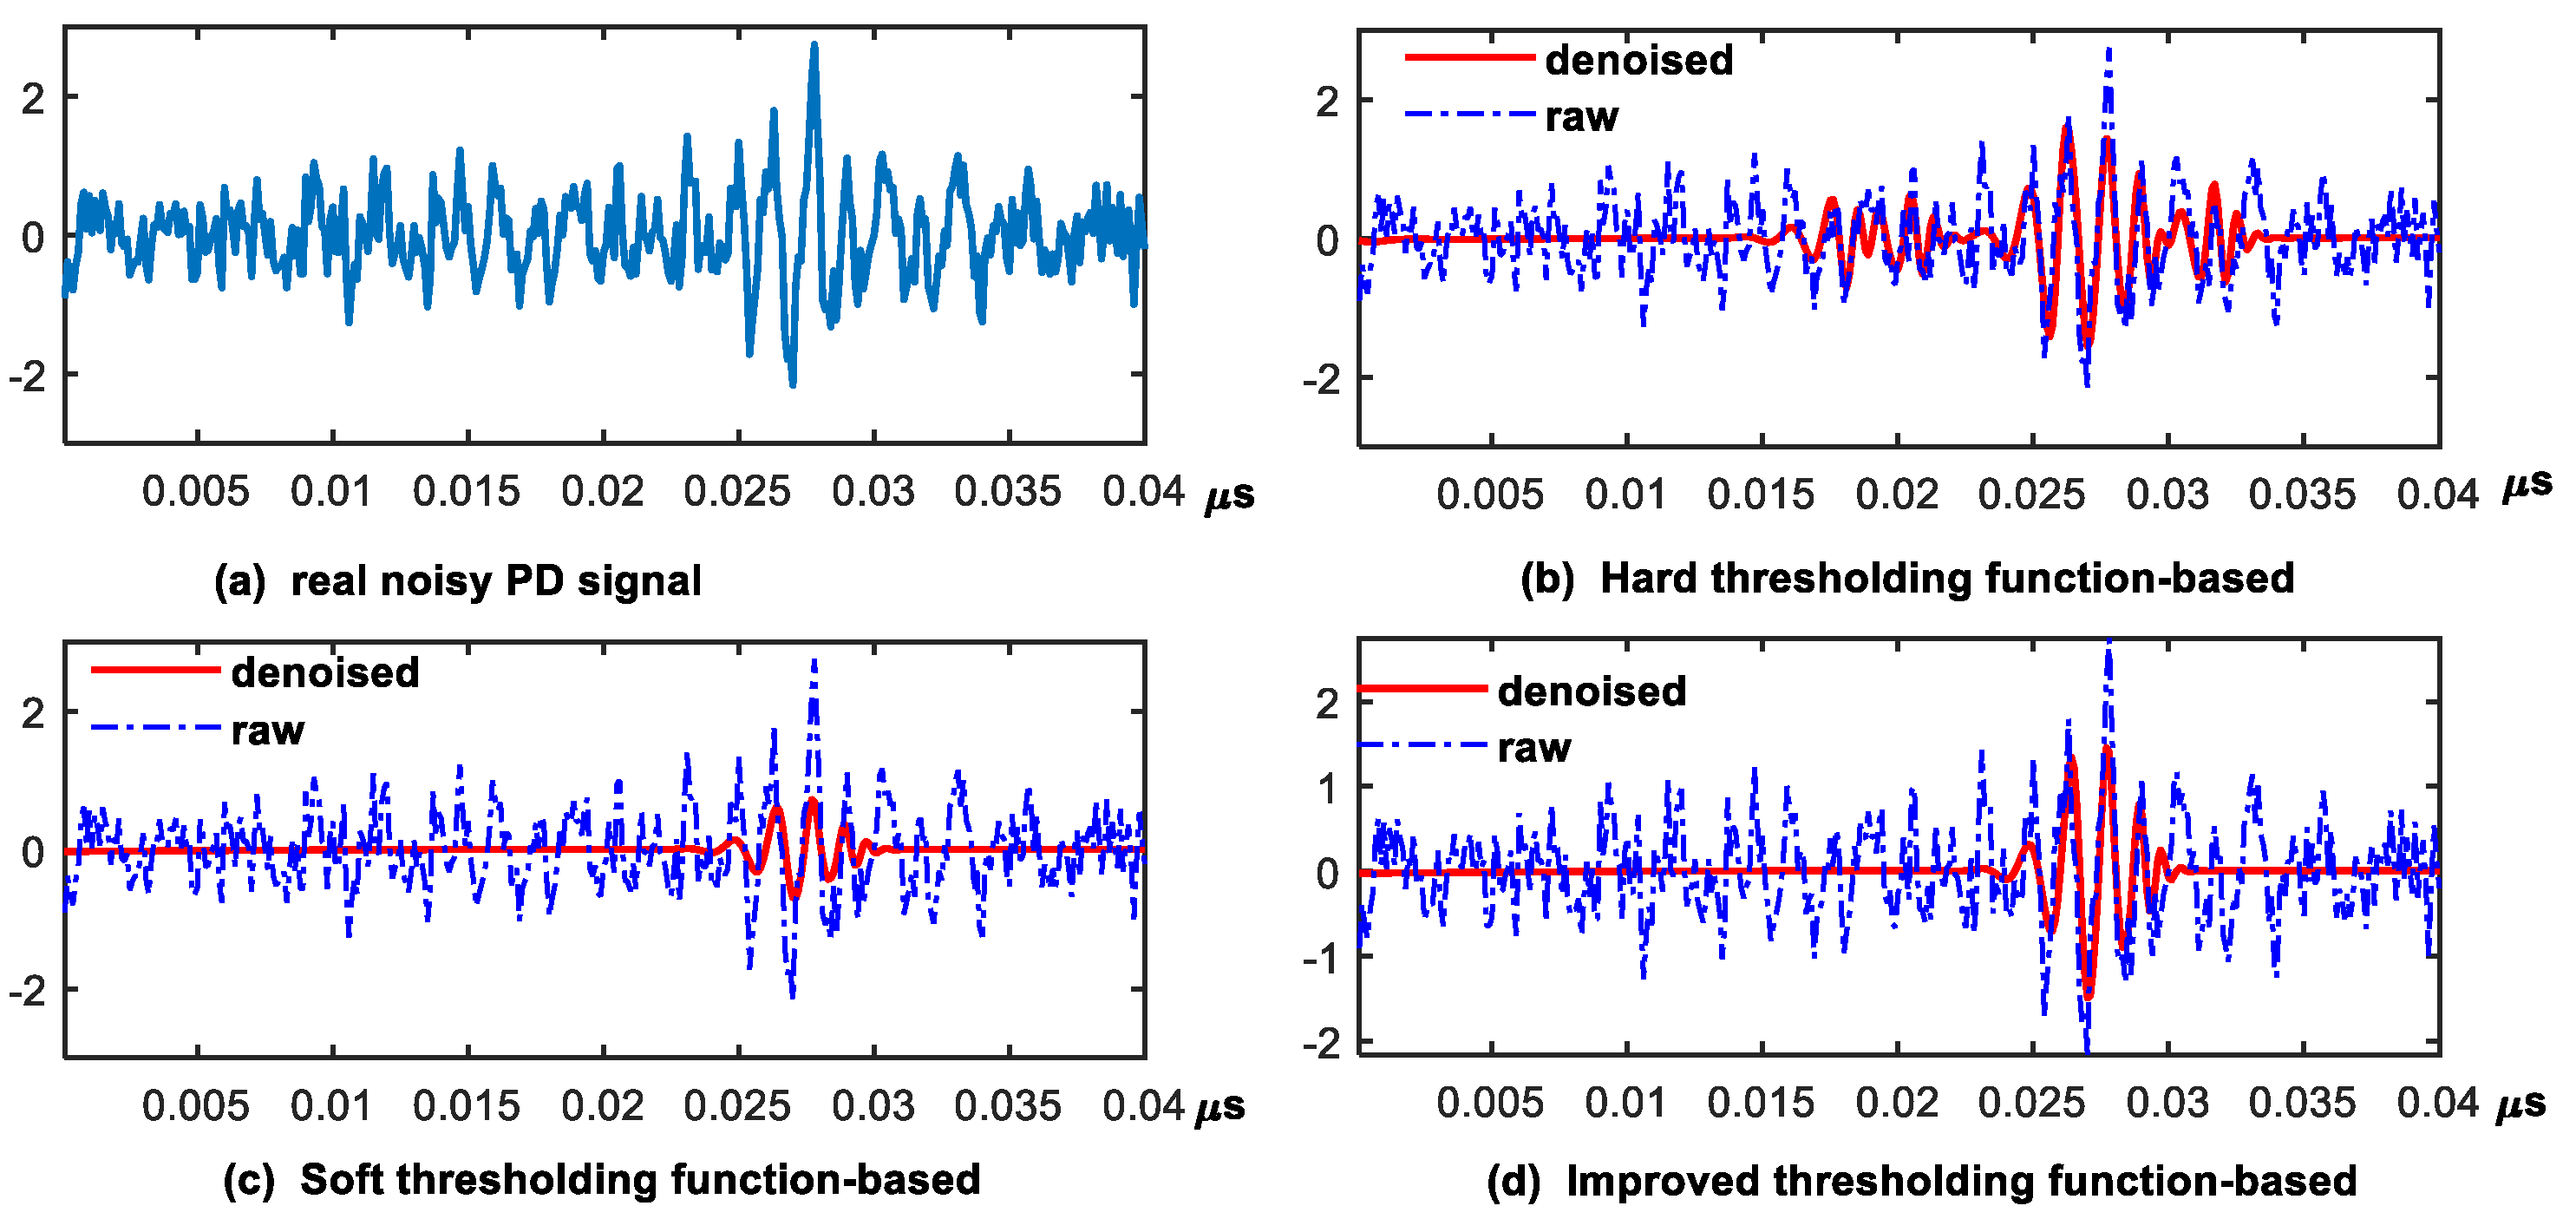
Figure 9 presents the denoised results of noise-contaminated raw PD signals from the public dataset using three thresholding functions: hard, soft, and the improved method. The db9 wavelet basis and an eight-level decomposition are employed, consistent with the parameter settings used for the simulation data. In this figure, the denoised PD signals (red line) are superimposed on the raw PD signals (blue line). As shown in Figure 9, the PD signals are degraded by high noise levels, as the magnitude of the noise is comparable to that of the PD signals, despite the unknown SNR.
When the hard thresholding function is used, PD artifacts appear before the PD event between 0.016 and 0.22 μs, as shown in Figure 9a. Although the soft thresholding function does not produce artifacts like the hard function does, it significantly reduces the magnitude of the PD signals, as shown in Figure 9b. In contrast, the improved thresholding function exhibits no artifacts in the denoised signal before or after PD events, with the signal magnitude approaching zero, as shown in Figure 9c. During PD events, the magnitude, frequency, and phase of the denoised signal are consistent with those of the raw PD signals, demonstrating that the essential characteristics of the PD signals are preserved as much as possible. This confirms that the proposed improved thresholding function is also suitable for real-world PD signals with unknown noise characteristics.

5. Conclusions

In this paper, we propose an improved threshold function for use in the wavelet threshold denoising technique for corrupted PD signals in the stators of electrical machines. First, the wavelet basis function is selected based on the correlation coefficient, ensuring it aligns with the characteristics of the PD signal. Then, the PD signal is decomposed using DWT with the selected basis function and the adaptive threshold value is calculated at different decomposition levels. Next, the improved thresholding function is utilized to perform denoising at each decomposition level, and finally, the PD signal is recovered via inverse wavelet transform. The proposed technique is verified through experiments on simulated and real PD signals at different SNR levels. The experimental results show that the improved thresholding function achieves better denoising performance in terms of SNR, MSE, and CC compared with traditional soft and hard threshold functions, especially under low-SNR conditions.

Author Contributions

Conceptualization, D.Y. and X.Y.; methodology, D.Y. and X.Y.; validation, H.X.; investigation, R.Y.; writing—original draft preparation, D.Y. and K.S.; writing—review and editing, D.Y. and X.Y. All authors have read and agreed to the published version of the manuscript.

Funding

This work was supported in part by the National Energy Group Science and Technology Research Institute Co., Ltd. Science and Technology Project (No. CD2024Y01). All authors sincerely thank all editors and anonymous reviewers for their valuable comments.

Data Availability Statement

The real-world PD Data is publicly available at https://doi.org/10.6084/m9.figshare.24033225.v1 [32], accessed on 16 November 2023.

Conflicts of Interest

Authors Dong Yang, Kunlong Song and Ruiji Yi were employed by the company China Energy Science and Technology Research Institute Co., Ltd. The remaining authors declare that the research was conducted in the absence of any commercial or financial relationships that could be construed as a potential conflict of interest.

References

  1. Li, R.; Li, H.; Hu, B.; Guo, Q. Groundwall insulation damage localization of large generator stator bar using an active Lamb waves method. IEEE Trans. Dielectr. Electr. Insul. 2017, 24, 1860–1869. [Google Scholar] [CrossRef]
  2. Habib, B.; Al Zaabi, O.; Harid, N.; Al Hosani, K.; Alkhatib, M. Condition Monitoring Based on Partial Discharge Diagnostics Using UHF Sensors: A Comprehensive State-of-the-Art Review. IEEE Trans. Dielectr. Electr. Insul. 2024, 31, 2860–2873. [Google Scholar] [CrossRef]
  3. Ilkhechi, H.D.; Samimi, M.H. Applications of the Acoustic Method in Partial Discharge Measurement: A Review. IEEE Trans. Dielectr. Electr. Insul. 2021, 28, 42–51. [Google Scholar] [CrossRef]
  4. Yusoff, N.A.; Isa, M.; Hamid, H.; Adzman, M.R.; Rohani, M.N.K.H.; Chai, C.Y.; Ayop, N.N. Denoising technique for partial discharge signal: A comparison performance between artificial neural network, fast fourier transform and discrete wavelet transform. In Proceedings of the 2016 IEEE International Conference on Power and Energy (PECon), Melaka, Malaysia, 28–29 November 2016; pp. 311–316. [Google Scholar] [CrossRef]
  5. Friebe, K.; Jenau, F. Evaluation Study on Wavelet Denoising of Antenna-Based PD Measurements in Strong Interference Environments Considering a New Reliability Score of Pulse Detection. IEEE Trans. Dielectr. Electr. Insul. 2024, 31, 2887–2896. [Google Scholar] [CrossRef]
  6. Chan, J.C.; Ma, H.; Saha, T.K.; Ekanayake, C. Self-adaptive partial discharge signal de-noising based on ensemble empirical mode decomposition and automatic morphological thresholding. IEEE Trans. Dielectr. Electr. Insul. 2014, 21, 294–303. [Google Scholar] [CrossRef]
  7. Wang, X.; Wang, X.; Gao, J.; Tian, Y.; Kang, Q.; Zhang, F.; Liu, W. A Denoising Method for Cable Partial Discharge Signals Based on Image Information Entropy and Multivariate Variational Mode Decomposition. IEEE Trans. Instrum. Meas. 2024, 73, 3500415. [Google Scholar] [CrossRef]
  8. Cao, J.; Wang, Y.; Zhu, W.; Zhang, Y. A Noise Reduction Algorithm for White Noise and Periodic Narrowband Interference Noise in Partial Discharge Signals. Appl. Sci. 2025, 15, 1760. [Google Scholar] [CrossRef]
  9. Raymond, W.J.K.; Xin, C.W.; Kin, L.W.; Illias, H.A. Noise invariant partial discharge classification based on convolutional neural network. Measurement 2021, 177, 109220. [Google Scholar] [CrossRef]
  10. Soltani, A.A. Employing Artificial Neural Network as a Novel Method for De-noising of Partial Discharge Signals. In Proceedings of the 2019 International Power System Conference (PSC), Tehran, Iran, 9–11 December 2019; pp. 269–274. [Google Scholar] [CrossRef]
  11. Barrios, S.; Buldain, D.; Comech, M.P.; Gilbert, I. Partial Discharge Identification in MV Switchgear Using Scalogram Representations and Convolutional AutoEncoder. IEEE Trans. Power Deliv. 2021, 36, 3448–3455. [Google Scholar] [CrossRef]
  12. Chaudhuri, S.; Ghosh, S.; Dey, D.; Munshi, S.; Chatterjee, B.; Dalai, S. Denoising of partial discharge signal using a hybrid framework of total variation denoising-autoencoder. Measurement 2023, 223, 113674. [Google Scholar] [CrossRef]
  13. Zhong, J.; Liu, Z.; Bi, X. Partial Discharge Signal Denoising Algorithm Based on Aquila Optimizer—Variational Mode Decomposition and K-Singular Value Decomposition. Appl. Sci. 2024, 14, 2755. [Google Scholar] [CrossRef]
  14. Hassan, F.; Rahim, L.A.; Mahmood, A.K.; Abed, S.A. A Hybrid Particle Swarm Optimization-Based Wavelet Threshold Denoising Algorithm for Acoustic Emission Signals. Symmetry 2022, 14, 1253. [Google Scholar] [CrossRef]
  15. Liu, Z.; Li, J.; Zhang, T.; Chen, S.; Xin, D.; Liu, K.; Chen, K.; Liu, Y.C.; Sun, C.; Gao, G.; et al. Accurate Identification of Partial Discharge Signals in Cable Terminations of High-Speed Electric Multiple Unit Using Wavelet Transform and Deep Belief Network. Appl. Sci. 2024, 14, 4743. [Google Scholar] [CrossRef]
  16. Kumar, C.; Ganguly, B.; Dey, D.; Chatterjee, S. Recent trends and open challenges in acoustic partial discharge signal denoising techniques: A review. Electr. Power Syst. Res. 2025, 248, 111931. [Google Scholar] [CrossRef]
  17. Jiang, X.; Lang, Q.; Jing, Q.; Wang, H.; Chen, J.; Ai, Q. An Improved Wavelet Threshold Denoising Method for Health Monitoring Data: A Case Study of the Hong Kong-Zhuhai-Macao Bridge Immersed Tunnel. Appl. Sci. 2022, 12, 6743. [Google Scholar] [CrossRef]
  18. Carvalho, A.T.; Lima, A.C.; Cunha, C.F.; Petraglia, M. Identification of partial discharges immersed in noise in large hydro-generators based on improved wavelet selection methods. Measurement 2015, 75, 122–133. [Google Scholar] [CrossRef]
  19. Wang, G.; Kim, S.J.; Kil, G.S.; Kim, S.W. Optimization of wavelet and thresholding for partial discharge detection under HVDC. IEEE Trans. Dielectr. Electr. Insul. 2017, 24, 200–208. [Google Scholar] [CrossRef]
  20. Ma, X.; Zhou, C.; Kemp, I. Automated wavelet selection and thresholding for PD detection. IEEE Electr. Insul. Mag. 2002, 18, 37–45. [Google Scholar] [CrossRef]
  21. Hussein, R.; Shaban, K.B.; El-Hag, A.H. Wavelet Transform With Histogram-Based Threshold Estimation for Online Partial Discharge Signal Denoising. IEEE Trans. Instrum. Meas. 2015, 64, 3601–3614. [Google Scholar] [CrossRef]
  22. Li, H.; Shi, J.; Li, L.; Tuo, X.; Qu, K.; Rong, W. Novel Wavelet Threshold Denoising Method to Highlight the First Break of Noisy Microseismic Recordings. IEEE Trans. Geosci. Remote Sens. 2022, 60, 5910110. [Google Scholar] [CrossRef]
  23. Yi, T.H.; Li, H.N.; Zhao, X.Y. Noise Smoothing for Structural Vibration Test Signals Using an Improved Wavelet Thresholding Technique. Sensors 2012, 12, 11205–11220. [Google Scholar] [CrossRef]
  24. Li, S.; Liu, S.; Wang, J.; Yan, S.; Liu, J.; Du, Z. Adaptive-Wavelet-Threshold-Function-Based M2M Gaussian Noise Removal Method. IEEE Internet Things J. 2024, 11, 33177–33192. [Google Scholar] [CrossRef]
  25. Sun, Z.; Lu, J. An Ultrasonic Signal Denoising Method for EMU Wheel Trackside Fault Diagnosis System Based on Improved Threshold Function. IEEE Access 2021, 9, 96244–96256. [Google Scholar] [CrossRef]
  26. Donoho, D.L.; Johnstone, I.M. Ideal Spatial Adaptation by Wavelet Shrinkage. Biometrika 1994, 81, 425–455. [Google Scholar] [CrossRef]
  27. Jing-Yi, L.; Hong, L.; Dong, Y.; Yan-Sheng, Z. A New Wavelet Threshold Function and Denoising Application. Math. Probl. Eng. 2016, 2016, 3195492. [Google Scholar] [CrossRef]
  28. Cunha, C.F.; Carvalho, A.T.; Petraglia, M.R.; Lima, A.C. A new wavelet selection method for partial discharge denoising. Electr. Power Syst. Res. 2015, 125, 184–195. [Google Scholar] [CrossRef]
  29. Haider, N.S. Respiratory sound denoising using Empirical Mode Decomposition, Hurst analysis and Spectral Subtraction. Biomed. Signal Process. Control 2021, 64, 102313. [Google Scholar] [CrossRef]
  30. Naveed, K.; Akhtar, M.T.; Siddiqui, M.F.; ur Rehman, N. A statistical approach to signal denoising based on data-driven multiscale representation. Digit. Signal Process. 2021, 108, 102896. [Google Scholar] [CrossRef]
  31. Rauscher, A.; Kaiser, J.; Devaraju, M.; Endisch, C. Deep learning and data augmentation for partial discharge detection in electrical machines. Eng. Appl. Artif. Intell. 2024, 133, 108074. [Google Scholar] [CrossRef]
  32. Rauscher, A. Dataset of Partial Discharge and Noise Signals. Figshare. Available online: https://figshare.com/articles/dataset/Dataset_of_partial_discharge_and_noise_signals/24033225/1 (accessed on 16 November 2023).
Figure 1. Flowchart of wavelet threshold denoising.
Applsci 15 10509 g001
Figure 2. Improved threshold function, classical hard and soft threshold function.
Applsci 15 10509 g002
Figure 3. Flowchart of the proposed approach with improved thresholding function.
Applsci 15 10509 g003
Figure 4. Wavelet basis. (a) Average correlations between the different wavelet basis function and the two simulation PD signals. (b) Waveforms of five wavelet basis functions, i.e., db7–db10 and sym9.
Applsci 15 10509 g004
Figure 5. Denoised results of the three thresholding functions for two simulated PD signal ( S 1 and S 2 ) under Gaussian noise with SNR in = 10 dB. (a,b): pure PD signals S 1 and S 2 , respectively; (c,d): noisy S 1 and S 2 with SNR in = 10 dB, respectively; (e,f): Hard-thresholding-based denoised S 1 and S 2 , respectively; (g,h): Soft-thresholding-based denoised S 1 and S 2 , respectively; (i,j): Improved-thresholding-based denoised S 1 and S 2 , respectively.
Applsci 15 10509 g005
Figure 6. Denoised results of three denoising approaches for two simulated PD signals under Gaussian noise ( SNR in = 10 dB). (a,b) pure PD signals S 1 and S 2 , respectively; (c,d) noisy S 1 and S 2 with SNR in = 10 dB, respectively; (e,f) EMD-based denoised S 1 and S 2 , respectively; (g,h) VMD-based denoised S 1 and S 2 , respectively; (i,j) proposed-approach-based denoised S 1 and S 2 , respectively.
Applsci 15 10509 g006
Figure 7. Denoised results of three denoising approaches for the simulated PD signal S 2 under impulse and Rayleigh noises: (a) noisy PD signals S 2 with impulse noise ( SNR in = 10 dB); (b) noisy PD signals S 2 with Rayleigh noise ( SNR in = 10 dB); (c,d) EMD-based denoising results corresponding to (a) and (b), respectively; (e,f) VMD-based results corresponding to (a) and (b), respectively; (g,h) results of the proposed approach corresponding to (a) and (b), respectively.
Applsci 15 10509 g007
Figure 8. Schematic of PD test setup including a stator, the high-voltage (HV) probe, the antennas, and the scope.
Applsci 15 10509 g008
Figure 9. Results for (a) noisy real-world PD signal using three thresholding functions: (b) hard thresholding function; (c) soft thresholding function; (d) the proposed improved thresholding function.
Applsci 15 10509 g009
Table 1. Denoised performance of different wavelet basis function for PD signals using the proposed approach under SNR i n = 10 dB.
Wavelet BasisPD Signal S 1 in (14) (Mean ± Std)PD Signal S 2 in (15) (Mean ± Std)
SNR out (dB) CC MSE SNR out (dB) CC MSE
db26.0182 ± 1.20960.8720 ± 0.03700.3056 ± 0.08563.7604 ± 0.58500.7717 ± 0.03220.0431 ± 0.0058
db35.8308 ± 1.13240.8667 ± 0.0340.3173 ± 0.08014.2894 ± 0.89130.8007 ± 0.04160.0386 ± 0.0078
db45.6425 ± 0.95140.8587 ± 0.03160.3286 ± 0.07454.7276 ± 0.67250.8210 ± 0.03000.0346 ± 0.0052
db57.2287 ± 1.33580.9029 ± 0.02940.2336 ± 0.07705.4934 ± 0.68210.8517 ± 0.02410.0290 ± 0.0045
db66.2959 ± 1.05100.8840 ± 0.03010.2843 ± 0.07215.0290 ± 0.80230.8326 ± 0.03250.0324 ± 0.0059
db74.8637 ± 1.01450.8313 ± 0.03840.3940 ± 0.08974.1013 ± 0.83690.7871 ± 0.04650.0402 ± 0.0079
db85.8423 ± 1.10830.8672 ± 0.03410.3165 ± 0.08245.0521 ± 0.82560.8355 ± 0.03630.0323 ± 0.0064
db97.5603 ± 1.61690.9097 ± 0.03410.2211 ± 0.08535.4571 ± 0.59750.8512 ± 0.02180.0292 ± 0.0041
db105.2929 ± 0.94470.8529 ± 0.03140.3558 ± 0.07724.8264 ± 0.76620.8248 ± 0.03520.0340 ± 0.0060
sym25.8177 ± 1.12540.8674 ± 0.03290.3184 ± 0.08173.6741 ± 0.63040.7689 ± 0.03480.0440 ± 0.0063
sym35.7901 ± 1.27790.8626 ± 0.04340.3237 ± 0.09844.4950 ± 0.83540.8096 ± 0.03760.0367 ± 0.0067
sym46.5722 ± 1.31900.8850 ± 0.03780.2709 ± 0.08215.3185 ± 0.96290.8461 ± 0.03780.0306 ± 0.0068
sym56.3388 ± 1.10590.8810 ± 0.03270.2823 ± 0.07365.4483 ± 0.75920.8508 ± 0.02840.0294 ± 0.0053
sym66.3283 ± 1.27890.8781 ± 0.03640.2858 ± 0.08435.3936 ± 1.02860.8467 ± 0.03980.0301 ± 0.0070
sym76.9338 ± 1.17290.8973 ± 0.02570.2472 ± 0.07005.6208 ± 0.69900.8571 ± 0.02430.0282 ± 0.0046
sym86.7236 ± 1.36810.8881 ± 0.03670.2624 ± 0.08175.2626 ± 0.86750.8438 ± 0.03470.0309 ± 0.0064
sym97.0519 ± 1.48860.8961 ± 0.03790.2461 ± 0.08896.6908 ± 1.05970.8889 ± 0.02760.0224 ± 0.0052
sym106.4015 ± 1.36350.8780 ± 0.04180.2827 ± 0.08925.2229 ± 0.94780.8404 ± 0.03930.0312 ± 0.0067
Table 2. Denoised performance of the improved threshold function with different threshold values, SNR i n = 10 dB.
Threshold Value
Selection Approaches
PD Signal S 1 in (14) (Mean ± Std)PD Signal S 2 in (15) (Mean ± Std)
SNR out CC MSE SNR out (dB) CC MSE
Rigrsure3.3704 ± 1.94530.8074 ± 0.06880.0239 ± 0.01121.3284 ± 1.75620.7245 ± 0.06780.0810 ± 0.0325
Heursure7.6367 ± 1.33520.9082 ± 0.03090.0085 ± 0.00275.4219 ± 0.70990.8503 ± 0.02440.0295 ± 0.0050
Sqtwolog6.4464 ± 1.32100.8768 ± 0.04690.0112 ± 0.00375.0308 ± 0.62820.8303 ± 0.03420.0323 ± 0.0055
Minimaxi5.6296 ± 1.11920.8625 ± 0.03880.0133 ± 0.00343.4378 ± 0.82050.7835 ± 0.03490.0468 ± 0.0087
Equation (9)7.8754 ± 1.34310.9133 ± 0.02890.0080 ± 0.00255.4789 ± 0.62500.8510 ± 0.02300.0291 ± 0.0042
Table 3. Denoised performance of three threshold approaches for PD signals under different conditions of Gaussian noise.
NoisyThresholdingPD Signal S 1 in (14) (Mean ± Std)PD Signal S 2 in (15) (Mean ± Std)
SNR in Function SNR out (dB) CC RSE SNR out (dB) CC RSE
Hard2.2368 ± 1.95620.7120 ± 0.11790.0310 ± 0.01381.0807 ± 1.60750.6535 ± 0.11930.0848 ± 0.0328
−15 dBSoft1.6573 ± 0.84650.5553 ± 0.11510.0327 ± 0.00631.1120 ± 0.85180.4708 ± 0.14810.0801 ± 0.0159
Improved3.1572 ± 1.42550.7231 ± 0.11100.0239 ± 0.00772.1482 ± 1.30220.6744 ± 0.12860.0649 ± 0.0211
Hard6.5267 ± 1.77920.8857 ± 0.04370.0113 ± 0.00434.7661 ± 1.07370.8337 ± 0.03770.0349 ± 0.0086
−10 dBSoft5.0642 ± 0.95520.8548 ± 0.04090.0150 ± 0.00324.0329 ± 0.59870.8059 ± 0.03930.0405 ± 0.0057
Improved7.7268 ± 1.29270.9109 ± 0.02740.0083 ± 0.00245.5267 ± 0.67760.8532 ± 0.02370.028 ± 0.0045
Hard10.5002 ± 1.29890.9543 ± 0.01360.0044 ± 0.00138.0284 ± 0.89430.9213 ± 0.01600.0163 ± 0.0033
−5 dBSoft8.9286 ± 0.85300.9534 ± 0.01210.0061 ± 0.00126.6922 ± 0.53170.9061 ± 0.01290.0219 ± 0.0026
Improved11.7572 ± 0.95530.9662 ± 0.00820.0032 ± 0.00078.2108 ± 0.57820.9220 ± 0.01080.0155 ± 0.0020
Hard14.4275 ± 1.20360.9815 ± 0.00530.0018 ± 0.000511.8330 ± 0.75840.9669 ± 0.00600.0068 ± 0.0012
0 dBSoft12.6548 ± 0.64680.9815 ± 0.00300.0026 ± 0.00049.5486 ± 0.41540.9539 ± 0.00560.0113 ± 0.0011
Improved14.5107 ± 0.63230.9824 ± 0.00260.0017 ± 0.000211.0006 ± 0.51620.9595 ± 0.00500.0081 ± 0.0010
Hard18.7930 ± 0.93200.9933 ± 0.00150.0006 ± 0.000116.3392 ± 0.73370.9883 ± 0.00210.0024 ± 0.0004
5 dBSoft16.0659 ± 0.58100.9910 ± 0.00140.0012 ± 0.000212.7499 ± 0.42740.9783 ± 0.00250.0054 ± 0.0005
Improved16.4360 ± 0.48980.9888 ± 0.00130.0011 ± 0.000113.5302 ± 0.44540.9778 ± 0.00240.0045 ± 0.0005
Table 4. Comparison of computational costs between the proposed approach and the EMD-based and VMD-based approaches.
ProposedEMD-BasedVMD-Based
Computational ComplexityO( N log N )O( N 2 K )O( N · K · N p )
Memory ComplexityO(N)O( N · K )O( N · K )
Practical SpeedFastModerateSlow
Table 5. Comparison of the proposed approach with EMD-based [29] and VMD-based [30] denoising approaches for PD signals under Gaussian noise.
NoisyApproachesPD Signal S 1 in (14) (Mean ± Std)PD Signal S 2 in (15) (Mean ± Std)
SNR in SNR out (dB) CC RSE SNR out (dB) CC RSE
EMD−3.0127 ± 1.36080.5076 ± 0.13750.0711 ± 0.0241−3.1075 ± 1.27930.5199 ± 0.09980.2174 ± 0.0711
−15 dBVMD−4.1515 ± 0.63560.5038 ± 0.05570.0888 ± 0.0127−4.1953 ± 0.57880.4889 ± 0.06260.2692 ± 0.0359
Proposed3.1572 ± 1.42550.7231 ± 0.11100.0239 ± 0.00772.1482 ± 1.30220.6744 ± 0.12860.0649 ± 0.0211
EMD1.3751 ± 1.36110.6937 ± 0.17750.0260 ± 0.00931.3697 ± 1.27500.7296 ± 0.09340.0776 ± 0.0258
−10 dBVMD0.8282 ± 0.58520.7289 ± 0.03500.0282 ± 0.00390.7870 ± 0.65700.7223 ± 0.03690.0857 ± 0.0133
Proposed7.7268 ± 1.29270.9109 ± 0.02740.0083 ± 0.00245.5267 ± 0.67760.8532 ±0.02370.028 ± 0.0045
EMD4.4849 ± 2.76440.7389 ± 0.26090.0150 ± 0.01095.3738 ± 1.70460.8360 ± 0.17060.0327 ± 0.0206
−5 dBVMD5.7132 ± 0.60810.8844 ± 0.01520.0092 ± 0.00135.6707 ± 0.59040.8801 ± 0.01450.0278 ± 0.0038
Proposed11.7572± 0.95530.9662 ± 0.00820.0032 ± 0.00078.2108 ± 0.57820.9220 ± 0.01080.0155 ± 0.0020
EMD6.4090± 4.06450.7733 ± 0.25440.0121 ± 0.01148.3309 ±2.59630.8857 ± 0.18460.0199 ± 0.0239
0 dBVMD10.4991± 0.53530.9564 ± 0.00530.0030 ± 0.000410.3454 ± 0.59280.9545 ± 0.00580.0095 ± 0.0013
Proposed14.5107 ± 0.63230.9824 ± 0.00260.0017 ± 0.000211.0006 ± 0.51620.9595 ± 0.00500.0081 ± 0.0010
EMD9.2040 ± 6.05820.7804 ± 0.30160.0105 ± 0.013110.9485 ± 3.61040.9140 ± 0.17190.0149 ± 0.0262
5 dBVMD14.0686 ± 0.37580.9803 ± 0.00170.0013 ± 0.000114.7777 ± 0.57740.9832 ± 0.00220.0034 ± 0.0004
Proposed16.4360 ± 0.48980.9888 ± 0.00130.0011 ± 0.000113.5302 ± 0.44540.9778 ± 0.00240.0045 ± 0.0005
Table 6. Comparison of the proposed approach with EMD-based [29] and VMD-based [30] denoising approaches for PD signals under impulse and Rayleigh noise conditions.
NoisyApproachesImpulse Noise (Mean ± Std)Rayleigh Noise (Mean ± Std)
SNR in SNR out (dB) CC RSE SNR out (dB) CC RSE
EMD−13.4047 ± 0.67470.0858 ± 0.06372.2498 ± 0.3239−3.1848 ± 1.44270.5536 ± 0.09160.2231 ± 0.0758
−15 dBVMD−10.3635 ± 2.79360.3414 ± 0.12731.4449 ± 1.4287−4.1022 ± 0.67740.5053 ± 0.07050.2644 ± 0.0417
Proposed−9.3244 ± 0.57460.3930 ± 0.06410.8767 ± 0.11120.7690 ± 1.38360.4610 ± 0.24760.0891 ± 0.0257
EMD−5.9532 ± 0.68100.3935 ± 0.10670.4048 ± 0.06150.9747 ± 1.25780.6928 ± 0.16000.0847 ± 0.0262
−10 dBVMD−4.6431 ± 2.69230.5344 ± 0.15900.3891 ± 0.41610.7284 ± 0.56720.7208 ± 0.03140.0866 ± 0.0113
Proposed−3.4910 ± 0.48490.6421 ± 0.04180.2283 ± 0.02454.8177 ± 1.14030.8195 ± 0.06380.0348 ± 0.0108
EMD−0.0575± 3.37180.6894 ± 0.19020.1479 ± 0.14975.1037 ± 1.67540.8356 ± 0.14790.0343 ± 0.0189
−5 dBVMD2.5433 ± 0.52570.8323 ± 0.02800.0570 ± 0.00705.5328 ± 0.69600.8777 ± 0.01670.0288 ± 0.0045
Proposed2.7333 ± 0.65550.8469 ± 0.02350.0548 ± 0.00866.8865 ± 0.72600.8918 ± 0.01830.0211 ± 0.0034
EMD1.9693 ± 3.13960.7577 ± 0.13180.0795 ± 0.04147.9319 ± 2.68250.8725 ± 0.20060.0220 ± 0.0258
0 dBVMD9.5146 ± 0.50300.9512 ± 0.00610.0114 ± 0.001410.2021 ± 0.52370.9534 ± 0.00590.0098 ± 0.0012
Proposed8.5846 ± 0.69610.9378 ± 0.01170.0142 ± 0.00239.4609 ± 0.65120.9418 ± 0.00960.0116 ± 0.0018
EMD5.3695 ± 1.85580.8652 ± 0.10280.0319 ± 0.01298.9506 ± 5.35280.8051 ± 0.28880.0311 ± 0.0432
5 dBVMD14.3526± 0.59130.9826 ± 0.00260.0038 ± 0.000514.7831 ± 0.56740.9833 ± 0.00220.0034 ± 0.0004
Proposed11.6736 ± 0.59120.9673 ± 0.00470.0070 ± 0.001011.9500 ± 0.66880.9676 ± 0.00520.0066 ± 0.0010
Disclaimer/Publisher’s Note: The statements, opinions and data contained in all publications are solely those of the individual author(s) and contributor(s) and not of MDPI and/or the editor(s). MDPI and/or the editor(s) disclaim responsibility for any injury to people or property resulting from any ideas, methods, instructions or products referred to in the content.