Article

High Heat Producing Mesoproterozoic Granitoids and Their Impact on the Geothermal Field in Lithuania, Baltic Basin

by
Saulius Šliaupa
1,* and
Gediminas Motuza
2
1
Nature Research Centre, State Scientific Research Institute, Akademijos 2, LT-08412 Vilnius, Lithuania
2
Faculty of Chemistry and Geosciences, Institute of Geosciences, Vilnius University, M. K. Čiurlionio 21/27, LT-03101 Vilnius, Lithuania
*
Author to whom correspondence should be addressed.
Appl. Sci. 2025, 15(19), 10480; https://doi.org/10.3390/app151910480
Submission received: 28 July 2025 / Revised: 23 September 2025 / Accepted: 25 September 2025 / Published: 27 September 2025
(This article belongs to the Section Earth Sciences)

Abstract

The Palaeoproterozoic crystalline basement is overlain by the Baltic Basin. Lithuania is situated in the shallow eastern periphery and grades into the deep part of the basin, which comprises a number oil fields; the thickness of the sedimentary cover varies from 0.2 to 2.3 km. The Mesoproterozoic granitoid intrusions of different scales were discovered in the crystalline basement. In total, thirteen intrusions were defined on the gravity and magnetic maps and studied by abundant deep boreholes drilled in Lithuania. The recent dating revealed several phases of magmatic activity ranging from 1625 to 1445 Ma. No systematic lateral and temporal distribution of intrusions was noticed. The intrusions comprise sub-alkaline I-type diorites and quartz monzodiorites, granodiorites, and granites. The radiogenic granitoids are characterized by anomalous heat production ranging from 2.8 to 18.2 μW/m3 (average 7.26 μW/m3). The shoshonitic series correlates with high heat production. Furthermore, the Th series is documented in west Lithuanian (WLD) intrusions, while Th-U-enriched granitoids show high heat production in east Lithuania (LBB) domains. The high iron (magnetite) content of the Mesoproterozoic magmatic rocks accounts for specific high magnetic field anomalies. The most voluminous intrusions are mapped in the West Lithuanian Geothermal Anomaly, which is the most spectacular geothermal feature recognized in the East European Platform.

1. Introduction

The highest geothermal potential is considered in relation to low-enthalpy sandstone reservoirs in the Baltic Basin, e.g., Cambrian, Lower Devonian, and Middle Devonian sandy aquifers defined in the Baltic Basin [1]. Despite high geothermal potential, there is no successful geothermal plant operating in the Baltic region [2]. Alternatively, hot dry rock (HDR) is the most abundant source of geothermal energy that is still difficult to access [3]. A vast store of thermal energy is contained within hot but essentially dry and impervious crystalline basement rocks. Enhanced geothermal systems (EGS), also known as hot dry rock or hot fractured rock systems, enable the economic employment of initially low-permeability conductive rocks by creating fluid connectivity through hydraulic, thermal, or chemical stimulation [4,5,6].
The present study focuses on hot granites to gain a better understanding of the generation and excessive radiogenic heat production of granites, defined in the crystalline basement [7], which are overlain by sedimentary rocks in the Baltic Basin [7]. The exposed outcropping metamorphic rocks provide better control of the geological system, e.g., the Fennoscandian Shield flanking the Baltic Basin. The study of heat flux density and radiogenic heat production rate provides essential information on the temperature and structure of the continental crust [8]. The high content of radiogenic elements (K, U, and Th) is related to the initial conditions of magma formation, magmatic source material, and differentiation processes [9].
The first EGS pilot project in the Baltic region was initiated at the Fjällbacka site in 1988, situated in the exposed granites of the westernmost part of the Fennoscandian Shield [10]. The Bohus peraluminous monzogranite was intruded at 920 Ma after cessation of the Sveconorwegian orogeny [11].
Recently, the focus on hot dry rocks has dramatically increased in recent years in the Baltic region. The 3.1 and 3.7 km deep geothermal exploration wells were drilled into the Precambrian crystalline basement to evaluate experiences for drilling, geological conditions, and thermal properties in the Fennoscandian Shield Border Zone in south Sweden [12]. Both wells penetrated an approximately two-kilometer-thick succession of sedimentary strata. The average heat production was defined at 3.0 μW/m3. Both sites are situated in proximity to the largest-scale Teisseyre–Tornquist Zone (TTZ).
In Finland, far from active major tectonic zones, St1 Oy is developing an ambiguous geoenergy project in Otaniemi, Espoo [13,14]. The St1 project, with its two deep boreholes extending to 6.2 km and 6.4 km depth in the Proterozoic gneisses, is the world’s deepest industrial geoenergy project.
The shallow setting of the crystalline basement in the northeast periphery of the Baltic Basin has recently encouraged several projects in Estonia. Geothermal Baltic OÜ aims to provide a 15 MW hydrothermal heat supply to Narva City and extract geothermal energy at a depth of 3–6 km [15]. The Palaeoproterozoic crystalline basement is overlain by the Ediacaran–Cambrian terrigenous sedimentary deposits of 250 m thick. Additionally, two Estonian geothermal pilot plants utilize the DHE technology (downhole heat exchanger) to harness geothermal energy in the western outskirts of Tallinn City (Tiskre) (one well, 505 m deep) and in the Roosna-Alliku area (five wells, 500 m deep). They crossed the Quaternary and Lower Paleozoic sedimentary rocks and penetrated the crystalline basement for a few hundred meters [16].
The granites are commonly characterized by increased heat production. The average bulk radiogenic heat production in all types of granitic rocks of all ages was evaluated at 2.92 ± 1.86 μW/m3 [17]. The heat production tends to increase gradually with progressively younger geologic emplacement age, based on a statistical analysis of the data. It should be emphasized that most EGS projects primarily focused on the fracturing behavior of crystalline basement rocks, which are essentially subject to hydrothermal activity, while rock heat production was considered to be of subordinate (or negligible) importance.
The recent studies of so-called “radiogenic granites” have gained focus in some regions due to the excessive heat production of some granites. Investigations of the Caledonian “hot” granite plutons in Scotland prove favorable for geothermal exploration of selected large plutons, all of which have heat production values greater than 3–5 μW m−3 [18]. This heat production arises from the significant concentrations of potassium, uranium, and thorium in some granite plutons. In England, the potential for geothermal power production is essential in the granites of South West England (Permian) and Northern England (Devonian) [19,20]. The average heat production was estimated at 4.6 μW/m3 and 4.1 μW/m3, respectively.
Much of the Mid-European basement has been consolidated during the Variscan Orogeny and includes large volumes of granitic intrusions. In particular, the heat production of radiogenic granites of the Bohemian Massif varies from 3.9 and 8.9 µW/m3, with a mean of 4.9 µW/m3 [21]. The ratio of Th/U vary from lower to higher than 1.0. The ratios exceeding unity are most likely related to the abundance of monazite. The low Th/U ratios here are in agreement with a possible U mobilization along the Saxothuringian–Moldanubian contact zone.
The heat potential was classified as low-, moderate-, and high-heat-producing granites. For this classification, some authors used a lower limit of 4 µW/m3 for moderate and 8 µW/m3 for high heat production, respectively. This classification follows the scheme established by [22] for the Mesoproterozoic granitic intrusions in Queensland, Australia. As mentioned above, the Mesoprosopic granitoids are characterized by the globally highest heat production.
In the present study, we provide the essential parameters of the Mesoproterozoic intrusions documented in Lithuania. In terms of the tectonic setting, the study area is situated in the eastern periphery and central part of the Baltic Basin. In the previous study, geothermal features of the most prospective Žemaičių Naumiestis batholith were evaluated [22]. Despite deep burial depth (ca. 2.0 km), the intrusion is well-delineated on the magnetic and Bouguer anomaly (positive correlation), and the abundant deep wells (N = 29) were drilled by coring to as deep as 20–65 m.
The extensive Mesoproterozoic magmatic event was recognized in Lithuania. In the present study, the petrophysical parameters were derived for the interpretation of the magnetic and gravity anomalies. The petrological and geochemical features of granodiorites were studied, with a focus on the high heat generation of these granitoids. The granitoids are classified as the “hot” intrusions, owing to high radiogenic heat production (>2.8 µW/m3).

2. Heat Flow of Lithuania

The temperature measurements in the deep wells were systematically carried out from the 1960s until the mid-1990s in Lithuania. Most of the deep drilling has reached the top of the crystalline basement or the Cambrian sedimentary reservoir; the latter is prospective for hydrocarbon exploration, while the former geological formation was considered prospective for mineral resources, e.g., magnetite deposits in southeast Lithuania. The oil exploration wells were drilled in the west and middle of Lithuania, while deep geological mapping boreholes were drilled in the southeast of Lithuania.
In total, the geothermal database of Lithuania comprises 204 deep boreholes; the temperature logging was carried out in 156 deep boreholes [23]. The depth of the top of the crystalline basement varies from 211.5 m (borehole Čepkeliai-350 penetrated the Mesoproterozoic granite) to 2164 m (borehole Purmaliai-1 reached the top of the Mesoproterozoic blastomonitic granodiorite). Also, the geothermal database comprises key boreholes studied in the Kaliningrad District.
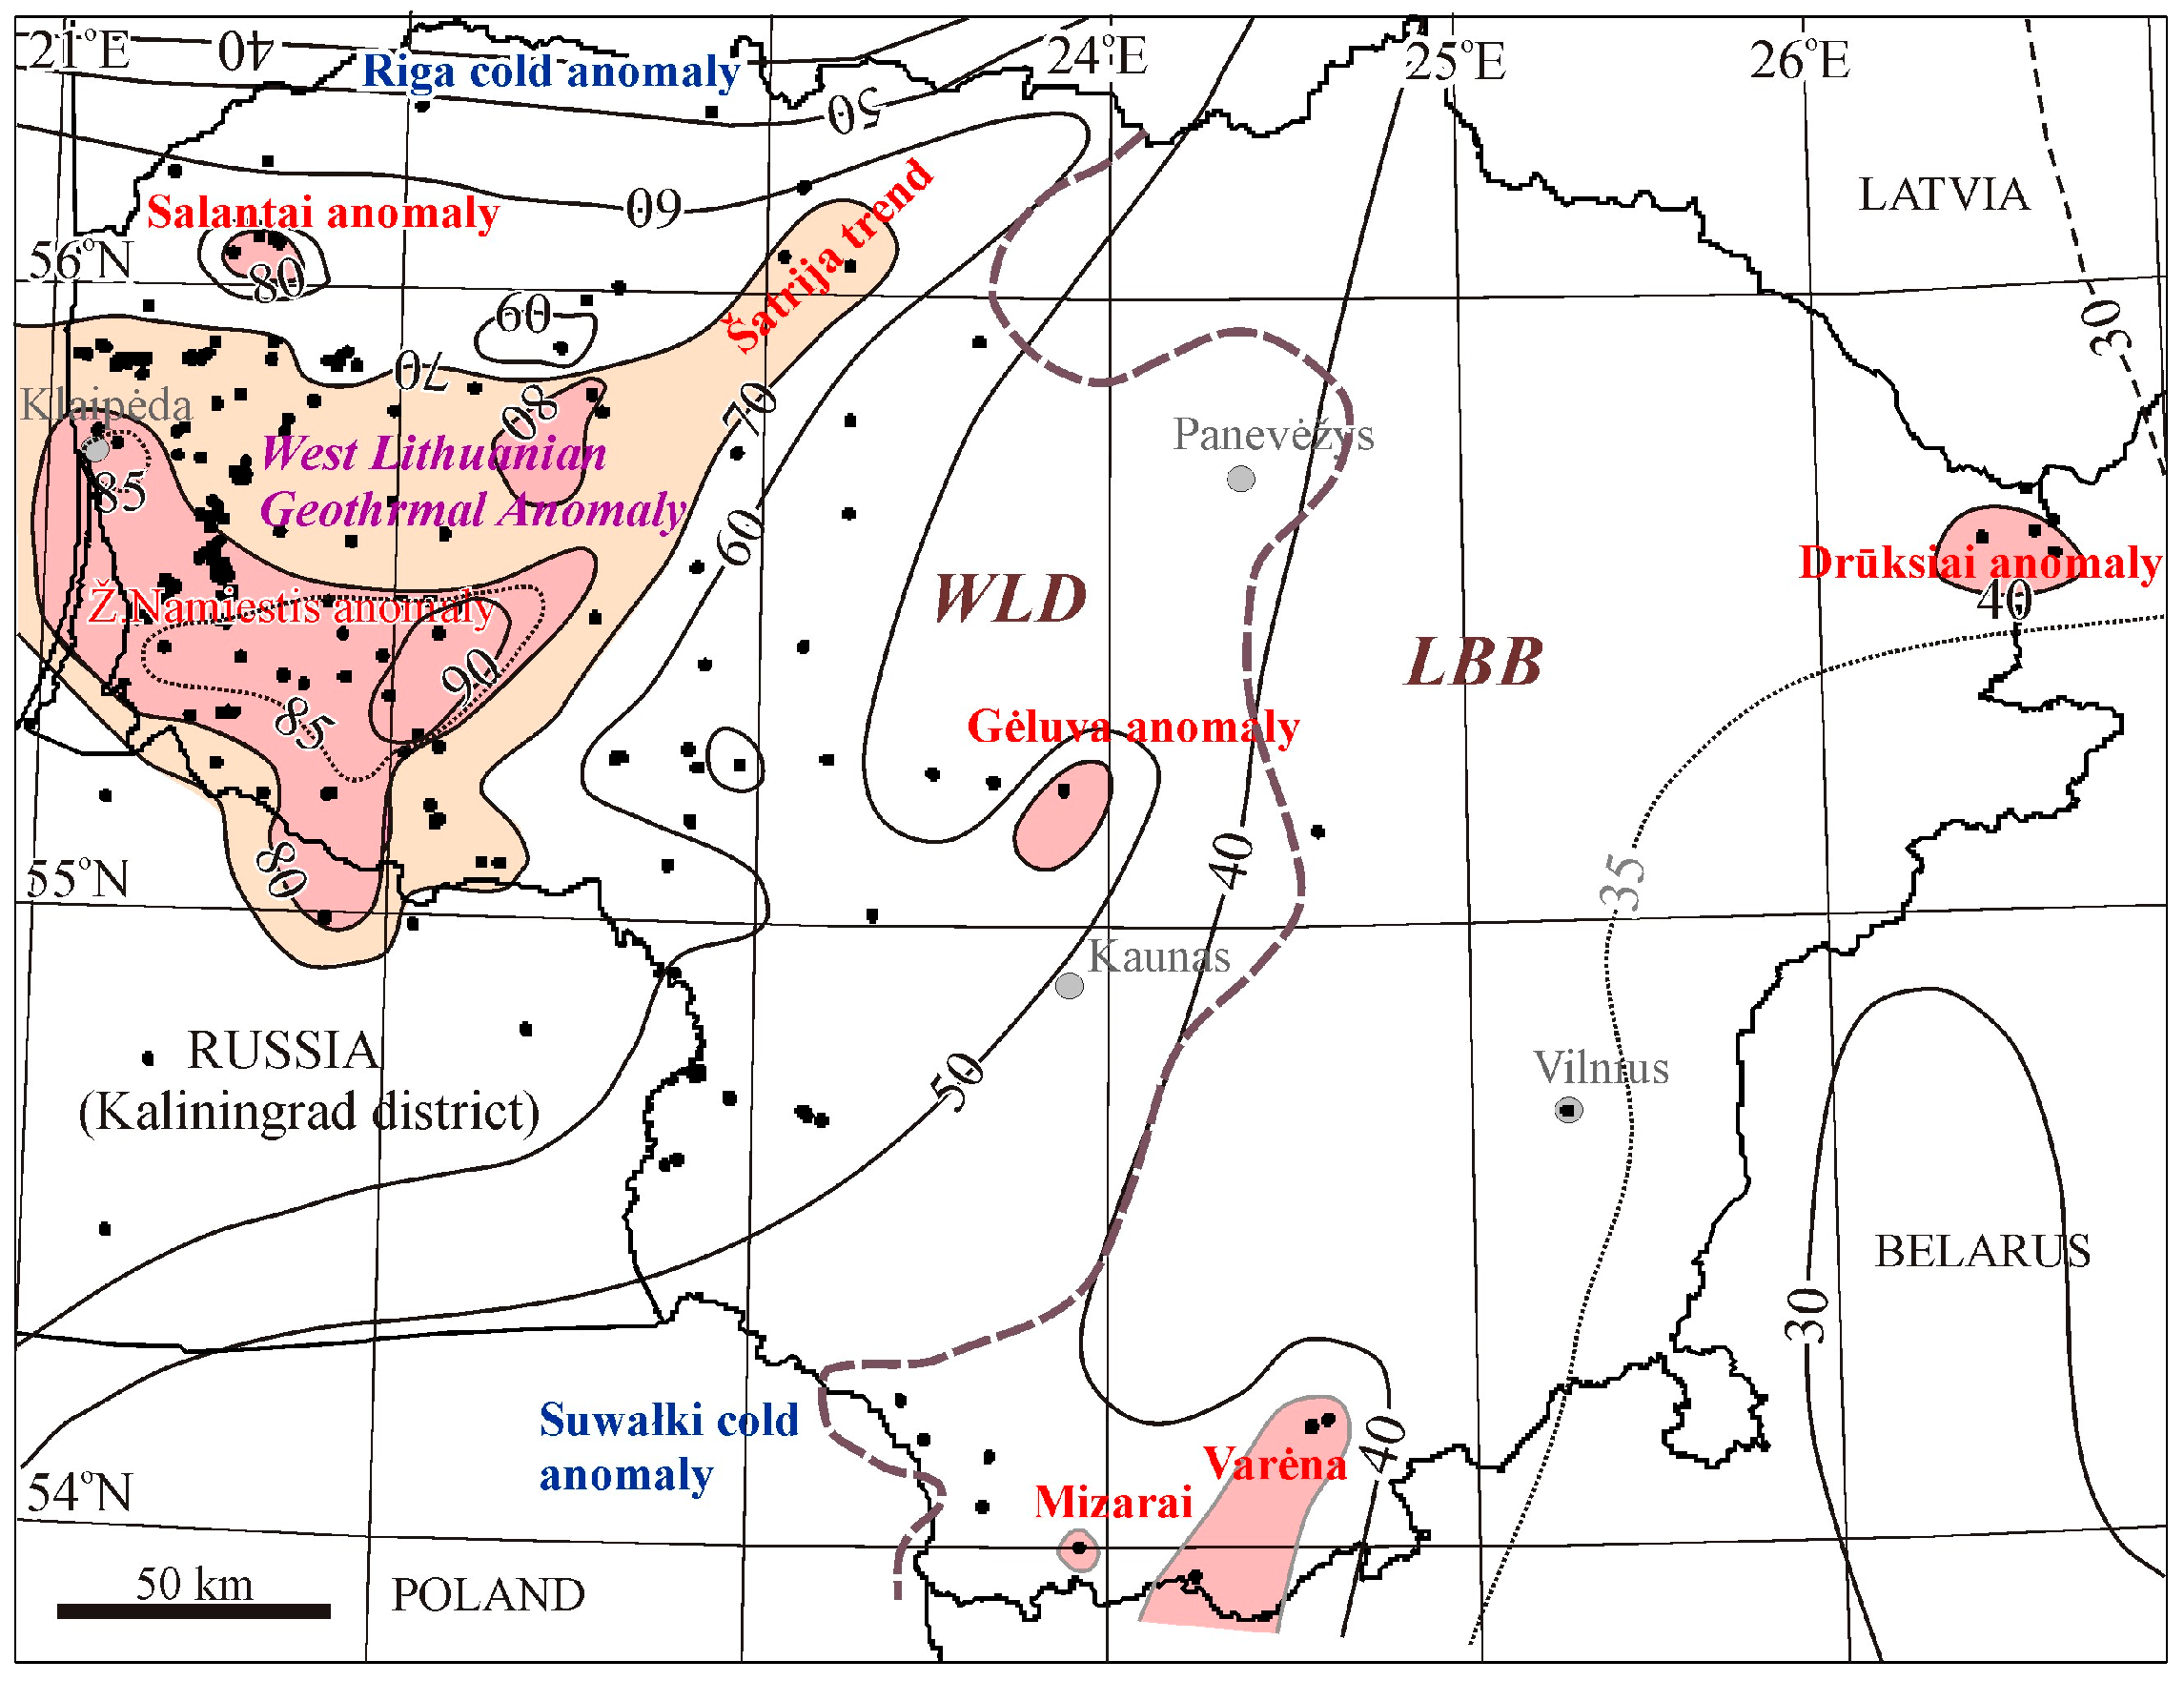
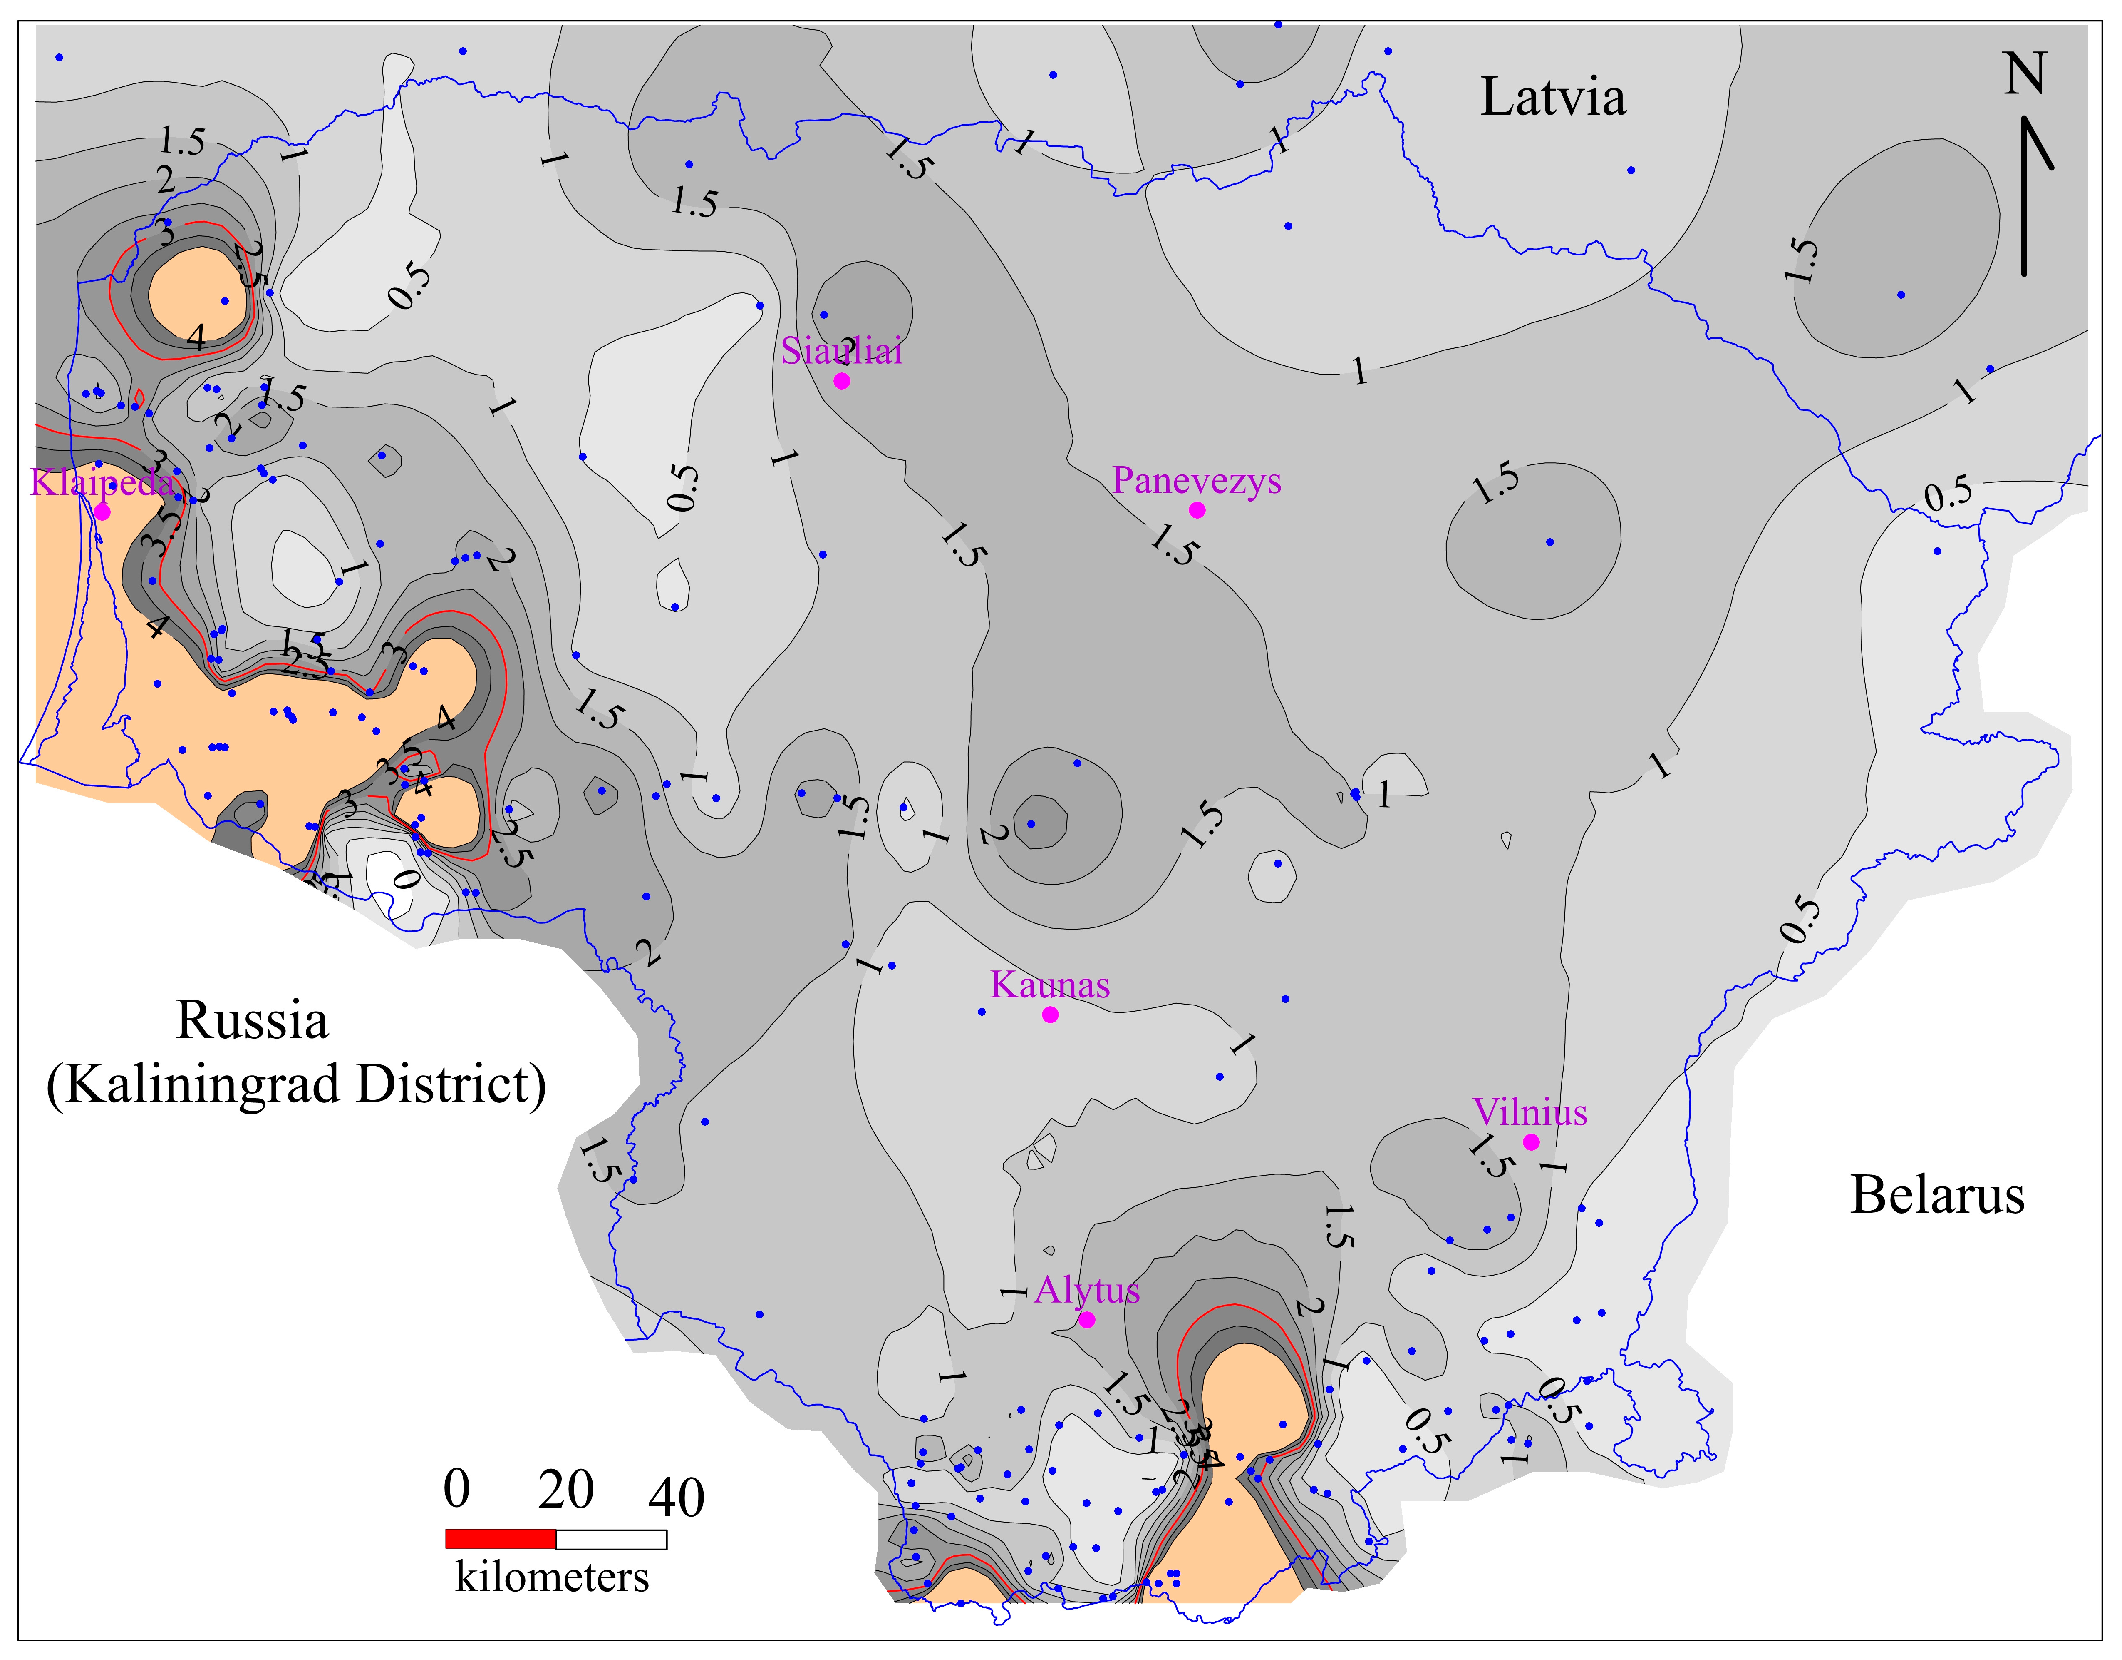
The geothermal gradient of the sedimentary cover exhibits a systematic westward increase, ranging from 11.1 °C/km to 43.9 °C/km (Figure 1A). The sedimentary basin is underlain by the Palaeoproterozoic crystalline basement that is subdivided into two lithotectonic domains, referred to as the West Lithuanian Domain (WLD) and Lithuanian–Belarus Belt (LBB), which substantially differ in the lithological composition and tectonic structuring of metamorphic rocks (Figure 1B) [24], formed in the course of different stages of Svecofennian (senso largo) orogeny. The average geothermal gradient is assessed at 29.8 °C/km in the east and 34.9 °C/km in west Lithuania.
Several geothermal anomalies are distinct on the plot of depth vs. temperature (Figure 1A). The largest and most intense regional-scale West Lithuanian Geothermal Anomaly was defined [25]. The smaller local anomalies were defined in the east (Kabeliai anomaly) and middle Lithuania (Gėluva anomaly).
The increase in geothermal gradient correlates with the burial depth of the sedimentary reservoirs. Three major sandy geothermal aquifers were defined in the Baltic Artesian Basin, e.g., Cambrian (Deimena RSt.), Lower Devonian (Kemeri Fm.), and Middle-Upper Devonian (Šventoji-Upninkai Fms.) [1].
Based on deep seismic sounding data, the thickness of the Earth’s crust was measured at 49–53 km in the east and attenuated to 43 km in west Lithuania [26,27]. The transition zone, separating two domains, was defined as the peculiar Middle Lithuania Zone identified as either the particular lithotectonic zone or the juxtaposition of LBB and WLD blocks. The nature of this suture is still debated [24]. The difference in seismic velocity parameters suggests that a more sialic Earth’s crust was interpreted in thinner WLD, and the largest thickness of the crust accounts for the high thickness of the lower crust of LBB.
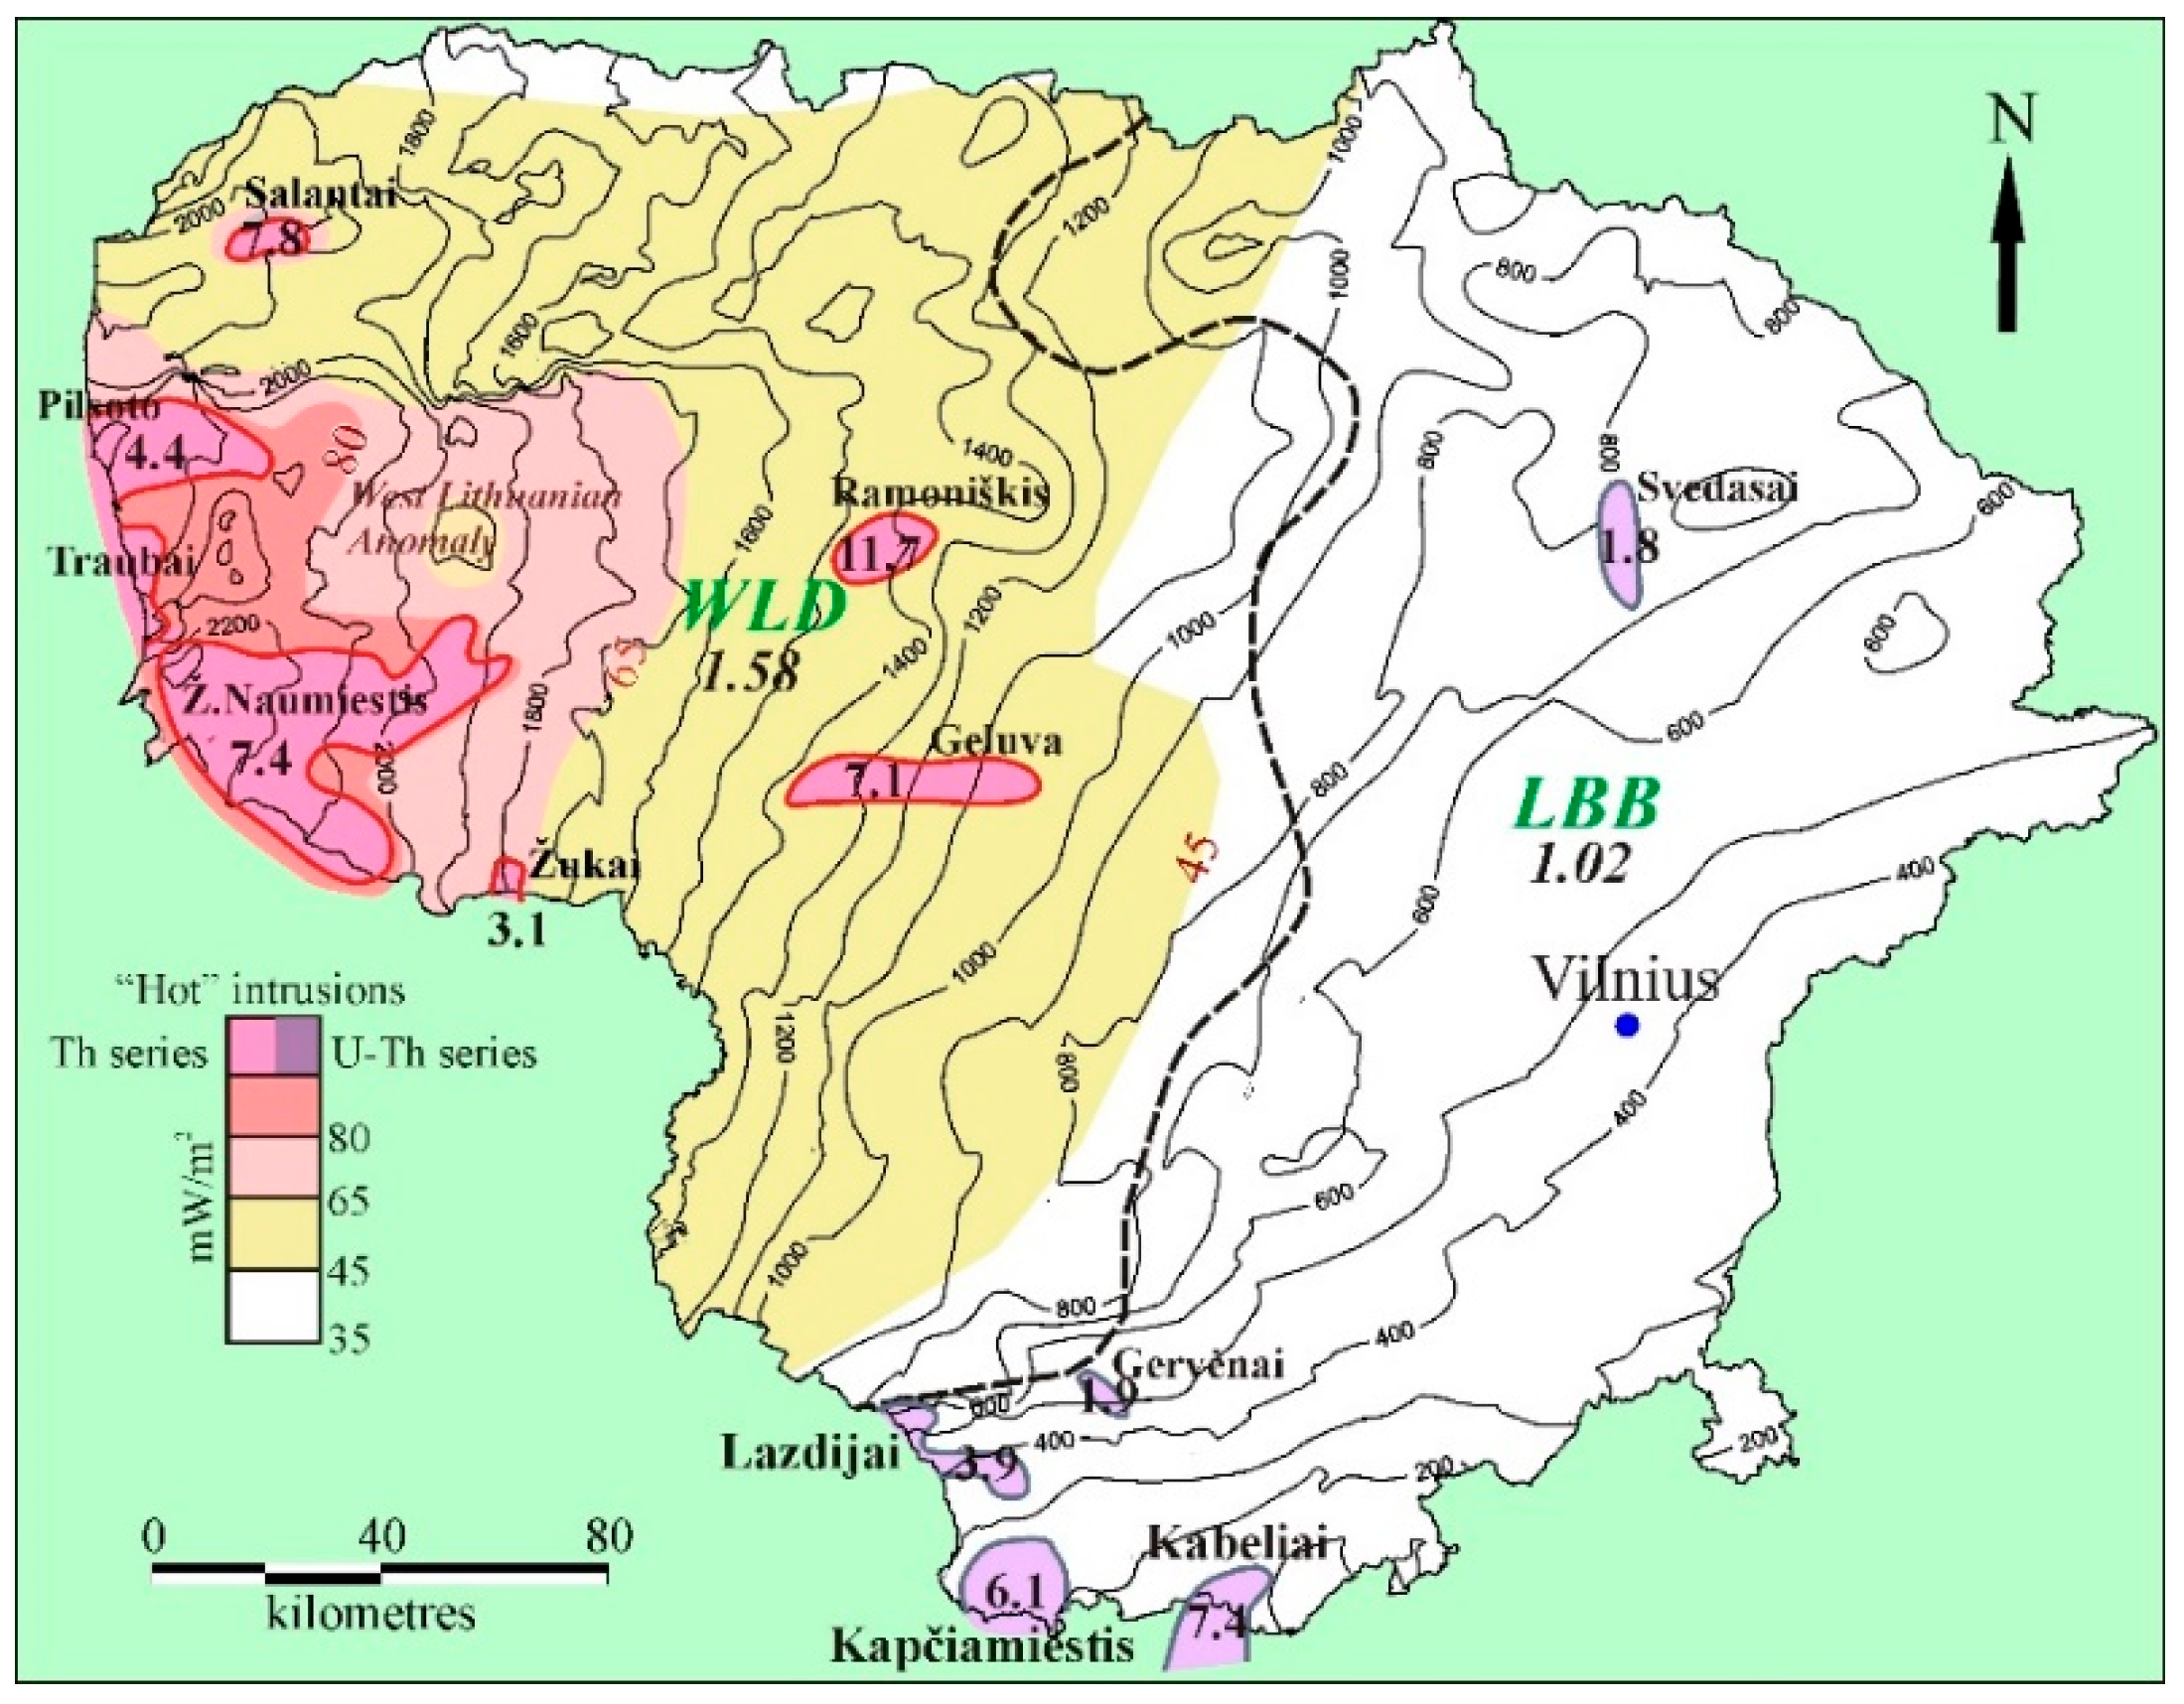
The heat flux varies from 38 mW/m2 in the east to 94 mW/m2 in west Lithuania [23,25,28] (Figure 2). The geothermal data were inspected for the present study. LBB and WLD crustal blocks are confined to two geothermal provinces conventionally delineated at the contour line at ca. 45 mW/m2. The heat flow is partially accounted for by the variable heat production of the crystalline basement. Also, the active mantle flow was suggested in west Lithuania, based on a seismic tomography experiment [29]. Besides the endogenic parameters, the intense percolation by the meteoric flow and resistant thermal sedimentary blanketing of the Baltic Artesian Basin significantly contribute to variations in the heat flow [1].
Several local geothermal anomalies were defined in Lithuania (Figure 2). The Drūkšiai geothermal anomaly was studied in five boreholes and documented the upward groundwater flow along the fractured zone [23]. The NNE-SSW local anomaly is confined to the Kabeliai radiothermal batholith of the Mezoproterozoic granites and extends to the Varėna Iron Ore Zone.
The regional scale West Lithuanian Geothermal Anomaly is situated in WLD (Figure 2). The anomaly was conventionally limited by a 70 mW/m2 contour line (75 × 124 km, 7000 km2). The Šatrija geothermal trend extends to middle Latvia, which comprises the most considerable geothermal resources [1]. In the southwest, a heat flow of 80–94 mW/m2 was determined in the Žemaičių Naumiestis local anomaly [22]. Also, the exceptionally high local Salantai anomaly was defined in two wells in the northwest.
Two exotic Suwalki and Kurzeme “cold” geothermal anomalies were identified. In NE Poland, the anomaly is related to the residual permafrost effect of the terminal Weichselian ice age and is well-discernible in the background low heat flow, which is partially accounted for by the voluminous anorthosite and gabbro defined in the central part of the intrusion [30]. In Latvia, the anomalous heat flux, which decreases to as low as 19 mW/m2, is confined to the Riga batholith. The central part of intrusions is composed of heat producing granites (3.7–6.2 μW/m3) and grades to anorthosites comprising the southern periphery of the intrusions and shows very low heat production 0.2–0.4 μW/m3 [25]. Most likely, the granitic part of the intrusion was eroded, and only a thin layer was preserved (less than 1 km thick). Moreover, the deep penetration of the meteoric sweet water flow was mapped in the Upper Devonian aquifer (about 650 m) [31].

3. Age and Distribution of the Mesoproterozoic Intrusions of Lithuania

The Wiborg rapakivi granite pluton of 19,000 km2, located in southeastern Finland and the Leningrad Region of Russia, marks the triggering of protracted anorogenic magmatic activity in the Baltic region. The rapakivi granitoids of the pluton are dated ca. 1646–1622 Ma [32]. The average heat production was estimated at 8.0 µW/m3 and reaches the maximum value of 17 µW/m3 [33]. Also, several contemporaneous, smaller granodiorite and rapakivi-like granite intrusions were dated to 1633–1629 Ma in the Estonian territory [34,35]. In west Lithuania, the oldest Mesoproterozoic granodiorite intrusion was dated 1625 ± 6 Ma (borehole Vėlaičiai-2) [36]. Furthermore, the similar granodiorite (vein) cuts the Paleoproterozoic charnockites in borehole Genčiai-6 and was dated at 1622 ± 12 Ma (Table 1). It implies the nucleation of a larger-scale magma chamber at a greater depth. Notably, this intrusion is located in the largest fault zone recognized in the sedimentary cover of Lithuania, established in the Palaeozoic time [37].
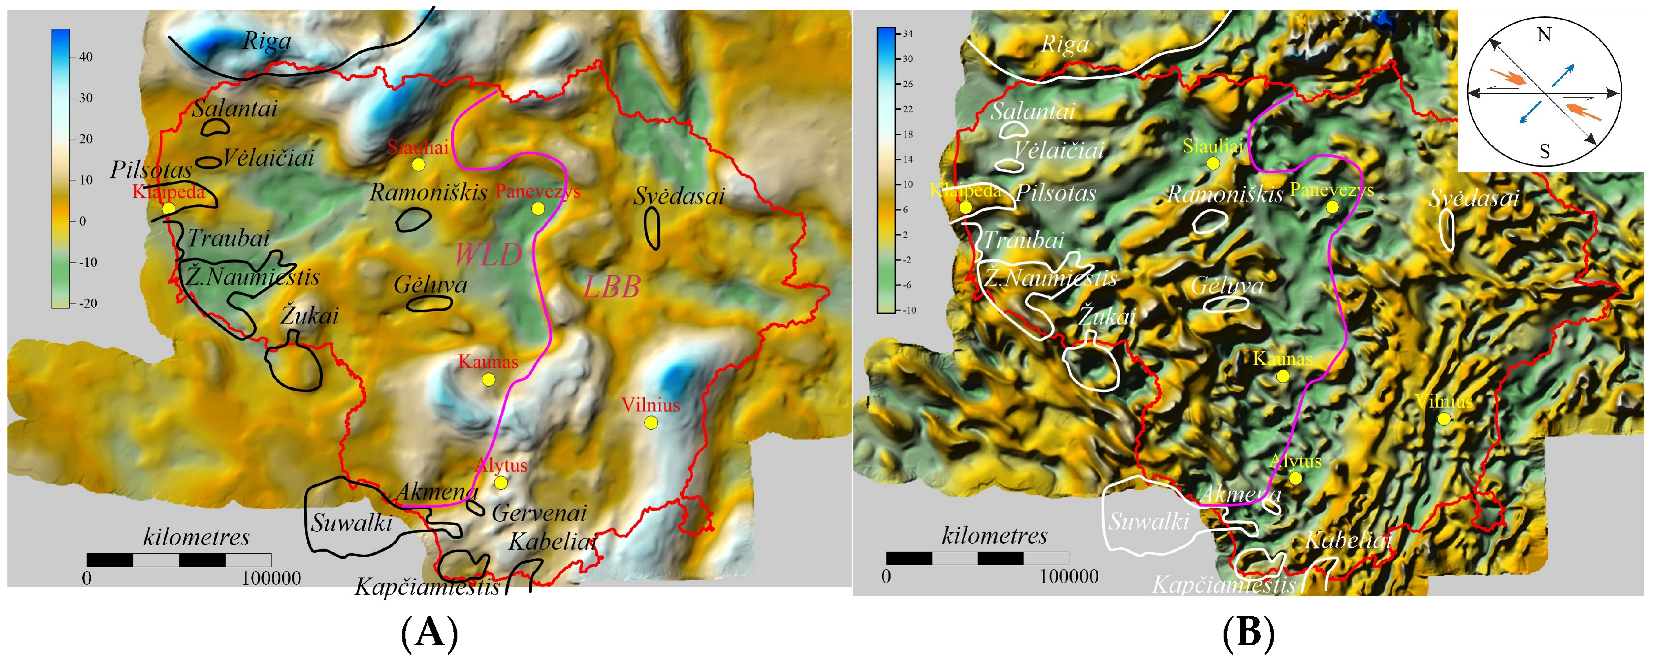
The second phase of igneous activity involved western Finland, Latvia, and eastern Lithuania. In Finland, the Åland, Vehmaa, and several smaller intrusions were dated 1576–1568 Ma [42] and lasted until 1547–1530 Ma (Salmi) [32,43]. The Riga batholith of the AMCG suite (anorthosite–mangerite–charnockite–granite) is the second-largest batholith, with a diameter of 200–250 km. Zircons from the Riga batholith yield ages of 1568 ± 10 Ma [44]. The highest heat production 8.2 µW/m3 was reported in the central part of the pluton and gives way to poor radiogenic mafic lithologies in the southern periphery of the intrusion (0.2–0.4 µW/m3) [25]. Only the most peripheral part of the intrusion extended into northwest Lithuania, as indicated by gravimagnetic mapping data (Figure 3). The small Svėdasai intrusion was drilled in east Lithuania and dated 1569 ± 10 Ma [38] (Figure 3), i.e., contemporaneous with the Riga pluton. The borehole Svėdasai-252 was drilled seeking no specific target in the crystalline basement, as part of the regional geological mapping. Notably, the most intense magnetic anomaly was refined in Lithuania and verified by borehole Tverečius-336. The anomaly is confined to the large Polotsk shear zone, and the borehole cut through the augen-gneiss-mesomylonite after granite (U-Pb titanite TIMS age) yielded a date of 1534 ± 9 Ma [45]. It indicates high tectonic activity, rather than an anorogenic regime that is associated with magmatic activity.
The third phase of the magmatism shifted to the south in the Mazury-Belarus Antelize (present southeast Lithuania and northeast Poland) at about 1.5 Ga. The porphyritic monzogranites and sieno-granites of the Lazdijai intrusions are shown in [46,47]. The quartz moncodiorite was dated at 1511 ± 5 Ma in Gevėnai small intrusion (well Lazdijai-16) (Figure 3). The Akmeniai intrusion (or cluster of small granitic bodies) is considered the eastern appendix of the Suwałki batholith (age 1516–1499 Ma) located in northeast Poland and represents a part of the Mazury anorthosite/mangerite/charnockite/granite belt trending E-W along the Polish and Kaliningrad District (Russia) state border and extending for ca. 300 km [48,49]. The easternmost Kabeliai batholith was dated at 1505 ± 11 Ma [40] (Figure 3). This intrusion grades to the peculiar Varena Iron Ore Deposit in the north [50]. The leucogranite and syenitic granite veins cross this ore zone. The veins were dated at 1512 ± 13 Ma (borehole Varėna-987) and 1497 ± 7 Ma (borehole Dzūkija-9). The mineralogical and geochemical features show a low-temperature eutectic assemblage [41].
The final phase of the magmatic activity was recorded in the abundant deep boreholes drilled in west Lithuania [51]. The largest Žemaičių Naumiestis batholith is mainly composed of the monzogranites and quartz moncodiorites dated at 1469–1447 Ma (dating in three boreholes) [47,48]. It implies a few phases of the batholith (Table 1). The contemporary Pilsotas pyroxene granitoids were dated at 1468 ± 3 Ma [24]. In middle Lithuania, the granitoid intrusion was dated at 1445 ± 5 Ma in borehole Gėluva-99 [39]. The anomalous high heat flow estimated in borehole Gėluva-99 implies a much larger extent of this intrusion (Figure 2).
Ramoniškis and Salantai intrusions, situated in west Lithuania, were not dated. The latter intrusions are confined to a high heat flow anomaly defined in two boreholes, interpreted as having a larger extent below the outcropping top of the basement.

4. Materials and Methods

The geothermal database comprises 204 deep boreholes studied in Lithuania [23]. The extensive oil exploration drilling was carried out in west Lithuania, while the geological mapping of the crystalline basement and assessment of mineral resources provided the most essential information about underground temperature distribution in southeastern Lithuania, as well as scarce boreholes in the eastern part of the country (Figure 1). The geothermal logging was carried out in most of the boreholes (N = 156).
Thirteen intrusions of the Mesoproterozoic age are distributed in Lithuanian territory (Figure 3). The number of boreholes ranges from single wells (Gerdašiai, Svėdasai-252, Žūkai-2) to 29 wells in the Žemaičių Naumiestis batholith. The Mesoproterozoic intrusions were defined by the specific gravity and magnetic signature identified on the gravimagnetic maps. Therefore, the density and magnetic susceptibility were measured in samples collected for the Palaeo- and Mesoproterozoic basement rocks. The Terraplus Kappameter tool was used to measure the magnetic susceptibility of crystalline basement rocks, with a sensitivity of 1 × 10⁻⁶ SI (258 samples). Magnetic properties are basically controlled by the type and amount of ferrimagnetic minerals contained in a rock. However, the bulk of the studied samples is composed of paramagnetic minerals (mafic silicates such as olivine, pyroxenes, amphiboles, micas, tourmaline, and garnets) with an admixture of ferromagnetic minerals (e.g., magnetite or ilmenite). Along with magnetic susceptibility, the density of samples was measured using the approach applied by [52]. Furthermore, density is a crucial parameter for assessing the heat production of rocks (see below).
The description of drill cores and optical microscopy was carried out to inspect the thin sections [24]. The chemical composition of major (11) and trace (32) elements of 65 samples, collected from 55 deep boreholes drilled into Mesoproterozoic rocks, was analyzed, including the content of the radiogenic elements K, U, and Th. The bulk and trace chemical analyses were performed using ICP-MS and XRF methods at Acme Labs, Vancouver, Canada. The results of all chemical analyses were published by [24]. In total, three batholiths and ten smaller intrusions were studied. Also, 281 samples were obtained from the Palaeoproterozoic metamorphic rocks as the background heat production of the crystalline basement lithologies.
The heat production (A) of rock was determined by applying Equation [8]:
A[µW/m3] = 10−5 × ρ × (9.52CU + 2.56CTh + 3.48CK)
where ρ (g/cm3) is the density of the rock, and CU, CTh, and CK are the concentration of uranium (ppm), thorium (ppm), and potassium oxide (%), respectively. Additionally, the density of the samples was measured to correct for heat production.
Radiogenic heat production was alternatively derived from standard gamma ray logging, which is available for all oil exploration and geological mapping boreholes. The assessment of the heat production is discussed in [53,54]. The heat production data from 33 boreholes were added to the database for a more consistent assessment of the geothermal potential of the crystalline basement rocks in Lithuania.

5. Results

5.1. Petrography

The Palaeoproterozoic metamorphic rocks were intruded by the Mesoproterozoic granitoids and are widely recognized in the Baltic region [24,32,34,35,42,46,48]. In the studied drill cores, the granitoids are predominantly medium- to coarse-grained, often porphyritic. The porphyritic texture is formed by microcline phenocrysts up to a few centimetres in size.
The rock-forming felsic minerals are plagioclase, microcline, and quartz, all of which appear in various quantities, while the mafic minerals are represented by biotite (up to 15%), hornblende, and clinopyroxene (the average amount of mafic minerals is about 10%). The accessory minerals identified are titanite, magnetite, titanomagnetite, zircon, and epidote. Magnetite grains are up to 1.5 mm in size and commonly form anhedral grains. Additionally, the widespread occurrence of uranium-enriched apatite and thorium-rich allanite should be emphasized.
The high content of potassium feldspars significantly contributes to the heat production of granitoids. The size of phenocrysts of microcline reaches up to 3–4 cm and plagioclase up to 2 cm in diameter. A granophyric texture is often observed, formed by quartz intergrowths in plagioclase, indicating the coeval crystallization of both minerals triggered by the rapid cooling or loss of fluids in the magma. In some boreholes (Lazdijai-2,16), a magma mingling of fine-grained massive gabbro and porphyritic granitoids was documented in the Akmeniai intrusion.
The structure of granitoids ranges from massive (e.g., Kabeliai, Kapčiamiestis) to blastomylonitic, suggesting mineral recrystallisation and growth accompanied by tectonic deformation (e.g., Akmeniai intrusion) and strong shearing of the northern periphery of the Žemaičių Naumiestis batholith (mylonites, ultracataclasites).
The fracturing records the protracted tectonic history of the crystalline basement. In the studied drill cores, fracturing rate varies from a few centimeters spacing (e.g., Ž.Naumiestis-4) to a only one fracture was documented in a 152 m drilling interval in borehole Lazdijai-22 (Kapčiamiestis batholith). A similar variation in fracturing rate was recorded in the adjacent Kabeliai batholith (12 boreholes). The west Lithuanian intrusions were subject to stronger tectonic deformations, including local milonitization. The horizontal discing feature is well-recognized in west Lithuanian wells.
Based on petrographical inspection (and geochemical, below), PA-type (post-orogenic) granites were formed shortly after plate subduction and plate collision, while AA-type (anorogenic) granites tend to be associated with lithospheric rifting [55].

5.2. Major Elements

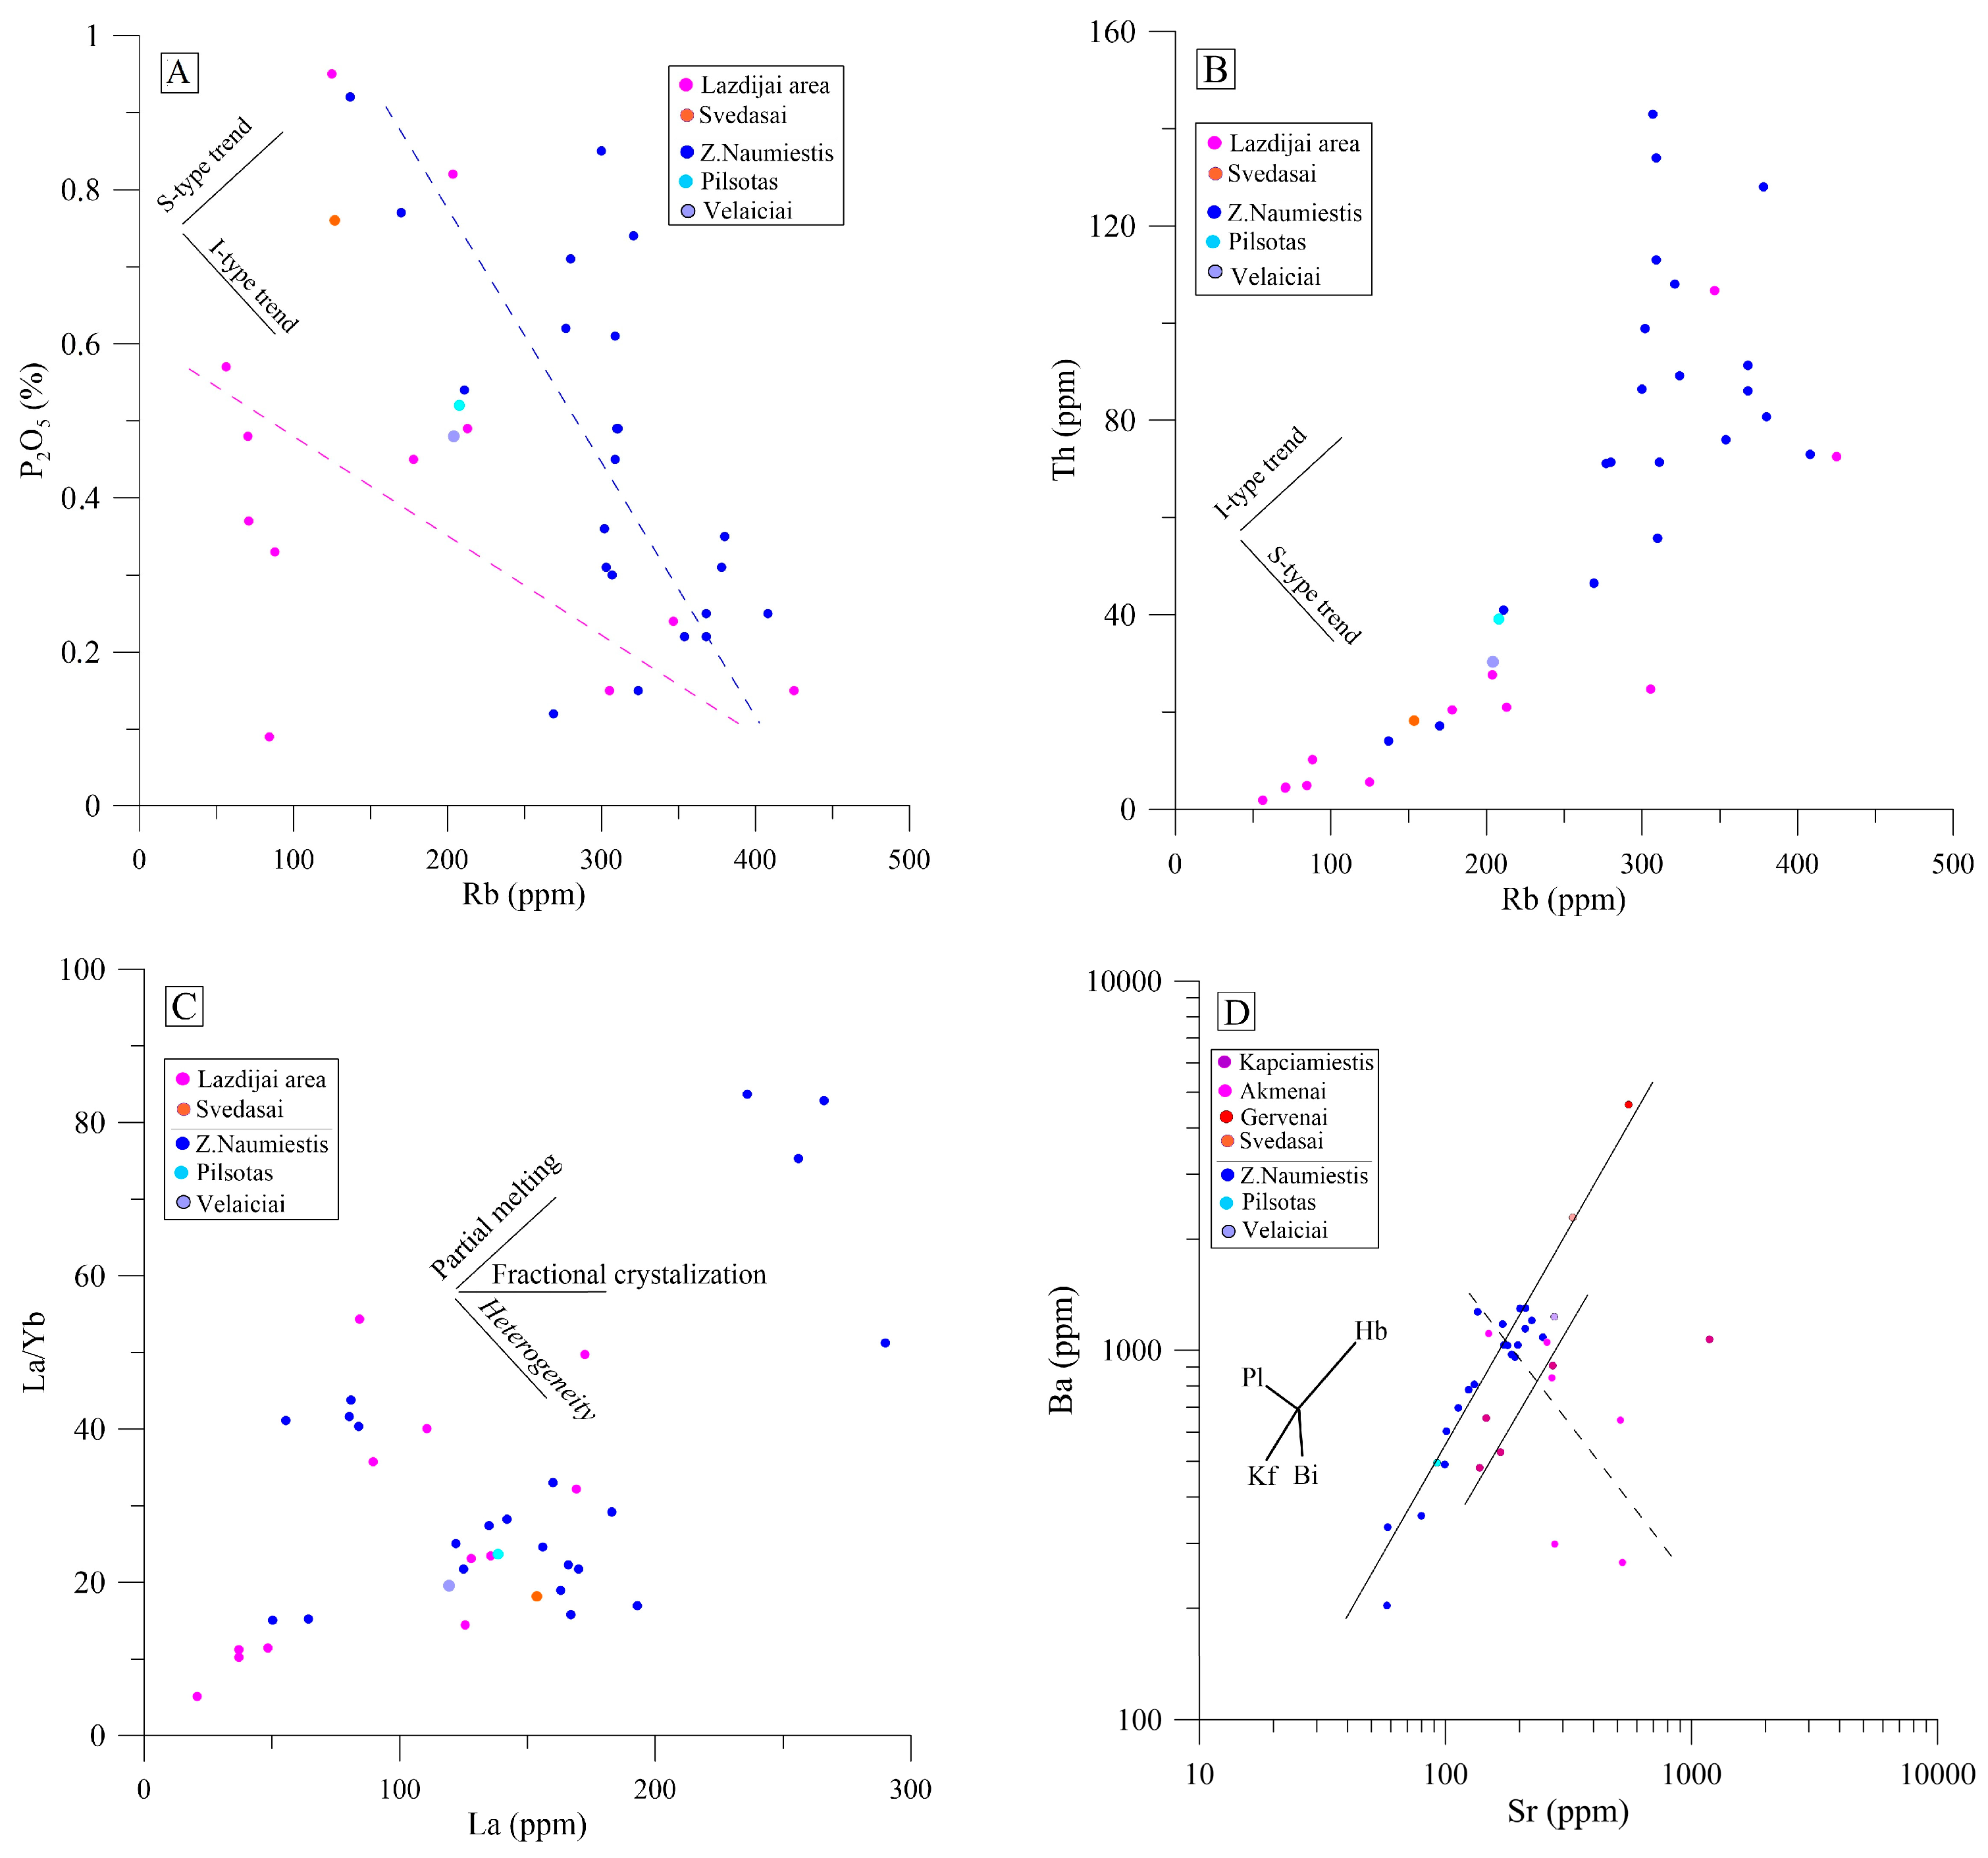
Whole-rock geochemical analyses of major elements of the Mesoproterozoic granitoids are presented in Table 2. The average SiO2 content was estimated at 66.05% in WLD and a lower concentration (60.24%) was documented in LBB. The intrusions are composed of diorites, granodiorites, and granites. Al2O2 content is similar in both crystalline basement domains (ca. 14.52%), while the diorites of eastern Lithuania indicate enrichment to 15.60%. The SiO2 content exhibits a strong positive correlation with Na2O and K2O (the latter having a relatively higher content), while CaO follows a very strong negative trend. The latter trend is very distinct for Fe2O3T. Notably, the iron content shows a rather similar average content (6.59%) in Mesoproterozoic intrusions compared to Palaeoproterozoic granodiorites and granites (6.54%). A similar trend was defined for MgO in Meso- (average 1.74%) and Palaeoproterozoic (average 1.72%) granitoids. Therefore, the ratio of iron and magnesium in the two types of rocks is similar. It implies that the high magnetic signature of Paleorpterozoic granites is accounted to the high magnetic fraction of ferric minerals. The same negative trend was established for TiO2 and P2O5. It is important to note that the phosphorus content (1.10%) shows a higher content (steeper angle trend) in the Mesoproterozoic intrusions compared to the Palaeoproterozoic granitoids (0.82%), which is an essential parameter in decoding the petrological interpretation. Strong positive correlation between K2O/P2O5 vs. SiO2 was illustrated on Mesorpterozoic granitoids (demonstrating continental crust contamination), while no consistent statistical trend was obtained for Palaeorpterozoic granitoids.
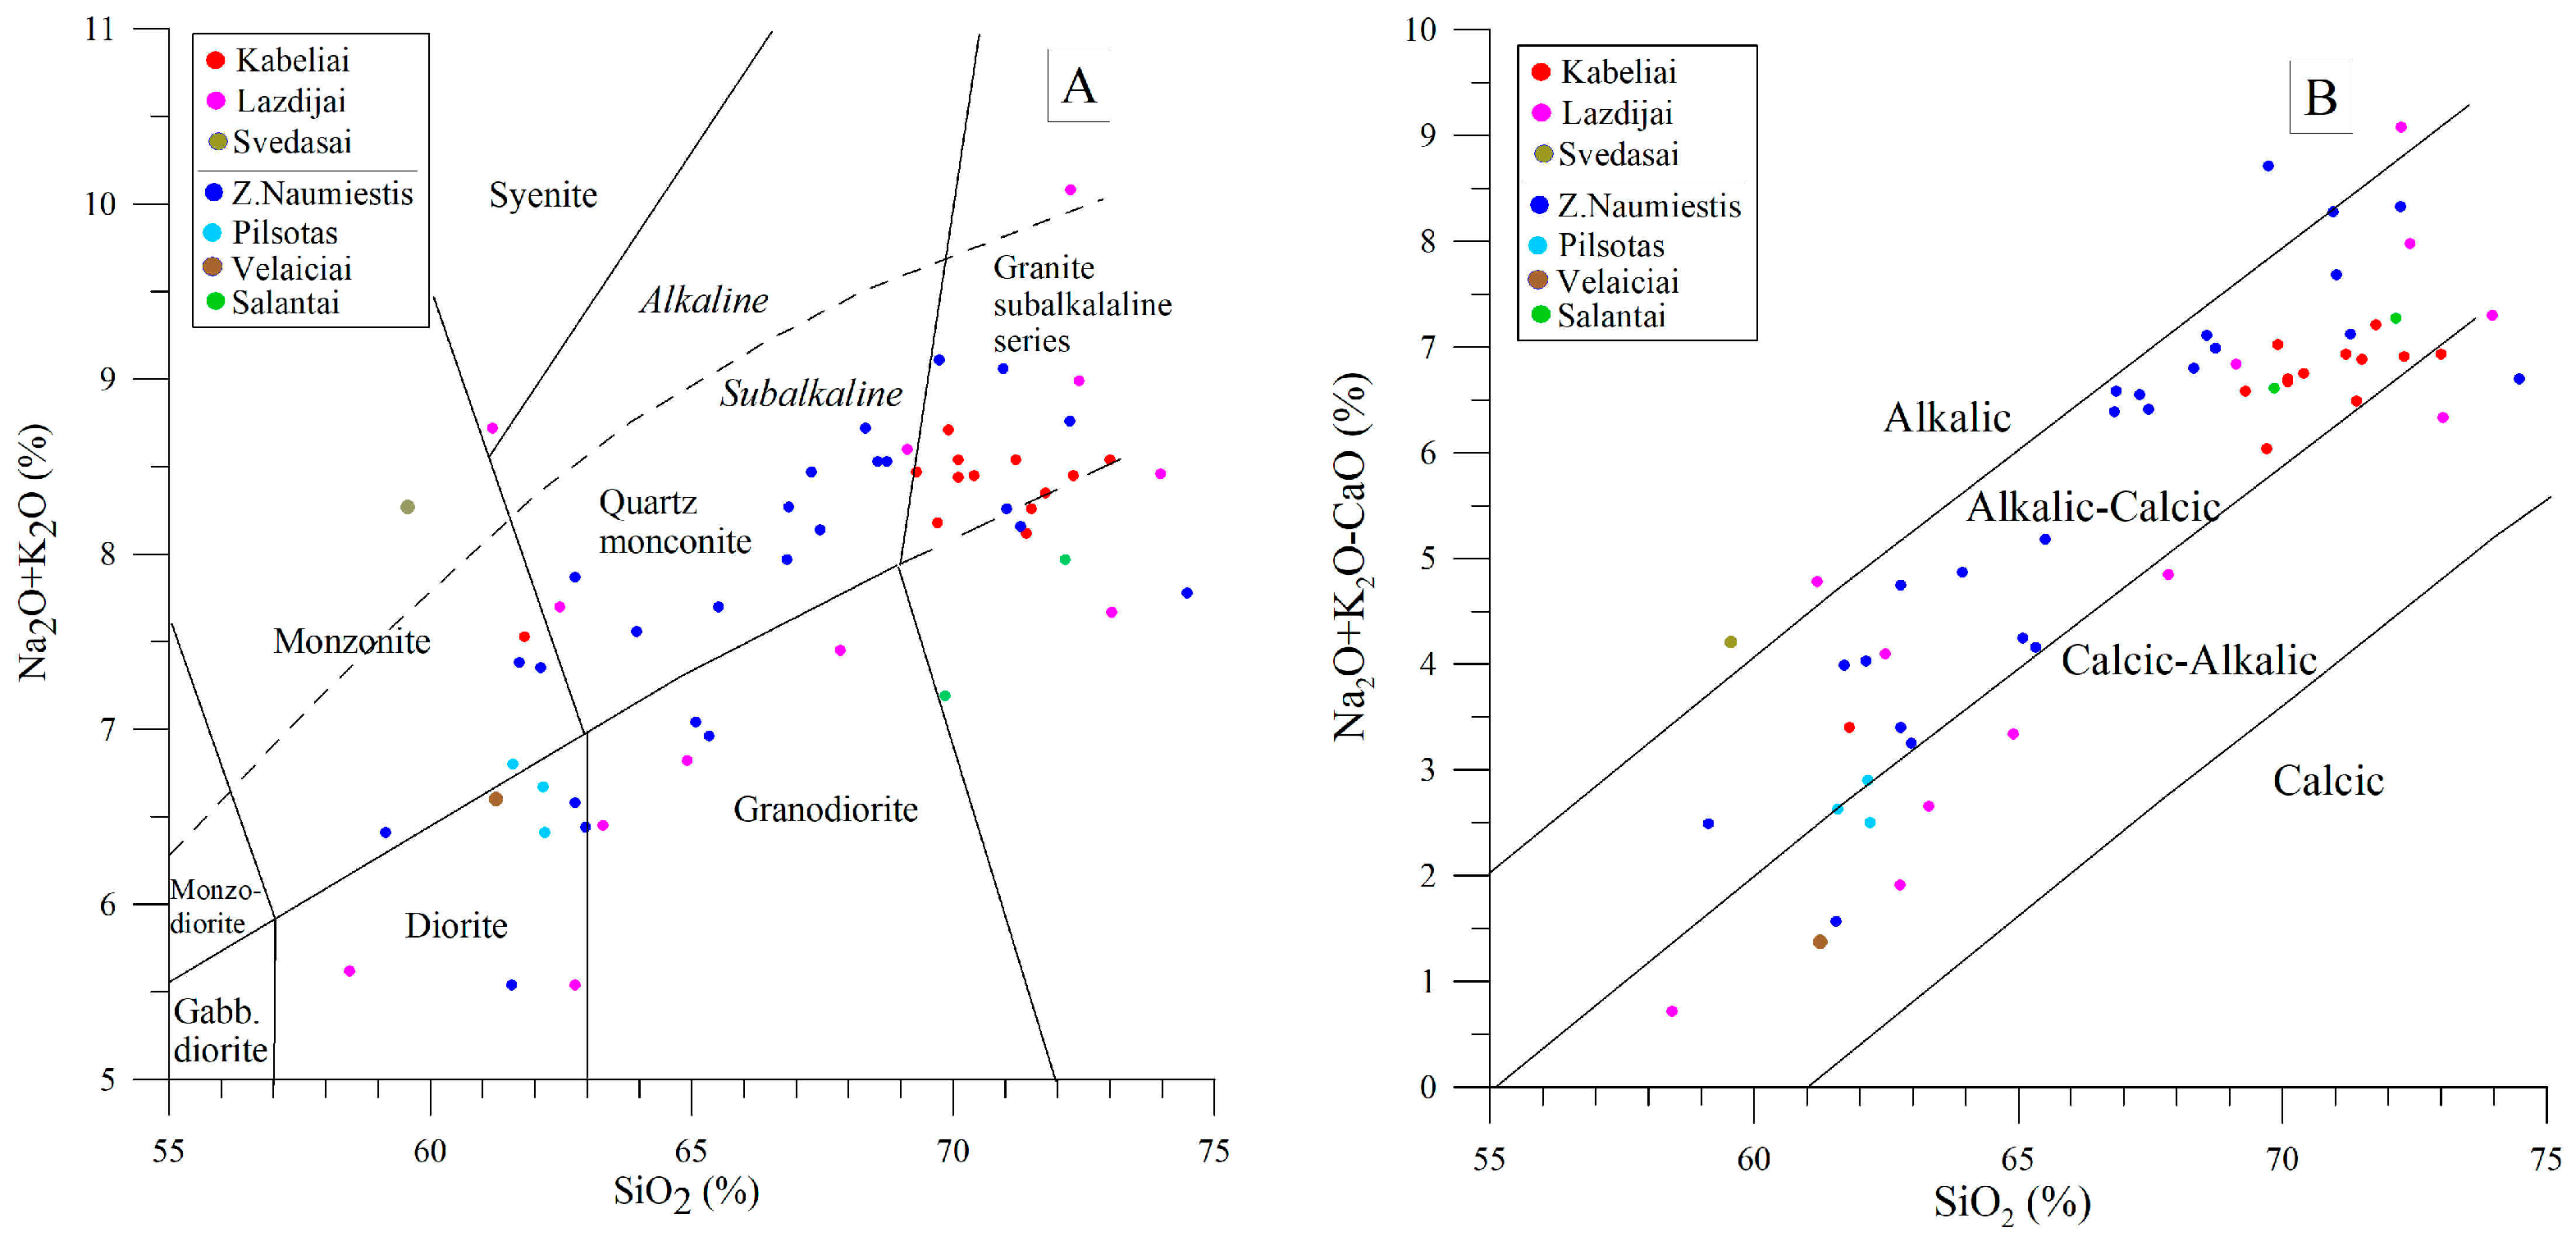
The SiO2 content of the studied Mesoproterozoic granitoids ranges from 58.45 to 74.48% (average 67.36%). On the TAS diagram (Figure 4A), diorites and monzonites, granodiorites and quartz monzonites, and granites compose the intrusions. In particular, monzogranite predominates in the largest intrusions—Žemaičių Naumiestis and Kabeliai batholiths. The highest differentiation of the mineral composition was recorded in the Kapčiamiestis batholith. According to [56], the studied samples are attributed to the subalkaline granitoids, except for a few samples (e.g., Svėdasai-252, Lazdijai-24).
The sum of alkaline elements (Na2O + K2O) increases from 5.54 to 10.08% and positively correlates with SiO2 content (Figure 4B). The alkalic-calcic series predominates in the studied intrusions and the subordinate calcic-alkaline group. It is noted that granitoids of the LBB generally show relatively lower potassium content (ratio K2O/Na2O = 1.1–2.3) compared to the WLD (ratio K2O/Na2O = 2.2–4.3).
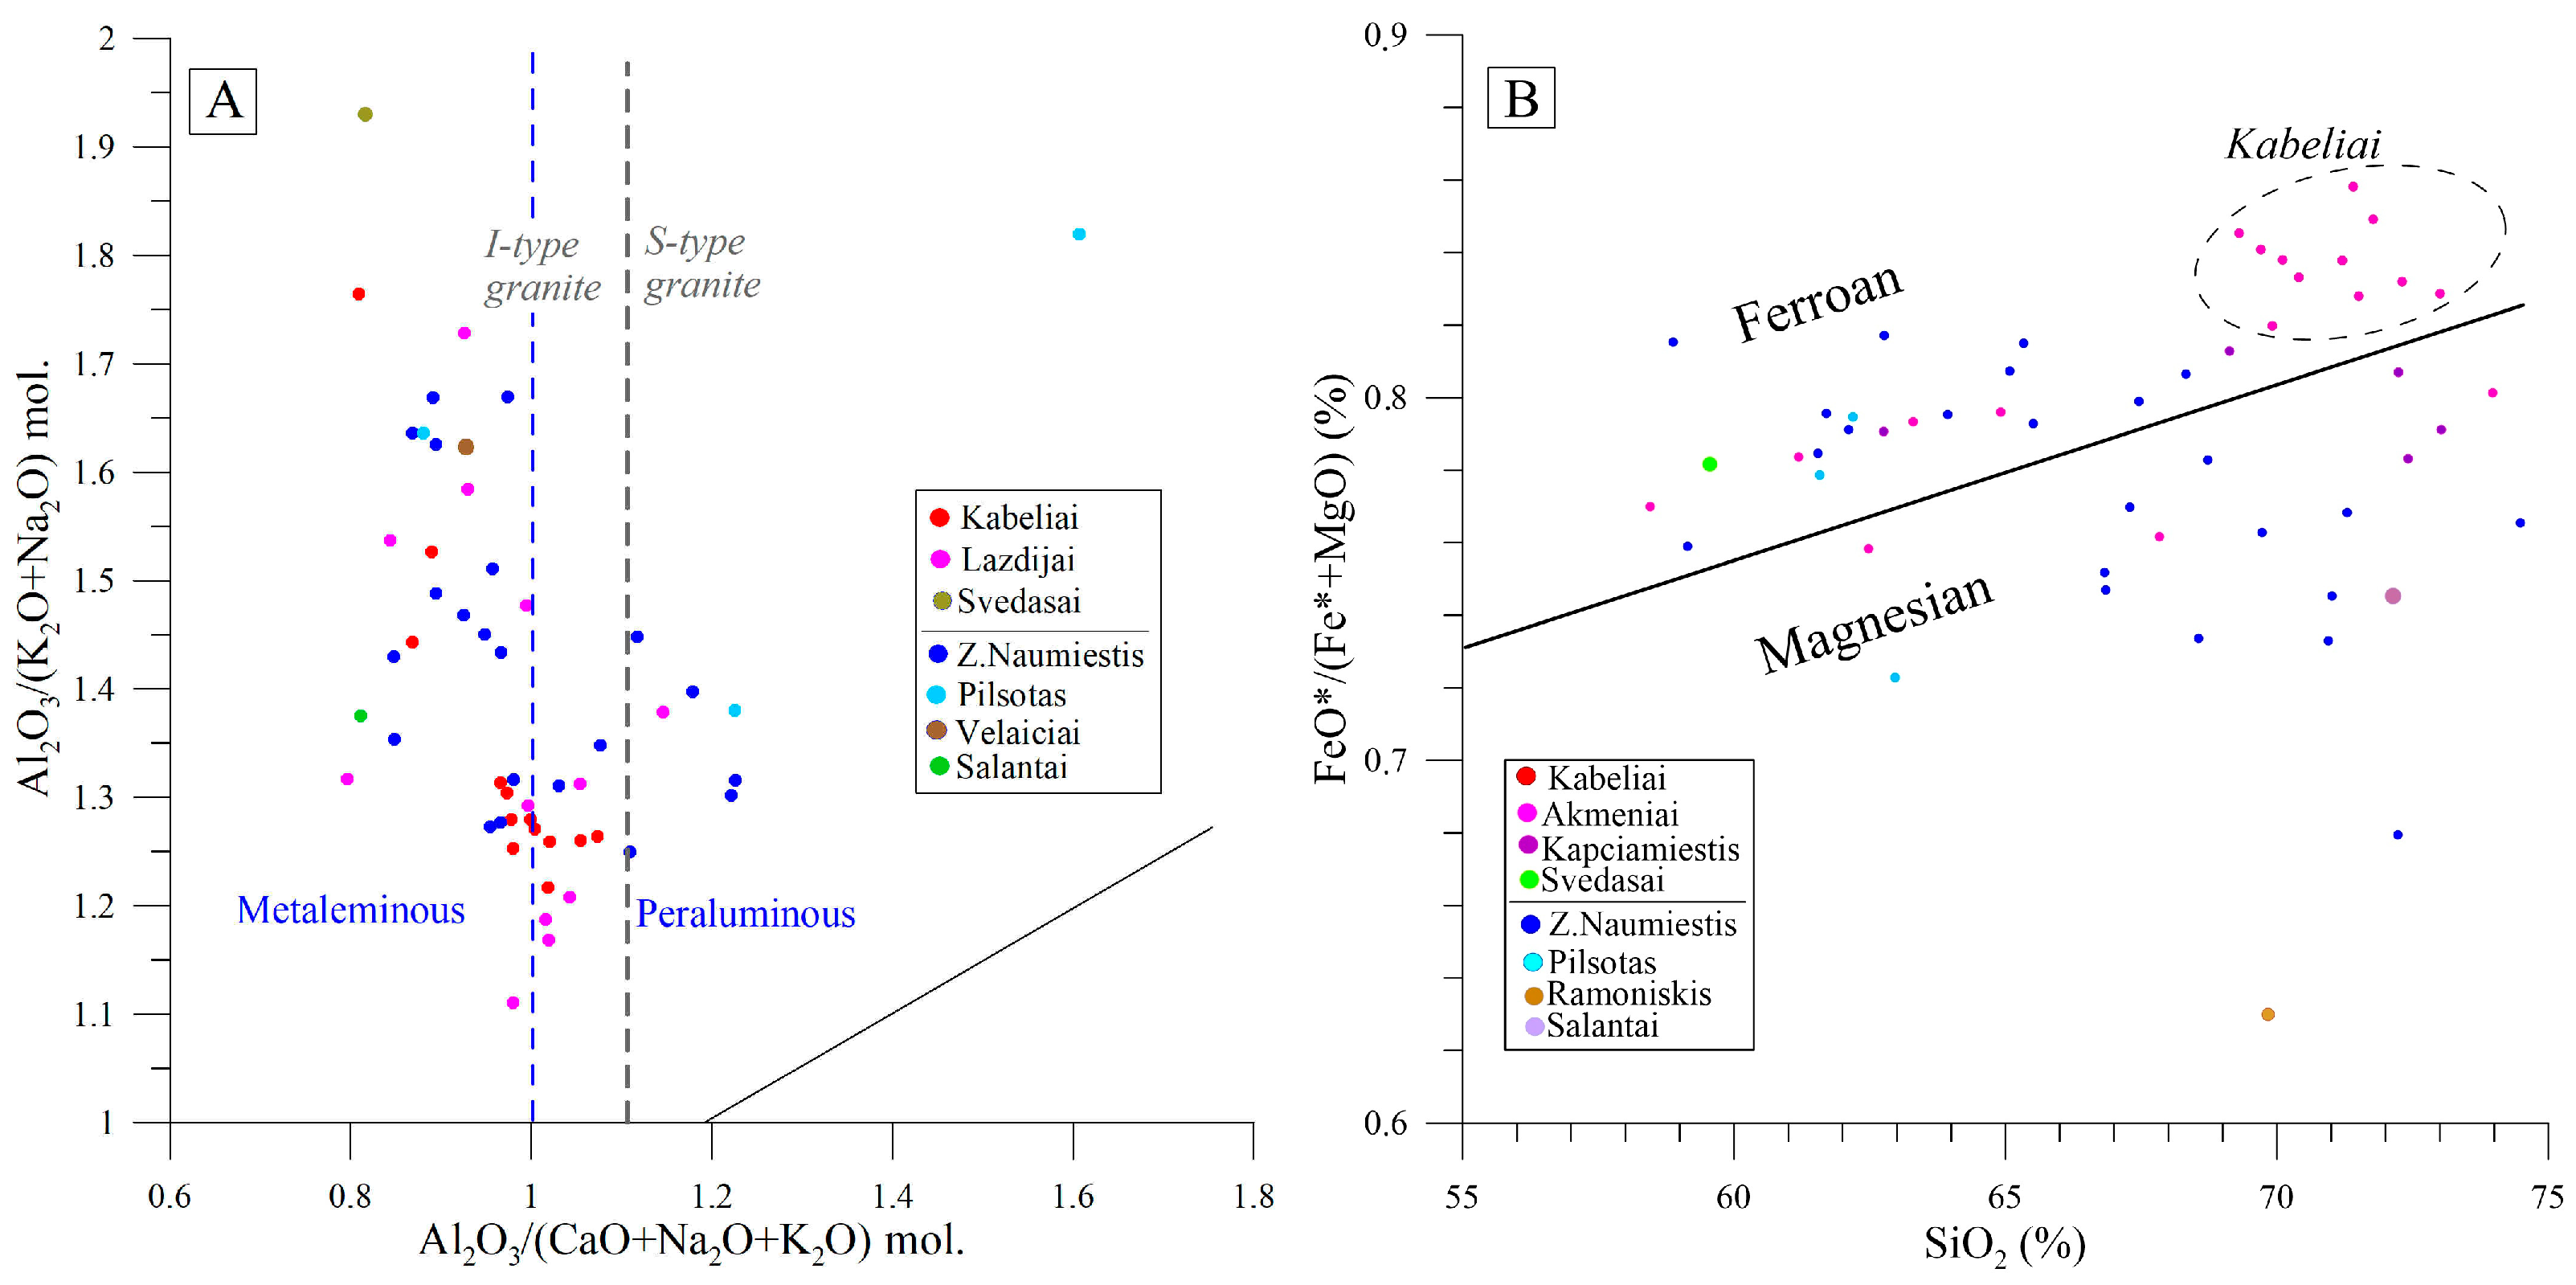
The studied samples are scattered in the meta- and peraluminous fields on the molecular diagram by [59] (Figure 5A). The A/CNK ratio shows a statistically negative trend in the A/NK ratio. It correlates well with I-type granite series identified on the plot, except for several samples collected from west Lithuania.
Based on the collected database, granitoids show a minor difference in the iron and magnesium ratio between the Palaeoproterozoic (0.71) and Mesoproterozoic (0.78, e.g., slightly higher) basement rocks, respectively. The systematic increase in the ratio of FeO* to SiO2 is clearly observed in crystalline basement rocks. The high magnetic susceptibility of the Mesoproterozoic intrusions is an indicative exploration signature. The particular mineral phase is important and causes high magnetic susceptibility. In particular, the magnetic susceptibility is much higher compared to ilmenite [61].
In the FeO*/(FeO* + MgO) vs. SiO2 diagram (Figure 5B), ‘ferroan’ and ‘magnesian’ type series were identified in the Mesoproterozoic granitoids, showing no distinct lateral discrimination. The fractional recrystallization was discernible in the largest Žemaičių Naumiestis batholith; most of granites of the intrusion are attributed to the ‘ferroan’ type, while the ‘magnesian’ type is defined in the southwestern part of the intrusion (syenogranite of Žalgiriai, Šilutė, Barzdėnai boreholes). No discernible difference was recognized in the Kapčiamiestis batholith and Akmeniai intrusion, granitoids of both ‘ferroan’ and ‘magnesian’ series.
The Kabeliai batholith and Pilsotas intrusion are characterized by a high iron vs. magnesium ratio and are attributed to ‘ferroan’ series. In contrast to the batholiths discussed above, the samples of the Kabeliai granites and Pilsotas granodiorites exhibit a narrow variation in chemical and mineralogical composition. There are only two samples collected from the Svėdasai and Salantai ‘magnesian‘ granitoids.

5.3. Trace Elements

The analytical results of trace elements are summarized in Table 3 and Table 4, which show notable differences between the Mesoproterozoic granitoids of WLD and LBB. Generally, the strong positive indicative correlation of Ba and Sr follows the fractional crystallization of granitoids. This relationship is most distinct in WLD intrusions, while the ratio is statistically not consistent in granitoids of LBB and implies a more complex magmatic history in the latter intrusions. Rb/Sr is rather significant, indicating that granitic magma is evolving towards higher SiO2.
Some elements bear important petrological characteristics, including tectonic environment. Specifically, the Zr/Y ratio clearly reveals a calc-alkaline type of the studied granitoids, as discussed below (Figure 4B). The ratio varies from 4.95 to 17.10 (average 8.34) [62].
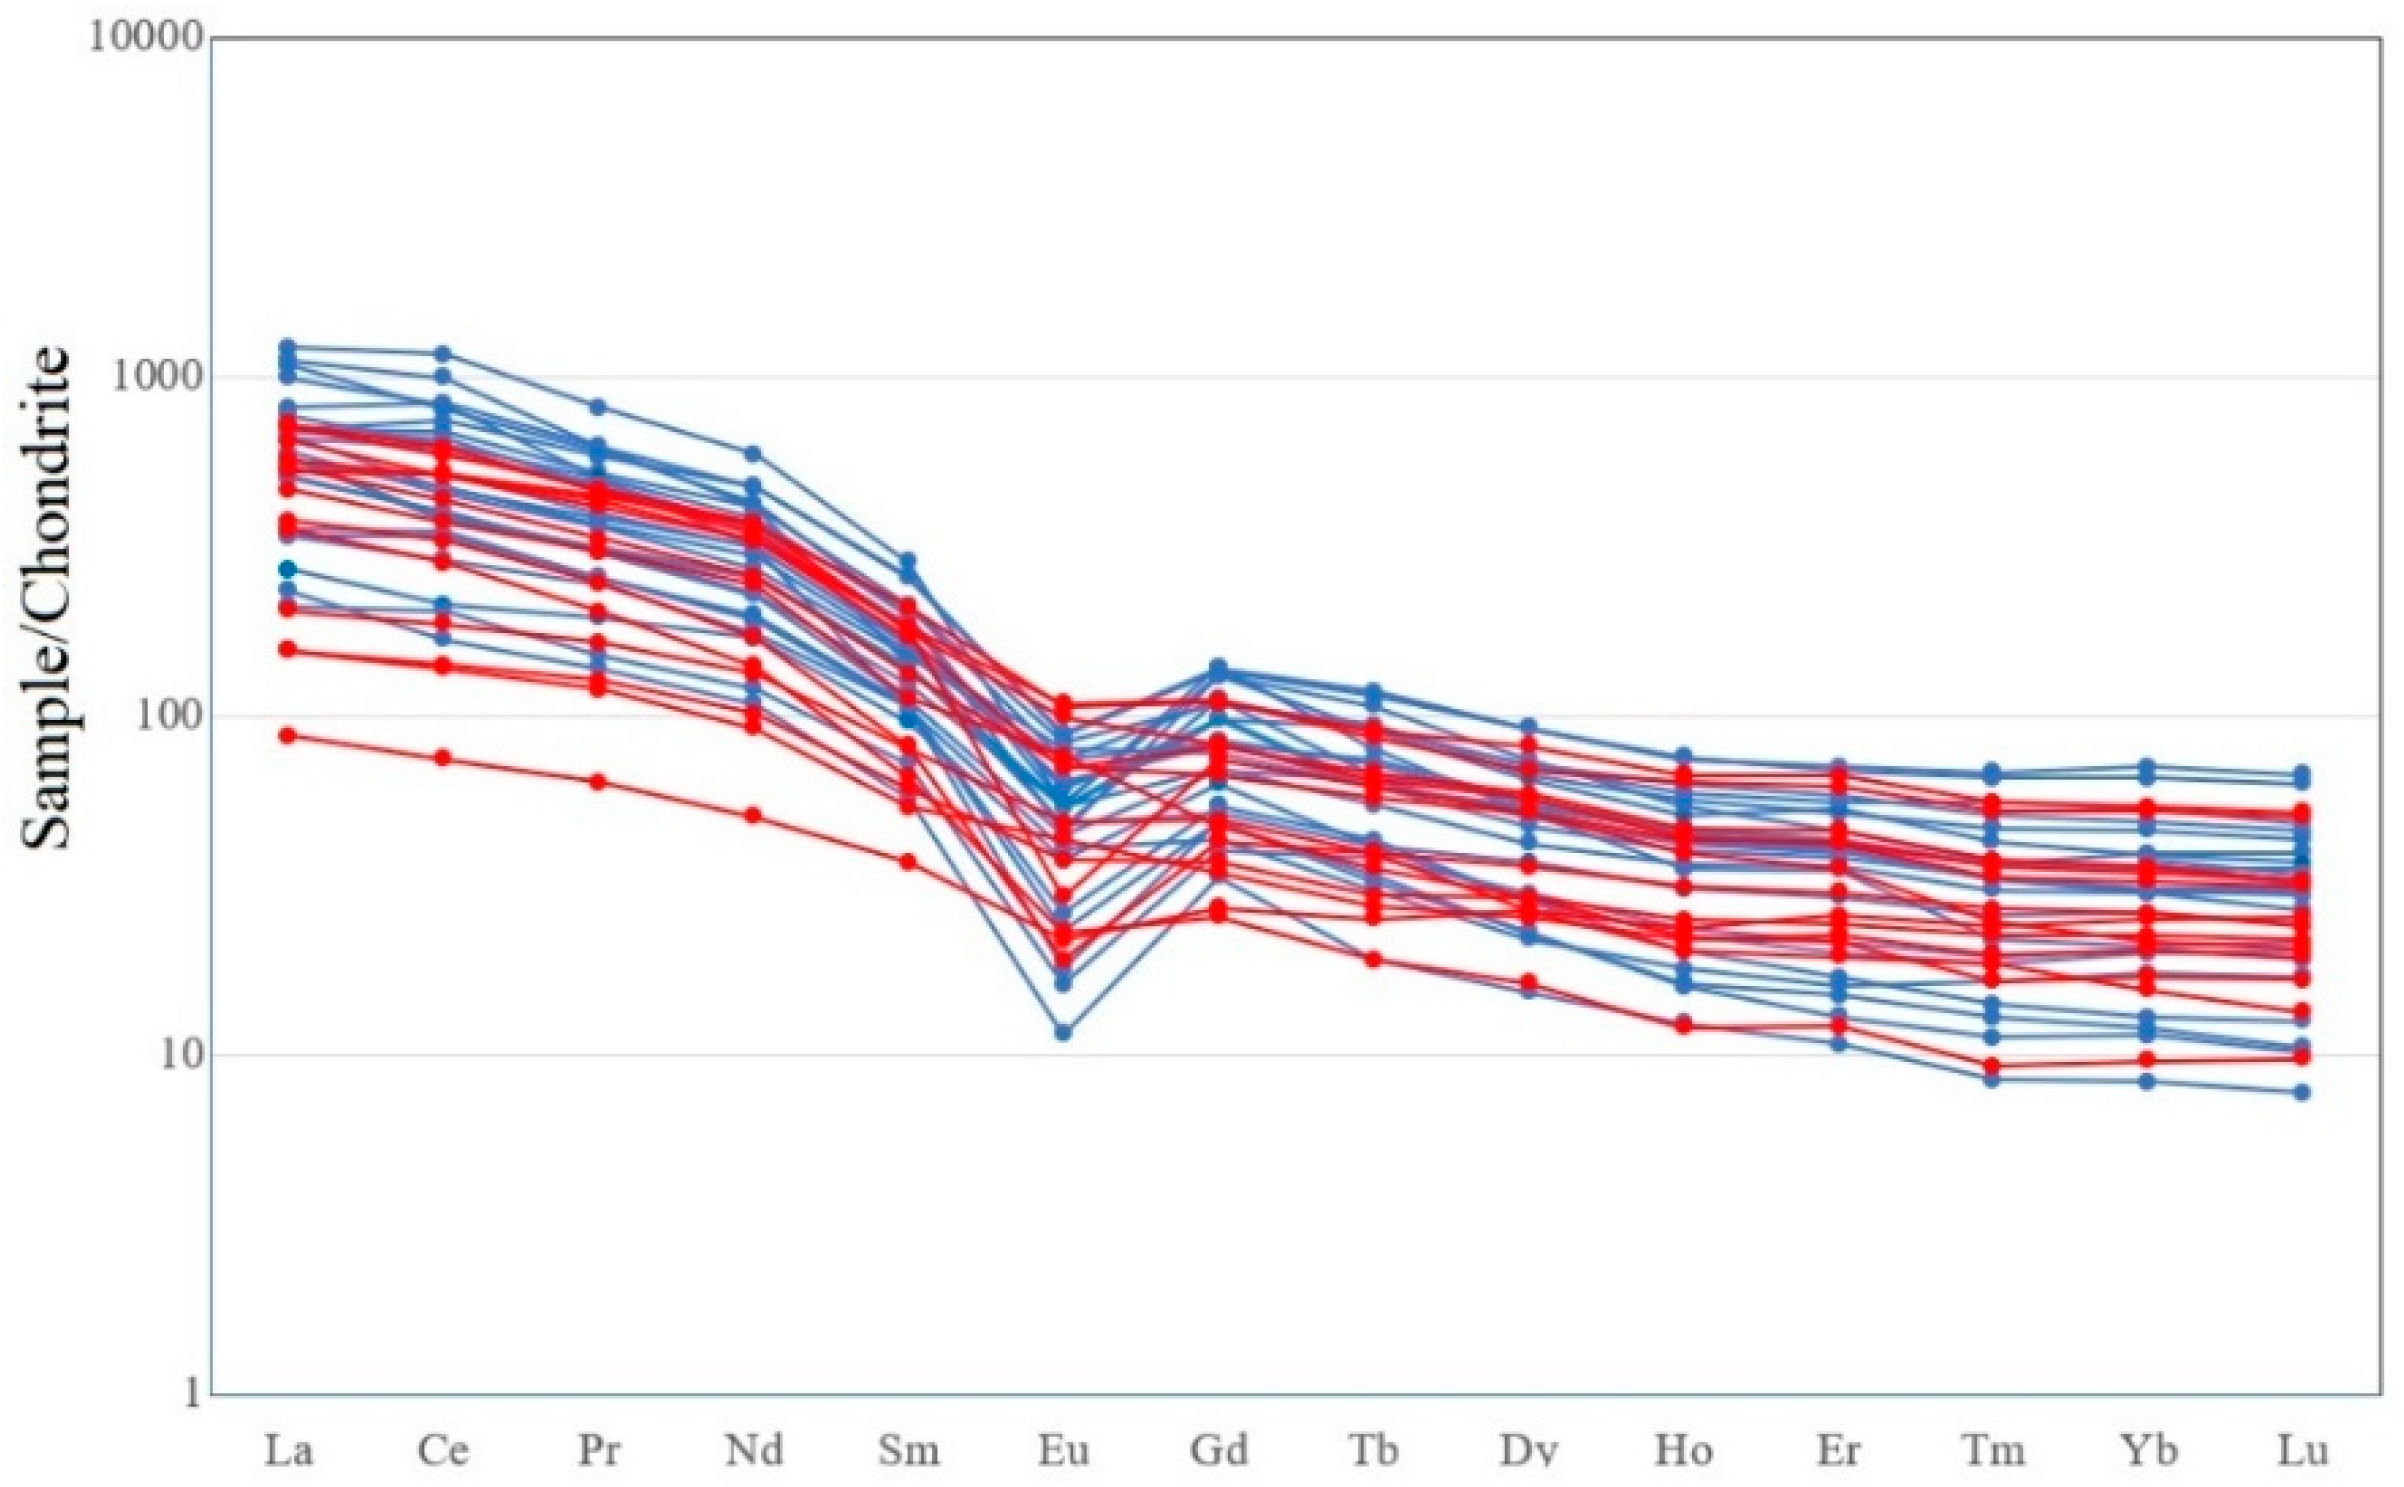
The pattern of REE elements reveals two distinct groups, recognized in WLD and LBB, respectively (Table 4). On the spider diagram, the former cluster shows higher differentiation between LREE and HREE elements; the average ratio LREE/HREE was estimated at 13.9 in west Lithuanian intrusions, while a lower ratio 11.4 was documented in the east (Figure 6). The remarkable difference in the Eu/Eu* anomaly is observed. The strongest anomaly was defined in WLD (ratio < 0.2), while it was much smoother in LBB (ratio > 0.2). In general, the higher LRRR/HREE ratio associates with a generally higher concentration of REE in west Lithuanian intrusions (∑REE = 741.1 ppm), while the average ∑REE = 513.1 ppm content was mapped in east Lithuania. The (La/Yb)N ratio was estimated 23.2 and 17.5 in WLD and LBB, respectively. Furthermore, (La/Yb)N ratio correlates with a strong Eu/Eu* anomaly, which points to the highest magma differentiation in the west Lithuanian granitoids. The lower REE content is related to a basically lower concentration of LREE in LBB intrusions. Locally, the scatter in REE varies from 245.5 ppm (Barzdėnai-1) to 1462.9 ppm (Šilutė-1) in the Žemaičių Naumiestis batholith. Notably, the highest Th concentration 254 ppm, documented in Lithuania, was reported from this latter particular borehole. The second-highest value was measured in Ž.Naumiestis boreholes (1111.9 ppm, 1171.8 ppm). In general, the high REE content associates with high Th concentration, which, vice versa, correlates with the highest heat production of rocks. There is no consistent correlation recognized between REE vs. U concentration.
Intrusions of LBB show the similar correlation of REE content and Th. The highest REE value, 824.7 ppm, was reported in borehole Lazdijai-22 (central part of the Kapčiamiestis batholith) and correlates with the highest Th concentration, 106.7 ppm, while the lowest REE content correlates (209.01 and 286.08 ppm) with the lowest Th = 1.8 and 4.3 ppm concentration (well Lazdijai-2, Akmeniai intrusion, see Figure 3).

5.4. Heat Production

At the global scale, the statistical analysis of GRANITE2017 on bulk heat production in granitic rocks of all ages was assessed at approximately 2.0 μW/m3 [64]. In particular, the global average heat production of the Early Proterozoic granitic rocks is relatively low, at 1.25 ± 0.83 μW/m3, while a remarkable peak in heat production 4.36 ± 2.17 μW/m3 was defined for the Mesoproterozoic granitoids. For the sake of comparison, the average heat production of the Mesoproterozoic granitoids was determined 7.26 μW/m3 in Lithuania, while the heat production of the Palaeoproterozoic rocks was documented at 1.28 μW/m3 in east Lithuania and somewhat higher at 1.76 μW/m3 in west Lithuania (Figure 7; age not discriminated).
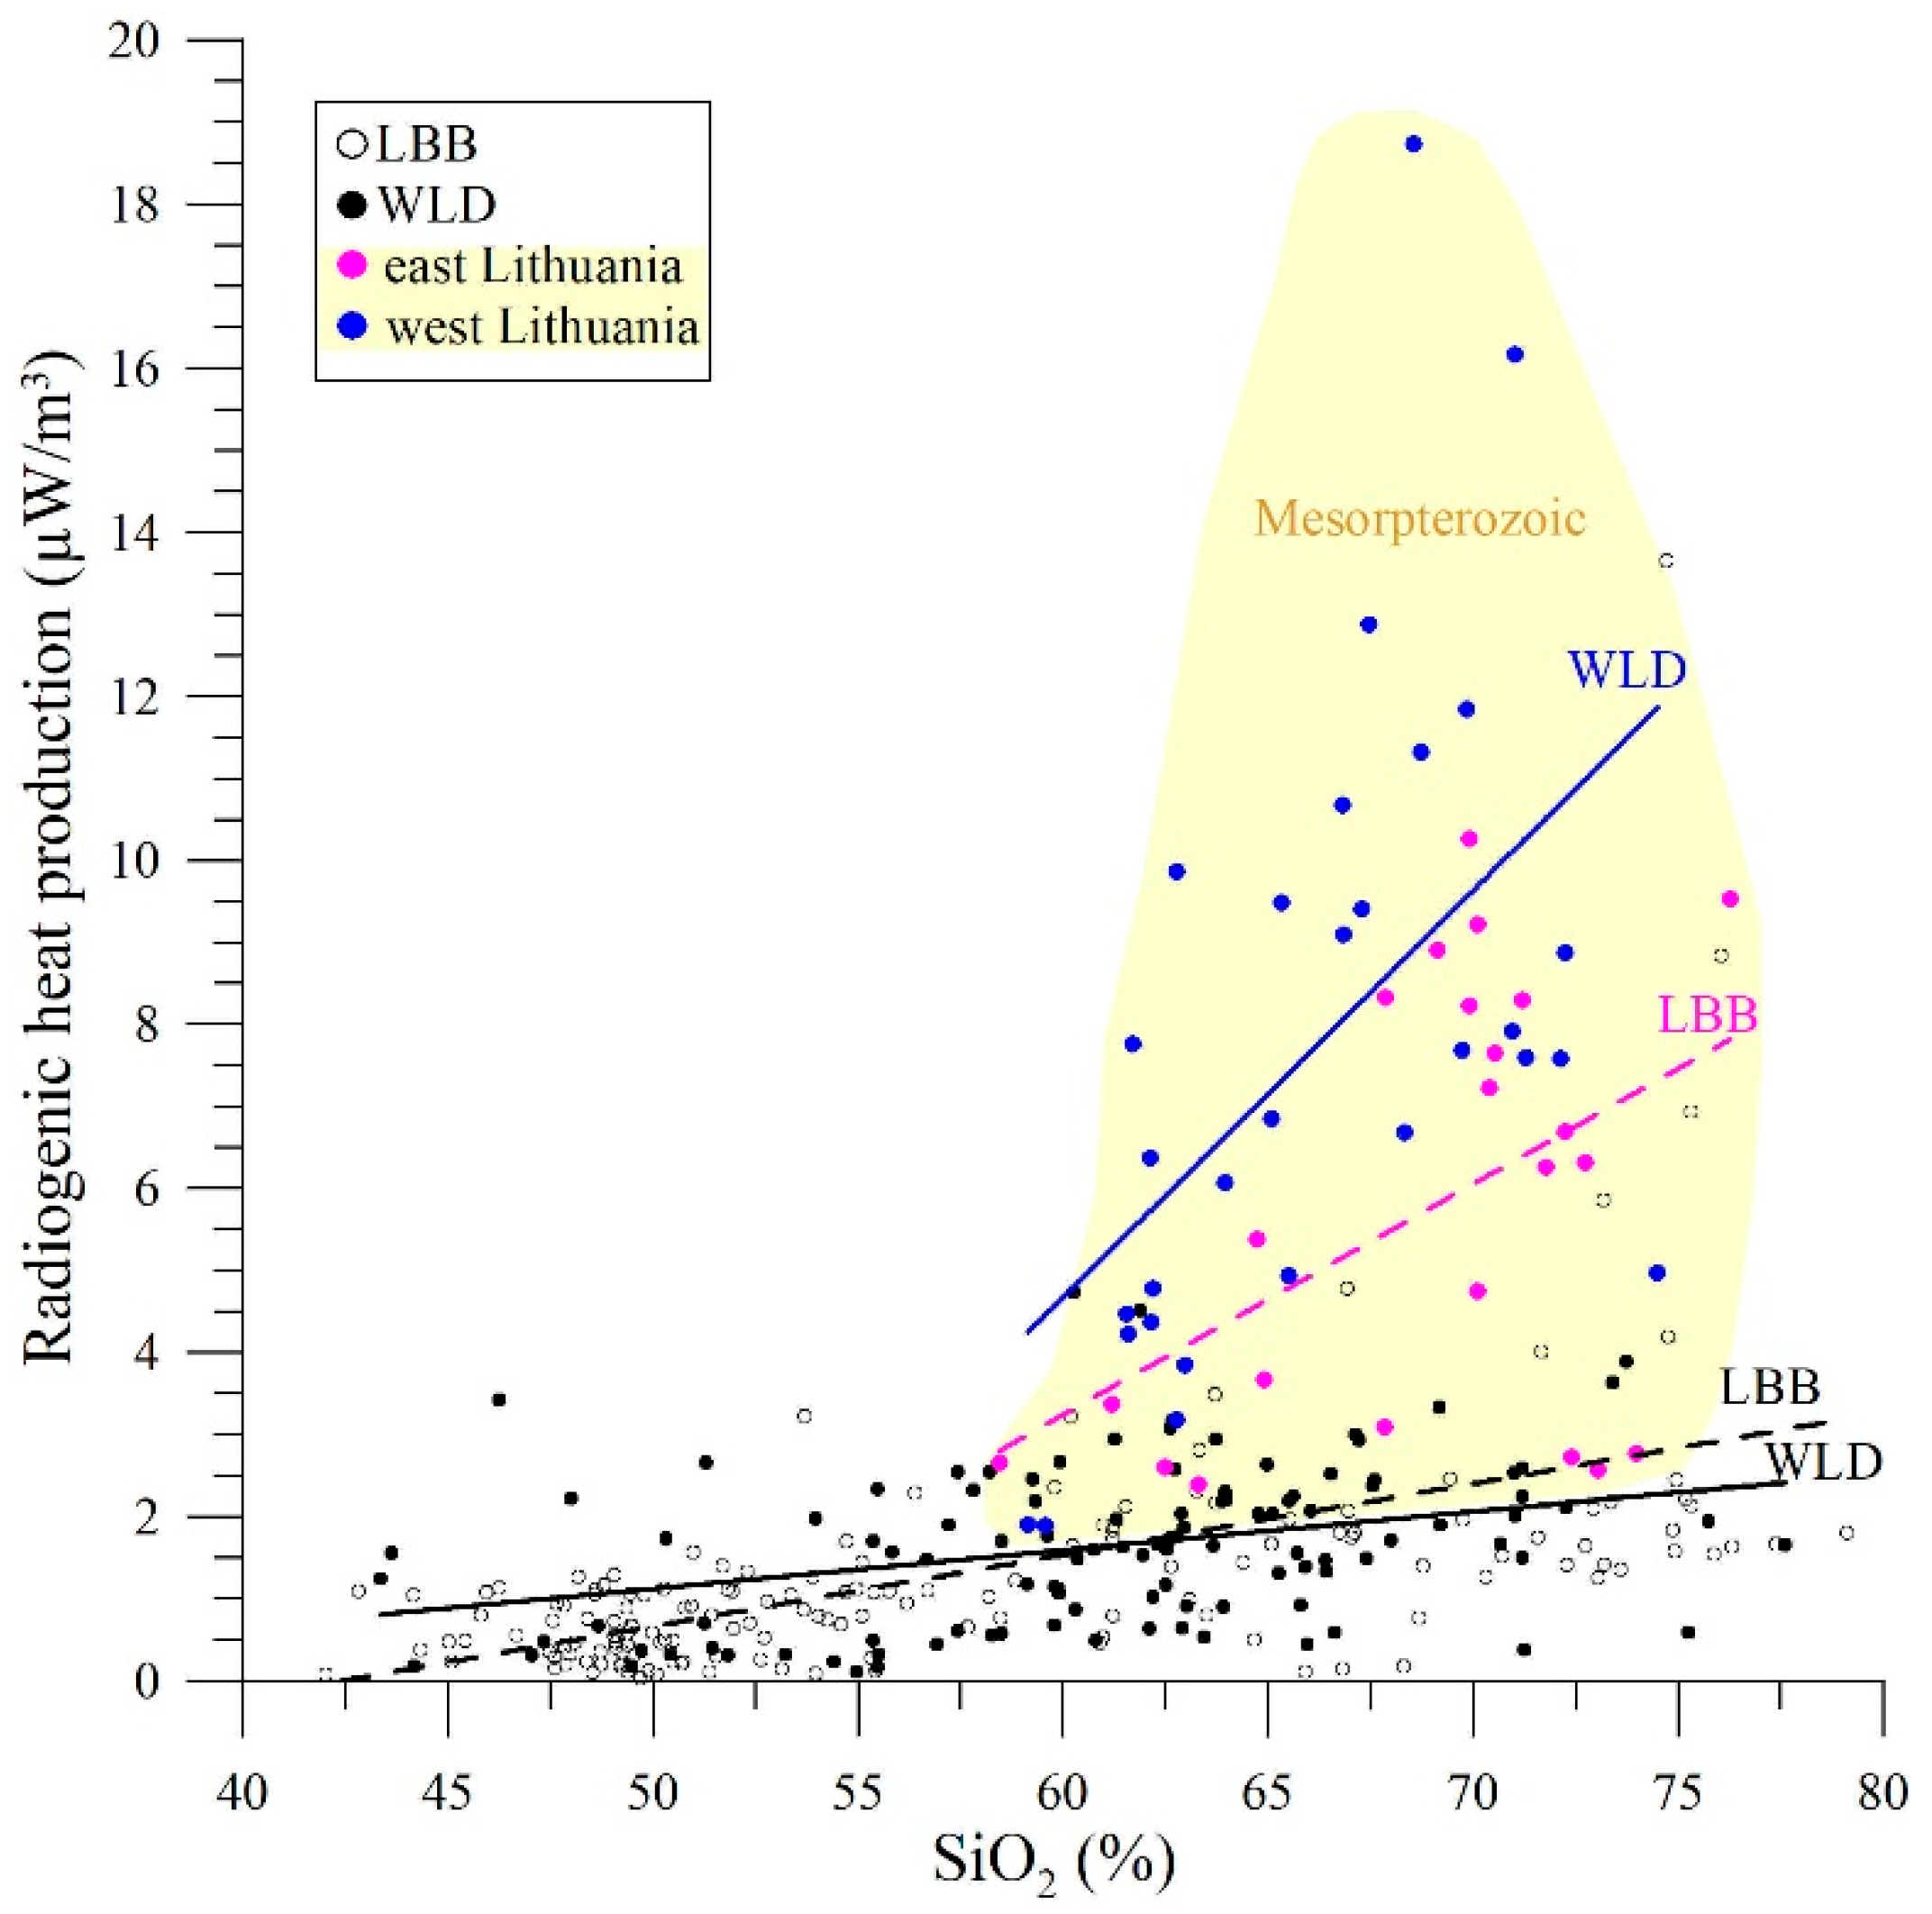
The radiogenic heat production of the studied Palaeoproterozoic rocks, ranging from mafic to granites, as calculated applying [Equation (1)], shows a general positive correlation with SiO2 (Figure 8). Two trends of the Palaeorpterozoic rocks show slightly higher differentiation of heat production vs. SO2 defined in LBB and WLD. The Mesoproterozoic granitoids exhibit anomalous high heat production, with no correlation observed between heat production and SiO2 content. The highest values were measured in the Kapčiamiestis batholith.
The values range from 2.8 to 18.2 µW/m3 for Mesoproterozoic granitoids (Figure 8). The heat production correlates with increasing SiO2 content. A similar correlation trend was defined in the WLD and LBB blocks. However, the heat generation is shifted for about 2.0–3.5 µW/m3 in the western Lithuanian intrusions compared to east Lithuania. The average heat production was estimated at 7.76 µW/m3 for west Lithuanian intrusions and 5.54 µW/m3 in east Lithuania. It is notable that regional-scale variations in heat generation strongly correlate with REE abundance (as stressed in the previous sub-chapter), which, in turn, associates with Th variations, while variation in uranium content is more complex.
The concentration of the radiogenic elements U, Th, and K2O in the Mesoproterozoic granitoids is significantly higher compared to the Palaeoproterozoic felsic rocks (Figure 9A). The average concentration of K2O was defined as 7.2% [Equation (1)] (measured concentration 5.6 vol.%), uranium at 18.5% (measured 6.3 ppm), and thorium at 60.5% (measured 72.1 ppm). The latter element contributes to the highest radiogenic heat production of Mesoproterozoic granitoids.
The high heat production correlates with increased potassium content (Figure 10A). Furthermore, samples are distributed in the shoshonitic suite on the K2O vs. SiO2 diagram (Figure 9B) [65] and account for the high fractional crystallization of parental magmas [66]. In general, the granitoids of LBB show a lower concentration of potassium (at about 1.5%) compared to WLD intrusions.
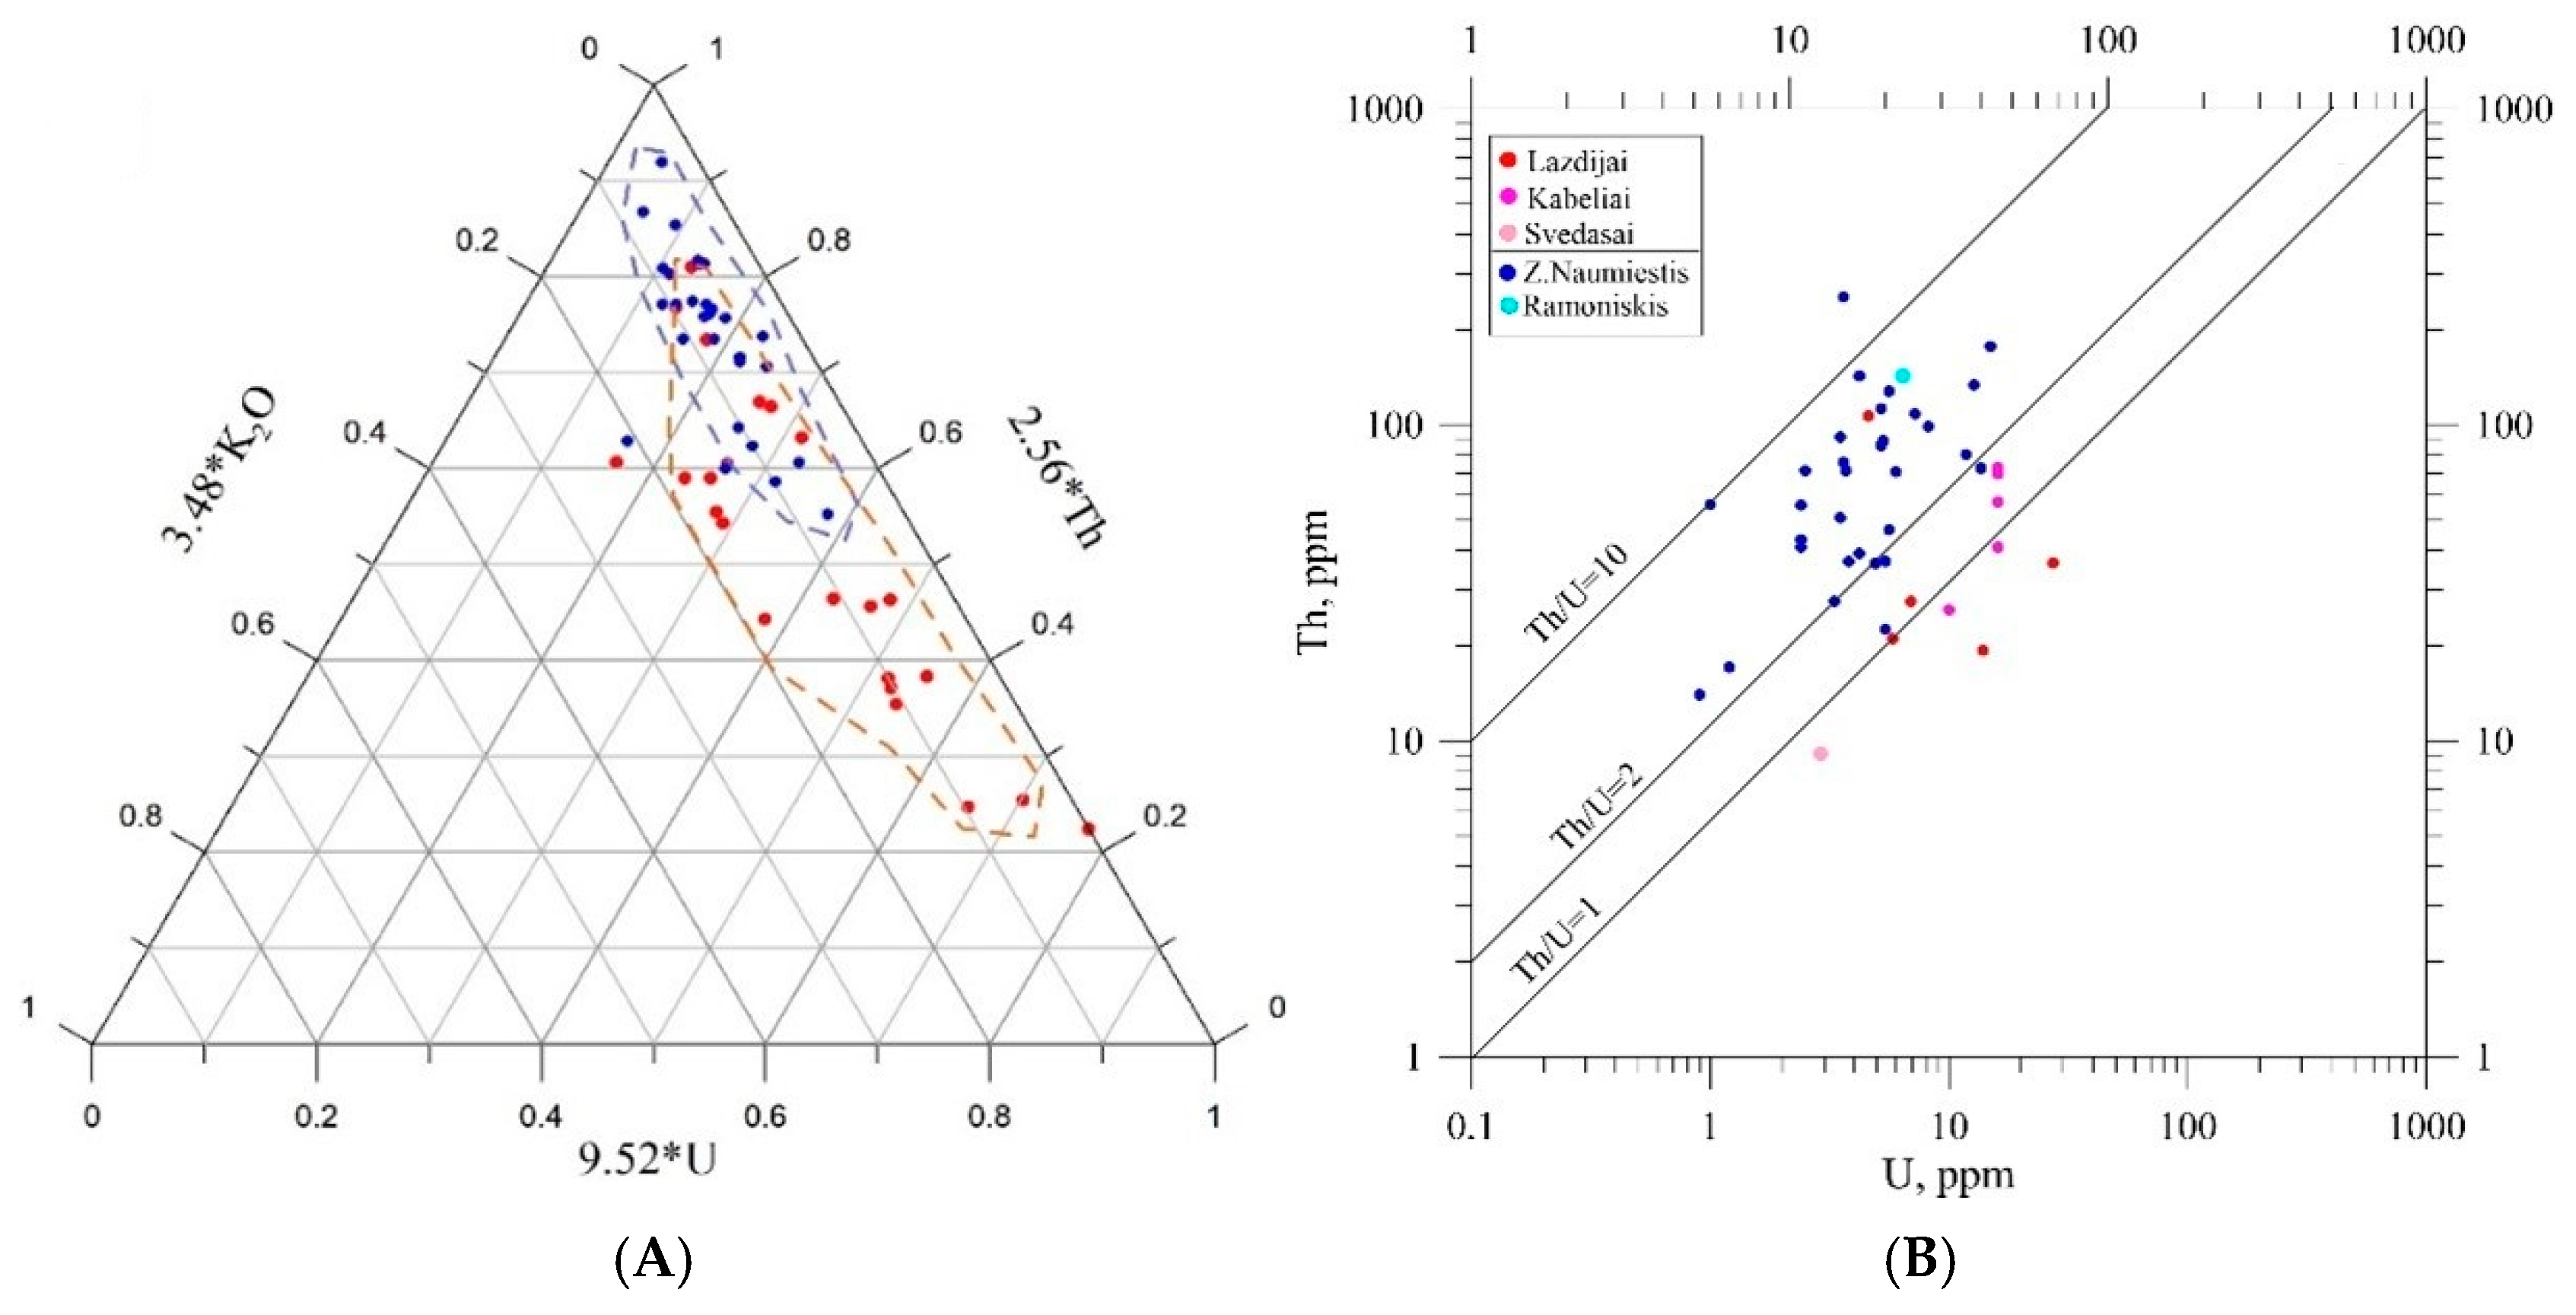
Despite differences between Palaeoproterozoic rocks and Mesoproterozoic granitoids, the two regional trends show relative enrichment in uranium–thorium in LBB, while Th is the most enriched radiogenic element in WLD rocks (Figure 9C,D).
The ternary diagram shows enrichment in Th in WLD, while both uranium and thorium contribute to the majority of the generation (Figure 10A). Furthermore, the ternary diagram indicates a higher content of potassium in the western part, as noticed above. The Th/U ratio of 1.8 divides higher and lower enriched thorium granitoids in western and eastern Lithuania, respectively (Figure 11B). The U/Th ratio has also proven helpful in recognizing ‘geochemical facies’ [67]. In particular, the uranium vs. thorium ratio is a useful proxy indicating relatively oxidizing (e.g., WLD) or reducing (e.g., LBB) conditions, respectively. The Mesoproterozoic samples plotted on the U vs. Th show a clear positive magmatic trend with no hydrothermal anomalies [68].

5.5. Petrophysical and Mapping Signatures of “Hot” Granitoids

Gravity and aeromagnetic mapping was carried out at a scale of 1:200,000 for the entire Lithuanian territory between 1951 and 1962. Based on these data, the digital Bouguer reduction gravimetric map (contour line 2 mGal, reference density 2.30 g/cm3 and 2.67 g/cm3) and magnetic field map (contour lines 100 nT) were compiled in the Lithuanian Geological Survey [69]. On the magnetic map, LBB is characterized by the lenticular NNE-SSW trend of anomalies, mirroring the thick-skinned thrust sheet tectonic grain at a wavelength of 10–30 km and correlating with deep long-wave gravity anomalies (Figure 11). In contrast, WLD is portrayed by an isomorphic pattern of anomalies. Based on the Grodno-Starobin DSS profile crossing LBB close to the Belarus–Lithuanian state border [70], the thrust sheets are inclined to the WNW, which is congruent with the westward overriding of LBB plate below WLD [70].
The density and magnetic susceptibility of the crystalline basement are crucial in interpreting potential field anomalies. The average density of the Palaeoproterozoic crystalline basement rocks was measured at 2762 kg/m3 and 2746 kg/m3 in the LBB and WLD, respectively, and the difference is negligible.
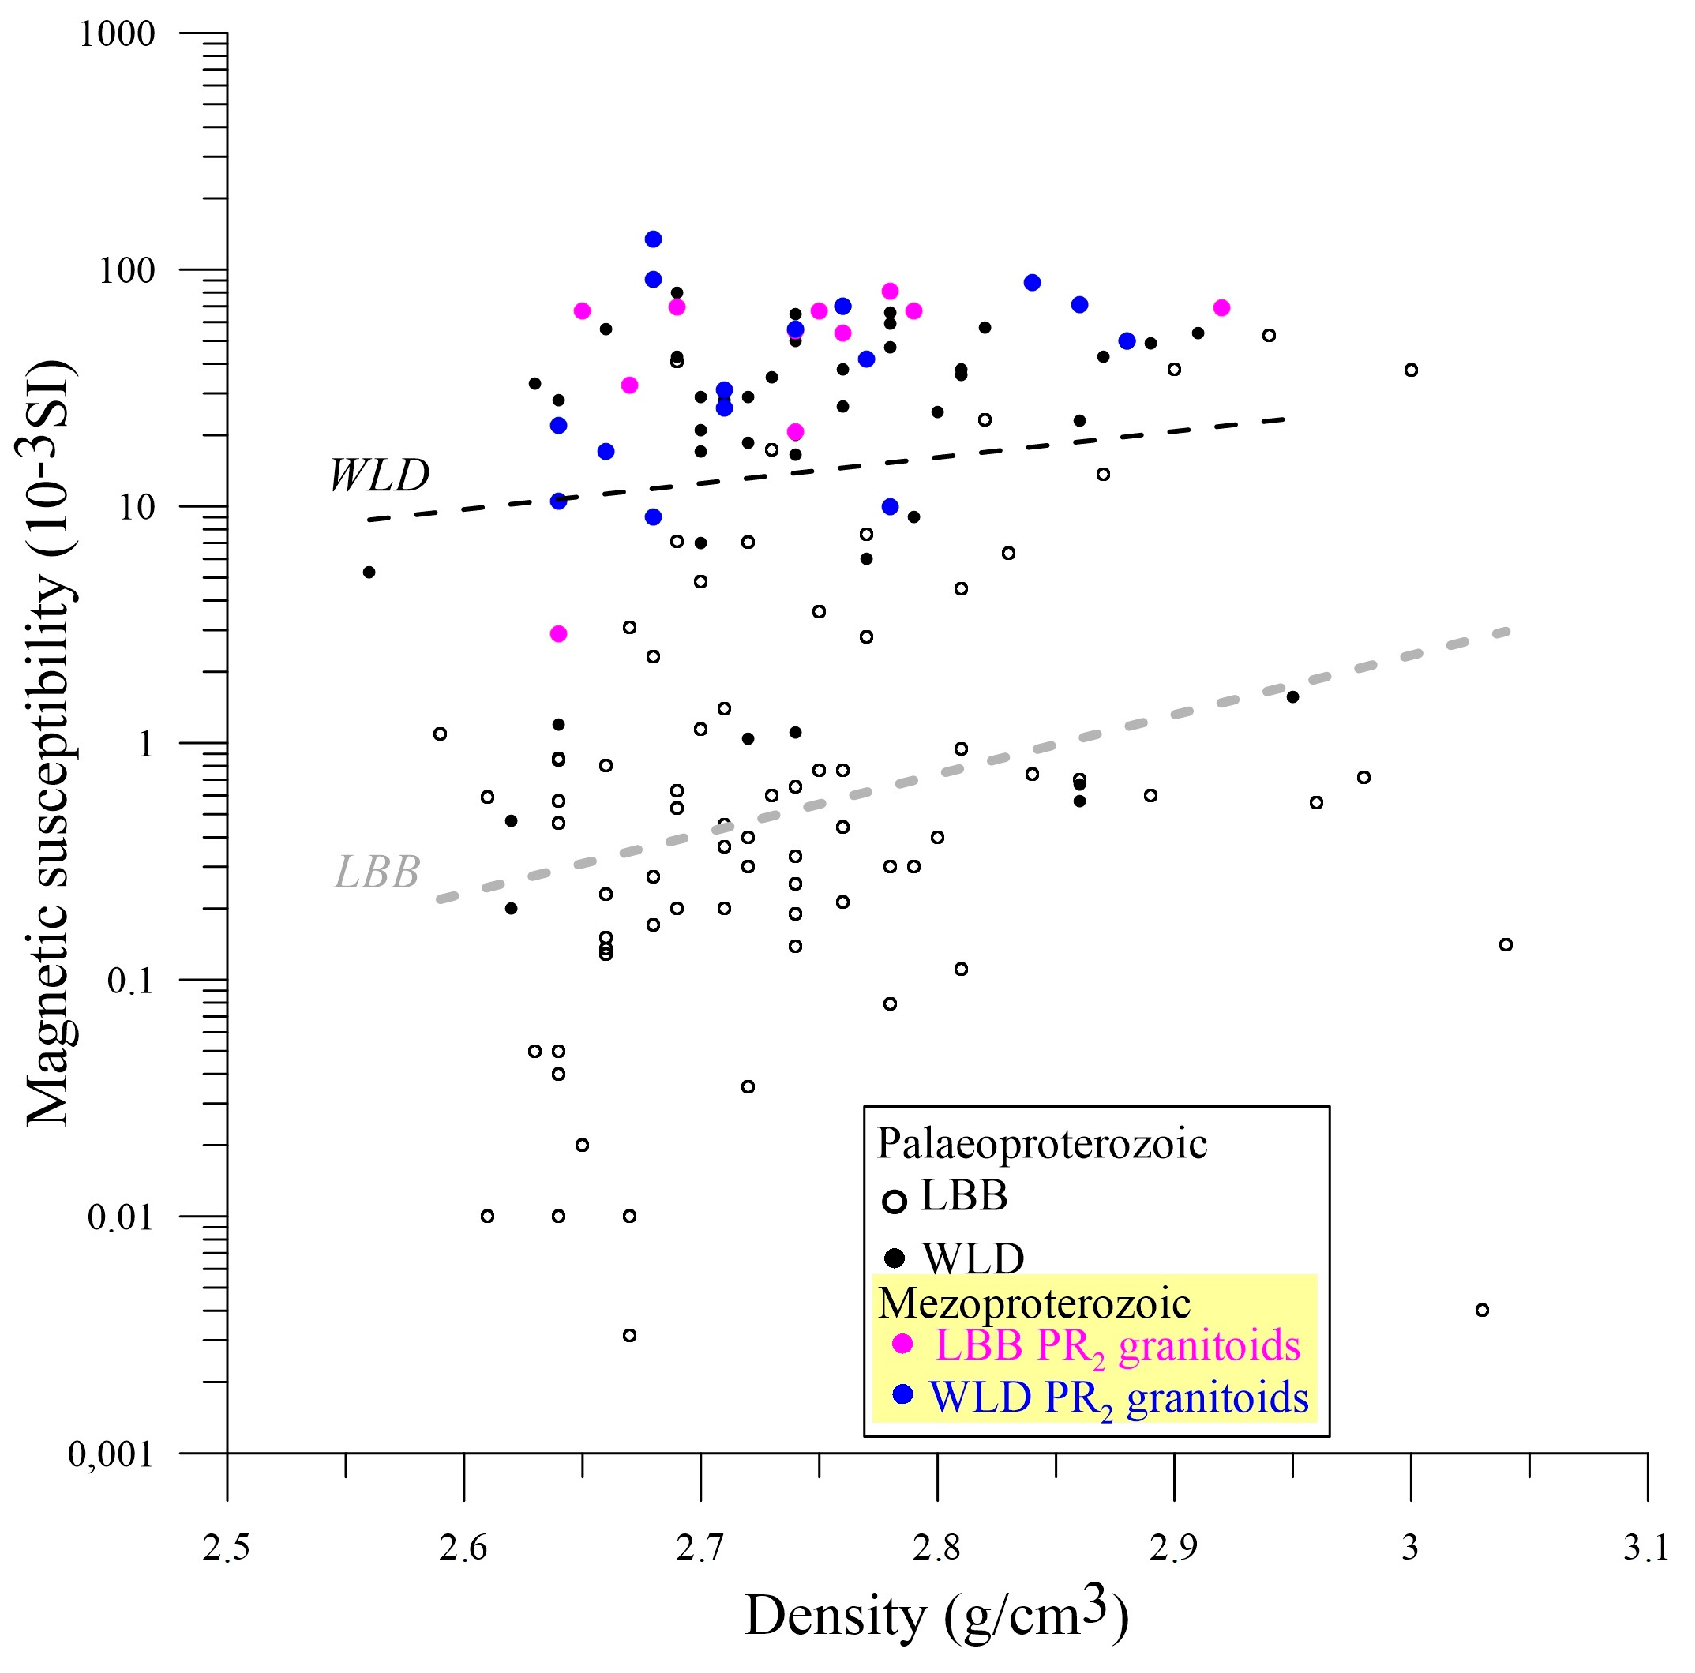
By contrast, the remarkable difference was defined for magnetic susceptibility in Palaeoproterozoic rocks at 14.12 × 10⁻³ SI in WLD and significantly decreased to 0.96 × 10⁻³ SI in LBB (excluding Varėna Iron Ore Deposit) (Figure 12). The positive trends (density vs. magnetic susceptibility) were calculated for the two data clusters, while average values differ by one order.
The Mesoproterozoic granitoids show anomalous high magnetic susceptibility (Figure 13). The average volume was documented 53 × 10−3 SI in both domains defined in Lithuania. The average density of Mesoproterozoic intrusions shows only a miserable difference of 2729 kg/m3 and 2741 kg/m3 for intrusions situated in LBB and WLD, respectively.

6. Discussion

6.1. Petrologic Interpretation of the Mesoproterozoic Granitoids

The deep drilling was primarily focused on oil exploration in western and central Lithuania, while geological mapping and drilling were carried out in southeastern Lithuania. The Mesoproterozoic intrusions were first dated only in the mid-nineties [40].
Thirteen intrusions of the Mesoproterozoic age were identified owing to specific gravity and magnetic field signatures in Lithuania. The composition of intrusions ranges from diorites, granodiorites, and granites. They are attributed to the sub-alkaline series and plots in the meta- and peraluminous fields of major chemical elements (Figure 4B and Figure 5A).
The nature of the Mesoproterozoic granitoids was alternatively considered as the post-orogenic or anorogenic magmatic rocks in Lithuania [46,47]. Globally, A-type granites were first defined by [71] and gained significant economic importance since [72]. Many authors associate the origin of A-type granites with crustal anatexis promoted by magmatic underplating [73,74]. Alternatively, ref. [75,76] suggested that some A-type granitoids were derived directly from a mantle source.
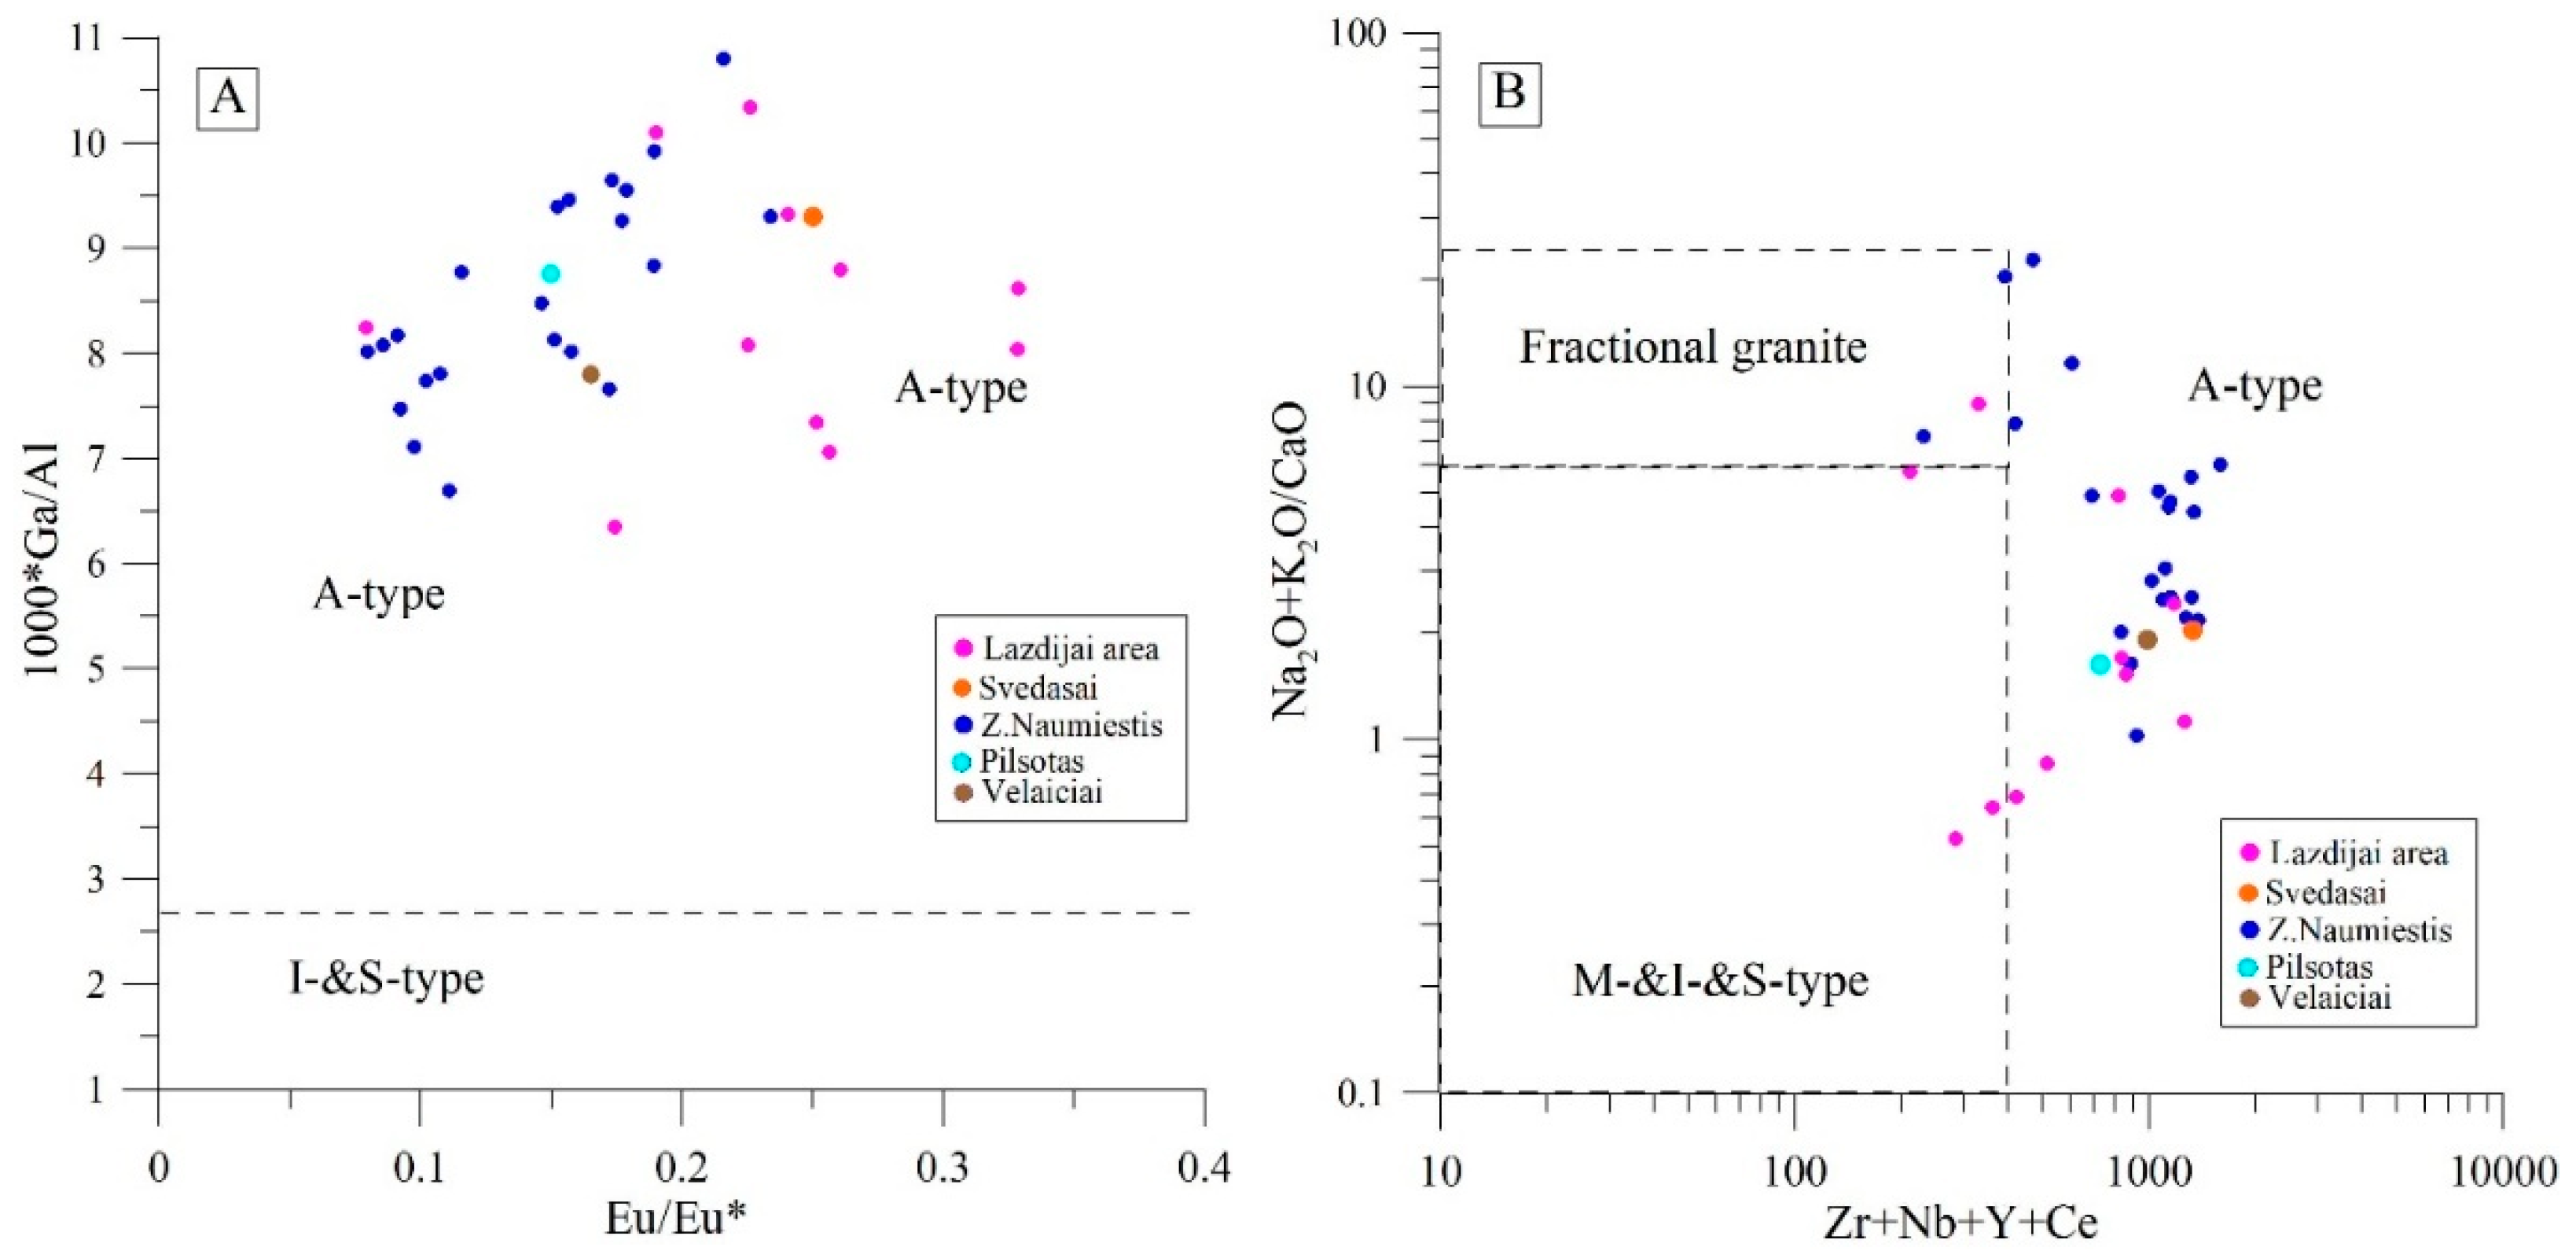
Utilizing plots of some major and trace elements, it is possible to clearly distinguish between A-type granites and other granite types [72,77]. The studied Mesoproterozoic intrusions are attributed to the A-type granitoids owing to a high 10,000 × Ga/Al ratio (Figure 13A). It is notable that the Eu/Eu* anomaly shows stronger magmatic differentiation (ratio < 0.2) in WLD and a weaker signal defined in LBB (ratio mainly >0.2) (Table 4), suggesting higher mineral fractionation (e.g., potassium or sodium feldspars). Eu/Eu* ratio is often applied to reconstruct the redox environment of magmatic rocks [78]. In particular, an oxidized environment has been suggested in the Žemaičių Naumiestis batholith, and a moderate reducing regime is considered in the granitoids in the Lazdijai area.
The plot of Zr + Nb + Ce + Y vs. (Na2O + K2O)/CaO discriminates A-type and other types of granites (Figure 13B) [77]. It should be emphasized that no notable difference was observed between the western and eastern Lithuanian samples.
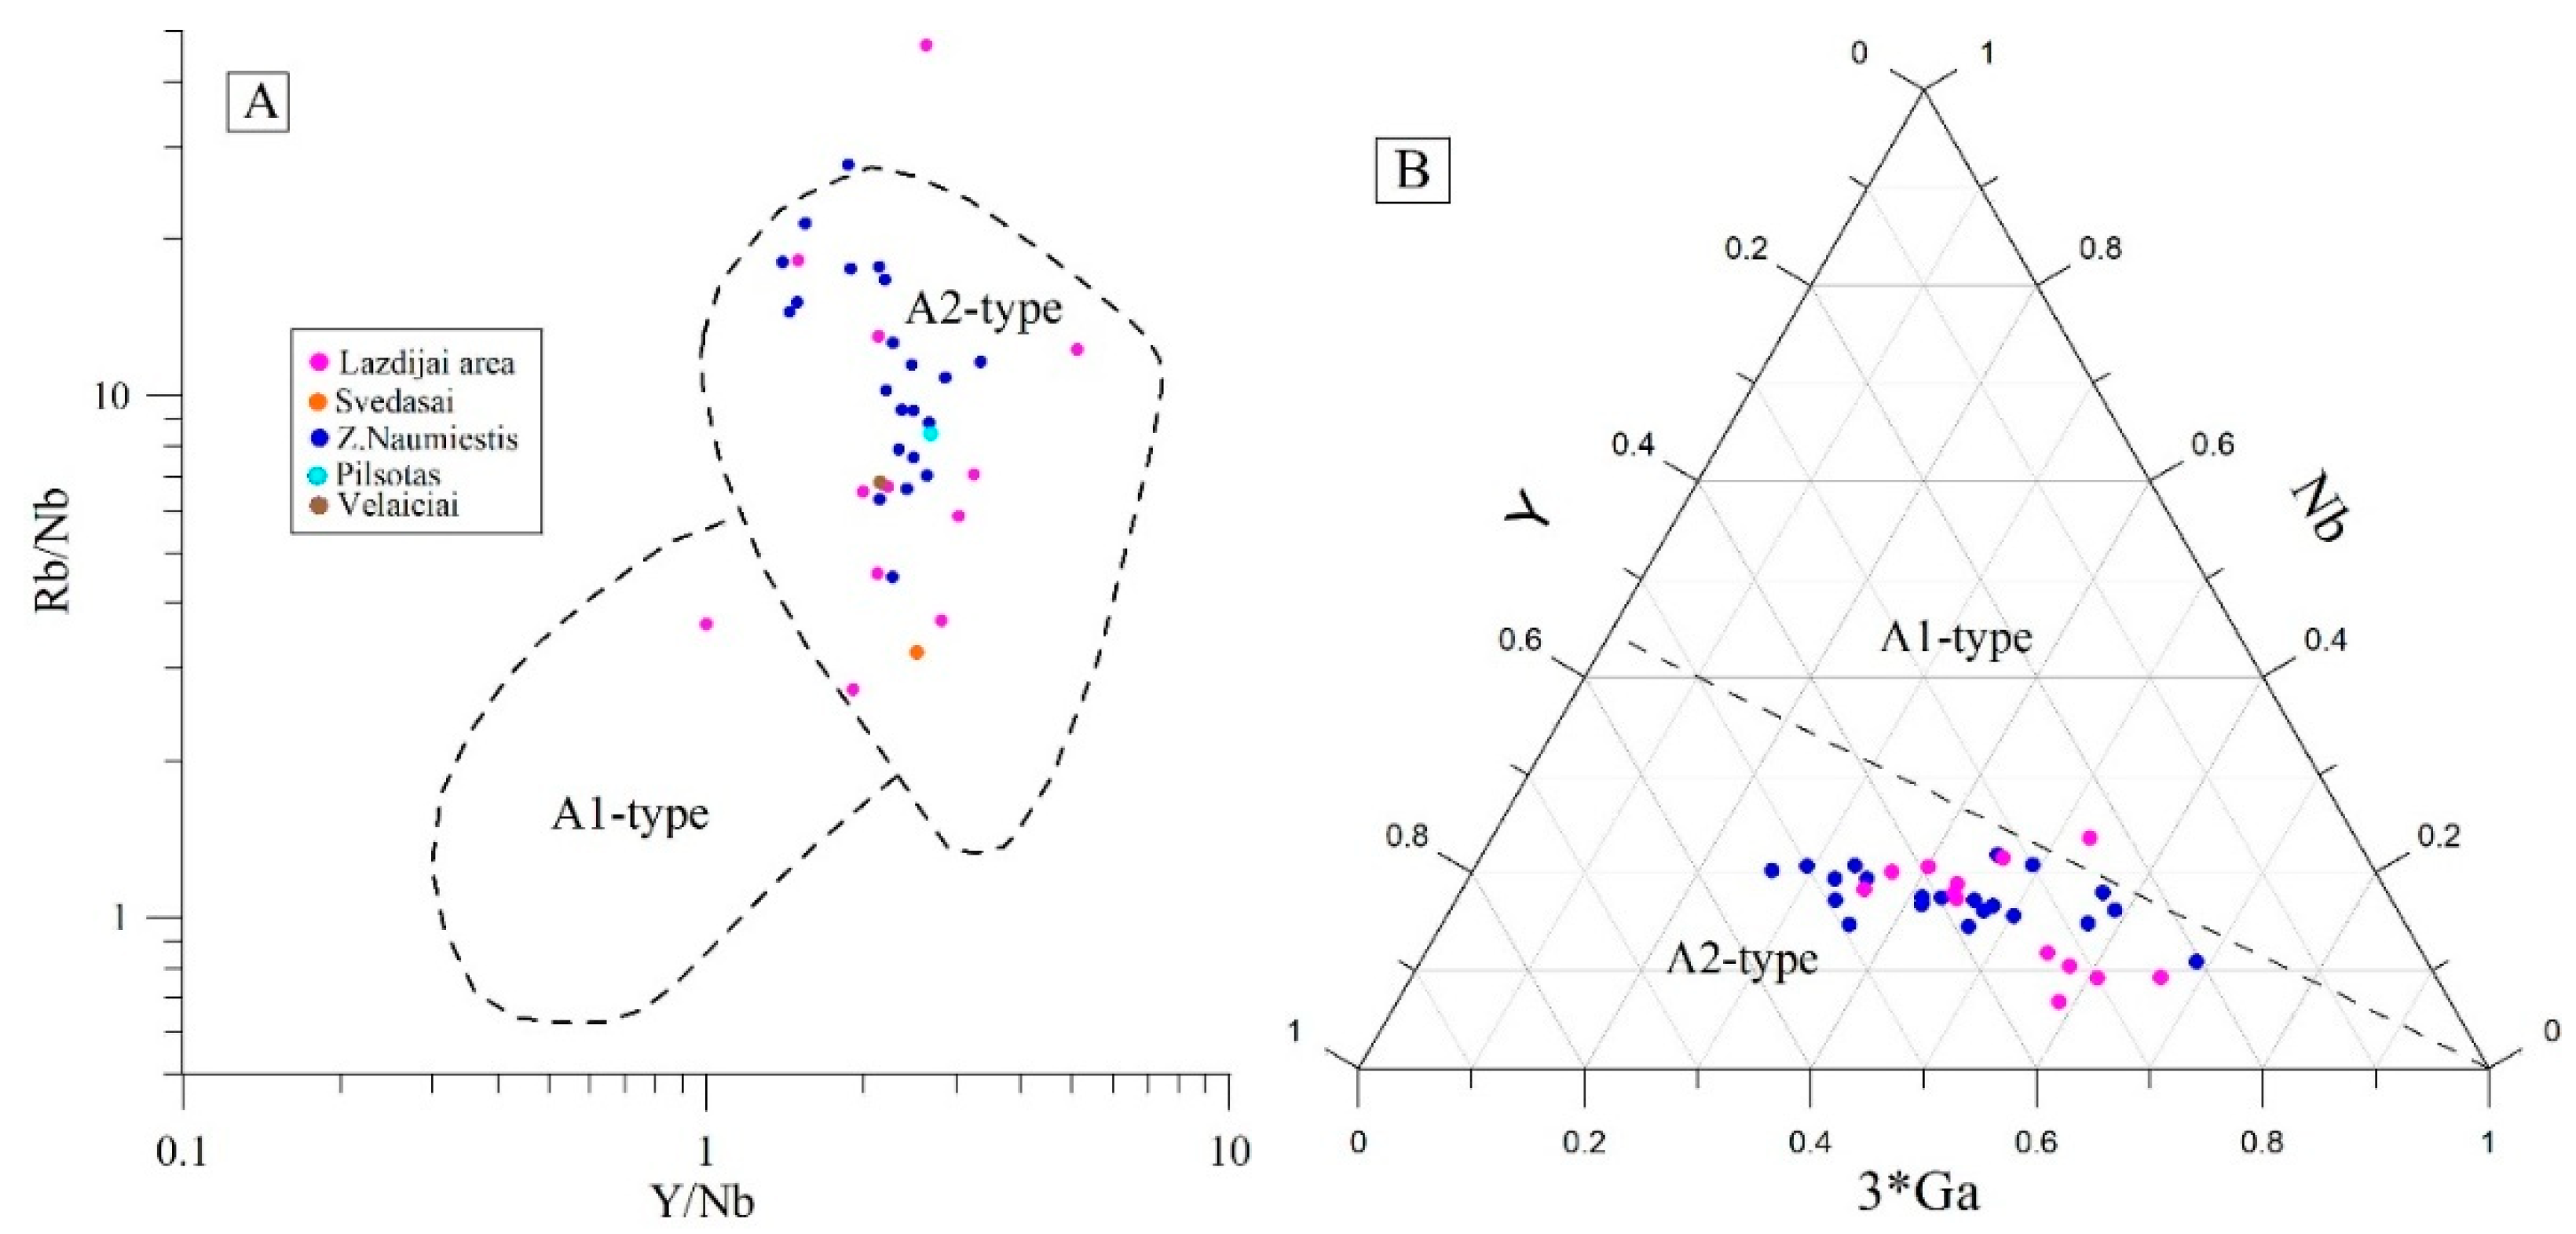
Some authors [75] have attempted to relate A-type granites to tectonic settings and further subdivided A-type granites into A1- and A2-type granites. Based on the Y/Nb ratio, A1-type granites (Y/Nb < 1.2) were emplaced in an anorogenic setting (continental rifts or intraplate environments), and A2-granites (Y/Nb > 1.2) were established in a post-orogenic setting (continent–continent collision). On the plot of Y/Nb vs. Rb/Nb, all the collected samples were classified as A2-granites, e.g., post-orogenic granitoids. Rb/Nb vs. Y/Nb (Figure 14A).
The ternary diagram 3 × Ga-Nb-Y demonstrates a similar type of granitoids (Figure 14B), pointing to the post-collisional tectonic setting. They generally show a common negative trend of Nb vs. Ga, as well as a rather stable ratio of ytterbium. During crystallization, Nb tends to be incorporated into minerals like ilmenite, magnetite, and feldspar, while Ga may be more compatible with biotite.
Notably, the increased alkalinity is related to the excessive potassium content in the studied samples. Lithological variability in shoshonitic associations may be interpreted as resulting from variation in source composition, different melt fractions from similar sources, or melt mingling [79]. An experimental melting of metabasaltic amphibolite requires small degrees of dehydration melting of amphibole, plagioclase, and clinopyroxene at a high temperature. A potassium-rich shoshonite suite is a common feature of postorogenic setting. Mineralogical and geochemical compositions of the studied granitoids are classified as K-rich and K-feldspar porphyritic calc-alkaline granitoids of mixed origin. The WLD granitoids show generally higher potassium content compared to LBB (difference for about K2O = 1.5%).
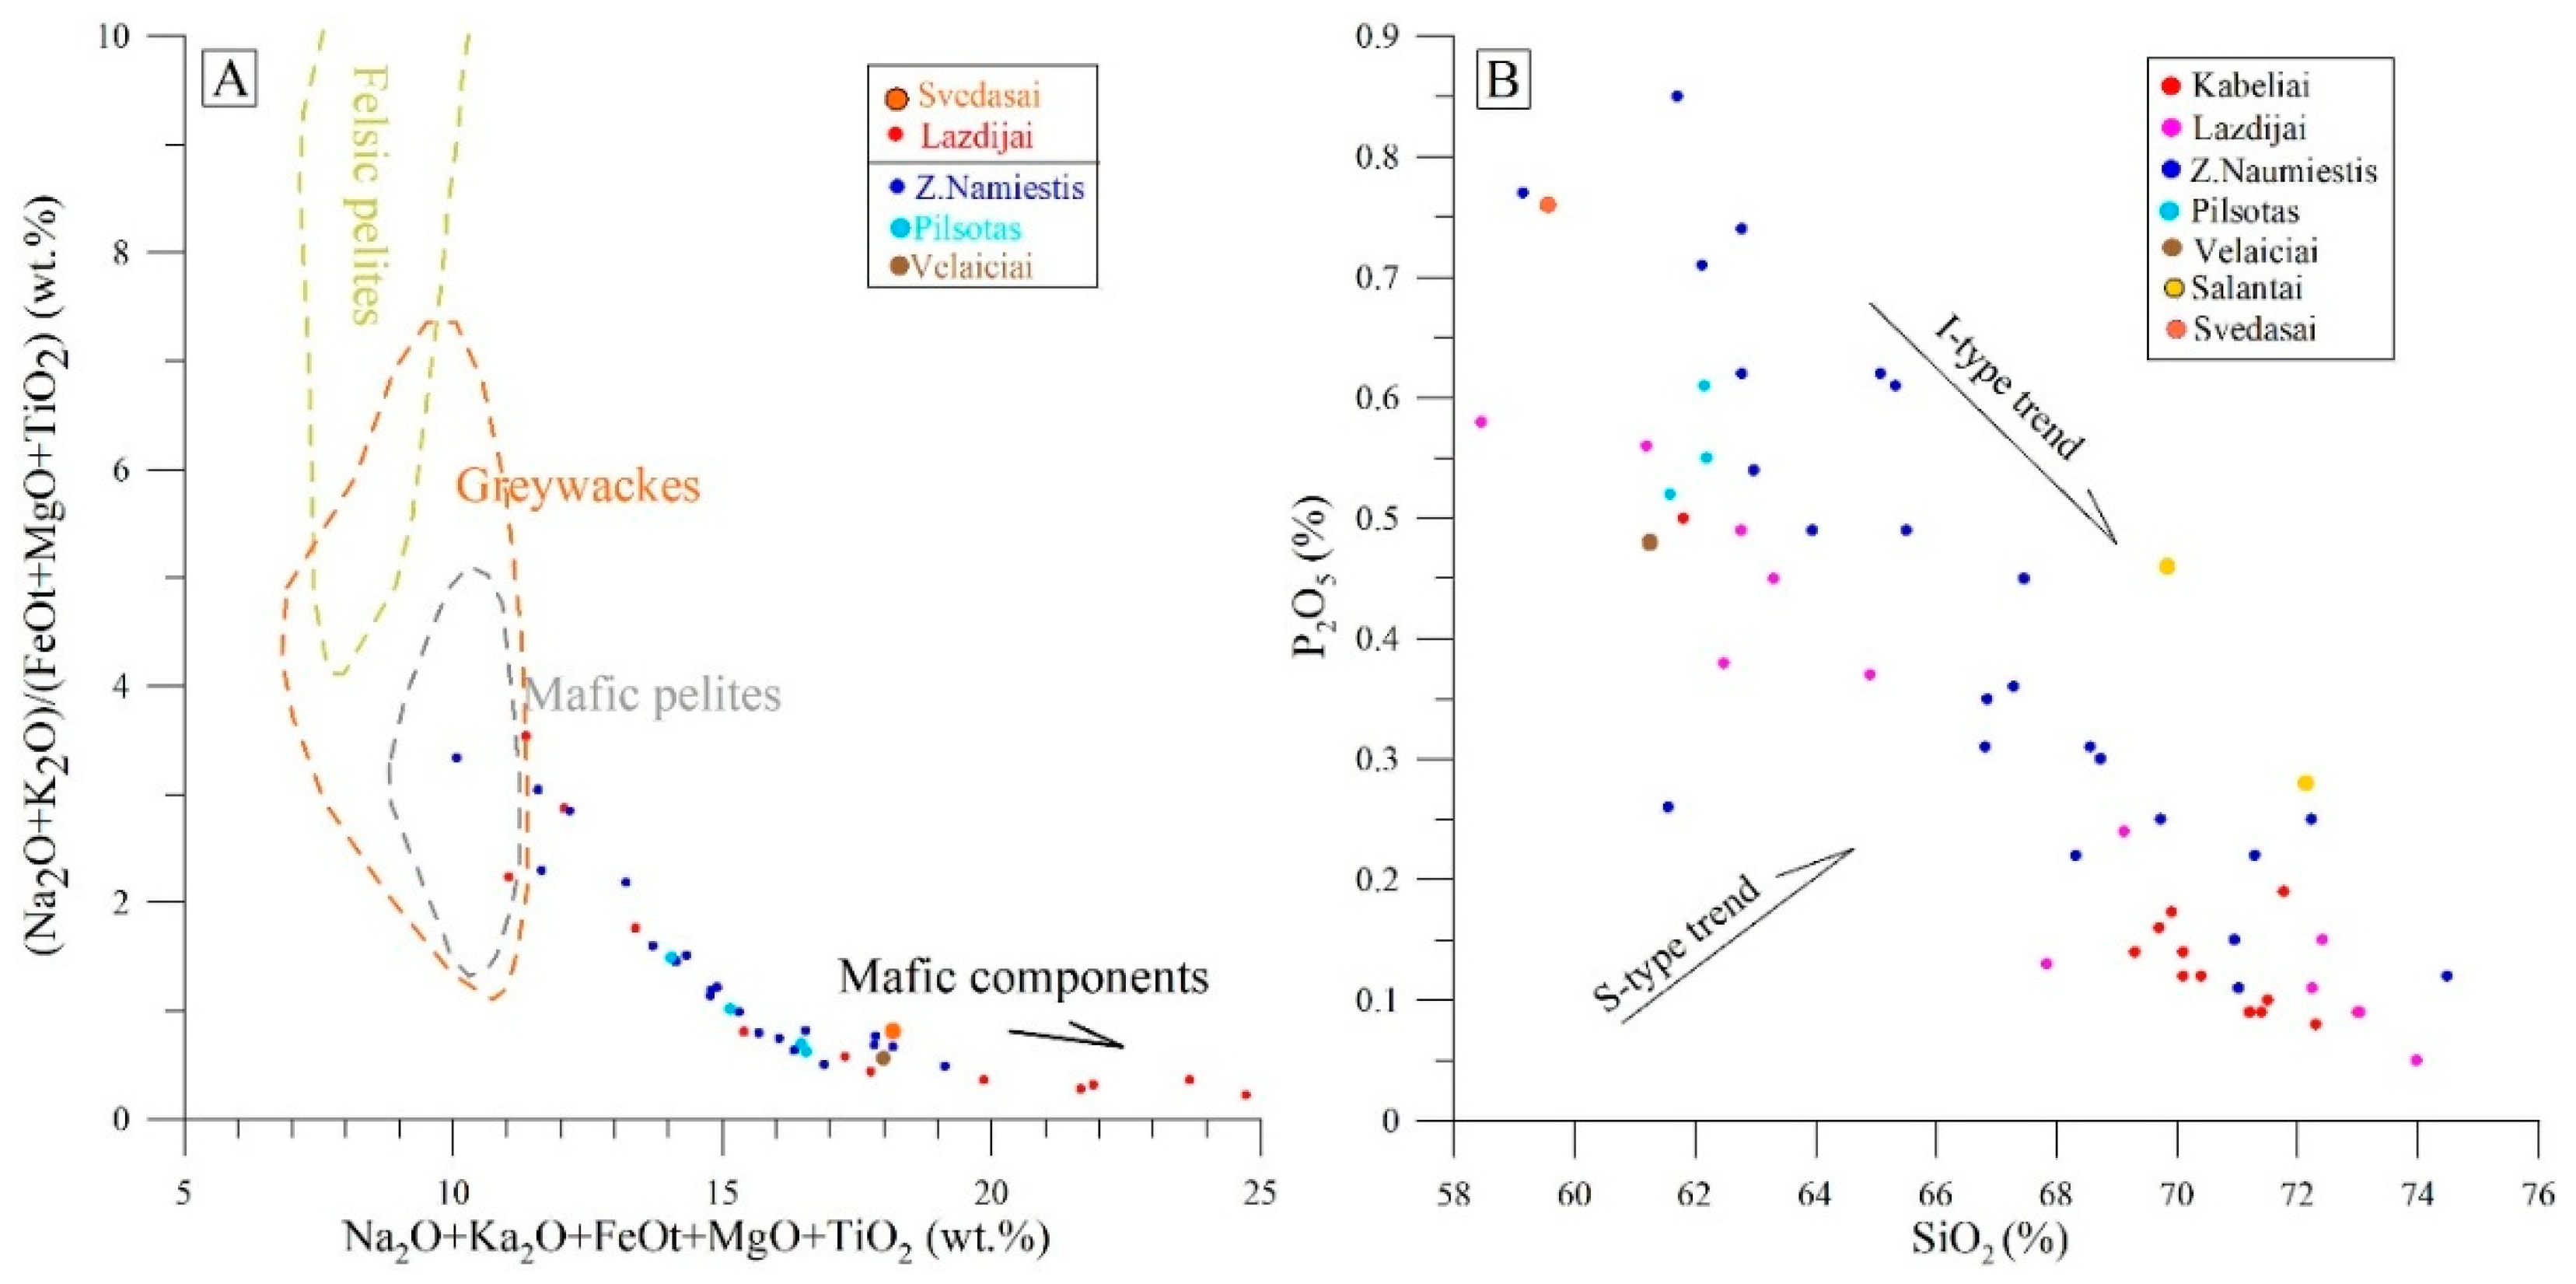
On the diagram combining the major elements, samples are distributed in the mafic greywacke field and follow the trend of the mafic component (Figure 15A). A clear trend is evident in the plot, suggesting a similar petrologic setting for the intrusions. The studied granitoids show a strong enrichment in mafic elements. The strongest mafic signature is defined in LBB samples and grades to pelites/greywacks in WLD.
Many researchers proposed that I-type granites are derived from the remelting of sedimentary rocks reformed by mantle-derived magma [82,83], or that the melt compositional change from S- to I-type is caused by gradually decreasing sediment during re-melting of the crust [84]. The strong negative trend of Al2O3/TiO2 vs. CaO/Na2O in most of the studied rocks indicates a basaltic and psammitic source for the melting of I-type granitoids, with a ratio of 0.3–3.0 [85].
Granitic rocks are divided into two types based on the nature of their protolith and their petrographic and geochemical features, e.g., I- and S-type granites [81]. The distinction between different types of granites is not always straightforward, especially for the highly fractionated granites. A strong negative correlation was observed between SiO2 and P2O5 in Mesoproterozoic granitoids (Figure 15B). A slightly higher phosphorus concentration was noticed in WLD granitoids. The common trend defined implies a similar temperature of crystallization for the studied granitoids. Temperatures obtained using whole-rock P2O5 and SiO2 contents indicate values well above 950 °C [86]. These values, which are strongly related to apatite mineral defined in thin sections, suggest that the magma of the granites started to crystallize at temperatures above 950 °C and indicate that these granites are high-temperature I-type granites [87].
The lognormal negative trend of MgO vs. K2O/P2O5 implies strong assimilation of the mafic host rocks in the studied shoshonitic granitoids [88]. Total rock K/Rb ratios are relatively low at ca. 163 in WLD, and ratios are increased at ca. 215 in LBB, indicating strongly evolved magma and moderately evolved magma, respectively [89] (Table 2 and Table 3).
Rb vs. P2O5 ratio is a typical I-type granite trend, thus corroborating highly fractionated granitoids (Figure 16A) [81]. It corroborates the strong positive trend defined between Rb/Sr vs. Rb/Ba, pointing to the melting of clay-poor psammites.
Figure 16B is relevant for assessing geothermal prospects and shows a correlation between Rb and Th, accounting for approximately 75% of heat generation in west Lithuanian granitoids and 55% in east Lithuania (Figure 10A). Granitoids are clearly classified as I-type series. No systematic studies have been carried out to explain the anomalous Th concentration (>85 ppm) recorded in the Žemaičių Naumiestis intrusion.
Partial melting and fractional crystallization were involved in the formation of Mesoproterozoic intrusions. In particular, the La and La/Yb ratio (Figure 16C) indicates no definite trends after [90]. Magma melting and mixing occurred in the Akmeniai intrusion, as based on petrographic examination of drill cores. Furthermore, the diagram indicates a heterogeneous source of magma in the largest Žemaičių Naumiestis batholith.
The partial melting of mafic rocks usually forms high-temperature I-type granitoids. The Nb/La ratio varies from 0.36 to 0.04. The former value is compatible with the average lower crust [92], and low ratios, negatively correlating with La/Yb, suggest involvement of lower and middle crust rocks, while neither the deep mantle nor the asthenosphere level was likely involved.
The Rb and Ba ratio allows for the tracing of the fractionation of major minerals. The Žemaičių Naumiestis and Kapčiamiestis batholiths indicate a clear potassium-amphibolite trend, except for some higher shift in Sr concentration in the latter intrusion (Figure 16D). The other intrusions were scarcely sampled (one sample for particular intrusions, e.g., Vėlaičiai, Pilsotas, Gervėnai, Svėdasai). However, they are also chained along the main positive trend. In contrast to most intrusions, the Akmeniai diorites and granodiorites exhibit a discordant trend that can be interpreted as a result of plagioclase and biotite fractionation. Based on inspection of the drill cores, the mingling of the two magmas was rather clear, instead of fractional crystallization in this intrusion.

6.2. Magnetite Series of the Mesoproterozoic Granitoids

The high magnetic susceptibility of the Mesoproterozoic intrusions is the most remarkable exploration signature identified on magnetic maps. Notably, the Kapčiamiestis and Žemaičių Naumiestis batholiths reveal strong magma fractionation observed on the magnetic map.
In terms of the magnetic susceptibility, granitic rocks can be classified into the magnetite or ilmenite series [93]. All the Mesoproterozoic samples are classified as the ‘magnetite’ series (>3 × 10⁻³ SI). Magnetite-bearing granites are generally interpreted as being ‘oxidized’. Many authors have argued that the presence of magnetite in granites is not incompatible with a more reduced character [94].
In the FeOtot/(FeOtot + MgO) vs. SiO2 diagram (Figure 5B), ‘ferroan’ and ‘magnesian’ geochemical series are defined in the studied intrusions. In west Lithuania, Traubai, Pilsotas, Žūkai are classified as the ‘ferroan‘ series. The Žemaičių Naumiestis and Kapčiamiestis batholith granitoids show a variable ratio of iron and magnesium content, while the lowest ratio was documented in the Ramoniškis intrusion.
The ‘oxidized’ granites are more magnesian than the strongly reduced granitoids identified by [71]. The iron and magnesium ratio, according to [58], can serve as an indicator of oxygen fugacity in magmatic systems, where higher ratios indicate more reducing conditions. The mineral assemblages imply a higher oxygen fugacity in the magnetite series granitoids than in the ilmenite series granitoids during the solidification of the granitic magmas [93]. However, their petrogenesis remains a matter of controversy [95].
The Pilsotas, Kabeliai, Gervėnai, Svėdasai intrusions show a clear type of ‘ferroan’ granitoids, while the Ramoniškis, Salantai, and Gėluva intrusions exhibit a relative increase in magnesium concentration and correlate with lower magnetic anomalies. The Žemaičių Naumiestis batholith indicates differentiation of magma. Most of the magmatic body indicates a relatively high Fe and Mg ratio, except for the southeastern part of the intrusion, which is enriched in magnesium, as is discernible on the magnetic field map. No clear trend was recognized in the Lazdijai area. The granitoids of particular boreholes are classified as both ‘ferroan’ and ‘magnesian’ intervals. Locally, the magma mingling was documented in a few boreholes, as discussed above (Akmeniai intrusion, some boreholes drilled in the Žemaičių Naumistis batholith).

6.3. Influence of Mesoproterozoic Granitoids on the Recent Heat Flow

The basic concept for interpreting the two different geothermal provinces in Lithuania and the subdivision of two Palaeoproterozoic crustal (lithospheric) blocks, showing different Earth’s thickness and lithologies of the crystalline basement (Figure 2). The boundary between two blocks is conventionally delineated by a heat flow of approximately 45 mW/m2. Based on deep seismic data [26,27], the Palaeoproterozoic rocks of the WLD block indicate generally more sialic composition of Earth’s crust [20] and correlate with drilling evidence.
Based on the straightforward interpretation of the heat generation in crystalline basement rocks and deep seismic data, the higher heat flow in the WLD geothermal province is attributed to the increase in heat flow. Therefore, the occurrence of numerous radiothermal granitoids in the crystalline basement is the most important target of geothermal siting. The lowest heat generation was reported at 2.8 μW/m3 in moncodiorite and 2.9 μW/m3 for diorite collected from boreholes Svedasai-252 and Gervėnai-14, respectively, while the highest values 7.4–7.8 μW/m3 were documented for granitic intrusions (Salantai, Žemaičių Naumiestis, Kabeliai) (Figure 17).
The largest West Lithuanian Geothermal Anomaly is primarily associated with abundant “hot” granitoids that intruded into the upper granulitic crust (Figure 17). The deep seismic tomography also suggests anomalous parameters in the underlying mantle [29]. The average heat flow of the anomaly was assessed as 1.95 × 10⁻⁶ cal/(cm2·s). Based on the gravimagnetic modelling [24], the thickness of the Žemaičių Naumiestis batholith was modelled at ca. 4 km, which accounts for a ca. 30 mW/m2 increase in heat flow in WLD. Geothermal insulation is another important parameter that increases the heat flow due to the large thickness of the basin in west Lithuania. The local increase in heat flow was demonstrated in other local anomalies confined to the “hot” intrusions (e.g., most remarkable increase in the Salantai anomaly at 81 mW/m2).
By contrast to west Lithuania, situated in the deep part of the Baltic Basin, the boreholes drilled in southeast and east Lithuania show much lower heat flow (35–40 mW/m2) due to lower background heat production of crystalline basement rocks, low sedimentary blanketing, and intense meteoric water flow in the eastern periphery of the Baltic Artesian Basin.

6.4. Tectonic Structural Control and Setting of Intrusions

The western margin of the Baltica Craton was subject to 1.64–1.52 Ga Gothian and 1.52–1.48 Ga Telemarkian orogenic events, recorded in the west Fennoscandian region [96]. The magmatic rocks have a juvenile calc-alkaline geochemical signature typical of an active margin tectonic setting. The Gothian orogenic event triggered “anorogenic” magmatism in the Baltoscandian region and lasted for 200 Ma. Two alternative models, e.g., the transitional and anorogenic tectonic regimes can be discussed, that led to the extensive magmatic activity during the Mesoproterozoic time. The former model is more consistent in the context of the ongoing active subduction and accretion of the Gothiana and Telemark orogens along the margin of the Baltica craton. Therefore, the general strain field was governed by a general shearing regime. The extensive igneous activity was recorded far away from the orogenic chain and apparently influenced the asthenosphere upwelling that induced the tectonic extension and decompression of the lithosphere.
The most proximal A-type intrusive suite yielded ages of 1.45–1.46 Ga, defined in Bornholm Island situated in the western Baltic Sea [97], and was emplaced in the Palaeoproterozoic gneisses. This model incorporates partial melting of the mantle and lower crust. The contemporaneous intrusions (1447–1468 Ma) were detected as far away as west Lithuania [51]. It is notable that granitoids in two regions exhibit similar features, such as metaluminous to weakly peraluminous, alkali-calcic, potassic (shoshonitic), ferroan, and characterized by a strong negative Eu anomaly.
The Wiborg rapakivi pluton (southeast Finland) documents the first magmatic phase as mentioned above and echoed in west Lithuania. The Vėlaičiai local intrusion (dated at 1625 Ma) exhibits a W-E elongated geometry on the magnetic field map. This intrusion marks the onset of the large Tectonic Shear Zone trending W-E in west Lithuania, which later evolved into the most significant fault recognized in the sedimentary cover of Lithuania [37]. The granodiorite documents a blastomylonitic structure, witnessing an active tectonic regime.
The second phase was characterized by the establishment of the Riga pluton, located in western Latvia and dated 1568 Ma. The pluton extends to Hiiumaa island in Estonia, northwest Lithuania, and offshore Latvia. This magmatic event involved eastern Lithuania, e.g., a small Svėdasai intrusion was dated 1569 Ma. The other borehole Tverečius-336 marks the resetting of the isotopic system along the most distinct Polotsk shear zone striking W-E and cutting the LBB block (Figure 3).
The very different lateral pattern of intrusions was identified in the third igneous phase, dated at 1495–1511 Ma. The 300 km long W-E trending Mazury magmatic belt extends from north Poland to southernmost Lithuania. Notably, the Mazury belt played the most important tectonic role in shaping the boundary of the Baltic Basin in the south and Mazury-Belarus Anteclise [37]. Most of the southernmost Lithuanian intrusions (Akmeniai and Kabeliei granites) show massive structures pointing to low tectonic activity, while some parts of the Kapčiamiestis batholith are subject to local bastomilonitic deformations. Notably, intrusions are dissected by scarce-to-abundant fractures, most likely formed in the Phanerozoic time. Based on hydrodynamic testing of exploration boreholes, the fracture zones show very high water discharge (exploration carried out in Kabeliai granites).
The final stage climaxed at ca. 1445–1460 Ma and records the most abundant intrusions defined in the crystalline basement of western Lithuania. This cluster of intrusions was emplaced in the Kuršiai charnockitic batholith of 1.85–1.81 Ga age and granulitic migmatites [24]. The most voluminous intrusions (Žemaičių Namiestis, Traubai, Pilsotas, Žūkai) are situated in the West Lithuanian Geothermal Anomaly, which largely accounts for the high heat production of intrusions. Furthermore, the high heat flow in the eastern part of the anomaly suggests not outcropping intrusions, as suggested by high heat flow values assessed in the oil exploration wells (>80 mW/m2).
Tectonic deformation of granitoids varies from massive structures (Gėluva intrusion dissecting gabbro body dated as old as 1839 Ma) [47] to strongly mylonitized granodiorites (Pilsotas intrusion). The Žemaičių Naumiestis batholith is strongly deformed (milonites and proto-cataclasites) along the W-E trending shear zone, while the southern part of the batholith shows very uneven tectonic deformation along the NW-SE tectonic trend.
The studied rocks are attributed to A2-type granitoids, which suggests a post-orogenic tectonic setting (Figure 14A,B). The mapped intrusions were classified as non-A1-type granitoids, which would otherwise suggest an anorogenic setting (e.g., weak or no tectonic structuring of granitoids, no asthenosphere geochemical signatures).
The interpretation of the gravimagnetic maps shows a strong tectonic framework controlling the Mesoproterozoic intrusions. The pervasive younger deformations reveal NW-SE and W-E linear anomalies straddle this major tectonic zone (Figure 3). The W-E trending structures, mostly shearing zones, control the majority of intrusions, while NW-SE lineaments show more abundant lateral distribution (e.g., Gervėnai intrusion, western part of the Žemaičių Naumiestis batholith).

7. Conclusions

Thirteen intrusions of different sizes and geometries were defined in the crystalline basement of Lithuania, ranging from 1625 Ma to 1445 Ma in age. The most important parameter in mapping these peculiar intrusions is related to anomalous magnetic susceptibility (average 53 × 10−3 SI). The high magnetic susceptibility classified granitoids as the ‘magnetite’ series. However, both predominant ‘ferroan’ and subordinate ‘magnesian’ type granitoids are identified. The bulk and trace elements emphasize that the “hot” granites were derived from the melting of the lower crust with a high mafic component, implying melting of depleted granulites, mafic, and ultramafic lithologies of the lower crust.
The I-type geochemical trend was demonstrated on geochemical plots. The granitoids are attributed to the subalkaline series and classified as A2-type granitoids, indicating a post-orogenic tectonic setting rather than an anorogenic regime. The petrographic examination of drill cores revealed two types of granitoid tectonic structuring, namely, massive or weakly oriented blastocataclasite and proto-cataclasites that grade into mylonites.
The average radiogenic heat production of the Mesoproterozoic granitoids was determined at 7.29 μW/m3. The shoshonitic series (K2O) accounts for the increased heat production of the Mesoproterozoic granitoids. The highest contribution to heat production is attributed to the highest content of thorium (approximately 60%) and a lesser significant role of uranium. The Th series of granitoids was defined in WLD, while the U-Th series is registered in LBB. The latter correlates with REE abundance of granitoids, while U concentration shows a more complex correlation. The nature of the most intense West Lithuanian Geothermal Anomaly is attributed to a cluster of “hot” granites of Mesoproterozoic age.

Author Contributions

Conceptualization, S.Š. and G.M.; methodology, G.M. and S.Š.; formal analysis, S.Š. and G.M.; investigation, S.Š. and G.M.; writing—original draft preparation, S.Š. and G.M.; writing—review and editing, S.Š. and G.M.; visualization, S.Š.; supervision, S.Š. All authors have read and agreed to the published version of the manuscript.

Funding

This research received no external funding.

Institutional Review Board Statement

Code of Academic Ethics of Nature Research Centre Scientists and Researchers approved by the Research Council of the State Scientific Research Institute Nature Research Centre downloadable at https://gamtostyrimai.lt/en/akademines-etikos-komisija/ (accessed on 27 January 2011). Code of academic ethics of Vilnius University downloadable at https://www.vu.lt/site_files/Studies/Study_regulations/Code_of_academic_ethics_VU.pdf (accessed on 21 October 2020).

Informed Consent Statement

Not applicable.

Data Availability Statement

The original contributions presented in the study are included in the article, further inquiries can be directed to the corresponding author.

Acknowledgments

This study was supported by the open access to the research infrastructure of the State Scientific Research Institute Nature Research Centre under the Lithuanian open-access network initiative. We kindly thank the two reviewers for their valuable comments, which helped to structure and improve the manuscript.

Conflicts of Interest

The authors declare no conflicts of interest regarding the publication of this article.

References

  1. Zajacs, A.; Shogenova, A.; Shogenov, K.; Volkova, A.; Sliaupa, S.; Sliaupiene, R.; Jõeleht, A. Utilization of Geothermal Energy: New Possibilities for District Heating Networks in the Baltic States. Renew. Energy 2025, 242, 122375. [Google Scholar] [CrossRef]
  2. Brehme, M.; Nowak, K.; Banks, D.; Petrauskas, S.; Valickas, R.; Bauer, K.; Burnside, N.; Boyce, A. A Review of the Hydrochemistry of a Deep Sedimentary Aquifer and Its Consequences for Geothermal Operation: Klaipeda, Lithuania. Geofluids 2019, 2019, 4363592. [Google Scholar] [CrossRef]
  3. Lund, J.W.; Toth, A.N. Direct Utilization of Geothermal Energy 2020 Worldwide Review. Geothermics 2021, 90, 101915. [Google Scholar] [CrossRef]
  4. Duchane, D.; Brown, D. Hot Dry Rock (HDR) Geothermal Energy Research and Development at Fenton Hill, New Mexico. Geo-Heat. Cent. Q. Bull. 2002, 23, 13–19. [Google Scholar]
  5. Ledru, P.; Bruhn, D.; Calcagno, P.; Genter, A.; Huenges, E.; Kaltschmitt, M.; Karytsas, C.; Kohl, T.; Le Bel, L.; Lokhorst, A. ENhanced Geothermal Innovative Network for Europe: The State-of-the-Art. Geotherm. Resour. Counc. Bull. 2007, 36, 295–300. [Google Scholar]
  6. Genter, A.; Evans, K.; Cuenot, N.; Fritsch, D.; Sanjuan, B. Contribution of the Exploration of Deep Crystalline Fractured Reservoir of Soultz to the Knowledge of Enhanced Geothermal Systems (EGS). Comptes Rendus. Géoscience 2010, 342, 502–516. [Google Scholar] [CrossRef]
  7. Paškevičius, J. The Geology of the Baltic Republics; Lietuvos Geologijos Tarnyba: Vilnius, Lithuania, 1997; ISBN 978-9986-623-20-5. [Google Scholar]
  8. Rybach, L. Determination of Heat Production Rate. Handb. Terr. Heat-Flow. Density Determ. 1988, 4, 125–142. [Google Scholar]
  9. Liao, Y.; Wang, G.; Xi, Y.; Gan, H.; Yan, X.; Yu, M.; Zhang, W.; Zhao, Z. Petrogenesis of High Heat Producing Granites and Their Contribution to Geothermal Resource in the Huangshadong Geothermal Field, South China. Front. Earth Sci. 2024, 12, 1342969. [Google Scholar] [CrossRef]
  10. Wallroth, T.; Eliasson, T.; Sundquist, U. Hot Dry Rock Research Experiments at Fjällbacka, Sweden. Geothermics 1999, 28, 617–625. [Google Scholar] [CrossRef]
  11. Eliasson, T.; Schöberg, H. U-Pb Dating of the Post-Kinematic Sveconorwegian (Grenvillian) Bohus Granite, SW Sweden: Evidence of Restitic Zircon. Precambr. Res. 1991, 51, 337–350. [Google Scholar] [CrossRef]
  12. Rosberg, J.-E.; Erlström, M. Evaluation of Deep Geothermal Exploration Drillings in the Crystalline Basement of the Fennoscandian Shield Border Zone in South Sweden. Geotherm. Energy 2021, 9, 20. [Google Scholar] [CrossRef]
  13. Rintamäki, A.E.; Hillers, G.; Vuorinen, T.A.T.; Luhta, T.; Pownall, J.M.; Tsarsitalidou, C.; Galvin, K.; Keskinen, J.; Kortström, J.T.; Lin, T.-C.; et al. A Seismic Network to Monitor the 2020 EGS Stimulation in the Espoo/Helsinki Area, Southern Finland. Seismol. Res. Lett. 2022, 93, 1046–1062. [Google Scholar] [CrossRef]
  14. Kukkonen, I.T.; Pentti, M.; Heikkinen, P.J. St1 Deep Heat Project: Hydraulic Stimulation at 5–6 Km Depth in Crystalline Rock. In Proceedings of the Lithosphere 2021–Eleventh Symposium on the Structure, Composition and Evolution of the Lithosphere in Finland, Programme and Extended Abstracts, Berlin, Germany, 17–21 October 2022; pp. 69–72. [Google Scholar]
  15. Moska, R.; Labus, K.; Kasza, P.; Moska, A. Geothermal Potential of Hot Dry Rock in South-East Baltic Basin Countries—A Review. Energies 2023, 16, 1662. [Google Scholar] [CrossRef]
  16. Piipponen, K.; Soesoo, A.; Arola, T.; Bauert, H.; Tarros, S. Impacts of Groundwater Flow on Borehole Heat Exchangers: Lessons Learned from Estonia. Renew. Energy 2024, 237, 121448. [Google Scholar] [CrossRef]
  17. Liao, D.; Feng, D.; Luo, J.; Yun, X. Relationship between Radiogenic Heat Production in Granitic Rocks and Emplacement Age. Energy Geosci. 2023, 4, 100157. [Google Scholar] [CrossRef]
  18. McCay, A.T.; Younger, P.L. Ranking the Geothermal Potential of Radiothermal Granites in Scotland: Are Any Others as Hot as the Cairngorms? Scott. J. Geol. 2017, 53, 1–11. [Google Scholar] [CrossRef]
  19. Atkins. Deep Geothermal Review Study Final Report; Department of Energy & Climate Change: Epsom Surrey, UK, 2013; p. 156.
  20. Busby, J.; Terrington, R. Assessment of the Resource Base for Engineered Geothermal Systems in Great Britain. Geotherm. Energy 2017, 5, 7. [Google Scholar] [CrossRef]
  21. Scharfenberg, L.; Regelous, A.; De Wall, H. Radiogenic Heat Production of Variscan Granites from the Western Bohemian Massif, Germany. J. Geosci. 2020, 64, 251–269. [Google Scholar] [CrossRef]
  22. Sliaupa, S.; Motuza, G.; Korabliova, L.; Motuza, V.; Zaludiene, G. Hot Granites of Southwest Western Lithuania: New Geothermal Prospects. Tech. Poszuk. Geol. 2005, 44, 26–34. [Google Scholar]
  23. Šliaupa, S. Geothermal Data Base of Lithuania; Lithuanian Geological Survey: Vilnius, Lithuania, 2002; pp. 51–53. [Google Scholar]
  24. Motuza, G. The Precambrian Geology of Lithuania: An Integratory Study of the Platform Basement Structure and Evolution, 1st ed.; Regional Geology Reviews Series; Springer International Publishing AG: Cham, Switzerland, 2022; ISBN 978-3-030-96854-0. [Google Scholar]
  25. Urban, G. Heat flow and radiogenic heat generation of some structures of the crystalline basement of Baltic Syneclise. Proc. Acad. Sci. Est. SSR. Geol. 1989, 38, 155–160. [Google Scholar] [CrossRef]
  26. Giese, R. Eine Zweidimensionale Interpretation Der Geschwindigkeitsstruktur Der Erdkruste Des Südwestlichen Teils Der Osteuropäischen Plattform (Projekt EUROBRIDGE). Ph.D. Thesis, WB Scientific Drilling, Scientific Infrastructure and Plattforms, GFZ, Potsam, Germany, 1998. [Google Scholar]
  27. Garetsky, R.G.; Karataev, G.I.; Zlotsky, G.; Astapenko, V.N.; Belinsky, A.A.; Terletsky, V.V.; EUROBRIDGE Seismic Working Group. Seismic Velocity Structure across the Fennoscandia–Sarmatia Suture of the East European Craton beneath the EUROBRIDGE Profile through Lithuania and Belarus. Tectonophysics 1999, 314, 193–217. [Google Scholar] [CrossRef]
  28. Zui, V.; Dubanevich, M.; Vasilionak, E. Geothermal Field and Geothermal Resources in Belarus, Country Update for Belarus. In Proceedings of the European Geothermal Congress 2016, Strasbourg, France, 19–23 September 2016. [Google Scholar]
  29. Janutyte, I.; Majdanski, M.; Voss, P.H.; Kozlovskaya, E. PASSEQ Working Group Upper Mantle Structure around the Trans-European Suture Zone Obtained by Teleseismic Tomography. Solid. Earth 2015, 6, 73–91. [Google Scholar] [CrossRef]
  30. Šafanda, J.; Szewczyk, J.; Majorowicz, J. Geothermal Evidence of Very Low Glacial Temperatures on a Rim of the Fennoscandian Ice Sheet. Geophys. Res. Lett. 2004, 31, L07211. [Google Scholar] [CrossRef]
  31. Mokrik, R.; Mažeika, J.; Baublytė, A.; Martma, T. The Groundwater Age in the Middle-Upper Devonian Aquifer System, Lithuania. Hydrogeol. J. 2009, 17, 871–889. [Google Scholar] [CrossRef]
  32. Rämö, O.T.; Haapala, I. Chapter 12 Rapakivi Granites. In Developments in Precambrian Geology; Lehtinen, M., Nurmi, P.A., Rämö, O.T., Eds.; Precambrian Geology of Finland Key to the Evolution of the Fennoscandian Shield; Elsevier: Amsterdam, The Netherlands, 2005; Volume 14, pp. 533–562. [Google Scholar]
  33. Haapala, I.; Lukkari, S. Petrological and Geochemical Evolution of the Kymi Stock, a Topaz Granite Cupola within the Wiborg Rapakivi Batholith, Finland. Lithos 2005, 80, 347–362. [Google Scholar] [CrossRef]
  34. Kirs, J.; Haapala, I.; Rämö, O.T. Anorogenic Magmatic Rocks in the Estonian Crystalline Basement. Proc. Estonian Acad. Sci. Geol. 2004, 53, 210. [Google Scholar] [CrossRef]
  35. Kirs, J.; Puura, V.; Soesoo, A.; Klein, V.; Konsa, M.; Koppelmaa, H.; Niin, M.; Urtson, K. The Crystalline Basement of Estonia: Rock Complexes of the Palaeoproterozoic Orosirian and Statherian and Mesoproterozoic Calymmian Periods, and Regional Correlations. Est. J. Earth Sci. 2009, 58, 219. [Google Scholar] [CrossRef]
  36. Vejelyte, I.; Bogdanova, S.; Skridlaite, G. Early Mesoproterozoic Magmatism in Northwestern Lithuania: A New U–Pb Zircon Dating. Est. J. Earth Sci. 2015, 64, 189–198. [Google Scholar] [CrossRef]
  37. Stirpeika, A. Tectonic Evolution of the Baltic Syneclise and Local Structures in the South Baltic Region with Respect to Their Petroleum Potential; Lithuanian Geological Survey: Vilnius, Lithuania, 1999. [Google Scholar]
  38. Vejelyte, I.; Bogdanova, S.; Yi, K.; Cho, M. The Paleo-to Mesoproterozoic Tectonic and Magmatic Evolution of the Telsiai and Druksiai-Polotsk Deformation Zones in the Crystalline Basement of Lithuania, East European Craton, Reconstructed by U–Pb Zircon Geochronology. In Proceedings of the 34th International Geological Congress, Brisbaine, Australia, 5–10 August 2012. [Google Scholar]
  39. Skridlaite, G.; Whitehouse, M.; Rimša, A. Evidence for a Pulse of 1.45 Ga Anorthosite–Mangerite–Charnockite–Granite (AMCG) Plutonism in Lithuania: Implications for the Mesoproterozoic Evolution of the East European Craton. Terra Nova 2007, 19, 294–301. [Google Scholar] [CrossRef]
  40. Sundblad, K.; Mansfeld, J.; Motuza, G.; Ahl, M.; Claesson, S. Geology, Geochemistry and Age of a Cu-Mo-Bearing Granite at Kabeliai, Southern Lithuania. Mineral. Petrol. 1994, 50, 43–57. [Google Scholar] [CrossRef]
  41. Skridlaite, G.; Siliauskas, L.; Whitehouse, M.; Dunkley, D. Radiation-Damaged Zircon and Its Dating: A Case Study of ca. 1.50 Ga Granitoid Veins Crosscutting Skarns in South-Eastern Lithuania. In Proceedings of the Goldschmidt 2023 Conference, Lyon, France, 9–14 July 2023. [Google Scholar]
  42. Ehlers, C.; Haapala, I. Excursion A1: Rapakivi granites and postorogenic granites of Southwestern Finland. In Proceedings of the Symposium Precambrian Granitoids, Petrogenesis, Geochemistry and Metallogeny, Helsinki, Finland, 14–17 August 1989. [Google Scholar]
  43. Amelin, Y.V.; Larin, A.M.; Tucker, R.D. Chronology of Multiphase Emplacement of the Salmi Rapakivi Granite-Anorthosite Complex, Baltic Shield: Implications for Magmatic Evolution. Contrib. Mineral. Petrol. 1997, 127, 353–368. [Google Scholar] [CrossRef]
  44. Rämö, O.T.; Huhma, H.; Kirs, J. Radiogenic Isotopes of the Estonian and Latvian Rapakivi Granite Suites: New Data from the Concealed Precambrian of the East European Craton. Precambr. Res. 1996, 79, 209–226. [Google Scholar] [CrossRef]
  45. Vejelyte, I.; Bogdanova, S.; Salnikova, E.; Yakovleva, S.; Fedoseenko, A. Timing of Ductile Shearing within the Drūkšiai–Polotsk Deformation Zone, Lithuania: A U–Pb Titanite Age. Est. J. Earth Sci. 2010, 59, 256–262. [Google Scholar] [CrossRef]
  46. Skridlaite, G.; Wiszniewska, J.; Duchesne, J.-C. Ferro-Potassic A-Type Granites and Related Rocks in NE Poland and S Lithuania: West of the East European Craton. Precambr. Res. 2003, 124, 305–326. [Google Scholar] [CrossRef]
  47. Skridlaite, G.; Baginski, B.; Whitehouse, M. Significance of ~1.5 Ga Zircon and Monazite Ages from Charnockites in Southern Lithuania and NE Poland. Gondwana Res. 2008, 14, 663–674. [Google Scholar] [CrossRef]
  48. Baginski, B.; Duchesne, J.-C.; Martin, H.; Wiszniewska, J. Isotopic and Geochemical Constraints on the Evolution of the Mazury Granitoids (NE Poland). AM Monogr. 2007, 1, 11–30. [Google Scholar]
  49. Grabarczyk, A.; Wiszniewska, J.; Krzemińska, E.; Petecki, Z. A New A-Type Granitoid Occurrence in Southernmost Fennoscandia: Geochemistry, Age and Origin of Rapakivi-Type Quartz Monzonite from the Pietkowo IG1 Borehole, NE Poland. Miner. Petrol. 2023, 117, 1–25. [Google Scholar] [CrossRef]
  50. Motuza, G.; Kirkliauskaitė, V. Ultramafic Varėna Suite in the Precambrian Crystalline Basement of the Southern Lithuania—Implications for the Origin. Baltica 2016, 29, 93–106. [Google Scholar] [CrossRef]
  51. Motuza, G.; Čečys, A.; Kotov, A.B.; Salnikova, E.B. The Žemaičių Naumiestis Granitoids: New Evidences for Mesoproterozoic Magmatism in Western Lithuania. GFF 2006, 128, 243–254. [Google Scholar] [CrossRef]
  52. Dobrynin, V.M.; Vendelshtein, B.Y.; Kozhevnikov, D.A. Petrophysics; Heдpa: Moscow, Nedra, 1991. [Google Scholar]
  53. Serra, O.; Westaway, P.; Abbott, H. Fundamentals of Well-Log Interpretation 2. The Interpretation of Logging Data; Developments in Petroleum Science; Elsevier: Amsterdam, The Netherlands, 1986; ISBN 978-0-444-42132-6. [Google Scholar]
  54. Bücker, C.; Rybach, L. A Simple Method to Determine Heat Production from Gamma-Ray Logs. Mar. Pet. Geol. 1996, 13, 373–375. [Google Scholar] [CrossRef]
  55. Dawei, H.; Shiguang, W.; Baofu, H.; Manyuan, J. Post-Orogenic Alkaline Granites from China and Comparisons with Anorogenic Alkaline Granites Elsewhere. J. Southeast Asian Earth Sci. 1996, 13, 13–27. [Google Scholar] [CrossRef]
  56. Irvine, T.N.; Baragar, W.R.A. A Guide to the Chemical Classification of the Common Volcanic Rocks. Can. J. Earth Sci. 1971, 8, 523–548. [Google Scholar] [CrossRef]
  57. Middlemost, E.A.K. Naming Materials in the Magma/Igneous Rock System. Earth-Sci. Rev. 1994, 37, 215–224. [Google Scholar] [CrossRef]
  58. Frost, B.R.; Barnes, C.G.; Collins, W.J.; Arculus, R.J.; Ellis, D.J.; Frost, C.D. A Geochemical Classification for Granitic Rocks. J. Petrol. 2001, 42, 2033–2048. [Google Scholar] [CrossRef]
  59. Maniar, P.D.; Piccoli, P.M. Tectonic Discrimination of Granitoids. GSA Bull. 1989, 101, 635–643. [Google Scholar] [CrossRef]
  60. Chappell, B.W.; White, A.J.R. Two Contrasting Granite Types. Pac. Geol. 1974, 8, 173–174. [Google Scholar]
  61. Thompson, R.; Oldfield, F. Magnetic Properties of Natural Materials. In Environmental Magnetism; Thompson, R., Oldfield, F., Eds.; Springer: Dordrecht, The Netherlands, 1986; pp. 21–38. ISBN 978-94-011-8036-8. [Google Scholar]
  62. MacLean, W.H.; Barrett, T.J. Lithogeochemical Techniques Using Immobile Elements. J. Geochem. Explor. 1993, 48, 109–133. [Google Scholar] [CrossRef]
  63. McDonough, W.F.; Sun, S.-S. The Composition of the Earth. Chem. Geol. 1995, 120, 223–253. [Google Scholar] [CrossRef]
  64. Artemieva, I.M.; Thybo, H.; Jakobsen, K.; Sørensen, N.K.; Nielsen, L.S.K. Heat Production in Granitic Rocks: Global Analysis Based on a New Data Compilation GRANITE2017. Earth-Sci. Rev. 2017, 172, 1–26. [Google Scholar] [CrossRef]
  65. Rickwood, P.C. Boundary Lines within Petrologic Diagrams Which Use Oxides of Major and Minor Elements. Lithos 1989, 22, 247–263. [Google Scholar] [CrossRef]
  66. Joplin, G.A. The Shoshonite Association: A Review. J. Geol. Soc. Aust. 1968, 15, 275–294. [Google Scholar] [CrossRef]
  67. El Mezayen, A.M.; Ibrahim, E.M.; El-Feky, M.G.; Omar, S.M.; El-Shabasy, A.M.; Taalab, S.A. Physico-Chemical Conditions Controlling the Radionuclides Mobilisation in Various Granitic Environments. Int. J. Environ. Anal. Chem. 2022, 102, 970–986. [Google Scholar] [CrossRef]
  68. Vanderhaeghe, O.; André-Mayer, A.-S.; Diondoh, M.; Aurélien, E.; Maryse, O.; Moussa, I.; Michel, C.; Marc, P.; Marieke, V.L. Uranium Mineralization Associated with Late Magmatic Ductile to Brittle Deformation and Na–Ca Metasomatism of the Pan-African A-Type Zabili Syntectonic Pluton (Mayo-Kebbi Massif, SW Chad). Miner. Depos. 2021, 56, 1297–1319. [Google Scholar] [CrossRef]
  69. Korabliova, L.; Popov, M. Compilation of Gravity and Magnetic Field Digital Maps of Lithuania at the Scale of 1: 200,000; Lithuanian Geological Survey: Vilnius, Lithuania, 1996; pp. 21–23. [Google Scholar]
  70. Aksamentova, N.V.; Dankevich, I.V.; Naidenkov, I.V. Deep structure of the Belarus-Baltic granulite belt. Proc. Natl. Acad. Sci. Belarus 1994, 38, 93–97. [Google Scholar]
  71. Loiselle, M.C.; Wones, D.R. Characteristics and Origin of Anorogenic Granites. Geol. Soc. Am. 1979, 11, 468. [Google Scholar]
  72. Whalen, J.B. Geology and Geochemistry of the Molybdenite Showings of the Ackley City Batholith, Southeast Newfoundland. Can. J. Earth Sci. 1980, 17, 1246–1258. [Google Scholar] [CrossRef]
  73. Rämö, O.T.; Haapala, I. One Hundred Years of Rapakivi Granite. Mineral. Petrol. 1995, 52, 129–185. [Google Scholar] [CrossRef]
  74. Dall’Agnol, R.; Teixeira, N.P.; Rämö, O.T.; Moura, C.A.V.; Macambira, M.J.B.; De Oliveira, D.C. Petrogenesis of the Paleoproterozoic Rapakivi A-Type Granites of the Archean Carajás Metallogenic Province, Brazil. Lithos 2005, 80, 101–129. [Google Scholar] [CrossRef]
  75. Eby, G.N. Chemical Subdivision of the A-Type Granitoids: Petrogenetic and Tectonic Implications. Geology 1992, 20, 641–644. [Google Scholar] [CrossRef]
  76. Bonin, B. A-Type Granites and Related Rocks: Evolution of a Concept, Problems and Prospects. Lithos 2007, 97, 1–29. [Google Scholar] [CrossRef]
  77. Whalen, J.B.; Currie, K.L.; Chappell, B.W. A-Type Granites: Geochemical Characteristics, Discrimination and Petrogenesis. Contrib. Miner. Petrol. 1987, 95, 407–419. [Google Scholar] [CrossRef]
  78. Roda-Robles, E.; Gil-Crespo, P.P.; Pesquera, A.; Lima, A.; Garate-Olave, I.; Merino-Martínez, E.; Cardoso-Fernandes, J.; Errandonea-Martin, J. Compositional Variations in Apatite and Petrogenetic Significance: Examples from Peraluminous Granites and Related Pegmatites and Hydrothermal Veins from the Central Iberian Zone (Spain and Portugal). Minerals 2022, 12, 1401. [Google Scholar] [CrossRef]
  79. Pagel, M.; Leterrier, J. The Subalkaline Potassic Magmatism of the Ballons Massif (Southern Vosges, France): Shoshonitic Affinity. Lithos 1980, 13, 1–10. [Google Scholar] [CrossRef]
  80. Patiño Douce, A.E. What Do Experiments Tell Us about the Relative Contributions of Crust and Mantle to the Origin of Granitic Magmas? Geol. Soc. Lond. Spéc. Publ. 1999, 168, 55–75. [Google Scholar] [CrossRef]
  81. Chappell, B.W.; White, A.J.R. I- and S-Type Granites in the Lachlan Fold Belt. Earth Environ. Sci. Trans. R. Soc. Edinb. 1992, 83, 1–26. [Google Scholar] [CrossRef]
  82. Chappell, B.W.; Stephens, W.E. Origin of Infracrustal (I-Type) Granite Magmas. Earth Environ. Sci. Trans. R. Soc. Edinb. 1988, 79, 71–86. [Google Scholar] [CrossRef]
  83. Sylvester, P.J. Post-Collisional Strongly Peraluminous Granites. Lithos 1998, 45, 29–44. [Google Scholar] [CrossRef]
  84. Collins, W.J.; Richards, S.W. Geodynamic Significance of S-Type Granites in Circum-Pacific Orogens. Geology 2008, 36, 559–562. [Google Scholar] [CrossRef]
  85. Yan, Q.-H.; Chi, G.; Wang, H.; Chen, C.; Zhou, K.; Liu, M. Sediment-Derived Granites as the Precursor of Rare-Metal Pegmatites in the Paleo-Tethys Tectonic Zone—Evidence from the Bailongshan Li-Rb-Be Pegmatite Ore Field and Factors Controlling Mineralization. Miner. Depos. 2025, 60, 743–764. [Google Scholar] [CrossRef]
  86. Kwékam, M.; Talla, V.; Fozing, E.M.; Tcheumenak Kouémo, J.; Dunkl, I.; Njonfang, E. The Pan-African High-K I-Type Granites from Batié Complex, West Cameroon: Age, Origin, and Tectonic Implications. Front. Earth Sci. 2020, 8, 363. [Google Scholar] [CrossRef]
  87. Chappell, B.W.; Bryant, C.J.; Wyborn, D.; White, A.J.R.; Williams, I.S. High- and Low-Temperature I-type Granites. Resour. Geol. 1998, 48, 225–235. [Google Scholar] [CrossRef]
  88. Potter, K.E.; Shervais, J.W.; Christiansen, E.H.; Vetter, S.K. Evidence for Cyclical Fractional Crystallization, Recharge, and Assimilation in Basalts of the Kimama Drill Core, Central Snake River Plain, Idaho: 5.5-Million-Years of Petrogenesis in a Mid-Crustal Sill Complex. Front. Earth Sci. 2018, 6, 10. [Google Scholar] [CrossRef]
  89. Blevin, P.L. Redox and Compositional Parameters for Interpreting the Granitoid Metallogeny of Eastern Australia: Implications for Gold-Rich Ore Systems. Resour. Geol. 2004, 54, 241–252. [Google Scholar] [CrossRef]
  90. Liao, X.-D.; Sun, S.; Chi, H.-Z.; Jia, D.-Y.; Nan, Z.-Y.; Zhou, W.-N. The Late Permian Highly Fractionated I-Type Granites from Sishijia Pluton in Southestern Inner Mongolia, North China: A Post-Collisional Magmatism Record and Its Implication for the Closure of Paleo-Asian Ocean. Lithos 2019, 328, 262–275. [Google Scholar] [CrossRef]
  91. Rollinson, H.R. Using Geochemical Data: Evaluation, Presentation, Interpretation; Longman Geochemistry Series; Longman Scientific & Technical [u.a.] Burnt Mill: Harlow, UK, 1993; ISBN 978-0-470-22154-9. [Google Scholar]
  92. Jafari, A.; Fazlnia, A.; Jamei, S. Mafic Enclaves in North of Urumieh Plutonic Complex: Evidence of Magma Mixing and Mingling, Sanandaj–Sirjan Zone, NW Iran. Arab. J. Geosci. 2015, 8, 7191–7206. [Google Scholar] [CrossRef]
  93. Ishihara, S. The Magnetite-Series and Ilmenite-Series Granitic Rocks. Min. Geol. 1977, 27, 293–305. [Google Scholar] [CrossRef]
  94. Dall’Agnol, R.; De Oliveira, D.C. Oxidized, Magnetite-Series, Rapakivi-Type Granites of Carajás, Brazil: Implications for Classification and Petrogenesis of A-Type Granites. Lithos 2007, 93, 215–233. [Google Scholar] [CrossRef]
  95. Wang, Z.-L.; Fan, J.-J.; Wang, Q.; Hu, W.-L.; Wang, J.; Ma, Y.-M. Campanian Transformation from Post-Collisional to Intraplate Tectonic Regime: Evidence from Ferroan Granites in the Southern Qiangtang, Central Tibet. Lithos 2022, 408, 106565. [Google Scholar] [CrossRef]
  96. Bingen, B.; Andersson, J.; Söderlund, U.; Möller, C. The Mesoproterozoic in the Nordic Countries. Episodes 2008, 31, 29–34. [Google Scholar] [CrossRef]
  97. Johansson, Å.; Waight, T.; Andersen, T.; Simonsen, S.L. Geochemistry and Petrogenesis of Mesoproterozoic A-Type Granitoids from the Danish Island of Bornholm, Southern Fennoscandia. Lithos 2016, 244, 94–108. [Google Scholar] [CrossRef]
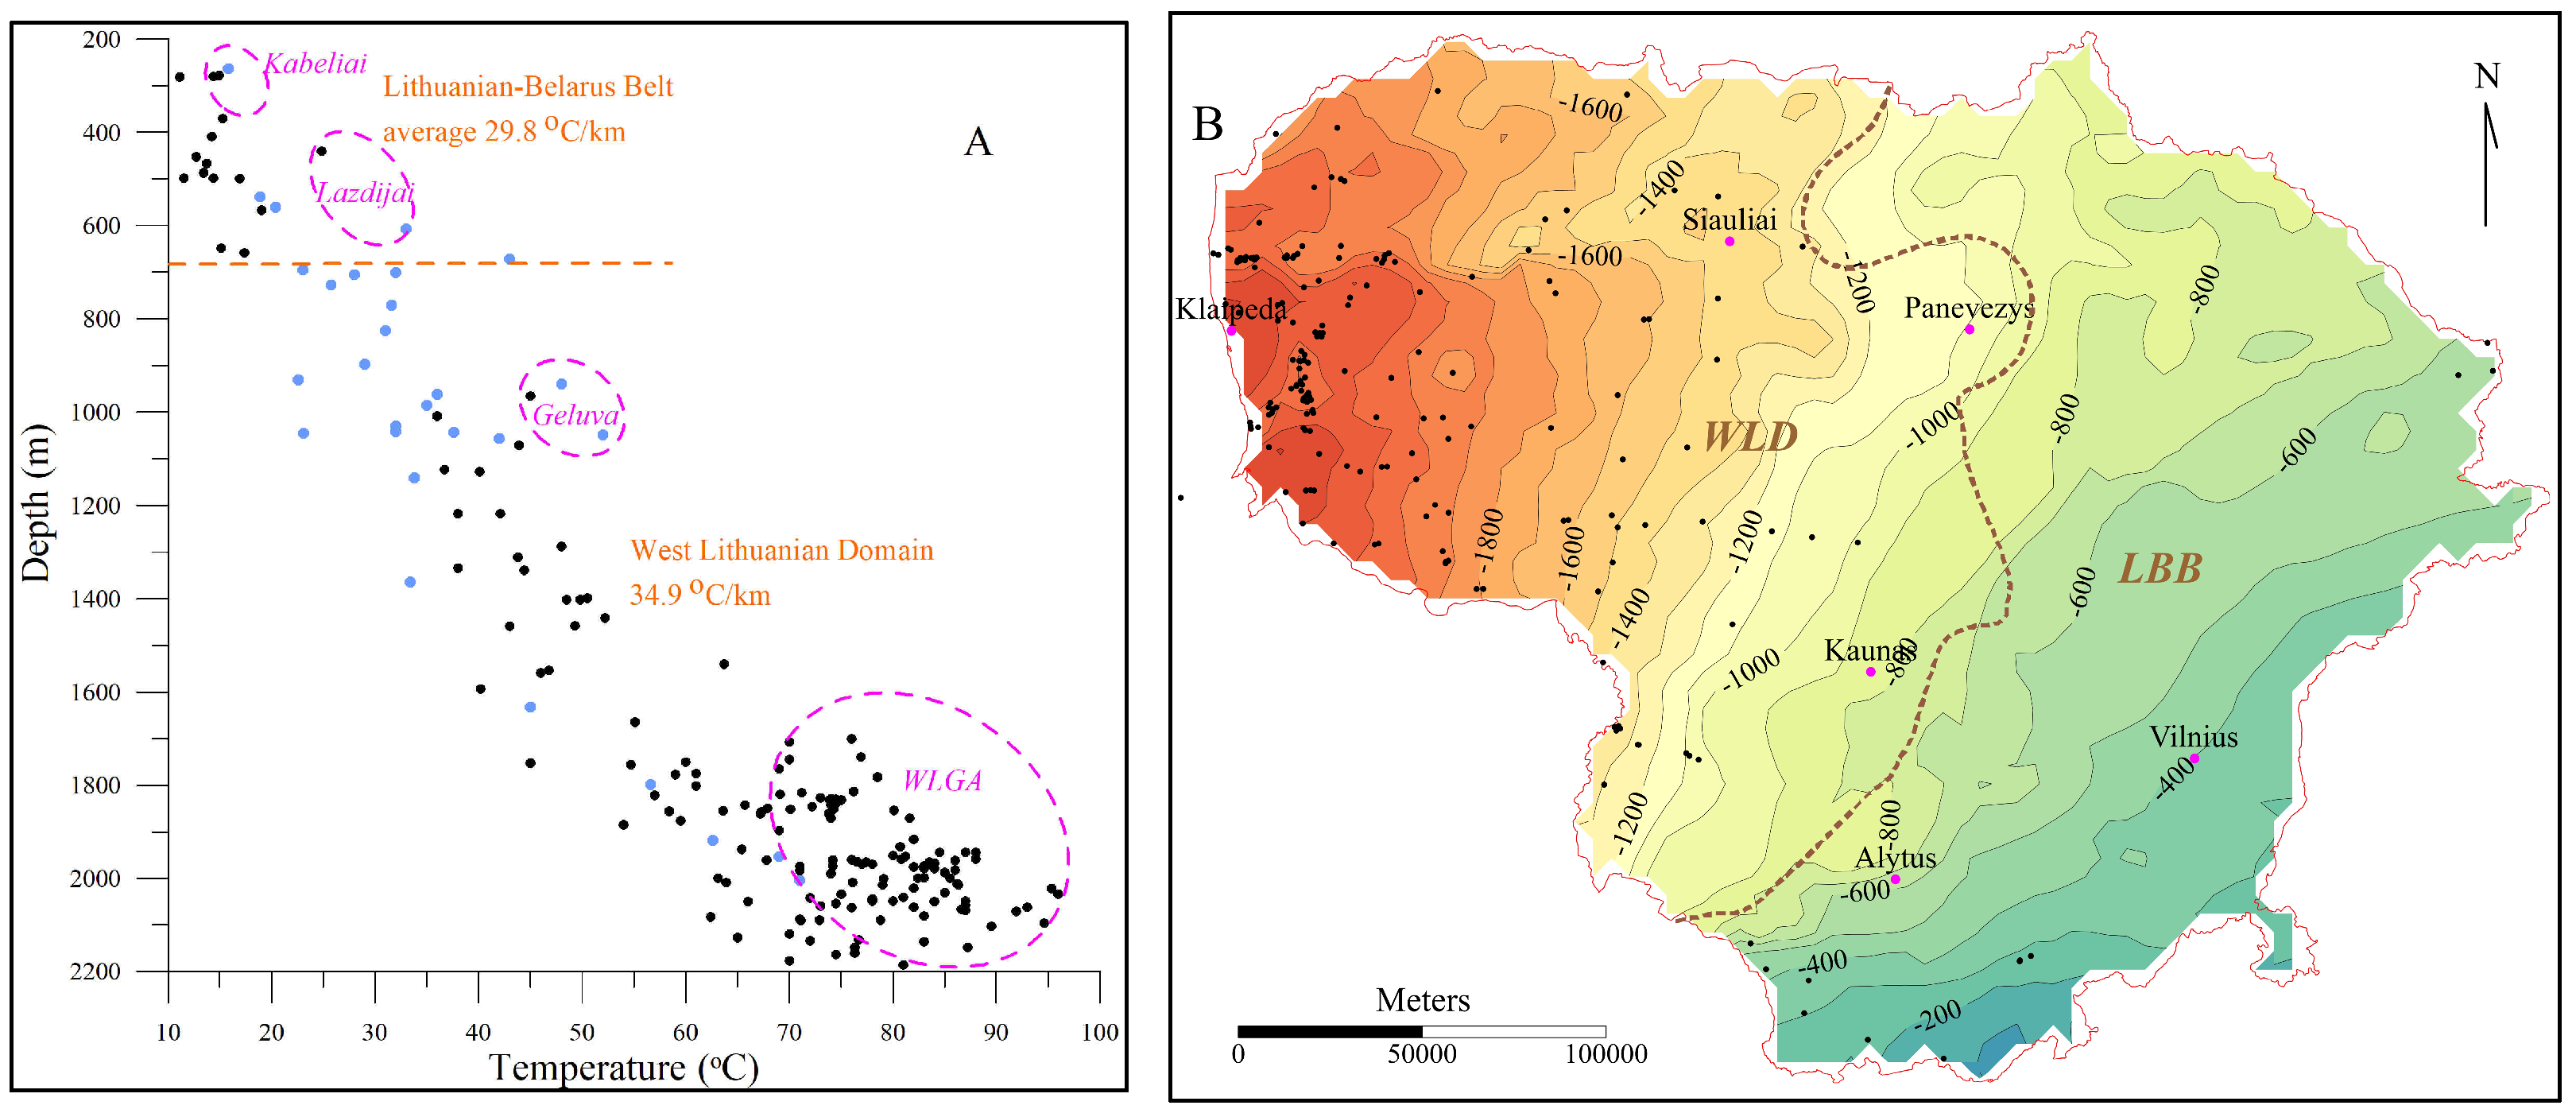
Figure 1. (A) Bottom temperature vs. depth of deep boreholes (N = 204), Lithuania. Average geothermal gradients are indicated (°C/km). Geothermal anomalies are marked (WLGA—West Lithuanian Geothermal Anomaly; Gėluva, Lazdijai, and Kabeliai). Bold dots show temperature of the top of the Cambrian reservoir or top of the underlying crystalline basement. Blue open dots show temperature measured in shallower boreholes (reaching Silurian and Ordovician sedimentary rocks). (B) Depth of top of crystalline basement, Lithuania. Boundary of major WLD and LBB blocks is shown (brown). Main cities are indicated on the map.
Applsci 15 10480 g001
Figure 2. Heat flow density (mW/m2). The West Lithuanian Geothermal Anomaly is delineated >70 mW/m2 (bright pink). The local anomalies are marked (pink). Sub-surface distribution of temperatures was measured in deep boreholes (black dots). The heat flow data were incorporated in the map [23,25,28]. WLD and LBB blocks are shown. Contour line spacing 10 mW/m2, dotted lines show important local variations in heat flow.
Applsci 15 10480 g002
Figure 3. Histogram-equalized grey scale image (illumination direction from SW) of the magnetic field and indicates boreholes drilled into Mesoproterozoic granitoids (N = 65 boreholes). Recent dating indicates four phases of activity shown on the map (marked in brown, green, red, and blue contour lines; dashed line records documented veins). Dating is discussed in the text. Undated intrusions are marked in yellow. The boundary of the West Lithuanian Domain (WLD) and Lithuanian–Belarus Belt (LBB) is shown. Polotsk shear zone is indicated on the map (green dashed line).
Applsci 15 10480 g003
Figure 4. Mesoproterozoic granitoids. (A) Total alkali vs. SiO2 diagramme [57] and alkalic/subalkalic divide after [56]; (B) SiO2 vs. Na2O + K2O-CaO variation diagram; boundaries between various rock series from [58].
Applsci 15 10480 g004
Figure 5. (A) A/CNK vs. A/NK (molar) diagram [60]; (B) FeO*/(FeO* + MgO) vs. SiO2 variation diagram; FeO*, total iron expressed as ferrous iron. Ferroan versus magnesian boundary (black line) from [58]; Kabeliai batholith is remarkable for by narrow cluster.
Applsci 15 10480 g005
Figure 6. Chondrite-normalized REE abundance of Mesoproterozoic granitoids, Lithuania (normalized after) [63]. WLD—blue samples, LBB—red samples.
Applsci 15 10480 g006
Figure 7. Heat production (µW/m3) of the crystalline basement rocks of Lithuania (sampled boreholes are indicated). Contour lines spacing 0.5–4.0 µW/m3. Anomalies exceeding > 4.0 µW/m3 are highlighted (moderate- and high-heat-producing granitoides are marked in brown; no contour lines are shown). Data of wells studied in southernmost Latvia are incorporated into the common map [25].
Applsci 15 10480 g007
Figure 8. Scatter diagram SiO2 vs. heat production of Palaeoproterozoic (black and white) rocks ranging from mafic to granites and Mesoproterozoic (pink and blue) granitoids (yellow cloud) (N = 336 samples). The regression lines are shown for LBB (dashed) and WLD (solid) clusters.
Applsci 15 10480 g008
Figure 9. (A,C,D) Diagrams show correlation of radiogenic heat production vs. U, Th, K2O; (B) SiO2 vs. K2O [65].
Applsci 15 10480 g009
Figure 10. (A) Ternary diagram shows weighted concentration of 9.52 × U*2.56 × Th*3.48 × K2O [Equation (1)]; symbols: WLS—blue, red—LBB; (B) diagram U vs. Th; symbols mark sampled intrusions.
Applsci 15 10480 g010
Figure 11. (A) Bouguer gravity (mGal); (B) magnetic (×100 nT) anomaly maps. The boundary between WLD and LBB is marked (pink line). Mesoproterozoic intrusions are indicated. The kinematic lineaments controlling intrusions are interpreted (insertion).
Applsci 15 10480 g011
Figure 12. Density vs. magnetic susceptibility of Palaeoproterozoic rocks of WLD (solid dots) and LBB (open dots). Two statistical trends of WLD and LBB are shown. Mesoproterozoic intrusions are marked in blue and pink dots.
Applsci 15 10480 g012
Figure 13. (A) Eu/Eu* vs. Ga/Al diagram for distinguishing granite types of S&I- and A-types. (B) Zr + Nb + Ce + Y vs. (Na2O + K2O)/CaO (discrimination after) [71].
Applsci 15 10480 g013
Figure 14. (A) Y/Nb vs. Rb/Nb diagram. (B) Y–Nb–Ce ternary diagram. A1: field for anorogenic; A2: field for post-collisional. Discrimination plots by [75].
Applsci 15 10480 g014
Figure 15. (A) (Na2O + Ka2O + FeOt + MgO + TiO2) vs. (Na2O + K2O)/(FeOt + MgO + TiO2) diagram and discrimination fields by [80]; (B) SiO2 vs. P2O5 diagram and I- and S-type granite trends by [81].
Applsci 15 10480 g015
Figure 16. (A) Rb vs. P2O5 diagram [81]; WLD and LBB trends are indicated; (B) Rb vs. Th [81]; (C) La vs. La/Yb; I-type and S-type trends are shown according to [90]; trends suggest source heterogeneity; (D) Sr vs. Ba; partition coefficients are from [91]. Symbols indicate particular intrusions; WLD and LBB trends are indicated; particular trend defined for Akmeniai intrusion (dashed line).
Applsci 15 10480 g016
Figure 17. Depth of top of the crystalline basement. No faults are shown on the map. “Hot” granitoids are defined and heat production is indicated (μW/m3). Palaeoprterozoic domains and average heat flow (mW/m2) are shown. Heat flow scale is inserted and shown on the map.
Applsci 15 10480 g017
Table 1. Dating of Mesoproterozoic intrusions documented in Lithuania (sorting by estimated age of granitoids).
BoreholeRockAge, MaMethod/
Laboratory
MineralReferences
Vėlaičiai-2granodiorite1625 ± 6U-Pb
LA-ICP-MS/SU *
zirconVejelyte et al., 2015 [36]
Genčiai-6granodiorite1622 ± 12U-Pb
LA-ICP-MS/SU *
zirconVejelyte et al., 2015 [36]
Svėdasai-252granite1569 ± 9U-Pb
SIMS/SU *
zirconVejelyte, 2012 [38]
Lazdijai-16Qtz monzodiorite1511 ± 5U-Pb
NORDSIM/MNH *
zirconSkridlaite et al., 2007 [39]
Marcinkon-4granite1505 ± 11U-Pb
TIMS/MNH *
zirconSundblad et al., 1994 [40]
Varėna-987granite vein1512 ± 13U-Pb
NORDSIM/MNH *
zirconSkridlaite et al., 2023 [41]
Dzūkija-6granite vein1497 ± 7U-Pb
NORDSIM/MNH *
zirconSkridlaite et al., 2023 [41]
Purmaliai-2granodiorite1469 ± 3TIMS/IPGG RAS *zirconMotuza, 2022 [24]
Ž.Naum.-4granite1462 ± 8TIMS/IPGG RAS *zirconMotuza, 2022 [24]
Vabalai-1granite1459 ± 3TIMS/IPGG RAS *zirconMotuza, 2022 [24]
Rukai-2Qtz monzodiorite1447 ± 8NORDSIM/MNH *zirconSkridlaite et al., 2007 [39]
Gėluva-99granite1445 ± 8NORDSIM/MNH *zirconSkridlaite et al., 2007 [39]
* Laboratories: MNH—Swedish Museum of Natural History in Stockholm (NORDSIM), Stockholm; IPGG RAS—Institute of Precambrian Geology and Geochronology, Sankt-Petersburg; SU—Seoul University.
Table 2. Geochemical summary of major-element oxides (wt%) of Mesoproterozoic granitoids. Comparison of Paleoproterozoic granodiorites and granites.
ElmSiO2Al2O3Fe2O3TMgOCaONa2OK2OTiO2P2O5MnO
West Lithuanian Domain
min58.9012.501.780.490.400.333.530.240.120.02
max74.5014.609.352.675.682.537.102.040.920.15
eve66.0513.625.691.482.351.975.700.860.460.06
Lithuanian–Belarus Belt
min48.6112.582.490.621.012.051.420.270.090.03
max73.0317.0914.525.748.793.966.942.760.950.35
eve60.2414.268.852.404.562.953.651.390.480.16
Paleoproterozoic granodiorites and granites
min59.257.380.840.240.751.200.540.050.030.01
max75.7322.7713.703.696.226.307.351.840.690.26
eve65.0315.006.541.723.322.753.560.870.220.13
Table 3. Geochemical summary of trace element (ppt), Mesoproterozoic granitoids.
ElemBaScCoCsGaHfNbRbSn
West Lithuanian Domain
min2031.82.90.517.73.69.7137.00.9
max131323.023.33.829.822.648.4408.08.0
aver94813.110.81.721.915.427.8296.23.4
Lithuanian–Belarus Belt
min2665.03.00.515.54.06.556.32.0
max462339.038.95.227.523.944.7425.17.0
aver113619.218.31.922.211.523.9176.53.8
ElemSrRbTaThTlUVZrY
West Lithuanian Domain
min581370.4140.10.91499.418.1
max370408138.52541.813.6157829117
aver17429612.084.130.65.27653664
Lithuanian–Belarus Belt
min138560.21.80.21.116129.617.1
max11814253.0106.71.36.9249915.799.6
aver3681761.024.51.23.611840552.4
Table 4. Geochemical summary of lanthanides (ppt), Mesoproterozoic granitoids.
ElmLaCePrNdSmEuGdTbDyHoErTmYbLu
West Lithuanian Domain
min50.210312.949.68.50.656.680.693.790.681.730.211.350.19
max290.271675.427042.34.9927.84.2822.74.1311.31.6911.41.65
aver15033838.214223.32.9517.092.3912.412.226.040.815.240.76
Lithuanian–Belarus Belt
min20.745.75.9423.15.51.085.10.694.030.661.950.231.550.24
max173380.943.1169.231.06.1422.13.2920.073.6610.691.388.71.28
aver101222.727.1103.317.73.2712.131.7910.621.945.570.724.560.66
Average∑REELREEHREERatio L/H(La/Yb)NEu/Eu*
WLD741.1691.349.813.923.20.15
LBB513.0471.741.311.417.20.22
Disclaimer/Publisher’s Note: The statements, opinions and data contained in all publications are solely those of the individual author(s) and contributor(s) and not of MDPI and/or the editor(s). MDPI and/or the editor(s) disclaim responsibility for any injury to people or property resulting from any ideas, methods, instructions or products referred to in the content.