Featured Application
A framework combining energy damage evolution and PSO-BP optimization enables accurate prediction of tunnel instability and support design, improving safety and guiding tunneling under complex geological conditions.
Abstract
This study focuses on tunnel construction in fault fracture zones and systematically investigates the energy evolution and damage catastrophe mechanisms of surrounding rock during excavation, based on energy conservation principles and cusp catastrophe theory. A tunnel instability prediction and support optimization framework integrating energy damage evolution and intelligent optimization algorithms was developed. Field tests, rock mechanics experiments, and Discrete Fracture Network (DFN) numerical simulations reveal the intrinsic relationships among energy input, dissipation, damage accumulation, and instability under complex geological conditions. Particle Swarm Optimization–Back Propagation (PSO-BP) is applied to optimize tunnel support parameters. Model performance is evaluated using the Mean Absolute Error (MAE), Mean Squared Error (MSE), Mean Absolute Percentage Error (MAPE), and R-squared (R2). The results show that upon reaching structural mutation zones, the system damage variable (ds), displacement, and dissipated energy increase abruptly, indicating critical instability. Numerical simulation and catastrophe feature analysis demonstrate that energy-related damage accumulation is effectively suppressed, the system damage variable decreases significantly, and crown stability is greatly enhanced. These findings provide a theoretical basis and practical reference for optimizing tunnel support design and controlling instability risks in complex geological settings.
1. Introduction
Faulted tunnels are generally characterized by low surrounding rock strength, loose structures, and well-developed joints and fissures, often leading to significant deformations and crown instability, which pose considerable challenges during construction [1,2]. Traditional approaches for analyzing crown stability mainly rely on elastoplastic mechanics or empirical numerical simulations. Although these methods can partially capture the stress–strain behavior of the surrounding rock, they are inadequate for accurately reflecting energy accumulation and abrupt changes prior to failure. In contrast, energy-based methods provide a novel perspective for investigating rock mass instability by revealing the intrinsic relationships among energy input, storage, and release during deformation, offering more reliable criteria for instability prediction [3]. In faulted tunnels, however, the energy evolution process is influenced by complex geological conditions, construction disturbances, and support systems, and the governing mechanisms remain unclear [4]. Therefore, systematic investigation of the deformation energy evolution and the development of predictive models for crown instability are essential. Moreover, integrating intelligent optimization algorithms enables the prediction and optimization of support parameters, providing both theoretical guidance and practical tools for engineering applications [5].
With the increasing attention to the nonlinear mechanical behavior of geotechnical materials in tunnel engineering, the applicability of traditional linear or simplified assumptions for evaluating surrounding rock stability has become increasingly limited. In this context, energy-conservation-based approaches have emerged as essential tools for analyzing and predicting the response of tunnel surrounding rock [6]. These methods systematically examine the input, storage, dissipation, and transformation of energy during tunnel excavation, thereby revealing the potential instability mechanisms of the surrounding rock and providing quantitative bases for stability assessment [7]. Building on this framework, catastrophe theory, as an effective theoretical approach for studying abrupt state transitions and nonlinear evolution in complex systems, can further elucidate the critical conditions and evolutionary pathways associated with the transition of surrounding rock from stable to unstable states. By analyzing energy variation characteristics and discontinuities in system response, catastrophe theory enables the identification of sudden failures triggered by minor perturbations that may be overlooked by conventional methods [8]. Leveraging the combined insights of energy conservation analysis and catastrophe theory, numerous studies have been conducted both domestically and internationally, yielding significant advances in theoretical modeling and numerical simulation, and providing a scientific foundation for engineering design and support optimization under complex geological conditions [9,10].
Catastrophe theory is a branch of topology that can model situations involving discontinuities or singularities, and it is widely applied in fields such as volcanology, sedimentology, and structural geology, as well as in modeling spatial or temporal discontinuities in other areas [11]. According to Hao Y et al. [12], a fluid-solid coupling model and strength reduction method were established based on catastrophe theory to study water inrush from concealed, confined karst caves. The analysis revealed that rock pillar instability, caused by disturbance and seepage stress, leads to catastrophic destabilization. Using the Qiyi Mine incident as an example, a safety thickness with a factor of 1.5 was proposed. The water inrush occurred due to the insufficient thickness of the rock pillar. This approach provides new methods for evaluating rock engineering stability. Li G [13] proposed an early-warning and support control method for deeply buried soft rock tunnels based on catastrophe theory and energy transfer, effectively optimizing reinforcement timing and parameters, reducing deformation and energy release, and enhancing tunnel stability. Zou Y [14] developed a model for calculating the safe thickness and predicting the failure time of karst tunnel roofs using catastrophe theory, successfully evaluating the effects of key factors on roof stability and validating the model’s accuracy and practicality. Yao Yi [15] utilized the principle of energy conservation and energy density visualization to analyze the energy evolution laws of the surrounding rock in the Chongqing Zhong liangshan karst tunnel under different cave-to-tunnel bottom distances, revealing the relationship between energy evolution, plastic zones, stress, and displacement. Zhao, Y et al. [16] used numerical simulations and cusp point mutation theory to analyze the instability of surrounding rock during tunnel excavation through a fault fracture zone, revealing how factors such as fault dip angle, strike angle, and thickness affect the timing and magnitude of instability, providing valuable insights for future engineering projects. Ref. [17] found that the failure mechanism of deep carbonaceous schist is mainly governed by weak cemented planes between laminae, with water content having a notable impact on energy evolution, while lamination orientation has a minimal effect. Liu Y [18], based on an elastic viscoplastic damage model, revealed the spatiotemporal evolution law of rock mass energy during deep tunnel excavation—characterized by “release–accumulation–re-release”—and proposed an energy-based control mechanism for rockbursts and large deformations. Yang HQ [19] introduced a simplified method based on damage evolution to predict excavation-induced damage zones in high-stress areas, effectively assessing tunnel stability. Deng XF [20] analyzed damage features of circular tunnels under blasting shock waves using UDEC simulations, showing that joint orientation significantly affects damage extent, and that bolt support can improve stability by altering vibration modes. Guo C [21] proposed an analytical model for progressive roof failure in shallow tunnels based on functional catastrophe theory, established a failure criterion, and validated the method through comparisons with deep tunnel predictions and physical model tests. Yang K [22] constructed an analytical model revealing that large deformation in soft rock tunnels is energy-driven, with surrounding rock energy transforming through elastic storage, plastic dissipation, and pressure work, while support deformation significantly enhances energy absorption—strongly influenced by support timing, tunnel size, and initial stress. [23]. Machine learning and optimization algorithms, as intelligent optimization and prediction methods, have been widely applied in various geotechnical engineering fields [24]. Li x et al. [25] establishes a geomechanical model to analyze surrounding rock deformation in full-section excavated tunnels, identifies critical indicators using the rough set algorithm, and develops a PSO-BP neural-network-based prediction model, demonstrating improved prediction efficiency and accuracy compared to numerical simulations and single BP networks, with results aligning well with field observations. Chen Z et al. [26] developed an intelligent support parameter prediction model based on tunnel background information, demonstrating that CLS-PSO-SVM and HRNet algorithms deliver high accuracy and promising application potential in tunnel intelligent design. Soranzo E [27] combined finite difference methods with reinforcement learning to replace manual support level selection in NATM, and experiments showed that the method could automatically optimize support schemes based on geological conditions, with performance improving as training progressed. Song S [28] developed an XGBoost model using drilling and blasting monitoring data for automatic classification and dynamic prediction of tunnel face surrounding rock, achieving 87.5% accuracy under small-sample conditions. Overall, significant progress has been made in analyzing tunnel surrounding rock stability through energy mechanisms, catastrophe theory, and intelligent optimization. Energy-based instability criteria and catastrophe theory have become research hotspots, with numerical simulations effectively illustrating energy evolution and damage accumulation. However, for complex geological conditions such as fault-fractured zones, more systematic research on energy damage evolution and instability mechanisms is still needed (Zhang T et al. [29]). This study develops a tunnel excavation model with weak interlayers, derives a stability criterion using catastrophe theory, and establishes a PSO-RBF optimization model to minimize support costs, showing that interlayer angle and thickness significantly impact surrounding rock displacement, with the PSO-RBF model reducing calculation and construction costs by 88% and 34.96%, respectively. Although significant progress has been made in surrounding rock stability analysis, the application of catastrophe theory, energy mechanism characterization, and intelligent optimization, several limitations remain. First, the study of energy evolution and instability mechanisms under complex conditions, such as fault-fractured zones, extreme stress environments, and multilayered heterogeneous geology, is still insufficient, and the applicability and robustness of existing models are limited. Second, current research on energy mechanisms primarily focuses on overall evolution, with insufficient investigation of local instabilities and micro-scale failure processes. Third, although intelligent methods have been preliminarily applied to support optimization and prediction, their deep integration with catastrophe theory and energy analysis remains inadequate, and their feasibility and real-time performance in field applications require further validation. Finally, despite the abundance of theoretical models and numerical simulations, experimental and in situ validations are still limited, resulting in some uncertainty regarding their practical guidance for engineering applications.
This study addresses the instability of crown surrounding rock in fault-fractured soft rock tunnels by proposing a quantitative prediction framework based on energy evolution and cusp catastrophe theory. Unlike previous studies that primarily focused on single mechanical indicators or numerical analyses, this work innovatively integrates the principle of energy conservation with cusp catastrophe theory, introducing new definitions of a “catastrophe criterion” and a “system damage variable” to achieve quantitative identification of the instability process. Meanwhile, the PSO-BP optimization method is incorporated to effectively couple the theoretical criterion with support design, establishing an integrated prediction and design model directly applicable to engineering practice. This research not only elucidates the intrinsic mechanism of deformation energy evolution in crown surrounding rock under complex geological conditions but also provides novel theoretical guidance and methodological support for safety control and support optimization in soft rock tunnels.
2. Project Overview and On-Site Testing
2.1. Engineering Project Overview
As shown in Figure 1a,b, the Shangshan Tunnel is located in Shangshan Village, Fengzhen City, Ulanqab, Inner Mongolia Autonomous Region, China. The tunnel has a total length of 2316 m, with a width of 13 m and a height of 11 m, classifying it as a large-section tunnel. It accounts for 6.7% of the entire route. The entrance and exit of the tunnel are integrated with the embankments, with the entrance located at DK37 + 587, the exit at DK39 + 903, and the center of the tunnel at DK38 + 745. As shown in Figure 1c,d, the geological conditions encountered by the tunnel are extremely complex, characterized by severely fractured surrounding rock with poor self-stability. The tunnel passes through an area with widespread weak surrounding rock and adverse geological features, leading to significant difficulties during excavation, such as crown collapses and damage to both sides of the tunnel. These issues have severely impacted the progress and safety of construction.
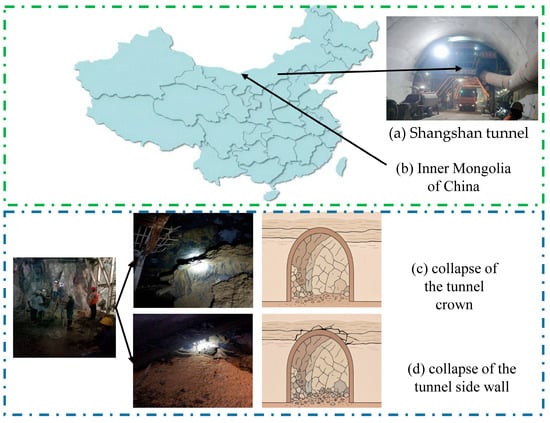
Figure 1.
Schematic Diagram of the Project Overview.
In addition, the tunnel face is affected by natural block shedding, and the self-stability is very poor. The surrounding rock is severely weathered and exhibits a loose, soil-like structure, making it highly prone to collapse and block disintegration during excavation. These unfavorable geological conditions pose significant risks to the tunneling process and complicate the construction. Therefore, it is essential to implement specialized support systems and protective technologies throughout the construction process to mitigate these challenges and ensure the smooth progress of the project.
2.2. Field Testing
This study employs three testing methods—borehole imaging, Ground Penetrating Radar (GPR), and the Elastic Wave Reflection Method (TSP) system—to conduct a multi-scale, in-depth investigation of the geological features of the tunnel’s surrounding rock. These methods are targeted at assessing borehole wall details, shallow structures ahead of the tunnel face, and deep elastic wave reflections, respectively, to evaluate the integrity of the rock, the distribution of fractures, and the presence of weak interbeds. The combined application of these techniques enables a comprehensive assessment of surrounding rock stability, providing a scientific basis for rational support design and construction risk management.
The borehole imaging detection results are shown in Figure 2a. Initially, the borehole wall remains relatively intact, with no major joints or fissures intersecting the surrounding rock. Although some minor joints do intersect parts of the surrounding rock, cementation remains good. As drilling progresses, sections of the surrounding rock intersected by larger joints and fissures appear, reducing the integrity and increasing the risk of borehole collapse. The joint orientation is 28°∠88°, forming an angle of 89° with the tunnel axis.
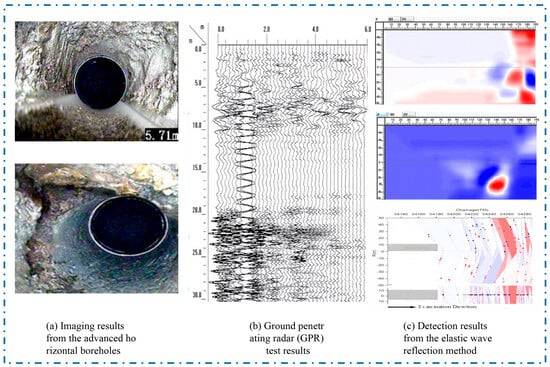
Figure 2.
Schematic Diagram of Field Testing Results.
The Ground Penetrating Radar (GPR) imaging detection is shown in Figure 2b. In the 0–10 m range ahead of the tunnel face, the rock mass is relatively intact, indicating good stability of the surrounding rock. However, between 10 and 30 m, local variations in reflection energy and discontinuous co-phase axes suggest poor continuity of the surrounding rock, with numerous fractures and joints present. The rock mass is fragmented, leading to poor self-supporting capacity and the potential presence of structural fractures.
The TSP system’s prediction results are shown in Figure 2c. The P-wave depth migration image reveals alternating positive and negative reflections between DK54 + 208 and DK54 + 230, with the intensity of the negative reflections significantly exceeding that of the positive ones, indicating a strong reflective interface in this segment. Both shear and longitudinal waves scatter and concentrate in this region, suggesting that the surrounding rock belongs to grade V, characterized by a highly fragmented rock mass with numerous weak interbeds and joints. The alternating positive (red) and negative (blue) reflections are clearly visible, with the negative reflections showing greater intensity than the positive ones. it is evident that a strong reflective interface exists between DK54 + 208 and DK54 + 230, where shear and longitudinal waves scatter irregularly, further indicating that the surrounding rock is of grade V, severely fragmented, with many weak interbeds and fractures.
When the tunnel face reaches the fault location at this mileage, the surrounding rock shows severe weathering, with brownish-yellow staining on the surface (Figure 1), well-developed joints and fissures, and wet rock surfaces. To further clarify the geological conditions ahead of the tunnel face, an integrated advanced geological forecast was conducted at this location using nondestructive geological radar detection, the TSP elastic wave reflection method, and advanced horizontal drilling techniques. The detection results (Figure 2) indicate that the surrounding rock ahead of the tunnel face is highly fragmented and severely weathered. Combining this with relevant geological data and core sampling analysis, the unfavorable geological section ahead of the tunnel face is identified as a fault zone characterized by intense rock fragmentation.
2.3. Testing the Mechanical Characteristics of Tunnel Surrounding Rock
In this study, a variety of rock samples were collected to comprehensively evaluate the physical and mechanical properties of rocks in tunnel engineering. A series of mechanical tests were conducted in the laboratory (as shown in Figure 3). The specific testing methods and procedures are as follows:
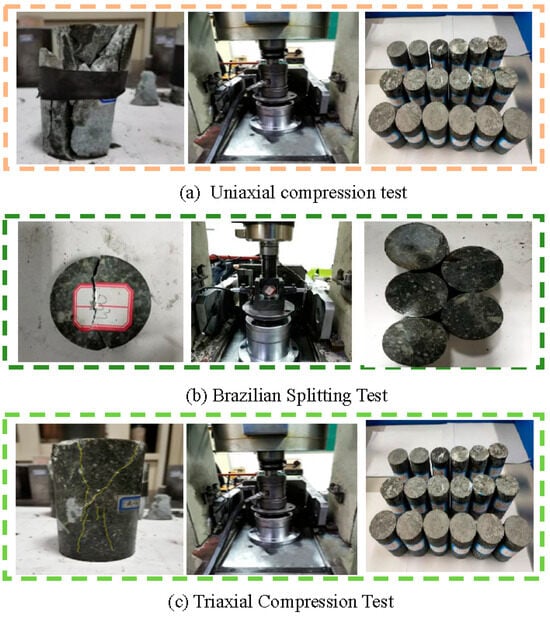
Figure 3.
Schematic diagram of the rock mechanics test.
Uniaxial Compression Test (Figure 3a): The uniaxial compression test was performed on rock samples using the RMT150B Triaxial Rock Mechanics Testing System. At least nine specimens were tested for each rock type. This test primarily measures the rock’s elastic modulus and Poisson’s ratio. As shown in Figure 3a, the sample reaches the yield state and experiences splitting failure, which is critical for assessing the deformation behavior and elastic properties of the rock, especially in tunnel excavation and support design.
Brazilian Splitting Test (Figure 3b): Approximately twelve saturated specimens of each rock type underwent the Brazilian splitting test to determine the rock’s tensile strength. This method is particularly suitable for rocks with well-developed fractures and effectively evaluates the rock’s resistance to crack propagation under tensile stress. As shown on the left side of Figure 3b, the sample undergoes tensile splitting failure.
Triaxial Test (Figure 3c): Saturated tuff samples were subjected to triaxial tests with 3 to 4 different confining pressure levels. At least three specimens were tested at each pressure level. The triaxial test provides data on the rock’s stress–strain behavior under different confining pressures. As shown in Figure 3c, the rock experiences brittle failure, which helps analyze the rock’s strength parameters and assess the stability of the surrounding rock under actual tunnel excavation conditions.
Through this series of experiments, As shown in Table 1 we obtained the basic mechanical parameters of the rock, providing accurate experimental data and scientific basis for tunnel design, support optimization, and construction risk assessment. Additionally, by combining experimental results with an analysis of engineering geological conditions, the GSI classification method and Hoek-Brown criterion were used to estimate the strength of the rock mass. Based on the test data, the mechanical parameters for different regions were appropriately adjusted, thus deriving the rock mass strength parameters required for field application. These mechanical parameters provide important theoretical support and practical references for support design, construction plan selection, and risk management during tunnel excavation.

Table 1.
Rock mechanical parameters.
3. Tunnel Energy Catastrophe Identification Criterion
3.1. Energy Conversion and Conservation Analysis in Tunnel Excavation Process
Under the influence of various external factors such as forces, displacements, and temperature, the tunnel system undergoes an evolutionary process from deformation to instability. This process essentially involves dynamic energy input, transmission, and transformation. The surrounding rock and support structures not only act as storage and converters of energy but also serve as media for energy transfer. Part of the input energy is stored as elastic strain energy, another part is released as dissipated energy through surrounding rock deformation and failure, while a small portion converts into kinetic energy, manifested as sudden deformation or collapse of the surrounding rock and other dynamic failures. The entire system maintains a dynamic energy balance with the external environment, and its energy conservation relationship is expressed by Equation (1) [30].
In this equation, stands for the total work carried out by the tunnel system, while , , and represent the elastic-plastic strain energy, dissipated energy, and kinetic energy of the tunnel system, respectively. The dissipated energy encompasses various forms, including apparent energy, thermal energy, and radiated energy.
When applying the FLAC3D6.00.69 finite difference method for numerical analysis of the tunnel system, if only the stability of the surrounding rock under self-weight stress is considered, it is reasonable to ignore the impact of external loads, environmental temperature, electromagnetic radiation, and other factors. In such cases, the total energy input into the tunnel system can be approximated as the mechanical work performed by the self-weight stress of the surrounding rock, meaning . Therefore, the energy conservation equation for the tunnel system can be simplified as follows [30]:
In the formula, represents the mechanical work carried out by the tunnel system due to self-weight stress, also called the reduction in gravitational potential energy; that is, the decrease in gravitational potential energy after tunnel excavation deformation relative to its initial state. , and denote the differences between the initial (“start”) and final (“end”) values from the beginning of self-balancing to the stable terminal state. Initially, there is no kinetic energy or dissipated energy (i.e., initial values are zero), which can be calculated using the following formula:
Substituting Equation (3) into Equation (2), the total change in dissipated energy of the tunnel system at any time ttt during the sliding deformation process can be expressed as in Equation (4):
In the formula, v0 and vt represent the total volumes of the tunnel system at the initial state and at any time t during the sliding deformation process, respectively; , and denote the elastic strain energy density, gravitational potential energy density, and kinetic energy density of any unit element within the tunnel surrounding rock, respectively. The parameters, , and of the element can be represented as follows:
In the formula, , , and represent the principal stresses in the three directions of the unit element; (for i = 1, 2,) are the elastic strains in the respective principal stress directions; Ei and vi are the elastic modulus and Poisson’s ratio corresponding to each principal stress direction; p and Vi represent the density and volume of the element, respectively; v and h represent the velocity and height at the center of mass of the element, respectively.
In the tunnel system, the damage and failure of local rock masses primarily manifest as energy dissipation. This study defines the unit damage variable du [31] for any unit element within the system during excavation disturbance as the ratio of dissipated energy to the releasable strain energy of that unit during the deformation and instability process.
Tunnel excavation is a continuous disturbance process. As the tunnel is progressively excavated, the surrounding rock mass is continuously disturbed, leading to stress redistribution, which in turn causes the gradual accumulation of damage and deformation in the rock mass, eventually resulting in local rock failure. In this process, the factors influencing rock mass failure and deformation are not only related to the energy of excavation disturbance but are also closely connected to the geometric characteristics of the rock mass and the excavation length. Therefore, in order to more accurately describe the damage evolution of each element during the tunnel excavation process, a length influence factor l is introduced into the expression for the unit damage variable du.
Furthermore, when a time factor is introduced, the length influence factor LLL can be expressed as l(t), allowing for the observation of the changes in the unit damage variable dududu over different excavation times. Specifically, as the tunnel is progressively excavated, the damage and deformation of the rock mass are influenced not only by the excavation length but also by the excavation time. As excavation time progresses, the response of the rock mass may exhibit different time-dependent characteristics. Therefore, it is necessary to incorporate the time-dependent influence factor l(t)) into the model to fully reflect the impact of time on damage evolution. In this way, the unit damage variable dududu not only considers the influence of excavation length on damage but also integrates the damage evolution process of the rock mass over different excavation times, providing a more accurate reflection of the local damage development during tunnel excavation.
In summary, by introducing the time factor l(t), it is possible to more precisely simulate and predict the dynamic response of the rock mass under different excavation progressions. This also provides more reliable support for tunnel excavation design and safety monitoring, thus improving the safety and cost-effectiveness of tunnel engineering.
In the formula, , , , respectively, represent the elastic strain energy density, kinetic energy density, and gravitational potential energy density of the unit element in its initial state. , , , respectively, represent the elastic strain energy density, kinetic energy density, and gravitational potential energy density of the unit element at any given moment during the deformation process.
Similarly, the ratio of the total energy dissipated by the system during tunnel excavation disturbance, , to the releasable strain energy of the tunnel system, , can be defined as the system damage variable ds [31], that is:
Tunnel excavation is a continuous disturbance process. As excavation progresses, the energy within the tunnel system constantly changes, causing the stress and deformation states of the surrounding rock mass and media to evolve accordingly. In this process, the factors affecting the damage and deformation of the tunnel system not only include the energy generated by the excavation disturbance but also involve the tunnel’s geometric characteristics, excavation speed, and the length of the excavation process. To more accurately describe the overall damage evolution of the tunnel system, a system damage variable ds is introduced, and the excavation length impact factor l is incorporated into the expression of this variable.
Furthermore, after introducing the time factor, the length impact factor lll can be expressed as l(t), allowing for the calculation of the system damage variable dsdsds at different excavation times. Specifically, as the tunnel is progressively excavated, the excavation length impact factor l(t) plays a significant role in the accumulation of system damage and energy dissipation. The excavation length impact factor l(t) can be used to quantify the effect of excavation progress and tunnel scale on the overall system damage at different excavation times. Based on the previous definition, the system damage variable ds can be expressed as formula (9), which includes a correction term for the l(t) factor. In this way, the system damage variable not only reflects the ratio of energy dissipation to releasable strain energy during the excavation disturbance process but also integrates the impact of tunnel geometric features, excavation depth, and time progression on the overall system damage, providing a more comprehensive perspective to describe the damage development of the tunnel system during excavation.
3.2. Cusp Catastrophe Model of Tunnel System
The standard form of the potential function in cusp catastrophe theory is expressed as follows: [32]:
In the function of cusp catastrophe theory, q and v are control variables, and q is the state variable. By taking the derivative of Equation (9), the corresponding equilibrium equation can be obtained as [32]:
As illustrated in Figure 4, the cusp catastrophe model can be divided into three regions from bottom to top, creating a curved, folded surface with a lower sheet, middle sheet, and upper sheet. Each region represents a distinct state: the upper and lower sheets correspond to stable equilibrium states, while the middle sheet represents an unstable state. By differentiating the model function, the set of points that satisfy the singularity condition can be determined.
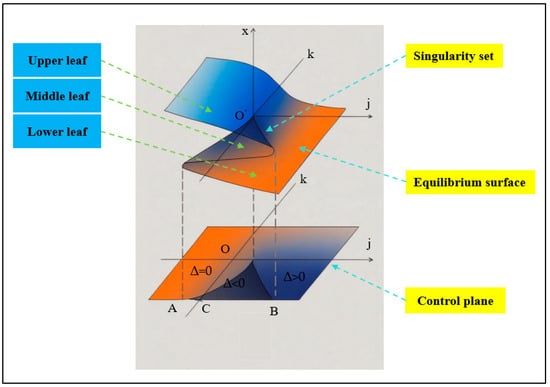
Figure 4.
Equilibrium Surface and Control Surface diagram.
At this stage, when is taken into account, singular points occur where the vertical tangent of the equilibrium equation intersects the curve. The number of singular points depends on the number of equilibrium positions along the curve. By solving the equations together and eliminating q, the following expression is derived:
At this point, when condition is met, singular points are obtained where the vertical tangent in the equilibrium equation intersects the curve. The number of singular points depends on the number of equilibrium positions along the curve. By simultaneously solving equations and , and eliminating q, the following expression can be derived:
Establishment of Tunnel Instability Catastrophe Model Based on Cusp Catastrophe Theory
Cusp catastrophe theory can effectively identify sudden instability phenomena during tunnel excavation caused by factors such as weakening of surrounding rock strength, geostress disturbances, or delayed support. By establishing a mathematical model with displacement as the state variable and surrounding rock parameters and excavation disturbances as control variables, this theory reveals the intrinsic mechanism of the tunnel surrounding rock system transitioning from multistability to catastrophic instability. It can predict sudden deformations occurring at a critical excavation depth or under specific conditions, providing a theoretical basis for forecasting instability precursors.
Combined with Flac3D finite difference software for numerical simulation, by writing Fish scripts and using Extra functions to convert energy or directly monitoring energy changes in model elements, precise calculation and dynamic tracking of energy evolution during tunnel excavation can be realized, thus deepening the understanding of the energy mechanisms behind surrounding rock instability.
To determine the sudden change in the stability of surrounding rock during tunnel excavation, the energy of the surrounding rock after excavation steps can be expressed as:
In the equation: and N represent the change in dissipated energy density of a certain yield unit in the tunnel system after the excavation, and the number of good system units after the excavation, respectively. (The displacement follows the same formula.) Assume that is expanded into a Taylor series with respect to up to the fourth-order term.
The real-valued and complex-valued functions established to simplify calculations are transformed using the Laplace transform. Letting , , the resulting relationship is:
The relationship between ui and vi is:
Dividing both sides by b4 simultaneously, the standard form of the cusp catastrophe model function can be obtained as:
Since d is a constant in the equation, it can be simplified as:
where a and b are defined as:
According to the critical instability criterion of cusp catastrophe theory, by differentiating and when , , the following can be obtained:
At this point, based on the above instability judgment principle of cusp catastrophe theory, the sudden change in dissipated energy during tunnel excavation can be determined through . When > 0, the system is stable; when < 0, the system is unstable; and when = 0, the system is in a critical state.
4. Energy Evolution Law of Tunnel Crown Surrounding Rock Deformation
This study employs Fast Lagrangian Analysis of Continua in 3 Dimensions (FLAC3D) FLAC3D is a three-dimensional numerical simulation software based on the finite difference method, widely used in geotechnical and underground engineering to analyze the mechanical behavior of soils and rock masses. combined with the DFN module to construct a numerical model coupling the discrete fracture network with the continuum mesh. First, the DFN module generates fracture networks that accurately reflect the spatial distribution, scale, and connectivity of fractures consistent with actual geological characteristics. Then, interface elements are used to simulate the mechanical behavior of fracture surfaces, achieving mechanical coupling between the fractured medium and the surrounding rock mass. This effectively captures the influence of fractures on the overall mechanical response, providing a numerical basis for stability analysis and support optimization.
As shown in Figure 5, the model adopts a horseshoe-shaped tunnel structure, considering the field profile, mesh size, and the effects of joints. The tunnel has a height of 11 m and a width of 13 m. To account for excavation factors, the model dimensions are set to 4–5 times the tunnel diameter in the X-direction and 4 times in the Y-direction, resulting in a model size of 100 × 100 × 131 m (X, Y, Z). Displacement constraints are applied in the X-direction on the two side faces, in the Y-direction on the front and back faces, and self-weight stress due to burial depth is considered on the top surface. Displacement constraints are also applied in the X, Y, and Z directions on the bottom surface. The introduction of the DFN module further enhances the representation of fracture effects, improving the realism and accuracy of the model.
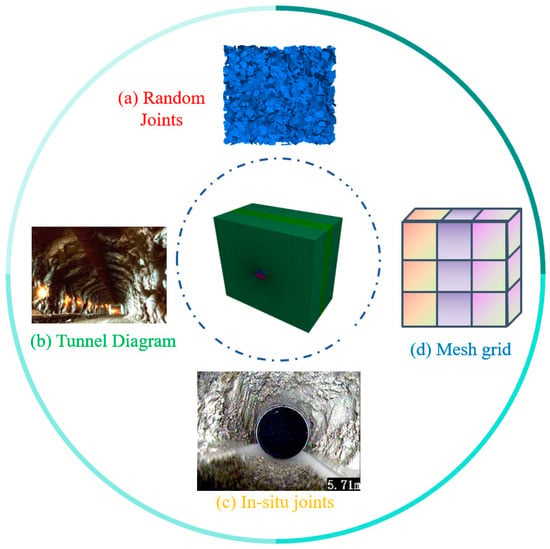
Figure 5.
Numerical Calculation Model.
4.1. Tunnel Deformation Analysis
After the tunnel passes through the fault fracture zone, the overall structure of the surrounding rock is significantly weakened, and mechanical parameters change drastically, resulting in noticeably increased excavation displacements. The rock mass in the fault zone is loose and has reduced strength, which easily leads to the formation of shear slip zones, causing intensified radial convergence of the tunnel and subsidence of the crown. Numerical simulations show that displacements within the fault zone surrounding rock far exceed those in intact rock masses and develop more rapidly. As shown in Figure 6, displacement in the z-direction reaches 21.6 cm, while displacements in the x-direction are 15.9 cm and 16.0 cm, respectively, indicating large deformations induced by excavation through the fault zone.
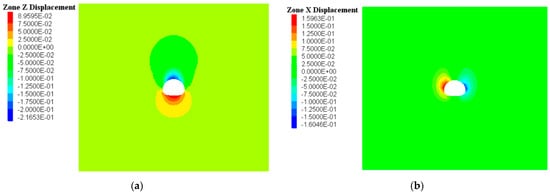
Figure 6.
Displacement Contour Map during Tunnel Excavation to the Fault Zone; (a) Z-direction displacement during Excavation Reaching the Fault Zone; (b) X-direction displacement during excavation Reaching the Fault Zone.
4.2. Comparative Analysis of Plastic Zones and Dissipated Energy
After the tunnel passes through the fault fracture zone, the surrounding rock experiences abrupt stress changes, resulting in a significant expansion of the plastic zones. During the initial excavation phase, localized shear failure appears on both sides of the fault, followed by the plastic zone extending asymmetrically along the fault toward the crown and sidewalls. Numerical simulations indicate that the plastic damage is primarily shear-dominated, with local tensile failures. The dissipated energy within the fault zone is significantly higher than that of the intact surrounding rock and accumulates progressively with excavation. At the intersection of the fault and the tunnel, the dissipated energy locally reaches a peak, reflecting concentrated energy release and intensified damage. In Figure 7, the maximum dissipated energy on both sides of the tunnel reaches 1.12 MJ/m3.

Figure 7.
Plastic Zone and Dissipated Energy Contour Maps during Tunnel Excavation to the Fault Zone; (a) Plastic Zone Contour Map during Excavation to the Fault Zone; (b) Dissipated Energy Contour Map during Excavation to the Fault Zone.
4.3. Tunnel Energy Damage Analysis
During tunnel excavation, the surrounding rock is significantly disturbed by construction activities, causing the original stress field of the rock mass to undergo severe disturbance. Internal stresses redistribute, leading to non-uniform accumulation and sudden release of strain energy. As the excavation face advances, localized regions of the rock mass gradually enter a nonlinear failure stage, with the mechanisms of energy transmission, conversion, and dissipation within the rock mass becoming increasingly complex, exhibiting distinct non-elastic behavior and damage evolution characteristics, as shown in Figure 8. As tunnel excavation progresses, the values of ds are 0.21, 0.51, and 0.64, 0.72. Analysis indicates that as excavation progresses into the fault zone, energy dissipation significantly increases, leading to increased damage.
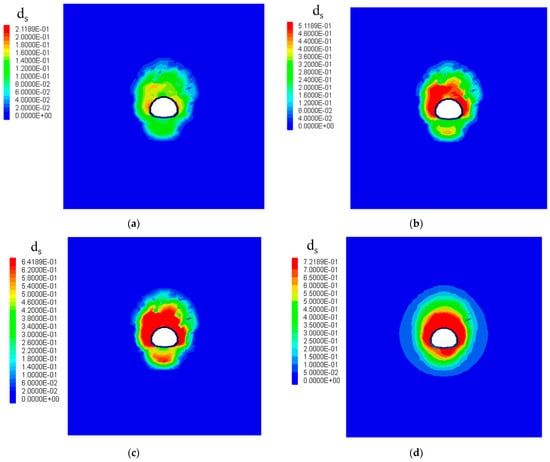
Figure 8.
ds Contour Maps during Tunnel Excavation to Different Zones; (a) ds Contour Map of Tuff Excavation; (b) ds Contour Map after Completion of Tuff Excavation; (c) Initial ds Contour Map during Fault Excavation; (d) ds Contour Map at 5 m Fault Excavation.
4.4. Tunnel Hazard Prediction Based on Cusp Catastrophe Theory
Cusp catastrophe theory is an important mathematical tool used to describe non-linear sudden change phenomena and is widely applied in fields such as geological hazards, engineering mechanics, and complex system analysis. By implementing cusp catastrophe theory calculations using Python 3.11, as shown in Figure 9 and Table 2, the computed result is Δ < 0, indicating that the tunnel experiences a catastrophic failure when excavated into the fault zone. This corresponds well with the on-site conditions.
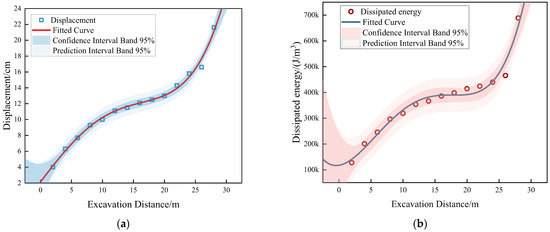
Figure 9.
Schematic Diagram of Displacement and Dissipated Energy Mutation Fitting; (a) Schematic Diagram of Displacement Mutation; (b) Schematic Diagram of Dissipated Energy Mutation.

Table 2.
Calculation Results of Cusp Catastrophe Theory.
5. Development of an Intelligent Tunnel Support System Based on Catastrophe Theory
As tunnel engineering advances toward larger scales and more complex geological conditions, traditional support design methods that rely on empirical formulas and numerical simulations are increasingly showing limitations in addressing sudden instabilities and nonlinear responses. To enhance the scientific rigor and intelligence level of support design, this study proposes an intelligent tunnel support approach that integrates catastrophe theory with data-driven optimization. This method employs cusp catastrophe theory to identify the critical state of surrounding rock instability, enabling the detection of potential catastrophic risks. Simultaneously, machine learning algorithms are introduced to establish a nonlinear mapping model between support parameters and stability. By coupling instability risk assessment with support design analysis, the method enables rapid prediction and precise optimization of support structures under complex conditions, providing intelligent and efficient decision-making support for high-risk tunnel projects. The construction flowchart of the intelligent tunnel support prediction system is shown in Figure 10.
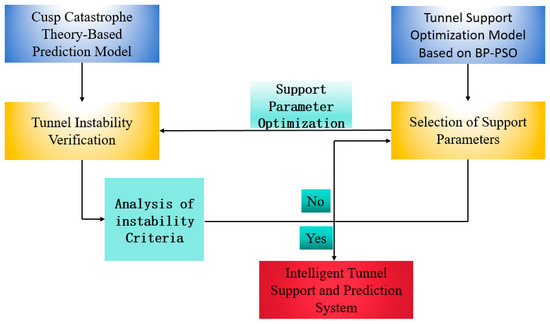
Figure 10.
Flowchart of Tunnel Intelligent Support Prediction System Construction.
5.1. Algorithm Introduction
5.1.1. BP Neural Network
As shown in Figure 11 the BP neural network excels at handling complex nonlinear relationships and can accurately predict tunnel stability by learning nonlinear patterns from sample data. Its fundamental unit is the neuron, which processes input signals through an activation function. The output of each layer is formed by applying a nonlinear activation function to a linear combination of the outputs from the previous layer.
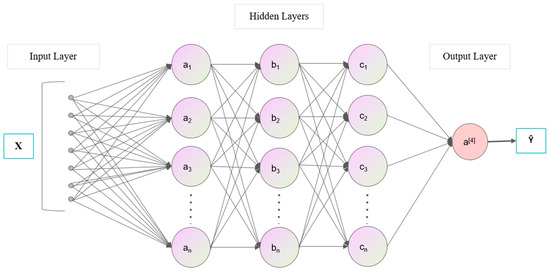
Figure 11.
Schematic Diagram of the BP Neural Network.
For a single-layer neural network, the output
In the equation: denotes the input feature vector; represents the weight matrix; stands for the bias term; and denotes the activation function.
Through layer-by-layer calculation by the feedforward neural network, the final output is a stability prediction value.
After feature selection is complete, the selected important features are input into the neural network model for further non-linear modelling. The task of the neural network is to learn complex non-linear relationships and, through training, enable the model to accurately predict future tunnel safety factors.
Assume that the selected feature vector contains P features. The basic output calculation formula for neural networks is:
In the formula: is the weight matrix of the i-the layer; is the bias term of the i layer; is the activation function; is the output of the neural network.
5.1.2. PSO Algorithm
PSO is a global optimization technique rooted in swarm intelligence, introduced by Kennedy and Eberhart in 1995. The algorithm simulates the social behavior of bird flocks foraging or fish schools swimming, enabling individuals within the group (i.e., particles) to collaborate in searching for the optimal solution, demonstrating excellent performance in solving complex optimization problems.
Specifically, particles are updated in each iteration through velocity and position update formulas, continuously adjusting their velocity and position to reach the current optimal position, ultimately obtaining the global optimal solution. The velocity and position update formulas for particles are:
In the formula: Vn(m) is the velocity of the nth particle at the mth iteration, Xn(m) is its position; c1 and c2 are acceleration constants; r1 and r2 are random numbers between [0, 1]; Px(m) is the current position of the particle at the mth iteration, and Py(m) is its optimal position.
5.2. Establishment of the PSO-BP Model
A neural network is a multi-layer feedforward model utilizing error backpropagation. During training, the input signal passes through a nonlinear function in the hidden layer to generate an output. If the output deviates from the expected value, the weights and thresholds are adjusted through gradient descent to minimize the error and optimize the model. However, traditional BP networks face challenges such as slow convergence, sensitivity to local minima, and difficulty in parameter tuning, making them less effective for real-world prediction tasks. To overcome these issues, this paper introduces the PSO algorithm, which employs collective search to quickly approximate the optimal solution, thereby improving the BP network’s performance. Figure 12 illustrates the computational process and optimization steps of the PSO-BP algorithm.
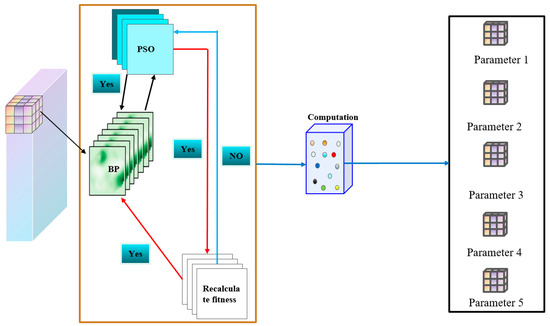
Figure 12.
Flowchart of PSO-BP Algorithm.
1. Determine the structure of the BP neural network
First, determine the structure of the BP neural network, which includes the number of nodes in the input layer, output layer, and hidden layer.
2. Initialize PSO algorithm parameters
(1) Initialization of the particle swarm:
Each dimension of the particle corresponds to the weights and thresholds of the BP network.
Particles are randomly generated within the search space of weights and thresholds.
(2) Parameter settings:
Number of particles N, maximum iteration count T;
Inertia weight ω, learning factors c1, c2;
Initial velocity and position.
3. Calculate the fitness function
(1) Assign the weights and thresholds represented by the particles to the BP neural network;
(2) Use the BP network to predict the training data and calculate the value of the objective function as the fitness.
4. Update the particle’s position and velocity
Update the position and velocity of each particle based on the PSO algorithm.
5. Check convergence conditions
(1) Determine whether the algorithm has converged based on changes in the fitness value:
(2) Terminate optimization when the change in fitness is less than the set threshold or the maximum iteration count is reached.
6. Output the optimal solution
(1) The BP network weights and thresholds corresponding to the optimal solution.
(2) Use the optimized BP network to predict and evaluate the tunnel support scheme, and output the optimized support design parameters.
5.3. Calculation Method
To achieve intelligent optimization and safety assurance of tunnel support parameters, this study proposes a combined model PSO-BP based on PSO and BP. This model combines the non-linear mapping capabilities of BP networks with the global search advantages of PSO to improve training accuracy and convergence speed, thereby achieving efficient optimization design of support structures. Under fixed conditions such as known rock mass conditions, ground stress, and pore pressure, the BP network fits the ‘support parameter-mechanical response’ relationship. Combined with the PSO algorithm, it optimizes the optimal combination of anchor rod length, spacing, and sprayed concrete thickness based on multiple objectives such as deformation displacement, dissipated energy, kinetic energy, and maximum shear strain, balancing safety and economy. This study’s input parameters include anchor rod length (2, 3, 4 m), spacing and spacing (0.8, 1, 1.2 m), and sprayed layer thickness (8–16 cm) see Table 3, corresponding to displacement, dissipated energy, kinetic energy, and shear strain. And the test samples are shown in Table 4.

Table 3.
Support Scheme.

Table 4.
Test Samples.
5.4. Algorithm Validation and Analysis
- (1)
- Fitness Curve Analysis
PSO as an optimization algorithm, can effectively compensate for the limitations of traditional neural networks when combined with them. In this context, the loss function value of the neural network represents a univariate optimization trajectory, directly describing the variation in the objective function. In contrast, the fitness curve in evolutionary algorithms reflects the overall evolutionary trend of the population. Therefore, a specific fitness curve may not always be present. As shown in Figure 13, the optimal fitness value was achieved after 32 iterations.
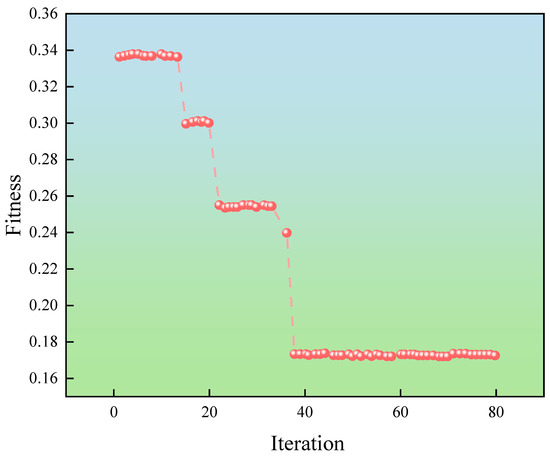
Figure 13.
Fitness Curve.
- (2)
- Algorithm Evaluation
MAE measures the average absolute difference between predicted and actual values, serving as a key metric for evaluating model accuracy. By optimizing weights and thresholds, the PSO-BP model effectively reduces MAE enhancing prediction stability and minimizing fluctuations due to random initial values. MSE gives greater weight to larger errors, emphasizing the impact of extreme deviations. The PSO-BP model utilizes swarm intelligence to search for the global optimum, significantly lowering MSE, improving robustness to outliers, and overcoming the local minimum issue typically faced by traditional BP networks due to gradient vanishing. MAPE measures relative error in percentage terms, allowing for comparisons across different scales. With a MAPE below 10%, the PSO-BP model demonstrates strong generalization capability. R2 indicates the proportion of variance explained by the model, with values closer to 1 signifying a better fit. As illustrated in Figure 14 and supported by Table 5, the R2 diagram confirms the PSO-BP algorithm’s excellent predictive performance.
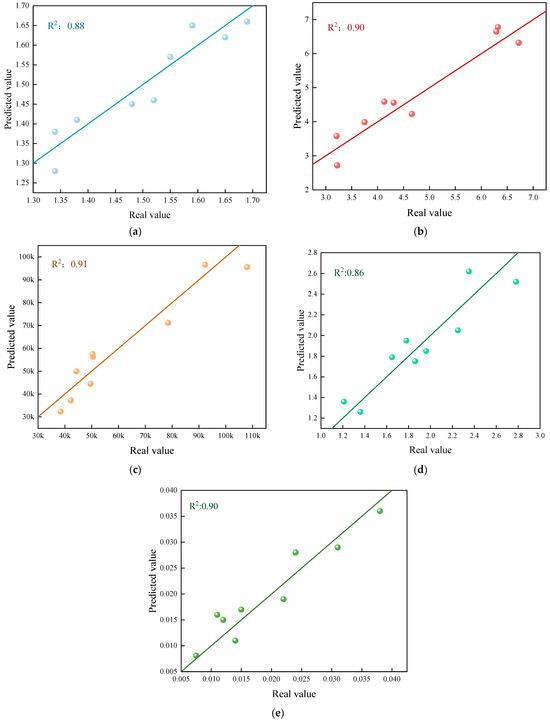
Figure 14.
Fitting degree diagram; (a) R2 Diagram of Safety Factor; (b) R2 Diagram of Crown Displacement; (c) R2 Diagram of Dissipated energy; (d) R2 Diagram of Springline Region; (e) R2 Diagram of Max shear increment.

Table 5.
Test Results.
In Equations (26)–(29)
: Sample Size;
: is the i-th true value.
: is the i-th predicted value.
: is the mean of the actual values.
- (3)
- Comparison between Real Values and Predicted Values
To assess the predictive performance of the PSO-BP model, this study compared its results with actual observed data. As shown in Figure 15, the model closely aligns with the real values, accurately capturing both overall trends and local fluctuations, with minimal errors. By optimizing the BP network’s initial weights and thresholds through PSO, the model effectively addresses common issues in traditional BP networks, such as local minima and slow convergence, thereby enhancing both fitting accuracy and stability. Overall, the PSO-BP model exhibits excellent predictive performance, strong generalization ability, and significant application potential.
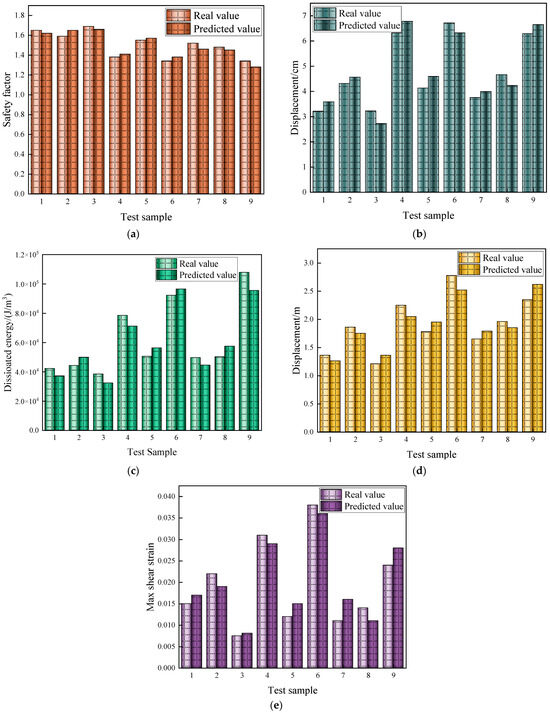
Figure 15.
Comparison between Actual and Predicted Values Based on PSO-BP; (a) Comparison between Actual and Predicted Safety Factors; (b) Comparison between Actual and Predicted Vault Displacements; (c) Comparison between Actual and Predicted Dissipated Energy (d) Comparison between Actual and Predicted Lateral Deformations; (d) Comparison between Actual and Predicted Lateral Deformations; (e) Comparison between Actual and Predicted Max shear increment.
The optimal support method was determined through analysis, as shown in Table 6.

Table 6.
Tunnel Support Parameters.
5.5. Verification and Analysis of Tunnel Excavation Support Based on FLAC3D and Cusp Catastrophe Theory
5.5.1. Displacement Analysis Under Support Action
During the tunnel excavation process, the surrounding rock experiences stress release due to disturbances in the original stress field, resulting in displacement. Under the support action, the displacement of the surrounding rock generally shows a gradual slowing trend and tends to stabilize, indicating that the surrounding rock and the support system have reached a new stress equilibrium state. As shown in Figure 16 according to the calculated displacement contour and vector diagrams, the crown subsidence displacement in the z-direction under support is 3.44 cm, and the displacements on both sides in the x-direction are 1.25 cm and 1.23 cm, respectively. This indicates that the tunnel is in a stable state under the support action.
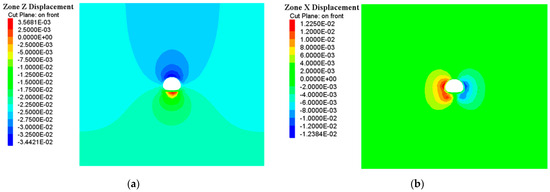
Figure 16.
Displacement Contour Maps under Support Condition; (a) Z-direction Displacement under Support Conditions; (b) Z-direction Displacement under Support Conditions.
5.5.2. Analysis of Dissipated Energy and Energy Damage Under Support Action
During tunnel excavation, the surrounding rock’s original stress field is disrupted. Some of the energy is stored as elastic energy, while the rest is dissipated through mechanisms such as plastic deformation and crack propagation. The prompt installation of support structures helps control the deformation and energy release of the surrounding rock, altering the patterns of energy transfer and dissipation. As shown in Figure 17, with support in place, the dissipated energy is 3.86 × 10⁴ J/m3, and the damage variable (ds) is 0.26, both of which are significantly lower than those in the unsupported condition.
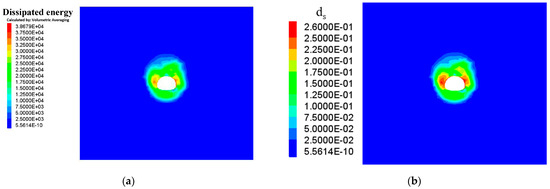
Figure 17.
Contour Maps of Dissipated Energy and ds under Support Conditions; (a) Dissipated Energy Contour Map under Support Conditions; (b) ds Contour Map under Support Conditions.
5.5.3. Tunnel Stability Verification Based on Catastrophe Theory
Based on the displacement and dissipated energy obtained from the catastrophe theory combined with numerical simulation, as shown in Figure 18, it can be seen that under the support conditions, in Table 7, the catastrophe characteristic value Δ > 0. Therefore, it is concluded that the support parameters meet the requirements for tunnel support.
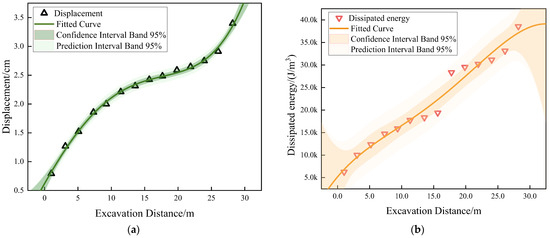
Figure 18.
Schematic Diagram of Displacement and Dissipated Energy Fitting under Support Conditions; (a) Displacement Fitting Curve under Support Conditions; (b) Fitting Curve of Dissipated Energy under Support Conditions.

Table 7.
Catastrophe Characteristic Values of Cusp Catastrophe Theory under Support Conditions.
6. Conclusions
Systematic application of existing theories to complex engineering:
This study is the first to systematically apply catastrophe theory and the principle of energy conservation to analyze the energy evolution of surrounding rock in fault-fractured tunnels, enabling a quantitative assessment of rock instability processes under complex geological conditions.
Practical and fully implementable predictive framework:
A complete framework directly applicable to field construction was developed, integrating instability prediction with support optimization. This establishes a closed loop from theoretical analysis to engineering practice, overcoming the limitations of studies that remain purely theoretical or case-based.
Intelligent optimization coupled with energy–catastrophe methodology:
By coupling PSO-BP intelligent optimization with catastrophe theory, a nonlinear mapping between support parameters and tunnel stability was established, providing high-precision support design solutions for tunnels in complex fault-fractured zones.
Full-chain engineering validation:
The proposed approach was validated in the Shangshan Tunnel project through geological forecasting, laboratory rock mechanics testing, numerical simulation, and intelligent prediction. The results demonstrate the method’s practical applicability and provide an innovative solution that can be referenced in similar engineering projects.
This study makes several assumptions regarding data representativeness and method applicability. The data, derived from field tests, laboratory experiments, and numerical simulations, assume that the samples represent the geological conditions of the Shangshan Tunnel. However, the complexity of the faulted fracture zone may limit this representativeness. The geological model assumes that rock fractures are adequately captured by the testing methods, though undetected geological features may exist. In the numerical simulations, rock mechanical parameters are based on the GSI classification and Hoek-Brown criteria, with model accuracy dependent on these assumptions, warranting further validation. Additionally, laboratory tests did not include statistical repetition for all rock types, potentially limiting sample representativeness. Finally, the energy damage model assumes dissipation is primarily due to rock deformation, without accounting for external factors. Despite these limitations, this study provides valuable theoretical insights into tunnel rock mass instability, with further validation needed through additional field tests.
Author Contributions
Conceptualization, Methodology, Writing—Original Draft, Data Curation, C.S.; Methodology, Software, Methodology, Writing—Review and Editing, Writing—Original Draft, Z.X.; Investigation, Data Curation, Writing—Review and Editing, Supervision, J.Z.; Validation, Data Curation, Writing—Review and Editing, Y.P.; Data Curation, Writing—Original Draft, Visualization, Q.T.; Validation, Writing—Original Draft, Data Curation, Y.Z.; Investigation, Resources, Data curation, X.G.; Investigation, Data Curation, Writing—Review and Editing, T.L. All authors have read and agreed to the published version of the manuscript.
Funding
National Natural Science Foundation of China, 51704144.
Institutional Review Board Statement
Not applicable.
Informed Consent Statement
Informed consent was obtained from all participating subjects.
Data Availability Statement
The original contributions presented in this study are included in this article; further inquiries can be directed to the corresponding author.
Conflicts of Interest
Authors Qi Tao and Xibin Guan were employed by the company “China Railway 19th Bureau Group Sixth Engineering Co., Ltd.” and Author Ye Zhou was employed by the company “China Railway 19th Bureau Group Co., Ltd.”. The remaining authors declare that the research was conducted in the absence of any commercial or financial relationships that could be construed as a potential conflict of interest.
References
- Zhu, H.; Yan, J.; Liang, W. Challenges and development prospects of ultra-long and ultra-deep mountain tunnels. Engineering 2019, 5, 384–392. [Google Scholar] [CrossRef]
- He, C.; Wang, B. Research progress and development trends of highway tunnels in China. J. Mod. Transp. 2013, 21, 209–223. [Google Scholar] [CrossRef]
- Li, Z.; Zhang, X.; Zhu, Z.; Wu, Y.; Yu, H.; Gao, W.; Lv, B. Detonation Dynamics and Damage Behavior of Segmented Tunnel Charges with Shaped Liners. Buildings 2025, 15, 2815. [Google Scholar] [CrossRef]
- Cui, G.; He, Z.; Chen, Q.; Wang, M.; Wang, D. Research on the Zoning Method and Application of Seismic Damage Impact for Tunnels Crossing Active Faults Based on the Energy Principle [J/OL]. Chin. J. Geotech. Eng. 2025, 46, 1171–1180. [Google Scholar]
- Peng, M.; He, M.; Guo, Y.; Cheng, T.; Qiao, F. Mechanical Behavior and Energy Evolution Characteristics of Sandstone under Combined Effects of Strain Rate and Confining Pressure [J/OL]. Rock Mech. Eng. 2025, 44, 2071–2085. [Google Scholar] [CrossRef]
- Zheng, K.; Shi, C.; Lou, Y.; Jia, C.; Lei, M.; Yang, Y. Energy Calculation Method and Evolution Mechanism of Surrounding Rock Unloading in Deep High-Stress Tunnel Excavation. Rock Soil Mech. 2025, 46, 165–177. [Google Scholar]
- Ye, F.; Han, X.; Qin, N.; Ouyang, A.; Liang, X.; Xu, C. Damage management and safety evaluation for operating highway tunnels: A case study of Liupanshan tunnel. Struct. Infrastruct. Eng. 2020, 16, 1512–1523. [Google Scholar] [CrossRef]
- Peng, Y.; Wu, L.; Chen, C.; Yue, J. Stability analysis of surrounding rock in tunnel crossing water-rich fault based on catastrophe theory. Geotech. Geol. Eng. 2020, 38, 415–423. [Google Scholar] [CrossRef]
- Wang, H.; Zheng, Z.; Gao, X.; Cui, D.; Xu, C. Study on Collapse and Instability of Tunnel Lining Structures Based on Catastrophe Theory. Highw. Traffic Technol. 2023, 40, 239–245. [Google Scholar]
- Zhou, P.; Wang, Z.; Hou, W.; Zhou, F.; Du, Y.; Feng, J.; Xu, H. Study on Local Wetting-Induced Instability Characteristics and Catastrophe Prediction of Xigeda Formation Tunnel. Chin. J. Geotech. Eng. 2020, 42, 503–512. [Google Scholar]
- Henley, S. Catastrophe theory models in geology. Math. Geol. 1976, 8, 649–655. [Google Scholar] [CrossRef]
- Hao, Y.L.; Peng, Q.Y.; Wan, W.; Wang, W.J.; Chen, B. Fluid-solid coupling analysis of rock pillar stability for concealed karst cave ahead of a roadway based on catastrophic theory. Int. J. Rock Mech. Min. 2014, 24, 737–745. [Google Scholar]
- Li, G.; Luo, Z.; Wu, C.; Lu, H.; Zhu, C. Integrated early warning and reinforcement support system for soft rock tunnels: A novel approach utilizing catastrophe theory and energy transfer laws. Tunn. Undergr. Space Technol. 2024, 150, 105869. [Google Scholar] [CrossRef]
- Zou, Y.; Tang, Q.; Peng, L. Stability Analysis and Instability Time Prediction of Tunnel Roofs in a Karst Region Based on Catastrophe Theory. Appl. Sci. 2025, 15, 978. [Google Scholar] [CrossRef]
- Yao, Y.; Chang, F.; Wen, Y.; Li, Z.; Wang, M. Study on the Failure Mechanism of Karst Tunnels Based on Energy Visualization. J. Undergr. Space Eng. 2024, 20, 841–847. [Google Scholar]
- Zhao, Y.; Qi, Y. Study on instability change law of surrounding rock of tunnel crossing fault fracture zone based on cusp point mutation theory. Highlights Sci. Eng. Technol. 2023, 79, 10–21. [Google Scholar] [CrossRef]
- Chen, Z.; He, C.; Wu, D.; Gan, L.; Xu, G.; Yang, W. Mechanical Properties of Deeply Buried Carbonaceous Phyllite and Its Energy Damage Evolution Mechanism. Rock Soil Mech. 2018, 39, 445–456. [Google Scholar]
- Liu, Y.; Zhang, R.; Hou, S.; Zhu, L.; Pang, Z.; Zhuang, W. Investigation of energy evolution process of rock mass during deep tunnel excavation based on elasto-viscoplastic damage model and time-dependent energy indices. Acta Geotech. 2025, 20, 1549–1570. [Google Scholar] [CrossRef]
- Yang, H.Q.; Zeng, Y.Y.; Lan, Y.F.; Zhou, X.P. Analysis of the excavation damaged zone around a tunnel accounting for geostress and unloading. Int. J. Rock Mech. Min. Sci. 2014, 69, 59–66. [Google Scholar] [CrossRef]
- Deng, X.F.; Zhu, J.B.; Chen, S.G.; Zhao, Z.Y.; Zhou, Y.X.; Zhao, J. Numerical study on tunnel damage subject to blast-induced shock wave in jointed rock masses. Tunn. Undergr. Space Technol. 2014, 43, 88–100. [Google Scholar] [CrossRef]
- Guo, C.; Fan, L.; Han, K.; Li, P.; Zhang, M. Progressive failure analysis of shallow circular tunnel based on the functional catastrophe theory considering strain softening of surrounding rock mass. Tunn. Undergr. Space Technol. 2023, 131, 104799. [Google Scholar] [CrossRef]
- Yang, K.; Yan, Q.; Zhang, C.; Cheng, Y. Investigation of Energy Transformation and Dissipation in Soft Rock Tunnels with Yielding Support Under Large Deformation. Rock Mech. Rock Eng. 2024, 57, 6119–6140. [Google Scholar] [CrossRef]
- Xie, H.P.; Li, L.Y.; Ju, Y.; Peng, R.D.; Yang, Y.M. Energy analysis for damage and catastrophic failure of rocks. Sci. China Technol. Sci. 2011, 54 (Suppl. 1), 199–209. [Google Scholar] [CrossRef]
- Leu, S.S.; Chen, C.N.; Chang, S.L. Data mining for tunnel support stability: Neural network approach. Autom. Constr. 2001, 10, 429–441. [Google Scholar] [CrossRef]
- Li, X.; Jia, C.; Zhu, X.; Zhao, H.; Gao, J. Investigation on the deformation mechanism of the full-section tunnel excavation in the complex geological environment based on the PSO-BP neural network. Environ. Earth Sci. 2023, 82, 326. [Google Scholar] [CrossRef]
- Chen, Z.; He, C.; Zhou, Z.; Zhang, X.; Zhou, Y.; Han, F.; Meng, W. Intelligent design and evaluation of tunnel support structure systems. Autom. Constr. 2025, 175, 106215. [Google Scholar] [CrossRef]
- Soranzo, E.; Guardiani, C.; Wu, W. The application of reinforcement learning to NATM tunnel design. Undergr. Space 2022, 7, 990–1002. [Google Scholar] [CrossRef]
- Song, S.; Xu, G.; Bao, L.; Xie, Y.; Lu, W.; Liu, H.; Wang, W. Classifying the surrounding rock of tunnel face using machine learning. Front. Earth Sci. 2023, 10, 1052117. [Google Scholar] [CrossRef]
- Zhang, T.; Zhao, J.; Kuang, R.; Li, C. Stability Analysis and Support Optimization of Tunnel Surrounding Rock with Weak Interlayer Based on Catastrophe Theory. Buildings 2025, 15, 507. [Google Scholar] [CrossRef]
- Deng, T.; Pang, X.; Sun, J.; Zhang, C.; Wan, D.; Zhang, S.; Zhang, X. A Multi-Method Approach to the Stability Evaluation of Excavated Slopes with Weak Interlayers: Insights from Catastrophe Theory and Energy Principles. Appl. Sci. 2025, 15, 7304. [Google Scholar] [CrossRef]
- Tu, Y.; Liu, X.; Zhong, Z.; Li, Y. New criteria for defining slope failureusing the strength reduction method. Eng. Geol. 2016, 212, 63–71. [Google Scholar] [CrossRef]
- Qin, S. Introduction to Nonlinear Engineering Geology; Southwest Jiaotong University Press: Chengdu, China, 1993. [Google Scholar]
Disclaimer/Publisher’s Note: The statements, opinions and data contained in all publications are solely those of the individual author(s) and contributor(s) and not of MDPI and/or the editor(s). MDPI and/or the editor(s) disclaim responsibility for any injury to people or property resulting from any ideas, methods, instructions or products referred to in the content. |
© 2025 by the authors. Licensee MDPI, Basel, Switzerland. This article is an open access article distributed under the terms and conditions of the Creative Commons Attribution (CC BY) license (https://creativecommons.org/licenses/by/4.0/).