Abstract
This study proposes a rapid method for identifying the geographical origin of Poria by combining Raman spectroscopy with an improved PCA algorithm—multi-matrix projection discrimination analysis. Poria samples from four Chinese provinces—Yunnan, Anhui, Shaanxi, and Hubei—were analyzed. Four datasets were constructed, each containing 25 Raman spectra per origin, with an additional 10 spectra per origin reserved as independent test sets. PCA was then separately applied to the spectral dataset of each origin to derive its respective eigenvector matrix. For each test spectrum, four reconstructed spectra were generated by projecting it onto the eigenvector matrices of the four origins. The origin was determined by identifying the one with the minimum Euclidean distance between the test spectrum and its reconstructions. When the first six principal components were used for model construction, the test set accuracy reached 97.5%, significantly outperforming the optimized PCA–SVM model, which achieved an accuracy of 85%. These results demonstrate that Raman spectroscopy, combined with the multi-matrix projection discrimination method based on PCA, can effectively capture the fingerprint information of Poria and accurately determine its geographical origin.
1. Introduction
Poria, the dried sclerotium of the fungus Poria cocos (Schw.) Wolf from the Polyporaceae family, is one of the Chinese traditional and valuable medicinal herbs widely used in both food and medicine [1,2]. Its annual societal demand exceeds tens of thousands of tons. Poria cocos has the effects of promoting diuresis, eliminating dampness, strengthening the spleen, and calming the mind, making it valuable in a variety of applications including health foods, cosmetic products, and pharmaceutical preparations [3,4]. According to numerous studies, the primary active components of Poria cocos are polysaccharides and triterpenoids [5,6]. Polysaccharides accounts for 84% by weight among all constituents in the dried sclerotium [7]. With the increasing cultivation and application of Poria cocos, researchers have discovered more of its medicinal values, such as anti-tumor, anti-inflammatory, and immune-regulating functions [8,9].
According to reports from the China Report Hall in 2024, China is the primary producer of Poria cocos, accounting for approximately 70% of global production. In 2022, the production in China reached 252,000 tons, and by 2024, the national output had increased to 500,000 tons, representing an 8% year-on-year growth. It is projected that by 2025, the cultivated area in China will exceed 2 million mu, with an annual production of 1 million tons. These data indicate that China is the main cultivation region for Poria cocos. Due to differences in geography, climate and other factors, samples from different provinces vary significantly in appearance, nutritional composition, and bioactive constituents. For example, Xia et al. [10] reported that Poria samples from eight provinces (including Yunnan, Sichuan and Anhui) exhibited significant differences in the content of seven major triterpenoid compounds. In addition, three carbohydrates (mannose, galactose, and palatinose) had the highest relative abundance in samples from YN, followed by AH, and the lowest in JZ, while the relative abundance of the four amino acids (proline, l-alanine, l-norleucine, and kainic acid) was the highest in samples from JZ, followed by those from AH, and the lowest in samples from YN. Here, JZ represents Hunan Province, AH represents Anhui Province, and YN represents Yunnan Province [11].
The processing of Poria cocos (including peeling, slicing, steaming and other procedures) significantly alters its original morphological and chemical characteristics [12]. The processing techniques for Poria cocos differ across China, varying in specific procedures and excipient dosages. While the Traditional Chinese Medicine sector features a lengthy industrial chain, the accountability for managing its standardization is not clearly established [13,14]. Compounding this issue, the current quality control system for Chinese herbal medicines lacks standardized authentication labeling for processed Poria products. The quality evaluation of Poria cocos products is a comprehensive system, primarily based on the standards of the Pharmacopoeia of the People’s Republic of China. Key parameters include: active ingredient content (e.g., Poria cocos polysaccharides and triterpenes), physicochemical indicators (moisture, ash, and extractives), safety indicators (heavy metals and pesticide residues), and traditional appearance traits (color, texture, and pattern).
These challenges make it difficult to accurately trace the geographic origin of Poria using traditional morphological identification methods. Accurate origin identification, however, is essential for the rational development and management of Poria resources across different regions and provides a scientific basis for clinical applications. Therefore, developing rapid and reliable methods for determining the geographical origin of Poria holds significant practical value in both commercial and research contexts.
Currently, common methods for determining the origin of Poria include Terahertz spectroscopy (THz), Hyperspectral imaging [15], Electronic nose technology, High-performance liquid chromatography (HPLC) and Near-infrared spectroscopy (NIR), among others [16,17]. However, these techniques have several limitations, such as high instrumentation costs, complex data processing, and destructive sample preparation. In contrast, Raman spectroscopy (RS) is a powerful molecular spectroscopy technique that enables rapid, non-destructive analysis while providing detailed molecular structural information. With its advantages of high detection efficiency and low operational costs, Raman spectroscopy has been widely applied in the analysis of polymer materials, biomolecules, pharmaceuticals, and food products [18,19]. For instance, Liu et al. [20] successfully differentiated three starch classifications using Raman spectroscopy combined with PCA-SVM analysis. de Angelis et al. [21] utilized surface-enhanced Raman spectroscopy (SERS) for rapid determination of phenolic compound in chamomile. Tian et al. [22] applied Raman spectroscopy combined with chemometrics to classify rice samples from different regions in Heilongjiang Province. They also employed PCA to reduce the dimensionality of rice spectroscopy data. Their study demonstrated that PCA is effective in extracting Raman spectroscopy features of rice, thereby improving classification and prediction accuracy. Currently, Raman spectroscopy has not yet been applied to the identification of Poria origin, its proven utility in food authentication and traceability studies of traditional Chinese medicines suggests strong potential for its application in this field. Peta et al. used gel tactile sensing to record and discriminate fingerprints. This technique could potentially quantify micro-surface features of Poria cocos, such as roughness, texture, and pores, providing a complementary approach for origin identification alongside chemical analysis [23].
Principal Component Analysis (PCA) is a computationally efficient, unsupervised machine learning method that excels in dimensionality reduction and cluster analysis [24,25]. It can extract essential structural information from datasets with limited sample sizes. Unlike machine learning methods, which typically require large sample sizes to improve predictive accuracy, PCA effectively addresses this limitation.
In this study, Poria samples from Chuxiong in Yunnan, Shangyu in Shaanxi, Yuexi in Anhui and Shennongjia in Hubei were selected as research subjects. A novel approach was developed by combining Raman spectroscopy with an improved PCA algorithm—multi-matrix projection discrimination—to establish an accurate and efficient model for identifying the geographical origin of Poria.
2. Principles of PCA
Specifically, PCA was applied to the spectral data to obtain the eigenvalues and the corresponding eigenvectors v within the linear space spanned by the original spectra, together with the projection scores S of each sample spectrum. The eigenvectors v form a set of orthogonal basis vectors that define the directions of the principal component subspace. The projection scores S indicate the coordinates of the original spectra in this subspace, reflecting their relative contributions along different principal component directions.
- (1)
- Let the spectral data be represented as an M × N matrix (), where M denotes the number of samples (spectral traces) and N denotes the feature dimension.
- (2)
- Centralize the sample matrix and calculate the mean vector:where represents the i-th sample, and the centralized matrix is obtained:
- (3)
- Calculate the covariance matrix of the samples after centralization:Perform eigenvalue decomposition on the covariance matrix C, obtaining eigenvalues arranged in descending order, i.e., ≥ ≥⋯≥ , and their corresponding eigenvectors (). The first k eigenvectors are then assembled column-wise to form the feature vector matrix .
- (4)
- Project the sample matrix X onto the new space spanned by the feature vector matrix , yielding the dimension-reduced principal component score matrix:The i-th row represents the scores of the i-th sample on the first k principal components.
- (5)
- If sample reconstruction is required, then there are:
- (6)
- The reconstruction error εi for each sample is defined as:Here, represents the i-th sample, and is the spectrum reconstructed by the projection of the first k feature vectors of .
3. Materials and Methods
3.1. Raman Experimental System and Samples
The Raman experimental system consists of an NLM series multimode narrow-bandwidth laser, an RL-RP series standard Raman probes, and an RLE-RI02 Raman spectrometer developed by Beijing Xinglin Ruikuang Co., Ltd. (Beijing, China) The excitation wavelength of the laser is 785 nm, and the spectroscopy range is 176–3500 cm−1, with a resolution of 6 cm−1. The Raman experimental system structure is shown in Figure 1. The laser emits excitation light, which is transmitted through an excitation fiber to the Raman probe. The probe performs dual functions: (1) directing the laser to the sample within the sampling chamber for Raman signal acquisition, and (2) filtering out non-Raman signals such as Rayleigh scattering and laser reflections through its backward collection optics. The processed Raman scattering signals are then transmitted via a collection fiber to the high-sensitivity Raman spectrometer. After spectroscopy processing and analysis, the data is transferred to a PC for Raman spectroscopy imaging. Data were processed using Matlab R2018b and OriginPro 2024.
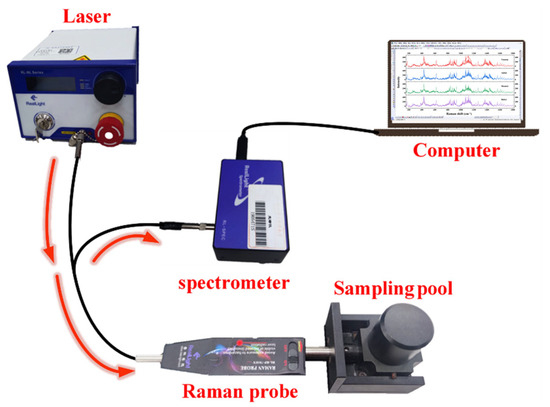
Figure 1.
Raman experimental system structure.
The Poria samples used in the experiment were purchased from Yunnan, Shaanxi, Anhui, and Hubei provinces in China. To minimize experimental errors caused by factors such as uneven size, surface oxidation, or contamination during production, handling, and transportation, the surface layer of each Poria sample was removed prior to data acquisition. Raman spectra were then collected from the interior of each sample.
3.2. Poria Raman Spectroscopy Acquisition
The laser current was set to 800 mA with an integration time of 5 s. The Poria sample was placed in a cuvette, which was then positioned in the sampling pool, and the fiber probe was aligned with the cuvette for data collection. For each surface of the Poria sample, data were collected three consecutive times and subsequently averaged. Baseline correction was performed using the adaptive iteratively reweighted penalized least squares (air PLS) method (Parameter settings: λ = 1000, order = 2, wep = 0.001, p = 0.05, itermax = 20) [26]. For model construction, the spectral range of 159–1803 cm−1 was selected. All samples were measured under identical conditions with fixed and consistent parameters to minimize the introduction of bias.
For each origin, 25 preprocessed Raman spectra were obtained using the aforementioned method to construct the training dataset, and an additional 10 spectra were collected to form the test set. In total, 35 preprocessed spectra were acquired per origin, resulting in 140 spectra across the four origins, as illustrated in Figure 2. As shown in the figure, the Raman spectra of Poria from the four origins exhibit highly similar overall patterns, making them difficult to distinguish by visual inspection alone.
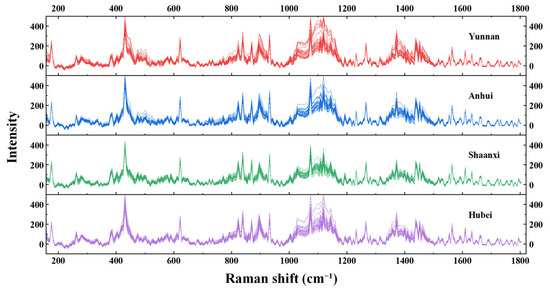
Figure 2.
Pre-processed Raman spectroscopy.
3.3. Fingerprint Characteristic Peaks of Poria Spectra
Figure 2 displays the Raman spectra of Poria samples from the four origins, with the main Raman characteristic peaks located at 431, 524, 579, 895, 1028, 1099, 1207, 1266, 1372, and 1462 cm−1, corresponding to the primary molecular bond assignments as shown in Table 1 [2]. The medium-frequency Raman characteristic peaks observed at 431 and 524 cm−1 were tentatively attributed, based on relevant literature, to the deformation vibrations of D-(+)-trehalose, a nonreducing disaccharide in which the two glucose units are linked in an α, α-1, 1-glycosidic linkage [27,28,29].

Table 1.
The primary Raman peaks of Poria and their corresponding vibrational band assignments.
3.4. Initial Analysis of Raman Spectra of Poria
Direct differences among the four origins cannot be discerned from the preprocessed Raman spectra. For high-dimensional data, it is inherently difficult to perceive their intrinsic structures and underlying patterns. To address this, PCA is commonly used for dimensionality reduction, projecting the high-dimensional data into a lower-dimensional space. The reduced data can then be visualized in two or three-dimensional space, facilitating early-stage data exploration by enabling a quick assessment of overall distribution, potential groupings, and outliers. This form of visualization provides valuable insights and guidance for subsequent in-depth analysis.
In this study, PCA was applied to the preprocessed Raman spectra of the four origins, followed by three-dimensional visualization. The specific steps are as follows: First, a total Poria dataset was constructed by combining 140 preprocessed Raman spectra from the four origins. PCA was then performed on this dataset, and the first three principal components were selected for 3D visualization, as shown in Figure 3a. The cumulative contribution rate of the first three principal components reaches 84.62%. Figure 3b–d show the corresponding two-dimensional projections.
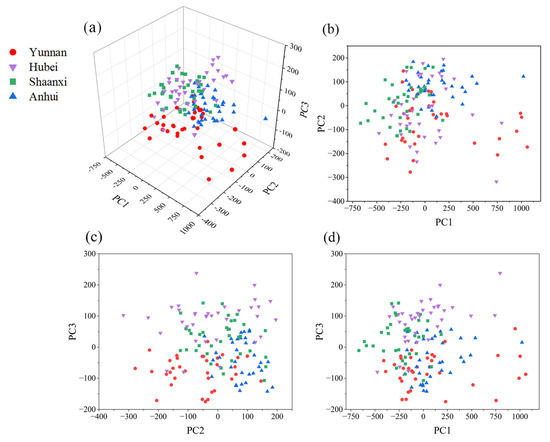
Figure 3.
Three-dimensional visualization of four origins of poria. (a) 3D visualization plot; (b) PC1-PC2 projection plot; (c) PC2-PC3 projection plot; (d) PC1-PC3 projection plot.
The three principal components shown in Figure 3 were obtained by applying PCA on the total Poria dataset, capturing the shared spectral features of samples from all four geographical origins. PCA extracts principal components based on data variance and other statistical characteristics, enabling both dimensionality reduction and data visualization. The cumulative contribution rate of the first three principal components reaches 84%, indicating that they capture the majority of the information contained in the original dataset. However, as shown in Figure 3, there is no evident clustering among Poria samples from different origins.
4. Geographical Discrimination of Poria Based on Grouped Modeling and Projection
4.1. Grouping Principle
The above results indicate that the spectral differences in Poria cocos caused by geographical origin are relatively small. Therefore, the principal component vectors obtained from PCA performed directly on the entire spectral dataset cannot effectively capture the variations among spectra from different origins.
According to Equations (5) and (6), any individual spectrum can be mathematically represented by its mean spectrum, eigenvectors, principal component scores, and deviations:
Here, represents the mean spectrum, represents the score vector on the first k principal components, is the matrix composed of the first k eigenvectors, and is the residual resulting from the incomplete reconstruction of the original spectrum using the first k principal components.
Equation (7) indicates that any spectrum can be expressed as a linear combination of three components: the common spectral background, the reconstructed spectrum in the principal component subspace, and the residual.
When the eigenvector matrix effectively captures the most significant and representative variation patterns of spectra from a given geographical origin, the spectra of samples from that origin can be optimally reconstructed within the principal component subspace. In this case, the corresponding residual is minimized, and the reconstruction error, defined as the Euclidean distance of, becomes smaller.
essentially reflects the degree of matching between a sample spectrum and the spectral model of a given geographical origin. A smaller indicates a higher degree of correspondence between the sample spectrum and the origin-specific spectral model.
Based on the above analysis, we propose a method for geographical origin discrimination using the residual magnitude. Specifically, PCA is performed separately on the spectra from each origin to obtain the corresponding origin-specific eigenvector matrices. A sample spectrum from a particular origin is then projected and reconstructed onto each of these eigenvector matrices. The reconstructed spectrum is most accurately restored in the principal component subspace of its true origin, resulting in the smallest residual and minimal reconstruction error. Accordingly, the sample can be assigned to the origin corresponding to the minimal residual.
To clearly illustrate the discrimination procedure, a test spectrum from Yunnan is used as an example, detailing its projection and reconstruction across the eigenvector matrices of each origin and the corresponding origin classification method.
4.2. Data Processing Procedure
4.2.1. Establishment of Respective Principal Component Matrices for Different Origins
First, PCA was performed separately on each dataset in a grouped manner: PCA was independently applied to the dataset of each origin (comprising 25 preprocessed Raman spectra), resulting in four distinct principal component matrices. Each matrix contains 24 principal components, with the corresponding eigenvalues and contribution rates arranged in descending order. This ordering facilitates the interpretation of component significance across origins and provides a rational basis for selecting the optimal number of principal components for classification. Figure 4 illustrates the cumulative contribution rates of principal components for the Yunnan, Anhui, Shaanxi, and Hubei datasets.
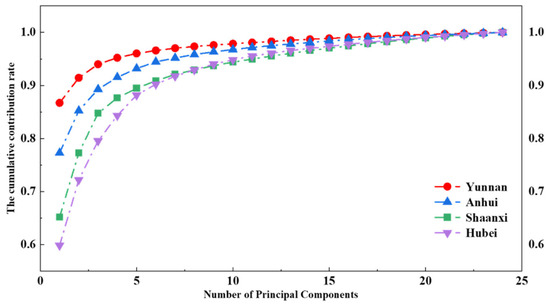
Figure 4.
The cumulative contribution rate.
As shown in Figure 4, the cumulative contribution rates of the first six principal components for all four geographical origins exceeded 90%, indicating that these components retain the vast majority of information contained in the original spectra. This demonstrates that PCA can significantly reduce data complexity while preserving the main spectral features. The Poria samples from Yunnan exhibit the highest cumulative contribution rate for the first principal component among the four origins, whereas the Shaanxi samples show the lowest. This suggests that in the PCA, certain primary characteristics of Yunnan Poria samples exhibit a higher degree of variability within the dataset, providing a relatively stronger explanatory power for the overall data. Such a distinction may imply fundamental differences in the chemical composition or physical structure of Yunnan Poria compared to samples from other regions. These disparities in principal component eigenvalues may serve as valuable indicators for both quality assessment and geographical origin identification of Poria.
4.2.2. Testing Spectral Projection Reconstruction
We selected the first k principal components to construct the classification model and obtained the origin-specific eigenvector matrices . For classification, a test Raman spectrum of known origin is selected, denoted as t1, and assumed to belong to the Yunnan group. First, the mean spectrum of each origin is subtracted from the test sample spectrum T1 to obtain four centralized spectra:
where represents the mean spectrum of the i-th origin dataset. This step serves to eliminate baseline offsets among different origins and enhances characteristic differences between classes.
Next, a projection transformation is performed using the eigenvector matrix of each origin, yielding the corresponding principal component scores:
Subsequently, by performing an inverse transformation to the principal component scores and adding back the respective mean spectrum, the reconstructed spectra of sample t1 for each origin are obtained:
To clearly visualize the differences between the reconstructed spectra and the original test spectrum t1, we selected the first seven principal components to construct the classification model. The comparison results between the reconstructed spectra and t1 are presented in Figure 5.
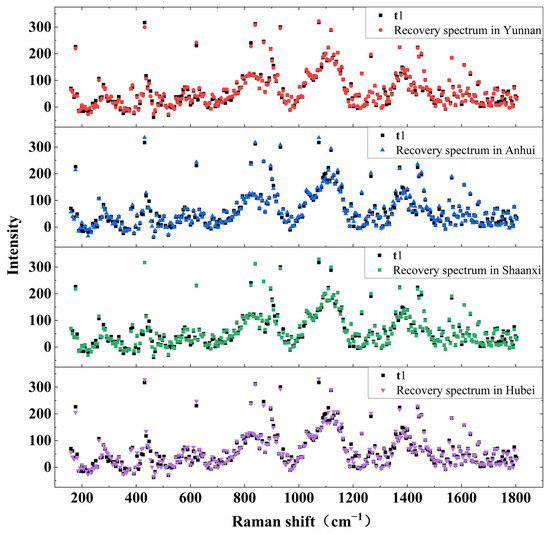
Figure 5.
t1 and its reconstructed spectra in four origins.
As illustrated in the figure, the reconstructed spectra from the four origins exhibit a high degree of consistency with t1 in several key aspects, including the overall spectral morphology, the positions and intensities of characteristic peaks, and the general spectral trend. This consistency demonstrates that the eigenvector matrices corresponding to each origin effectively capture and represent the key spectral features and structural information within the Poria Raman data. The information retained in these matrices is sufficient to accurately reconstruct spectra that closely resemble the original sample through projection-based recovery. Moreover, these results suggest a degree of intrinsic similarity or correlation among the Raman spectra of Poria from different geographical origins. Despite the geographical differences, the principal components extracted from each origin share a considerable overlap in the primary information dimensions. Notably, in the region around 1100 cm−1, the reconstructed spectra from Yunnan and Shaanxi show better alignment with t1 compared to those from Anhui and Hubei, indicating possible differences in spectral detail that may serve as a basis for origin differentiation.
4.2.3. Reconstruction Error
Based on the above process, four reconstructed spectra of the test sample t1 were obtained. The reconstruction errors between each reconstructed spectrum and t1 were calculated and compared. A smaller reconstruction error indicates that t1 is more similar to the reconstructed spectrum in the principal component subspace of that origin, suggesting that t1 is more likely to originate from this geographical source. The reconstruction error is expressed as the Euclidean distance and is calculated using the following formula:
Figure 6 presents a histogram of the Euclidean distances between t1 and the four reconstructed spectra. As shown in the figure, the Euclidean distance between t1 and the reconstructed spectrum based on the Yunnan eigenvector matrix is the smallest. This suggests that t1 most likely originates from Yunnan, which is consistent with our initial assumption.
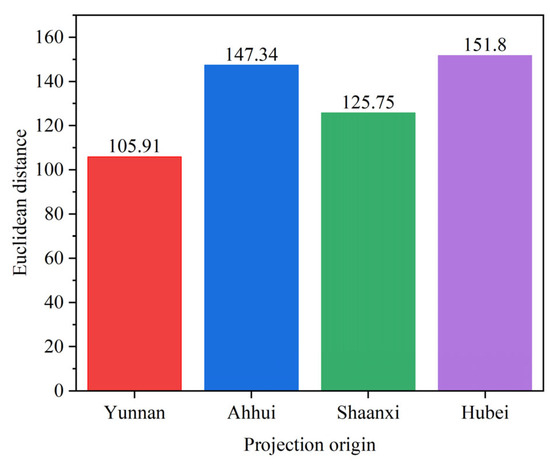
Figure 6.
Histogram of Euclidean distances.
4.3. Relationship Between the Number of Principal Components and Accuracy
The number of principal components directly influences the classification performance of the model. Using too few components may result in underfitting, while too many may lead to overfitting, ultimately degrading the model’s predictive accuracy and its generalization ability to new test data. Therefore, selecting an appropriate number of principal components is crucial. Generally, the number of required principal components is determined by calculating and accumulating the variance contribution rates of each component until a predefined threshold (e.g., 85% or 90%) is reached. The optimal number should be chosen based on specific research goals and practical considerations. In this study, we evaluated classification accuracy of the model using different numbers of principal components. As a result, the first six principal components were selected for model construction, as they offered the best balance between dimensionality reduction and classification performance. The corresponding confusion matrices for various numbers of principal components are shown in Figure 7.
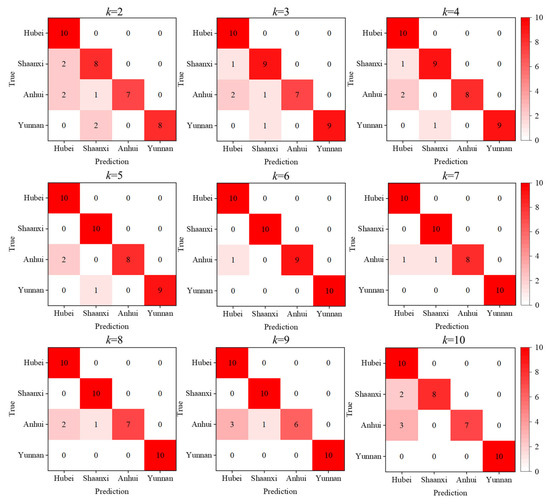
Figure 7.
Confusion matrix.
When the first six principal components are used to construct the feature vector matrices, the cumulative contribution rate exceeds 90% for all four origins, as illustrated in Figure 4. This indicates that these components effectively capture the majority of the significant spectral features in the Raman data of Poria from each origin. Under this configuration, the model achieves its highest classification accuracy of 97.5%. The recall rates for Yunnan, Anhui, Shaanxi, and Hubei samples are 100%, 90%, 100%, and 100%, respectively. The results indicate that, even with a limited number of samples, performing PCA in a grouped manner can effectively extract the spectral features of each geographical origin and construct origin-specific eigenvector matrices. When a test spectrum is reconstructed using the eigenvectors (principal components) of its true origin, the reconstruction error for that origin is minimized. Using the minimal reconstruction error for origin discrimination, an accuracy of 97.5% was achieved.
To mitigate the potential randomness caused by the small sample size, leave-one-out cross-validation (LOOCV) and an independent test set were employed. In the training set, each sample was sequentially left out while varying the number of principal components k from 1 to 15. The results showed that the highest accuracy in cross-validation was achieved at k = 12 (97.00% ± 17.14%), whereas at k = 6, the accuracy was 94.00% ± 23.87%, with the results tending to stabilize.
An independent test set, completely excluded from model training (4 origins × 10 spectra), was used to further assess generalization. The highest test set accuracy of 97.5% was obtained at k = 6, whereas at k = 12, the accuracy dropped to 87.5%. These findings suggest that although k = 12 performed best in cross-validation, it exhibited signs of overfitting, while the model with k = 6 achieved a better balance between accuracy and generalization ability.
4.4. PCA-SVM
The core principle of Support Vector Machines (SVM) is to construct a maximum-margin hyperplane in the feature space, thereby achieving optimal separation between classes. The decision boundary of SVM is determined solely by a few critical samples near the classification margin (called support vectors), rather than the entire dataset. This characteristic enables SVM to maintain strong generalization performance, even when trained on limited data, effectively addressing the dependency of machine learning models on large training sets. Liu et al. employed Raman spectroscopy coupled with PCA-SVM to classify three starch types, achieving an optimized test set accuracy of 93.67% [20].
In this study, 100 preprocessed Raman spectra of Poria cocos were used as the training set, and 40 spectra were reserved as the test set. PCA was first applied for dimensionality reduction, followed by selection of an appropriate number of principal components and kernel functions to construct the classification models. Ten-fold cross-validation was employed to robustly evaluate model performance.
For the linear kernel, after systematically adjusting the number of principal components and the penalty parameter C, the optimal performance was achieved with the first 9 principal components and C = 8, yielding a cross-validation accuracy of 0.91, a training set accuracy of 0.97, and a test set accuracy of 0.90.
For the RBF kernel, the model performed best with the first 10 principal components, C = 10, and γ = 0.00, resulting in a cross-validation accuracy of 0.91, a training set accuracy of 0.96, and a test set accuracy of 0.925.
However, when using the polynomial kernel, the classification performance was clearly inferior to that of the linear and RBF kernels.
Table 2 presents a comparison of the classification accuracy between the PCA-SVM model and the multi-matrix projection discrimination model based on PCA for Poria geographical origin identification. The results indicate that, given the current dataset size, the proposed method achieves higher accuracy in distinguishing the origins of Poria.
Table 2.
Identification rate of Poria origin under different models.
4.5. Discussion
The proposed method achieved 97.5% accuracy on the test set, with LOOCV and independent testing confirming that six principal components provided the best balance between accuracy and generalization. In comparison, a PCA-SVM model optimized with 10-fold cross-validation achieved a maximum accuracy of 92.5% using the RBF kernel. These results demonstrate that the proposed approach is more capable of capturing discriminative features among different origins with limited samples, demonstrating higher accuracy and superior generalization ability.
This study achieved high classification accuracy and demonstrates strong practical and economic potential. The method requires no complex pretreatment or costly reagents, enabling rapid, nondestructive detection. It can prevent adulteration and false origin labeling, supporting standardized and intelligent traceability of Poria cocos. Overall, this approach provides both a methodological innovation and a practical tool with significant potential for large-scale application.
Although this study achieved promising results, it still has certain limitations. The sample size was limited and covered only four production regions, which may restrict the generalizability of the model. Future work will focus on expanding the dataset to include more regions and other medicinal materials, developing portable Raman devices for rapid on-site detection, building a standardized Poria cocos spectral database, and further optimizing classification algorithms to improve stability and accuracy.
5. Conclusions
Origin authentication is a key step in the quality control of medicinal materials. In this study, a grouped modeling projection method combining Raman spectroscopy and PCA was developed for the origin discrimination of Poria cocos. When the first six principal components were selected to construct the feature matrices, the model achieved a classification accuracy of 97.5% on the test set. These results demonstrate that Raman spectroscopy combined with PCA enables rapid and accurate origin identification, providing an effective tool for quality control and traceability of medicinal materials.
Author Contributions
X.W.: Writing—review and editing, Data curation. Y.Q.: Writing—original draft, Visualization. W.X.: Supervision, Software. F.W.: Conceptualization, Methodology. S.Y. (Song Ye): Supervision, Funding acquisition. S.Y. (Siqian Yang): Software, Investigation. H.T.: Investigation. All authors have read and agreed to the published version of the manuscript.
Funding
This work was supported by The National Key Research and Development Program of China (No. 2022YFB3901800, No.2022YFB3901803), Guangxi Science and Technology Program Project (No. AD25069073), Key Laboratory of General Optical Calibration, Characterization Technology and Innovation Project of GUET Graduate Education (2025YCXS225).
Institutional Review Board Statement
Not applicable.
Informed Consent Statement
Not applicable.
Data Availability Statement
The data presented in this study are available on request from the corresponding author.
Conflicts of Interest
The authors declare no conflicts of interest.
References
- Yi, Y.; Hu, H.M. Rapid determination of polysaccharides and antioxidant activity of Poria cocos using near-infrared spectroscopy combined with chemometrics. Spectrochim. Acta A Mol. Biomol. Spectrosc. 2020, 240, 118623. [Google Scholar] [CrossRef]
- Chen, J.B.; Sun, S.Q. Vibrational microspectroscopic identification of powdered traditional medicines: Chemical micromorphology of Poria observed by infrared and Raman microspectroscopy. Spectrochim. Acta A Mol. Biomol. Spectrosc. 2014, 128, 629–637. [Google Scholar] [CrossRef]
- Wang, Y.Z.; Zhang, J. Mycology, cultivation, traditional uses, phytochemistry and pharmacology of Wolfiporia cocos (Schwein.) Ryvarden et Gilb.: A review. J. Ethnopharmacol. 2013, 147, 265–276. [Google Scholar] [CrossRef]
- Ng, C.Y.J.; Lai, N.P.Y. Chemical structures, extraction and analysis technologies, and bioactivities of edible fungal polysaccharides from Poria cocos: An updated review. Int. J. Biol. Macromol. 2024, 261, 129555. [Google Scholar] [CrossRef]
- Rios, J.L. Chemical constituents and pharmacological properties of Poria cocos. Planta Med. 2011, 77, 681–691. [Google Scholar] [CrossRef] [PubMed]
- Sun, Y. Biological activities and potential health benefits of polysaccharides from Poria cocos and their derivatives. Int. J. Biol. Macromol. 2014, 6, 131–134. [Google Scholar] [CrossRef] [PubMed]
- Li, X.L.; He, Y.L.P.J. Molecular basis for Poria cocos mushroom polysaccharide used as an antitumour drug in China. J. Cell. Mol. Med. 2019, 23, 4–20. [Google Scholar] [CrossRef]
- Jia, X.; Ma, L. Prospects of Poria cocos polysaccharides: Isolation process, structural features and bioactivities. Trends Food Sci. Technol. 2016, 54, 52–62. [Google Scholar] [CrossRef]
- Zhao, Y.; Nie, F. Preparation and exploration of anti-tumor activity of Poria cocos polysaccharide gold nanorods. Int. J. Biol. Macromol. 2024, 280, 135347. [Google Scholar] [CrossRef]
- Xia, B.; Zhou, Y. Advanced ultra-performance liquid chromatography–photodiode array quadrupole time-of-flight mass spectrometric methods for simultaneous screening and quantification of triterpenoids in Poria cocos. Food Chem. 2014, 152, 237–244. [Google Scholar] [CrossRef]
- Liu, X.; Zhong, C. Geographical region traceability of Poria cocos and correlation between environmental factors and biomarkers based on a metabolomic approach. Food Chem. 2023, 417, 135817. [Google Scholar] [CrossRef] [PubMed]
- Cheng, L.; Xiu, H.D. The Impact of Processing Methods from Different Regions on the Quality of Poria Medicinal. J. Qiqihar Univ. Medicine. 2022, 43, 674–677. [Google Scholar]
- Zhang, X.X.; Sun, L. Current status, problems and countermeasures of construction of standardization system of traditional Chinese medicine. China. J. Chin. Mater. Med. 2019, 44, 4745–4750. [Google Scholar]
- Jin, J.; Zhong, C. Current status and prospects of processing and product development of Poria cocos in China. China Mod. Chin. Med. 2020, 22, 1441–1446. [Google Scholar]
- Luan, M.; Wang, H. Hyperspectral Imaging Combined with Chemometrics for Rapid Detection of Poria cocos Adulteration: A Qualitative and Quantitative Approach. J. Food Compos. Anal. 2025, 145, 107835. [Google Scholar] [CrossRef]
- Zhu, L.X.; Xu, J. Correlation between quality and geographical origins of Poria cocos revealed by qualitative fingerprint profiling and quantitative determination of triterpenoid acids. Molecules 2018, 23, 2200. [Google Scholar] [CrossRef]
- Xie, J.; Huang, J.H. Determination of cultivation regions and quality parameters of Poria cocos by near-infrared spectroscopy and chemometrics. Foods 2022, 11, 892. [Google Scholar] [CrossRef]
- Bahlol, H.S.; Li, J. Recent Progress in Nanomaterial-Based Surface-Enhanced Raman Spectroscopy for Food Safety Detection. Nanomaterials 2024, 14, 1750. [Google Scholar] [CrossRef]
- Sun, Y.; Tang, H.B. Raman spectroscopy for food quality assurance and safety monitoring: A review. Curr. Opin. Food Sci. 2022, 47, 100910. [Google Scholar] [CrossRef]
- Liu, T.Y.; Chen, J. Utilization of a portable Raman spectrometer combined with a PCA-SVM model for starch type differentiation. Food Biosci. 2024, 57, 103465. [Google Scholar] [CrossRef]
- de Angelis, M.; Amicucci, C. Rapid determination of phenolic composition in chamomile (Matricaria recutita L.) using surface-enhanced Raman spectroscopy. Food Chem. 2025, 463, 141084. [Google Scholar] [CrossRef] [PubMed]
- Tian, F.M.; Tan, F. An rapid nondestructive testing method for distinguishing rice producing areas based on Raman spectroscopy and support vector machine. Vib. Spectrosc. 2020, 107, 103017. [Google Scholar] [CrossRef]
- Peta, K.; Stemp, W.J. Multiscale Geometric Characterization and Discrimination of Dermatoglyphs (Fingerprints) on Hardened Clay—A Novel Archaeological Application of the GelSight Max. Materials 2025, 18, 2939. [Google Scholar] [CrossRef] [PubMed]
- Mozhaeva, V.; Kudryavtsev, D. Toxins’ classification through Raman spectroscopy with principal component analysis. Spectrochim. Acta Part A Mol. Biomol. Spectrosc. 2022, 278, 121276. [Google Scholar] [CrossRef]
- Massei, A.; Falco, N. Use of Raman spectroscopy and PCA for quality evaluation and out-of-specification identification in biopharmaceutical products. Eur. J. Pharm. Biopharm. 2024, 200, 114342. [Google Scholar] [CrossRef]
- Zhang, X.; Chen, S. Method for removing spectral contaminants to improve analysis of raman imaging data. Sci. Rep. 2017, 7, 39891. [Google Scholar] [CrossRef]
- Maruf, A.; Milewska, M. Trehalose-bearing carriers to rarget impaired autophagy and protein aggregation diseases. Med. Chem. 2023, 66, 15613–15628. [Google Scholar] [CrossRef]
- Abazari, A.; Chakraborty, N. A Raman microspectroscopy study of water and trehalose in spin-dried cells. Biophys. J. 2014, 107, 2253–2262. [Google Scholar] [CrossRef]
- Fan, Y.J.; Xue, R.R. Explanation and prediction for the product of trehalose dihydrate selective dehydration process using mid-frequency Raman difference spectra. Vib. Spectrosc. 2024, 130, 103626. [Google Scholar] [CrossRef]
Disclaimer/Publisher’s Note: The statements, opinions and data contained in all publications are solely those of the individual author(s) and contributor(s) and not of MDPI and/or the editor(s). MDPI and/or the editor(s) disclaim responsibility for any injury to people or property resulting from any ideas, methods, instructions or products referred to in the content. |
© 2025 by the authors. Licensee MDPI, Basel, Switzerland. This article is an open access article distributed under the terms and conditions of the Creative Commons Attribution (CC BY) license (https://creativecommons.org/licenses/by/4.0/).