Article

On Relation Between Fatigue Limit ΔσFL and Threshold ΔKth

by
Daniel Kujawski
1,* and
Asuri K. Vasudevan
2
1
Mechanical and Aerospace Engineering, Western Michigan University, Kalamazoo, MI 49008, USA
2
Technical Data Analysis, Inc., Falls Church, VA 22043, USA
*
Author to whom correspondence should be addressed.
Appl. Sci. 2025, 15(19), 10405; https://doi.org/10.3390/app151910405
Submission received: 25 July 2025 / Revised: 1 September 2025 / Accepted: 22 September 2025 / Published: 25 September 2025
(This article belongs to the Section Materials Science and Engineering)

Abstract

Under cyclic loading, fatigue limits ΔσFL and fatigue crack growth (FCG) thresholds ΔΚth are usually examined using the S-N (or ε-N) and FCG da/dN-ΔK approaches, respectively. Historically, these two approaches are treated as a separate domain. This separation was due to the recognition that the nonuniform local stress field ahead of a crack differs significantly from the uniform stress field in a smooth specimen under axial fatigue loading. At present, there are no reliable approaches to analyzing these two regions in a unified way. In this paper, we first attempt to relate the experimental results of a cracked sample in the near-threshold region to the S-N fatigue limit of a smooth pull-push specimen. Then establish analytically the local stress intensity factor range ΔK at the process/damage zone ahead of the crack utilizing the local stress equal to ΔσFL in a smooth specimen. Doing such an analysis, we can account the variations between the applied and the local stress ratios R (=min stress/max stress) for both cracked and smooth samples. The proposed relationship between ΔKth and ΔσFL would enable the development of a unified framework for fatigue analysis methods to predict damage evolution under low-stress in-service loading conditions.

1. Introduction

Historically, smooth sample fatigue limit range (ΔσFL) was related to ultimate tensile stress (σUTS) for a single load ratio R = −1.0 usually at N = 107 cycles [1,2,3]. The relationship is observed to be linear, and the slope varied for different families of alloys in lab air. Figure 1 shows such a relationship for commercial steel and aluminum alloys with a slope ~0.45. Fatigue limit experiments are not commonly conducted at various load ratios R. Usually, R-ratio dependence on the fatigue limit is often determined using the so-called mean stress effect approaches such as by Goodman, Morrow, SWT as examples [4]. Smooth specimens are used in fatigue limit experiments (ΔσFL), while pre-cracked fracture mechanics samples are used in fatigue crack growth threshold tests, such as ΔKth.
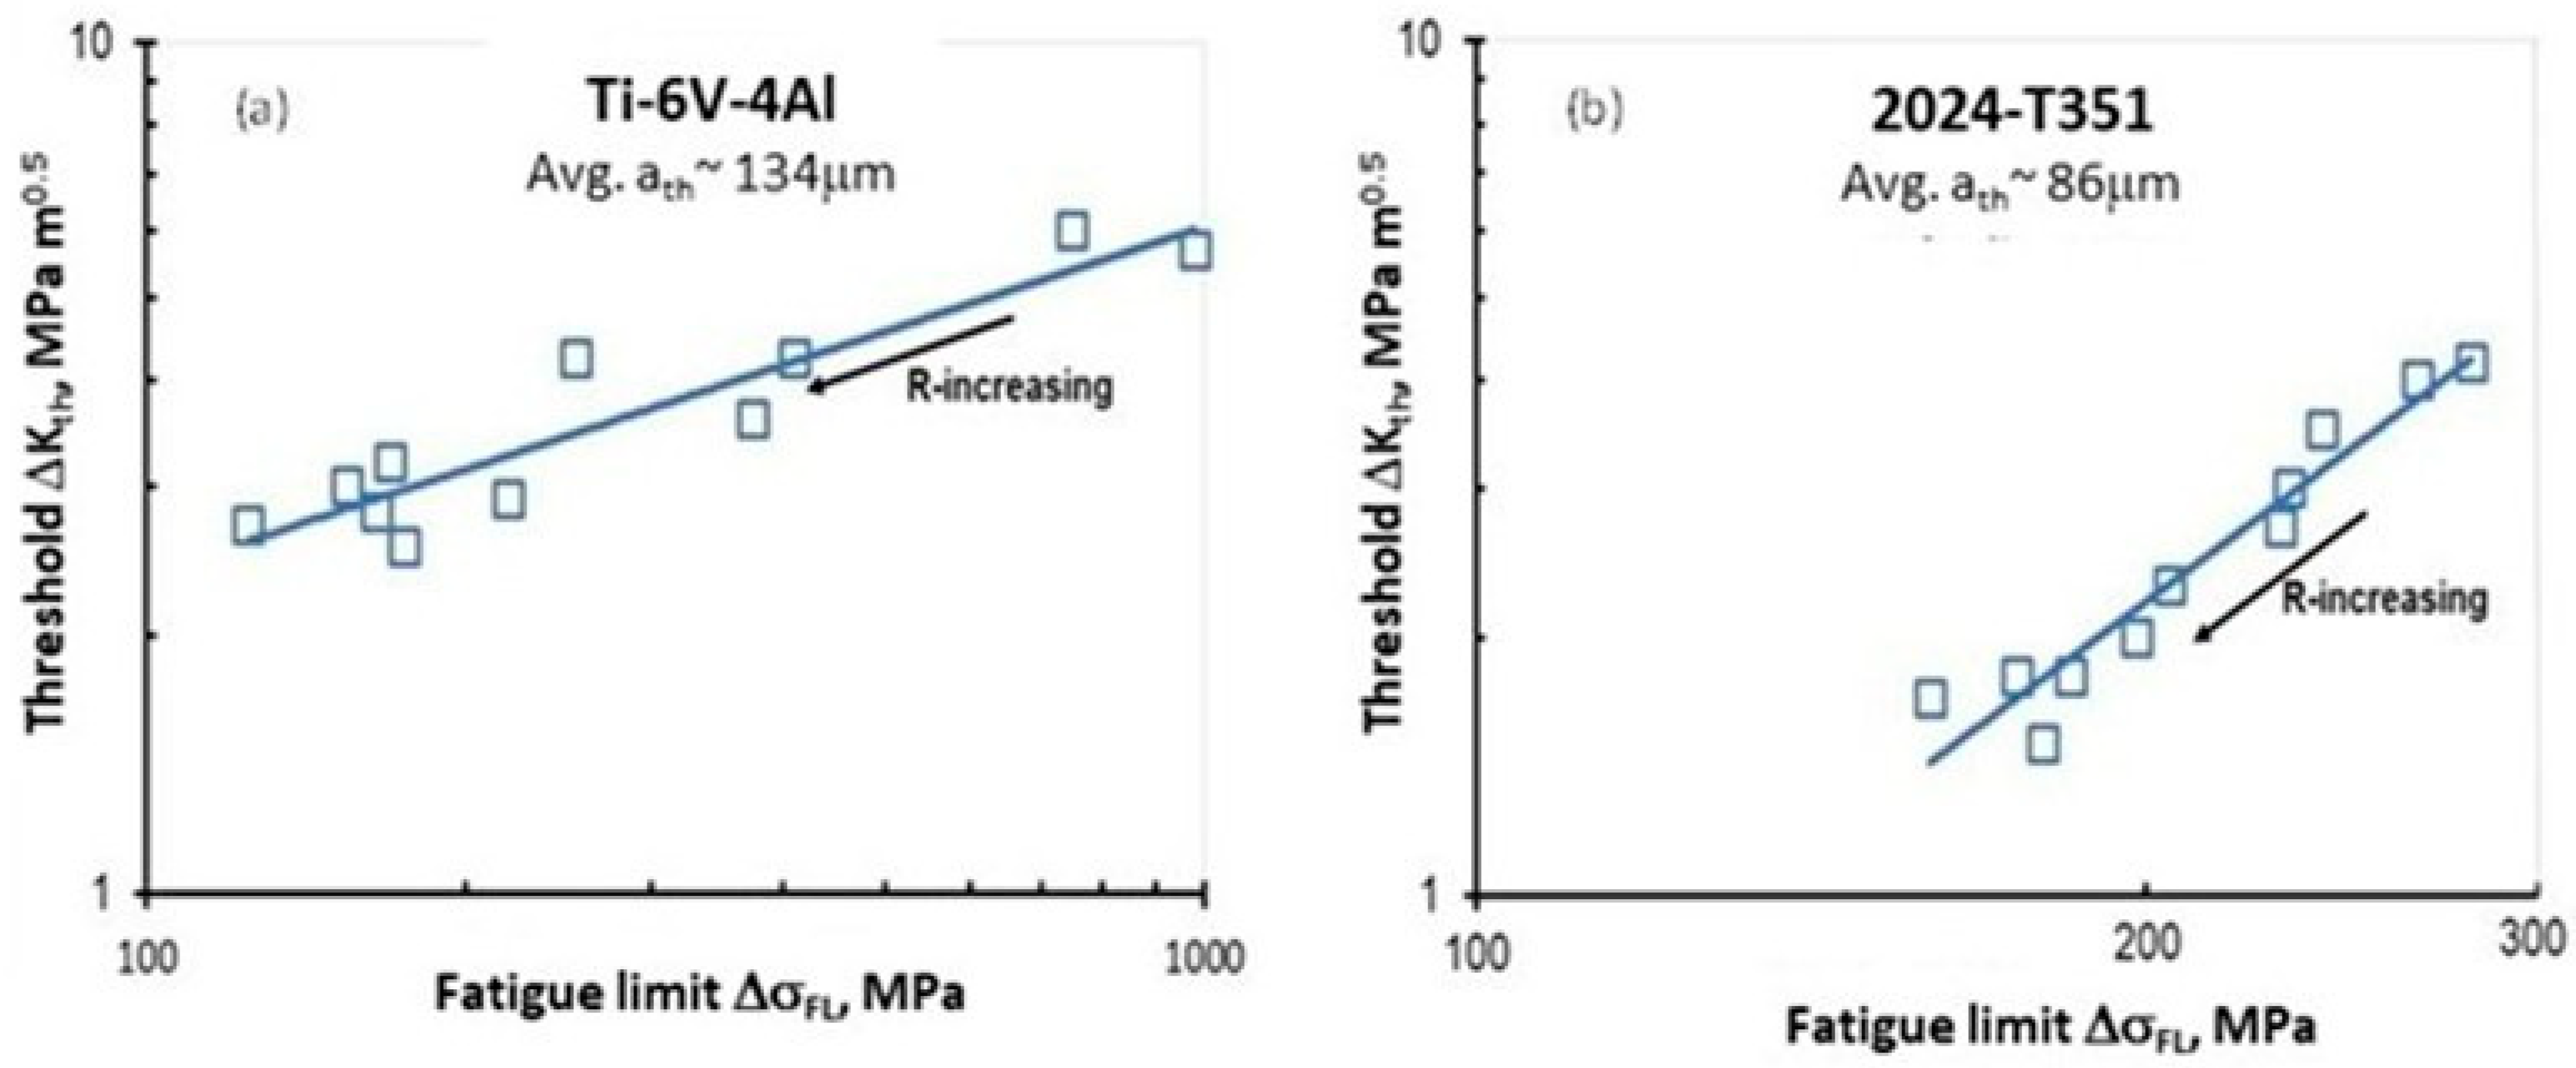
Figure 2 shows the log-log relationship between ΔKₜₕ and the fatigue limit ΔσFL for two different types of commercial alloys, Ti-6Al-4V (yield strength, YS = 950 MPa, Young’s modulus, E = 115 GPa) [5,6,7] and 2024-T351 (YS = 320 MPa, E = 71 GPa) [8,9]. Each data point is for a given applied load ratio R, the arrow indicates the direction of R-increasing. Applied R vales are matched for both ΔKth and for ΔσFL. Slopes in Figure 2 relates to a length parameter such as crack depth, ath, through the use of Mode I stress intensity factor equation
K t h = F ( σ F L ) π a t h ,
where F is the geometry/loading parameter (e.g., for a semi-circular surface crack F = 0.728).
These two illustrations in Figure 2 suggest that the fatigue limit ΔσFL and fatigue crack threshold ΔKth are related and the reason for this trend needs some analysis.

2. Background

Currently there are several fatigue software tools, such as n-Code, FASTRAN, NASGRO, and AFGROW, that were developed in the 1980s based on high-cycle S-N fatigue data and the Paris region of fatigue crack growth (FCG). These modeling tools primarily addressed relatively fast mechanical damage caused by loads much higher than the fatigue limit σFL or the threshold stress intensity factor range ΔKth and contains a number of adjustable parameters. As a result, these approaches to fatigue do not account for damage caused by low mechanical loads near the threshold or fatigue limit where the component spends most of its service life.
From the engineering point of view, relating fatigue limit ΔσFL and FCG threshold ΔKth is of importance since most of the useful life is spent when the cracks are small and grow in the near threshold/fatigue limit regime before they can be detected by a non-destructive inspection (NDI) equipment. It is known that most of the total fatigue life in service, around 70–80%, is spent in the regions near fatigue limit or FCG thresholds where small cracks dominate. Figure 3 schematically illustrates the stages to failure in terms of defect/crack size versus time/cycles of service.
Key features of this figure show that by the time NDI detects a crack, the component has lost ~70–80% of its life. Above the NDI limit, crack growth enters Paris region where the remaining life is about 20–30%. Small initiated cracks (corresponding to the left low corner of the graph) are highly affected by the alloy microstructure, load history, environment, etc.
Traditionally, fatigue life has been analyzed using a stress- or strain-based approaches (S-N or ε-N curves) in terms of number of cycles Nf (or reversals 2Nf) to failure whereas, FCG rate (da/dN) has been analyzed in terms of stress intensity factor range ΔK [1,2,3,4,10]. As a result, these two approaches have been kept as a separate domain in the fatigue and fracture mechanics fields.

2.1. Stress/Strain Approach to Fatigue

The S-N approach was developed for high cyclic fatigue (HCF), where loading is mostly elastic, whereas the εp-N approach for low cyclic fatigue (LCF) where plastic strain dominates.
Basquin’s Equation (2) is often used to describe S-N curves at HCF regime:
σ a = σ 2 = σ f 2 N f b
and Manson-Coffin’s Equation (3) is used to describe εp-N curves at LCF:
ε a , p = ε f 2 N f c
To analyze both LCF and HCF regimes, the total strain amplitude εa = σa/E + εa,p is used [2]
ε a = σ f E 2 N f b + ε f 2 N f c
where E is Young’s modulus, σ f and ε f are strength and ductility coefficients and b and c are strength and ductility exponents, respectively.
The fatigue limit, ΔσFL, is defined as a cyclic stress range (or strain range ΔεFL = ΔσFL/E) corresponding to an endurance life at Nf = 106–108 cycles. The endurance life is usually associated with a fully reversed loading where stress ratio R = −1. For polycrystalline engineering alloys the endurance limit is observed to be related to crack initiation and its subsequent arrest, predominantly in individual grains, at obstacles/barriers such as at the grain boundaries or at hard particles. Conventionally, it is considered that for a stress amplitude σa < σFL there is no observable damage, and the material has practically an infinite life.

2.2. Fracture Mechanics Approach to Fatigue

For a cracked body, the FCG rate, (da/dN), is plotted versus the applied stress intensity range, ΔK, as:
d a d N = C K m
where C and m are fitting parameters for a given R-ratio and environment.
Equation (5) was initially proposed by Paris, Gomez, and Anderson [11] in 1961. It is worth noting that the 1961 manuscript was rejected by three leading journals, and the authors were only able to publish it in a university journal. To support Equation (5), Paris et al. [11] provided experimental data of da/dN vs. ΔK for two materials from three independent studies. For the first time, Equation (5) offered the theoretical basis for FCG analysis, whereas, before 1961, only empirical estimations were utilized. In 1963, Paris and Erdogan published a second paper in the Journal of Basic Engineering [12], after which Equation (5), an empirical relation which correlates data, became commonly known as Paris’ Law. More than 30 years later, in 1998, Paris reflected on his classical Paris’ Law equation [13]: “Well, that paper was very promptly rejected by three of the world’s leading journals. All of the reviewers simply stated that “no elastic parameter, e.g., K, could possibly correlate fatigue cracking rates because plasticity was a dominant feature”. It can be noted that the reviewers proceeded with their prompt rejections by completely ignoring the presented data. Indeed, it was later found that Paris’ Law has a number of limitations, such as: it applies only at a mid-range of FCG rates and is affected by R-ratio. When applied to small cracks, it shows unusual behavior compared to long cracks. The effect of R-ratio was later rationalized by the crack closure argument proposed by Elber [14]. The small crack effects were often attributed to several factors, including a possible breakdown of fracture mechanics similitude, the effect of microstructure orientation, reduced crack closure, crack shape and deflection, retardation at grain boundaries, and others [10]. To account for small crack effects below the ΔKth for long cracks, some researchers postulated a lower threshold for small microstructural cracks [15]. For some of the reasons mentioned above, it has been argued for the last 50 years that the fatigue limit ΔσFL and the threshold for fatigue crack growth ΔKth have evolved into two separate fields of study. Typically, the threshold of FCG, K t h , is defined when (da/dN) = 10−10–10−11 m/cycle (close to the lattice parameter of an alloy) which, from a practical viewpoint is considered to be non-propagating crack when the applied ΔK ΔKth. During fatigue testing the independent/input variable is the applied cyclic stress Δσ or ΔK whereas material response represents the dependent/output variable in terms of cycles to failure (Nf) or FCG rate (da/dN).
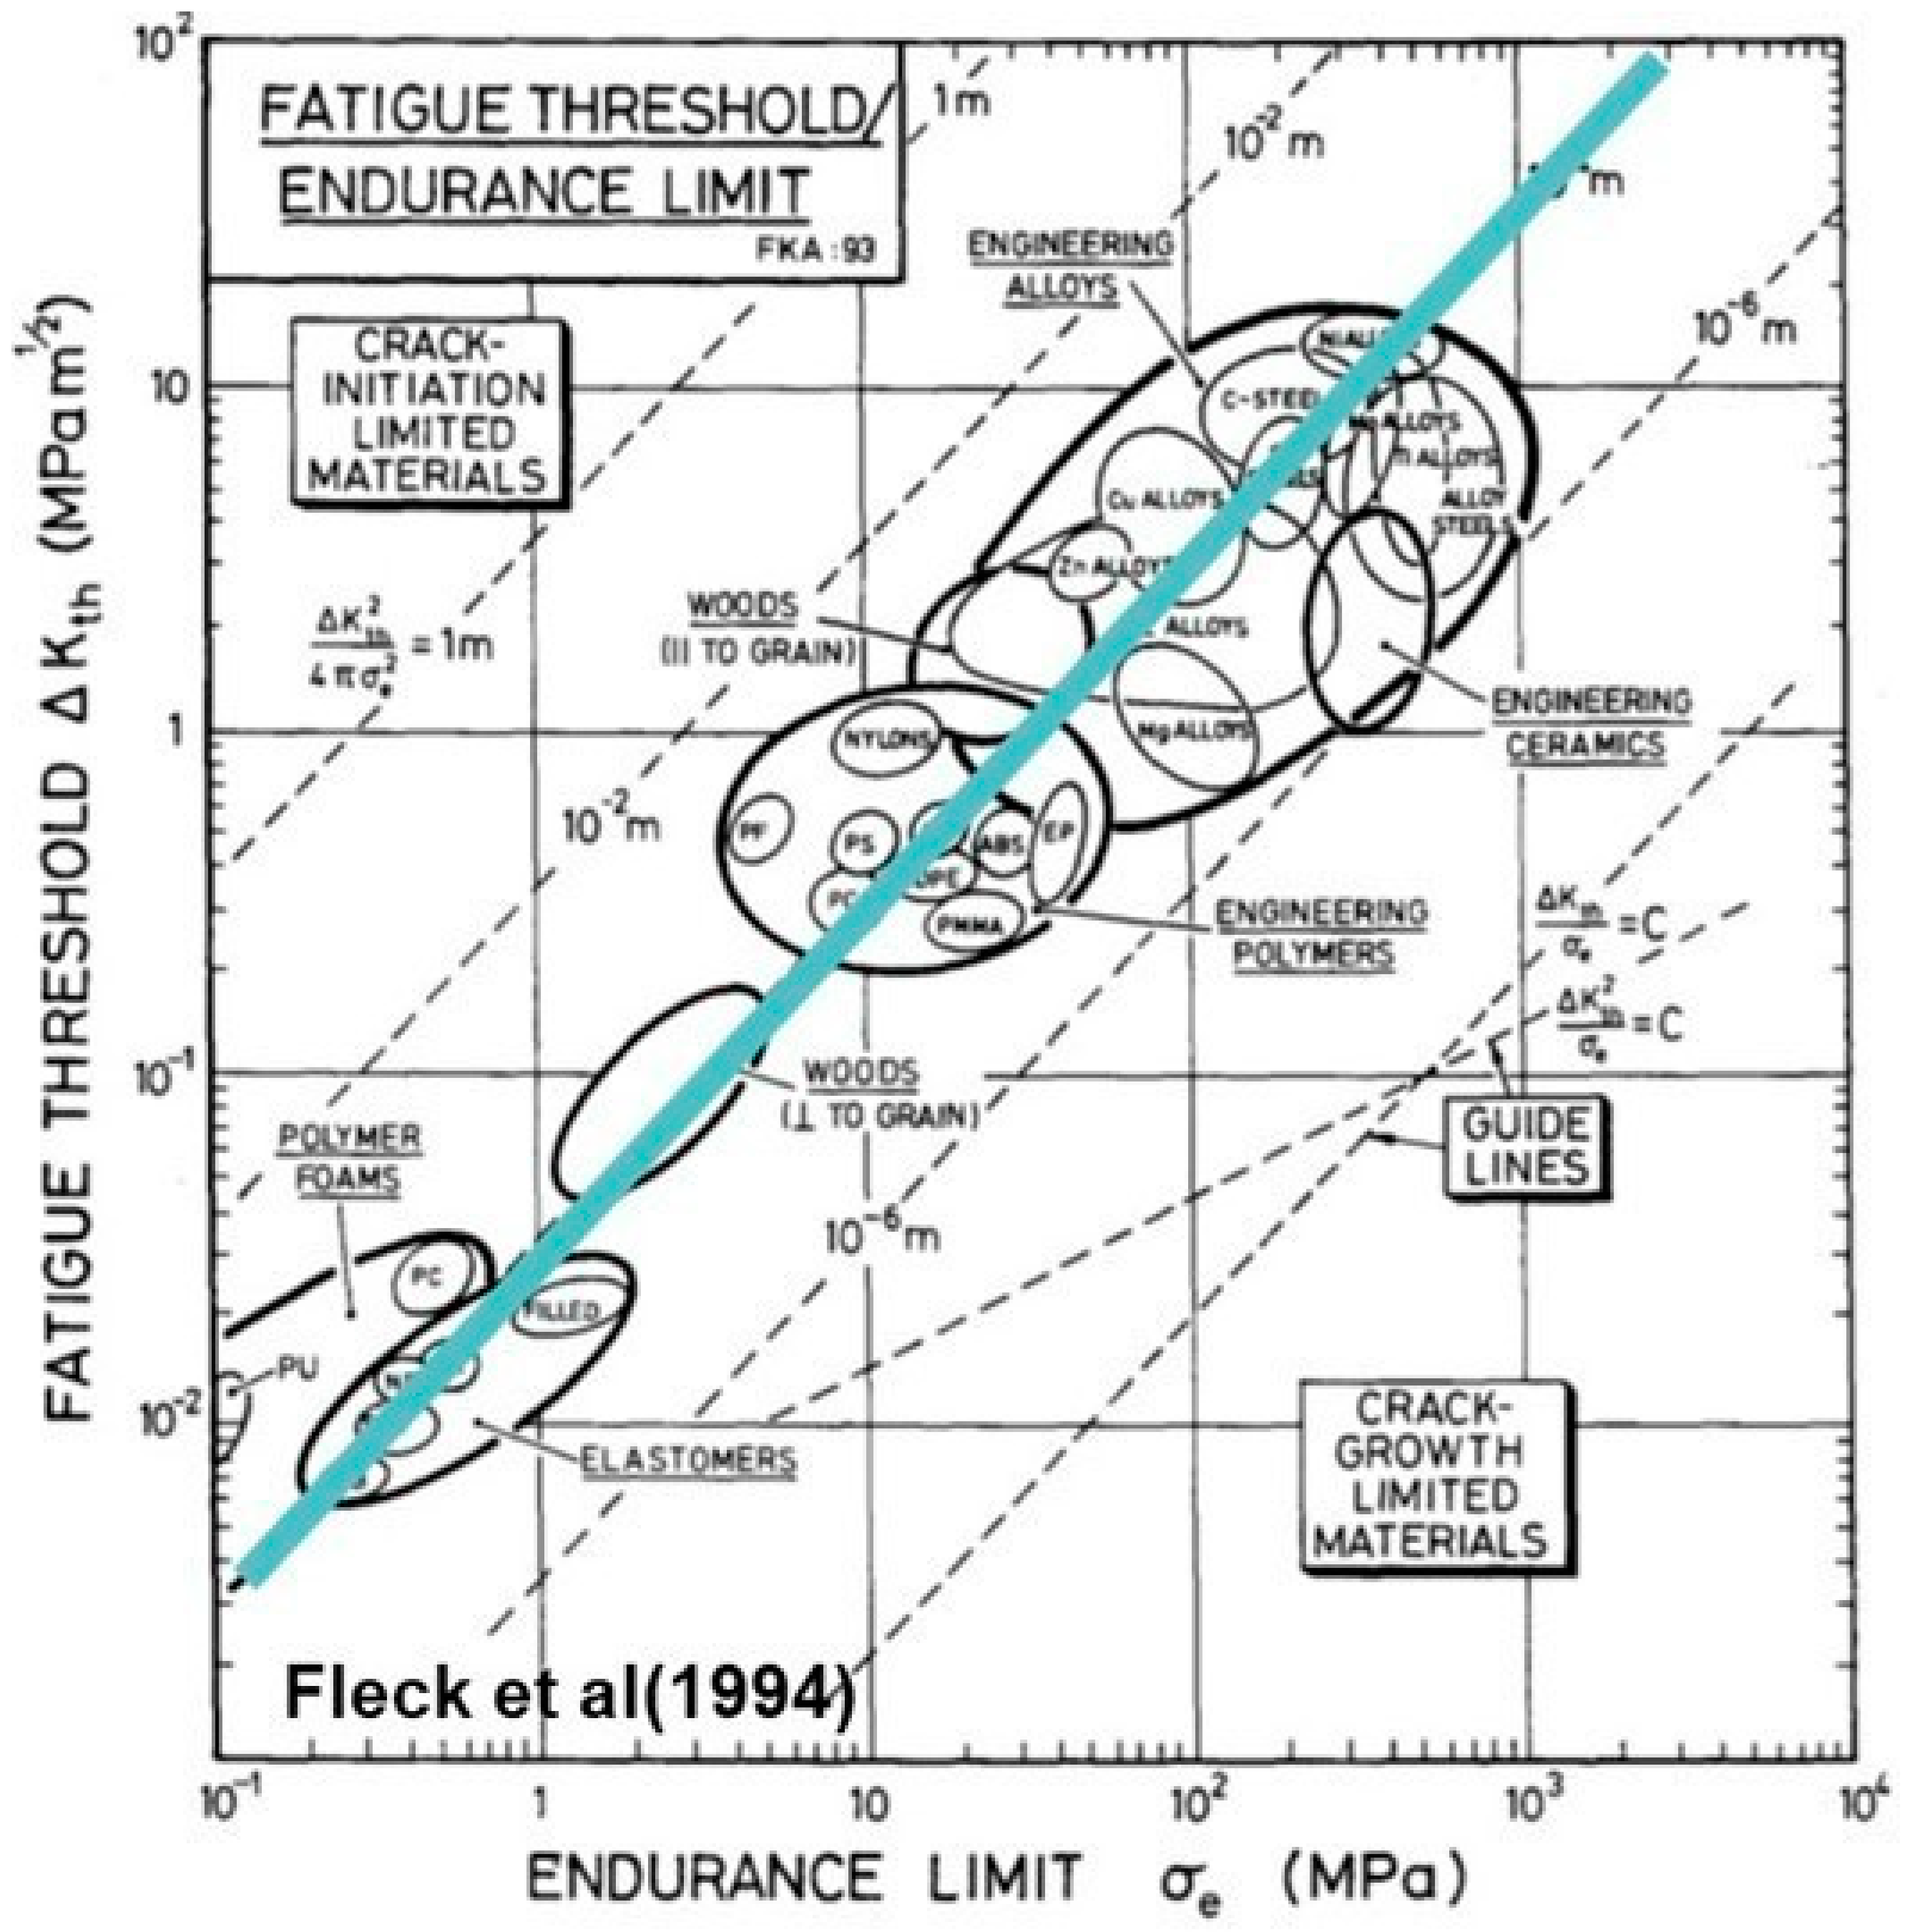
Figure 4 depicts an empirical correlation between fatigue limit ΔσFL (at R = −1) and FCG threshold ΔKth (at R = 0) for various family of materials on a log-log plot suggested by Fleck at al. [16]. This general trend is not for one particular material but for various family of materials that underline a physical relation between σFL and ΔKth. Such a general observation was described qualitatively in Reference [16]. Using Equation (1) and setting ΔσFL = 2σFL for R = −1 (in Figure 4 σe = σFL), and F   1   one may write the following relationship for ΔKth at R = 0:
K t h = 2 σ F L π   a t h
Assuming σ F L σ y c (where σ y c is the cyclic yield strength) the cyclic process or damaging distance d t h can be estimated as
d t h a t h = 1 π K t h 2 σ y c 2
According to Figure 4 this cyclic process zone d t h is approximately same for various family of materials at threshold. It should be noted that Equation (7) is obtained for a special case relating amplitude of σFL, at R = −1 and ΔKth at R = 0 (two different applied R-ratios). As a 1st approximation, Equations (6) and (7) can be assumed as the crack initiation criteria. Equation (6) does suggest a relationship can exist between ΔΚth and ΔσFL via a critical crack length ath. Closer examination of Equations (6) and (7) and Figure 4 leads to the following important conclusion that the threshold ΔKth and fatigue limit σFL are coupled through a common process zone d t h where an average stress range (in the continuum mechanics sense) is equal to the fatigue limit: ΔσFL = 2σFL = 2σe.
An average trend line (thick line) is shown for all the materials. Since the ductile and brittle materials fall on the same trend line suggests that the threshold and fatigue limit regions are mainly in the elastic region.

2.3. Two Thresholds for Fatigue Crack

It is well documented that small, non-propagating cracks can be found at the fatigue limit of both smooth and notched specimens (e.g., [4,10,17,18,19,20,21]). This experimental observation supports the notion that, in general, there are two distinct fatigue thresholds: one for crack initiation and another for crack propagation. This distinction was particularly well demonstrated by Frost and Dugdale [17], and Nisitani [18], through tests on notched specimens with varying stress concentration factors (kₜ) or different notch-root radii (ρ), as illustrated in Figure 5.
The threshold for fatigue crack initiation can be estimated using the well-known approaches proposed by Neuber [22] or Peterson [23]. In these approaches, a fatigue notch factor, kf, is defined in terms of a material length parameter, the stress concentration factor kt, and the notch-root radius ρ [22,23]. The threshold for crack initiation is typically estimated by dividing the fatigue limit of a smooth specimen, ΔσFL, by kt or kf. For shallow notches, kf ≈ kt, whereas for relatively sharp notches, kf < kt.
Figure 5 defines three distinct regions:
  • The region below the threshold for crack initiation, where Δσlocal < ΔσFL and ΔKappl < ΔKth.
  • The failure region above both thresholds, where Δσlocal > ΔσFL and ΔKappl > ΔKth.
  • The region of non-propagating cracks, where Δσlocal > ΔσFL but ΔKappl < ΔKth.
Therefore, in order for an initiated small crack to propagate, both the local crack initiation threshold and the applied crack propagation threshold must be exceeded. The horizontal line corresponding to the crack growth threshold represents the lowest limiting condition where both thresholds are met. Crossing point of the crack-initiation threshold line with the crack-propagation threshold defines a branch point corresponding to a critical stress concentration factor kt,c or a critical notch radius 1/ρc, beyond which the two thresholds diverge, forming a zone of non-propagating cracks.
In other words, designing solely based on the crack initiation threshold can lead to overly conservative designs. It should be noted that Figure 5 is empirical and typically plotted for a given applied load ratio, Rappl. Due to stress gradients near the notch root or crack, the local stress ratio Rlocal differs from the applied stress ratio Rappl.
In the next section we discuss a general procedure which allows to relate σFL and ΔKth for any applied R-ratio linking fatigue damage at the process zone dth at near fatigue limit or threshold regime. In this process zone dth, one needs to consider a local stress ratio Rlocal in the continuum mechanics sense for Mode I loading. This is performed by examining the relationship between the fatigue limit ΔσFL and ΔKth under different applied R-ratios.

3. Analysis

The stress fields between uncracked and cracked geometries can be bridged using classical continuum mechanics, which suggest that a cracked component has high stress gradient ahead of a main fatigue crack where the local Rlocal within the process zone d t h is different from the applied Rappl. In contrast, for the uncracked component Rlocal = Rappl due to uniform stress distribution in the gage section of the sample. So, we need a correction factor to the applied Rappl in cracked samples to allow a comparison to the smooth sample. In the proposed analysis, we assume a continuum mechanics approach, neglecting the non-uniform microstress distribution within the individual grains for polycrystalline materials.

3.1. Relating R-Ratios for Uncracked and Cracked Samples

Let us consider the stress field ahead of a crack tip (CT-sample) and at a smooth (tensile sample) under uniaxial cyclic loading. Here we describe the similarities and dissimilarities between the two component stress fields, under the same applied Rappl cyclic loading conditions. Situation with stresses at a cracked body can be complex as one has to recognize the stress gradient, which is absent in a smooth tensile sample [24]. In a smooth sample, a stress gradient starts to develop with cycles after a micro crack is initiated within the persistent slip band (PSB) with a defined stress gradient. Here we are comparing damaging average stress within the process zone dth = ath and corresponding ΔK from two different geometries. For the sake of argument, we can assume that the process zone is equivalent to the average width of a PSB. Figure 6 illustrates the stress field ahead a crack tip to that at a smooth tensile sample at the same nominal applied load ratio Rappl = 0. Near the crack tip region, we illustrate a possible stress distribution as a function of distance ‘x’ from the main crack tip. At threshold, we assume the existence of a small semi-circular crack with a depth of ath for both geometries, as defined in Figure 6. Based on Figure 4 and Figure 6 the following hypothesis is proposed:
Within the damage zone δth = ath ahead of the main fatigue crack, the local ΔKth is the same as in a smooth tensile sample loaded at ΔσFL.
In other words, the local threshold conditions in terms of ΔσFL and ΔKth must be met for the smooth and for the cracked body within the process zone δth.
The above hypothesis is akin to the one used in the Theory of Critical Distance (TCD) proposed by Taylor [25]. It is postulated in the TCD that the average stress calculated at the critical distance should be equivalent to the stress in a smooth specimen. This average stress can be computed using point, linear, or volume methods, depending on the specific situation under consideration. In contrast to the TCD, which uses an average stress, we propose using the local SIF range, ΔKth, for small semi-circular cracks in either smooth or cracked specimens at the fatigue limit or threshold. Thus, the TCD can be seen as a stress-based approach, whereas the proposed method is SIF-based approach. The two approaches are equivalent only when the local stress is uniform.
In the next subsection an approximate approach will be used to estimate the correlation between ΔKth and ΔσFL. In general, for the C(T) sample, to determine the local average stresses at a distance x = ath a careful elastic-plastic analysis of stress–strain field is required. This will be performed in a future work using a finite element analysis (FEA) approach to calculate a local ΔK at the process zone δth = ath ahead of the main crack in a C(T) specimen.

3.2. Approximate Correlation of ΔσFL to ΔKth

This subsection provides the procedure to estimate the correlating factor between ΔKth versus ΔσFL for different applied R-ratios. In general, due to high stress concentration and gradient of the local stress field at a crack, σlocal within x = ath and ahead of the crack-tip, the applied Rappl may differ from Rlocal = σmin,localmax,local. For example, for a linear elastic material model (with no yielding) subjected to Rappl = 0 results in Rlocal = 0. On the other hand, for the case of an elastic-perfectly plastic material model under relatively high loading with Rappl = 0, the forward and reversed local plasticity would results in Rlocal = −1 within the reversed plastic zone. Experimental data taken from the literature were obtained at different labs using different testing methods, specimen’s geometry, material’s batches, loading conditions, slip systems, and at limited range of R-ratios. The experimental data of ΔσFL and ΔKth show a relationship against applied R-ratios exhibiting some scatter. Therefore, the trend can be smoothed by fitting the ΔKth and ΔσFL data with applied Rappl. For the uncracked samples (values of ΔσFL), due to uniform stress distribution, both applied and local R-ratios are the same, i.e., Rappl = Rlocal = R, for any R applied. In contrast, for the fracture mechanics samples values of ΔKth are plotted in terms of the applied Rappl since the local values of Rlocal are not known.
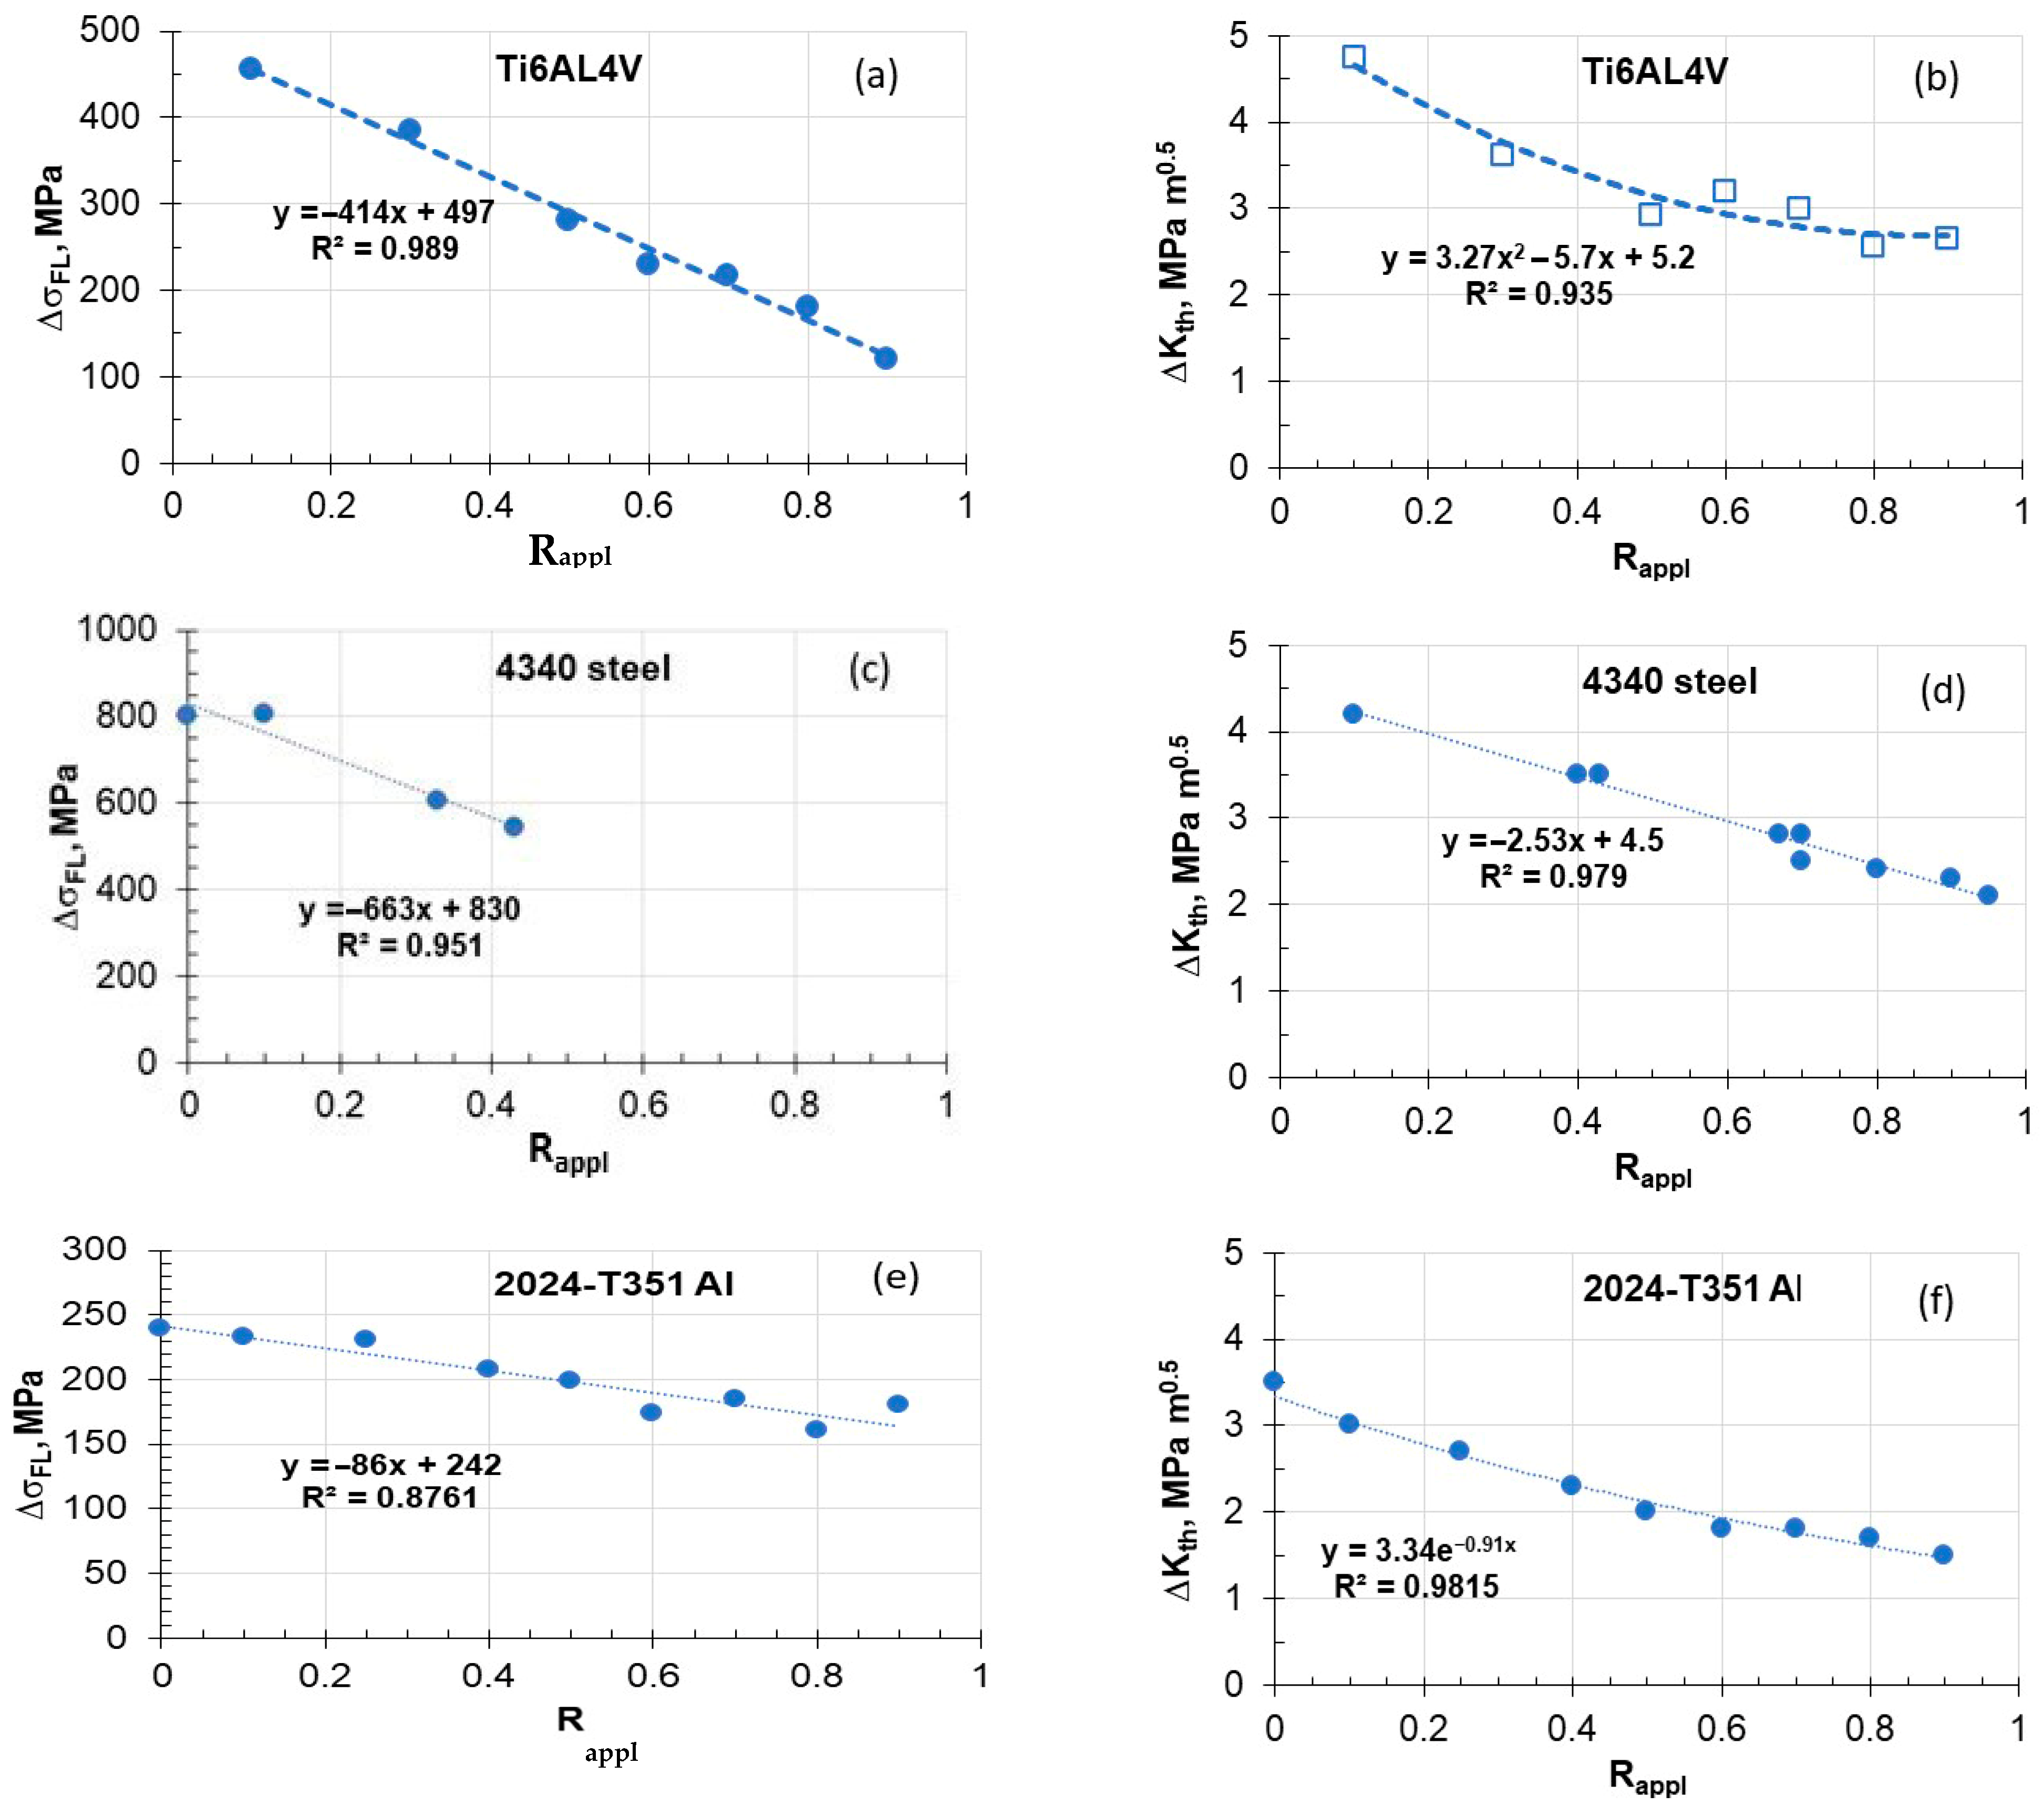
Figure 7 shows several plots of ΔσFL and ΔKth versus Rappl-ratios together with the best fit.
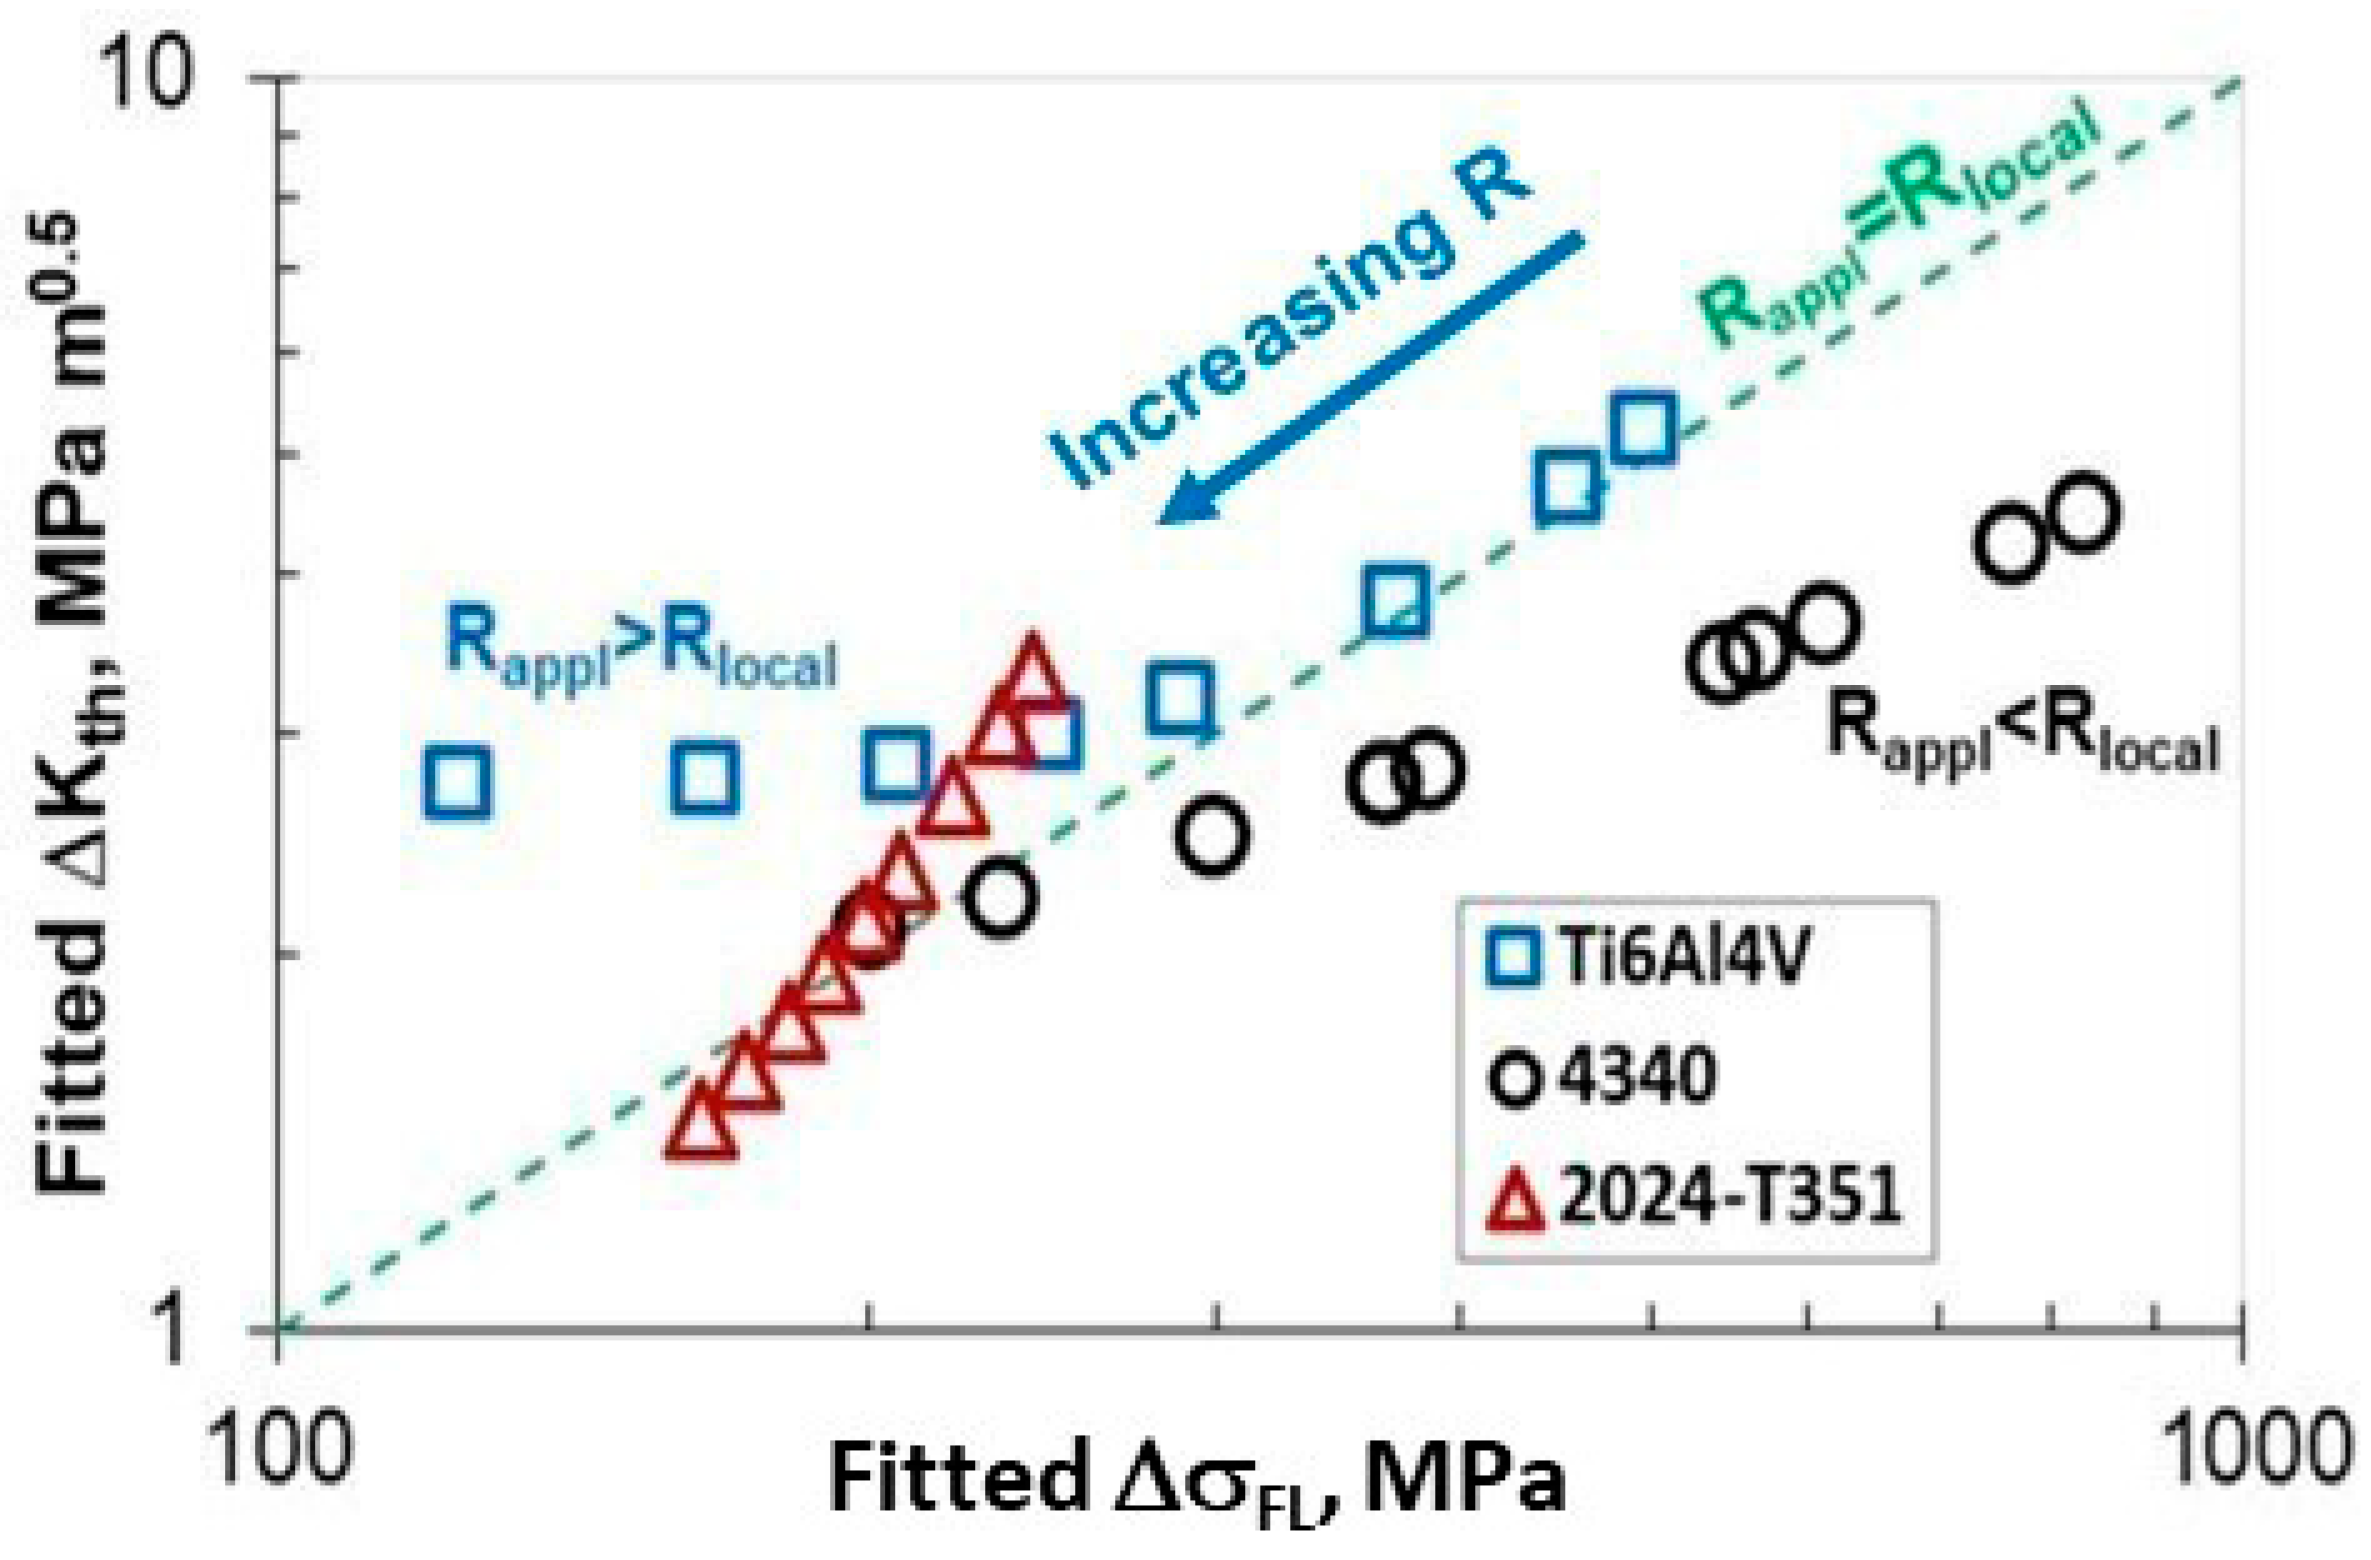
Curves/equations for the three materials selected in this study: Ti-6Al-4V [5,6,7], 2024-T351 Al alloy [8,9], and 4340 steel [9,26]. The equations from the best-fitting procedure are then used to re-calculate the fitted values of ΔσFL and ΔKth at R ranging from 0 to 0.95. These fitted ΔσFL and ΔKth values that gave Rlocal for the same Rappl are plotted against each other in log-log coordinates in Figure 8. It is noted that some points lie on the dashed trend-line with a slope equal to 1, with a small deviation. The points that are lying on the dashed line of unit slope, represent the correlation between fitted ΔσFL and ΔKth for the same Rappl. Therefore, in order to quantitatively assess how Rappl can be related to the Rlocal one needs a careful/detailed FEA model to account for the key parameters like the local stress gradient, monotonic pre-strain at maximum load, isotropic/kinematic hardening, as well as cyclic. The different trends in the alloy behavior in Figure 7 and Figure 8 is due to the differences in the cyclic YS, work hardening, slip and texture properties.
Due to lack of FEA data in the literature we will used a back extrapolation to estimate the relation between Rlocal and Rappl for fracture mechanics specimens.
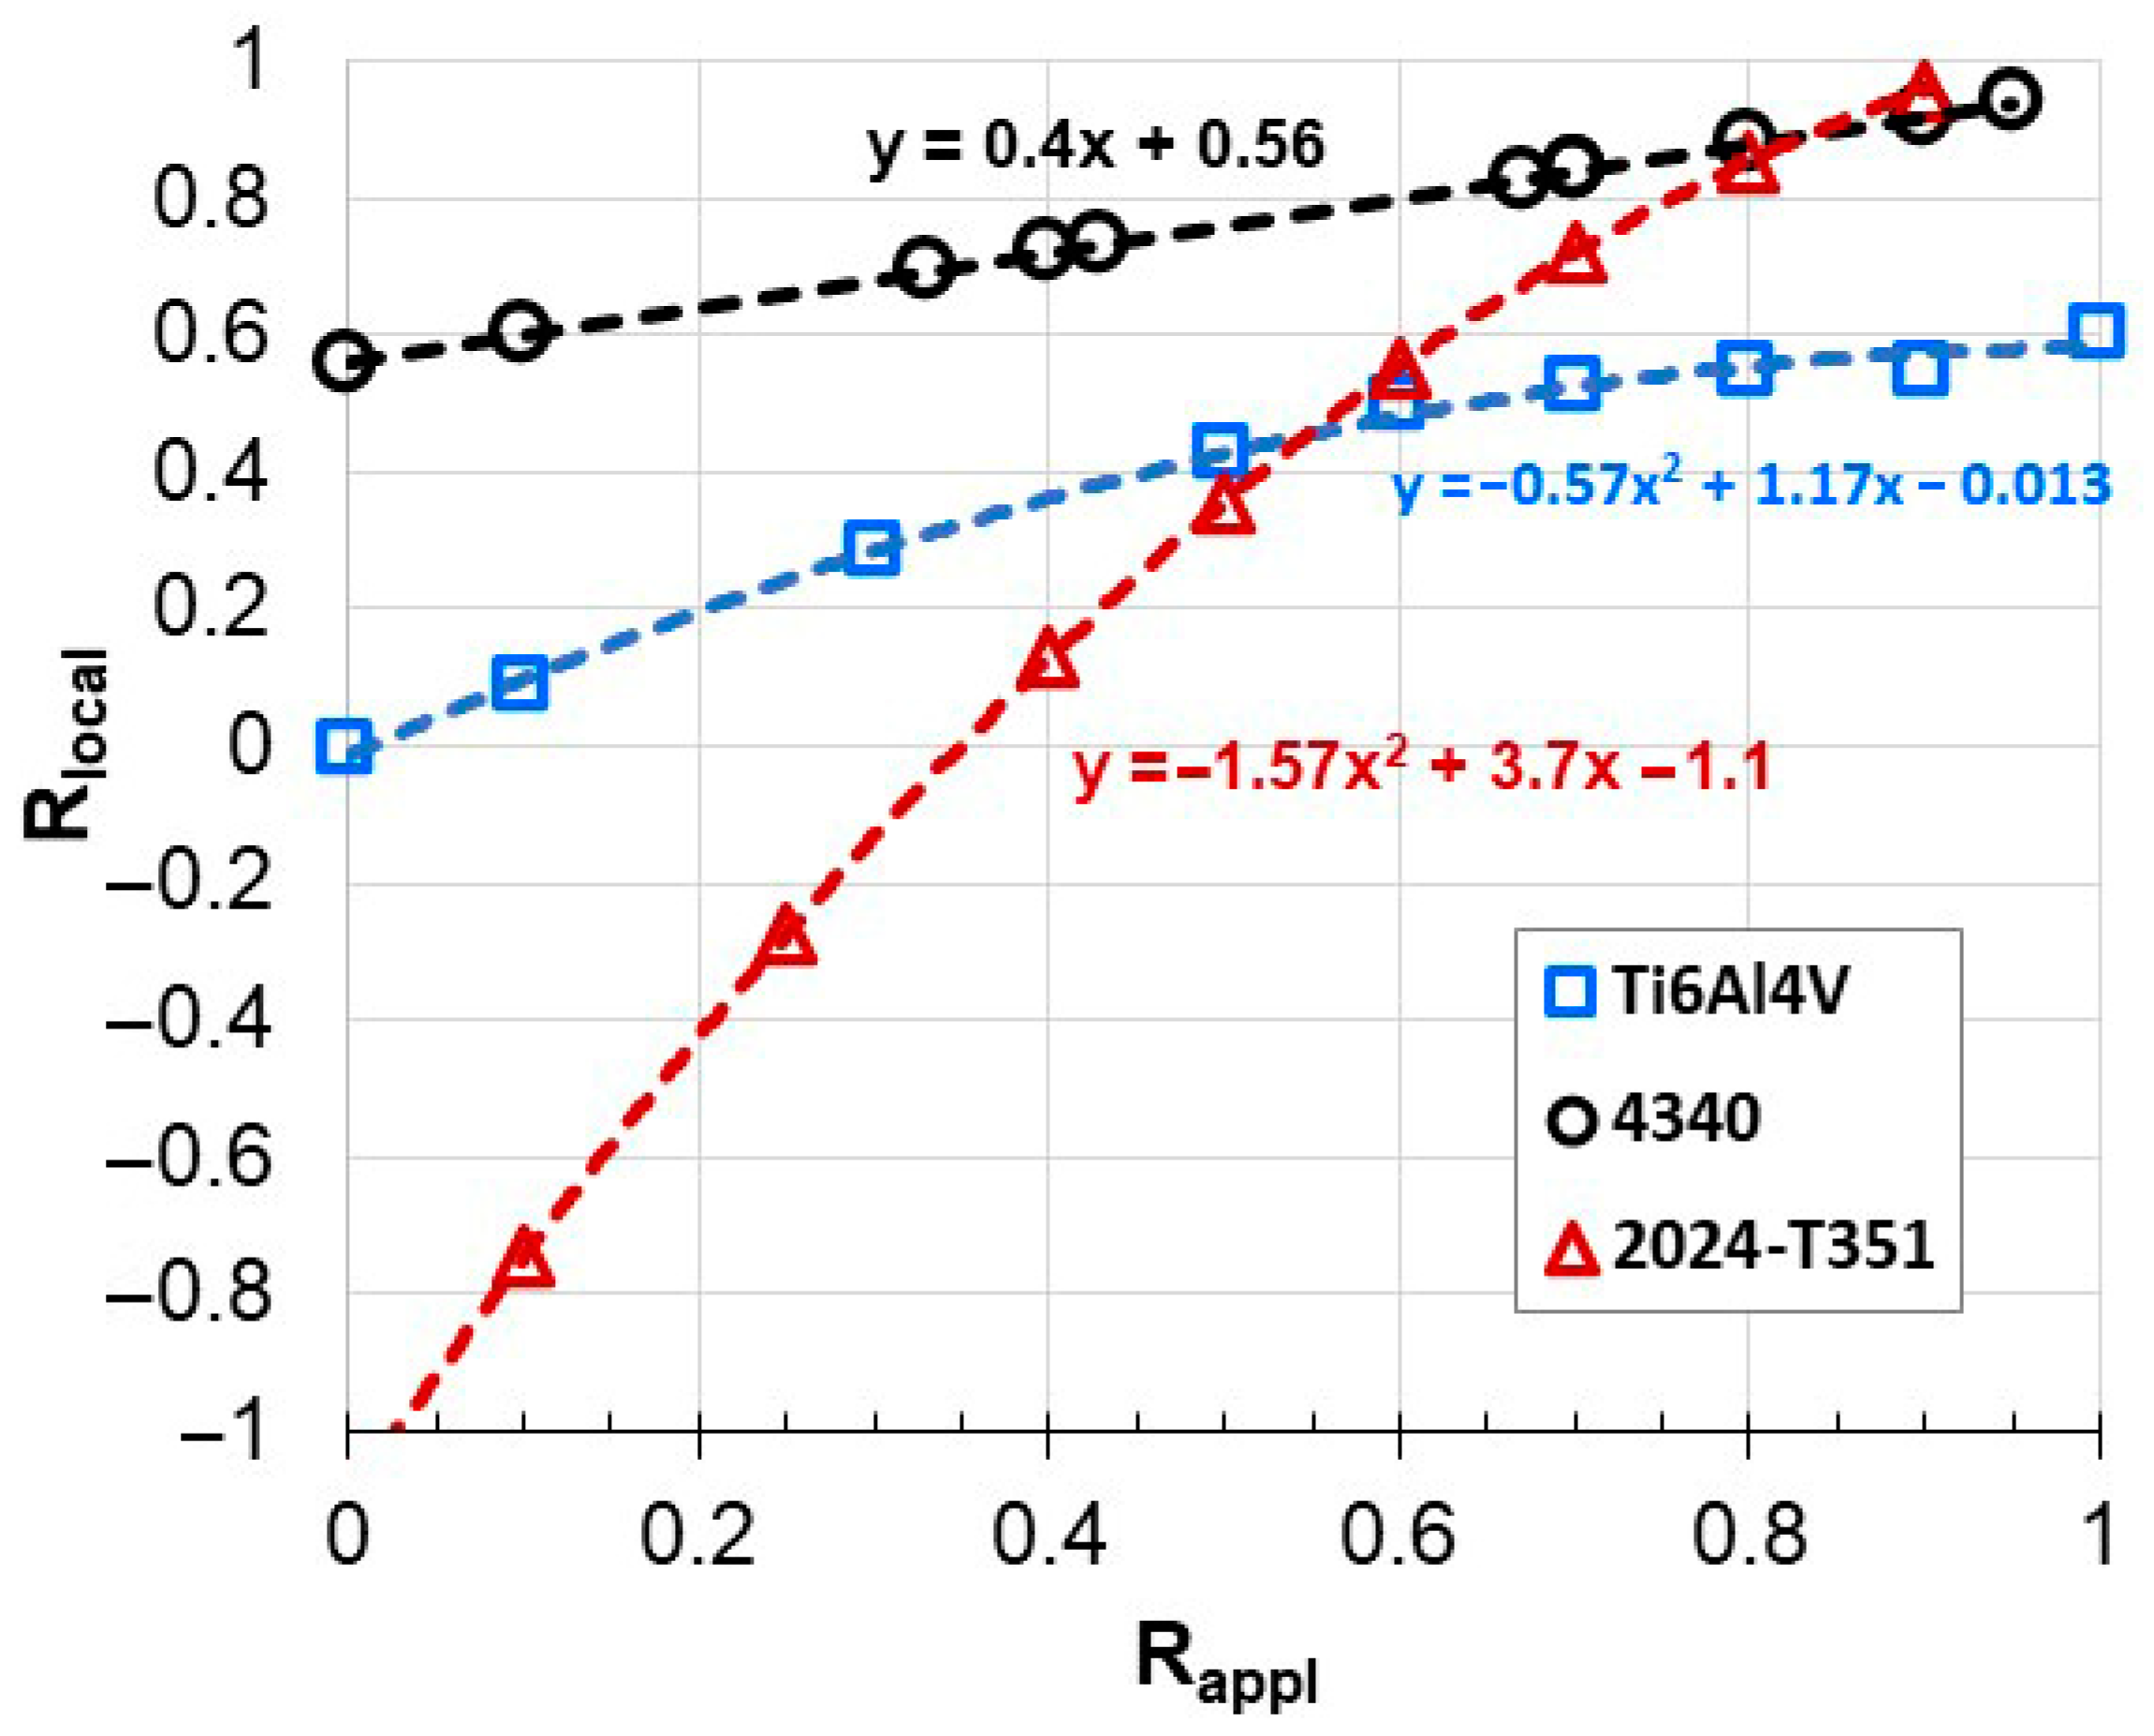
It can be noticed that some points in Figure 8 lie on the dashed diagonal line in log-log coordinates, while others are located above or below the dashed line. Points which lie on the dashed line indicate that the applied and local R-ratios are matching for both smooth and fracture mechanics samples, i.e., Rappl = Rlocal. Points that lie above or below the dashed line indicated that Rlocal are lower or higher, respectively, with respect to Rappl. Such points can be translated horizontally onto dashed line by adjusting the Δσ values. These adjusted of Δσ values can then be fitted into the equations depicted in Figure 7a,c,e and solved for the local values of Rlocal. Subsequently, by plotting these values Rlocal versus Rappl the relations among them can be established as it is shown in Figure 9 by the best fit lines. The corresponding equations allows to calculate Rlocal for any Rappl. Then Rlocal can be used to calculate the correct local ΔσFL by utilizing equations in Figure 7a,c,e. Finally, we can relate the experimental ΔKth for Rappl and the local ΔσFL values corresponding to the Rlocal and replot to get Figure 9. It is important to note that as Rappl increases Rlocal are approaches 1. It means, that at high applied R-ratios material within ath distance behaves almost elastically, which results in Rlocal → Rappl. Only Ti6Al4V shows that Rlocal tends to 0.6 at high Rappl values, which could be due to its material deformation behavior and environment. Interestingly, 4340 and Ti6Al4V show very similar trends even though their deformation behaviors are different.
Figure 9 indicates different trends between Rappl vs. Rlocal for the three materials investigated. These different trends seem to be related to diverse micro-slip systems in these alloys. The 2024-T351 alloy predominantly exhibits planar slip with a sharp crack, whereas the 4340 alloy exhibits homogenous slip with a blunt crack. Planar slip alloys maintain their crack tip to be sharp during crack extension, while a cross slip (homogeneous slip) material goes through crack blunting and resharpening process. On the other hand, Ti6Al4V exhibits a crystallographic anisotropy allowing cracks to change directions from grain to grain, similar to planar slip materials, in particular, at the threshold, with basal slip system. These suggest that micro-slip features and associated crack-tip blunting needs to be included in the proper finite element analysis when calculating the local σavg in the process zone within x = ath ahead of the crack-tip.

3.3. Estimated Relation Between ΔσFL and ΔKth

Figure 10a–c depicts estimated results for three alloys (Ti6Al4V, 4340 and 2024) in the log-log variation in the ΔKth versus ΔσF for Rappl  0 using an analysis described in Section 3.2. By this analysis, the linear relation in log-log plot between ΔKth and ΔσFL can be established. It is noted that the corresponding threshold crack sizes ‘ath are also provided in Figure 10 for three materials investigated and are almost constant for R-ratios ranging from 0 to 0.9. The threshold ‘ath’ values were calculated according to Equation (1) assuming F = 0.728 for a semi-circular surface crack.
It is interesting to note, again, the ath values are very similar, for these three alloys, and generally support the earlier comments with respect to Fleck at al. [16] relationship depicted in Figure 4.

4. Discussion

The above analysis assumes that there exists a small hypothetical crack of size ‘ath’ that is common for both the cracked and uncracked samples. Some uncertainty may come in when other variables such as different crack shapes are introduced to this assumption. In the case of a long crack near the threshold, the crack front does not extend uniformly along its entire length. Instead, crack propagation is uneven and occurs through a localized process of crack extension in shear mode for aluminum alloy (EN-AW 6082) in both peak-aged and overaged conditions [27,28]. These tests were conducted at two R-ratios of −1 and 0.1 on flat dogbone specimens with L-S and T-S orientations. It was demonstrated that two mechanisms prevent the crack front from extending uniformly due to pinning by primary precipitates and shear-controlled crack extension with plastic deformation similar to stage-I small cracks. Interaction with precipitates resulted in kinking and deflection of the shear-controlled crack but did not change the extension mode, which resembled that of stage-I small cracks. Recently, Tanaka et al. [29] showed the relationship between the opening- and shear-mode FCG thresholds and the fatigue limit of a planar slip Ni-based superalloy 718. They proposed a novel strategy for evaluating the fatigue limit based on the competition between the opening and shear modes of the FCG threshold.
The validation of the proposed hypothesis relating ΔσFL and ΔKth was performed for three very dissimilar materials: (α + β) Ti-6Al-4V crystallographic texture alloy [5,6,7], 4340 high strength wavy slip alloy [9,26], and 2024-T351 planar slip low strength aluminum alloy [8,9]. These materials were selected because they had been tested at various load ratios to obtain both ΔKth and ΔσFL, in a common lab air environment. Fatigue limit ranges, ΔσFL, were selected at N = 106–108 cycles. The S-N fatigue limit data were taken from the references. Fatigue crack growth thresholds, ΔKth, were taken at a (da/dN) =10−9–10−10 m/cycle. The collected data were all from lab air with relative humidity varying from 30% to 50%. As a result, there is some scatter in the data presented due to variations in yields stress, sample testing orientation (LT, TL, ST), test frequency and test methods like load shedding vs. compression pre-cracking, etc. In addition, there are variations in oxygen content in the Ti-alloy and internal H in 4340 which influences their yield stress and fatigue limits. Several of the similar magnitude data points fall from different sources and cluster together. Details of the R-ratio results are given in the respective references listed. The above simple analysis seems to support the above hypothesis for Ti-6Al-4V alloy, 4340 steel, and 2024-T351 Al alloy results.
The present approach sheds light on another disputed topic in the literature, which is related to small cracks that exhibit faster growth rates compared to long cracks under the same ΔK applied. The traditional explanation is often attributed to the crack closure argument. It is suggested that small cracks experience relatively low plasticity induced crack closure (PICC) due to their limited crack wake, compared to long cracks. As the crack size increases and the crack wake expands, PICC becomes more pronounced, and the crack behavior transitions to that of a long crack. However, this explanation is disputed based on experimental observations published by Cappelli et al. [30], where they demonstrate that the transition from small to long fatigue crack growth occurs when the scatter in FCG sharply decreases and steady-state growth is reached. This transition is shown to correspond to the crack size at which the crack front intersects approximately 15 grains. Such a transition was experimentally validated for both single corner micro-cracks and multi-site micro-cracks on smooth surfaces.
Based on the present analysis and experimental evidence [27,28,29,30] we propose the following interpretation relating to small versus long fatigue crack behavior. In homogeneous polycrystalline ductile metallic materials, fatigue cracks usually initiate at the surface in grains that are favorably oriented due to maximum shear stress. Such cracks begin to grow as small cracks along these favorable planes, typically at 45° to the surface. These favorable plastic shear planes are associated with the maximum fatigue damage, which varies from grain to grain due to differences in grain orientation, resulting in significant scatter in the observed small FCG rates. As such, small cracks are not initially constrained to grow in Mode I. As the crack grows longer, the crack plane gradually rotates to become perpendicular to the applied load (Mode I). At this point, the crack extension no longer coincides with the maximum shear or damage plane. As a result, the Mode I crack may exhibit a more complex, microstructurally induced zig-zag crack front geometry, which enhances toughness [31] and reduces plasticity along its path. This leads to reduced damage, a slower growth rate in terms of ΔK compared to small cracks, and less scatter. The FCG rate of long cracks near threshold, in terms of ΔK, assume that the crack front of these cracks is planar.
Recently, Meia et al., in their state-of-the-art review paper [32] concluded that “… non-propagating microstructurally small crack at fatigue limit load indicate that both a microstructure-dependent characteristic length and the stress distribution over the length scale are needed for a fatigue limit characterization.”

5. Conclusions

In this paper, we relate the near-threshold behavior (da/dN)~10−10–10−11 m/cycle for a cracked sample to the S-N fatigue limit (N~106–10−8 cycles) of a smooth specimen ΔσFL. This relation is established through the average local SIF range ΔK at the process/damage zone ahead of the long crack and that in the smooth specimen. In doing so, we account for the variations between applied and local load/stress ratios R for both cracked and smooth samples. The proposed relationship between the ΔKth threshold and the fatigue limit ΔσFL will serve as the basis for developing of a unified fatigue analysis method for predicting the component’s service life.

Author Contributions

Conceptualization D.K.; methodology D.K.; original draft preparation D.K.; data analysis D.K.; data curation A.K.V.; review and editing A.K.V. All authors have read and agreed to the published version of the manuscript.

Funding

The presented research was funded by the Office of Naval Research grant No.: N000142412177.

Data Availability Statement

The data that suport the findings of this study are available from the corresponding author upon resonable request.

Conflicts of Interest

The authors declare that they have no known competing financial interest or personal relationship that could have appeared influence the work reported in this article.

References

  1. ASTM. Annual Book of ASTM Standards; American Society for Testing and Materials: West Conshohocken, PA, USA, 1997. [Google Scholar]
  2. Morrow, J. Fatigue properties of metals, section 3.2. In Fatigue Design Handbook, Pub. No. AE-4; Section 3.2 is a summary of a paper presented at division 4 of the SAE Iron and Steel Technical Committee, Nov. 4, 1964; Society of Automotive Engineers: Warrendale, PA, USA, 1968. [Google Scholar]
  3. ASTM. E647-23b: Standard Test Method for Measurement of Fatigue Crack Growth Rates; ASTM International: West Conshohocken, PA, USA, 2024. [Google Scholar]
  4. Dowling, N.E.; Kampe, S.L.; Kral, M.V. Mechanical Behavior of Material, 5th ed.; Pearson: London, UK, 2019. [Google Scholar]
  5. Boyce, B.L.; Ritchie, R.O. Effect of load ratio and maximum stress intensity on the fatigue threshold in Ti-6Al-4V. Eng. Fract. Mech. 2001, 68, 129–147. [Google Scholar] [CrossRef]
  6. Ravichandran, K.S. Near threshold fatigue crack growth behavior of a Titanium alloy: Ti-6Al-4V. Acta Metall. Et Mater. 1991, 39, 401–410. [Google Scholar] [CrossRef]
  7. Peters, J.O.; Boyce, B.L.; Chen, X.; McNaney, J.M.; Hutchinson, J.W.; Ritchie, R.O. On the application of the Kitagawa–Takahashi diagram to foreign-object damage and high-cycle fatigue. Eng. Fract. Mech. 2002, 69, 1425–1446. [Google Scholar] [CrossRef]
  8. Groves, H.J. Fatigue of Aircraft Structures, NAVAIR 01-1A-13; Supt. of Docs., U. S. Govt. Print. Off.: Washington, DC, USA, 1966. [Google Scholar]
  9. Newman, J.C.; Vizzini, A.J.; Yamada, Y. Fatigue Crack Growth Data Bases and Analysis for Threshold Behavior in Rotorcraft Materials, DOT/FAA/AR/103; Department of Transportation: Washington, DC, USA, 2010. [Google Scholar]
  10. Suresh, S. Fatigue of Materials, 2nd ed.; Cambridge University Press: Cambridge, UK, 1998. [Google Scholar]
  11. Paris, P.C.; Gomez, M.P.; Anderson, W.E. A rational analytic theory of fatigue. Trend Eng. 1961, 13, 9–14. [Google Scholar]
  12. Paris, P.; Erdogan, F. A critical analysis of crack propagation laws. J. Basic Eng. 1963, 85, 528–533. [Google Scholar] [CrossRef]
  13. Paris, P.C. Fracture mechanics and fatigue: A historical perspective. Fatigue Fract. Eng. Mater. Struct. 1998, 21, 535–540. [Google Scholar] [CrossRef]
  14. Elber, W. Fatigue crack closure under cyclic tension loading. Eng. Fract. Mech. 1970, 2, 37–45. [Google Scholar]
  15. Miller, K.J. The two thresholds of fatigue behavior. Fatigue Fract. Eng. Mater. Struct. 1993, 16, 931–939. [Google Scholar] [CrossRef]
  16. Fleck, N.A.; Kang, K.J.; Ashby, M.F. The cyclic properties of engineering materials, Overview No. 112. Acta Met. Mater. 1994, 42, 365–381. [Google Scholar] [CrossRef]
  17. Frost, N.E.; Dugdale, S.D. Fatigue tests on notched mild steel plates with measurements of fatigue cracks. J. Mech. Phys. Solids 1957, 5, 182–192. Available online: https://www.sciencedirect.com/science/article/abs/pii/0022509657900042 (accessed on 1 September 2025). [CrossRef]
  18. Nisitani, H. Effects of size on the fatigue limit and the branch point in rotary bending tests of carbon steel specimens. Bull. JSME 1968, 11, 947–957. [Google Scholar] [CrossRef]
  19. Lukáš, P.; Klesnil, M. Fatigue limit of notched bodies. Mater. Sci. Eng. 1978, 34, 61–66. [Google Scholar] [CrossRef]
  20. de Castro, J.T.P.; Meggiolaro, M.A.; Miranda, A.C.d.O.; Wu, H.; Imad, A.; Benseddiq, N. Prediction of fatigue crack initiation lives at elongated notch roots using short crack concepts. Int. J. Fatigue 2012, 42, 172–182. [Google Scholar] [CrossRef]
  21. Chapetti, M.D. Non-propagating cracks at the fatigue limit of notches: An Analysis of notch sensitivity and size effect. Materials 2024, 17, 4632. [Google Scholar] [CrossRef]
  22. Neuber, H. Theory of Notch Stresses: Principles for Exact Calculation of Strength with Reference to Structural Form and Material, 2nd ed.; Springer: Berlin/Heidelberg, Germany, 1958. [Google Scholar]
  23. Peterson, R.E. Notch sensitivity. In Metal Fatigue; Sines, G., Waisman, J.L., Eds.; McGraw-Hill: New York, NY, USA, 1959; pp. 293–306. [Google Scholar]
  24. Ince, A. Novel computational method for modeling elastic–plastic stress–strain fields near cracks under cyclic loadings. Int. J. Fatigue 2025, 193, 108792. [Google Scholar] [CrossRef]
  25. Taylor, D. The Theory of Critical Distance; Elsevier: Oxford, UK, 2007. [Google Scholar]
  26. US Military. MIL-HandBook-5 Metallic Materials & Aircraft Structures; DoD: Washington, DC, USA, 2006. [Google Scholar]
  27. Stein, T.; Wicke, M.; Brueckner-Foit, A.; Kirsten, T.; Zimmermann, M.; Buelbuel, F.; Christ, H.-J. Crack growth behavior in an aluminum alloy under very low stress amplitudes. J. Mater. Res. 2017, 32, 4354–4361. [Google Scholar] [CrossRef]
  28. Wicke, M.; Brueckner-Foit, A.; Kirsten, T.; Zimmermann, M.; Buelbuel, F.; Christ, H.J. Near-threshold crack extension mechanisms in an aluminum alloy studied by SEM and X-ray tomography. Int. J. Fatigue 2019, 119, 102–111. [Google Scholar] [CrossRef]
  29. Tanaka, Y.; Park, S.; Okazaki, S.; Matsunaga, H. Criteria for determining the fatigue limit of Ni-based superalloy 718 considering the competition between opening- and shear-mode fatigue crack-growth. Eng. Fract. Mech. 2023, 290, 109500. [Google Scholar] [CrossRef]
  30. Cappelli, M.; Carlson, R.; Kardomateas, G. The transition between small and long fatigue crack behavior and its relation to microstructure. Int. J. Fatigue 2008, 30, 1473–1478. [Google Scholar] [CrossRef]
  31. Wei, X.; Li, C.; McCarthy, C.; Kolinski, J.M. Complexity of crack front geometry enhances toughness of brittle solids. Nat. Phys. 2024, 20, 1009–1014. [Google Scholar] [CrossRef]
  32. Meia, J.; Xinga, S.; Vasua, A.; Chunga, J.; Desaia, R.; Dong, P. The fatigue limit prediction of notched components—A critical review and modified stress gradient based approach. Int. J. Fatigue 2010, 135, 10553. [Google Scholar] [CrossRef]
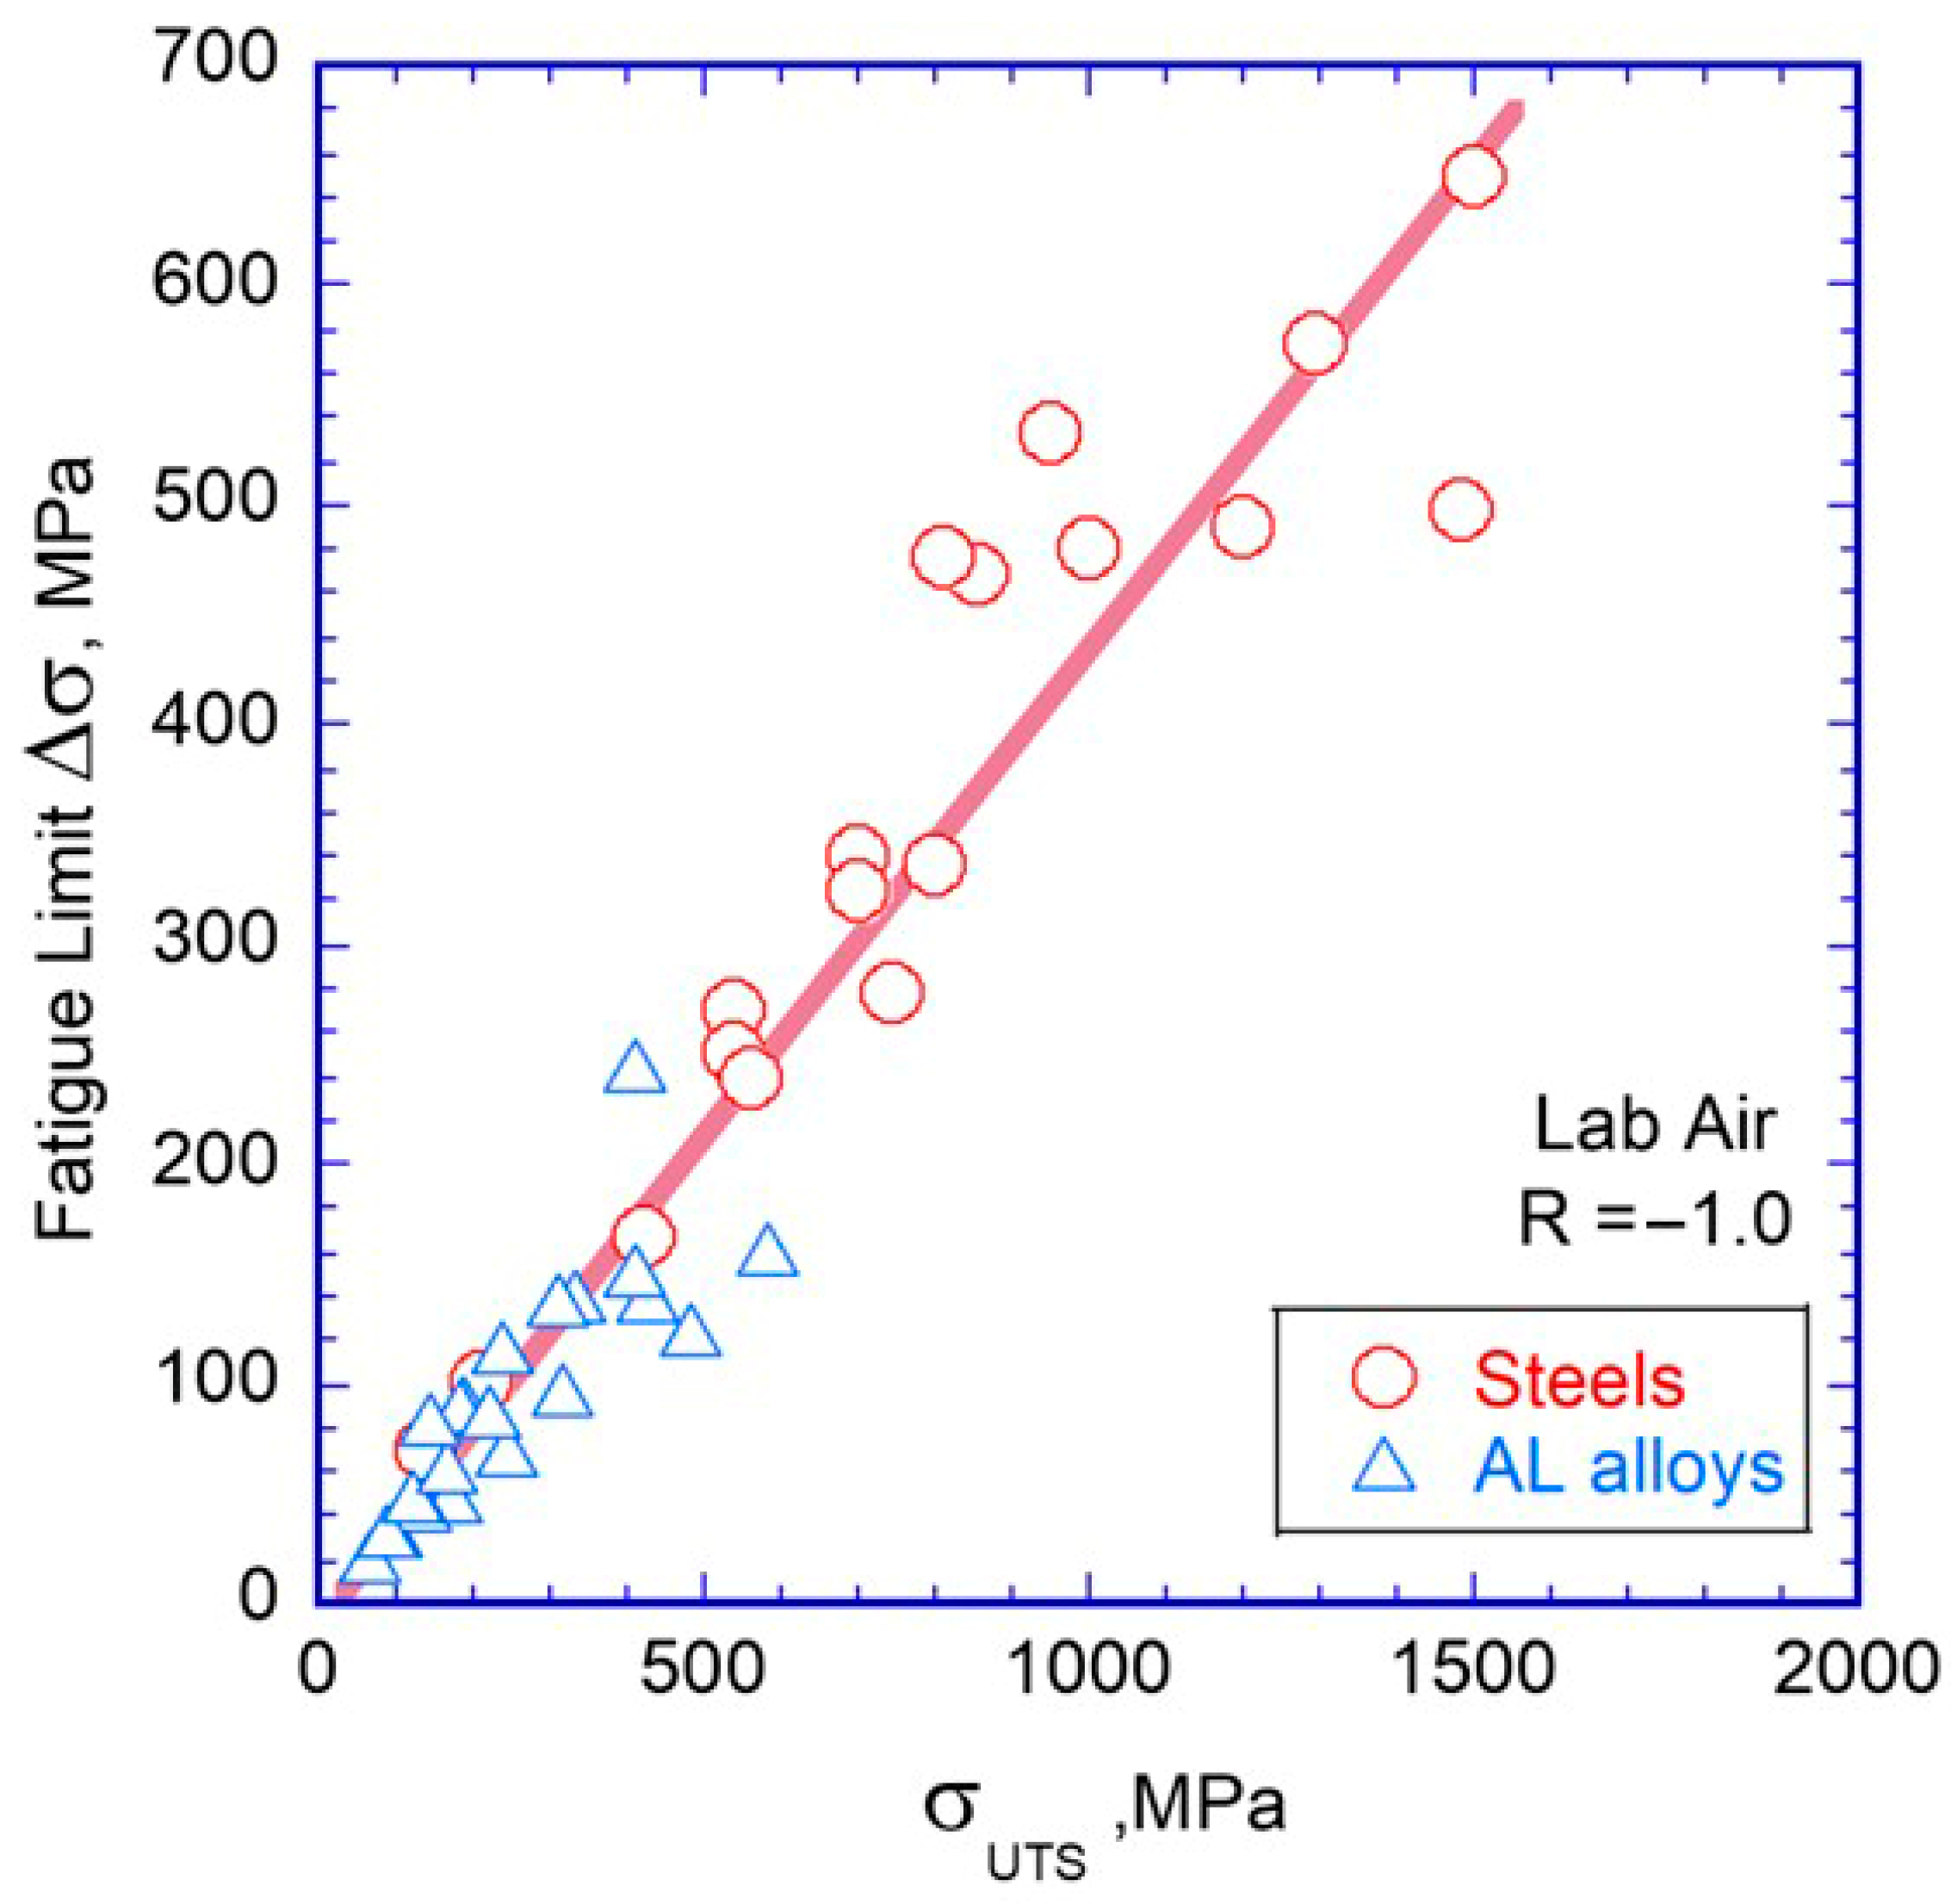
Figure 1. Linear variation in fatigue limit ΔσFL (N = 107 cycles) with ultimate tensile strength σUTS for steel alloys and Al alloys at R = −1.
Applsci 15 10405 g001
Figure 2. Linear variation in fatigue threshold ΔKth with fatigue limit ΔσFL for (a) Ti-6Al-4V [5,6,7] and (b) 2024-T351 [8,9] alloys. Slope of the results indicates the crack size ath which links the relationship between ΔKth and ΔσFL.
Applsci 15 10405 g002
Figure 3. Schematic illustration of the stages to failure in terms of defect/crack size. Versus time/cycles of service.
Applsci 15 10405 g003
Figure 4. ΔKth (R = 0) versus endurance limit σe (R = −1), for a family of materials [16].
Applsci 15 10405 g004
Figure 5. Schematic illustration of the effect of (a) the stress concentration factor, kt (Frost and Dugdale [17]), and (b) the inverse of notch-root radius, 1/ρ (Nisitani [18]), on fatigue crack-initiation threshold and crack-propagation threshold.
Applsci 15 10405 g005
Figure 6. Similarities and differences between the stress fields for a cracked a smooth specimen at applied R = 0.
Applsci 15 10405 g006
Figure 7. Experimental and fitted data in terms of ΔσFL and ΔKth versus R-ratios for three materials investigated (Ti6Al4V [5,6,7], 2024-T351Al [8,9], 4340 [9,26]). On a linear scale, only 2024-T351 and Ti6Al4V show nonlinearity in ΔKth-Rappl plots. S-N data for all 3 alloys (Ti6Al4V, 4340, 2024-T351) are linear.
Applsci 15 10405 g007
Figure 8. Relations among fitted ΔKth and ΔσFL for the same Rappl.
Applsci 15 10405 g008
Figure 9. Back fitted correlation among Rappl and Rlocal for cracked specimens and three materials investigated.
Applsci 15 10405 g009
Figure 10. Log-log relation between applied ΔKth and Δσe. Each data point corresponds to a given R-ratio. The lowest ΔKth and ΔσFL corresponds to high R and the highest values for low R.
Applsci 15 10405 g010
Disclaimer/Publisher’s Note: The statements, opinions and data contained in all publications are solely those of the individual author(s) and contributor(s) and not of MDPI and/or the editor(s). MDPI and/or the editor(s) disclaim responsibility for any injury to people or property resulting from any ideas, methods, instructions or products referred to in the content.