GIS Applications in Monitoring and Managing Heavy Metal Contamination of Water Resources
Abstract
1. Introduction
- (a)
- Data collection—sampling of soil, water, air, or sediments, followed by chemical analyses to quantify heavy metal concentrations. Standards for sampling protocols and analytical instrumentation must be explicitly reported.
- (b)
- Georeferencing—assigning GPS coordinates to each sample and compiling a spatial database in line with international reporting standards.
- (c)
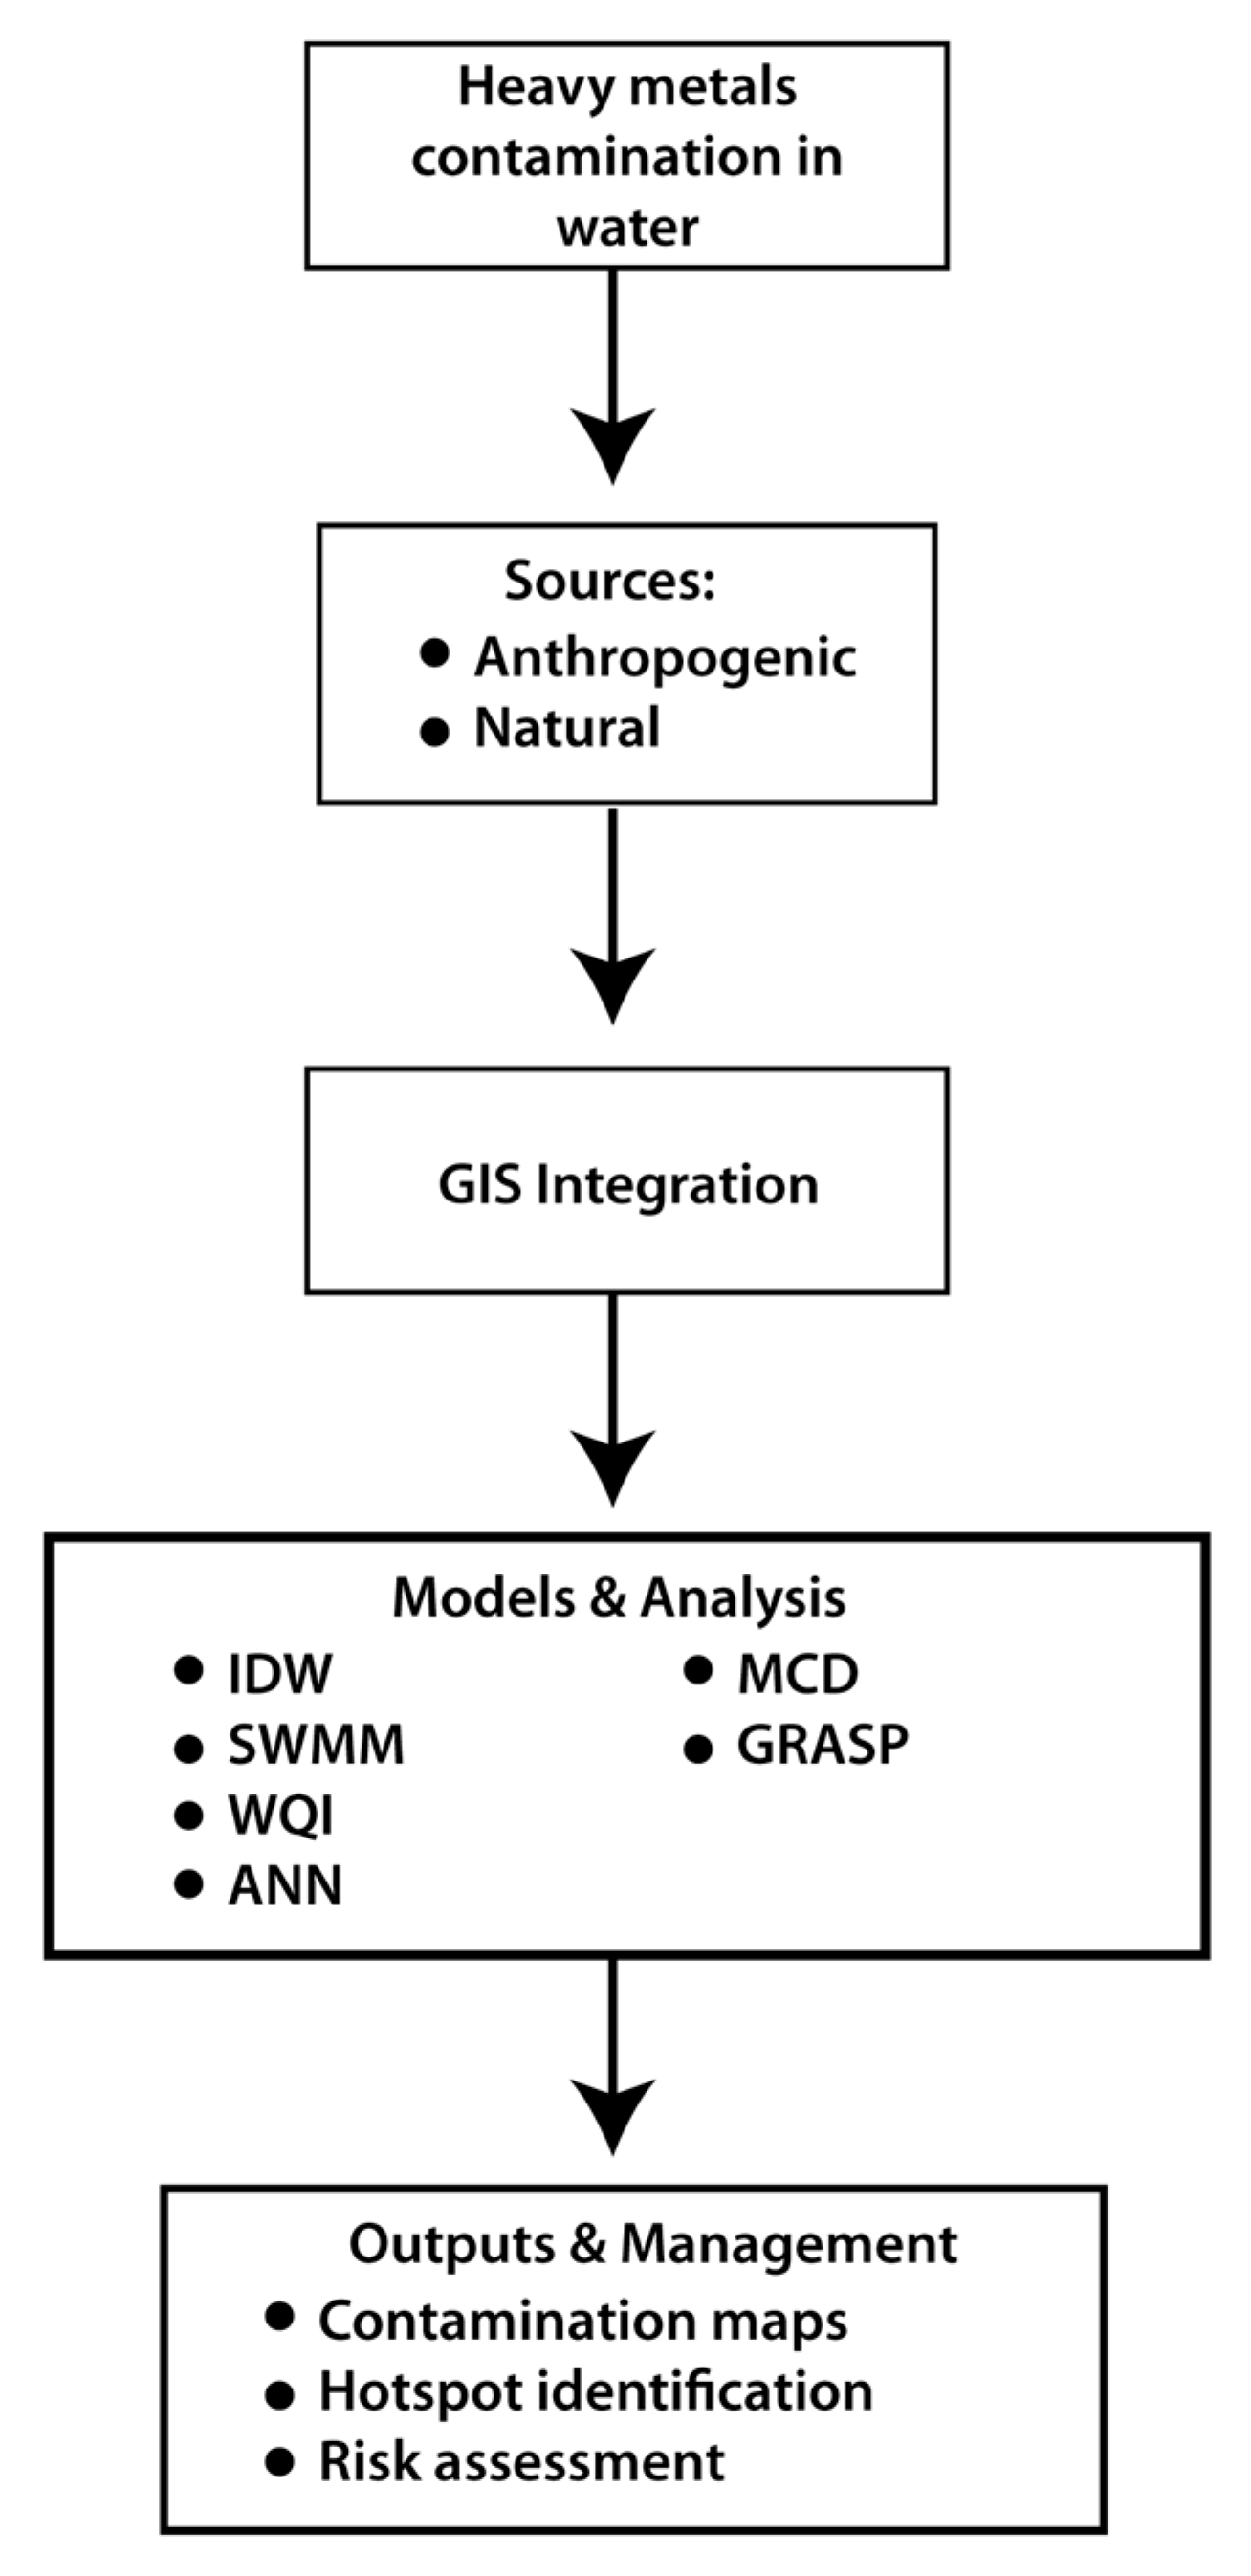
- System development and integration—importing data into GIS software, developing analytical models, and, where appropriate, integrating specialized hydrological or hydraulic applications (e.g., EPANET, SWMM, HEC-RAS, and TUFLOW). This step typically produces thematic maps showing pollutant distributions.
- (d)
- Spatial analysis—identifying high-risk areas, correlating pollutant concentrations with anthropogenic sources, such as industry, traffic, or agriculture, and modeling dispersion across space and time.
2. Materials and Methods
2.1. Literature Search and Data Sources
2.2. Data Integration and Screening
2.3. Bibliometric Analysis
2.4. Systematic Literature Review
3. Results and Discussion
3.1. Bibliometric Review—Synthesis of Literature
3.2. Literature Review
3.2.1. Global Research Trends on GISs and Heavy Metals in Water
Groundwater Quality and Drinking Water Safety
Surface Water Monitoring and Ecosystem Impacts
Mining and Industrial Legacy Contamination
Risk Assessment and Decision Support Frameworks
Policy Implications and Practical Applications
3.2.2. Global Occurrence of Heavy Metals in Water: Concentrations Versus WHO Permissible Limits
Element-Specific Exceedances Relative to WHO Standards
Critical Synthesis: Geogenic Versus Anthropogenic Drivers
3.2.3. Different GIS Models for Heavy Metals in Water
3.2.4. Sources of HMs in Water Identified Through GIS
3.2.5. Health Effects of HMs in Water Assessed Through GIS-Based Studies
4. Conclusions
- Research trends and distribution
- Scientific output on GISs and heavy metal contamination has grown exponentially in the past decade, reflecting both the urgency of pollution issues and the accessibility of open-source GIS platforms.
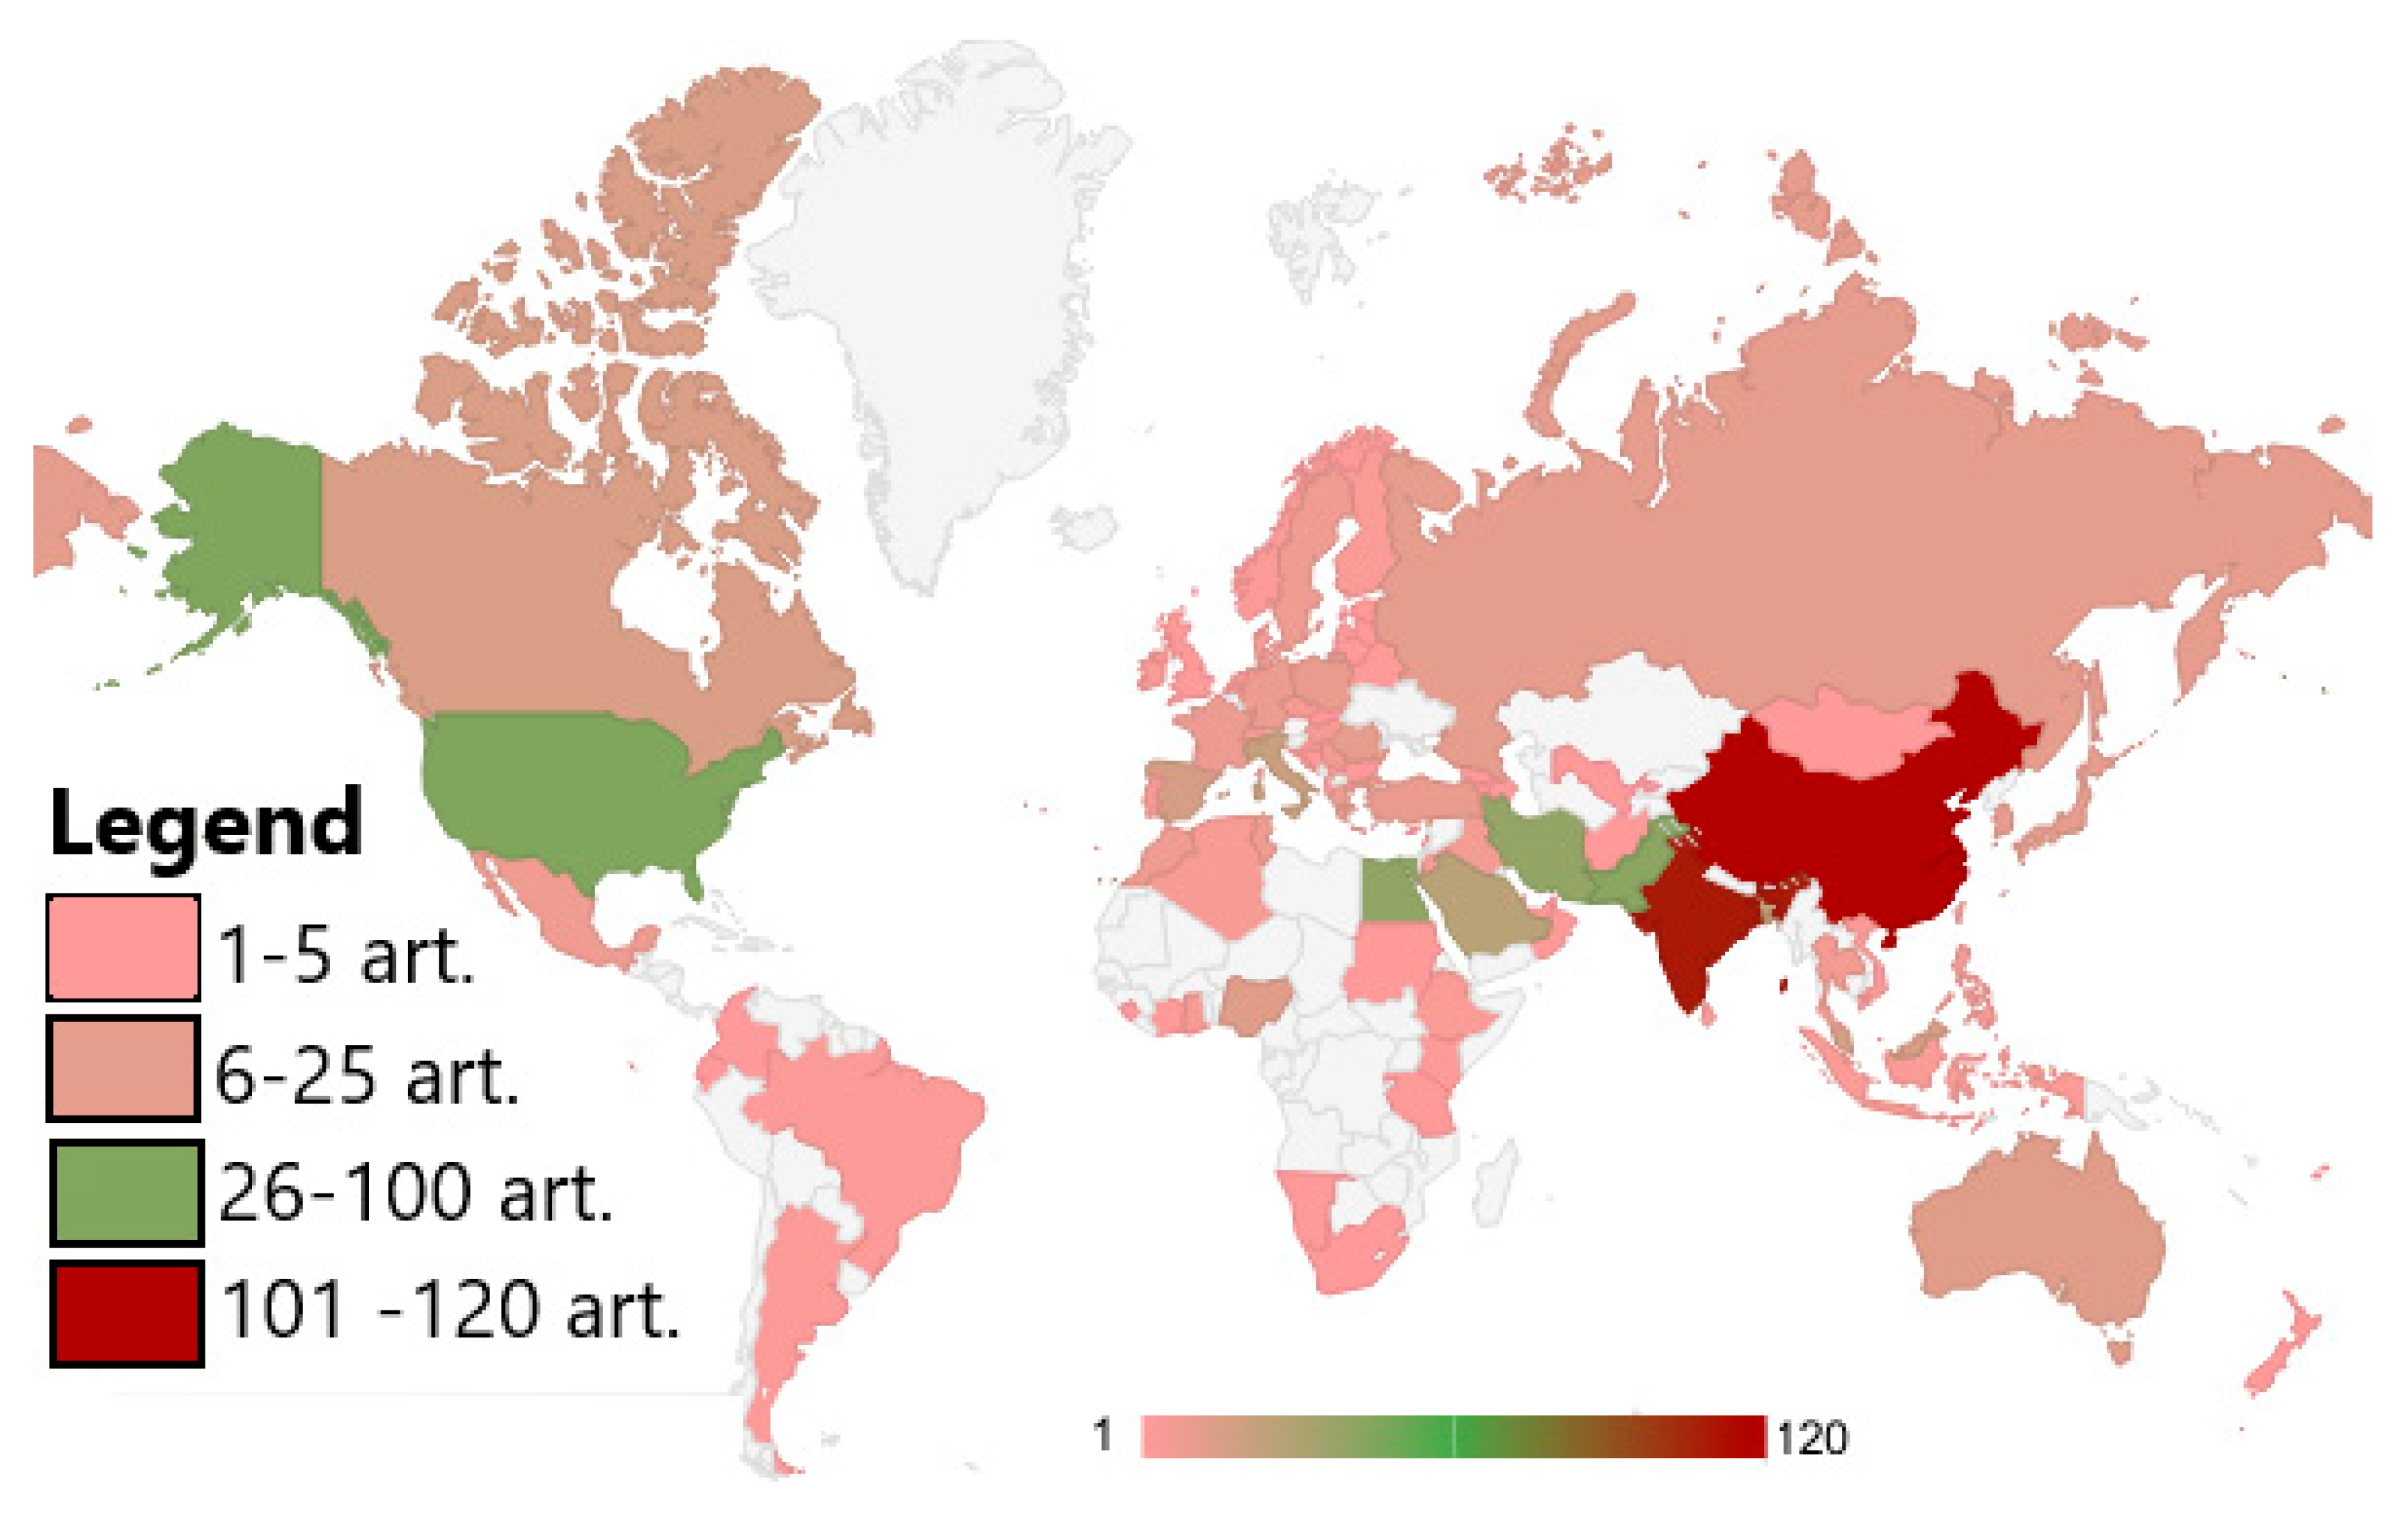
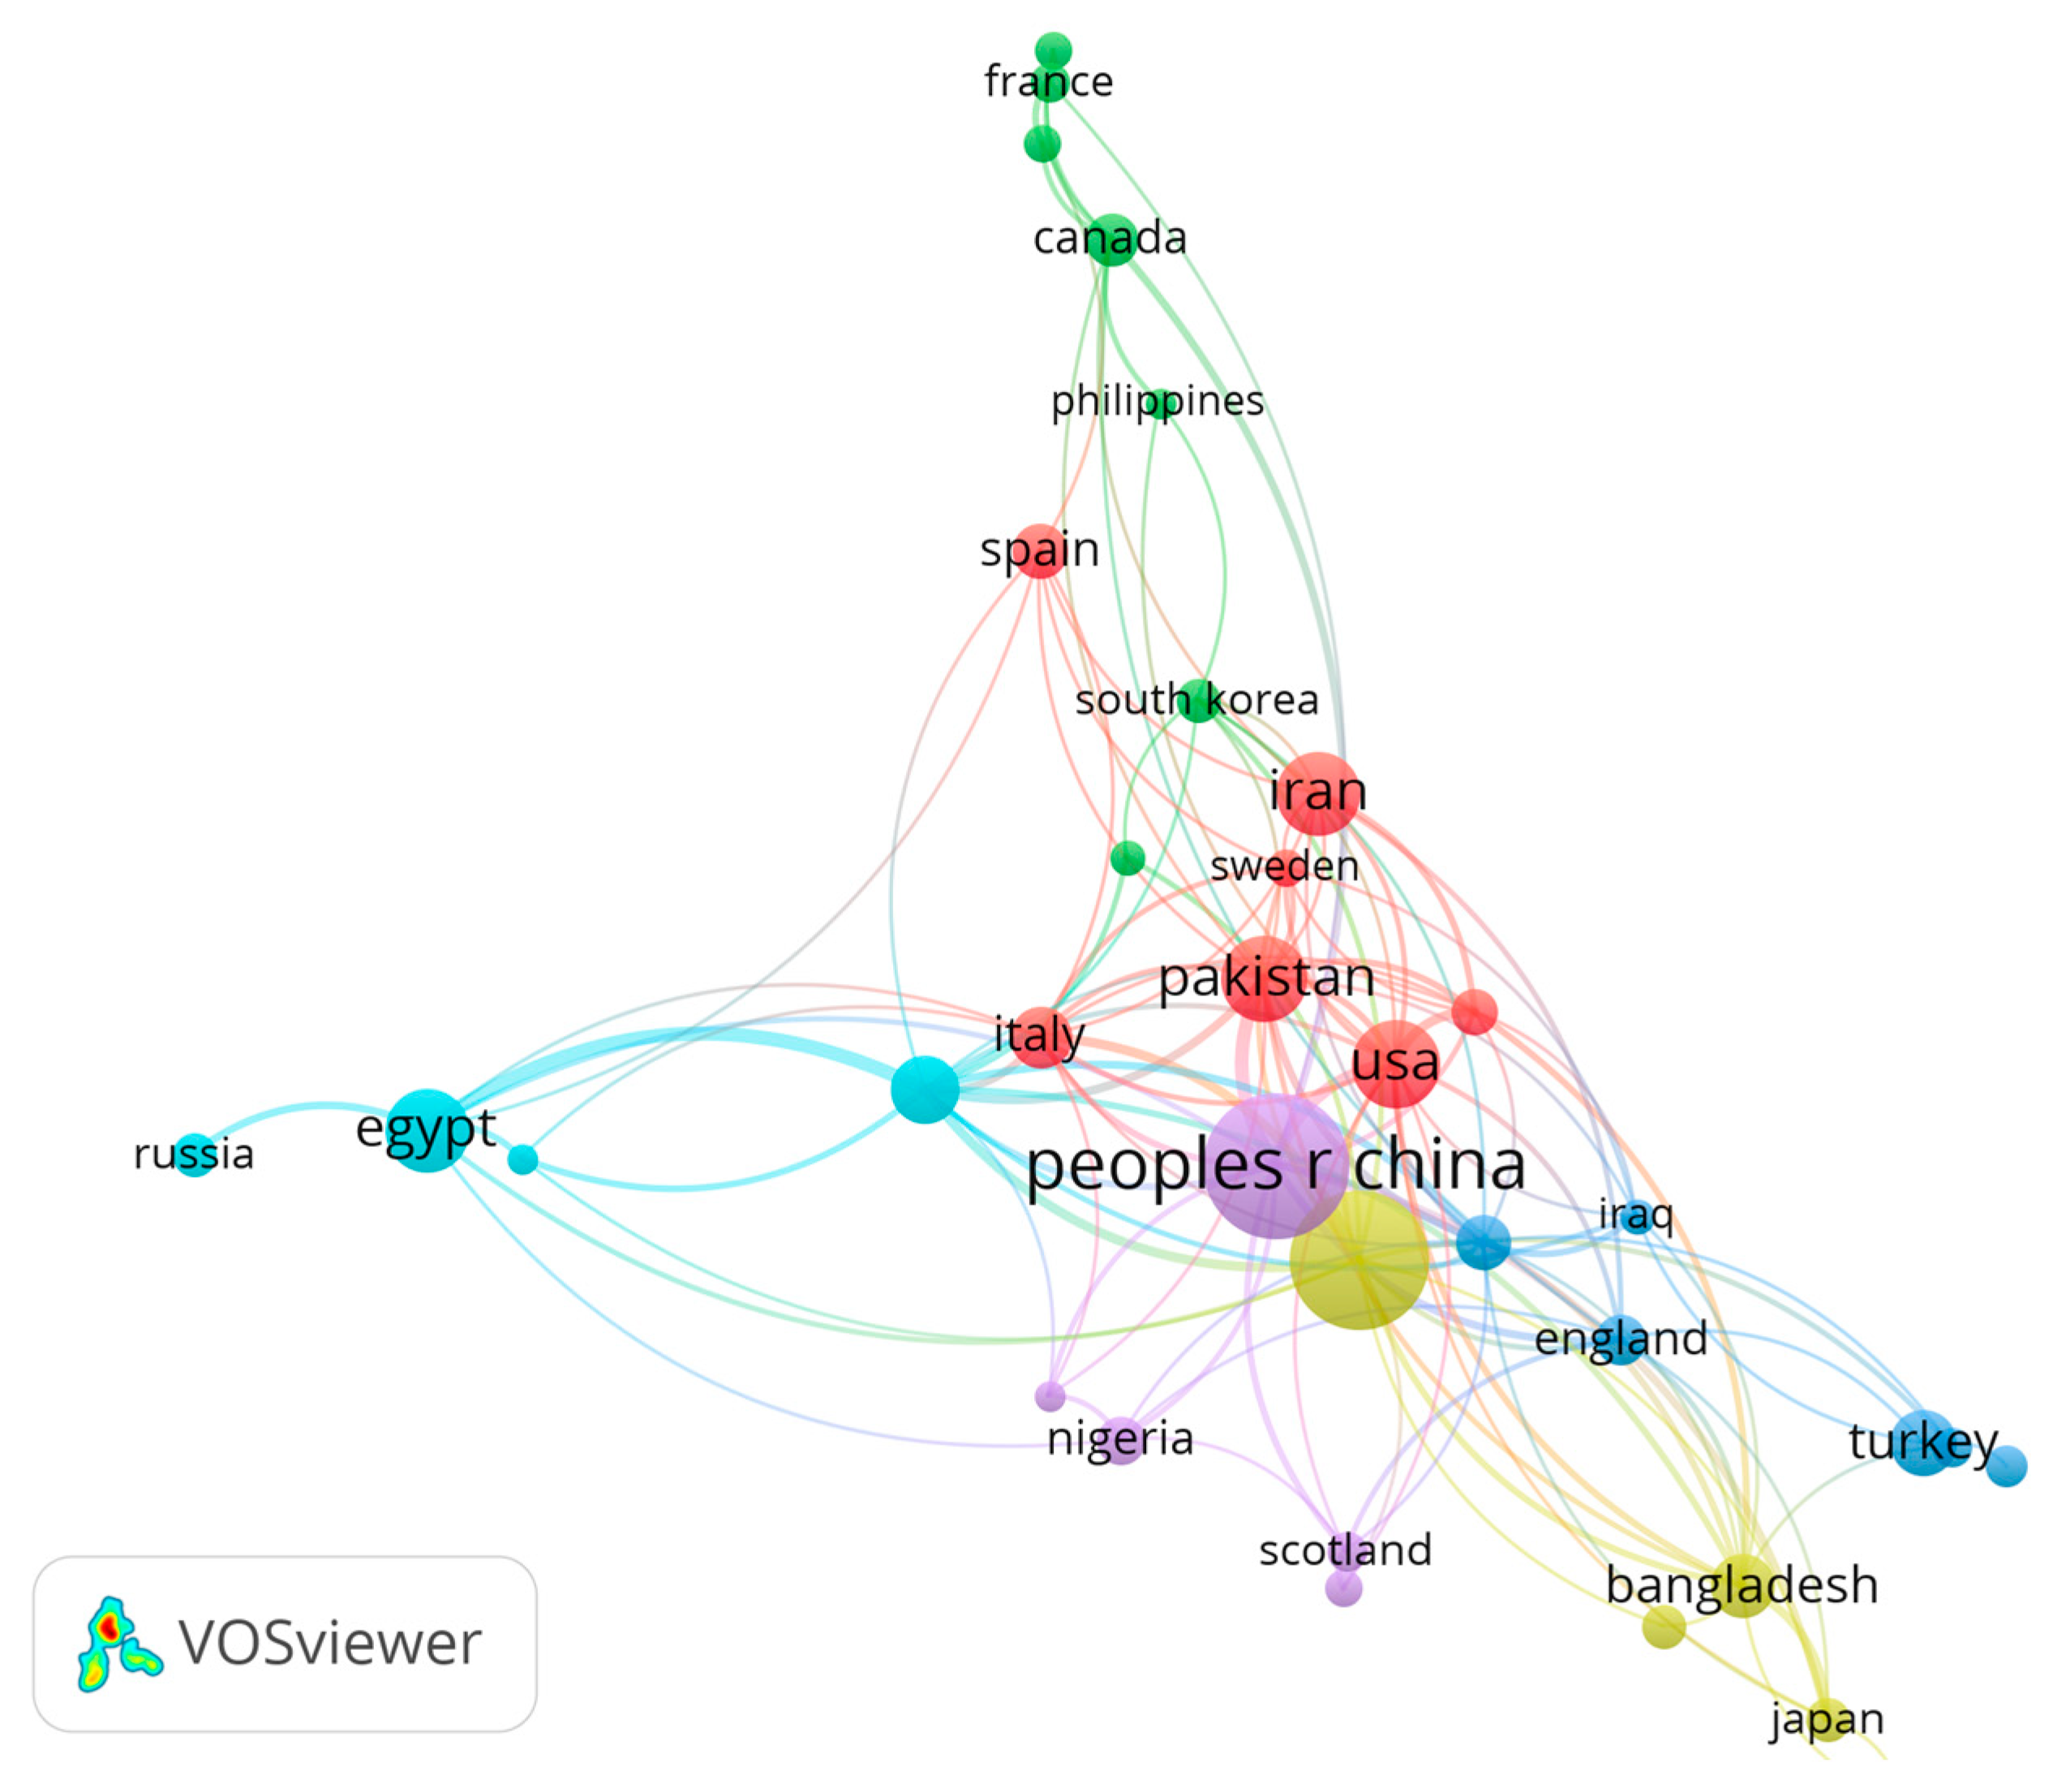
- Research is unevenly distributed, with South Asia, North Africa, and Eastern Europe dominating the literature, while regions such as sub-Saharan Africa and Latin America remain underrepresented.
- GIS applications and strengths
- The GIS is a versatile tool for integrating spatial, hydrological, and chemical datasets, enabling identification of pollution hotspots, dispersion pathways, and contamination sources.
- Coupling the GIS with advanced methods (multivariate statistics, machine learning, and decision support models) extends its role from descriptive mapping to predictive risk assessment and environmental management.
- Heavy metal occurrence and risks
- Concentrations of Cd, Cr, Cu, Mn, Hg, and Ni frequently exceed the WHO limits worldwide, posing serious ecological and health threats.
- GIS-based analyses help attribute exceedances to anthropogenic (e.g., urban runoff and industrial discharge) or geogenic sources, supporting the design of targeted remediation strategies.
- Limitations and challenges
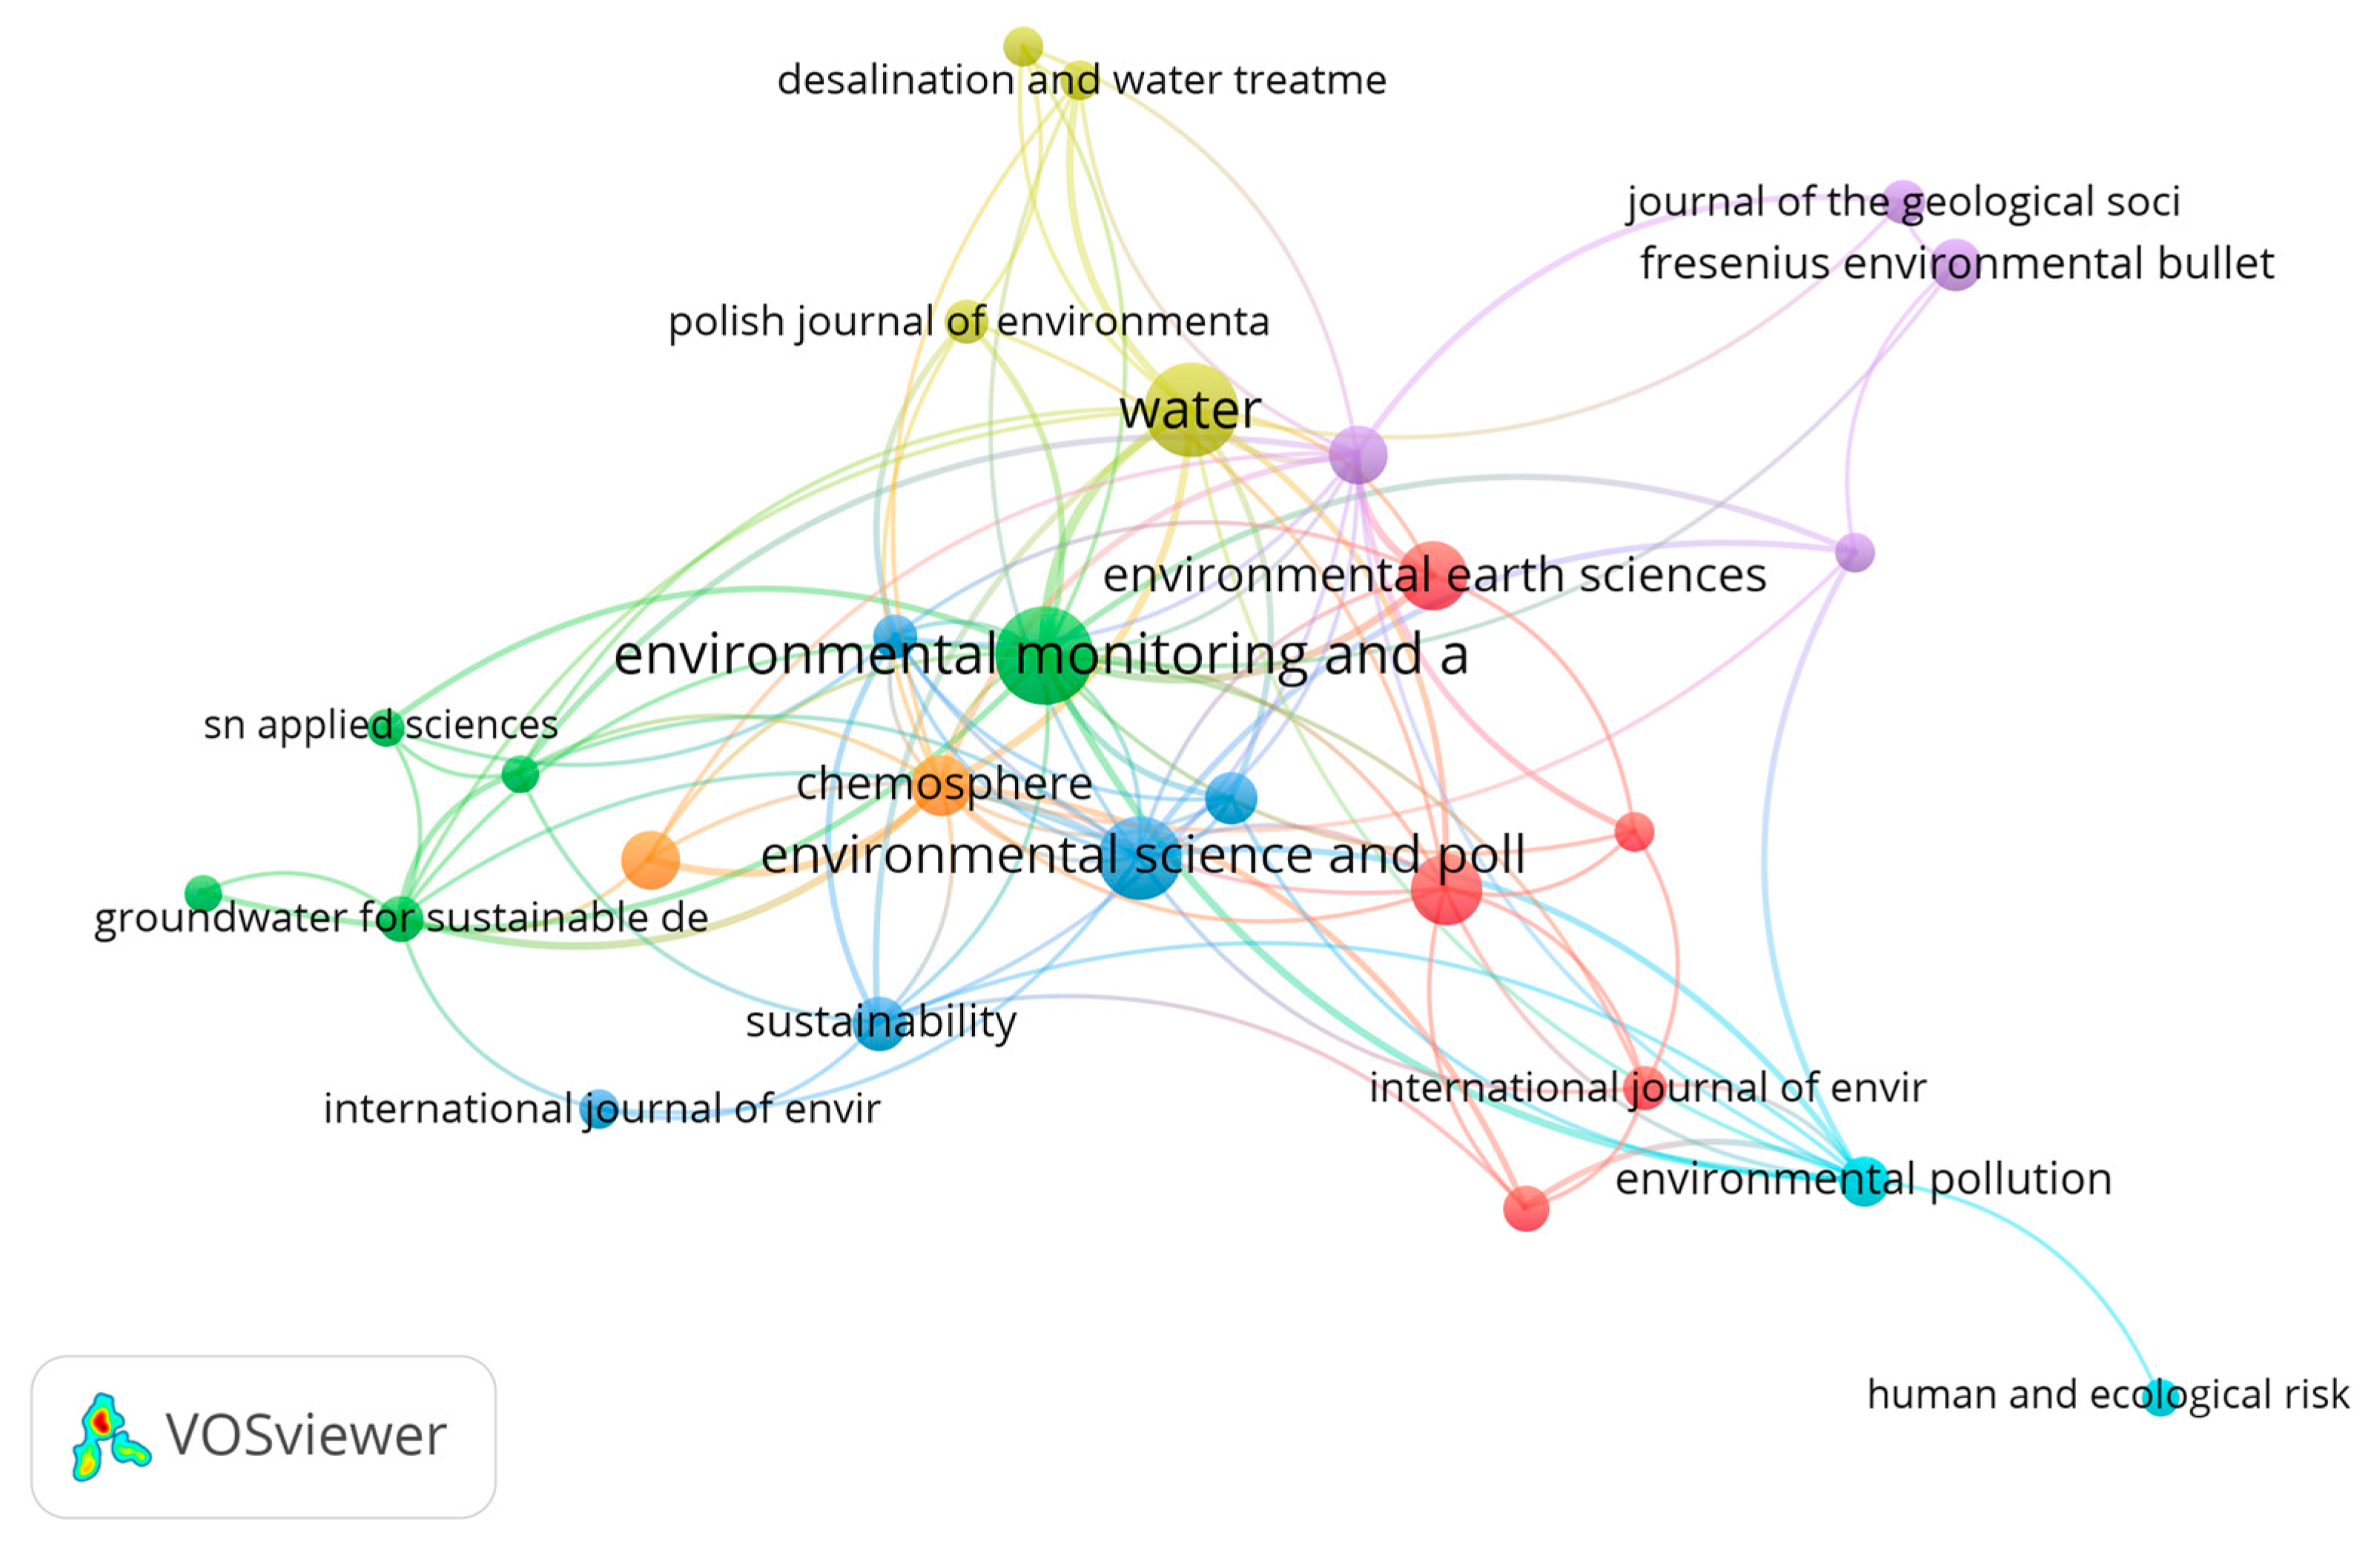
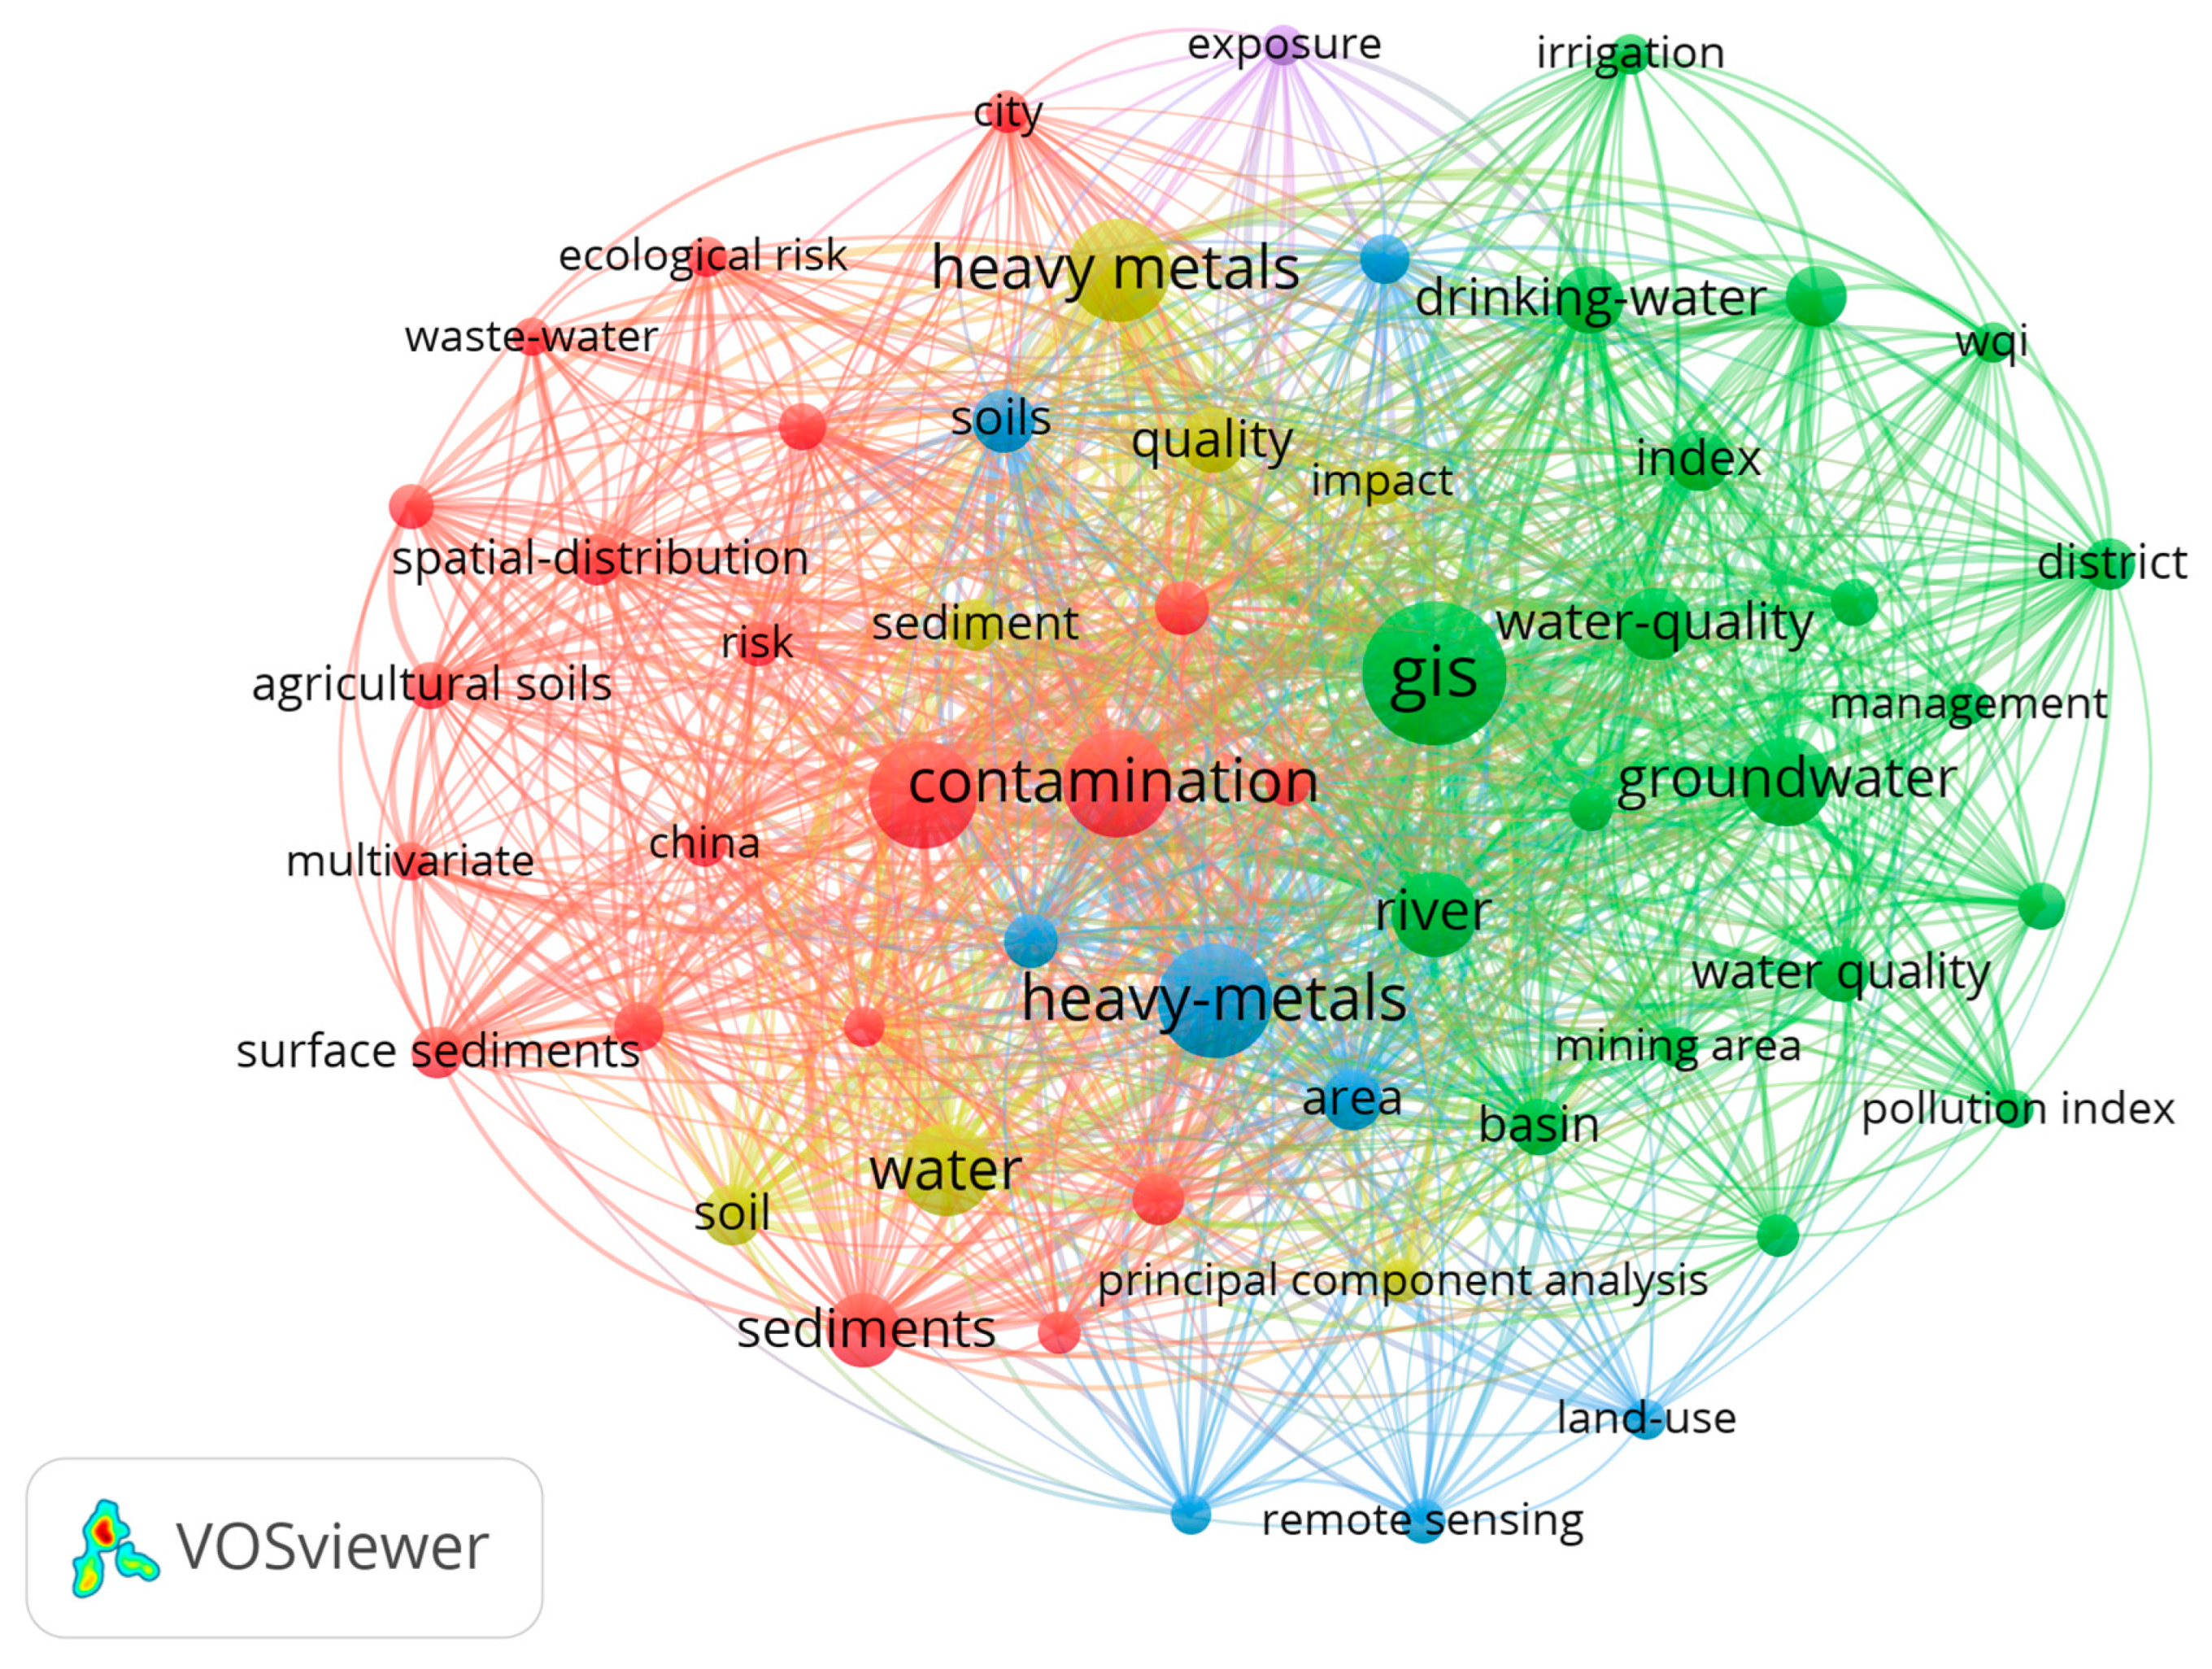
- Bibliometric analyses face biases related to database coverage, keyword selection, and bibliometric tool limitations.
- GIS-based studies are constrained by:
- Gaps in monitoring networks and data quality, especially in developing countries.
- Lack of standardized sampling and analytical protocols.
- Mismatches between GIS spatial resolution and contamination hotspots.
- These limitations reduce comparability across studies and restrict broader generalization.
- Weaknesses in the international research landscape
- Research is fragmented, with limited integration of geospatial contamination data and clinical/epidemiological outcomes.
- Underrepresented regions lack adequate monitoring capacity, limiting global assessments of heavy metal risks.
- Addressing these weaknesses requires greater international collaboration, open-access data platforms, and harmonized methodologies.
- Future research directionsTo strengthen GIS applications in heavy metal pollution studies, future work should prioritize:
- Integration with health risk assessment: develop GIS-based models linking pollutant distribution, exposure pathways, and population vulnerability.
- Real-time monitoring: incorporate remote sensing, IoT water sensors, and AI-driven analytics into GIS platforms for early warning systems.
- Data standardization: establish international standards for sampling, laboratory methods, and GIS resolution to enable comparability.
- Decision support integration: embed the GIS in multi-criteria decision analysis (MCDA) frameworks for remediation, land use, and water resource management.
Author Contributions
Funding
Acknowledgments
Conflicts of Interest
References
- Ali, H.; Khan, E. What are heavy metals? Long-standing controversy over the scientific use of the term ‘heavy metals’—Proposal of a comprehensive definition. Toxicol. Environ. Chem. 2018, 100, 6–19. [Google Scholar] [CrossRef]
- Appenroth, K.J. What are “heavy metals” in plant sciences? Acta Physiol. Plant. 2010, 32, 615–619. [Google Scholar] [CrossRef]
- Sharma, S.K. (Ed.) Heavy Metals in Water: Presence, Removal and Safety; Royal Society of Chemistry: London, UK, 2014. [Google Scholar]
- Charerntanyarak, L. Heavy metals removal by chemical coagulation and precipitation. Water Sci. Technol. 1999, 39, 135–138. [Google Scholar] [CrossRef]
- Pang, F.M.; Teng, S.P.; Teng, T.T.; Omar, A.M. Heavy metals removal by hydroxide precipitation and coagulation-flocculation methods from aqueous solutions. Water Qual. Res. J. 2009, 44, 174–182. [Google Scholar] [CrossRef]
- Hubicki, Z.; Kołodyńska, D. Selective removal of heavy metal ions from waters and waste waters using ion exchange methods. In Ion Exchange Technologies; IntechOpen: London, UK, 2012. [Google Scholar]
- Dabrowski, A.Z.P.E.; Hubicki, Z.; Podkościelny, P.; Robens, E. Selective removal of the heavy metal ions from waters and industrial wastewaters by ion-exchange method. Chemosphere 2004, 56, 91–106. [Google Scholar] [CrossRef]
- Blöcher, C.; Dorda, J.; Mavrov, V.; Chmiel, H.; Lazaridis, N.K.; Matis, K.A. Hybrid flotation—Membrane filtration process for the removal of heavy metal ions from wastewater. Water Res. 2003, 37, 4018–4026. [Google Scholar] [CrossRef]
- Chauhan, M.S.; Rahul, A.K.; Shekhar, S.; Kumar, S. Removal of heavy metal from wastewater using ion exchange with membrane filtration from Swarnamukhi river in Tirupati. Mater. Today: Proc. 2023, 78, 1–6. [Google Scholar] [CrossRef]
- Kulshreshtha, A.; Agrawal, R.; Barar, M.; Saxena, S. A review on bioremediation of heavy metals in contaminated water. IOSR J. Environ. Sci. Toxicol. Food Technol. 2014, 8, 44–50. [Google Scholar] [CrossRef]
- Halder, S. Bioremediation of heavy metals through fresh water microalgae: A review. Sch. Acad. J. Biosci. 2014, 2, 825–830. [Google Scholar]
- Litter, M.I. Mechanisms of removal of heavy metals and arsenic from water by TiO2-heterogeneous photocatalysis. Pure Appl. Chem. 2015, 87, 557–567. [Google Scholar] [CrossRef]
- Foteinis, S.; Chatzisymeon, E. Heterogeneous photocatalysis for water purification. In Nanostructured Photocatalysts; Elsevier: Amsterdam, The Netherlands, 2020; pp. 75–97. [Google Scholar]
- Arora, R. Adsorption of heavy metals—A review. Mater. Today Proc. 2019, 18, 4745–4750. [Google Scholar] [CrossRef]
- Chen, X.; Hossain, M.F.; Duan, C.; Lu, J.; Tsang, Y.F.; Islam, M.S.; Zhou, Y. Isotherm models for adsorption of heavy metals from water—A review. Chemosphere 2022, 307, 135545. [Google Scholar] [CrossRef]
- Boran, M.; Altınok, I. A review of heavy metals in water, sediment and living organisms in the Black Sea. Turk. J. Fish. Aquat. Sci. 2010, 10. [Google Scholar] [CrossRef]
- Biney, C.A.A.T.; Amuzu, A.T.; Calamari, D.; Kaba, N.; Mbome, I.L.; Naeve, H.; Ochumba, P.B.O.; Osibanjo, O.; Radegonde, V.; Saad, M.A.H. Review of heavy metals in the African aquatic environment. Ecotoxicol. Environ. Saf. 1994, 28, 134–159. [Google Scholar] [CrossRef]
- Punia, P.; Bharti, M.K.; Dhar, R.; Thakur, P.; Thakur, A. Recent advances in detection and removal of heavy metals from contaminated water. ChemBioEng Rev. 2022, 9, 351–369. [Google Scholar] [CrossRef]
- Xu, Z.; Zhang, Q.; Li, X.; Huang, X. A critical review on chemical analysis of heavy metal complexes in water/wastewater and the mechanism of treatment methods. Chem. Eng. J. 2022, 429, 131688. [Google Scholar] [CrossRef]
- Dincă, L.; Crisan, V.; Ienaşoiu, G.; Murariu, G.; Drăşovean, R. Environmental Indicator Plants in Mountain Forests: A Review. Plants 2024, 13, 3358. [Google Scholar] [CrossRef]
- Bratu, I.; Dinca, L.; Schiteanu, I.; Mocanu, G.; Murariu, G.; Stanciu, M.; Zhiyanski, M. Sports in Natural Forests: A Systematic Review of Environmental Impact and Compatibility for Readability. Sports 2025, 13, 250. [Google Scholar] [CrossRef]
- Budău, R.; Timofte, C.S.C.; Mirisan, L.V.; Bei, M.; Dinca, L.; Murariu, G.; Racz, K.A. Living Landmarks: A Review of Monumental Trees and Their Role in Ecosystems. Plants 2025, 14, 2075. [Google Scholar] [CrossRef]
- Dinca, L.; Murariu, G.; Lupoae, M. Understanding the ecosystem services of riparian forests: Patterns, gaps, and global trends. Forests 2025, 16, 947. [Google Scholar] [CrossRef]
- Diodato, V.P.; Gellatly, P. Dictionary of Bibliometrics; Routledge: London, UK, 2013. [Google Scholar]
- Lawani, S.M. Bibliometrics: Its theoretical foundations, methods and applications. Libri 1981, 31, 294–315. [Google Scholar] [CrossRef]
- Albort-Morant, G.; Henseler, J.; Leal-Millán, A.; Cepeda-Carrión, G. Mapping the field: A bibliometric analysis of green innovation. Sustainability 2017, 9, 1011. [Google Scholar] [CrossRef]
- Gizzi, F.T.; Potenza, M.R. The scientific landscape of November 23rd, 1980 Irpinia-Basilicata Earthquake: Taking stock of (almost) 40 years of studies. Geosciences 2020, 10, 482. [Google Scholar] [CrossRef]
- Muhuri, P.K.; Shukla, A.K.; Abraham, A. Industry 4.0: A bibliometric analysis and detailed overview. Eng. Appl. Artif. Intell. 2019, 78, 218–235. [Google Scholar] [CrossRef]
- Page, M.J.; McKenzie, J.E.; Bossuyt, P.M.; Boutron, I.; Hoffmann, T.C.; Mulrow, C.D.; Shamseer, L.; Tetzlaff, J.M.; Akl, E.A.; Brennan, S.E.; et al. The PRISMA 2020 Statement: An Updated Guideline for Reporting Systematic Reviews. BMJ 2021, 372, n71. [Google Scholar] [CrossRef]
- Clarivate.com. Web of Science Core Collection. Available online: https://clarivate.com/products/scientific-and-academic-research/research-discovery-and-workflow-solutions/webofscience-platform/web-of-science-core-collection/ (accessed on 20 May 2025).
- Elsevier. Scopus. Available online: https://www.elsevier.com/products/scopus (accessed on 20 May 2025).
- Microsoft Corporation. Microsoft Excel. Available online: https://www.microsoft.com/en-us/microsoft-365/excel?legRedir=true&CorrelationId=3bb60ab0-fe13-41a4-812b-2627667cf346 (accessed on 26 May 2025).
- Geochart. Google Developers. Available online: https://developers.google.com/chart/interactive/docs/gallery/geochart (accessed on 23 May 2025).
- VOSviewer. Available online: https://www.vosviewer.com/ (accessed on 22 May 2025).
- Enescu, C.M.; Mihalache, M.; Ilie, L.; Dinca, L.; Constandache, C.; Murariu, G. Agricultural benefits of shelterbelts and windbreaks: A bibliometric analysis. Agriculture 2025, 15, 1204. [Google Scholar] [CrossRef]
- Murariu, G.; Dinca, L.; Munteanu, D. Trends and Applications of Principal Component Analysis in Forestry Research: A Literature and Bibliometric Review. Forests 2025, 16, 1155. [Google Scholar] [CrossRef]
- Dincă, L.; Constandache, C.; Postolache, R.; Murariu, G.; Tupu, E. Timber Harvesting in Mountainous Regions: A Comprehensive Review. Forests 2025, 16, 495. [Google Scholar] [CrossRef]
- Bratu, I.; Dinca, L.; Constandache, C.; Murariu, G. Resilience and decline: The impact of climatic variability on temperate oak forests. Climate 2025, 13, 119. [Google Scholar] [CrossRef]
- Dinca, L.; Coca, A.; Tudose, N.C.; Marin, M.; Murariu, G.; Munteanu, D. The Role of Trees in Sand Dune Rehabilitation: Insights from Global Experiences. Appl. Sci. 2025, 15, 7358. [Google Scholar] [CrossRef]
- Mishra, S.; Bharagava, R.N.; More, N.; Yadav, A.; Zainith, S.; Mani, S.; Chowdhary, P. Heavy metal contamination: An alarming threat to environment and human health. In Environmental Biotechnology: For Sustainable Future; Springer: Singapore, 2018; pp. 103–125. [Google Scholar]
- Wegmann, M.; Leutner, B.; Dech, S. (Eds.) Remote Sensing and GIS for Ecologists: Using Open Source Software; Pelagic Publishing Ltd.: London, UK, 2016. [Google Scholar]
- Li, Y.J.; Zhang, L.Y.; Wu, Y.W.; Li, C.L.; Yang, T.X.; Tang, J. GIS spatial distribution and ecological risk assessment of heavy metals in surface sediments of shallow lakes in Jiangsu Province. Huan Jing Ke Xue Huanjing Kexue 2016, 37, 1321–1329. [Google Scholar]
- Satapathy, D.R.; Salve, P.R.; Katpatal, Y.B. Spatial distribution of metals in ground/surface waters in the Chandrapur district (Central India) and their plausible sources. Environ. Geol. 2009, 56, 1323–1352. [Google Scholar] [CrossRef]
- Rashid, A.; Khan, S.; Ayub, M.; Sardar, T.; Jehan, S.; Zahir, S.; Khan, M.S.; Muhammad, J.; Khan, R.; Ali, A.; et al. Mapping human health risk from exposure to potential toxic metal contamination in groundwater of Lower Dir, Pakistan: Application of multivariate and geographical information system. Chemosphere 2019, 225, 785–795. [Google Scholar] [CrossRef]
- Darwish, D.H.; Basiony, A.I.; El-Alfy, M.A. Mapping heavy metals contamination and eco-risk along Mediterranean Sea coast, Egypt. Geocarto Int. 2022, 37, 8645–8671. [Google Scholar] [CrossRef]
- Dalin, C.; Wada, Y.; Kastner, T.; Puma, M.J. Groundwater depletion embedded in international food trade. Nature 2017, 543, 700–704. [Google Scholar] [CrossRef]
- Yoffe, S.; Fiske, G.; Giordano, M.; Giordano, M.; Larson, K.; Stahl, K.; Wolf, A.T. Geography of international water conflict and cooperation: Data sets and applications. Water Resour. Res. 2004, 40, 1–12. [Google Scholar] [CrossRef]
- Hacısalihoğlu, S.; Karaer, F.; Katip, A. Applications of geographic information system (GIS) analysis of lake Ulua-bat. Environ. Monit. Assess. 2016, 188, 331. [Google Scholar] [CrossRef]
- Ismael, M.; Mokhtar, A.; Farooq, M.; Lü, X. Assessing drinking water quality based on physical, chemical and microbial parameters in the Red Sea State, Sudan using a combination of water quality index and artificial neural network model. Groundw. Sustain. Dev. 2021, 14, 100612. [Google Scholar] [CrossRef]
- Hrkal, Z.; Gadalia, A.; Jucker, C. Contamination of groundwaters by heavy metals in the city of Ust Kamenogorsk, north-eastern Kazakhstan. Environ. Geol. 2001, 41, 174–182. [Google Scholar] [CrossRef]
- Álvarez-Valero, A.M.; Sáez, R.; Pérez-López, R.; Delgado, J.; Nieto, J.M. Evaluation of heavy metal bio-availability from Almagrera pyrite-rich tailings dam (Iberian Pyrite Belt, SW Spain) based on a sequential extraction procedure. J. Geochem. Explor. 2009, 102, 87–94. [Google Scholar] [CrossRef]
- Tiwari, A.K.; De Maio, M.; Amanzio, G. Evaluation of metal contamination in the groundwater of the Aosta Valley Region, Italy. Int. J. Environ. Res. 2017, 11, 291–300. [Google Scholar] [CrossRef]
- Salem, I.B.; Nazzal, Y.; Howari, F.M.; Sharma, M.; Mogaraju, J.K.; Xavier, C.M. Geospatial assessment of groundwater quality with the distinctive portrayal of heavy metals in the United Arab Emirates. Water 2022, 14, 879. [Google Scholar] [CrossRef]
- Benaissa, C.; Rossi, A.; Bouhmadi, B.; El Hammoudani, Y.; Dimane, F. GIS-based hydrochemical assessment of groundwater in the Bakoya Massif, Northern Morocco. Desal. Water Treat. 2024, 317, 100287. [Google Scholar] [CrossRef]
- Hernández-Mena, L.; Panduro-Rivera, M.G.; Díaz-Torres, J.D.J.; Ojeda-Castillo, V.; Real-Olvera, J.D.; López-Cervantes, M.; Pacheco-Domínguez, R.L.; Morton-Bermea, O.; Santacruz-Benítez, R.; Vallejo-Rodríguez, R.; et al. GIS, multivariate statistics analysis and health risk assessment of water supply quality for human use in Central Mexico. Water 2021, 13, 2196. [Google Scholar] [CrossRef]
- Kulmatov, R.; Taylakov, A.; Khasanov, S. GIS approach for the evaluation of water resources quality indicators of the Aydar-Arnasay Lakes System in Uzbekistan. Sustain. Water Resour. Manag. 2024, 10, 36. [Google Scholar] [CrossRef]
- Anim-Gyampo, M.; Anornu, G.K.; Agodzo, S.K.; Appiah-Adjei, E.K. Groundwater risk assessment of shallow aquifers within the Atankwidi Basin of Northeastern Ghana. Earth Syst. Environ. 2019, 3, 59–72. [Google Scholar] [CrossRef]
- Affian, K.; Robin, M.; Maanan, M.; Digbehi, B.; Djagoua, E.V.; Kouamé, F. Heavy metal and polycyclic aromatic hydrocarbons in Ebrié lagoon sediments, Côte d’Ivoire. Environ. Monit. Assess. 2009, 159, 531–541. [Google Scholar] [CrossRef] [PubMed]
- Ahmed, S.; Khurshid, S.; Qureshi, F.; Hussain, A.; Bhattacharya, A. Heavy metals and geo-accumulation index development for groundwater of Mathura city, Uttar Pradesh. Desal. Water Treat. 2019, 138, 291–300. [Google Scholar] [CrossRef]
- He, Y.; Zhang, Q.; Li, H.; Wang, W.; Hua, J. Heavy metal pollution characteristics and systemic risk assessment of the environment around the tailings site. J. Soils Sediments 2024, 24, 217–229. [Google Scholar] [CrossRef]
- Adamu, A.Y.; Nigussie, A.B.; Amognehegn, A.E. Hydrogeochemical Study and Geospatial Analysis of Water Quality Using GIS based Water Index and Multivariate Statistics in Kombolcha City, Ethiopia. Water Air Soil Pollut. 2024, 235, 637. [Google Scholar] [CrossRef]
- Lu, Q.; Bian, Z.; Tsuchiya, N. Hydrotransport-oriented Zn, Cu, and Pb behavior assessment and source identification in the river network of a historically mined area in the Hokuroku basin, Northeast Japan. Int. J. Environ. Res. Public Health 2019, 16, 3907. [Google Scholar] [CrossRef]
- Martínez, L.L.; Poleto, C. Lead distribution by urban sediments on impermeable areas of Porto Alegre–RS, Brazil. J. Urban Environ. Eng. 2010, 4, 1–8. [Google Scholar] [CrossRef]
- Gkaragkouni, A.; Dimas, X.; Sergiou, S.; Christodoulou, D.; Anastasopoulos, L.; Geraga, M.; Karapanagioti, H.K.; Papatheodorou, G. Metal Pollution and Health–Ecological Risk Assessment in an Intensely Burdened Coastal Environment of Greece, the Saronikos Gulf: A 50-Year Critical Review. Water 2025, 17, 1029. [Google Scholar] [CrossRef]
- Aghamelu, O.P.; Omeka, M.E.; Unigwe, C.O. Modeling the vulnerability of groundwater to pollution in a fractured shale aquifer in SE Nigeria using information entropy theory, geospatial, and statistical modeling approaches. Model. Earth Syst. Environ. 2023, 9, 2385–2406. [Google Scholar] [CrossRef]
- Monte, L.; Brittain, J.E.; Gallego, E.; Håkanson, L.; Hofman, D.; Jiménez, A. MOIRA-PLUS: A decision support system for the management of complex fresh water ecosystems contaminated by radionuclides and heavy metals. Comput. Geosci. 2009, 35, 880–896. [Google Scholar] [CrossRef]
- Demirel, Z. Monitoring of heavy metal pollution of groundwater in a phreatic aquifer in Mersin-Turkey. Environ. Monit. Assess. 2007, 132, 15–23. [Google Scholar] [CrossRef] [PubMed]
- Jusufi, K.; Ejupi, A.; Demaku, S.; Maliqi, E. Monitoring Heavy Metals and Spatial Analysis Using Pollution Indices and Cartographic Visualization: A Case Study in Kosovo. Soil Sediment Contam. Int. J. 2024, 34, 1402–1419. [Google Scholar] [CrossRef]
- Baggio, H.; Heinrich, H. Natural and anthropogenic contributions to concentration and distribution of heavy metals in surface water and in stream sediments in the Formoso River, Buritizeiro municipality-Minas Gerais State, Brazil. Comun. Geológicas 2012, 99, 71–78. [Google Scholar]
- Sankoh, A.A.; Amara, J.; Komba, T.; Laar, C.; Sesay, A.; Derkyi, N.S.; Frazer-Williams, R. Seasonal assessment of heavy metal contamination of groundwater in two major dumpsites in Sierra Leone. Cogent Eng. 2023, 10, 2185955. [Google Scholar] [CrossRef]
- Megremi, I.; Vasilatos, C.; Vassilakis, E.; Economou-Eliopoulos, M. Spatial diversity of Cr distribution in soil and groundwater sites in relation with land use management in a Mediterranean region: The case of C. Evia and Assopos-Thiva Basins, Greece. Sci. Total Environ. 2019, 651, 656–667. [Google Scholar] [CrossRef]
- Ahmed, N.; Bodrud-Doza, M.; Islam, A.R.M.T.; Hossain, S.; Moniruzzaman, M.; Deb, N.; Bhuiyan, M.A.Q. Appraising spatial variations of As, Fe, Mn and NO3 contaminations associated health risks of drinking water from Surma basin, Bangladesh. Chemosphere 2019, 218, 726–740. [Google Scholar] [CrossRef] [PubMed]
- Cai, W.; Lin, Q.; Jai, X.; Wang, Z.; Li, C.; Yang, M. Synthetic assessment on pollution level and potential ecological risk of heavy metals in Kaozhou Bay. Chin. J. Ecol. 2005, 10, 343. [Google Scholar]
- Agarin, C.J.M.; Mascareñas, D.R.; Nolos, R.; Chan, E.; Senoro, D.B. Transition metals in freshwater crustaceans, tilapia, and inland water: Hazardous to the population of the small island province. Toxics 2021, 9, 71. [Google Scholar] [CrossRef]
- Kang, M.J.; Mesev, V.; Myint, S.W. Urbanization and Quality of Stormwater Runoff: Remote Sensing Measurements of Land Cover in an Arid City. Korean J. Remote Sens. 2014, 30, 399–415. [Google Scholar] [CrossRef]
- Omar, A.E.; Abdel-Halim, K.A.; Arnous, M.O. State of the practice worldwide: Utilizing hydrogeochemical data and GIS tools to assess the groundwater quality in arid region: Example from Wadi Feiran Basin, Southwestern Sinai, Egypt. Groundw. Monit. Remediat. 2024, 44, 101–121. [Google Scholar] [CrossRef]
- Banica, A.; Breaban, I.G.; Terryn, I.C.; Munteanu, A. Vulnerability and resilience of the urban drinking water system in the city of Bacau, Romania. In Proceedings of the 3rd International Multidisciplinary Scientific Conference on Social Sciences and Arts SGEM 2016, Albena, Bulgaria, 24–30 August 2016; pp. 1209–1218. [Google Scholar]
- Al-Fahdawi, A.A.; Rabee, A.M.; Al-Hirmizy, S.M. Water quality monitoring of Al-Habbaniyah Lake using remote sensing and in situ measurements. Environ. Monit. Assess. 2015, 187, 367. [Google Scholar] [CrossRef] [PubMed]
- Topa, C.; Murariu, G.; Calmuc, V.; Calmuc, M.; Arseni, M.; Serban, C.; Chitescu, C.; Georgescu, L. A spatial–seasonal study on the Danube River in the adjacent Danube Delta area: Case study—Monitored heavy metals. Water 2024, 16, 2490. [Google Scholar] [CrossRef]
- Budeanu, M.; Şofletea, N.; Petriţan, I.C. Among-population variation in quality traits in two Romanian provenance trials with Picea abies L. Balt. For. 2014, 20, 37–47. [Google Scholar]
- Besliu, E.; Curtu, A.L.; Apostol, E.N.; Budeanu, M. Using adapted and productive European beech (Fagus sylvatica L.) provenances as future solutions for sustainable forest management in Romania. Land 2024, 13, 183. [Google Scholar] [CrossRef]
- Besliu, E.; Curtu, A.L.; Budeanu, M.; Apostol, E.N.; Ciocîrlan, M.I. Exploring the effects of the assisted transfer of European beech (Fagus sylvatica L.) provenances in the Romanian Carpathians. Not. Bot. Horti Agrobot. Cluj-Napoca 2024, 52, 13968. [Google Scholar] [CrossRef]
- Budeanu, M.; Besliu, E.; Pepelea, D. Testing the radial increment and climate–growth relationship between Swiss Stone pine European provenances in the Romanian Carpathians. Forests 2025, 16, 391. [Google Scholar] [CrossRef]
- Budeanu, M.; Popescu, F.; Beșliu, E.; Aposton, N.E. Diallel crossing (10 × 10) in Swiss stone pine. Juvenile-adult correlations and genetic gain for predicting forward selection. Ann. For. Res. 2024, 67, 109–120. [Google Scholar] [CrossRef]
- Alqarawy, A.; El Osta, M.; Masoud, M.; Elsayed, S.; Gad, M. Use of hyperspectral reflectance and water quality indices to assess groundwater quality for drinking in arid regions, Saudi Arabia. Water 2022, 14, 2311. [Google Scholar] [CrossRef]
- Baran, H.A.; Nalbantcilar, M.T.; Koktan, N. Pollution and health risk assessment of heavy metals in waters around mine sites of Elazig (Eastern Turkey). J. Mt. Sci. 2023, 20, 1293–1306. [Google Scholar] [CrossRef]
- Faiku, F.; Haziri, A. Assessment of the water quality of Lumbardhi River, Prizren (Kosovo). Bulg. Chem. Commun. 2016, 48, 646–658. [Google Scholar]
- El-Alfy, M.A.; Elnaggar, A.A. Ecological and human risk assessment of heavy metals at Abu-Qir coastline of Mediterranean Sea in Egypt using GIS. Acta Ecol. Sin. 2023, 43, 907–924. [Google Scholar] [CrossRef]
- Ghahramani, E.; Khoshniyat, R.; Chavoshi, S.; Golzar, F.A.K. Heavy Metal Contamination in Drinking Water Supplies in the Villages of Divandarreh: The Use of Geographic Information System. Avicenna J. Environ. Health Eng. 2020, 7, 86–91. [Google Scholar] [CrossRef]
- Zhao, Y.P.; Wu, R.; Cui, J.L.; Gan, S.C.; Pan, J.C.; Guo, P.R. Improvement of water quality in the Pearl River Estuary, China: A long-term (2008–2017) case study of temporal-spatial variation, source identification and ecological risk of heavy metals in surface water of Guangzhou. Environ. Sci. Pollut. Res. 2020, 27, 21084–21097. [Google Scholar] [CrossRef]
- Al-Ameer, S.; AbuSaleem, K.; Abukashabeh, A.; Twaiq, O.; Al-Absi, E. Is Raw Spring Water Safe For Drinking? A Case Study For Spring Water Quality In Jordan. Fresenius Environ. Bull. 2020, 29, 10602–10610. [Google Scholar]
- Ahsan, W.A.; Ahmad, H.R.; Farooqi, Z.U.R.; Sabir, M.; Ayub, M.A.; Rizwan, M.; Ilic, P. Surface water quality assessment of Skardu springs using Water Quality Index. Environ. Sci. Pollut. Res. 2021, 28, 20537–20548. [Google Scholar] [CrossRef]
- Anwar, M.; Shirazi, S.A.; Mazhar, U. Spatial distribution and health risk assessment of groundwater pollution in Kotlakhpat industrial complex, Lahore. Water Air Soil Pollut. 2024, 235, 157. [Google Scholar] [CrossRef]
- Kluska, M.; Jabłońska, J. Pollution assessment and spatial distribution of heavy metals in surface waters and bottom sediments of the Krzna River (Poland). Water 2024, 16, 1008. [Google Scholar] [CrossRef]
- Severini, M.D.F.; Carbone, M.E.; Villagran, D.M.; Marcovecchio, J.E. Toxic metals in a highly urbanized industry-impacted estuary (Bahia Blanca Estuary, Argentina): Spatio-temporal analysis based on GIS. Environ. Earth Sci. 2018, 77, 393. [Google Scholar] [CrossRef]
- Lanjwani, M.F.; Khuhawar, M.Y.; Lanjwani, A.H.; Khuahwar, T.M.J.; Samtio, M.S.; Rind, I.K.; Soomro, W.A.; Khokhar, L.A.; Channa, F.A. Spatial variability and risk assessment of metals in groundwater of district Kamber-Shahdadkot, Sindh, Pakistan. Groundw. Sustain. Dev. 2022, 18, 100784. [Google Scholar] [CrossRef]
- Badar, M.S.; Ali, S.; Daniyal; Akram, M.W.; Faheem, K.; Khan, S.U.; Farooqi, I.H. GIS-based assessment of groundwater vulnerability to heavy metal contamination via water quality pollution indices in urban Aligarh, India. Water Pract. Technol. 2024, 19, 419–434. [Google Scholar] [CrossRef]
- Sur, I.M.; Moldovan, A.; Micle, V.; Polyak, E.T. Assessment of surface water quality in the Baia Mare area, Romania. Water 2022, 14, 3118. [Google Scholar] [CrossRef]
- Sishu, F.K.; Melese, T.B.; Aklog, D. Assessment of heavy metal and other chemical pollution in Lake Tana along urban peripheries, Ethiopia. Water Pract. Technol. 2024, 19, 1200–1218. [Google Scholar] [CrossRef]
- Moingt, M.; Lucotte, M.; Paquet, S.; Beaulne, J.S. The influence of anthropogenic disturbances and watershed morphological characteristics on Hg dynamics in Northern Quebec large boreal lakes. Adv. Environ. Res. 2013, 2, 81–98. [Google Scholar] [CrossRef]
- Kaur, R.; Rani, R. Spatial characterization and prioritization of heavy metal contaminated soil-water resources in peri-urban areas of National Capital Territory (NCT), Delhi. Environ. Monit. Assess. 2006, 123, 233–247. [Google Scholar] [CrossRef] [PubMed]
- Vasile, D.; Petritan, A.-M.; Tudose, N.C.; Toiu, F.L.; Scarlatescu, V.; Petritan, I.C. Structure and Spatial Distribution of Dead Wood in Two Temperate Old-Growth Mixed European Beech Forests. Not. Bot. Horti Agrobot. 2017, 45, 639–645. [Google Scholar] [CrossRef]
- Mihalache, A.L.; Marin, M.; Davidescu, Ș.O.; Ungurean, C.; Adorjani, A.; Tudose, N.C.; Davidescu, A.A.; Clinciu, I. Physical status of torrent control structures in Romania. Environ. Eng. Manag. J. 2020, 19, 861–872. [Google Scholar] [CrossRef]
- Marin, M.; Clinciu, I.; Tudose, N.C.; Ungurean, C.; Mihalache, A.L.; Mărțoiu, N.E.; Tudose, O.N. Assessment of Seasonal Surface Runoff under Climate and Land Use Change Scenarios for a Small Forested Watershed: Upper Tarlung Watershed (Romania). Water 2022, 14, 2860. [Google Scholar] [CrossRef]
- Marin, M.; Tudose, N.C.; Ungurean, C.; Mihalache, A.L. Application of Life Cycle Assessment for Torrent Control Structures: A Review. Land 2024, 13, 1956. [Google Scholar] [CrossRef]
- Mustățea, M.; Clius, M.; Tudose, N.C.; Cheval, S. An enhanced Machado Index of naturalness. Catena 2022, 212, 106091. [Google Scholar] [CrossRef]
- Oprică, R.; Tudose, N.C.; Davidescu, Ș.O.; Zup, M.; Marin, M.; Comanici, A.N.; Crit, M.N.; Pitar, D. Gender inequalities in Transylvania’s largest peri-urban forest usage. Ann. For. Res. 2022, 65, 57–69. [Google Scholar] [CrossRef]
- Tudose, N.C.; Petritan, I.C.; Toiu, F.L.; Petritan, A.-M.; Marin, M. Relation between Topography and Gap Characteristics in a Mixed Sessile Oak–Beech Old-Growth Forest. Forests 2023, 14, 188. [Google Scholar] [CrossRef]
- Murariu, G.; Dinca, L.; Tudose, N.; Crișan, V.; Georgescu, L.; Munteanu, D.; Mocanu, G.D. Structural characteristics of the main resinous stands from Southern Carpathians, Romania. Forests 2021, 12, 1029. [Google Scholar] [CrossRef]
- Dincă, L.; Achim, F. The management of forests situated on fields susceptible to landslides and erosion from the Southern Carpathians. Sci. Papers. Ser. Manag. Econ. Eng. Agric. Rural Dev. 2019, 19, 183–188. [Google Scholar]
- Hendawy, E.; Belal, A.A.A.; Rebouh, N.Y.; Shokr, M.S.; Mohamed, E.S.; Sheta, A.E.A.S.; Abou-Hadid, A.F. Assessing Surface Water Quality Using Risk Indicators, Geographic Information System Modeling Techniques, and Multi-Statistical Methods in Arid Regions to Maintain the Sustainability of Water Resources. Agronomy 2024, 14, 2834. [Google Scholar] [CrossRef]
- Albanese, S.; Iavazzo, P.; Adamo, P.; Lima, A.; De Vivo, B. Assessment of the environmental conditions of the Sarno river basin (south Italy): A stream sediment approach. Environ. Geochem. Health 2013, 35, 283–297. [Google Scholar] [CrossRef]
- Scherer, U.; Fuchs, S.; Behrendt, H.; Hillenbrand, T. Emissions of heavy metals into river basins of Germany. Water Sci. Technol. 2003, 47, 251–257. [Google Scholar] [CrossRef]
- Chabuk, A.; Jahad, U.A.; Majdi, A.; Majdi, H.S.; Hadi, A.A.; Hadi, H.; Isam, M. Integrating WQI and GIS to assess water quality in Shatt Al-Hillah River, Iraq using physicochemical and heavy metal elements. Appl. Water Sci. 2023, 13, 147. [Google Scholar] [CrossRef]
- Akdoğan, Z.; Güven, B.; Balcıoğlu, I. Modeling nutrient and heavy metal transport at selected catchments in the Marmara Region. Fresenius Environ. Bull. 2016, 25, 969–980. [Google Scholar]
- Elmahdi, A.; Afify, A.; Abdin, A. Development of a GIS-based decision support tool and assessment of Nile River water quality. Int. J. Water 2008, 4, 55–68. [Google Scholar] [CrossRef]
- Akhtar, M.A.; Akhtar, N.; Shoeb, M. Study of DRASTIC model and its modification by LULC for groundwater vulnerability assessment in Sonipat District, Haryana. J. Geol. Soc. India 2022, 98, 955–960. [Google Scholar] [CrossRef]
- Ashraf, S.; Abbas, F.; Ibrahim, M.; Rashid, U.; Khalid, S.; Ahmad, H.R.; Majeed, T. Application of GIS for the identification and demarcation of selective heavy metal concentrations in the urban groundwater. J. Geogr. Sci. 2015, 25, 225–235. [Google Scholar] [CrossRef]
- Dai, H.; Quddoos, A.; Naz, I.; Batool, A.; Yaseen, A.; Ali, M.; Alzahrani, H. Geospatial decision support system for urban and rural aquifer resilience: Integrating Remote sensing-based rangeland analysis with groundwater quality assessment. Rangel. Ecol. Manag. 2025, 99, 102–118. [Google Scholar] [CrossRef]
- Fordyce, F.M.; Dochartaigh, B.Ó.; Bonsor, H.C.; Ander, E.L.; Graham, M.T.; McCuaig, R.; Lovatt, M. Assessing threats to shallow groundwater quality from soil pollutants in Glasgow, UK: Development of a new screening tool. Earth Environ. Sci. Trans. R. Soc. Edinb. 2017, 108, 173–190. [Google Scholar] [CrossRef]
- Necula, M.; Tușa, I.M.; Sidoroff, M.E.; Ițcuș, C.; Florea, D.; Amărioarei, A.; Păun, A.; Pacioglu, O.; Păun, M. How accurate is the remote sensing based estimate of water physico-chemical parameters in the Danube Delta (Romania). Ann. For. Res. 2022, 65, 103–114. [Google Scholar] [CrossRef]
- Shahsavani, S.; Shooshtarian, M.R.; Tabatabaei, H.R.; Dehghani, M. An ontology-based approach for modeling the heavy metals’ temporal and spatial variations in groundwater resources by using fuzzy multi-criteria group decision-making models and geographical information system. Desal. Water Treat. 2018, 136, 259–267. [Google Scholar] [CrossRef]
- Sankhla, M.S.; Kumari, M.; Nandan, M.; Kumar, R.; Agrawal, P. Heavy metals contamination in water and their hazardous effect on human health—A review. Int. J. Curr. Microbiol. Appl. Sci. 2016, 5, 759–766. [Google Scholar] [CrossRef]
- Lace, A.; Cleary, J. A Review of Microfluidic Detection Strategies for Heavy Metals in Water. Chemosensors 2021, 9, 60. [Google Scholar] [CrossRef]
- Liu, X.; Zhong, L.; Meng, J.; Wang, F.; Zhang, J.; Zhi, Y.; Zeng, L.; Tang, X.; Xu, J. A multi-medium chain modeling approach to estimate the cumulative effects of cadmium pollution on human health. Environ. Pollut. 2018, 239, 308–317. [Google Scholar] [CrossRef] [PubMed]
- Singh, K.K.; Tewari, G.; Kumar, S.; Busa, R.; Chaturvedi, A.; Rathore, S.S.; Singh, R.K.; Gangwar, A. Understanding urban groundwater pollution in the Upper Gangetic Alluvial Plains of northern India with multiple industries and their impact on drinking water quality and associated health risks. Groundw. Sustain. Dev. 2023, 21, 100902. [Google Scholar] [CrossRef]
- Nawab, J.; Khan, S.; Ali, S.; Sher, H.; Rahman, Z.; Khan, K.; Tang, J.; Ahmad, A. Health risk assessment of heavy metals and bacterial contamination in drinking water sources: A case study of Malakand Agency, Pakistan. Environ. Monit. Assess. 2016, 188, 286. [Google Scholar] [CrossRef]
- Boum-Nkot, S.N.; Nlend, B.; Komba, D.; Ndondo, G.N.; Bello, M.; Fongoh, E.; Ntamak-Nida, M.-J.; Etame, J. Hydrochemistry and assessment of heavy metals groundwater contamination in an industrialized city of sub-Saharan Africa (Douala, Cameroon). Implication on human health. HydroResearch 2023, 6, 52–64. [Google Scholar] [CrossRef]
- Bolea, V.; Chira, D.; Popa, M.; Mantale, C.; Pepelea, D.; Gancz, V.; Iacoban, C. Trees-synthetic bioindicators and bioaccumulators in forest ecosystems. Analele ICAS 2006, 49, 67–77. [Google Scholar]
- Wall, W.A.; Busby, R.; Bosche, L. Vegetation predicts soil shear strength in Arctic Soils: Ground-based and remote sensing techniques. Ann. For. Res. 2024, 67, 155–166. [Google Scholar] [CrossRef]
- Kushwaha, M.; Shankar, S.; Goel, D.; Singh, S.; Chaurasia, P.K. Role of plants as bioindicators of water pollution and treatment of water contaminations. In Biotechnologies for Wastewater Treatment and Resource Recovery; Elsevier: Amsterdam, The Netherlands, 2025; pp. 187–201. [Google Scholar]
- Bolea, V.; Chira, D.; Sarbu, G. Ecological reconstruction, tending and management of riparian forest ecosystems. Rev. Silvic. Cineget. 2014, 19, 53–73. [Google Scholar]
- Dincă, L.; Murariu, G.; Enescu, C.M.; Achim, F.; Georgescu, L.; Murariu, A.; Holonec, L. Productivity differences between southern and northern slopes of Southern Carpathians (Romania) for Norway spruce, silver fir, birch and black alder. Not. Bot. Horti Agrobot. Cluj-Napoca 2020, 48, 1070–1084. [Google Scholar] [CrossRef]
- Achim, F.; Dinca, L.; Chira, D.; Raducu, R.; Chirca, A.; Murariu, G. Sustainable Management of Willow Forest Landscapes: A Review of Ecosystem Functions and Conservation Strategies. Land 2025, 14, 1593. [Google Scholar] [CrossRef]
- Hayati, T.; Korkorian, N.; Peshotan, N.; Sadeghi, A.; Doudi, M. Overview of Bioremediation (Bacteria) of Some Heavy Metals and Metalloids from 2014 to 2024. Int. J. New Find. Health Educ. Sci. 2025, 3, 202–219. [Google Scholar]
- Jabade, M.; Kaur, J. Systematic Review of Phytoremediation: Efficacy of Aquatic Plants in Wastewater Treatment and Pollutant Removal. Nat. Environ. Pollut. Technol. 2025, 24, B4243. [Google Scholar] [CrossRef]
- Borges, R.C.; Caldas, V.G. A review of use of GIS for the evaluation of heavy metal and water quality parameters in the Canal do Cunha watershed and west of the Guanabara Bay, Rio de Janeiro (Brazil). J. Sediment. Environ. 2016, 1, 268–278. [Google Scholar] [CrossRef]
- Qu, J.H.; Meng, X.L.; Ye, X.Q. Characteristic variation and original analysis of emergent water source pollution accidents in China between 1985 and 2013. Environ. Sci. Pollut. Res. 2016, 23, 19675–19685. [Google Scholar] [CrossRef] [PubMed]
- Liu, R.Z.; Zhang, K.; Zhang, Z.J.; Borthwick, A.G.L. Water-scale environmental risk assessment of accident water pollution: The case of Laoguan River, China. J. Environ. Inform. 2018, 31, 87–96. [Google Scholar]
- Pulido-Velazquez, M.; Escriva-Bou, A. Developing a water-energy-GHG emissions modeling framework: Insights from an application to California’s water system. Environ. Model. Softw. 2018, 109, 54–65. [Google Scholar]
- Ueda, S.; Hasegawa, H.; Kakiuchi, H. Nuclear accident-derived H-3 in river water of Fukushima Prefecture during 2011–2014. J. Environ. Radioact. 2015, 146, 102–109. [Google Scholar] [CrossRef]
- Becker, N.M.; Van Eeckhout, E.; David, N.A.; Irvine, J.M. Applying GIS Characterizing and Modeling Contaminant Transport in Surface Water at Los Alamos National Laboratory (No. LA-UR-95-3388; CONF-960451-1); Los Alamos National Laboratory: Los Alamos, NM, USA, 1995.
- Bhatti, N.B.; Siyal, A.A.; Qureshi, A.L.; Solangi, G.S.; Memon, N.A.; Bhatti, I.A. Impact of small dam’s construction on groundwater quality and level using water quality index (WQI) and GIS: Nagarparkar area of Sindh, Pakistan. Hum. Ecol. Risk Assess. 2020, 26, 2586–2607. [Google Scholar] [CrossRef]
- Hasan, M.M.; Ahmed, M.S.; Adnan, R. Assessment of physico-chemical characteristics of river water emphasizing tannery industrial park: A case study of Dhaleshwari River, Bangladesh. Environ. Monit. Assess. 2020, 192, 807. [Google Scholar] [CrossRef]
- Bhuiyan, M.A.H.; Suruvi, N.I.; Dampare, S.B.; Islam, M.A.; Quraishi, S.B.; Ganyaglo, S.; Suzuki, S. Investigation of the possible sources of heavy metal contamination in lagoon and canal water in the tannery industrial area in Dhaka, Bangladesh. Environ. Monit. Assess. 2011, 175, 633–649. [Google Scholar] [CrossRef]
- Deshmukh, K.K.; Aher, S.P. Assessment of the impact of municipal solid waste on groundwater quality near the Sangamner City using GIS approach. Water Resour. Manag. 2016, 30, 2425–2443. [Google Scholar] [CrossRef]
- Haque, E.; Reza, S.; Ahmed, R. Assessing the vulnerability of groundwater due to open pit coal mining using DRASTIC model: A case study of Phulbari Coal Mine, Bangladesh. Geosci. J. 2018, 22, 359–371. [Google Scholar] [CrossRef]
- Luo, D.; Liu, Y. Distribution and mobilization of heavy metals at an acid mine drainage affected region in South China, a post-remediation study. Sci. Total Environ. 2020, 724, 138122. [Google Scholar] [CrossRef]
- Ceramella, J.; De Maio, A.C.; Basile, G.; Facente, A.; Scali, E.; Andreu, I.; Sinicropi, M.S.; Iacopetta, D.; Catalano, A. Phyto-chemicals involved in mitigating silent toxicity induced by heavy metals. Foods 2024, 13, 978. [Google Scholar] [CrossRef]
- Anchidin-Norocel, L.; Gutt, G.; Tătăranu, E.; Amariei, S. Electrochemical sensors and biosensors: Effective tools for detecting heavy metals in water and food with possible implications for children’s health. Int. J. Electrochem. Sci. 2024, 19, 100643. [Google Scholar] [CrossRef]
- Zhu, Y.; Yang, Q.; Wang, H.; Yang, J.; Zhang, X.; Li, Z.; Martín, J.D. A hydrochemical and isotopic approach for source identification and health risk assessment of groundwater arsenic pollution in the central Yinchuan Basin. Environ. Res. 2023, 231, 116153. [Google Scholar] [CrossRef] [PubMed]
- Althomali, R.H.; Abbood, M.A.; Saleh, E.A.M.; Djuraeva, L.; Abdullaeva, B.S.; Habash, R.T.; Alhassan, M.S.; Alawady, A.H.R.; Alsaalamy, A.H.; Najafi, M.L. Exposure to heavy metals and neurocognitive function in adults: A systematic review. Environ. Sci. Eur. 2024, 36, 18. [Google Scholar] [CrossRef]
- Shukla, S.; Mbingwa, G.; Khanna, S.; Dalal, J.; Sankhyan, D.; Malik, A.; Badhwar, N. Environment and health hazards due to military metal pollution: A review. Environ. Nanotechnol. Monit. Manag. 2023, 20, 100857. [Google Scholar] [CrossRef]
- Wu, Y.-S.; Osman, A.I.; Hosny, M.; Elgarahy, A.M.; Eltaweil, A.S.; Rooney, D.W.; Chen, Z.; Rahim, N.S.; Sekar, M.; Gopinath, S.C.B.; et al. The toxicity of mercury and its chemical compounds: Molecular mechanisms and environmental and human health implications: A comprehensive review. ACS Omega 2024, 9, 5100–5126. [Google Scholar] [CrossRef] [PubMed]
- Karaouzas, I.; Kapetanaki, N.; Mentzafou, A.; Kanellopoulos, T.D.; Skoulikidis, N. Heavy metal contamination status in Greek surface waters; a review with application and evaluation of pollution indices. Chemosphere 2020, 263, 128192. [Google Scholar] [CrossRef]
- Proshad, R.; Islam, S.; Tusher, T.R.; Zhang, D.; Khadka, S.; Gao, J.; Kundu, S. Appraisal of heavy metal toxicity in surface water with human health risk by a novel approach: A study on an urban river in vicinity to industrial areas of Bangladesh. Toxin Rev. 2020, 40, 803–819. [Google Scholar] [CrossRef]
- Tokatli, C.; Ustaoğlu, F. Health risk assessment of toxicants in Meriç River delta wetland, Thrace region, Turkey. Environ. Earth Sci. 2020, 79, 426. [Google Scholar] [CrossRef]
- Soltaninia, S.; Eskandaripour, M.; Ahmadi, Z.; Ahmadi, S.; Eslamian, S. The hidden threat of heavy metal leaching in urban runoff: Investigating the long-term consequences of land use changes on human health risk exposure. Environ. Res. 2024, 251, 118668. [Google Scholar] [CrossRef] [PubMed]
- Colak, E.H.; Yomralioglu, T.; Nisanci, R.; Yildirim, V.; Duran, C. Geostatistical analysis of the relationship between heavy metals in drinking water and cancer incidence in residential areas in the Black Sea region of Turkey. J. Environ. Health 2015, 77, 86–93. [Google Scholar] [PubMed]
- Oginawati, K.; Susetyo, S.H.; Rosalyn, F.A.; Kurniawan, S.B.; Abdullah, S.R.S. Risk analysis of inhaled hexavalent chromium (Cr 6+) exposure on blacksmiths from industrial area. Environ. Sci. Pollut. Res. 2021, 28, 14000–14008. [Google Scholar] [CrossRef] [PubMed]
- Ahmad, W.; Alharthy, R.D.; Zubair, M.; Ahmed, M.; Hameed, A.; Rafique, S. Toxic and heavy metals contamination assessment in soil and water to evaluate human health risk. Sci. Rep. 2021, 11, 17006. [Google Scholar] [CrossRef]
- Karami, L.; Alimohammadi, M.; Soleimani, H.; Askari, M. Assessment of water quality changes during climate change using the GIS software in a plain in the southwest of Tehran province, Iran. Desalination Water Treat. 2019, 148, 119–127. [Google Scholar] [CrossRef]
- Rozemeijer, J.C.; Broers, H.P. The groundwater contribution to surface water contamination in a region with intensive agricultural land use (Noord-Brabant, The Netherlands). Environ. Pollut. 2007, 148, 695–706. [Google Scholar] [CrossRef]
- Visser, A.; Kroes, J.; Van Vliet, M.T.; Blenkinsop, S.; Fowler, H.J.; Broers, H.P. Climate change impacts on the leaching of a heavy metal contamination in a small lowland catchment. J. Contam. Hydrol. 2012, 127, 47–64. [Google Scholar] [CrossRef]
- Ye, F.; Huang, X.; Zhang, D.; Tian, L.; Zeng, Y. Distribution of heavy metals in sediments of the Pearl River Estuary, Southern China: Implications for sources and historical changes. J. Environ. Sci. 2012, 24, 579–588. [Google Scholar] [CrossRef] [PubMed]
- Lunetta, R.; Congalton, R.; Fenstermaker, L.; Jensen, J.; Mcgwire, K.; Tinney, L.R. Remote sensing and geographic information system data integration- Error sources and research issues. Photogramm. Eng. Remote Sens. 1991, 57, 677–687. [Google Scholar]
- Neeson, T.M.; Gorman, A.M.; Whiting, P.J.; Koonce, J.F. Factors affecting accuracy of stream channel slope estimates derived from geographical information systems. North Am. J. Fish. Manag. 2008, 28, 722–732. [Google Scholar] [CrossRef]

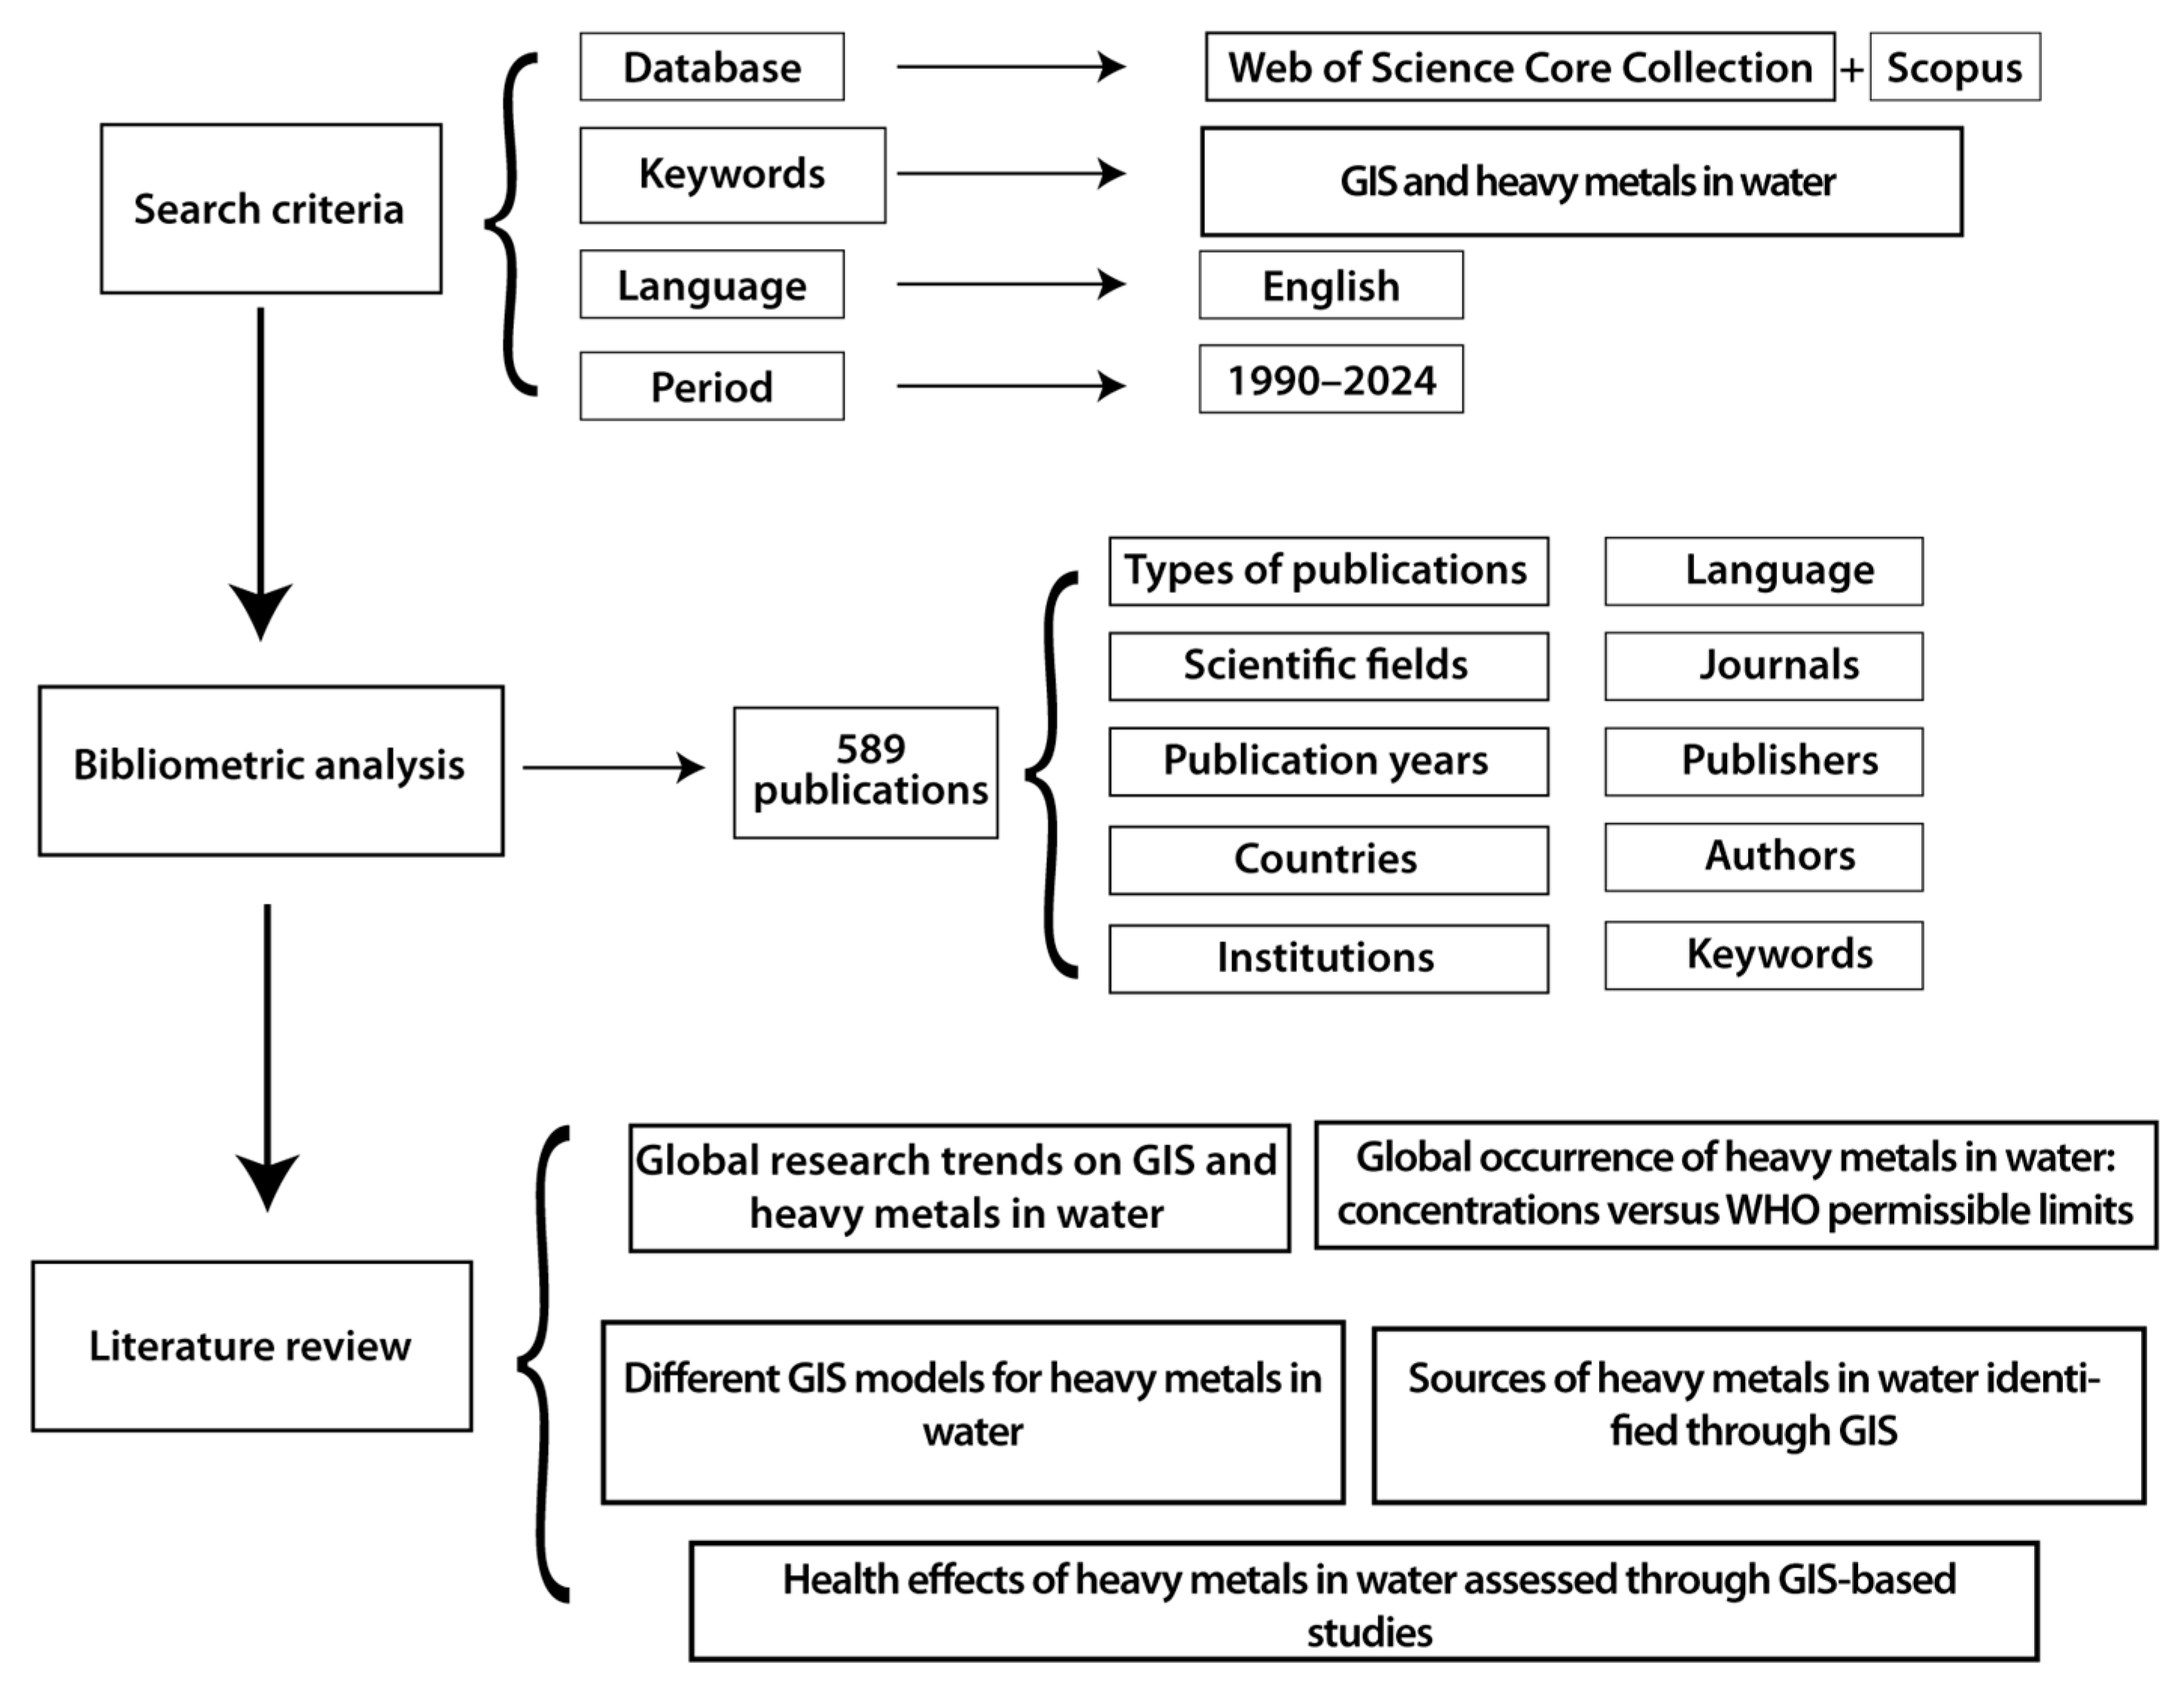
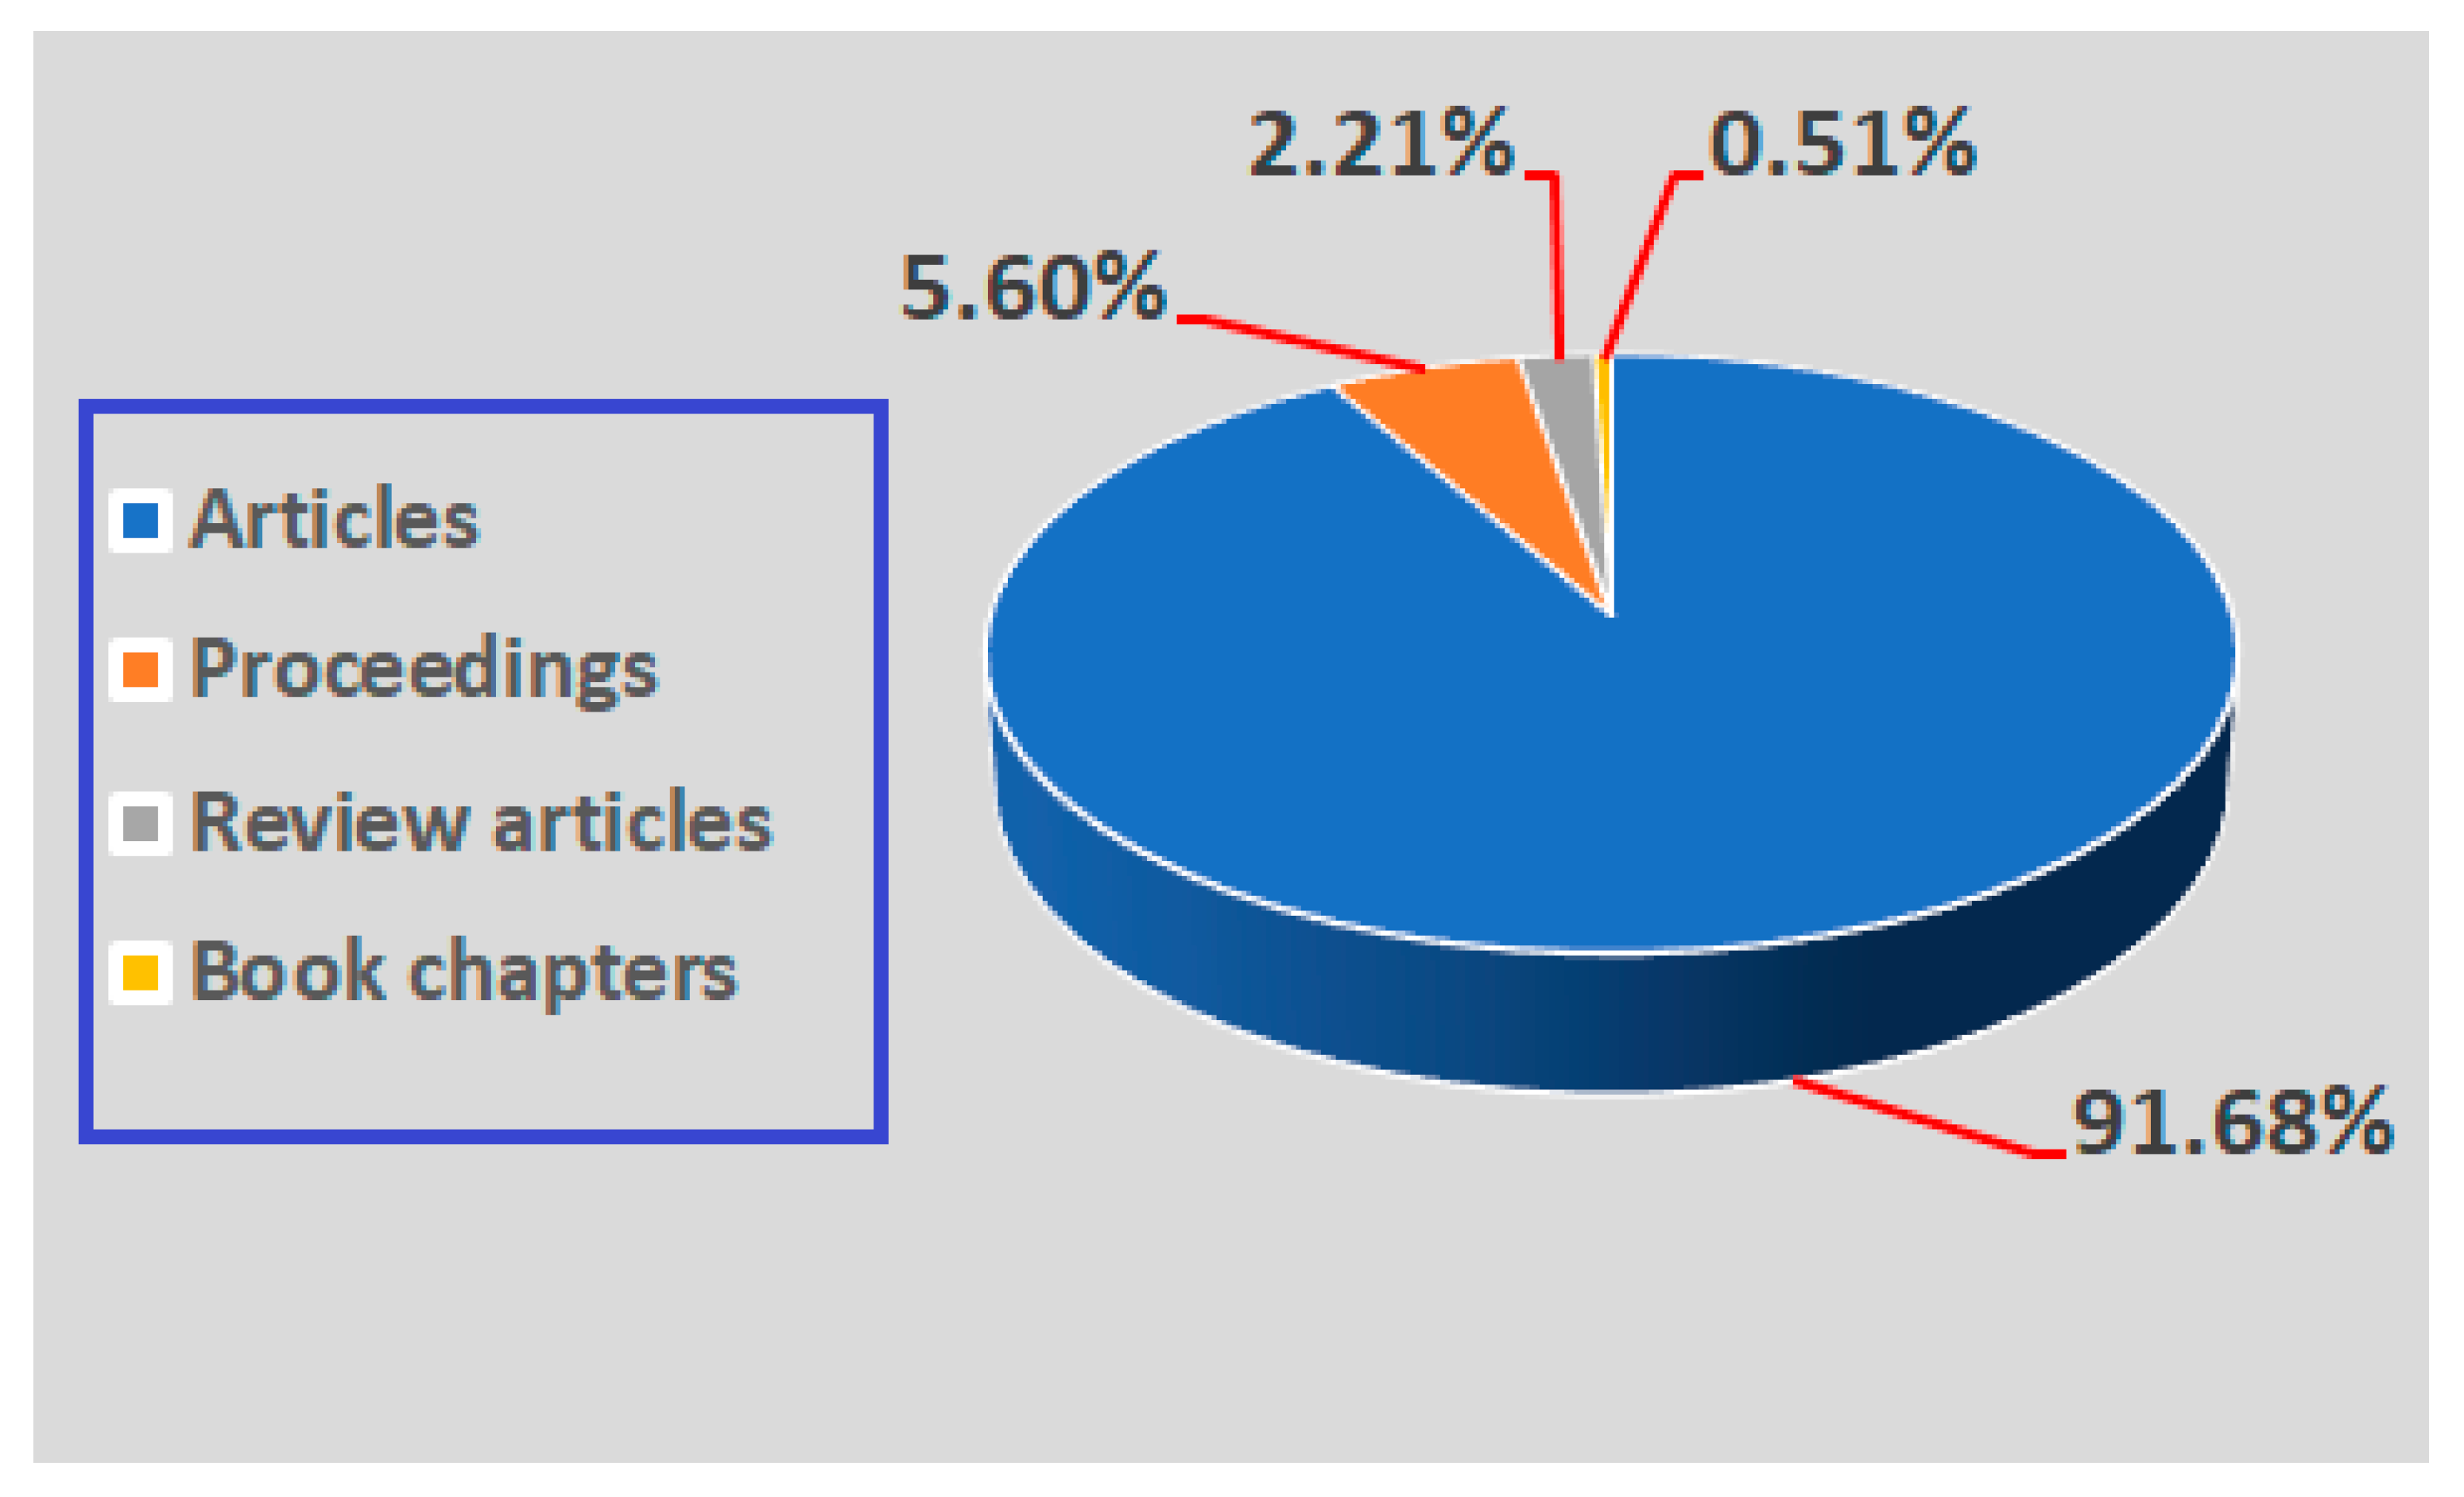
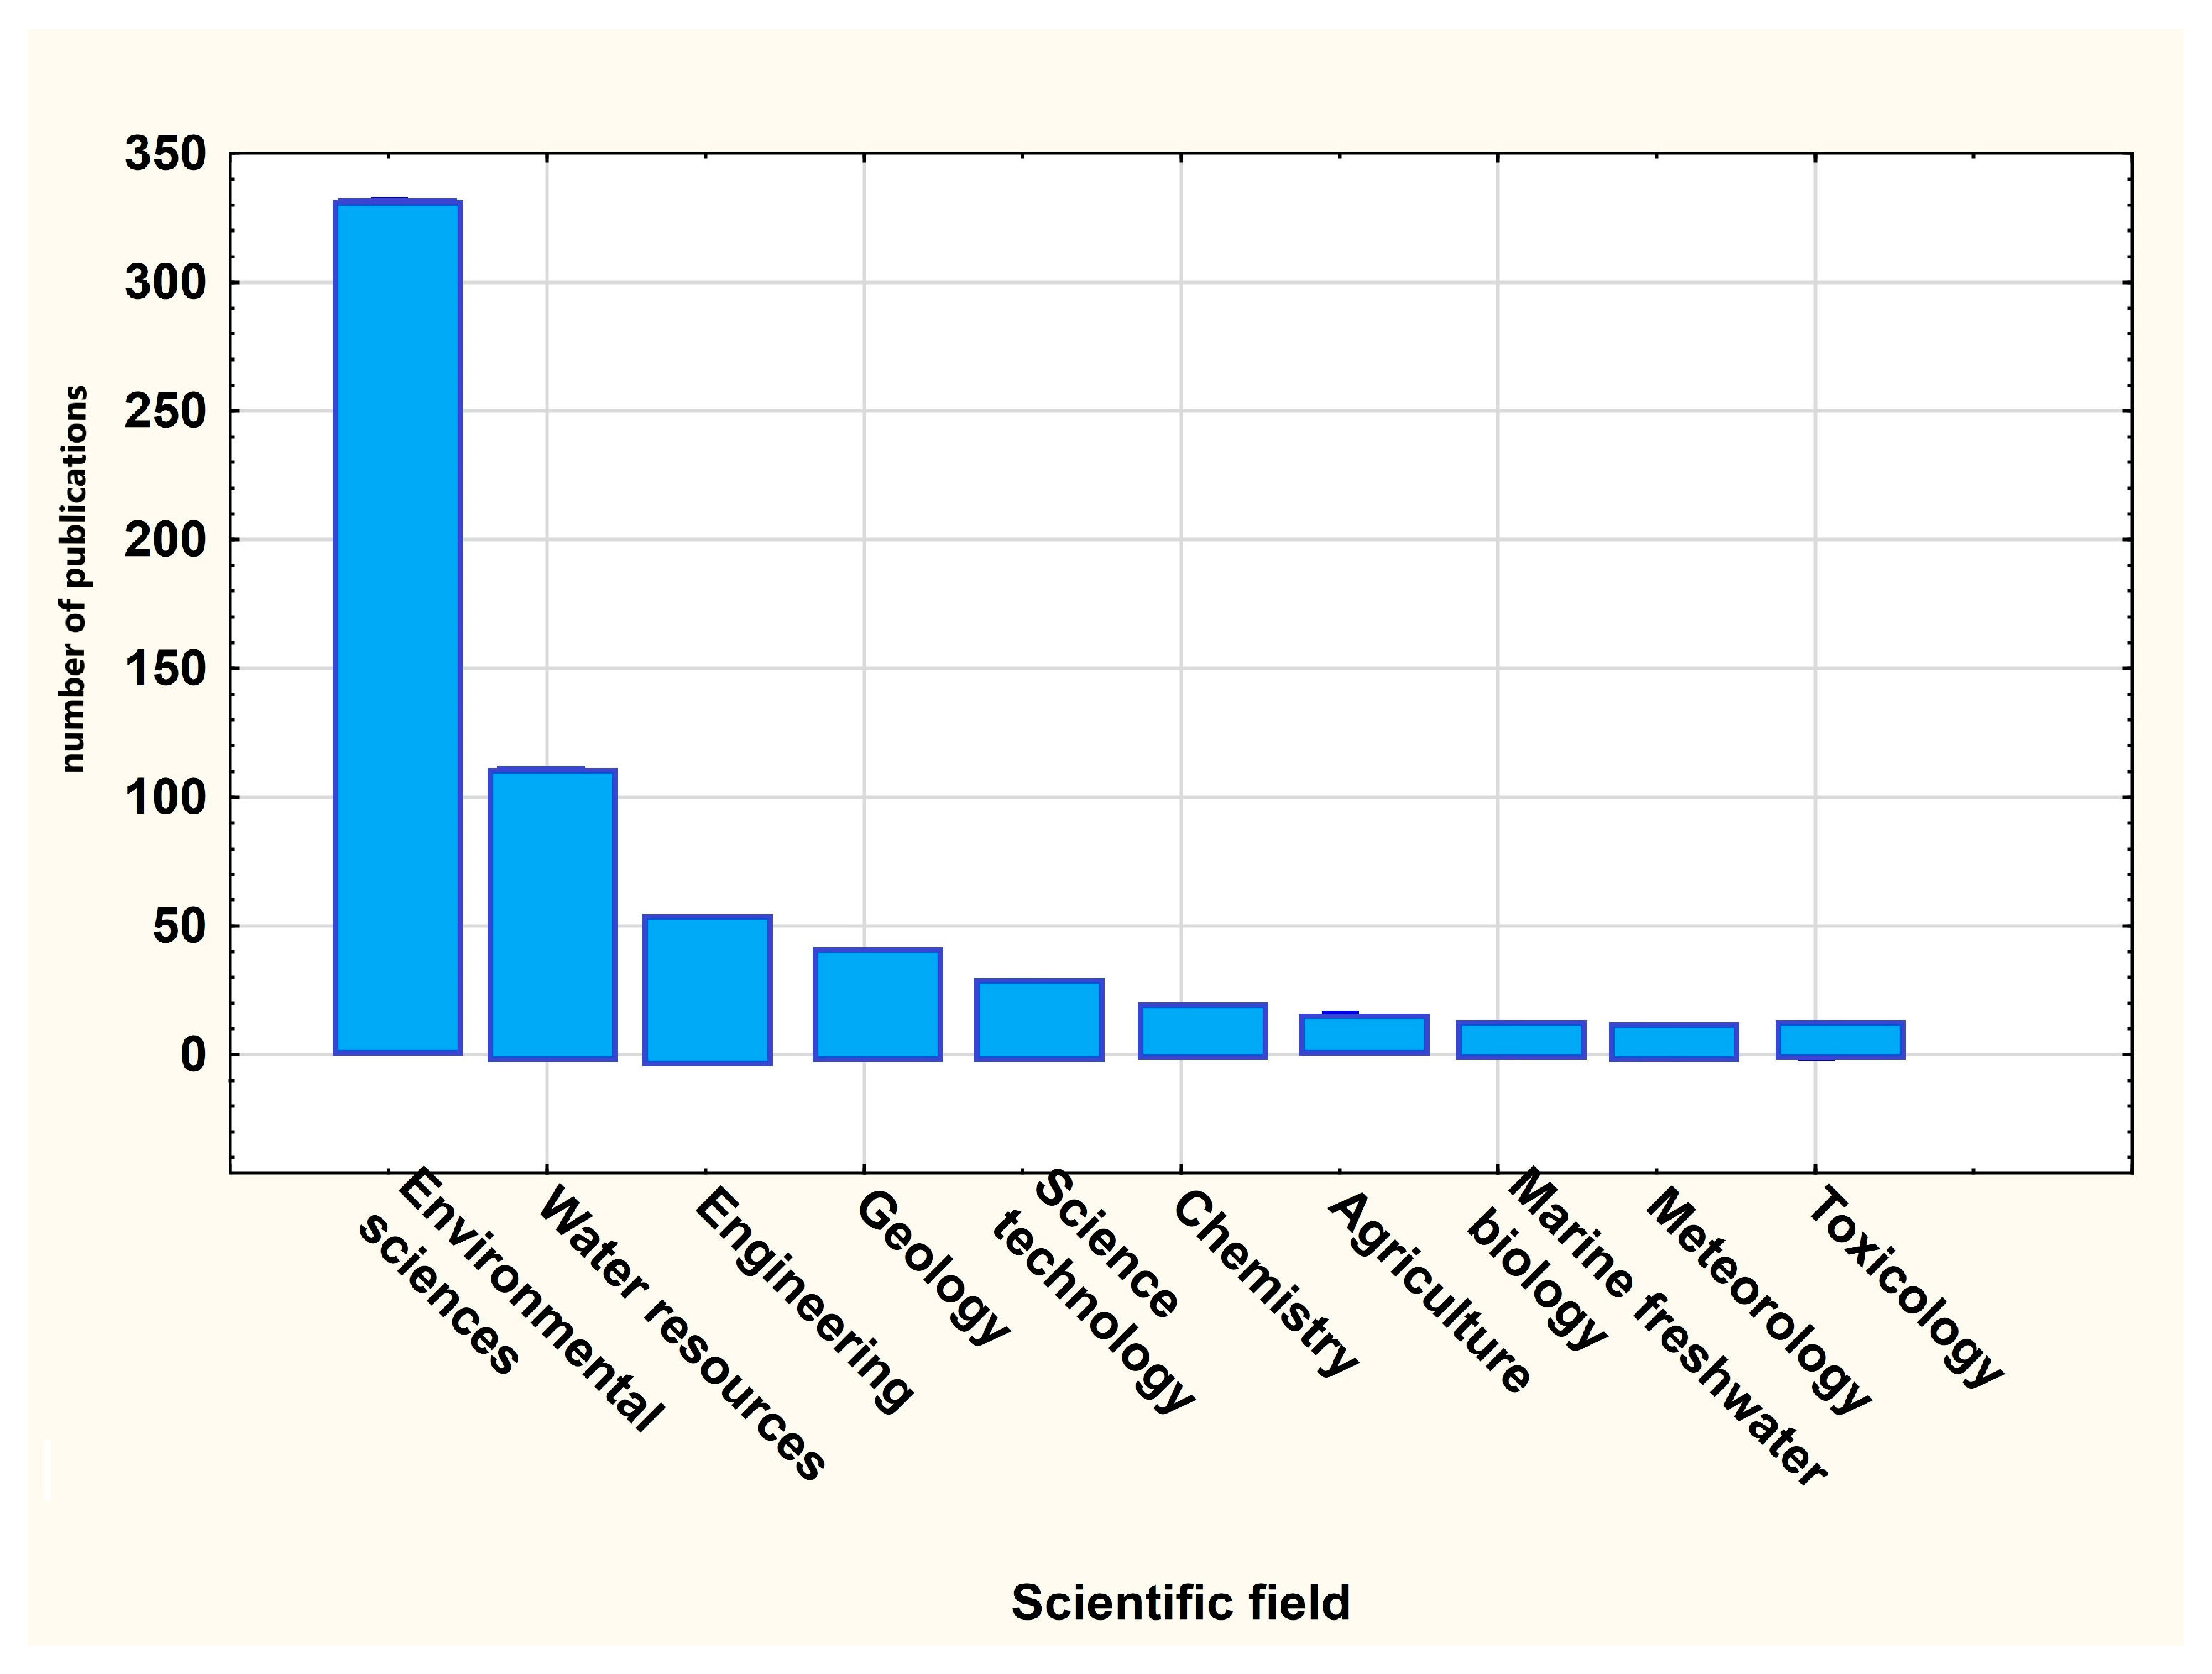
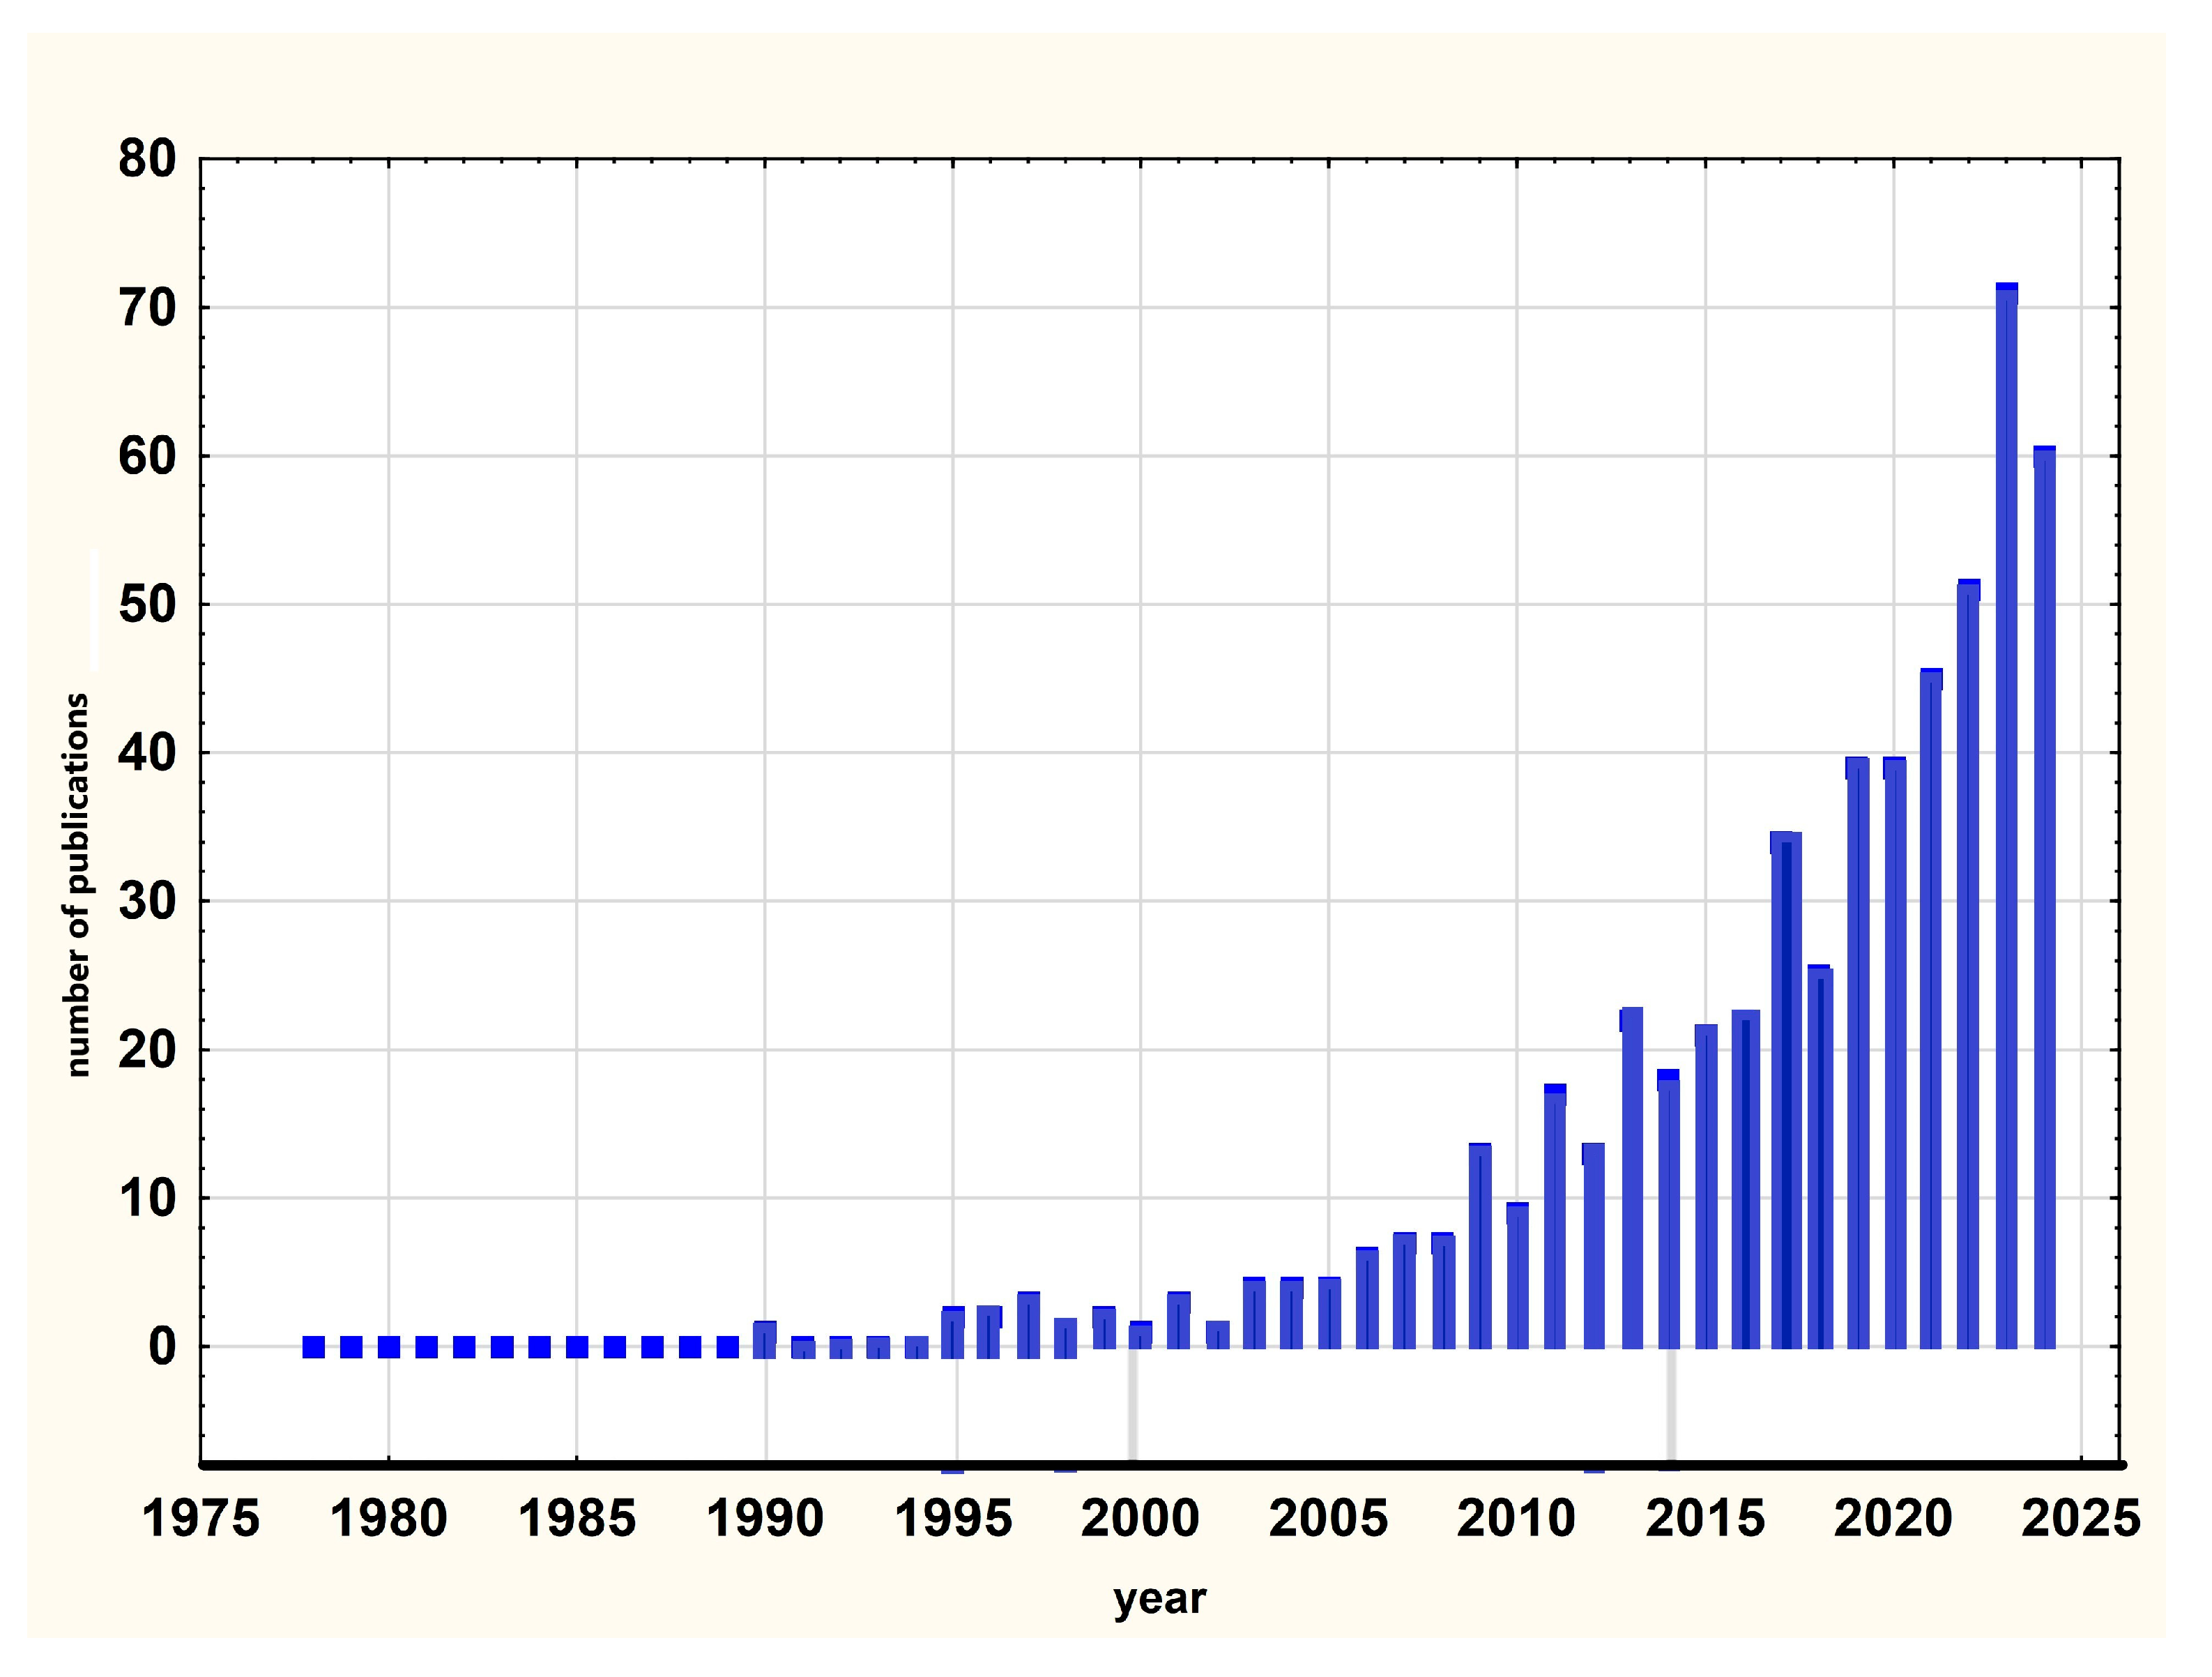
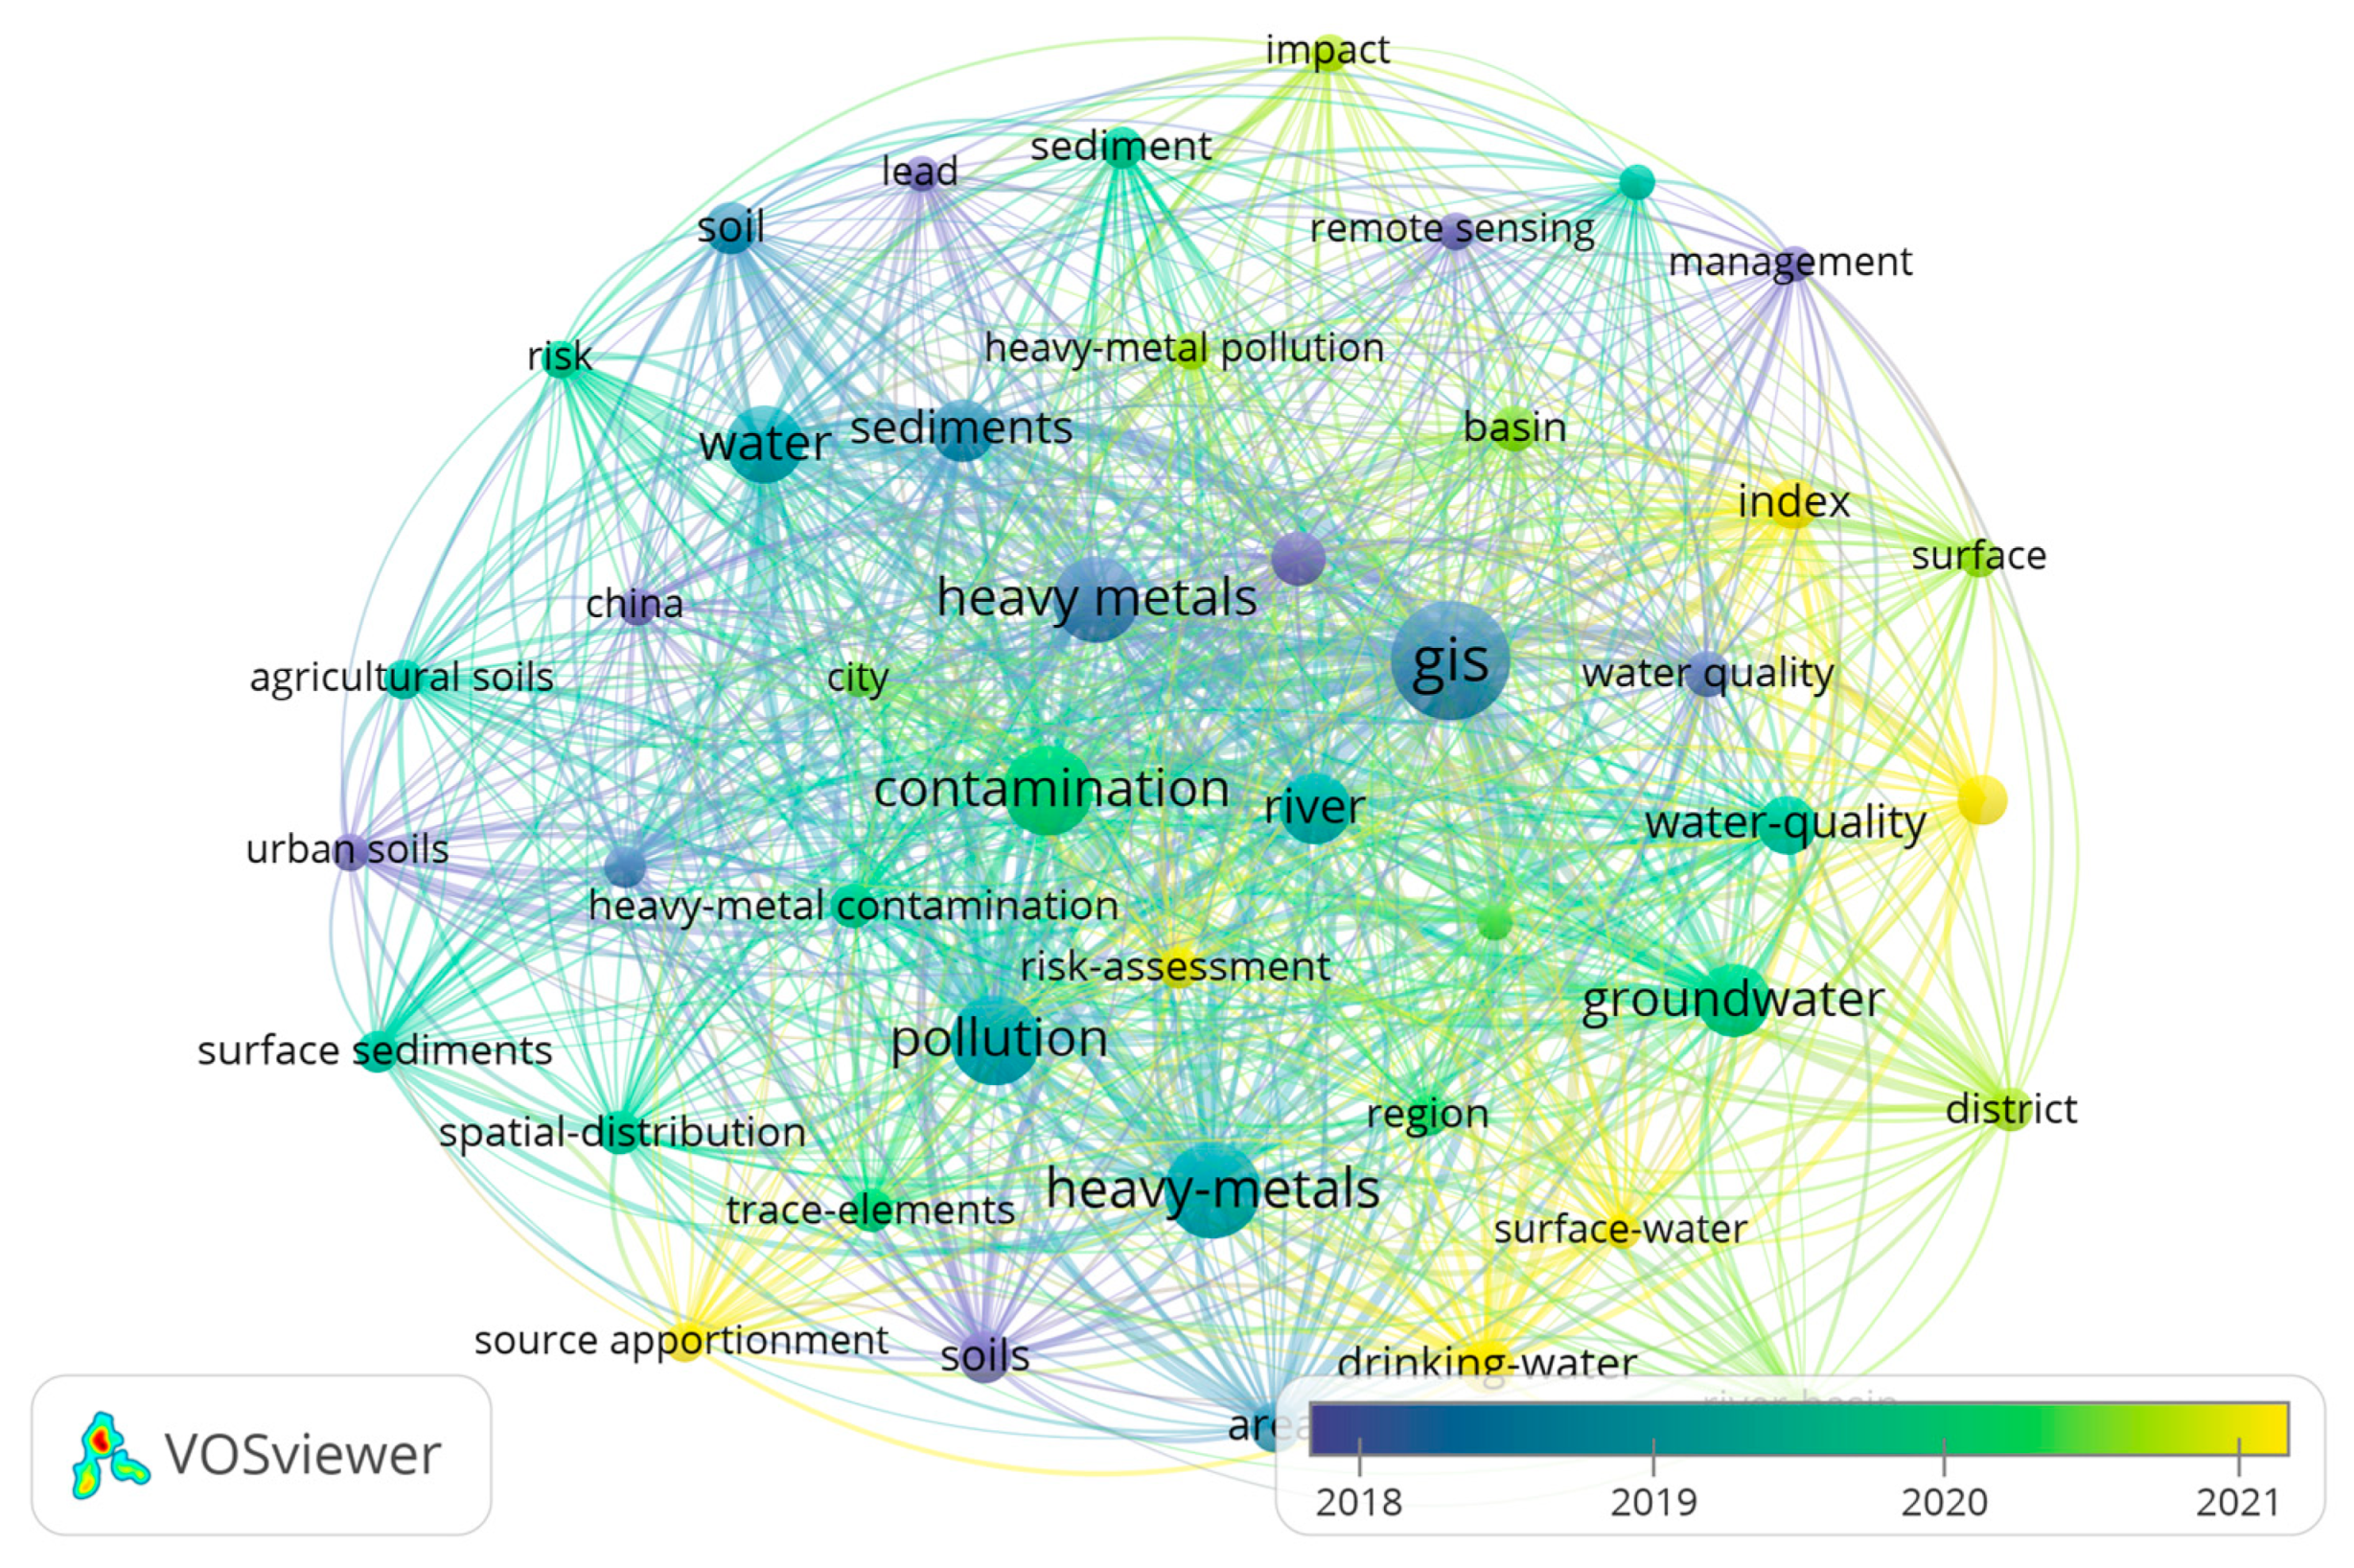
| Crt. No. | Journal | Publisher | Documents | Citations | Total Link Strength |
|---|---|---|---|---|---|
| 1 | Environmental Monitoring and Assessment | Springer/Springer Science and Business Media | 34 | 859 | 33 |
| 2 | Water | MDPI (Basel) | 32 | 546 | 25 |
| 3 | Chemosphere | Elsevier (Elsevier Ltd.) | 13 | 893 | 23 |
| 4 | Applied Water Science | Springer/SpringerOpen, (Springer Science and Business Media) | 12 | 374 | 21 |
| 5 | Environmental Science and Pollution Research | Springer (Springer Nature) | 25 | 579 | 17 |
| 6 | Environmental Pollution | Elsevier (Elsevier Sci. Ltd.) | 9 | 729 | 16 |
| 7 | Groundwater for Sustainable Development | Elsevier B.V. | 8 | 122 | 12 |
| 8 | Science of the Total Environment | Elsevier (Elsevier B.V.) | 18 | 1308 | 11 |
| 9 | Sustainability | MDPI (Basel) | 11 | 176 | 11 |
| 10 | Environmental Earth Sciences | Springer (Springer Science and Business Media Springer-Verlag) | 17 | 342 | 10 |
| 11 | Environmental Geochemistry and Health | Springer/Kluwer Academic Publishers (Dordrecht) | 10 | 269 | 8 |
| 12 | Water Air and Soil Solution | Springer Science + Business Media | 12 | 133 | 7 |
| Crt. No. | Keyword | Occurrences | Total Link Strength |
|---|---|---|---|
| 1 | GIS | 265 | 1160 |
| 2 | heavy metals | 259 | 1125 |
| 3 | contamination | 152 | 779 |
| 4 | pollution | 149 | 686 |
| 5 | groundwater | 103 | 505 |
| 6 | river | 95 | 493 |
| 7 | water | 110 | 487 |
| 8 | sediments | 73 | 348 |
| 9 | drinking water | 58 | 338 |
| 10 | water quality | 66 | 295 |
| 11 | groundwater quality | 49 | 236 |
| 12 | basin | 42 | 201 |
| 13 | water quality | 42 | 195 |
| 14 | trace elements | 37 | 181 |
| Cur. No. | Area of Research | Region | Citing Article |
|---|---|---|---|
| 1 | Applications of geographic information system (GIS) analysis of lake water | Uluabat, Turkey | Hacısalihoğlu et al., 2016 [48] |
| 2 | Assessing drinking water quality | Red Sea State, Sudan | Ismael et al., 2021 [49] |
| 3 | Contamination of groundwaters by HMs | Ust Kamenogorsk, Kazakhstan | Hrkal et al., 2001 [50] |
| 4 | Evaluation of heavy metal bioavailability from tailings dam | Almagrera, Spain | Alvarez-Valero et al., 2009 [51] |
| 5 | Evaluation of metal contamination in the groundwater | Aosta Valley Region, Italy | Tiwari et al., 2017 [52] |
| 6 | Geospatial assessment of groundwater quality with the distinctive portrayal of HMs | United Arab Emirates | Salem et al., 2022 [53] |
| 7 | GIS-based hydrochemical assessment of groundwater | Bakoya Massif, Morocco | Benaissa et al., 2024 [54] |
| 8 | GIS, multivariate statistics analysis, and health risk assessment of water supply quality for human use | Central Mexico | Hernández-Mena et al., 2021 [55] |
| 9 | GIS approach for the evaluation of water resources’ quality indicators | Aydar-Arnasay Lakes System, Uzbekistan | Kulmatov et al., 2024 [56] |
| 10 | Groundwater risk assessment of shallow aquifers | Atankwidi Basin, Ghana | Anim-Gyampo et al., 2019 [57] |
| 11 | Heavy metal and polycyclic aromatic hydrocarbons | Ebrié lagoon, Côte d’Ivoire | Affian et al., 2009 [58] |
| 12 | HMs and geo-accumulation index development for groundwater | Mathura city, Uttar Pradesh, India | Ahmed et al., 2019 [59] |
| 13 | Heavy metal pollution characteristics and systemic risk assessment of the environment around the tailings site | China | He et al., 2024 [60] |
| 14 | Hydrogeochemical study and geospatial analysis of water quality | Kombolcha City, Ethiopia | Adamu et al., 2024 [61] |
| 15 | Hydro-transport-oriented Zn, Cu, and Pb behavior assessment and source identification in the river network of a historically mined area | Hokuroku Basin, Japan | Lu et al., 2019 [62] |
| 16 | Lead distribution by urban sediment | Porto Alegre, Brazil | Martinez and Poleto, 2010 [63] |
| 17 | Metal pollution and health–ecological risk assessment | Saronikos Gulf, Greece | Gkaragkouni et al., 2025 [64] |
| 18 | Modeling the vulnerability of groundwater to pollution | SE Nigeria | Aghamelu et al., 2023 [65] |
| 19 | MOIRA-PLUS: a decision support system for the management of complex freshwater ecosystems contaminated by radionuclides and HMs | general | Monte et al., 2009 [66] |
| 20 | Monitoring of heavy metal pollution of groundwater | Mersin, Turkey | Demirel, 2007 [67] |
| 21 | Monitoring HMs and spatial analysis using pollution indices and cartographic visualization | Lake Henci, Kosovo | Jusufi et al., 2024 [68] |
| 22 | Natural and anthropogenic contributions to concentration and distribution of HMs in surface water | Formoso river, Brazil | Baggio and Heinrich, 2012 [69] |
| 23 | Seasonal assessment of heavy metal contamination of groundwater | Sierra Leone | Sankoh et al., 2023 [70] |
| 24 | Spatial diversity of Cr distribution in soil and groundwater sites in relation with land use management | Central Evia and Assopos-Thiva Basins, Greece | Megremi et al., 2019 [71] |
| 25 | Spatial variations of As, Fe, Mn, and NO3 contaminations of drinking water | Surma basin, Bangladesh | Ahmed et al., 2019 [72] |
| 26 | Synthetic assessment on pollution level and potential ecological risk of HMs | Kaozhou Bay, China | Cai et al., 2005 [73] |
| 27 | Transition metals in freshwater and inland water | Marinduque island, Philippines | Agarin et al., 2021 [74] |
| 28 | Urbanization and quality of stormwater runoff | Phoenix in Arizona, USA | Kang et al., 2014 [75] |
| 29 | Utilizing hydrogeochemical data and GIS tools to assess the groundwater quality in arid regions | Wadi Feiran Basin, Southwestern Sinai, Egypt | Omar et al., 2024 [76] |
| 30 | Vulnerabilities of urban drinking water | Bacau, Romania | Banica et al., 2016 [77] |
| 31 | Water quality monitoring | Al-Habbaniyah Lake, Iraq | Al-Fahdawi et al., 2015 [78] |
| Cur. No. | Element | Value (mg/L) | World Health Organization (WHO) Maximum Permissible Limit 2008 (mg/L) | Region | Citing Article |
|---|---|---|---|---|---|
| 1 | Aluminum (Al) | 0.18–0.58 | 0.2 | Makkah Al-Mukarramah Province, Saudi Arabia | Alqarawi et al., 2022 [85] |
| 2 | 0–6.411 | Elazig, Turkey | Baran et al., 2023 [86] | ||
| 3 | 0.058–0.195 | Lumbardhi river, Kosova | Faiku and Hazizi, 2016 [87] | ||
| 4 | 0.0478 | Chandrapur district, India | Satapathy et al., 2009 [43] | ||
| 5 | Arsenic (As) | 0.00581 | 0.01 | Abu-Qir, Egypt | El-Alfy et al., 2023 [88] |
| 6 | 0.00043–0.0285 | Lumbardhi river, Kosova | Faiku and Hazizi, 2016 [87] | ||
| 7 | 0.00013–0.001 | Divandarreh, Iran | Ghahramani et al., 2020 [89] | ||
| 8 | 0.00174–0.00385 | Lower Dir, Pakistan | Rashid et al., 2019 [44] | ||
| 9 | 0.00189–0.00269 | Pearl River Estuary, China | Zhao et al., 2020 [90] | ||
| 10 | Cadmium (Cd) | 0.00–0.0038 | Cd = 0.005 | Spring water, Jordan | Al-Ameer et al., 2020 [91] |
| 11 | 0.03 | Skardu, Pakistan | Ahsan et al., 2021 [92] | ||
| 12 | 0.001026 | Lahore, Pakistan | Anwar et al., 2024 [93] | ||
| 13 | 0.01837 | Mediterranean Sea coast, Egypt | Darwish et al., 2022 [45] | ||
| 14 | 0.006 | Krzna River, Poland | Kluska and Jabłońska, 2024 [94] | ||
| 15 | 0.0089 | Bahia Blanca Estuary, Argentina | Severini et al., 2018 [95] | ||
| 16 | Cobalt (Co) | 0.00097 | 0.07 | Mediterranean Sea coast, Egypt | Darwish et al., 2022 [45] |
| 17 | 0.0035 | Abu-Qir, Egypt | El-Alfy et al., 2023 [88] | ||
| 18 | 0.0039–0.638 | Kamber-Shahdadkot, Sindh, Pakistan | Lanjwani et al., 2022 [96] | ||
| 19 | 0.10 | Lower Dir, Pakistan | Rashid et al., 2019 [44] | ||
| 20 | Chromium (Cr) | 0.001724–0.004948 | Cr = 0.05 | Spring water, Jordan | Al-Ameer et al., 2020 [91] |
| 21 | 0.001–18.3 | Aligarh, India | Badar et al., 2024 [97] | ||
| 22 | 0.006–0.235 | Elazig, Turkey | Baran et al., 2023 [86] | ||
| 23 | 0–0.134 | Kamber-Shahdadkot, Sindh, Pakistan | Lanjwani et al., 2022 [96] | ||
| 24 | 0.09 | Lower Dir, Pakistan | Rashid et al., 2019 [44] | ||
| 25 | 0.0016 | Chandrapur district, India | Satapathy et al., 2009 [43] | ||
| 26 | 0.0256 | Bahia Blanca Estuary, Argentina | Severini et al., 2018 [95] | ||
| 27 | 0.165–1.57 | Baia Mare, Romania | Sur et al., 2022 [98] | ||
| 28 | Copper (Cu) | 0.867–2.353 | Cu = 0.05 | Skardu, Pakistan | Ahsan et al., 2021 [92] |
| 29 | 0.02–0.18 | Makkah Al-Mukarramah Province, Saudi Arabia | Alqarawy et al., 2022 [85] | ||
| 30 | 0.0014–0.0044 | Lumbardhi river, Kosova | Faiku and Hazizi, 2016 [87] | ||
| 31 | 0.0016 | Chandrapur district, India | Satapathy et al., 2009 [43] | ||
| 32 | 0.10–1.60 | Lake Tana, Ethiopia | Sishu et al., 2024 [99] | ||
| 33 | 0.036–0.195 | Baia Mare, Romania | Sur et al., 2022 [98] | ||
| 34 | Lead (Pb) | 0.00–0.0183 | Pb = 0.05 | Spring water, Jordan | Al-Ameer et al., 2020 [91] |
| 35 | 0.012–0.035 | Makkah Al-Mukarramah Province, Saudi Arabia | Alqarawy et al., 2022 [85] | ||
| 36 | 0–0.065 | Elazig, Turkey | Baran et al., 2023 [86] | ||
| 37 | 0.00286 | Abu-Qir, Egypt | El-Alfy et al., 2023 [88] | ||
| 38 | 0.00002–0.00149 | Shallow Lakes in Jiangsu Province, China | Li et al., 2016 [42] | ||
| 39 | Manganese (Mn) | 0.2464–1.1628 | Mn = 0.1 | Spring water, Jordan | Al-Ameer et al., 2020 [91] |
| 40 | 0.54–1.43 | Makkah Al-Mukarramah Province, Saudi Arabia | Alqarawy et al., 2022 [85] | ||
| 41 | 0–0.316 | Elazig, Turkey | Baran et al., 2023 [86] | ||
| 42 | 0–0.14 | Kamber-Shahdadkot, Sindh, Pakistan | Lanjwani et al., 2022 [96] | ||
| 43 | Mercury (Hg) | 0.00379 | Hg = 0.01 | Abu-Qir, Egypt | El-Alfy et al., 2023 [88] |
| 44 | 0.0007–0.0037 | Northern Quebec large boreal lakes, Canada | Moingt et al., 2013 [100] | ||
| 45 | 0.0455–0.0927 | Pearl River Estuary, China | Zhao et al., 2020 [90] | ||
| 46 | Nickel (Ni) | 0.001481–0.002811 | Ni = 0.07 | Spring water, Jordan | Al-Ameer et al., 2020 [91] |
| 47 | 0.41–0.56 | Makkah Al-Mukarramah Province, Saudi Arabia | Alqarawy et al., 2022 [85] | ||
| 48 | 0.002445 | Lahore, Pakistan | Anwar et al., 2024 [93] | ||
| 49 | 0–0.007 | Delhi, India | Kaur and Rani, 2006 [101] | ||
| 50 | 0.0046–0.0061 | Krzna River, Poland | Kluska and Jabłońska, 2024 [94] | ||
| 51 | 0.0027 | Bahia Blanca Estuary, Argentina | Severini et al., 2018 [95] | ||
| 52 | 0.01–0.718 | Baia Mare, Romania | Sur et al., 2022 [98] | ||
| 53 | Zinc (Zn) | 0.02–0.12 | Zn = 5.0 | Makkah Al-Mukarramah Province, Saudi Arabia | Alqarawy et al., 2022 [85] |
| 54 | 0.06–0.51 | Aligarh, India | Badar et al., 2024 [97] | ||
| 55 | 0.02477 | Mediterranean Sea coast, Egypt | Darwish et al., 2022 [45] | ||
| 56 | 0.0198–0.0314 | Divandarreh, Iran | Ghahramani et al., 2020 [89] | ||
| 57 | 0.05–0.18 | Delhi, India | Kaur and Rani, 2006 [101] |
| Cur. No. | Region/Study | GIS Approach Model | Heavy Metals Assessment | Key Methods/ Tools | Main Findings/ Applications |
|---|---|---|---|---|---|
| 1 | Middle Nile Delta, Egypt | GIS-based indicators | Not specified | IDW interpolation, ArcGIS 10.7 | Spatial variability of irrigation water quality; salinity, ion toxicity, risks to crops |
| 2 | Sarno River Basin, Italy | GIS + Factor Analysis | As, Cd, Cr, Cu, Hg, Pb, Zn | Contamination mapping using GIS, factor analysis | Identification of contamination extent and sources in river sediments |
| 3 | Germany | MONERIS model | Cd, Cr, Cu, Hg, Ni, Pb, Zn | GIS-integrated modeling | Quantified heavy metal inputs into river basins (1985–2000), point and diffuse sources |
| 4 | Iraq | GIS + WQI | Not specified | Weighted arithmetic WQI, IDW | Spatial mapping of water quality variations |
| 5 | Marmara Region, Turkey | GIS + SWMM | Cu, Ni, Zn, TN, TP | Hydrological modeling, kinetic equations | Predicted contaminant transport from land use and precipitation |
| 6 | Nile River, Egypt | GIS-based software tool | Not specified | GUI for visualization | Facilitates water quality assessment and spatial interpretation |
| 7 | India | Modified DRASTIC | F−, SO42−, NO3− | Groundwater vulnerability mapping | Shallow aquifers highly susceptible to pollution |
| 8 | Pakistan | GIS mapping | Various heavy metals | Spatial mapping | Identification of risk-prone zones in urban groundwater |
| 9 | China | GIS + MCDA + Remote Sensing | Not specified | Geostatistical AHP, LULC integration | Scenario-based groundwater quality management |
| 10 | Glasgow, UK | GRASP tool | Cr, Pb, Ni | GIS + soil chemistry | Risk maps for urban groundwater contamination |
| 11 | Bangladesh | GIS + ANN | Arsenic | Backpropagation neural network (6-20-1) | Predicted non-linear relationships and arsenic levels |
| 12 | Various locations | GIS + Fuzzy WQI | Various | Fuzzy multi-criteria decision-making | Spatiotemporal modeling of groundwater quality |
| Cur. Nr. | Source Type | Specific Examples/Regions | Heavy Metals | GIS Applications/Findings |
|---|---|---|---|---|
| 1 | Industrial emissions | Factories, tanneries (India, Egypt, Mexico, Bangladesh) | Cr, Pb, Cd, Cu, As, Zn | Mapping contamination from effluents; identifying hotspots |
| 2 | Urbanization/traffic | Urban areas, children’s parks (UK, global) | Pb, Cr, Ni | GIS-based risk maps showing relation with traffic, solid waste |
| 3 | Agriculture | Fertilizers, pesticides, animal manure | Cd, Cu, Zn, Pb | Spatial visualization of contamination from agricultural runoff |
| 4 | Mining | Coal mines, tailings, AMD (global) | As, Cd, Cu, Zn, Ag | The GIS identifies vulnerable groundwater zones and AMD-affected sites |
| 5 | Waste disposal | MSW landfills (India) | Various metals | GIS-based groundwater assessments show leachate impact |
| 6 | Accidental pollution | Water pollution accidents (China, USA, Japan) | Various metals, radionuclides | GIS + remote sensing reconstructs contamination pathways |
| 7 | Natural sources | Geological weathering, atmospheric deposition | Various metals | Baseline contribution mapped in GISs |
| 8 | Water management issues | Dams, drainage canals (Pakistan, Brazil) | Various metals | The GIS shows temporal and local-scale contamination patterns |
Disclaimer/Publisher’s Note: The statements, opinions and data contained in all publications are solely those of the individual author(s) and contributor(s) and not of MDPI and/or the editor(s). MDPI and/or the editor(s) disclaim responsibility for any injury to people or property resulting from any ideas, methods, instructions or products referred to in the content. |
© 2025 by the authors. Licensee MDPI, Basel, Switzerland. This article is an open access article distributed under the terms and conditions of the Creative Commons Attribution (CC BY) license (https://creativecommons.org/licenses/by/4.0/).
Share and Cite
Murariu, G.; Stanciu, S.; Dinca, L.; Munteanu, D. GIS Applications in Monitoring and Managing Heavy Metal Contamination of Water Resources. Appl. Sci. 2025, 15, 10332. https://doi.org/10.3390/app151910332
Murariu G, Stanciu S, Dinca L, Munteanu D. GIS Applications in Monitoring and Managing Heavy Metal Contamination of Water Resources. Applied Sciences. 2025; 15(19):10332. https://doi.org/10.3390/app151910332
Chicago/Turabian StyleMurariu, Gabriel, Silvius Stanciu, Lucian Dinca, and Dan Munteanu. 2025. "GIS Applications in Monitoring and Managing Heavy Metal Contamination of Water Resources" Applied Sciences 15, no. 19: 10332. https://doi.org/10.3390/app151910332
APA StyleMurariu, G., Stanciu, S., Dinca, L., & Munteanu, D. (2025). GIS Applications in Monitoring and Managing Heavy Metal Contamination of Water Resources. Applied Sciences, 15(19), 10332. https://doi.org/10.3390/app151910332


