Article

Function of Bolts in Arching Process of Surrounding Rocks of Roadways and Its Application in Support Design for Large Section Gateways

1
China Resources Power (Xilin Gol) Coal Co., Ltd., Xilin Gol 026299, China
2
School of Mines, China University of Mining and Technology, Xuzhou 221116, China
*
Author to whom correspondence should be addressed.
Appl. Sci. 2025, 15(19), 10327; https://doi.org/10.3390/app151910327
Submission received: 29 July 2025 / Revised: 10 September 2025 / Accepted: 16 September 2025 / Published: 23 September 2025

Abstract

In order to determine appropriate anchoring parameters after enlarging the cross-section of the mining roadway, a comprehensive study was conducted to investigate the development of deformation and failure characteristics in the surrounding rock. The mechanical behavior of rock failure under high-stress conditions and the progressive evolution of deformation and failure from shallow to deep zones were thoroughly analyzed. It was proposed that the primary function of bolt support in mining roadways is to guide the surrounding rock to form a stable compressive arch or ring structure. The mechanical mechanism underlying the formation of such an arch under bolt guidance, along with the stability characteristics during this process, was investigated. The principles for determining bolt support parameters were established as follows: (a) ensuring the formation of a closed compressive ring within the anchorage zone around the roadway; (b) preventing shear failure at the roadway corners; and (c) controlling the extent of roof subsidence under gravitational loading. Design methodologies for determining rock bolt and anchor cable length and spacing were formulated and implemented in the support design of large-section mining roadways within million-ton fully mechanized mining faces. The cross-sectional dimensions of the supported roadway are 5.8 × 4.0 m. Field monitoring results indicate that, after stabilization of the surrounding rock deformation, the maximum convergence between both sides does not exceed 140 mm, the maximum roof subsidence remains below 40 mm, and the maximum roof separation is limited to within 4 mm. These findings provide strong evidence that the selected design parameters fully meet the engineering requirements for roadway support.

1. Introduction

Large-scale and intensive production modes represent the core developmental trends of China’s coal mining technology. Coal mines implementing the “one mine, one shaft, one face” model have achieved annual outputs exceeding 10.0 Mt. The high productivity of longwall mining faces requires the deployment of large-scale mining equipment. For instance, the support height of certain hydraulic supports has exceeded 8.0 m [1]. To meet the requirements of transportation, ventilation, and equipment installation, the cross-sectional dimensions of roadways must be continuously increased [2]. Some mining roadways now exhibit widths of 5 to 6 m, with cross-sectional areas surpassing 20 m2 [3]. This significant expansion in roadway cross-section has markedly increased the complexity of surrounding rock support. Additionally, the surrounding rock in coal seam roadways is inherently weak in mechanical strength and is subject to mining-induced stress, further complicating support control.
Practical experience has consistently confirmed the effectiveness of rock bolt in supporting coal seam roadways. Under the guidance of the strength reinforcement theory, their extensive application underscores the pivotal role of theoretical research in advancing support technologies [3]. The implementation of rock bolts and anchor cables in coal mining roadways with cross-sectional areas of approximately 20 m2 has resulted in numerous successful engineering applications in China [3,4], with certain cases involving roadways exceeding 30.0 m2 in cross-sectional area [5]. At present, the design of rock bolt support for large cross-sectional coal mining roadways continues to rely on conventional methodologies, including empirical formulas for ordinary coal roadways, integrated with the dome theory and numerical simulation techniques, to determine rock bolt length and spacing [6,7]. Although the literature universally recognizes that larger cross-sectional dimensions increase the complexity of surrounding rock control, the support parameters employed remain largely comparable to those used in standard rock bolt applications. A systematic theoretical or empirical analysis of the relationship between roadway cross-sectional area and rock bolt support parameters is still lacking. Based on the geological conditions of a large cross-sectional coal mining roadway in a specific mine, this study investigates the evolution of surrounding rock failure and evaluates the effectiveness of rock bolt support. Furthermore, it clarifies the mechanical mechanism of active support by examining how rock bolts facilitate the formation of a stabilizing arch within the surrounding rock, and analyzes the influence of cross-sectional variations on rock bolt parameter requirements, ultimately proposing a customized rock bolt support scheme tailored to such roadways.

2. Geological and Working Conditions

The working face 31305 of Chahashu Coal Mine is adjacent to the 31303 and 31307 working faces, as illustrated in Figure 1. It is currently extracting the 3-1 coal seam, which has a thickness ranging from 4.3 to 7.38 m, with an average thickness of 5.92 m and an average burial depth of approximately 400.0 m. The geological structure of the working face is relatively simple. The coal seam strike is 165°, the dip direction is 255°, and the dip angle ranges from 1 to 3°. The lithological characteristics of the roof and floor strata are summarized in Table 1.
The primary gateways serving working face 31305 are as follows: main haulage roadway, auxiliary haulage roadway (or tailgate for working face 31303), tailgate (or auxiliary haulage roadway for working face 31303), main open-off, auxiliary open-off, main withdrawal roadway, and auxiliary withdrawal roadway. Each main haulage roadway and the adjacent auxiliary haulage roadway are separated by an 18.42 m wide coal pillar. The main open-off and auxiliary open-off are separated by a 25.0 m wide coal pillar. The main withdrawal roadway and auxiliary withdrawal roadway are 35.0 m apart. All these roadways are rectangular in cross-section and relevant parameters are detailed in Table 2.
The in situ stress conditions near the working face 31305 were determined using the hollow inclusion stress relief method, as presented in Table 3. Based on the measurement results: (a) the maximum and minimum principal stresses are predominantly horizontal. For instance, the maximum principal stress angles at the two measurement stations are 6.9° and 8.2°, respectively, while the minimum principal stress angles are −11.9° and −2.5°, indicating near-horizontal orientations; (b) the intermediate principal stress is nearly vertical. The average angle between direction of the intermediate principal stress and the horizontal plane at two measurement points is 78.8°, and its magnitude is approximately equal to or slightly greater than the overburden pressure per unit area; (c) the direction of the maximum principal stress ranges from 114.6° to 136.0°. The strata in the mining area exhibit a gently inclined monocline structure, with a strike of approximately N40° to 50°E and a dip direction of 130° to 140°. The maximum principal stress direction is perpendicular to the axial direction of the fold structure and aligns with the dip direction of the coal seam. The 31305 working face is mined using the inclined longwall method, advancing along the dip direction of the coal seam. The gateway is oriented nearly perpendicular to the fold axis and thus aligned with the direction of the maximum horizontal stress. According to the maximum horizontal stress theory in bolt support, this layout of the working face entries is conducive to maintaining the stability of the surrounding rock, particularly that of the roof and floor [8,9].
Core samples for the simulation experiment were collected from the auxiliary haulage roadway of work face 31305, and the physical and mechanical properties of both the coal seam and its roof and floor strata were determined through laboratory testing. The results of these tests are summarized in Table 4. Tensile strength was evaluated using the Brazilian splitting method, whereas cohesion and the internal friction angle were measured through angle model compression-shear tests.

3. Failure Process of the Surrounding Rock

Based on the geological and mining technical conditions of the haulage gateway 31,305 belt conveyor, PFC2D 3.0 was utilized to simulate the failure process following roadway excavation. The simulation initially established the in situ stress state prior to excavation, in accordance with the measured data presented in Table 3, with a vertical stress of approximately 20.0 MPa at the roadway location. After excavation, the stress applied to the upper boundary of the model was gradually increased from 18.0 MPa to 30.0 MPa to simulate the influence of the advancing abutment pressure on the roadway as the working face advanced.
Figure 2 illustrates the failure process of the surrounding rock in the unsupported roadway. The evolution of rock mass failure is represented by the progressive development of contact bond fractures between particles.
Following the excavation of a rectangular tunnel, stress concentration develops at the four corner points of the surrounding rock, where fractures initiation primarily occurs, as illustrated in Figure 2b–d. Subsequently, the fracture extends inward from these corner points along two sets of conjugate fracture planes—specifically OA and OB, as well as O′A′ and O′B′—located within the tunnel sidewalls, as shown in Figure 2e. Within the tunnel sidewalls, once the conjugate fracture surfaces intersect, further forward extension ceases, and vertical fracture initiate at the intersection points, extending downward to the floor, as depicted in Figure 2f,g. Upon reaching the floor, the failure process in the two sides diverges into two distinct modes: one involves upward extension from the intersection point toward the roof until the coal-rock interface is reached, resulting in a vertical fracture surface that penetrates the coal seam (e.g., CD in Figure 2h); the other involves continued inward extension, forming new conjugate fractures (e.g., EG and FG in Figure 2h), at the intersection of which a vertical fracture penetrating the coal seam is generated (e.g., HK in Figure 2k). Once a vertical fracture fully penetrates the coal seam from roof to floor, the failure continues to extend inward along the conjugate fractures, and upon intersecting with the roof, a new conjugate fractures extending upward is formed, as illustrated by MN and JI in Figure 2l.
As illustrated in Figure 2, in the absence of support, failure of the surrounding rock predominantly initiates within the two sides and the roof of the roadway. This failure extends into deeper regions of the surrounding rock through conjugate shear fracture surfaces. In addition to the conjugate shear failure induced by horizontal compressive and shear forces, the roof strata also undergo delamination failure due to vertical loading. Once the conjugate fracture intersect with the delamination surfaces, further extension into deeper regions is arrested, as shown in Figure 2i,j. Moreover, the development of conjugate fracture surfaces within the roof is controlled by those formed within the two sides, initiating from corresponding initiation points such as A and A′ in Figure 2e, and M and J in Figure 2l.
Based on the observed regularity in the surrounding rock failure process, the failure mechanism can be conceptually simplified as follows:
(1)
The influence of roof delamination is disregarded, and the conjugate failure surfaces within the roof are assumed to terminate at their intersection points.
(2)
The extension of fractures resulting from the conjugate failure of EG and FG in Figure 2h into deeper regions is not considered. Instead, it is assumed that each pair of conjugate fracture surfaces within the two sides gives rise to a vertical fracture surface that penetrates the coal seam and extends to both the roof and floor.
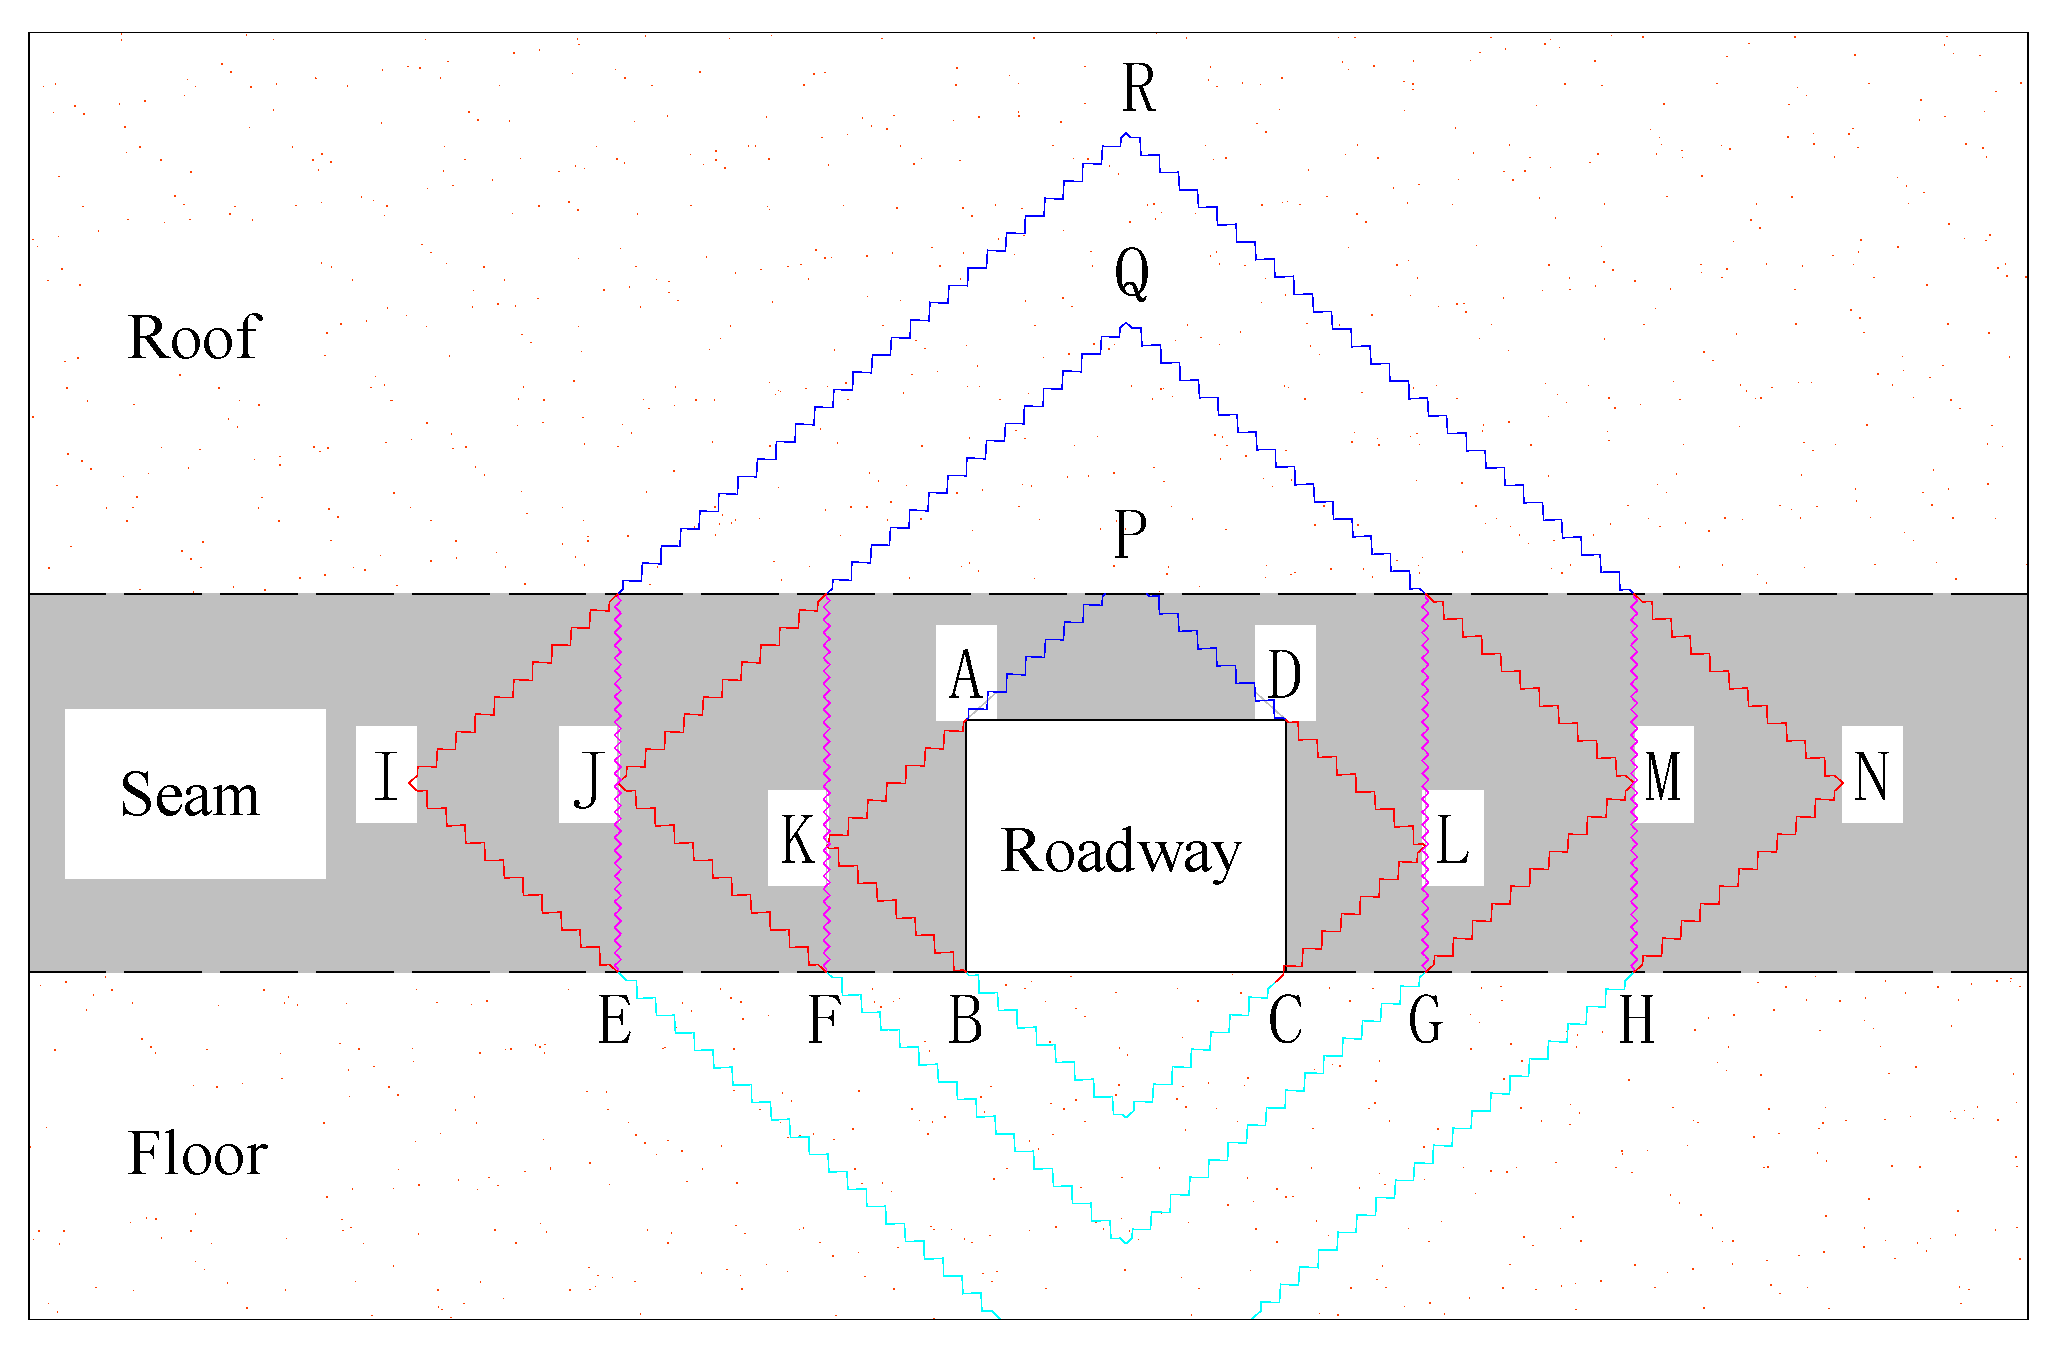
The simplified failure characteristics of the surrounding rock are presented in Figure 3, where line segments such as AK/BK and AP/DP represent conjugate fracture zones, while KF, LG, and MH indicate vertical fracture surfaces. It is evident that the development of fracture surfaces in the two sides and the roof exhibits a zonal failure pattern [10,11,12]. The formation of these conjugate fracture zones in both the sides and the roof arises from compressive and shear-induced failure mechanisms. Notably, when the horizontal stress in the floor reaches a critical level, a conjugate failure zone may also develop, thereby forming a closed fracture zone within the surrounding rock. The probability of such zonal failure increases with greater roadway burial depth. This phenomenon has been substantiated by previous research studies [12].
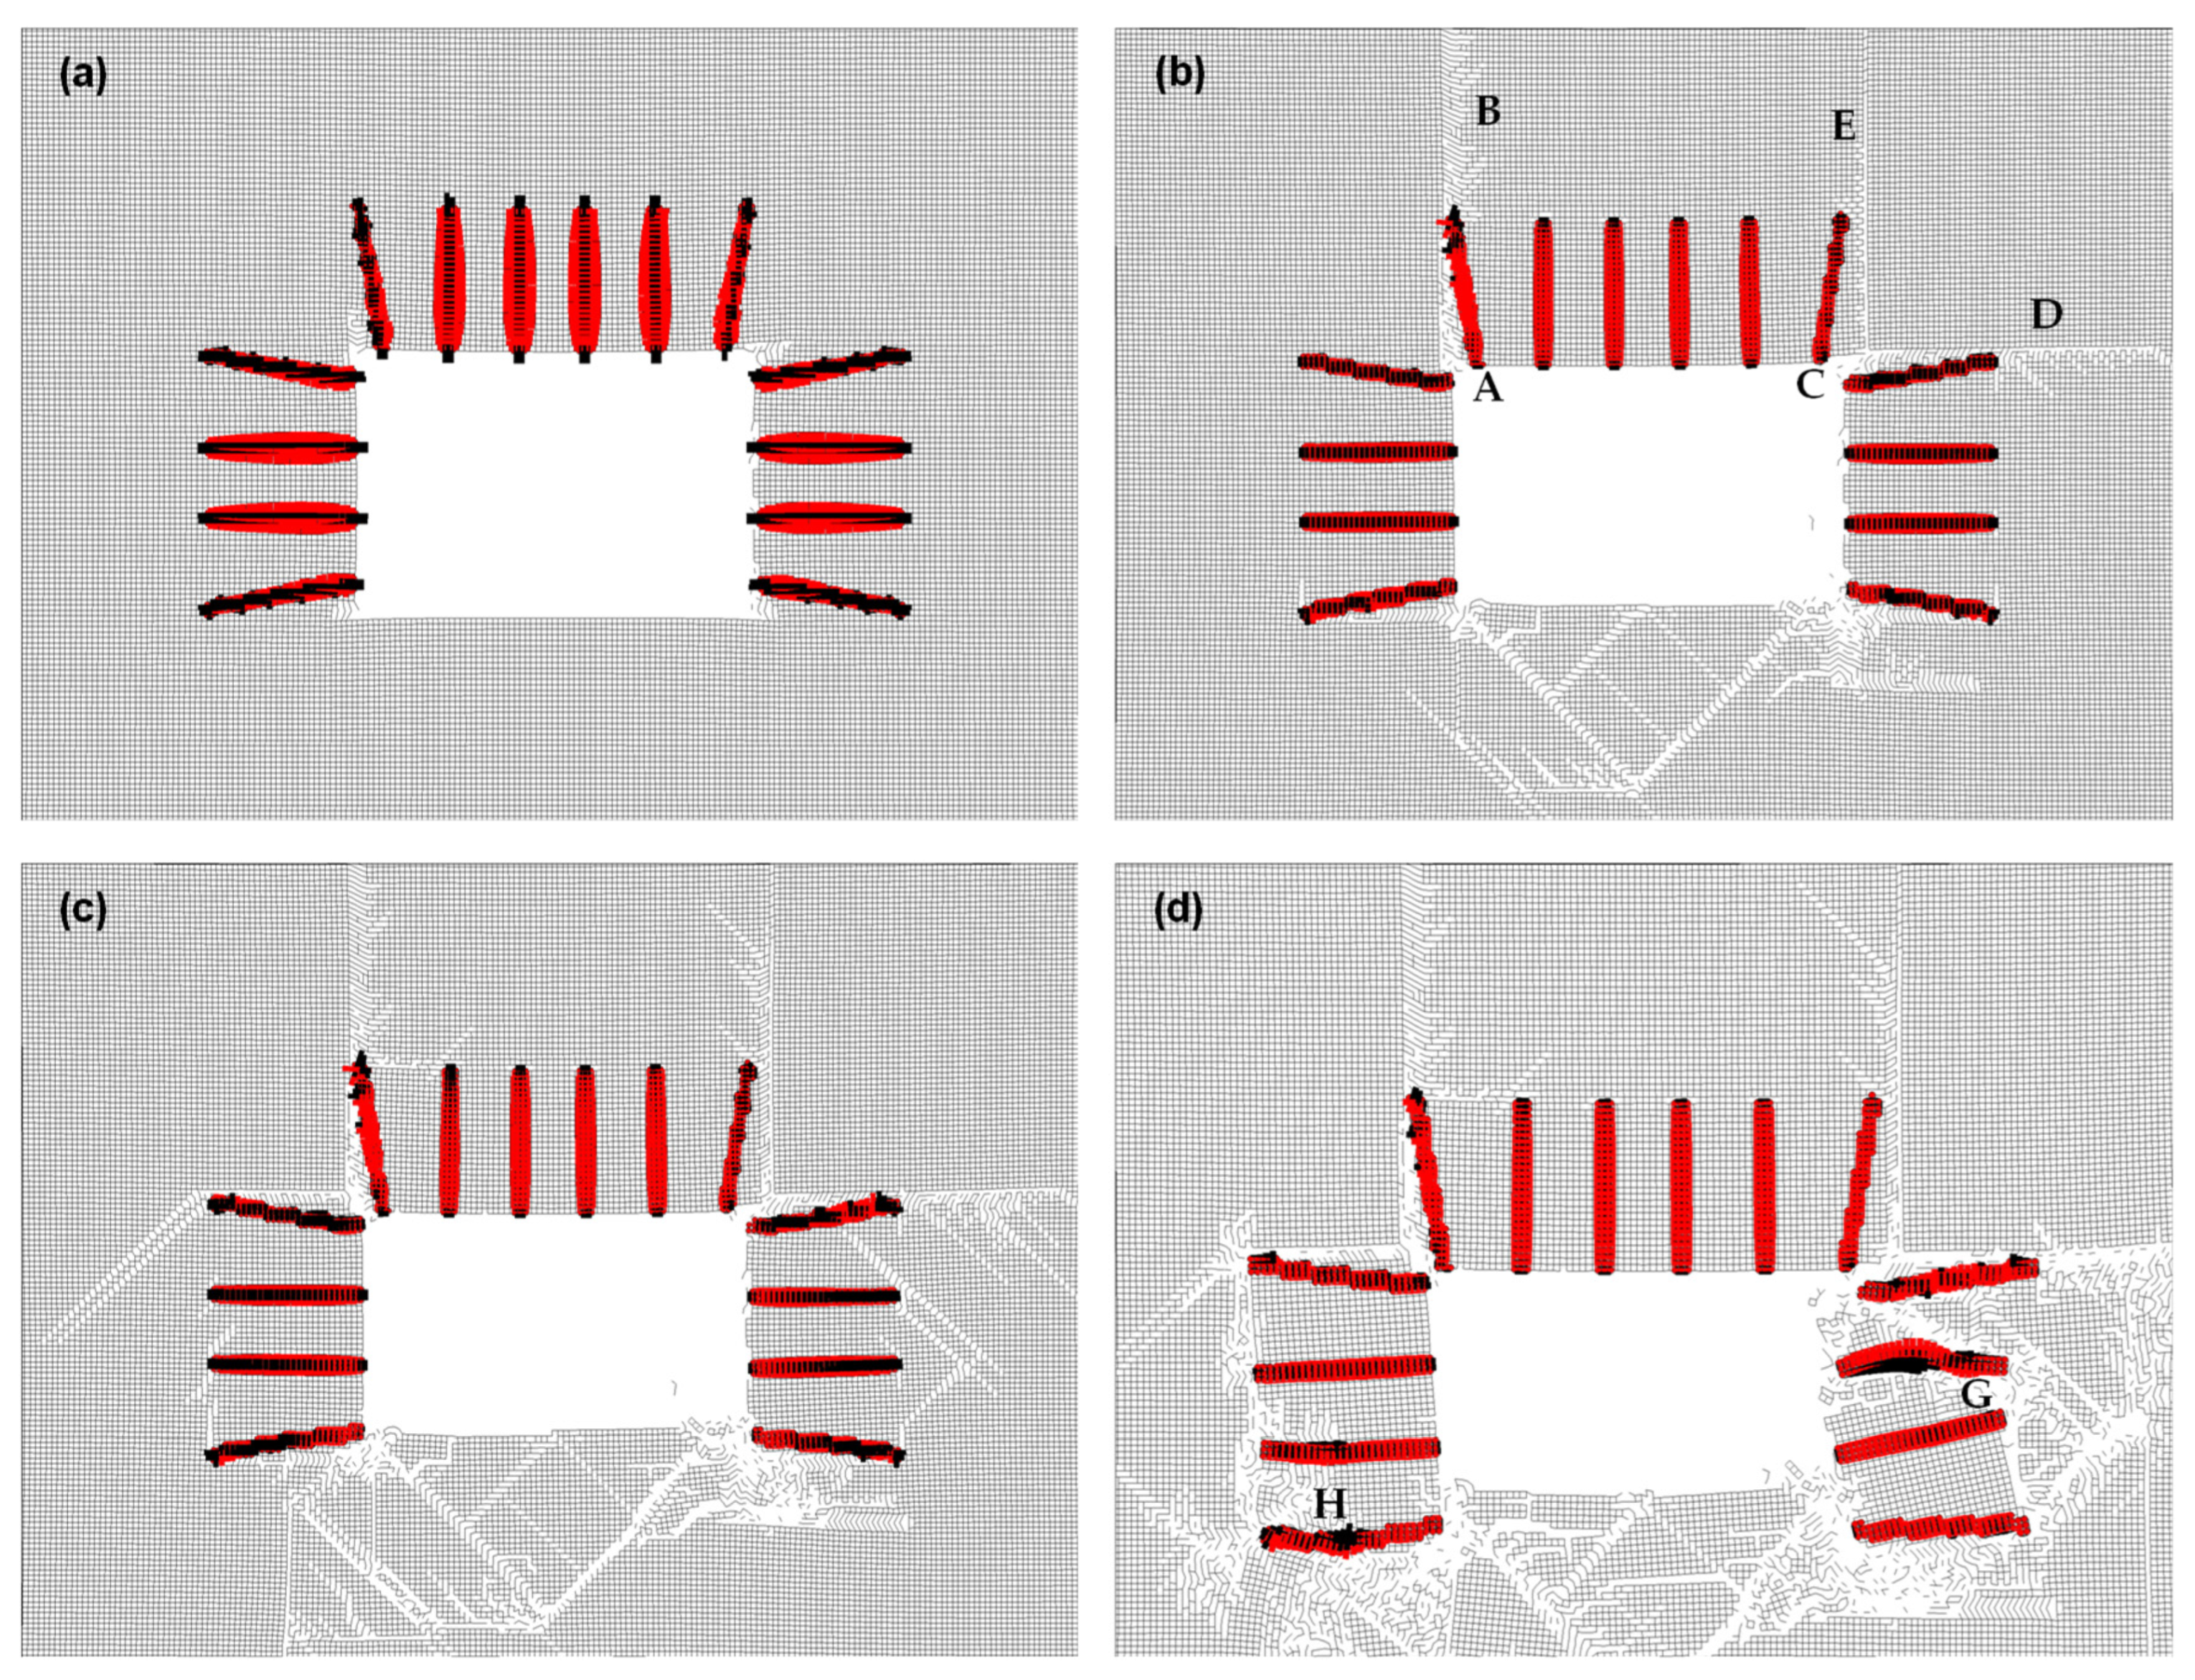
Figure 4 illustrates the development process of surrounding rock failure in the roadway under rock bolt reinforcement. The simulated rock bolts are 2.2 m in length and possess a bearing capacity of 100 kN. After reinforcement, failure initiation still occurs at the four corner points of the roadway (Figure 4a); however, the rock bolts effectively constrain failure extension along the conjugate failure surfaces commonly observed in unreinforced conditions (as shown in Figure 2e). Instead, the failure progresses along vertical or horizontal planes, as indicated by AB, CE, and CD in Figure 4b. A conjugate failure surface is also observed in the floor of the roadway (Figure 4b,c). When the roadway is subjected to mining-induced stress and an increase in roof pressure, failure initiates at the distal ends of the rock bolts (Figure 4c) and extends into the deeper surrounding rock in the form of conjugate failure surfaces (Figure 4d).
From the perspective of the mechanical behavior of rock bolts, they are predominantly subjected to tensile stress, as illustrated in Figure 4. This tensile stress is primarily caused by the non-uniform displacement of the surrounding rock at varying depths toward the tunnel, where the shallow portion undergoes greater displacement than the deeper portion, thereby placing the rock bolts in tension. It is evident that when rock bolts resist conjugate failure of the surrounding rock induced by compressive and shear stresses, they are simultaneously subjected to shear forces [3]. Additionally, relative movement of the surrounding rock along shear failure zones can generate bending moments within the rock bolts. As shown in Figure 4d, the rock bolt at the lower-left corner experiences localized bending deformation near point H. Under such loading conditions, compressive stress develops on the inner edge of the bent segment of the rock bolt, as indicated by the stress distribution at points H and G in Figure 4d. In such scenarios, if the stress on the rock bolt is measured using strain gauges, there is a potential for misinterpreting the deformation of the sur-rounding rock at that location as being in a compressive state [13].
A comparative analysis of Figure 2 and Figure 4 reveals that rock bolt support effectively restricts the development of shear failure in the shallow surrounding rock adjacent to the roadway. However, under elevated stress conditions, the support system is limited in its ability to prevent the initiation and extension of failure beyond the anchoring zone. In unsupported scenarios, surrounding rock failure predominantly occurs in the roof and both sides of the roadway. Following rock bolt reinforcement of these regions, the floor emerges as the primary zone of failure concentration. Shear failure extends from the floor toward both sides, resulting in the crushing of surrounding rock at the base of the sidewalls, thereby reducing the effectiveness of the rock bolt support system. The four corners of the roadway constitute key control points for rock bolt reinforcement. To improve support effectiveness, the inclination angle of the rock bolts should be increased—specifically, the side bolts at the corners should be oriented toward the roof and floor, while the roof bolts should be inclined outward. Furthermore, the length and shear resistance capacity of rock bolts at these critical locations should be enhanced. In roadways characterized by weak floor strata, floor heave has become a major challenge in the control of mining-induced roadway deformation [14].

4. Bolt-Guided Arching in the Surrounding Rock

4.1. Mechanism of Bolt-Guided Arching

At present, the principal theory guiding bolt design for coal seam roadways in weak surrounding rock conditions is the strength reinforcement effect of bolts on the surrounding rock mass [15,16]. Certainly, reinforcement with rock bolts can improve the stability of the surrounding rock, but its effectiveness ultimately depends on the structure of the surrounding rock in a stable state, i.e., the structure resulting from the deformation and failure process. As previously discussed, the deformation and failure of the surrounding rock in roadways develop in a sequential manner, progressing from shallow to deeper zones. The stabilizing function of bolt support is exerted precisely by modulating this deformation and failure process.
FLAC2D 5.0 was utilized to simulate the displacement behavior of the surrounding rock after tunnel excavation and to evaluate the mechanical effects of bolt support. The simulation first established the in situ stress field prior to excavation, based on the measured geo-stress data summarized in Table 3, with the vertical stress at the tunnel location approximately 20.0 MPa. After tunnel excavation, the vertical stress applied on the upper boundary of the model was incrementally increased from 18.0 MPa to 30.0 MPa to simulate the progressive influence of abutment pressure induced by work face advancement. In modeling the rock bolt support system, the bolt length was defined as 2.2 m.
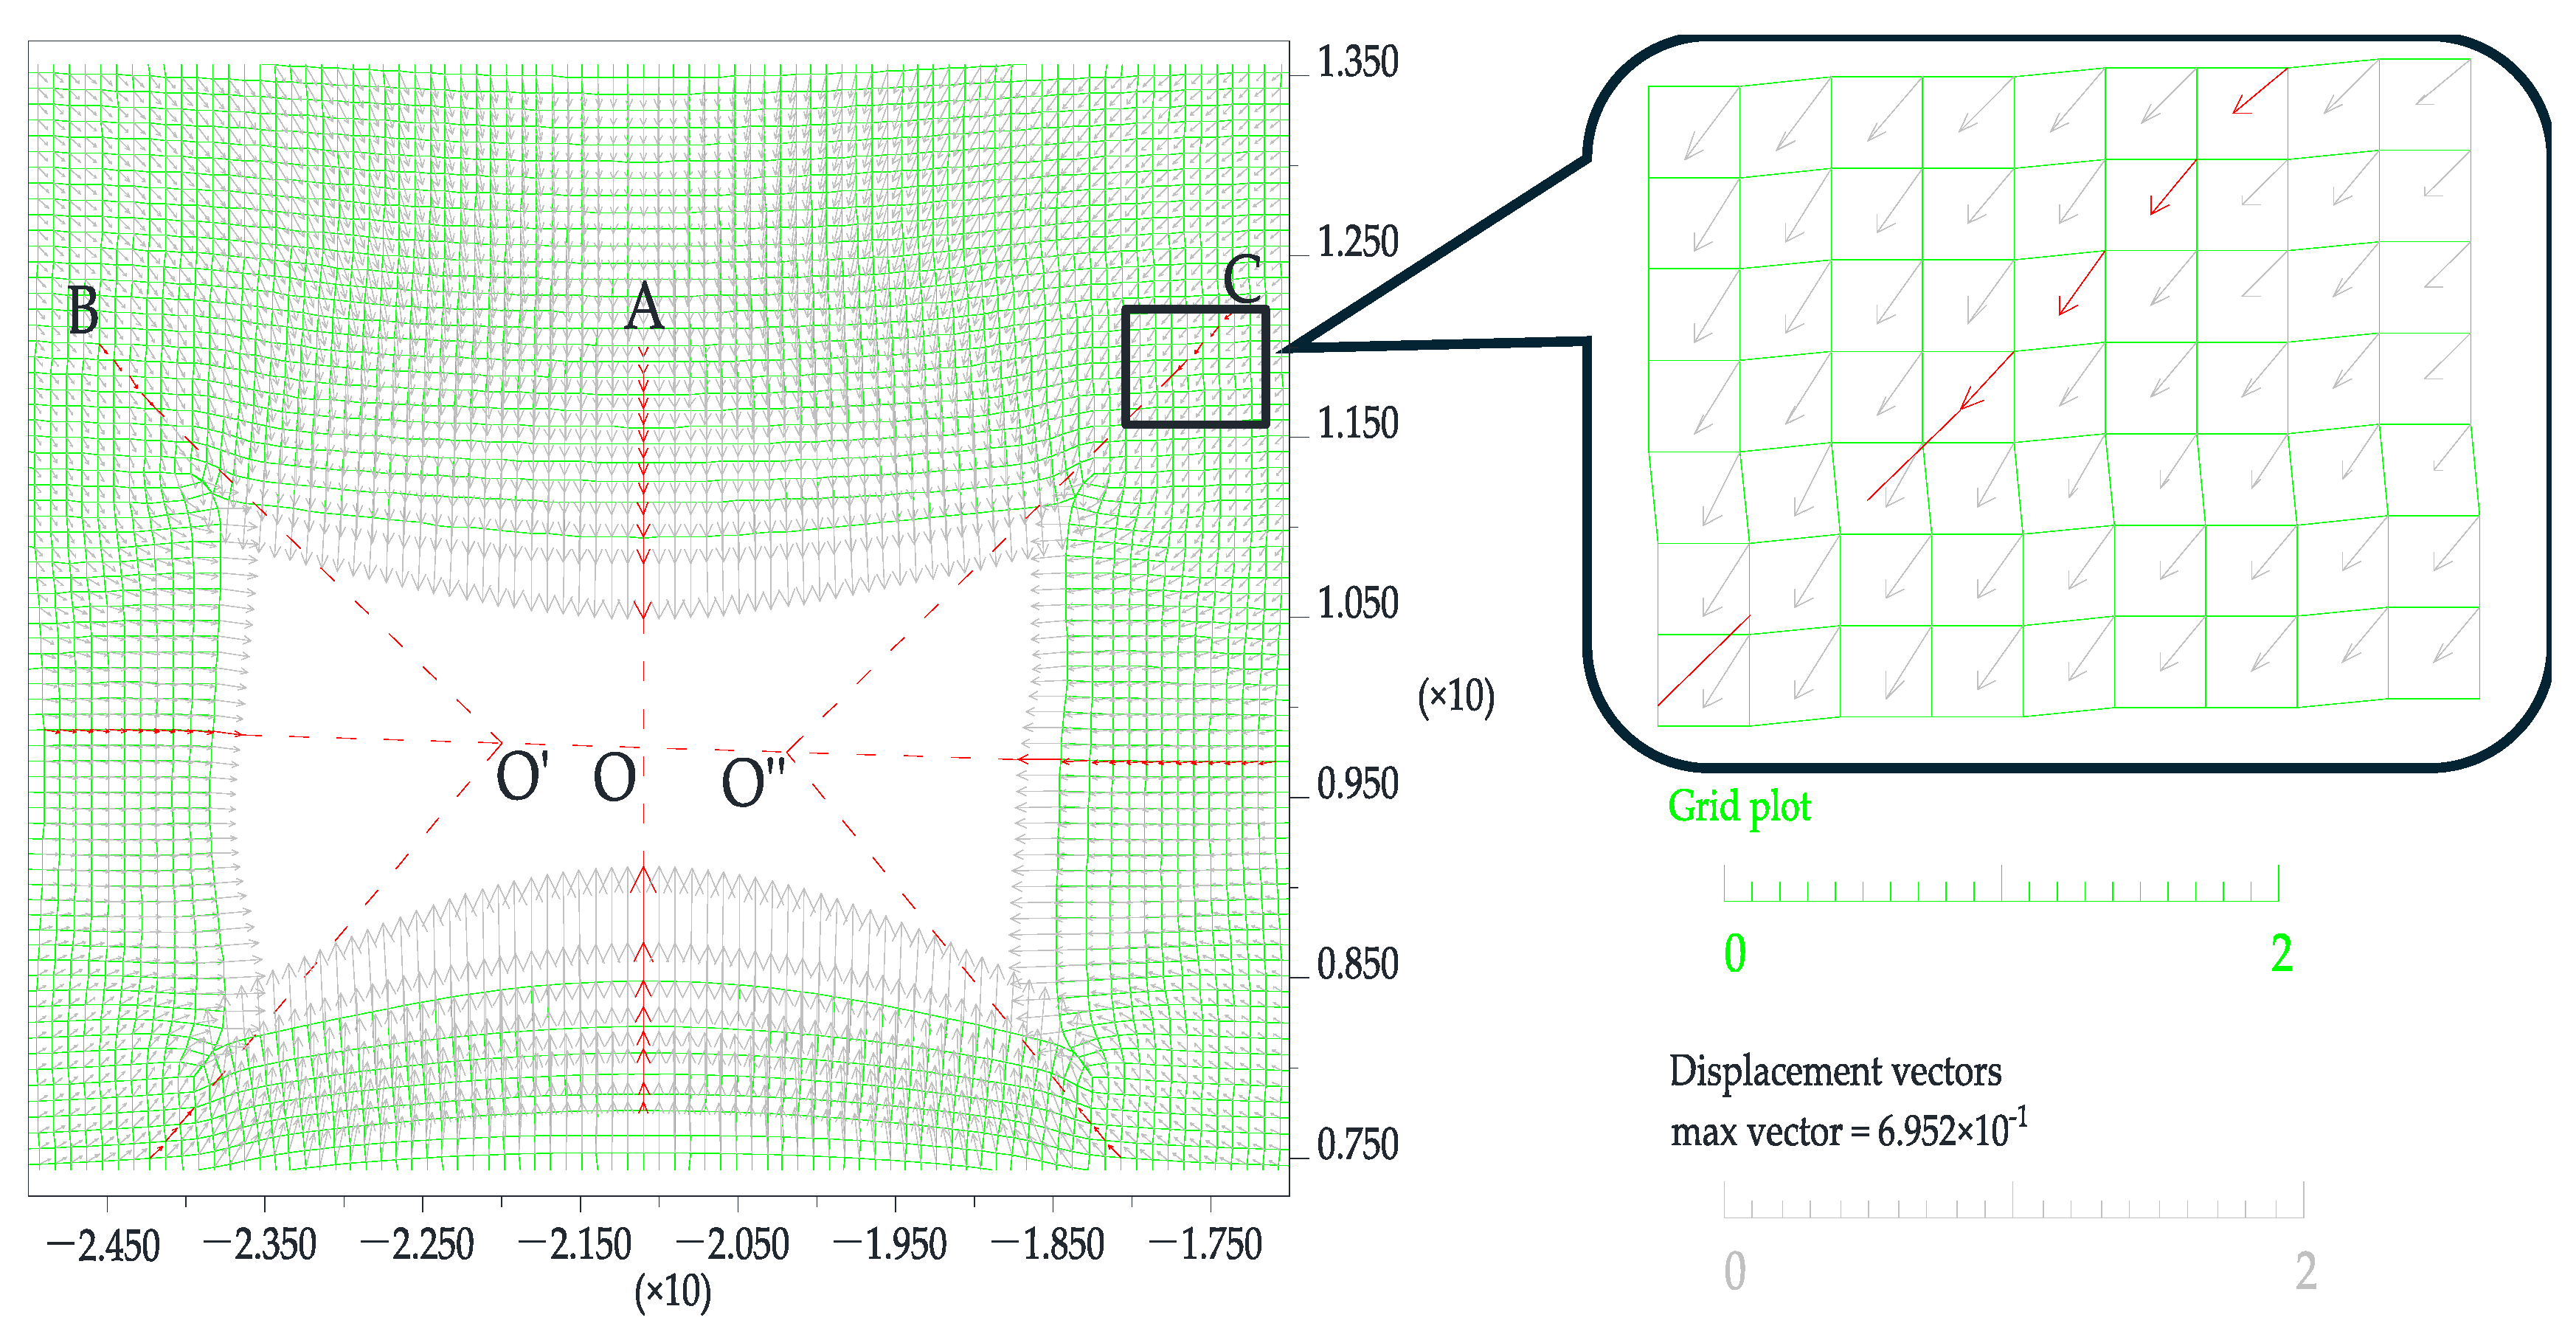
Following tunnel excavation, the deformation of the surrounding rock evolves as a progressive expansion from the surface toward deeper zones. Specifically, displacement initiates at the tunnel boundary and subsequently propagates from the near-field to the far-field regions of the surrounding rock mass. Analysis of the displacement vector distribution (Figure 5) reveals that the displacement direction at the tunnel surface is approximately perpendicular to the tunnel boundary. In contrast, the displacement vectors in deeper regions converge toward the tunnel center point “O,” as indicated by points O′ and O″ in Figure 5. Furthermore, the alignment of displacement vectors with point O becomes more pronounced with increasing depth. This pattern suggests that the deformation of shallow surrounding rock is strongly influenced by the tunnel geometry, while the deep surrounding rock exhibits deformation behavior that is relatively independent of the tunnel shape. If the direction of the displacement vector is interpreted as the direction of surrounding rock convergence toward the tunnel, as exemplified by AO, BO′, and CO″ in Figure 5, the magnitude of convergence displacement is significantly greater in the shallow surrounding rock than in the deeper zones.
Figure 6 illustrates the damage characteristics of the surrounding rock in the roadway under both unsupported and bolt-supported conditions. Comparative analysis demonstrates that while bolt support does not significantly reduce the overall damage extent of the surrounding rock, it plays an effective role in controlling convergence deformation within the roadway.
If the process of roadway convergence and deformation is regarded as a continuously intensifying phenomenon, and each increment in surrounding rock deformation and displacement reflects a progressive development from shallow to deeper zones, the following deformation mechanisms can be identified. In the unsupported condition, as shown in Figure 6a, the surrounding rock undergoes deformation and failure under applied stress, with the failure zone gradually extending into deeper regions until a stable arch or ring structure is established within the deep surrounding rock [17]. Under such conditions, the convergence and deformation of the shallow surrounding rock remain unconstrained, and the final deformation magnitude is governed by the formation of this deep arch structure. Only when the arch structure achieves stress equilibrium within the surrounding rock does the internal convergence and deformation cease.
When the roadway is reinforced with bolts, as illustrated in Figure 6b, the deformation behavior of the surrounding rock follows a distinct sequence:
(a)
The near-surface rock experiences initial failure and converges inward toward the roadway;
(b)
Through the mechanical interaction provided by the bolts, this surface deformation triggers movement and deformation in the deeper, relatively intact surrounding rock;
(c)
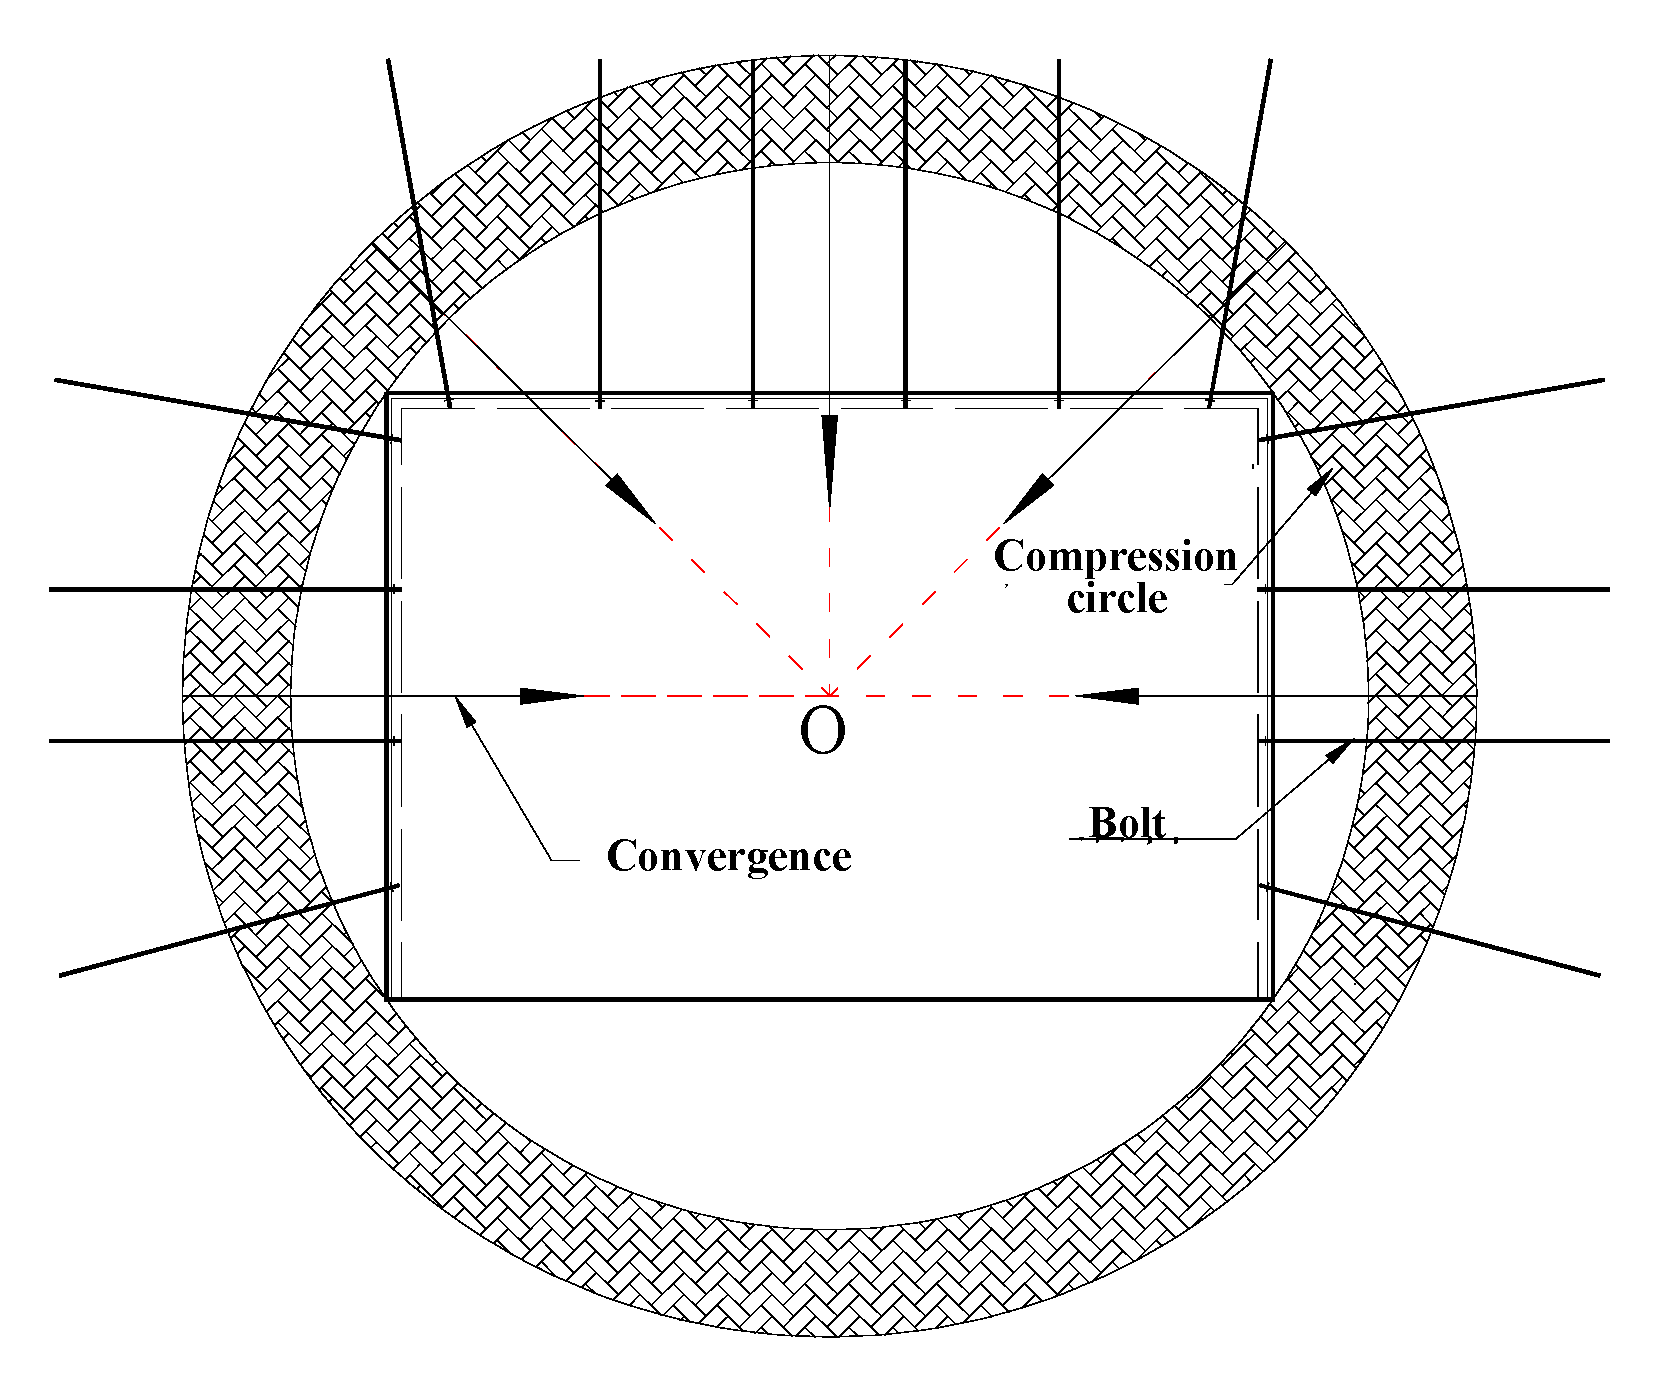
The deeper surrounding rock primarily undergoes radial convergence toward the roadway centerline (as shown in Figure 7), which induces tangential compressive stresses and results in the formation of a compression ring (arch);
(d)
This compression ring stabilizes the near-surface deformation by means of bolt-induced constraint, ultimately forming a stable bolt-reinforced composite structure.
The initiation of this compression ring is driven by the failure and deformation of the shallow surrounding rock, a phenomenon termed the bolt-guided arch (ring) formation effect.
The compression circle (arch) around the bolt-supported roadway is the product of convergence-induced compression of surrounding rock, just like the arch of natural equilibrium or Protodyakonov arch. However, the two arch types form through different mechanisms.
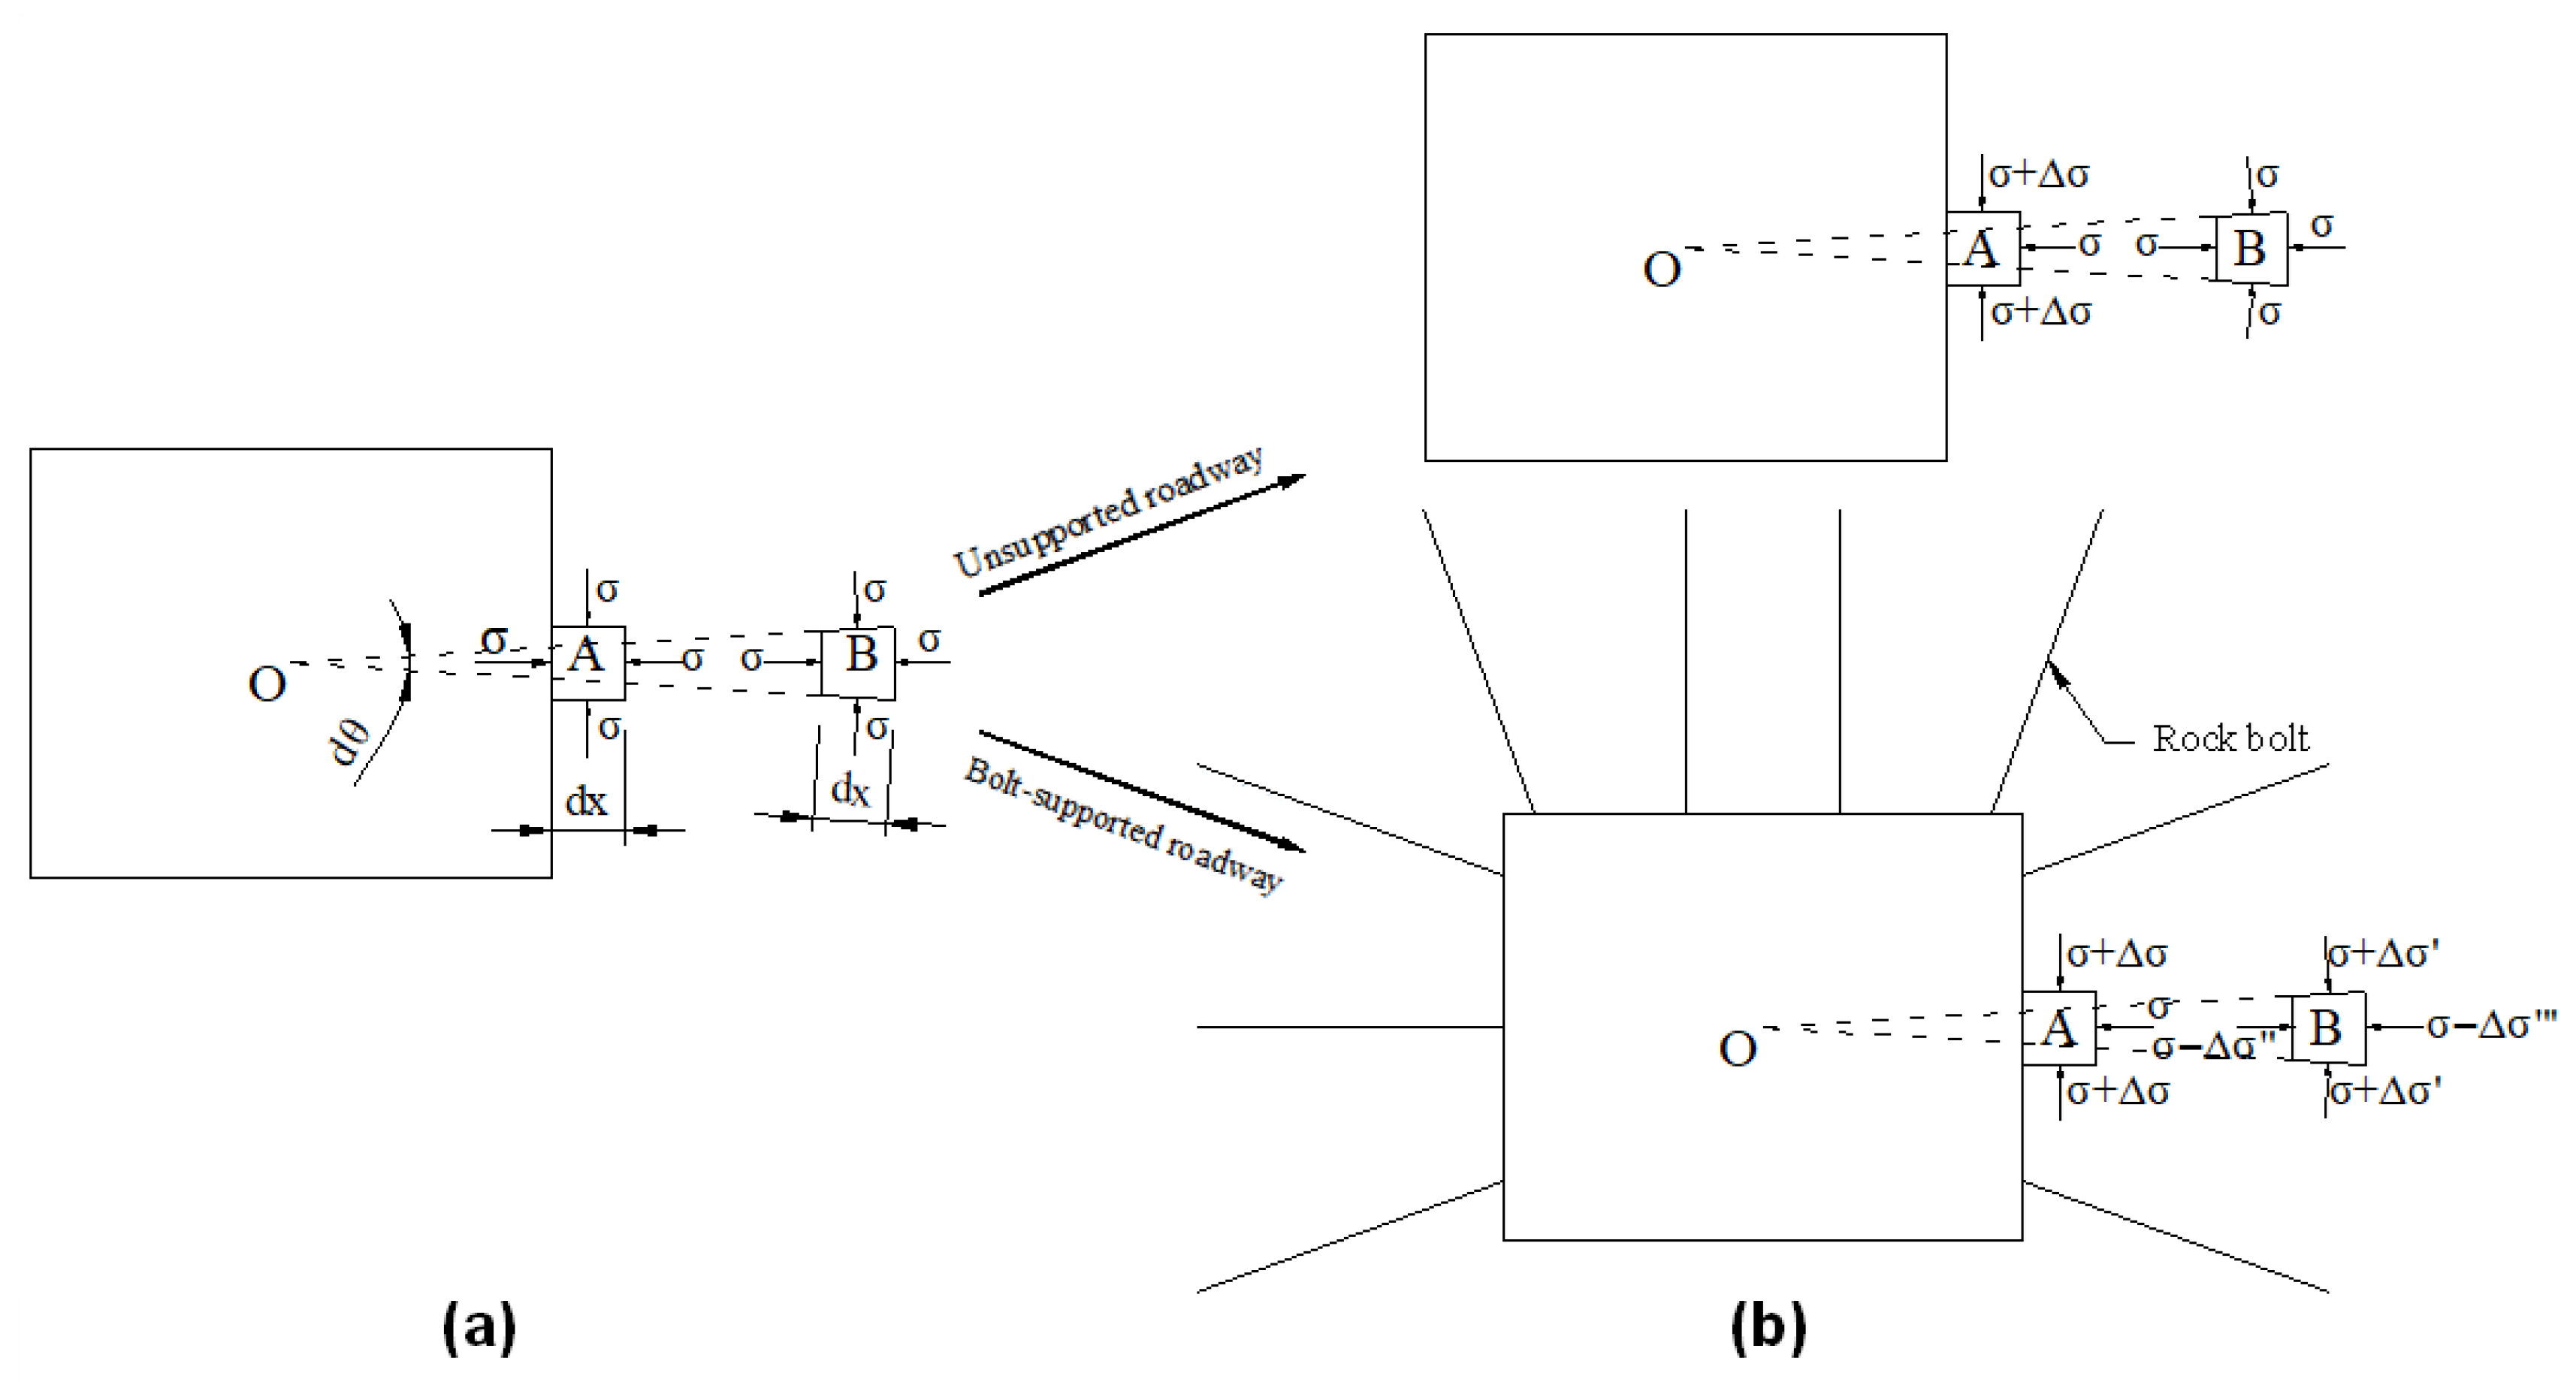
In the analysis of the formation mechanism of arch of natural equilibrium, it is reasonable to assume that the horizontal and vertical in situ stresses in the region to be excavated are equal at σ. Figure 8a illustrates the stresses in the surrounding rock before excavation. Square elements A and B in this Figure, both having an edge length of Δx, are in the same stress state. After excavation, the stress states of the surrounding rock are changed and the effect of excavation on stress state spreads from near-surface regions to distant regions. Let Δx denote the distance from the farthest point affected by excavation to the roadway surface. The stress states of elements A and B after excavation are shown in Figure 8b. It is found that the stress across the left edge of element A becomes 0 and the stresses across its top and bottom increase by Δσ. As the deformation process has just reached its right edge, no relative motion has occurred along this edge and thus the stress across it remains at σ. Element B experiences Δσ increases in the stresses across its left and lower edges, while the stresses across the other two edges remain at σ. As it tends to move relative to the two neighboring elements along the roadway surfaces (indicated by the dashed lines in Figure 8), element B is also subjected to shear stresses at its left and lower edges. For ease of analysis, we assume that the shear stresses at the two edges are equal at τ. Obviously, the forces acting on element A are not balanced and it will move towards the interior of the roadway. The movement of element B depends on the relationship between Δσ and τ. When Δσ = τ, element B remains in equilibrium, despite changes in directions of the principal stresses, as shown in Figure 8c. It follows that the surrounding rock responds to excavation in two different ways: deforming and moving under the action of unbalanced force (e.g., element A shown in Figure 8), or adjusting the stress state to stay in equilibrium (e.g., element B shown in Figure 8). The movement of element A changes the forces acting on its neighboring elements, which will stay in equilibrium by adjusting its stress state or move relative to element A. In this way, the effect of excavation will be continuously transmitted to distant regions. After the effect of excavation reaches a certain depth, the surrounding rock masses will undergo only adjustment of stress state at all positions without relative motion. Then the surrounding rock will enter a new stable state. If the surrounding rock is crushed and loosely packed, its displacement will occur in the form of flow towards the roadway. After a new stable state is reached, the surrounding rock can be divided into two parts, depending on whether they have undergone displacement. What separates the two parts is the aforementioned arch of natural equilibrium.
In the analysis of the mechanism of arching guided by rock bolts, the horizontal and vertical in situ stresses in the region to be excavated are also assumed to be equal atσ. Figure 9a presents the stresses in the surrounding rock before excavation. Element A is a square element with an edge length of dx located at a surface of the roadway, and its position is expressed in orthogonal coordinates. The principal stresses across its edges are equal at σ, as shown in Figure 9a. Element B is located in the anchorage zone. For ease of analysis, its position is expressed in polar coordinates, with the origin located at the center of the roadway. Let x be the distance from element B to the origin, dθ be the corresponding central angle, and dx denote its radial length. Before excavation, the principal stresses at its four edges are equal at σ (Figure 9a). It is clear that both elements A and B are in equilibrium before excavation, because the net force on each of them is zero. Let dx be the distance between the farthermost point affected by excavation and the roadway surface. The upper diagram in Figure 9b illustrates the stress states of elements A and B after excavation in the case where the roadway is unsupported. In this case, element A is subjected to a net force greater than zero and tends to move towards the interior of the roadway, while element B is still in equilibrium. The lower diagram in Figure 9b shows their stress states when the roadway is supported with rock bolts. In this case, element A tends to move towards the inside of the roadway. Meanwhile, the traction force at the rock-bolt surface arising from its motion will drag element B towards the inside of the roadway. In the radial direction, element B and the two neighbors on its left and right sides tend to move in the same direction. The analysis above suggests that near-surface elements have greater displacements than distant ones. The stresses at the left and right edges of element B then decrease to σ − Δσ″ and σ − Δσ‴, respectively, and Δσ″ ≥ Δσ‴. In the circumferential direction, element B and its two neighbors will undergo compression as they converge towards the roadway. Let Δσ’ denote the resulting increase in each circumferential stress. Then the total circumferential force acting on element B is 0, while the total radial force is (Δσ′ + Δσ‴) dθdr + (Δσ‴ − Δσ″) rdθ, where r is the distance from element B to point O. In effect, this radial force is the reaction force that balances the tensile force exerted on the bolt by the surrounding rock. It helps stabilize element A by resisting its convergence. Element B, together with other elements at similar depths, will constitute a compressive arch (circle) (Figure 7). This compressive arch (circle) can not only maintain its own stability, but also can prevent further deformation and failure of near-surface rocks and support the rock outside the anchorage zone.

4.2. Stability Analysis of the Compressive Arch

In the numerical simulation, displacement and stress in the surrounding rock were measured at points arranged at intervals of 0.5 cm along five observation lines. The observation lines lie on five rays sharing an endpoint at the center of the roadway, as shown in Figure 10. Then the patterns of variation in displacement and stress in the surrounding rock were analyzed to reveal the effects of near-surface rocks on distant rocks after rock bolting.

4.2.1. Patterns of Displacement Variation

Due to the presence of rock bolts, the convergence of measurement points along the roadway induces internal measurement points to move. Figure 11 depicts the relationship between the relative displacement (RD) of internal measurement points (i.e., the displacement of each measurement point inside the surrounding rock with respect to the corresponding surface measurement point) and side-surface displacement. Points with smaller RD are more affected by the movement of surface points. The simulation results demonstrate that the displacement of distant rocks tends to increase with increasing surface deformation, no matter whether the roadway is supported with bolts or not. The measurement points in the anchorage zone show RD values smaller than the RD of corresponding points around the unsupported roadway (Figure 11a–c), while the points outside this zone have similar RD in the two cases (Figure 11d–f). Moreover, the RD of points in the anchorage zone tends to decrease with decreasing depth. After the surrounding rock stabilizes, the maximum RD of the 1.5 m deep measurement point is about 181 mm, significantly greater than the 10 mm measured at the 0.5 m deep point. In the case of a bolt-supported roadway, the rock bolts pull the distant rocks towards the roadway, thus reducing the displacement difference between surface and internal measurement points. In the region where the rocks can not form a stable compressive arch (i.e., the near-surface rocks bounded by the compression circle shown in Figure 7), the rocks tend to move synchronously with the side surface under the action of traction force provided by the bolts. Therefore, the RD of the measurement point in this region is relatively small, as shown in Figure 11a. In the region where the rocks ultimately form an arch (circle) as a result of convergence-induced compression, the rocks remain relatively stable during convergence, due to the constraint from the compressive arch (circle). Therefore, the RD of the measurement points in this region tends to increase, as demonstrated in Figure 11b,c. In this case, the rocks outside the anchorage zone will remain stable due to the support provided by the compressive arch (circle). This contributes to the upward trend in the RD of corresponding measurement points, as shown in Figure 11d–f. Internal measurement points around the unsupported roadway have greater RD compared to those around the bolt-supported roadway, due to the absence of interaction between near-surface and distant rocks. In this case, the deeper rocks appear to be more stable than near-surface rocks and an arch of natural equilibrium will form at a certain depth. The RD of corresponding measurement points also increases with increasing depth. For example, as the depth increases from 0.5 m to 7.0 m, the RD increases from 202.9 mm to 494.0 mm. Figure 11d–f reveal that the displacement of rocks unaffected by the bolts depends on the surface displacement and the rock bolts can reduce the displacement of distant rocks by reducing the surface displacement.
A comparison of Figure 11 with Figure 12 shows that the RD of measurement points in the roof varies with roof surface displacement in a similar manner to the RD of those in the side. As roof subsidence is also affected by gravity. While the distant rock in the roof stays stable due to the support from the compressive arch around the bolt-supported roadway or the arch of natural equilibrium around the unsupported roadway, the near-surface rock tends to subside under gravity and then separates from the distant rock. Meanwhile, as the floor becomes less stable (Figure 6), the distant rock undergoes overall subsidence due to gravity. For a given roof surface displacement, the RD of internal measurement points are smaller in the case of bolt supported roadway than in other cases, because the rock bolts can reduce the separation between near-surface rock and distant rock. This is manifested by the divergence of the two curves after point A shown in Figure 12b.
Similar patterns can be observed in the RD curves for the measurement points along a diagonal measurement line (Figure 13). Figure 13a demonstrates that the differences between the RD of near-surface rocks in the two cases are not significant. For example, at a top-corner surface displacement of 100 mm, the RD of the 0.5 m deep measurement point in the case of the rock-supported roadway is 9.1 mm, which is close to that in the other case, at 12.8 mm. After stabilization, the maximum RD in the two cases is 19.1 mm and 19.8 mm, respectively. This is because the surrounding rock along this measurement line is in mechanical equilibrium (Figure 8) and thus able to maintain stability. The convergence of corner-surface rocks is driven primarily by the compressive force exerted by the distant rocks, which arises from the deformation of distant rocks due to stress concentration. This explains why the RD of distant rocks is small even in the absence of rock bolts.

4.2.2. Patterns of Stress Variation

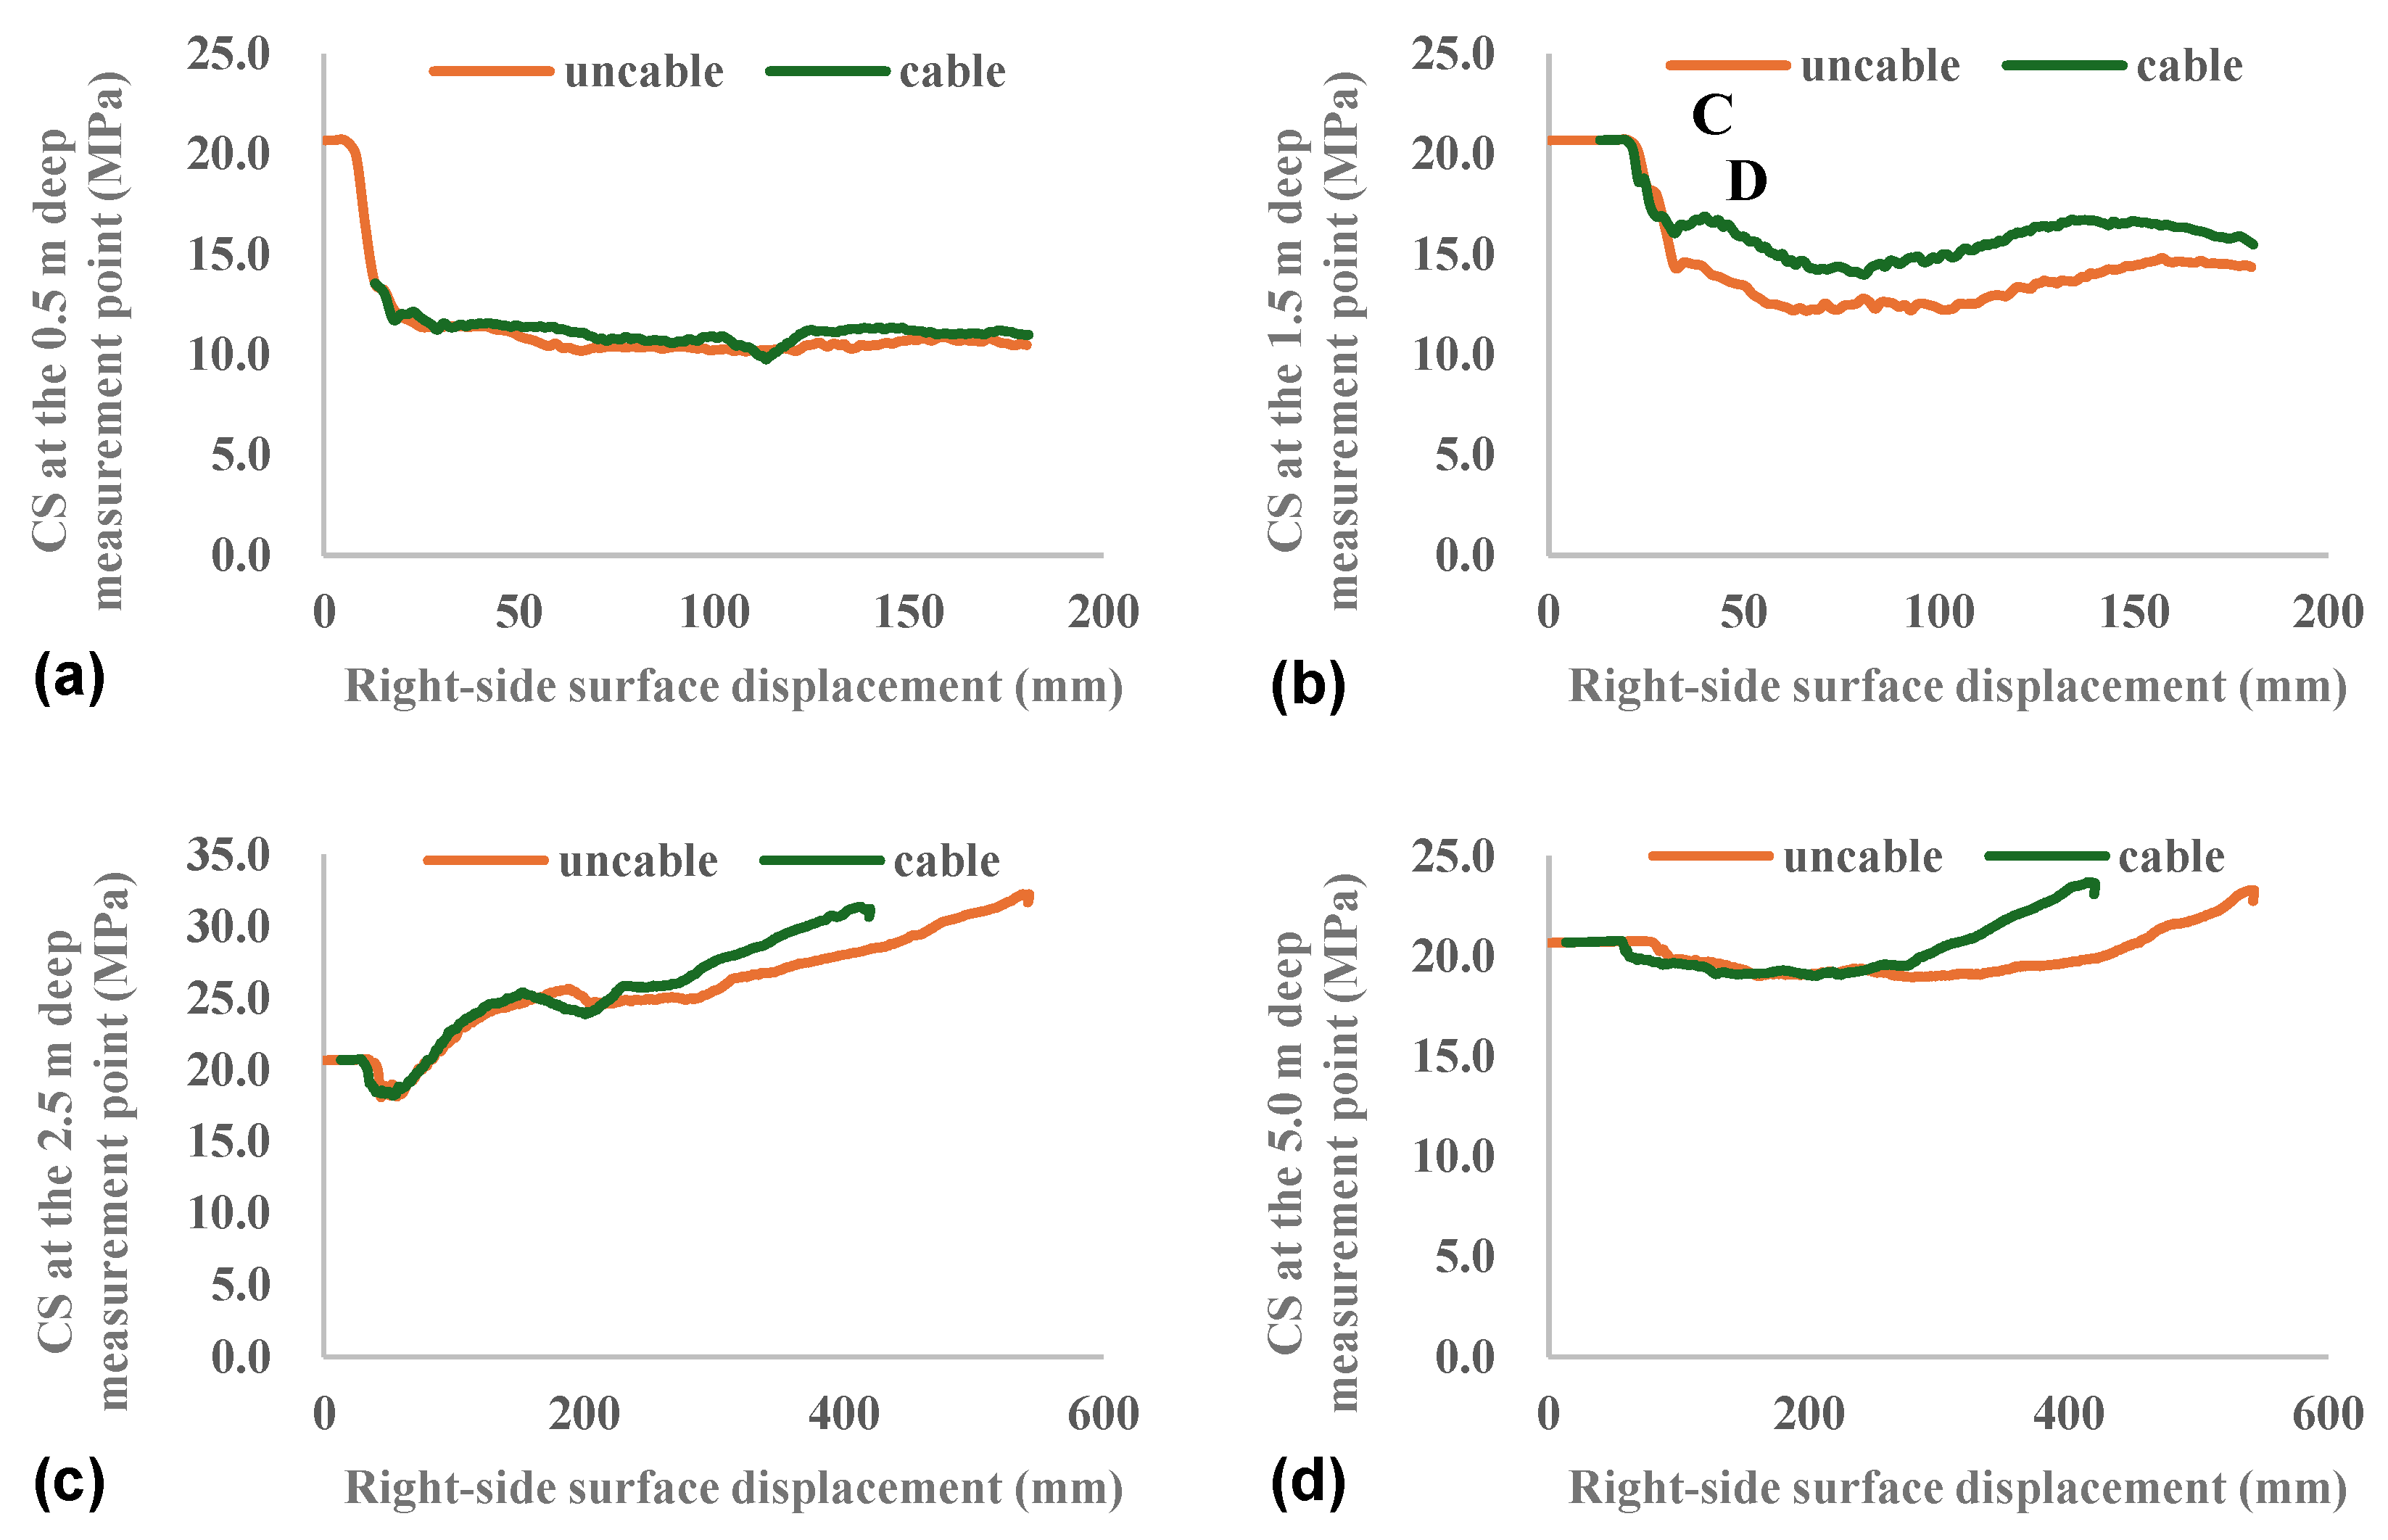
Figure 14 and Figure 15 illustrate the relationship of side surface displacement to the radial stress (RS) and circumferential stress (CS), respectively, at the measurement points. The Figures reveal that as the surface displacement increases, both the RS and CS in the anchorage zone tend to be stable after a sharp decline. During the stage of stress decline, the anchorage zone undergoes more rapid stress decline than the corresponding region around the unsupported roadway. For example, when the side surface displacement is 27.5 mm, the RS at the 1.5 m deep measurement point is 7.64 MPa in the case of bolt-supported roadway and 9.42 MPa in the case of unsupported roadway (Figure 14b), and the corresponding CS is 16.9 MPa and 18.0 MPa, respectively (Figure 15b). After the surrounding rock reaches equilibrium, the RS and CS in the anchorage zone are higher than those in the corresponding region in the case of unsupported roadway. In the presence of rock bolts, the RS at the measurement points 0.5 m and 1.5 m from the surface are 0.5 MPa and 3.5 MPa, respectively, and the CS there are 11.0 MPa and 16.0 MPa, respectively. In the absence of rock bolts, the RS at the 0.5 m and 1.5 m deep measurement points are subjected to RS of 0.1 MPa and 2.2 MPa, respectively, and the corresponding CS are 10.0 MPa and 13.5 MPa. Outside the anchorage zone, the RS decreases and then increases with increasing surface displacement. After the roadway reaches a stable state, it tends to stabilize at a level lower than its original level (Figure 14c,d). The CS tends to rise after a slight drop and then stabilizes at a level greater than the original level (Figure 15c,d). It follows that in the early deformation stage, the rock bolts can accelerate the stress decline within the anchorage zone and increase the residual strength of the rock therein [16]. According to the analysis of stress state (Figure 9), in the presence of rock bolts, the surface deformation can lead to a RS decrease and a CS increase in the distant rocks in this stage. As the surrounding rock reaches a state of limit equilibrium as shown in Figure 6 [17], these stress variations will cause the rock to deform plastically, thus reducing its bearing capacity. This can in turn lower the level of CS.
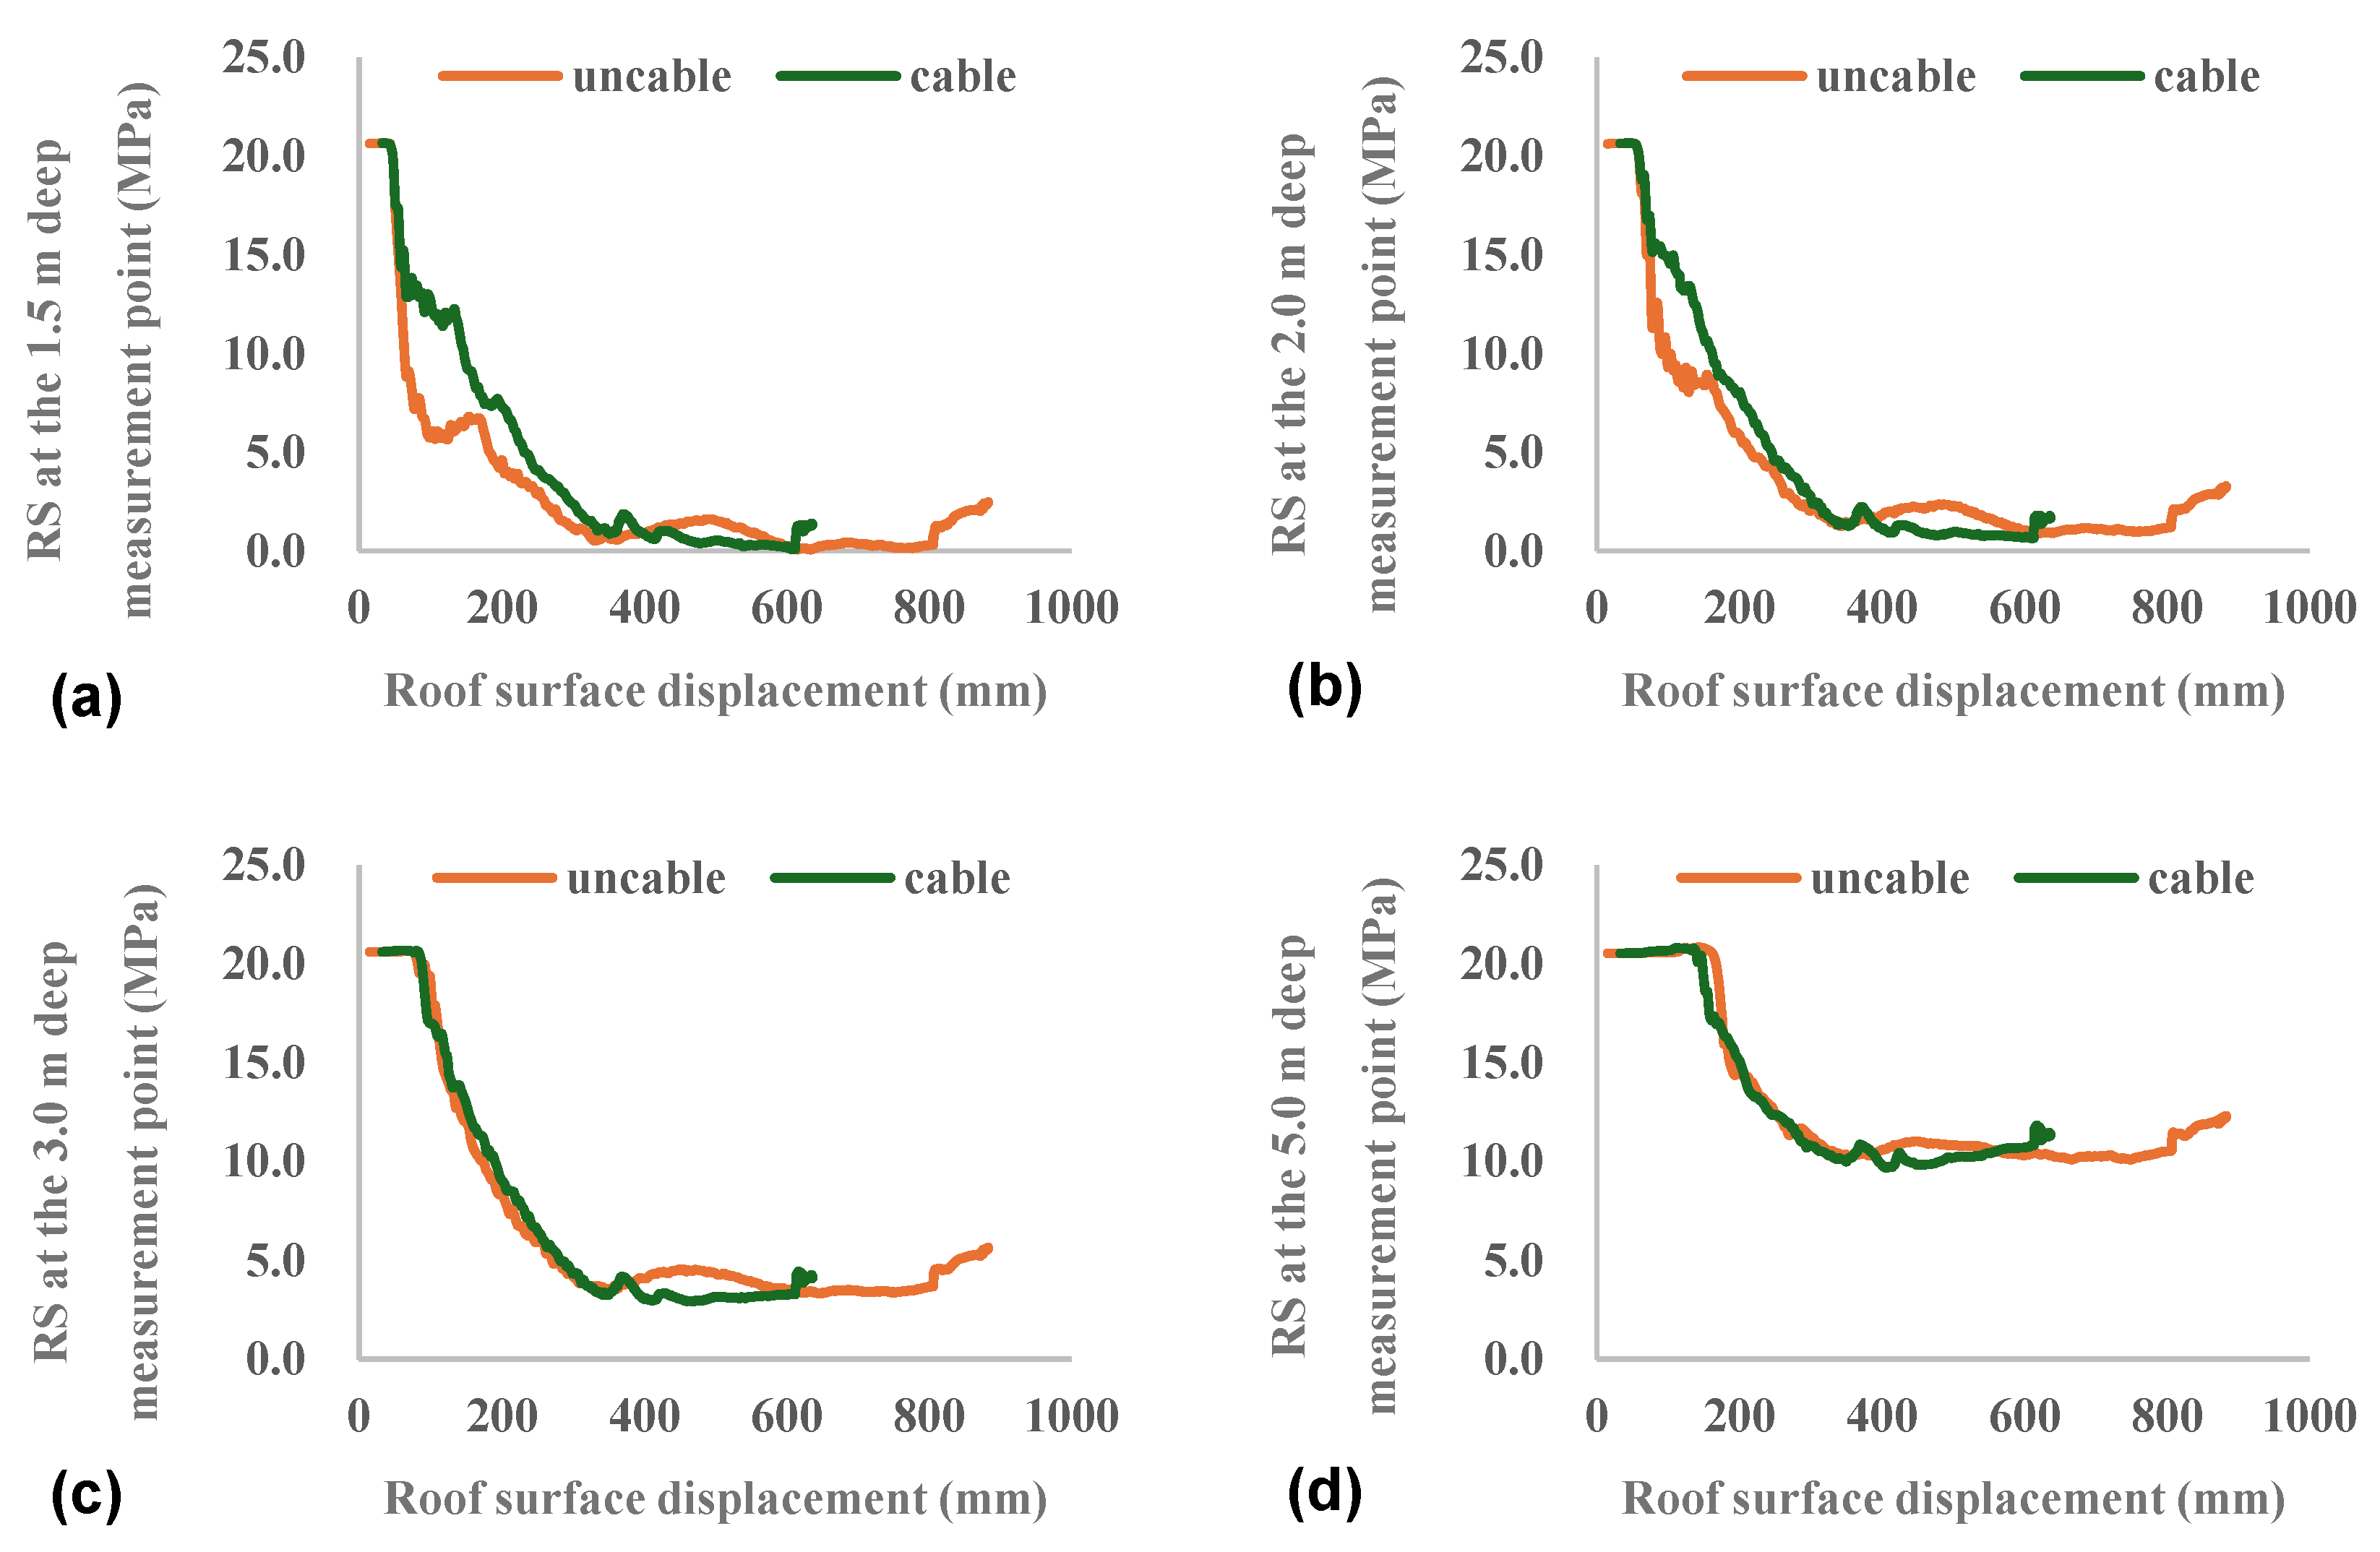
The stresses in the roof vary in similar patterns, as illustrated in Figure 16 and Figure 17 Under gravity, the roof experiences serious subsidence. In the case of bolt-supported roadway, the RS at the 1.5 m deep measurement point finally declines to approximately 0, while the CS there steadily increases after declining to 4.8 MPa. In the absence of rock bolts, both the RS and CS at the 1.5 m deep measurement point finally decrease to approximately 0. At the 2.0 m deep measurement point, both the RS and CS tend to stabilize at about 1.0 MPa after a decline. It is reasonable to infer that a compressive arch forms in the bolt-supported roof and the arch of natural equilibrium in the unsupported roof is more than 2.0 m away from the roof surface.
Similar patterns of stress variation are observed in the rock along each diagonal measurement line (Figure 18 and Figure 19). As can be seen in the Figure, the rock at depth of 0.5 m can maintain stability even in the absence of rock bolts. The RS at corresponding measurement point tends to stabilize at about 10.0 MPa after a decline. The CS shows a steady upward trend after slightly decreasing to nearly 15.0 MPa, and it finally exceeds the original level. The presence of rock bolts appears to have little influence on the stress state of the rock along this diagonal measurement line, as indicated by close similarity between the stress curves for the two cases. The maximum difference between the RS at the 0.5 m deep measurement point in the two cases is 1.0 MPa, less than 10% of the RS level in either case. The maximum difference between the CS at a depth of 0.5 m in the two cases is 1.3 MPa, about 5% of the CS level in either case. This suggests that at each top corner, the boundaries of both the compressive arch formed around the bolt-supported roadway and the arch of natural equilibrium around the unsupported roadway are within 0.5 m of the roadway surface.

4.3. The Influence of Two-Dimensional Simplification of the Simulation on the Results

According to elastoplastic mechanics theory, when an object’s dimension in one direction is significantly larger than those in the other two, a three-dimensional problem can be simplified to a two-dimensional plane strain problem—and roadways are typical engineering cases fitting this simplification. Obviously, two-dimensional simulation offer high computational efficiency, and when their results meet the requirements of problem analysis, the adoption of this method is justified.
The roadway anchorage arch refers to the arching effect formed by the surrounding rock along the roadway cross-section under the action of rock bolt support, which is a natural arching phenomenon relative to the absence of support.
Since the force state of roadways can be analyzed using the plane strain method, the analysis of the anchorage arch within the roadway cross-section is generally conducted via the same method. This simulation focuses primarily on the influence of rock bolts on the development of the anchorage arch in coal mine roadway support; thus, a two-dimensional planar analysis model is naturally adopted. However, since the roadway is actually a three-dimensional object, the results of the plane strain simulation are definitely slightly different from reality.
There have been numerous studies on the influence of FLAC3D and FLAC2D plane strain models on the results of the roadway excavation and support problems. Reference [18] found through comparison that the internal stress of the surrounding rock of the roadway in the two-dimensional plane strain simulation is slightly greater than that in the three-dimensional model, which leads to more plastic deformation in the surrounding rock of the roadway, resulting in the plastic zone extent obtained from the two-dimensional model being larger than that of the three-dimensional model. In reference [19], it is believed that 2D simulation has higher computational efficiency than three-dimensional models, and a comparative analysis was conducted on the stress and deformation characteristics of surrounding rock after roadway excavation and support using FLAC2D planar strain and three-dimensional models. The results showed that using the 2D model and the convergence-confinement method (CCM) 3D equivalent method, the simulation results of the support body’s stress and displacement were similar to those of the 3D model. Therefore, this article adopts a two-dimensional FALC model, which may also have the problem of high surrounding rock stress and large plastic zone range, but the results can still reflect the interaction law between the force on the rock bolt and surrounding rock deformation. Compared with the FALC3D model, using the FALC2D model is more convenient for constructing fine computational grids and anchoring results, which is conducive to more accurate analysis of the deformation and failure characteristics and interaction processes of the rock mass and rock bolts in the anchorage zone.
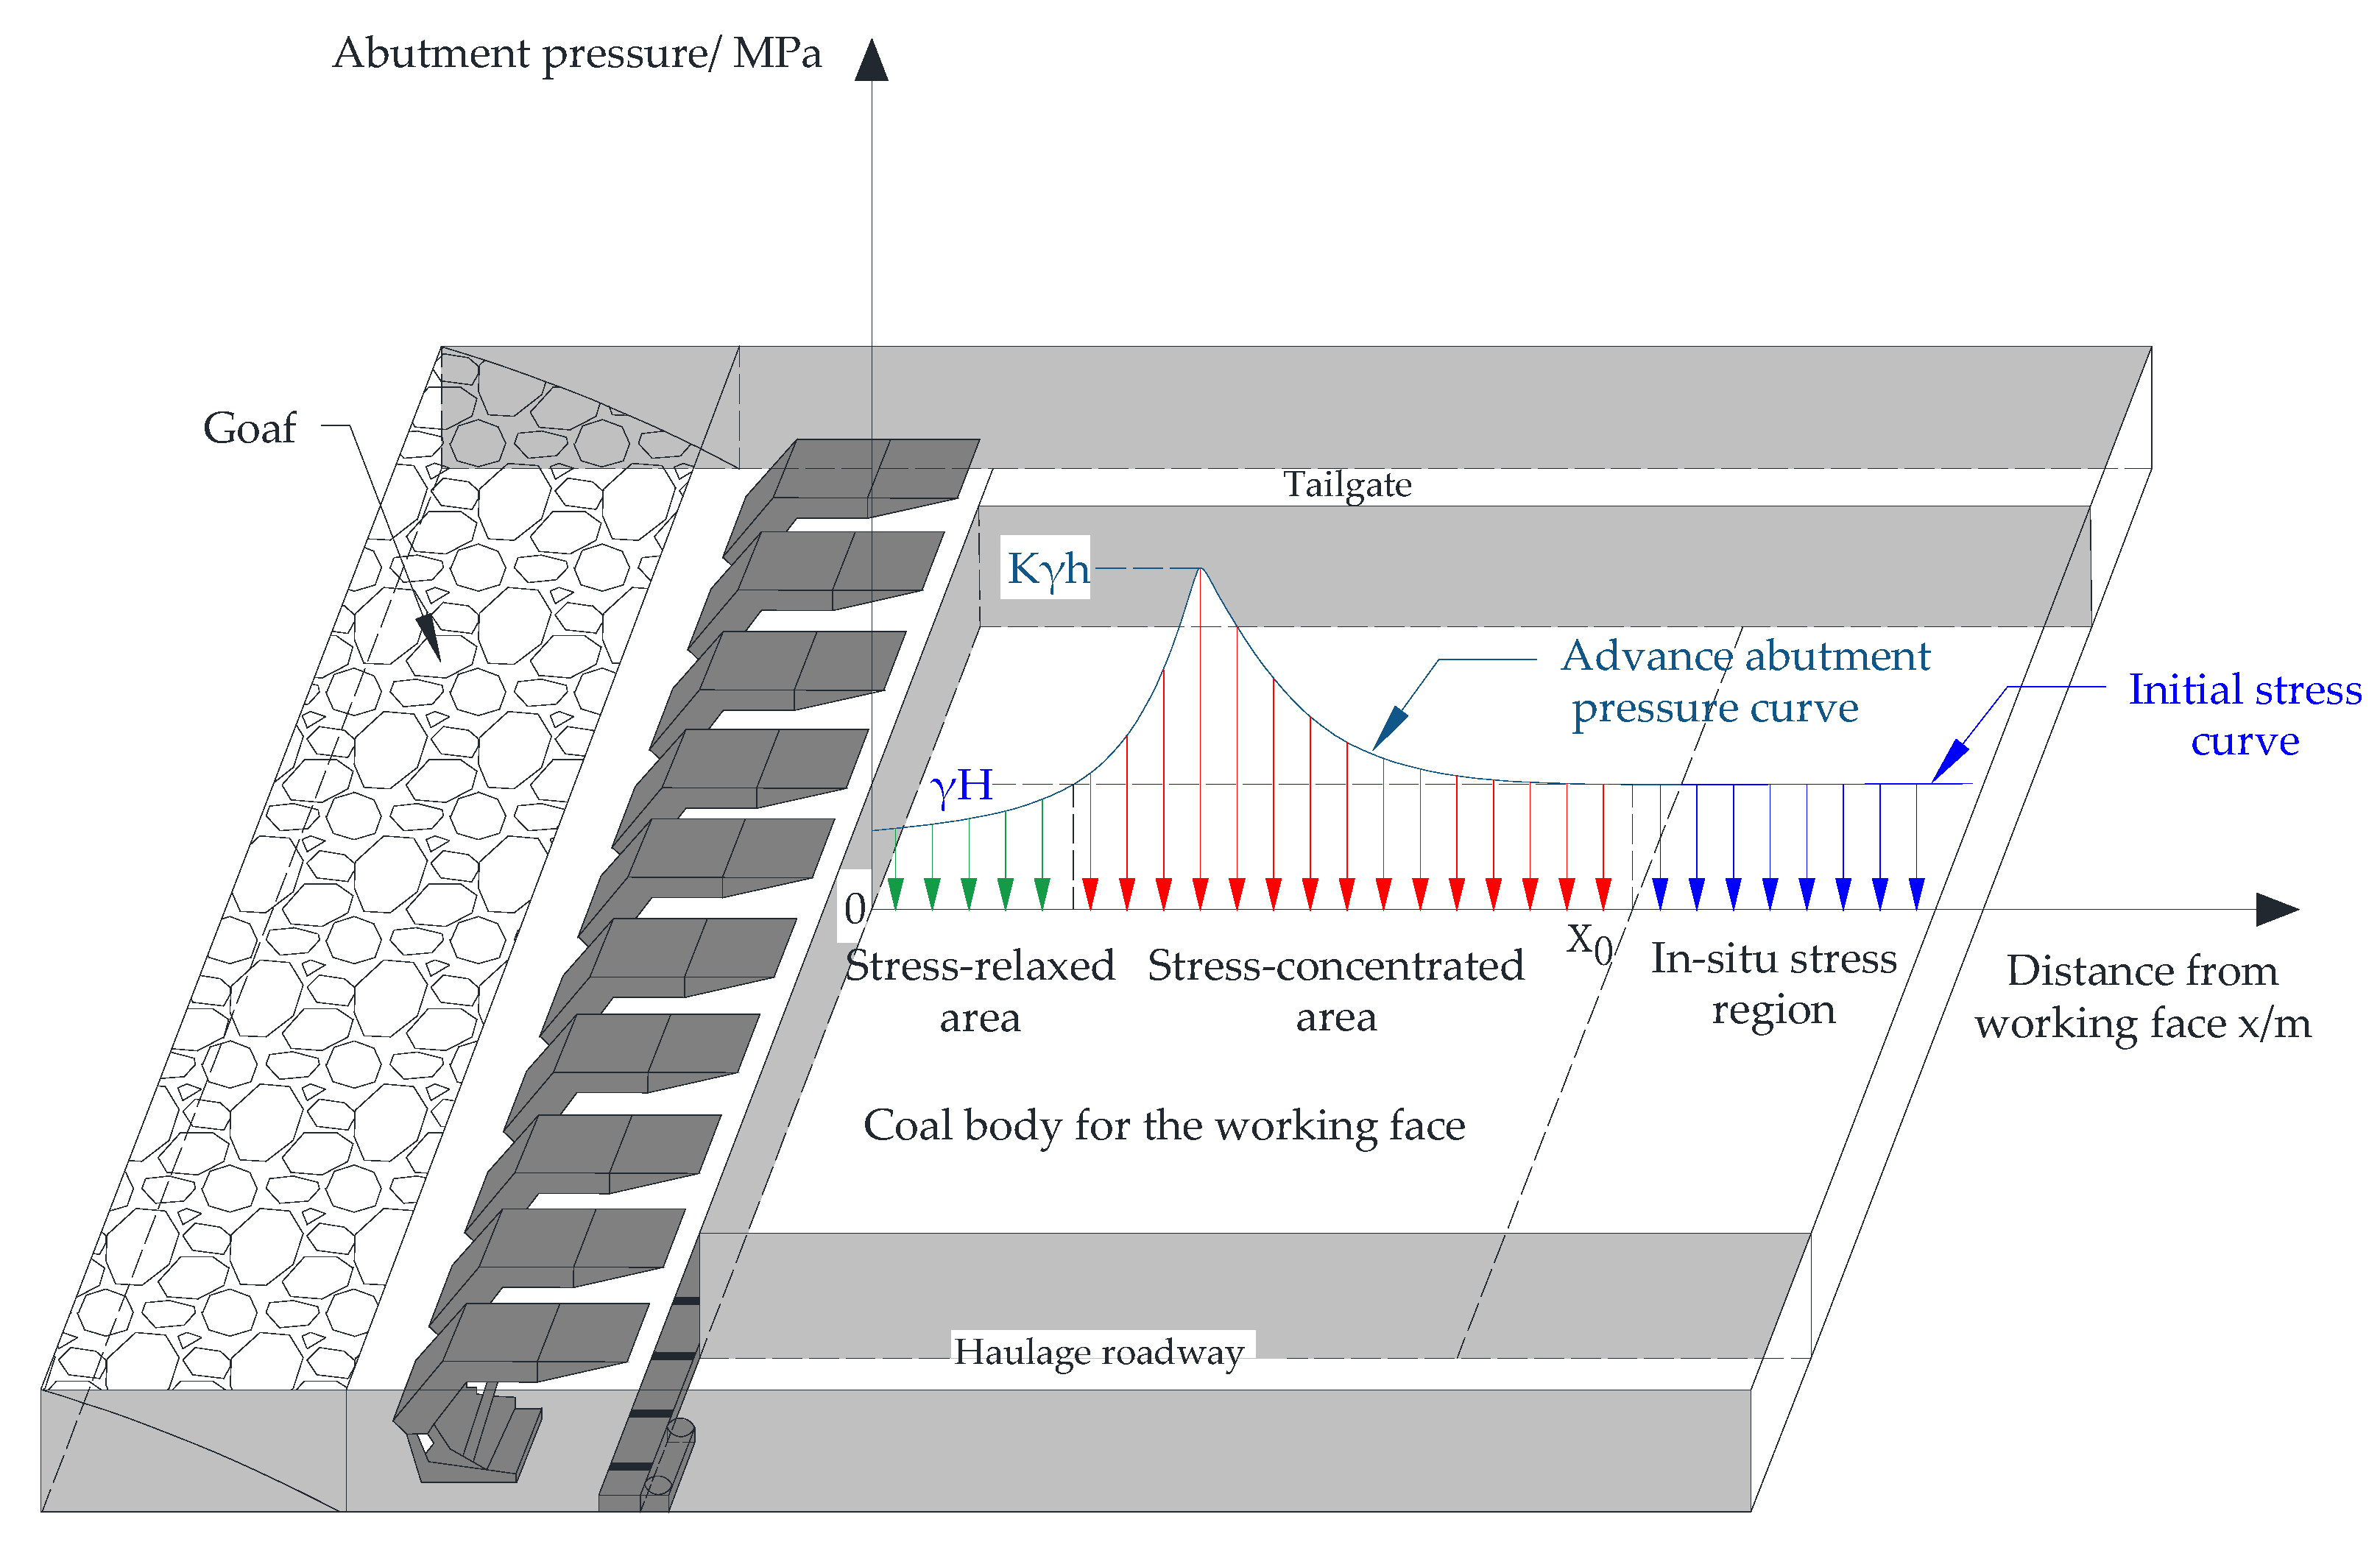
The development process of the anchorage arch in this analysis is divided into two stages. The first stage is the formation process of the anchorage arch after excavation, mainly analyzing the influence of the rock bolts on the deformation and stress changes in the surrounding rock after roadway excavation. The second stage is the stability characteristics of the rock bolts under the influence of subsequent mining stress. The roof stress along the roadway direction in the first stage is the initial stress, which is uniformly distributed. The stress on the surrounding rock of the roadway meets the conditions of the plane strain model. Therefore, the analysis results of the anchorage arch formation process using the FALC2D model are reliable. For the stage of mining induced stress influence, the advance abutment pressure of the working face is unevenly distributed within the roof of the mining roadway, as shown in Figure 20. At this point, the shear stresses τxz and τyz related to the Z direction are no longer zero, and the strain ε z related to the z-axis is 0, but εxz and εyz are no longer zero. Since the FALC2D model assumes that εxz and εyz are zero, it can be known from reference [18] that the simulated plastic deformation is less than the actual deformation.
In summary, the FLAC2D model can effectively analyze the influence of rock bolts on the anchoring and arching of the roadway surrounding rock. However, regarding the influence of mining on the stability of the anchorage arch, the uneven distribution of advance abutment pressure means that the FLAC2D model’s calculation results can only reflect the deformation and stress changes in the anchorage arch induced by rock bolts. To obtain more accurate results for this specific stage, the FLAC3D model must be employed.

5. A Bolting Scheme for a Gateway with a Large Cross-Sectional Area

5.1. Selection of Support Method

The design of rock bolting mainly involves selecting a proper support method and determining support parameters. The specific design process must be in accordance with the requirements in the technical specifications for bolt supporting in coal roadway.
According to the technical specifications, the gateway with a large cross-sectional area at Chahashu Coal Mine can be supported using a bolt-mesh-belt (beam) system or a bolt-mesh-cable system. After considering the strict reliability requirements of the highly productive coal face that it serves, the large cross-sectional area, and the gateway’s susceptibility to mining-induced dynamic pressure, we finally designed a support system combining bolt-mesh-beam and anchor cables for this gateway. The material parameters of the rock bolt, anchor cable, beam, wire mesh and other devices used are presented in Table 5.

5.2. Rock Bolt and Anchor Cable Parameters

5.2.1. Rock Bolt Length

In current rock bolt support design theories—such as the suspension theory and composite beam theory—a core emphasis is placed on the requirement that rock bolts should be anchored into stable rock masses. As inferred from the aforementioned analysis, the presence of rock bolts enables interaction between the shallow and deep surrounding rock of the roadway. Within the anchorage range, the rock mass maintains reinforcement and forms a stable reinforced arch; this structure effectively suppresses the roadway’s surface convergence deformation. When designing rock bolt support systems, the support requirements can be satisfied if two conditions are met: (1) the roadway surrounding rock meets the prerequisites for forming an anchorage arch, and (2) the formed arch can sustain long-term stability. This design criterion not only adheres to the fundamental principles of rock bolt support but also simplifies the range of influencing factors that need to be considered during the design process.
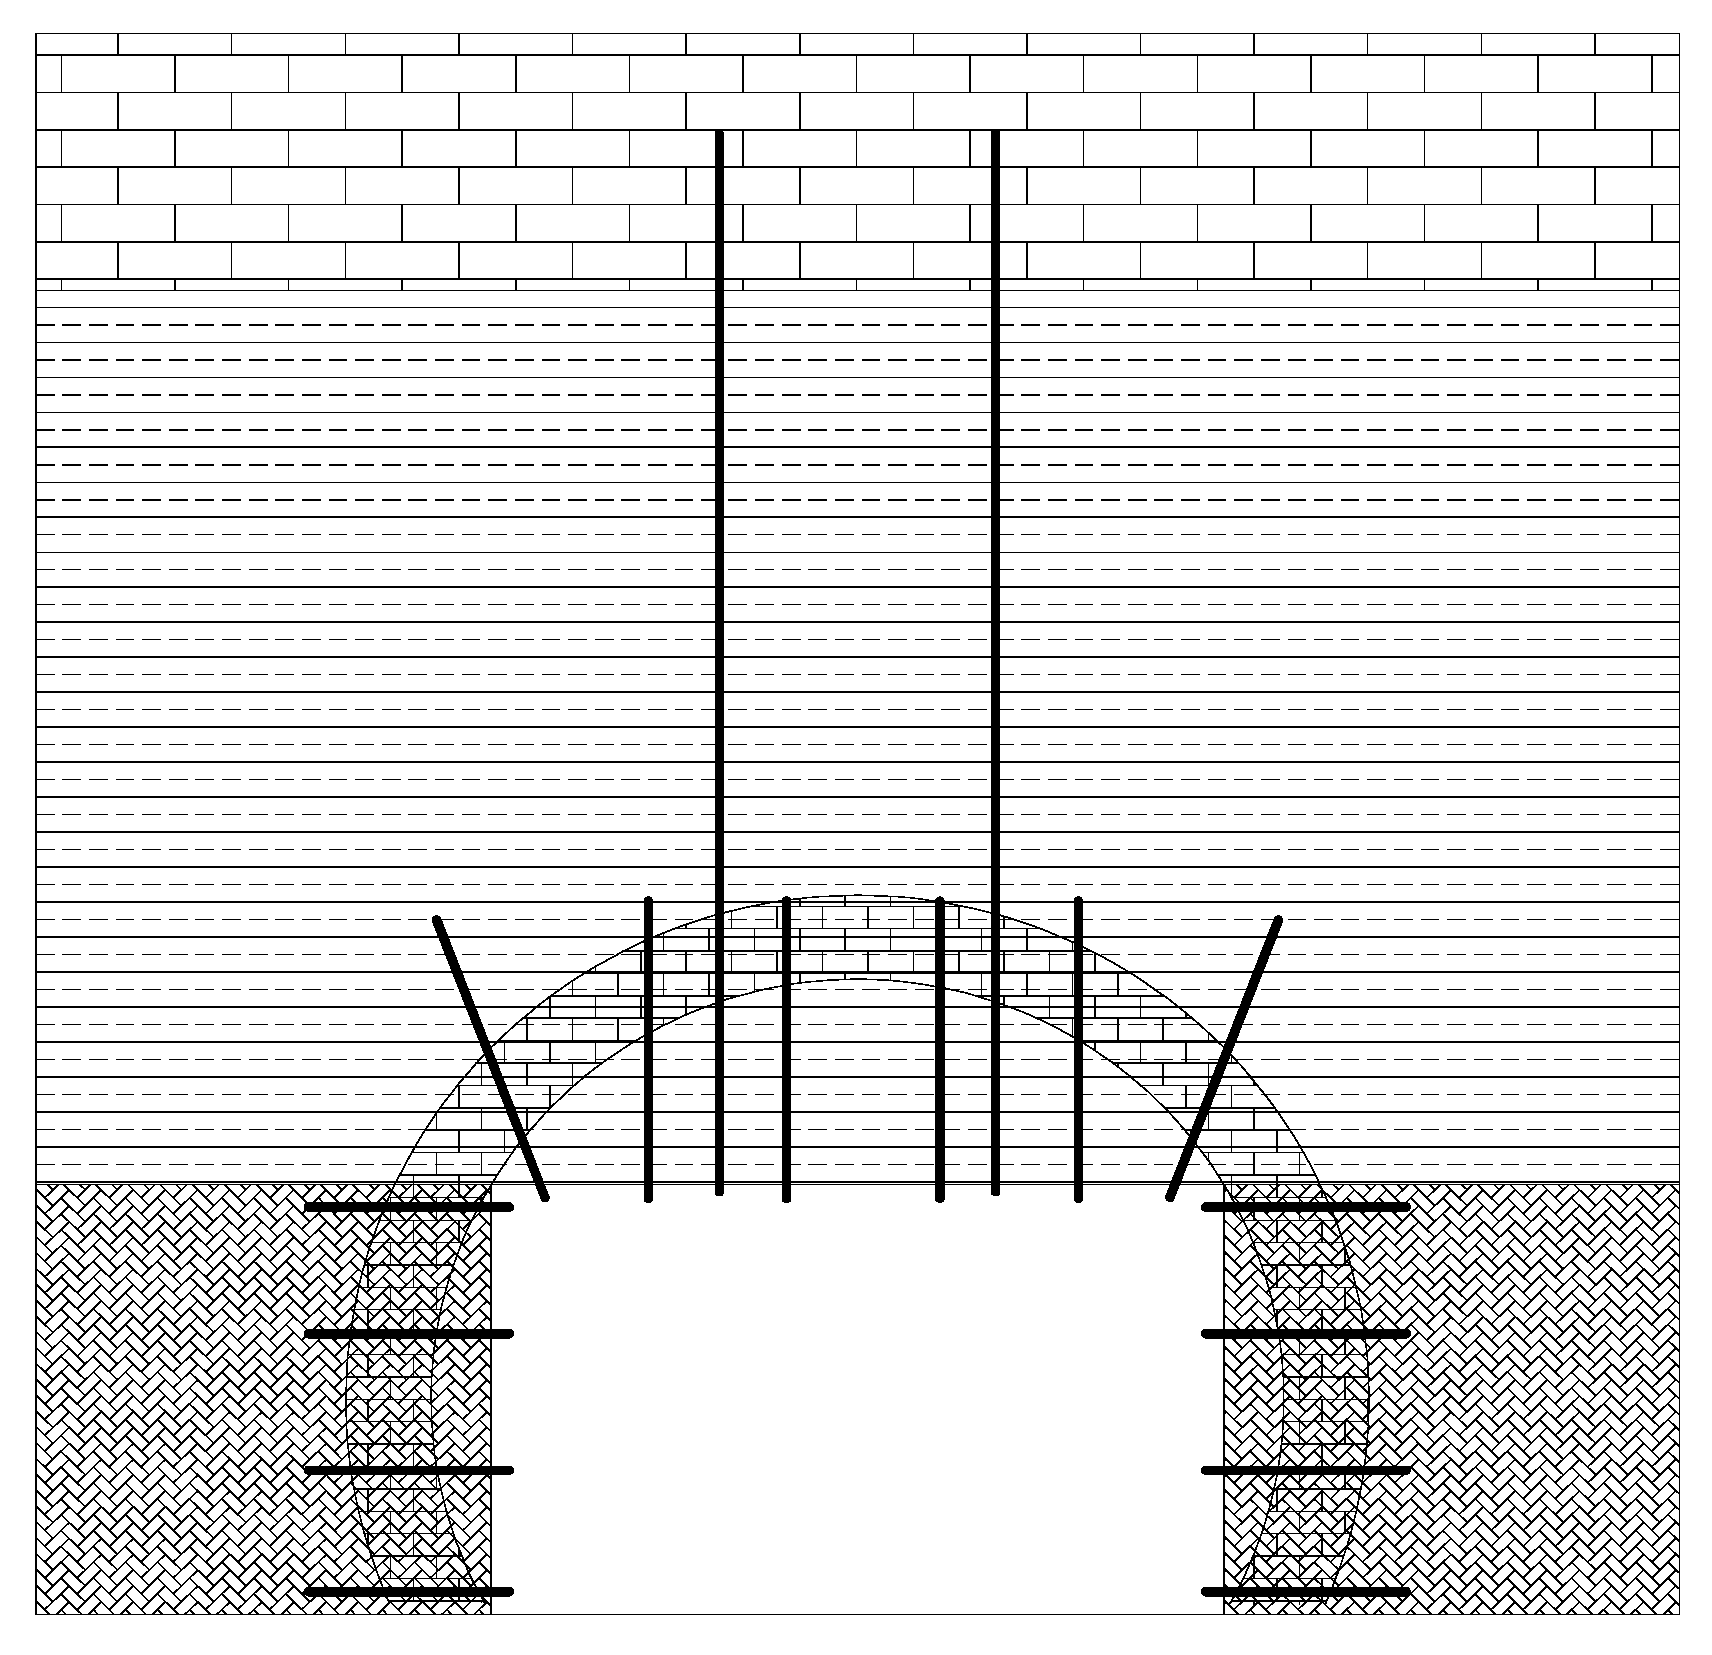
The mechanism analysis above suggests that when a roadway is supported with rock bolts, the surrounding rock can form a layered structure, as shown in Figure 21. The loose rock in the interior of this structure can not form a stable closed arch (circle) around the roadway and tend to deform and converge towards the inside of the roadway. This then induces the distant rocks in the anchorage zone to form compressive arches through the aforementioned bolt-guided arching. The compressive arches in different regions will finally combine into a stable closed arch (circle) surrounding the roadway and maintain stability. The rock bolts can prevent the convergence of the loose rock and bear the pressure exerted by the rock undergoing deformation in the anchorage zone. The stress concentration at the corners can crush the rock masses nearby, as shown in Figure 21. Though the crushed rock also forms a closed circle around the roadway, it is distinguished from the compression circle (arch) by decreased bearing capacity. This circle is called the crushed circle. According to the previous numerical analysis, its thickness should fall within the range of 0.1 to 0.2 m.
The lengths of rock bolts should allow for the formation of a compression circle (arch) of a particular thickness that can not only maintain its own stability, but also can withstand the pressure from deeper rocks. Therefore, the rock bolt length should satisfy the following condition:
L ≥ L1 + L2 + L3 + L4,
where L— rock bolt length (m);
L1—maximum thickness of the loose rock (m);
L2—thickness of the crushed circle (arch), L2 = 0.1 m;
L3—thickness of the compression circle (arch) (m);
L4—length of exposed bolt segment, L4 = 0.05 m.
The bolt parameters were designed regarding the theory of arch of natural equilibrium. The segment of each bolt screwed into stable strata should be at least 0.5 m long [3], and the compression circle (arch) should be no thinner than 0.5 m.
Given the size of the roadway’s cross-section (5.8 × 4.0 m), the length of rock bolts for the roof, Lf, can be derived from the geometric relationships shown in Figure 21:
Lf ≥ 1.52 + 0.1 + 0.5 + 0.05 = 2.17 (m),
The proper length of rock bolts for the two sides, Ls, should satisfy the following condition:
Ls ≥ 0.62 + 0.1 + 0.5 + 0.05 = 1.27 (m),
Given the field conditions, Lf and Ls were both set at 2.2 m.

5.2.2. Anchor Cable Length

The anchor cables in the support system mainly serve as hangers(Figure 22). The anchor cables are fastened to the overlying stable strata at one end and to the roof surface at the other end, for the purpose of reducing the subsidence of the anchorage zone due to gravity and stabilizing the compressive arch.
If there are hard and stable strata in the roof of a roadway, the anchor cable segments placed into the stable strata should have sufficient lengths. If the roof consists of weak fractured strata, the anchor cable segments placed into the arch of natural equilibrium should be long enough. The false roof and immediate roof of the roadway to be reinforced are composed of unstable mudstone and sandy mudstone, whose maximum thickness is 7.18 m (Table 1). Moreover, these strata are susceptible to mining-induced pressure. Therefore, the anchor cable length can be estimated for the latter case as follows:
Lc ≥ H + L1 + L2,
where Lc—anchor cable length (m);
H—ultimate height of arch of natural equilibrium (m);
L1—anchorage length of anchor cable, normally between 1.5 and 1.8 m;
L2—length of exposed cable segment, normally between 0.15 and 0.25 m.
The ultimate height of the arch of natural equilibrium can be calculated using the following formula [17]:
H = W 0 + H 0 tan π 4 φ 2 3 P 0 4 P 0 + 12 σ t 2 2 H 0 tan π 4 φ 2 ,
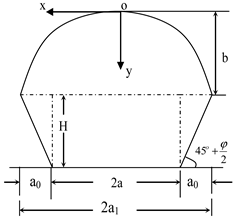
where W0 is the excavation width; H0 is the excavation height; σt is the tensile strength of the roof; φ is the angle of internal friction of the roof; and P0 is the roof pressure above the roadway. Their values determined in this study are as follows: W0 = 5.8 m; H0 = 4.0 m; σt = 1.43 MPa; φ = 26.6°; and P0 = 30 MPa, which takes into account the effect of front abutment pressure. Substituting these values into the equation above gives the ultimate height of the arch of natural equilibrium, at 5.06 m. The anchor cable length is required to satisfy the following condition:
L ≥ H + L1 + L2 = 4.95 + 1.5 + 0.15 = 6.6 (m),
Based on the current situation regarding the application of anchor cables in mines, the proper cable length was set at 7.3 m for this gateway.

5.2.3. Line and Row Spacing of Rock Bolts

The pullout testing on the rock bolts shows that a single rock bolt has only a limited effect on the deformation of the surrounding rock and the affected zone is shaped like a jujube pit [20]. Figure 23a shows the boundary of the zone affected by full-length anchorage. It is found that this affected zone has a vertical extent about 1.5 times the anchorage length and a horizontal extent equal to the anchorage length [21]. When the resin-bonded bolt is installed by end anchorage or lengthened anchorage, the affected zone around the free bolt segment is cone-shaped [22], as shown in Figure 23b. Figure 23c depicts the whole zone affected by end anchorage or lengthened anchorage. The horizontal extent of this zone equals the anchorage length.
The zones affected by the rock bolts should be able to connect into a continuous circle surrounding the roadway, to allow the distant converging rocks to form a self-stabilizing compressive arch (Figure 7). The proper line and row spacing of rock bolts can be estimated as follows:
Llrb < Lan,
where Llrb is the line and row spacing of rock bolts, and Lan is the anchorage length of the resign bolt, L a n = D 2 L D 1 2 D 2 2 , in which D and L are the anchoring agent’s diameter and length, respectively, D1 is the borehole diameter, and D2 is the rock bolt diameter.
According to Table 5, D = 23 mm, L = 0.6 m, and D2 = 22 mm. For a borehole diameter of 28 mm, the line and row spacing of rock bolts should satisfy the following condition:
L l r b D 2 L D 1 2 D 2 2 = 23 2 × 0.6 28 2 22 2 = 1.06   ( m ) ,
For quick excavation, the line and row spacing of rock bolts was set at 1.0 × 1.0 m.

5.2.4. Row Spacing of Anchor Cables

The main role of anchor cables is to prevent the crushed rock and loose rock in the roof (Figure 21) from subsiding on a large scale and reduce the subsidence of the anchorage zone due to gravity. If the cohesion and internal friction of the surrounding rock are relatively low, the row spacing of anchor cables should satisfy the following condition for mechanical equilibrium in the vertical direction:
L s c n F c S r a z γ ,
where Lsc is the row spacing of anchor cables (m); Fc is the ultimate bearing capacity of anchor cable; n denotes the number of cables in each row; and Sraz is the cross-sectional area of the zones occupied by crushed rock and loose rock, which can be calculated by geometrical construction; γ is the bulk density of roof strata. Their values determined in this design are as follows: Fc = 353 kN; n = 2; Sraz = 7.63 m2; and γ = 24.7 kN/m3. The row spacing of anchor cables is required to meet the following requirement:
L s c 2 × 353 7.63 × 24.7 = 3.74 m ,
Based on the results, the row spacing of anchor cables was set at 3.0 m and the two cables in each row are 3.0 m apart.

5.2.5. Final Design

The support parameters determined by the commonly used rock bolt design methods for domestic mining roadways in China are shown in Table 6.
As shown in Table 6, except for the roof bolt length determined by the dome theory method being relatively greater, the roof bolt lengths proposed in this study are slightly shorter than those obtained using the other methods listed in the table. the bolt spacing (a) value determined in this study is comparable to those derived from the dome theory and the “Chinese Coal Mines Technical Specifications”, and is larger than that calculated via the combined beam theory—more than twice the latter value.
The parameters recommended in the “Chinese Coal Mines Technical Specifications” are derived from long-term practical experience and are widely regarded as highly reasonable. However, the application of these values often depends on the designer’s subjective judgment, and this approach is primarily used for post hoc verification of design rationality. The rock bolt spacing required by the combined beam theory, as well as the side rock bolt length required by the dome theory, all exceed the recommended ranges specified in the “Chinese Coal Mines Technical Specifications.” This suggests that these theoretical approaches exhibit a certain degree of limitation in their understanding of the anchoring mechanism, which may compromise the reliability of their computational outcomes.
Although the length of the side rock bolt determined by the method proposed in this study falls below the range recommended by the “Chinese Coal Mines Technical Specifications”, it is the lower limit of the side rock bolt length. The design remains in compliance with the standard requirements when the specific value is selected. Therefore, the design outcomes demonstrate enhanced rationality and can be further substantiated for practical applicability through on-site implementation.
Based on the obtained rock bolt support parameters, a site-specific rock bolt support design scheme (oriented to field verification) was developed and implemented in the belt conveyor roadway of Working Face 31,305 at the Chahashu Mine.
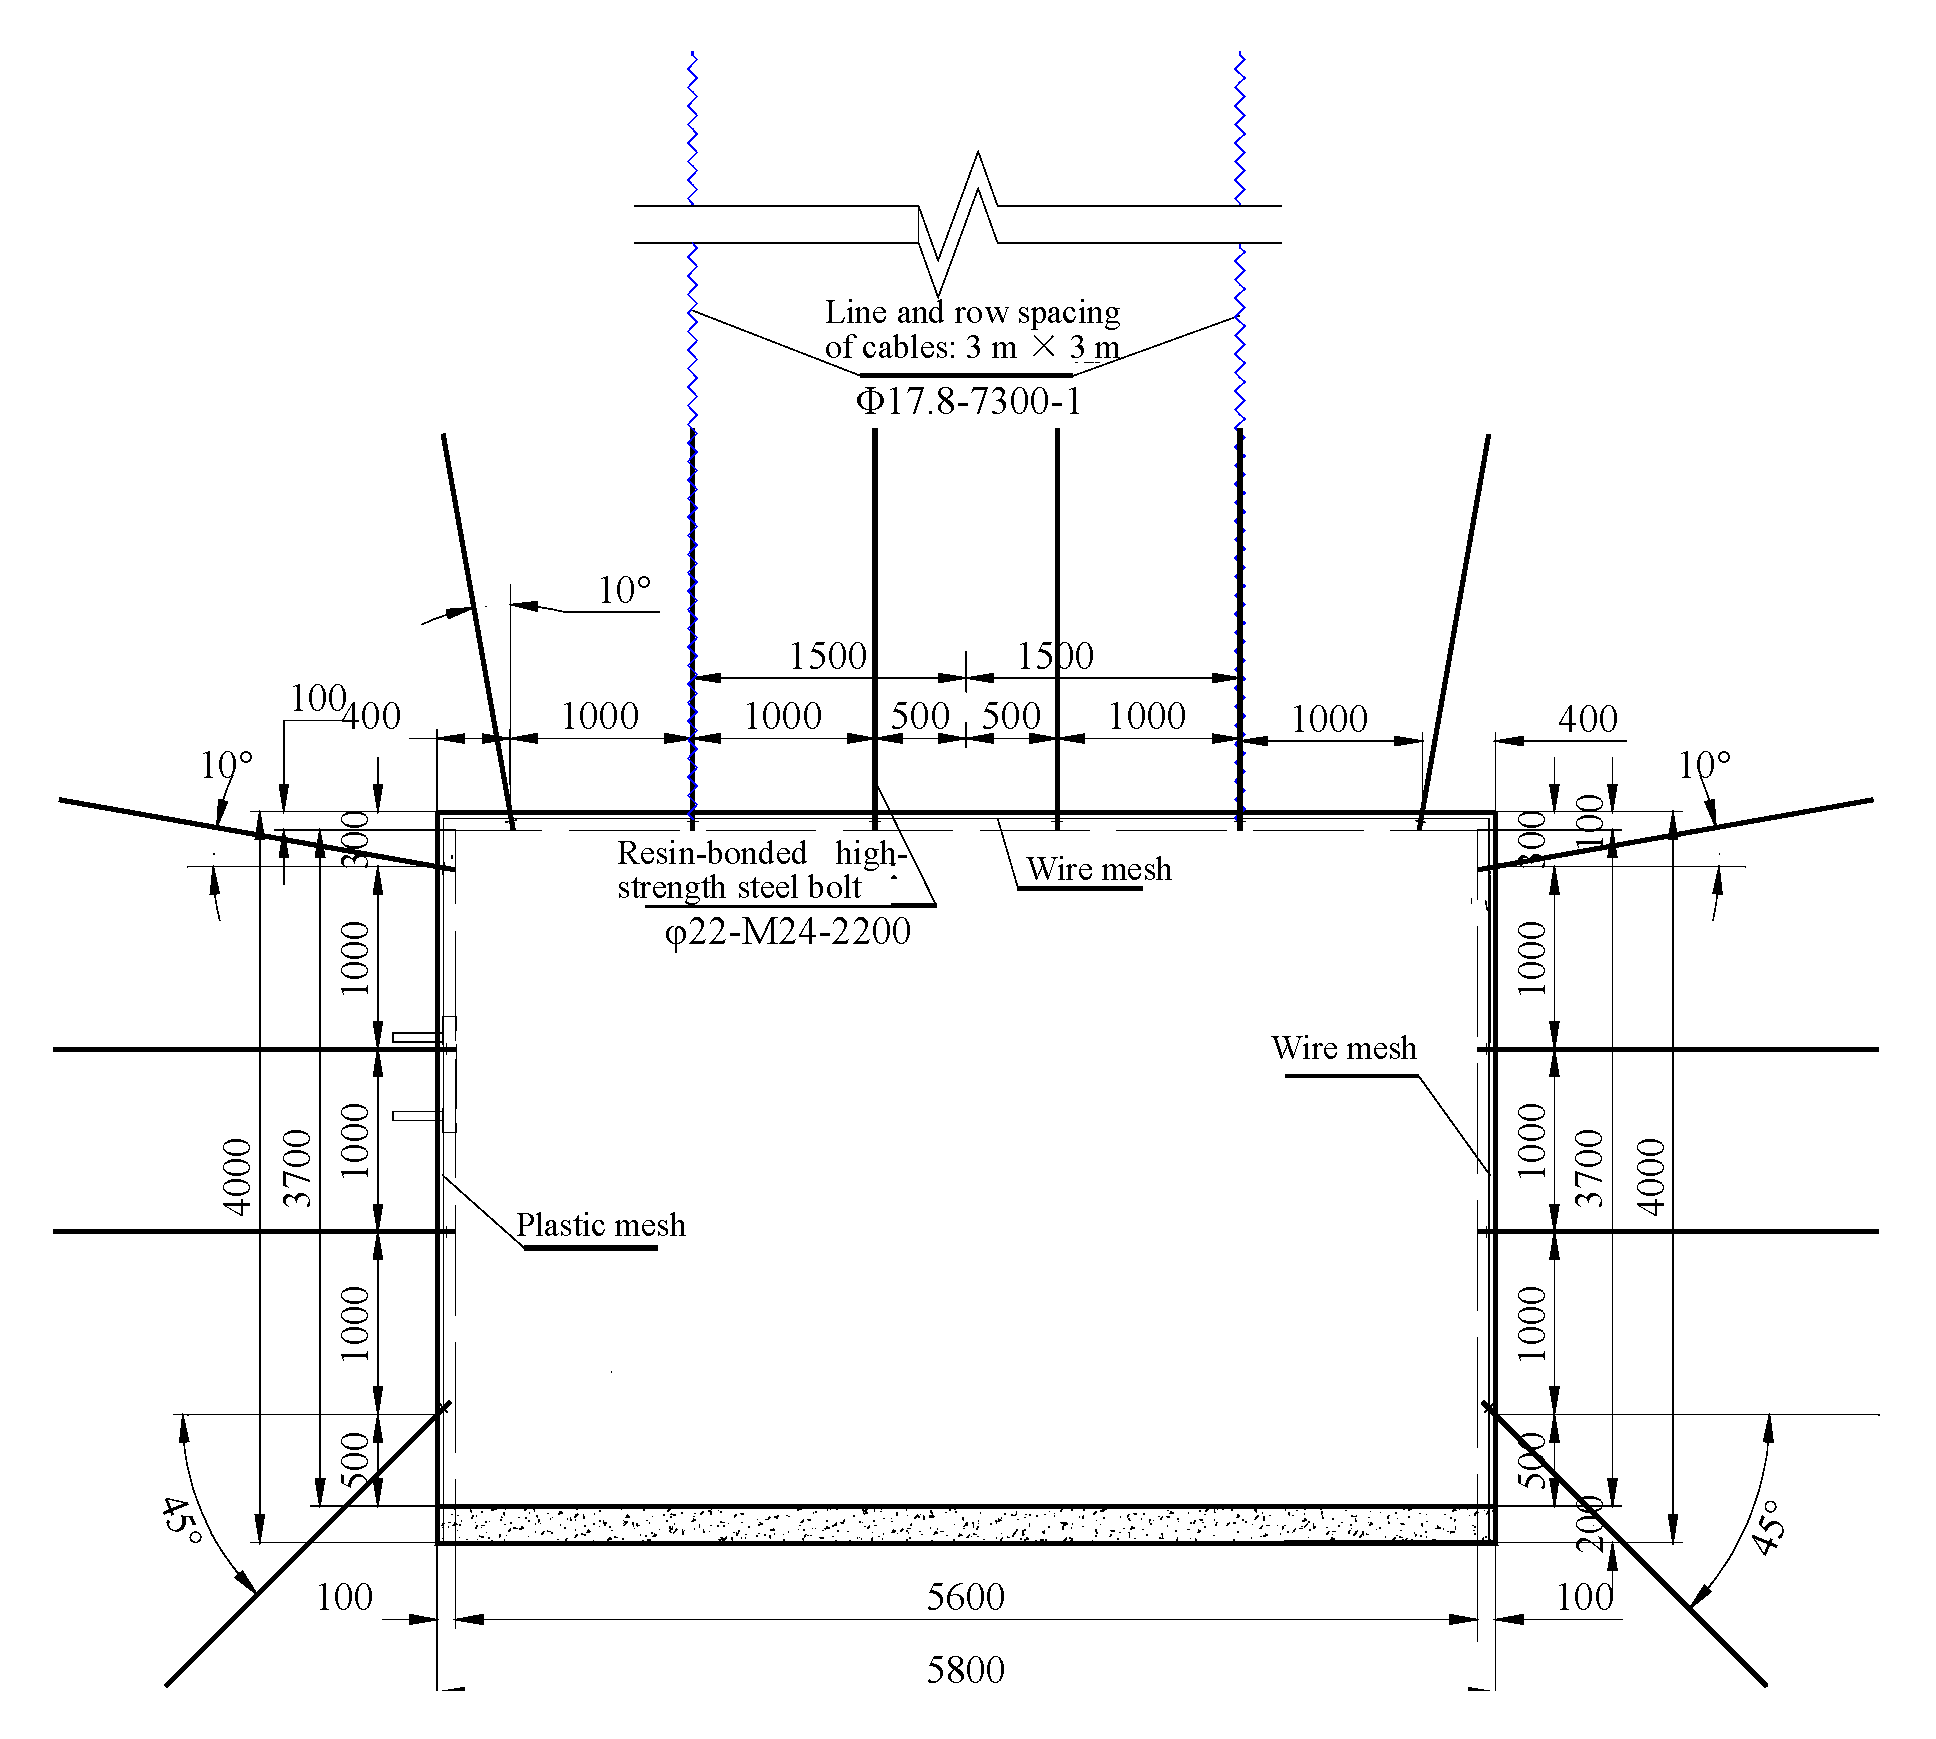
Figure 24 depicts the final design of rock bolting for the conveyor belt roadway. The specific parameters are as follows: (a) the number of roof bolts in a row, 6; the number of side bolts in a row, 4; HRB335 steel bolt with a left-handed thread and no longitudinal rib, φ22 × 2200 mm; line and row spacing of rock bolts, 1000 × 1000 mm; (b) the number of anchor cables in a row, 2; anchor cable formed of steel strands, φ17.8 × 7300 mm, with tensile strength of 1860 MPa or greater; line and row spacing of cables, 3000 × 3000 mm; (c) plastic mesh for the left side (viewed in the direction of tunneling), and wire mesh for other surfaces; (d) one piece of CK2360 resin anchoring agent for each rock bolt, and three for each anchor cable; (e) 3.0 m long beams made of round steel rods and with trapezoidal cross-section for connecting adjacent cables.
It can be observed that the rock bolt length determined via the method proposed in this study is shorter than the calculation result derived from the dome theory, and this outcome is close to the Chinese coal mine standards recommendations. However, the Chinese coal mine standards recommendations are highly dependent on the designer’s subjective judgment; thus, they can only be used to verify the rationality of the finalized design results. Additionally, the values of rock bolt single row spacing determined in this study are consistent with the results obtained from the two conventional methods listed in Table 6.

5.3. Results of Field Application

The support design scheme was implemented on site, and surface deformation, roof separation, and the force variation in the rock bolts/anchor cables were monitored from the tunneling face to the point of stable deformation of the roadway.
Multiple reference points have been established to monitor the deformation and displacement of the roadway. The monitoring results indicate that stabilization of the surrounding rock commenced at approximately 100 m behind the heading face. Following stabilization, the maximum lateral convergence did not exceed 12 mm, and the maximum roof subsidence remained under 4 mm (Figure 25). The greater deformation observed on both sides of the roadway, compared to the roof subsidence, can be attributed to the geological composition: the roof was composed of hard sandstone, while the side walls consisted of coal with relatively lower mechanical strength.
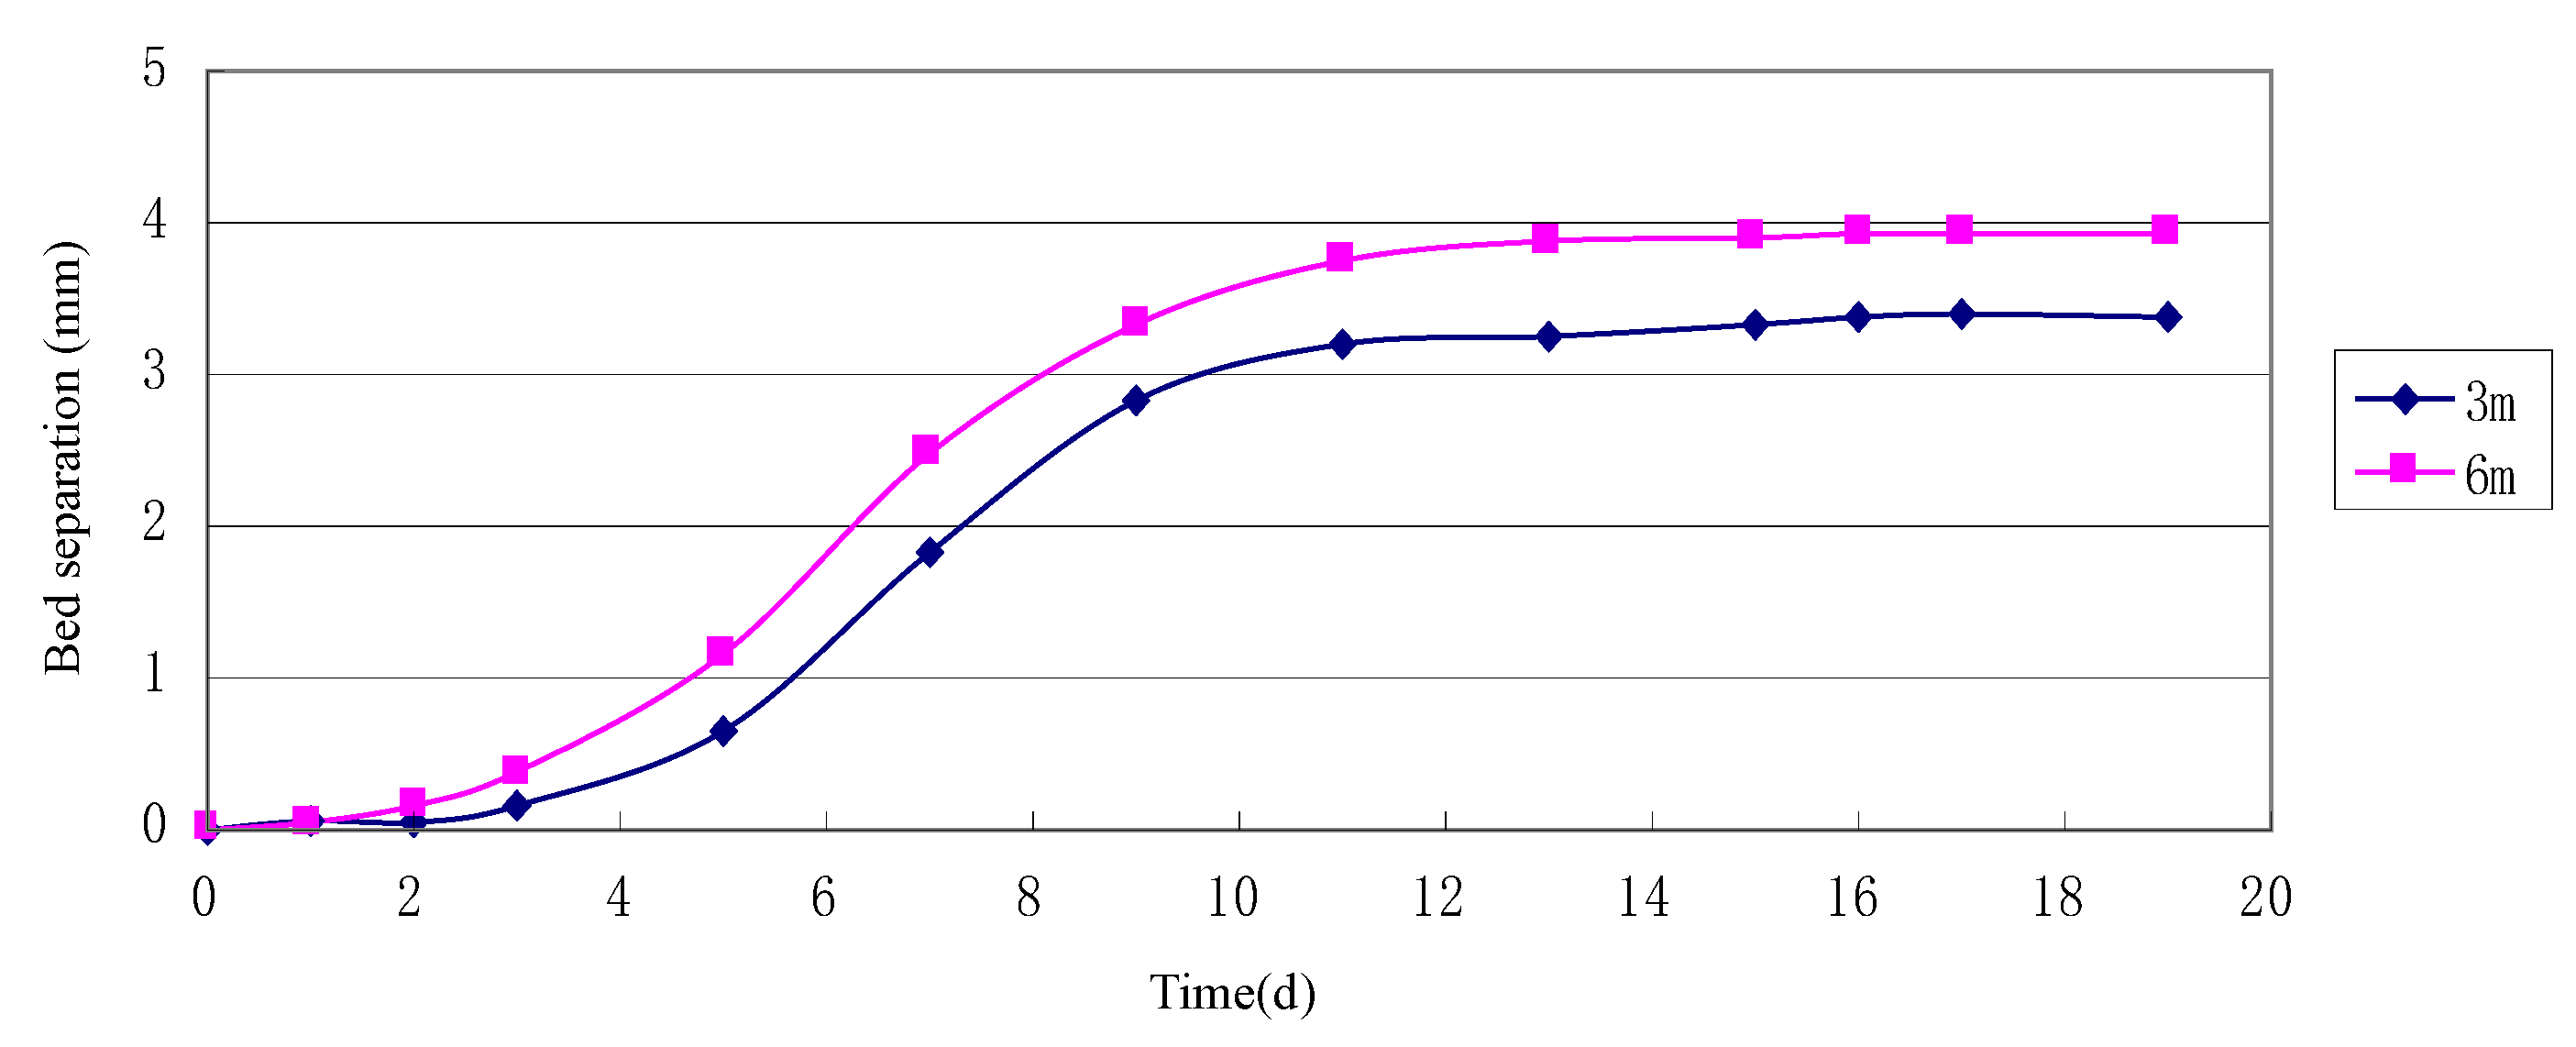
Deep multi-point displacement meters were utilized to monitor the relative displacement of the surrounding rock at different depths within the roadway. The maximum depth recorded across all monitoring points was 8 m, as depicted in Figure 26. The monitoring data demonstrated that the maximum roof separation remained below 4 mm, with 80% of the total deformation occurring within the first 3 m. The rock strata at depths exceeding 3 m were confirmed to be stable layers (Figure 27).
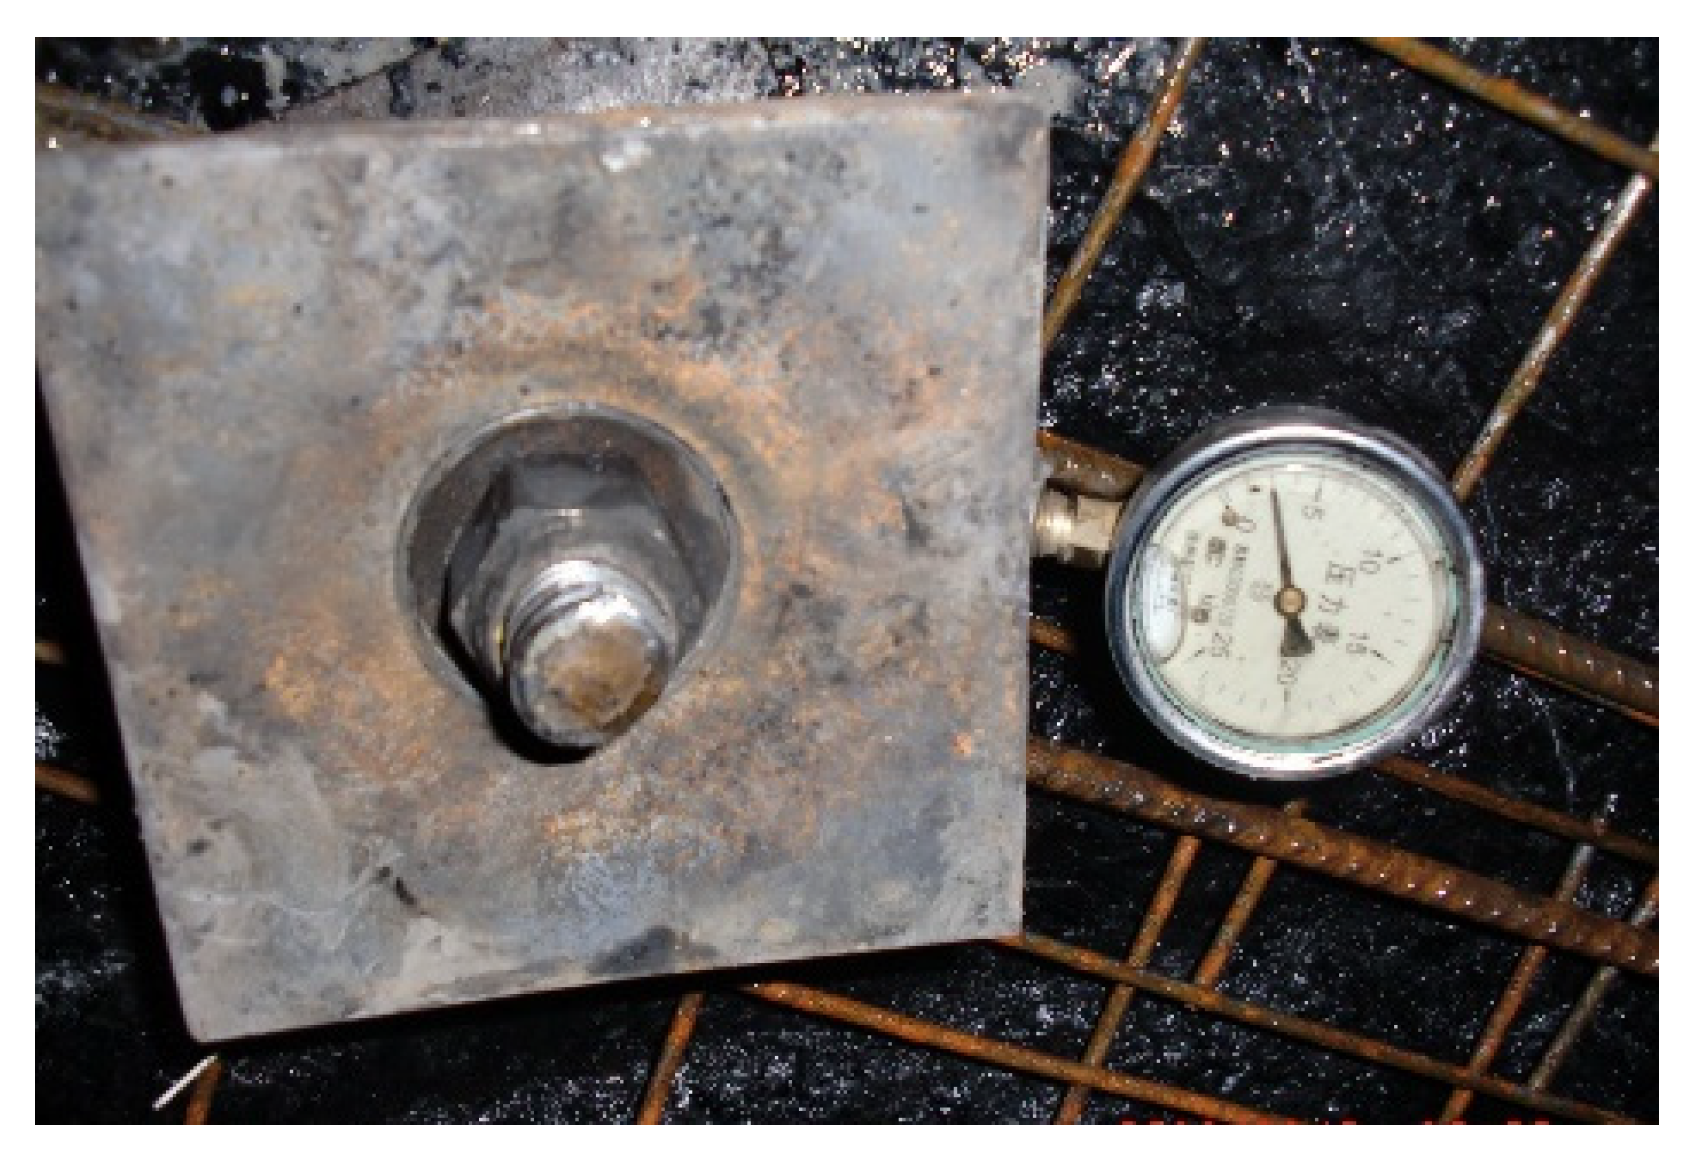
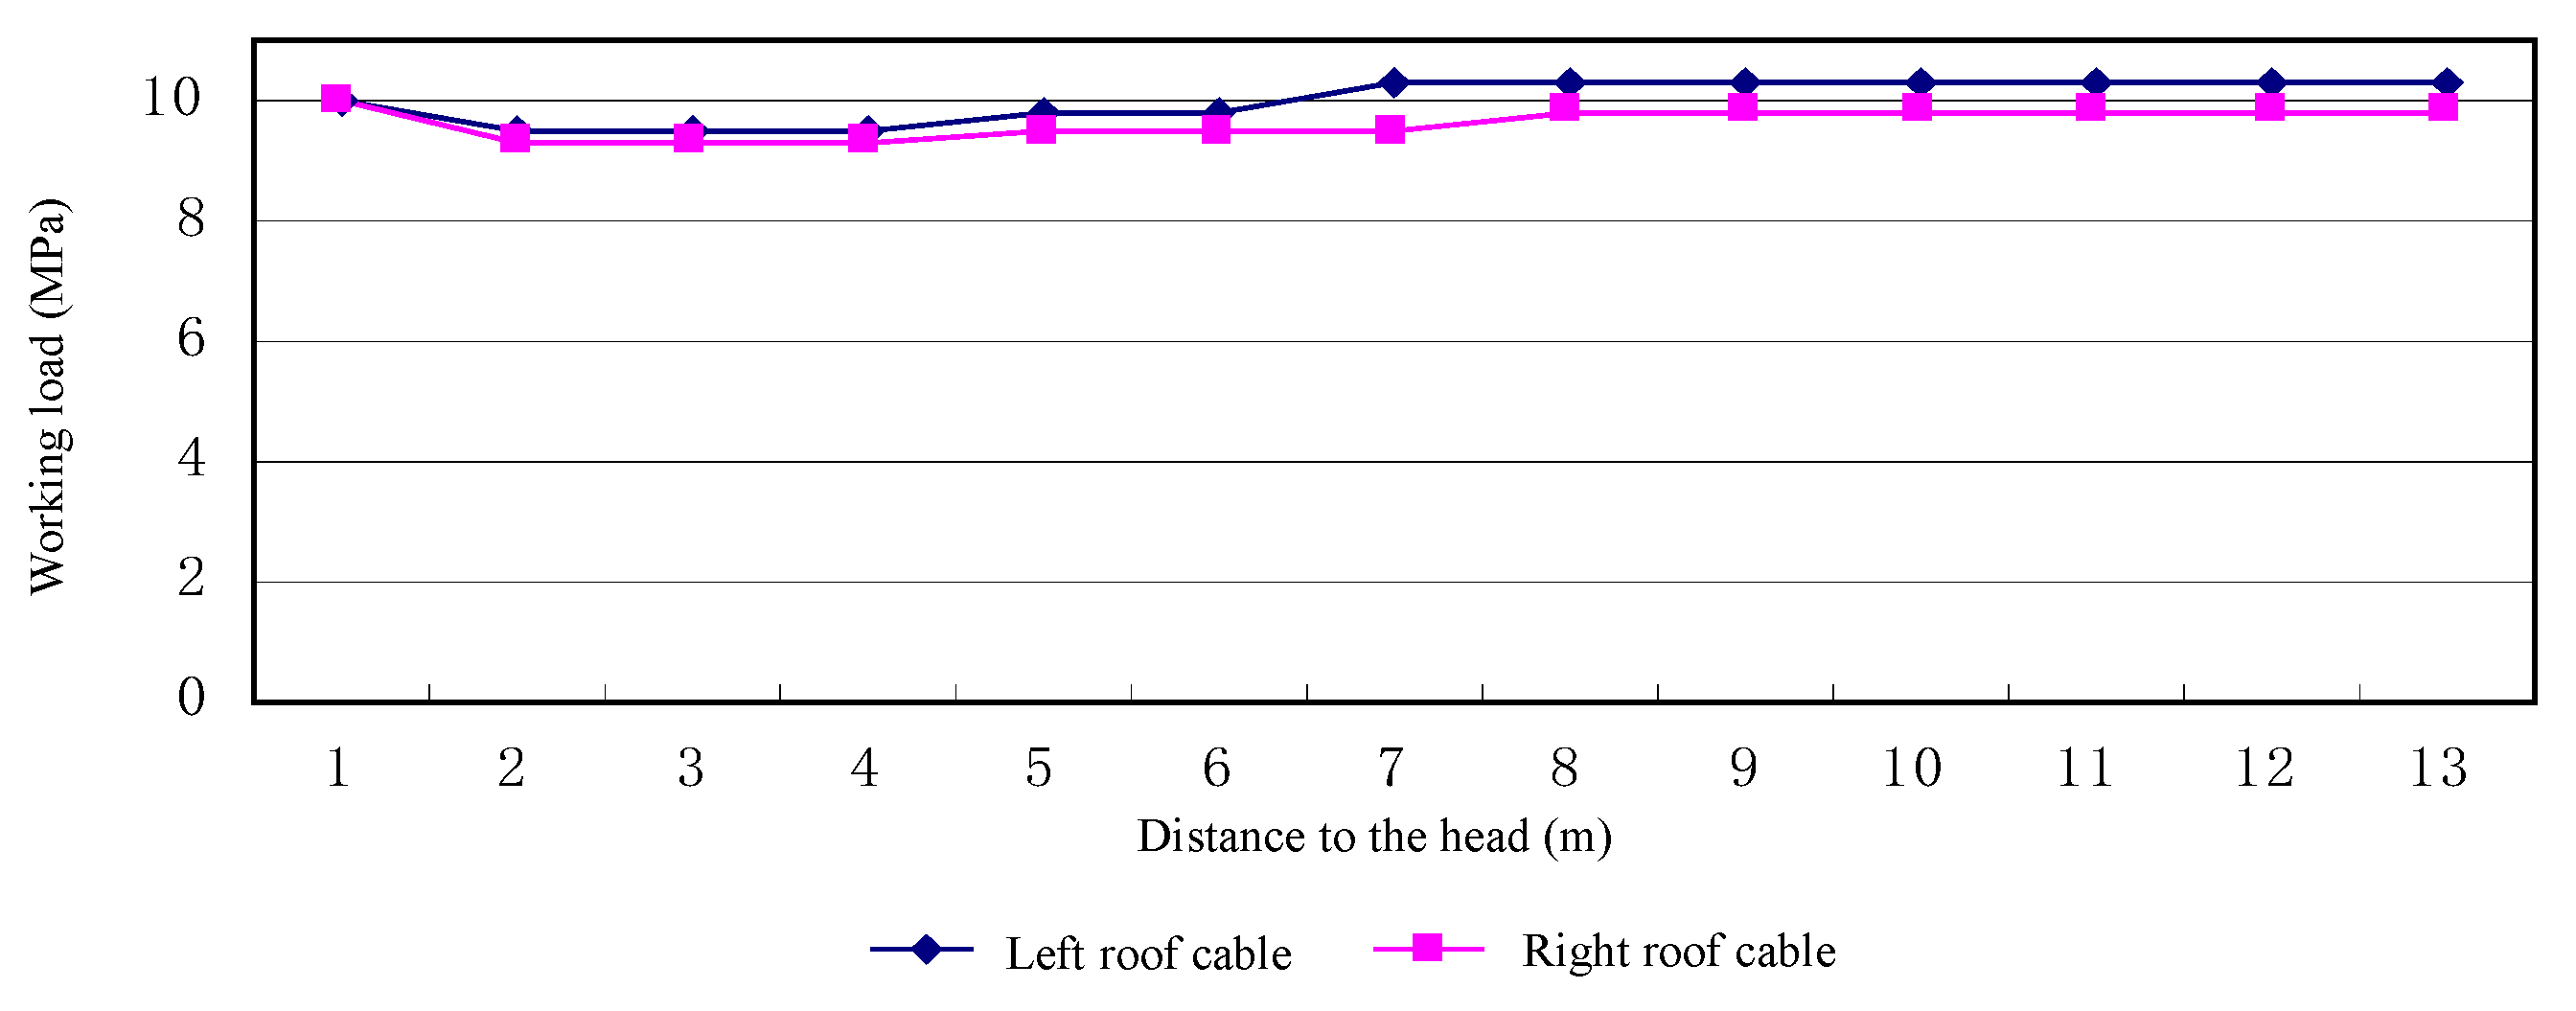
The operational status of the rock bolts and anchor cables is monitored through the rock bolt load cells, as depicted in Figure 28. The monitoring results demonstrate that the rock bolts and anchor cables are subjected to stable stress and remain predominantly in the pretensioned state.
The rock bolts employed in the support scheme have a length of 2.2 m. As illustrated in the monitoring results (Figure 27), the anchorage zone is located within the shallow surrounding rock, which undergoes relatively significant deformation. However, due to the reinforcing effect of the rock bolts, this zone remains stable, and the overall deformation of the roadway remains within the millimeter scale, as shown in Figure 25. These observations demonstrate that the support parameters derived from the proposed design methodology adequately meet the requirements for roadway stability control and exhibit high practical effectiveness(Figure 29 and Figure 30).

6. Conclusions

(1) Under high in situ stress or mining-induced stress concentration, the rock surrounding a coal roadway is found to undergo a failure process spreading from near-surface regions towards distant zones. For a roadway with a rectangular cross-section, the failure of surrounding rock starts at the corners and the failure process then extends towards the interior of the roof and two sides, largely in the form of conjugate compression-shear. The distant rock masses fail alternately in conjugate shear and vertical shear. The resulting failure planes divide the surrounding rock in the cross-section into different zones, suggesting a zonal fracturing process.
(2) If a roadway is surrounded by relatively soft and weak rock, the rock bolts can help stabilize the surrounding rock by the following mechanism: The convergence of near-surface rocks generates a traction force at rock-bolt interface. This force then drives the distant rock masses to converge and allow them to form a compressive arch (circle). By preventing further convergence of near-surface rocks, the resulting compressive arch (circle) creates a stable high-stress anchorage zone, which can support the pressure from the rocks undergoing deformation outside the zone.
(3) When the roadway is supported with rock bolts, the convergence of near-surface rocks can rapidly alter the stress state of distant rocks, primarily by sharp stress decline, allowing the distant rocks to form a stable arch (circle) structure under relatively low stresses. This stable structure can retard the deformation of the loose rocks nearer to the surface. As a result, the residual stress in the anchorage zone is significantly higher than the stress observed in the absence of rock bolts.
(4) Rock bolts can stabilize weak surrounding rock in two ways: guiding formation of a stable anchorage zone in the surrounding rock (which depends on properly designed bolt lengths and line and row spacing), and preventing development of shear failure in the anchorage zone (which depends on sufficient strength), especially the shear failure originating around the corners.
(5) During the formation of compressive arch guided by rock bolts, the rock around the corners can easily reach equilibrium and maintain stability, but the resulting concentrated stress is likely to cause shear failure. The subsidence of roof strata is caused by two reasons: mining-induced unbalanced force and gravity. To control shear failure around the corners, it is reasonable to reduce the angle between each roof bolt near the corner and the corresponding diagonal of the roadway during support design. In addition, anchor cables can be used to support the roof strata so as to reduce the effect of gravity on the stability of the roof structure.
(6) The length of the rock bolts should ensure the formation of a closed compressive zone surrounding the roadway within the anchorage zone. The spacing between rock bolts should be less than the lateral influence width of a single bolt when pulled out from the surrounding rock. Based on this principle, a geometric drawing method was developed to determine the required bolt length. Furthermore, based on the results of rock bolt pullout tests, a spacing determination method was proposed, which follows the principle that the spacing between bolts should be less than the effective anchorage length. This method is characterized by its simplicity and ease of application. By integrating these findings with the recommended parameters specified in the Chinese Technical Specifications for Roadway Support with Rock Bolts in Coal Mines, an initial rock bolt support design suitable for on-site construction can be established.
(7) Based on the principle that rock bolts guide the surrounding rock to form a stable compression arch, the rock bolt support parameters for a gateway with a large cross-section of 5.8 × 4.0 m were systematically designed. The designed bolt length is shorter than that determined by conventional design methods. Following engineering trials, the maximum convergence between both sides of the roadway after stabilization did not exceed 12 mm, and the maximum roof separation was less than 4 mm. The stress distribution on the rock bolts and anchor cables was found to be stable, thereby confirming the rationality and practical applicability of the proposed design method.

7. Patents

The Patent is shown in the following table.
PatentMethod for Bolt Length Design in Gateway Based on Function of Bolt in Arching Process of Roadway Surrounding Rocks.
InventorsPeiju Yang, Yeheng Wang, Changyou Liu, Fengfeng Wu, Yan Lu, Jingxuan Yang
ApplicantsPeiju Yang, Yeheng Wang, Changyou Liu
AddressChina University of Mining and Technology, Xuzhou, Jiangsu, China, 221116

Author Contributions

Conceptualization, P.Y. and T.G.; methodology, P.Y.; software, Z.C.; validation, J.Z.; formal analysis, P.Y.; investigation, Z.C.; resources, T.G. and J.Z.; data curation, P.Y.; writing—original draft, P.Y., J.Z. and Z.C.; writing—review and editing, T.G.; visualization, Z.C.; supervision, P.Y.; project administration, T.G.; funding acquisition, P.Y. All authors have read and agreed to the published version of the manuscript.

Funding

This research was funded by the National Natural Science Foundation of China (grant number 52074267).

Institutional Review Board Statement

Not applicable.

Informed Consent Statement

Not applicable.

Data Availability Statement

Data are contained within the article.

Acknowledgments

The authors are grateful to the editors and the anonymous reviewers for their insightful comments and suggestions. The authors sincerely thank Xizhu Quan, Yaoshuai Hu, and Jincheng Zheng for providing critical data essential to this article. Their rigorous data work laid a solid foundation for the study, and this work would not have been completed successfully without their valuable contributions.

Conflicts of Interest

Author Tuanjie Guo and author Jitao Zhao were employed by China Resources Power (Xilin Gol) Coal Co., Ltd. The remaining authors declare that the research was conducted in the absence of any commercial or financial relationships that could be construed as a potential conflict of interest.

Abbreviations

The following abbreviations are used in this manuscript:
RDRelative displacement
RSRadial stress
CSCircumferential stress

References

  1. Wang, F.Q.; Duan, W. Study on tunnelling and supporting process of super large section roadway in extremely thick coal seam. Coal Sci. Technol. 2016, 44, 27–29+66. [Google Scholar] [CrossRef]
  2. Kang, H.P. Study and application of complete rock bolting technology to coal roadway. Chin. J. Rock Mech. Eng. 2005, 24, 161–166. [Google Scholar]
  3. Kang, H.P.; Wang, J.H. Rock Bolting Theory and Complete Technology for Coal Roadways; China Coal Industry Publishing House: Beijing, China, 2007. [Google Scholar]
  4. Shi, X.D. Study on the Deformation Mechanism of Pulsating Relief of Surrounding Rock in Large Sectional Roadway. Master’s Thesis, China University of Mining & Technology, Xuzhou, China, 2016. [Google Scholar]
  5. Zhang, Z.T. Studying on Deformation Features of Surrounding Rock of Large Sectional Roadway in Coalmines and Supporting Parameters. Master’s Thesis, Chinese Institute of Coal Science, Beijing, China, 2009. [Google Scholar]
  6. Wei, Y.B. Practice on structing super section lane. Sci-Tech Innov. Product. 2006, 77–78. [Google Scholar] [CrossRef]
  7. Zhang, D.S.; Wen, J.; Wang, X.F.; Zhang, Y.; Li, B. Study and application of bolt-mesh-shotcreting support technology in thick coal seam with large section roadway. Coal Eng. 2015, 47, 37–39. [Google Scholar]
  8. Siddall, R.G.; Gale, W.J. Strata control: A new science for an old problem. In Proceedings of the Annual Joint Meeting of the Institution of Mining Engineers and the Institute of Mining and Metallurey, Harrogate, UK, 1 June 1992. [Google Scholar]
  9. Gale, W.J. Design approach to assess coal mine roadway stability and support requirements. In Proceedings of theVIII Australian Tunnelling Conference, Sydney, Australia, 24–26 August 1993. [Google Scholar]
  10. БОРИСОВЕЦ, В.А. Неoднoрoднoсти вoлнoвoгo характера в пoрoдах вблизи вырабoтoк, сooружаемых бурoвзрывным спoсoбoм. Шахтнoе Стрoйтельствo 1972, 9, 7–11. [Google Scholar]
  11. Li, S.C.; Wang, H.; Qian, Q.H.; Li, S.C.; Fan, Q.Z.; Yuan, L.; Xue, J.H.; Zhang, Q.S. In-situ monitoringresearch on zonal disintegration of surrounding rock mass in deepmine roadways. Chin. J. Rock Mech. Eng. 2008, 27, 1545–1553. [Google Scholar]
  12. He, Y.N.; Zhang, H.Q. Discussion on theory and practice of zonal disintegration in surrounding rocks of deep roadways. Chin. J. Rock Mech. Eng. 2008, 27, 2369–2375. [Google Scholar]
  13. Li, S.P. Observation of coal roadway roof bolt tests at 3109 mechanized section at Quantai Mine: Characterstics of coal roadway roof bolts and new viewpoints on the choice of roof bolt parameters. J. China Inst. Min. Technol. 1979, 19–57. [Google Scholar]
  14. Wang, W.J.; Hou, C.J. New development of mechanism and control technique study of extraction opening floor heave. Xiangtan Min. Inst. 2003, 18, 1–6. [Google Scholar]
  15. Hou, C.J.; Gou, P.F. Mechanism study on strength enhancement for the rocks surrounding roadway supported by bolt. Chin. J. Rock Mech. Eng. 2000, 19, 342–345. [Google Scholar]
  16. Hou, C.J.; Gou, P.F. Theoretical study on strength enhancement for the rocks surrounding roadway supported by bolt. Coal Mine Support 2001, 5, 1–4. [Google Scholar] [CrossRef]
  17. Huang, Q.X.; Liu, Y.W. Ultimate self-stable arch theory in roadway support. J. Min. Saf. Eng. 2014, 31, 354–358. [Google Scholar]
  18. Zhou, Y.; Zhang, X.Y. Excavation Analysis and Research to Underground Caves. J. Guangzhou Univ. 2001, 15, 7–10. [Google Scholar]
  19. Do, N.-A.; Dias, D.; Oreste, P.; Djeran-Maigre, I. 2D Tunnel Numerical Investigation: The Influence of the Simplified Excavation Method on Tunnel Behaviour. Geotech. Geol. Eng. 2014, 32, 43–58. [Google Scholar] [CrossRef]
  20. Hu, H.S.; Peng, Z.B. Numerical analysis on pull-out characteristic of wholly grouted cable. Sci. Technol. Rev. 2011, 29, 52–55. [Google Scholar]
  21. Xu, D.; Shao, L.T. Numerical analysis of bolt pullout based on elastic-perfectly plastic model. Chin. J. Undergr. Space Eng. 2011, 7, 1583–1588. [Google Scholar]
  22. Gao, P.B. The Study on Evolution Characteristics of Deformation Field of Anchorage System. Master’s Thesis, North China University of Technology, Beijing, China, 2017. [Google Scholar]
Figure 1. Layout of working face 31305.
Applsci 15 10327 g001
Figure 2. Fracture process of surrounding rock in unsupported roadway. Note: (a) the intact state of surrounding rock of the excavated roadway; (b) the roadway began to fracture from its four corners; (c) fracture extends from the roadway corner into the deeper regions of the surrounding rock; (d) intersection of fracture surfaces; (e) the state of conjugate compression-shear failure within the roadway sidewalls; (f) vertical fracture extends within the roadway sidewalls; (g) vertical fractures within the roadway sidewalls extended downward to the floor; (h) the left sidewall of the roadway undergoes conjugate compressive-shear failure bounded by the vertical fracture extending to the floor and the vertical fracture on the right sidewall extends toward the roof; (i) the conjugate compressive-shear failure initiated along the vertical fracture extended to the roof in the right sidewall of the roadway; (j) vertical fractures start to develop from the intersection point of the conjugate fractures in the left sidewall of the roadway; (k) the vertical fracture in the left sidewall of the roadway extends to the roof and floor; (l) shear-compression conjugate failure initiates within the roadway roof.
Applsci 15 10327 g002
Figure 3. Zonal fracture of the surrounding rock in the roadway.
Applsci 15 10327 g003
Figure 4. Failure process of surrounding rock in bolt supported roadway. Note: (a) State of intact surrounding rock in rock bolt supported roadway; (b) The fractures in roadway surrounding rock extend from the corners both horizontally and vertically into the deeper regions of the rock mass; (c) the surrounding rock of the tunnel commenced failure process at the end of the rock bolt; (d) the deformation of the surrounding rock causes the rock bolts to bend.
Applsci 15 10327 g004
Figure 5. Displacement field of surrounding rock in unsupported roadway.
Applsci 15 10327 g005
Figure 6. Damage state of surrounding rock in roadway after excavation. Note: (a) Unsupported; (b) Bolt supported.
Applsci 15 10327 g006
Figure 7. Schematic of rock compression guided by bolts.
Applsci 15 10327 g007
Figure 8. Stress state of surrounding rock on the surface of the roadway after excavation. Note: (a) Stress state of roadway surrounding rock before excavation; (b) The alteration of stress state in surrounding rock masses following excavation in roadways; (c) Variation of Principal Stress Direction at Mine Roadway Corners.
Applsci 15 10327 g008
Figure 9. Stress state of anchorage zone affected by rock bolts. Note: (a) Stress state of surrounding rock before excavation; (b) Rock bolt support alters the stress state of surrounding rock.
Applsci 15 10327 g009
Figure 10. Layout of measurement points in the surrounding rock in the simulation.
Applsci 15 10327 g010
Figure 11. Variation in RD of internal measurement points with right-side surface displacement. Note: (a) shows the variation in RD of the 0.5 m deep measurement point; (b) shows the variation in RD of the 1.0 m deep measurement point; (c) shows the variation in RD of the 1.5 m deep measurement point; (d) shows the variation in RD of the 2.5 m deep measurement point; (e) shows the variation in RD of the 5.0 m deep measurement point; (f) shows the variation in RD of the 7.0 m deep measurement point.
Applsci 15 10327 g011
Figure 12. Variation in RD of internal measurement points with roof surface displacement. Note: (a) shows the variation in RD of the 1.0 m deep measurement point; (b) shows the variation in RD of the 5.0 m deep measurement point.
Applsci 15 10327 g012
Figure 13. Variation in RD of internal measurement points with top-corner surface displacement. Note: (a) shows the variation in RD of the 0.5 m deep measurement point; (b) shows the variation in RD of the 4.5 m deep measurement point.
Applsci 15 10327 g013
Figure 14. Variation in radial stress(RS) of internal measurement points with right-side surface displacement. Note: (a) shows the variation in RS of the 0.5 m deep measurement point; (b) shows the variation in RS of the 1.5 m deep measurement point; (c) shows the variation in RS of the 2.5 m deep measurement point; (d) shows the variation in RS of the 5.0 m deep measurement point.
Applsci 15 10327 g014
Figure 15. Variation in CS of internal measurement points with right-side surface displacement. Note: (a) shows the variation in CS of the 0.5 m deep measurement point; (b) shows the variation in CS of the 1.5 m deep measurement point; (c) shows the variation in CS of the 2.5 m deep measurement point; (d) shows the variation in CS of the 5.0 m deep measurement point.
Applsci 15 10327 g015
Figure 16. Variation in RS of internal measurement points with roof surface displacement. Note: (a) shows the variation in RS of the 1.5 m deep measurement point; (b) shows the variation in RS of the 2.0 m deep measurement point; (c) shows the variation in RS of the 3.0 m deep measurement point; (d) shows the variation in RS of the 5.0 m deep measurement point.
Applsci 15 10327 g016
Figure 17. Variation in CS of internal measurement points with roof surface displacement. Note: (a) shows the variation in CS of the 1.5 m deep measurement point; (b) shows the variation in CS of the 2.0 m deep measurement point; (c) shows the variation in CS of the 3.0 m deep measurement point; (d) shows the variation in CS of the 5.0 m deep measurement point.
Applsci 15 10327 g017
Figure 18. Variation in RS of internal measurement points with top-corner surface displacement. Note: (a) shows the variation in RS of the 0.5 m deep measurement point; (b) shows the variation in RS of the 3.0 m deep measurement point.
Applsci 15 10327 g018
Figure 19. Variation in CS of internal measurement points with top-corner surface displacement. Note: (a) shows the variation in CS of the 0.5 m deep measurement point; (b) shows the variation in CS of the 3.0 m deep measurement point.
Applsci 15 10327 g019
Figure 20. Distribution of advance support pressure on the working face.
Applsci 15 10327 g020
Figure 21. Layered structure of rocks surrounding a bolt-supported roadway.
Applsci 15 10327 g021
Figure 22. Anchor cables to hang the anchorage zone in the roof.
Applsci 15 10327 g022
Figure 23. Schematic of zones affected by the rock bolt. Note: (a) Influence boundary of fully grouted anchor rods; (b) conical influence boundary at unanchored segment; (c) Influence range of end-anchored or extended-anchored rock bolts.
Applsci 15 10327 g023
Figure 24. Support parameters for the conveyor belt roadway.
Applsci 15 10327 g024
Figure 25. Displacement of roadway surfaces.
Applsci 15 10327 g025
Figure 26. Monitoring the separation of the roof with multi-point displacement meters.
Applsci 15 10327 g026
Figure 27. Bed separation in the roof.
Applsci 15 10327 g027
Figure 28. Bolt force monitoring.
Applsci 15 10327 g028
Figure 29. Working load on rock bolts.
Applsci 15 10327 g029
Figure 30. Working load on anchor cables.
Applsci 15 10327 g030
Table 1. Lithologies and characteristics of coal seam roof and floor.
Roof and FloorLithologyThickness (m)
Minimum–Maximum
Average
Characteristics
Main roofFine-grained and medium-grained sandstones and siltstone7.25–33.6
22.9
Grey, composed primarily of quartz, with less feldspar.
Immediate roofSandy mudstone and mudstone0–7.03
3.19
Grey, massive, with even fracture.
False roofSandy mudstone 0–0.15Grey, massive, with even fracture.
Immediate floor Mudstone, carbonaceous mudstone and sandy mudstone 0.36–14.8
5.48
Grey, massive, with even fracture.
Main floorCoarse-grained and medium-grained sandstone 0.6–3.9
1.48
Greyish white, composed primarily of quartz, with less feldspar.
Table 2. Section parameters of the main roadway in the working face 31305.
RoadwayExcavation Width (m)Net Width (m)Excavation Height (m)Net Height
(m)
Excavation Cross-Sectional Area (m2)Net Cross-Sectional Area
(m2)
Main haulage roadway5.85.64.03.723.220.72
Auxiliary haulage roadway 5.25.04.03.620.818.0
Tailgate5.25.04.03.620.818.0
Main open-off9.49.24.33.940.4235.88
Auxiliary open-off5.25.04.03.720.818.5
Main withdrawal roadway5.65.44.64.225.7622.68
Auxiliary withdrawal roadway5.25.04.03.720.818.5
Table 3. In situ stress measurements.
Observation PointDepth (m)Principal Stress
Principal StressMagnitude (MPa)Azimuth (°)Dip (°)
1459.7σ126.36136.06.9
σ218.1256.7−76.2
σ311.35217.7−11.9
2458.4σ125.75124.08.2
σ217.2916.381.4
σ312.46224.0−2.5
Table 4. Physical and mechanical parameters of rock strata.
StrataLithologyDensity (g/cm3)Elastic Modulus (GPa)Poisson’s Ratio (µ)Angle of
Internal
Friction (°)
Cohesion (MPa)Tensile Strength (MPa)
RangeAvg.RangeAvg.RangeAvg.RangeAvg.
Main roofMedium-fine sandstone2.68–2.722.721.1–34.226.30.13–0.180.15307.21.81–4.743.26
Immediate roofSandy mudstone2.45–2.482.4311.1–12.011.60.16–0.250.2238.23.761.18–1.691.43
Coal seamCoal1.27–1.331.38.47–10.539.50.3–0.330.3126.64.71.15–2.231.87
Immediate floorSandy mudstone2.51–2.572.5413.3–17.515.20.18–0.220.2132.55.61.96–3.832.66
Main floorMedium-coarse sandstone2.62–2.642.6322.1–27.024.40.12–0.150.13357.282.23–3.512.92
Table 5. Material parameters of support devices for the gateway.
DeviceMaterial Parameters
Rock boltHRB335 steel bolt (φ22 mm), with a left-handed thread and no longitudinal rib
Anchor cableAnchor cable (φ17.8) formed of steel strands, with tensile strength of 1860 MPa or greater.
BeamBeam made of round steel rods, trapezoidal in cross-section
Wire meshWelded wire (φ6.5) mesh with 100 × 100 mm square opening
Rock bolt trayDished Q235 steel tray, 150 × 150 × 8 mm
Anchor cable traySquare Q235 steel tray, 300 × 300 × 16 mm
Anchor cable riggingM18
Anchoring capsule for rock bolt/anchor cableMS CK2360 resin anchoring agent, φ23 mm × 600 mm
Table 6. Common methods for designing rock bolt support parameters.
Design MethodCalculation
Result
Formula Calculation
Explanation
Remarks
Combined beam theoryLf1 = 2.3 m
Ls1 = 2.30 m
Llrb1 = 0.47 m
Lf = Ls ≥ L2 + L3 + L4

L 2 0.5 × B K 1 q σ t
L l r b 1.4472 d L 2 τ k 1 q B
B is the width of the roadway, taken as 5.8 m;
K1 is the safety factor, taken as 5.0;
q is the load of the composite beam, calculated as 0.176 MPa based on the maximum thickness of immediate roof;
σt is the tensile strength of the composite beam rock mass, taken as 2.26 MPa;
τ is the shear strength of therock bolt, taken as 400 MPa;
K2 is the shear safety factor of the roof, taken as 3.0.
Dome theoryLf2 = 2.55 m
Ls2 = 2.50 m
Llrb2 = 1.02 m
Lf ≥ b + L3 + L4
b = a 1 f = a + H tan ( 4 5 0 ϕ 2 ) f
Ls ≥ a0 + L3 + L4
L lrb     Q K b γ
Applsci 15 10327 i001
2a is the width of the gateway, taken as 5.8 m;
H is the height of the gateway, taken as 4.0 m;
The internal friction angle of the coal seam is denoted as φ, with a value of 26.1°;
F is the strength coefficient of Proctor rock, which is taken as 3.1;
Q is the anchoring force of the rock bolt, taken as 100 kN;
K3 is a security factor, set to 2.0;
γ is the bulk density of the direct roof rock mass, taken as 25.4 kN/m3.
“Chinese Coal Mines Technical Specifications” for Roadway Support with Rock BoltsLf2 = 2.3 m
Ls2 = 2.3 m
Llrb2 = 1.05 m
Lf = 1.6~3.0 m
Ls = 1.6~3.0 m
Llrb = 0.6~1.5 m
Take the average of the recommended values for each parameter.
Disclaimer/Publisher’s Note: The statements, opinions and data contained in all publications are solely those of the individual author(s) and contributor(s) and not of MDPI and/or the editor(s). MDPI and/or the editor(s) disclaim responsibility for any injury to people or property resulting from any ideas, methods, instructions or products referred to in the content.