1. Introduction
The United States Geological Survey [
1], using a geology-based probabilistic approach, has estimated that substantial quantities of undiscovered oil and gas may exist in 33 regions worldwide, including extreme environments such as the Arctic. Permafrost in the Arctic exhibits thermal and mechanical properties that differ markedly from those of temperate soils, thereby posing significant challenges for infrastructure development and resource extraction.
Frozen soils consist of four phases: soil particles, water, air, and ice. As ground temperature decreases, pore water transforms into ice, enhancing interparticle bonding and increasing soil strength. Nevertheless, a fraction of pore water remains unfrozen even below 0 °C. Overall, the strength of permafrost generally increases with decreasing temperature, a trend attributed to stronger ice bonding and reduced unfrozen water content [
2,
3]. Although numerous empirical models have been proposed to estimate the strength of frozen soils, their applicability is constrained by the variability of soil properties and reliance on site-specific data [
4]. Consequently, laboratory freezing tests on field-collected samples are essential, as unfrozen water content and soil strength vary with soil type, particle size distribution, and salinity, even under identical freezing conditions [
5].
The presence of organic matter further complicates soil behavior under freezing conditions. In the Canadian oil sands, particularly Alberta, soils frequently contain relatively high organic contents. Organic soils exhibit distinct thermal, mechanical, and hydraulic properties depending on the amount and type of organic matter [
6]. Typically fibrous and undecomposed, they retain large amounts of water, display high expansiveness, and undergo considerable shrinkage upon dehydration. Previous studies have reported organic matter contents ranging from 0.6% to 10.1% in northeastern British Columbia [
7], 3.35–6.63% in eastern Canada [
8], and 2.3–7.3% with a mean of 4.2% in other regions [
9]. While contents exceeding 10% are generally considered problematic in geotechnical applications, even smaller amounts may hinder soil improvement when chemical additives are used [
10]. Therefore, investigating soil behavior across a wide spectrum of organic contents is essential under both frozen and unfrozen conditions.
Recent studies have further emphasized the influence of organic matter on permafrost behavior. Ref. [
11] quantitatively demonstrated that organic matter and soil moisture strongly affect freeze–thaw dynamics, underscoring the importance of linking laboratory investigations with field-scale observations to advance the understanding of frozen soil behavior in cold regions. Freeze–thaw effects on rocks have also been extensively investigated, providing important context for cold-region geotechnics. For instance, ref. [
12] demonstrated the progressive strength degradation of natural stones subjected to repeated freeze–thaw cycles and proposed an empirical model for durability prediction. Similarly, ref. [
13] showed that microcrack propagation during freeze–thaw cycling leads to significant strength loss in sandstone and developed a constitutive model to describe this process. These findings provide valuable insights into freeze–thaw degradation mechanisms and highlight the necessity of comparing soil and rock responses under freezing and freeze–thaw conditions.
While previous studies have utilized empirical and semi-empirical models to estimate the unfrozen water content and freezing behavior of soils, recent advancements have demonstrated significant benefits of machine learning approaches. For instance, ref. [
14] conducted a comparative analysis of machine learning techniques, including RF and XGB, to accurately predict unfrozen water content in frozen soils, finding improved precision over traditional models. Ref. [
15] used PSO-optimized machine learning models (ANN, RF, XGB, SVM) to predict changes in thermal conductivity under freeze–thaw cycles, achieving high R
2 (>0.95) and demonstrating model stability via Monte Carlo simulation. In the domain of mechanical behavior, ref. [
16] utilized artificial neural networks to model stress–strain behavior of frozen sandy soil under varying temperature and confining pressure, delivering highly accurate predictions. These recent studies reinforce the effectiveness of ensemble and neural-network-based machine learning methods in capturing complex physical processes in frozen soils.
Against this background, the present study conducted a series of laboratory experiments on soils collected from Alberta, Canada, and Gangwon Province, South Korea, to evaluate the thermal and mechanical behavior of permafrost with varying organic matter contents. The unfrozen water content, which governs soil strength, long-term deformation, and freezing duration, was measured over time at different subzero temperatures. Based on these results, a dataset was established, and machine learning models were developed to predict the freezing behavior of soils with different organic matter contents.
2. Materials and Methods
2.1. Materials
In this study, organic soil samples were collected from two oil sands extraction sites located in the Athabasca region of Alberta, Canada. For comparative analysis, additional samples were obtained from the Gangneung area in Gangwon Province, South Korea. All field samples were carefully collected after removing the topsoil layer, with efforts made to preserve their in-situ structure as much as possible. In particular, organic-rich soils from the Gangneung region were selected to simulate and compare with the Canadian samples, including organic permafrost soil types.
Soil sample #1 was collected from the southern area of Conklin, located in the eastern part of central Alberta, along the southern boundary of the Athabasca oil sands deposit. This area hosts the Kirby in-situ project for oil and gas production and is dominated by temperate to subarctic coniferous forests. The soil consists of organic and Luvisolic soils, commonly found in forested regions of Canada and categorized as organic soils. Soil sample #2 was collected from an area near Fort McMurray, also within the Athabasca oil sands region, where major oil sands companies such as Canadian Natural Resources Limited (CNRL), Suncor, Syncrude, Husky Energy, and Sunrise Energy operate. The region is part of the boreal forest zone, characterized by the presence of lichens due to extremely low winter temperatures, and the soils are primarily composed of organic matter. Soil sample #3 was obtained from an organic-rich soil site in the Gangneung area of South Korea, selected for its similar characteristics to the Canadian samples. The site is underlain by light-colored granite and has sparse vegetation. Samples were collected after removing approximately 10 cm of surface soil.
Basic physical properties of the collected samples were assessed, as summarized in
Table 1 [
17]. All three samples showed similar specific gravity values, consistent with the typical range for soils (2.6–2.7). The liquid limit and plastic limit tests were conducted using dried soil passing through a no. 40 sieve. The liquid limit was determined using the fall cone test, and the plastic limit was measured according to ASTM D 4318 [
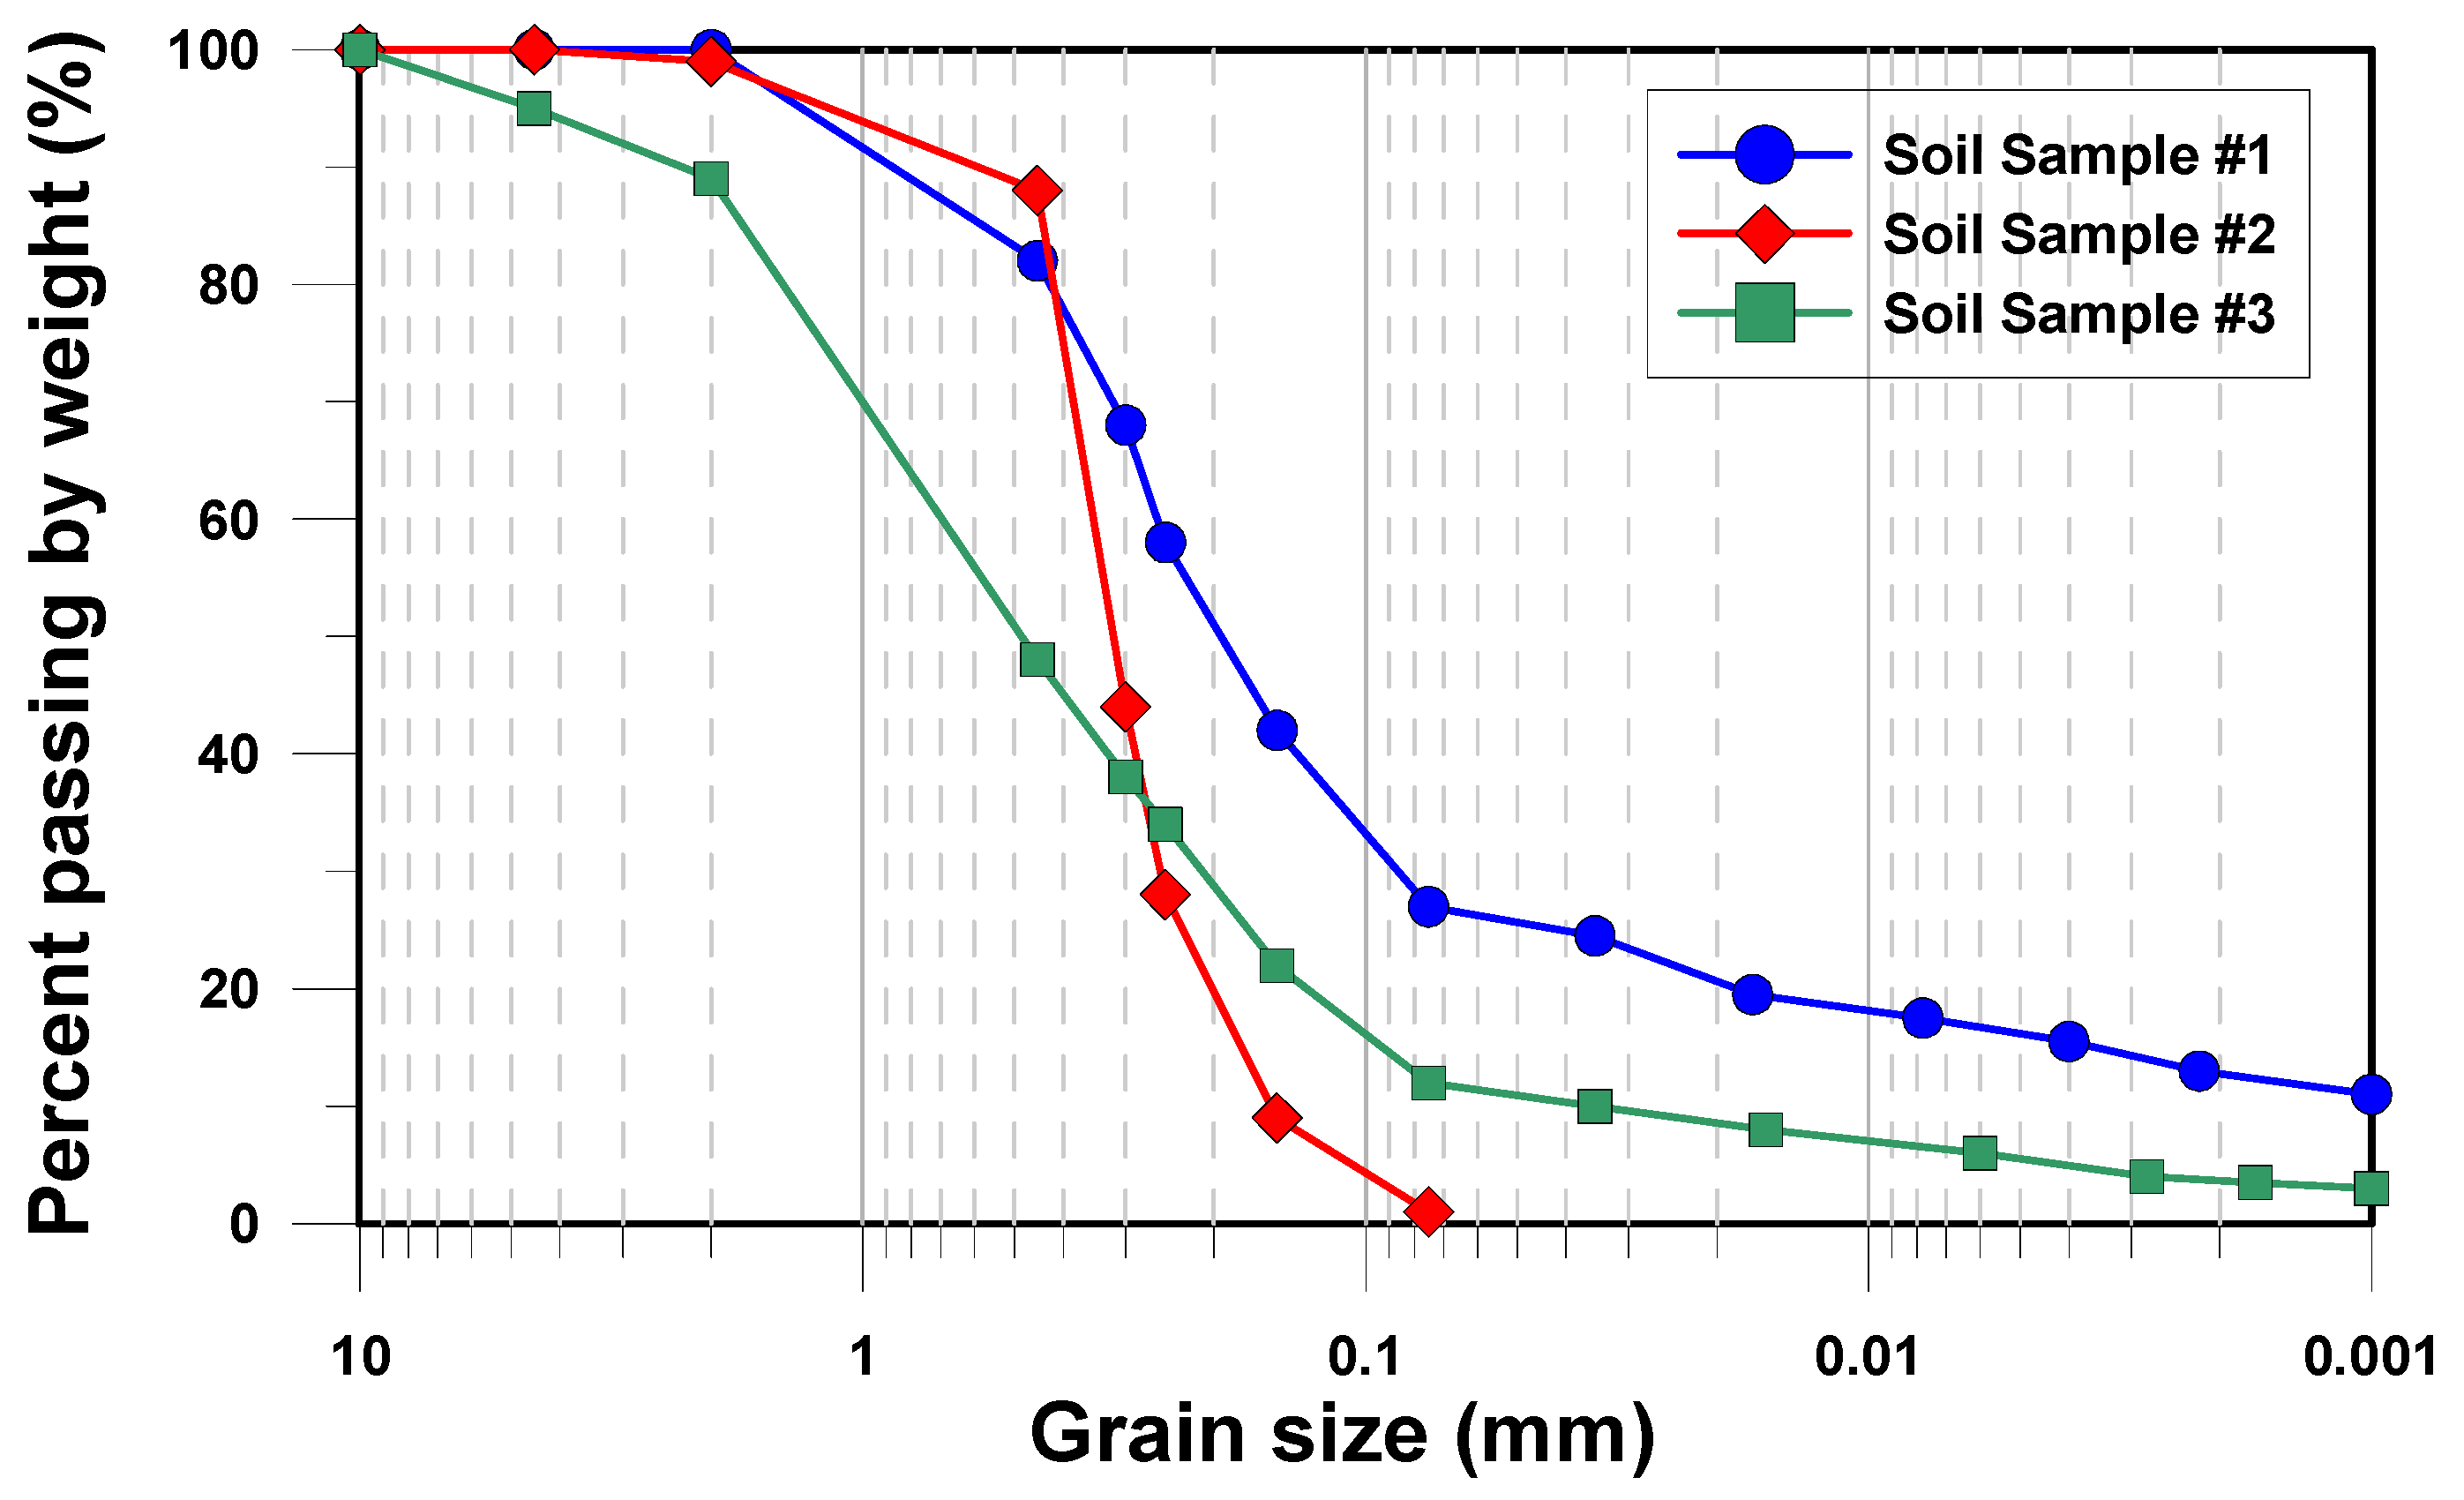
18]. The water content was measured at three vertical levels (top, middle, and bottom) of the approximately 50 cm-high core samples, and the average value was used for analysis. Based on the Unified Soil Classification System (USCS), soil sample #1 was classified as clayey sand (SC), soil sample #2 as poorly graded sand (SP), and soil sample #3 as clayey sand (SC), as shown in
Figure 1.
2.2. Organic Properties of Soil Samples
Carbon is commonly employed as a surrogate indicator for estimating soil organic matter (OM) content, owing to its predominance among organic constituents and the relative simplicity of its quantification. According to the National Institute of Agricultural Sciences [
19], analytical methods for determining soil organic carbon can be broadly categorized into wet oxidation and dry combustion techniques. Wet oxidation includes the Tyurin method and the Walkley–Black method, whereas dry combustion encompasses elemental analysis and the loss-on-ignition (LOI) method. The Tyurin method is a conventional chemical oxidation approach in which a soil sample is treated with a heated mixture of concentrated sulfuric acid (H
2SO
4) and potassium dichromate (K
2Cr
2O
7). The amount of oxidizing agent consumed during the reaction serves as the basis for estimating the organic carbon content. The Walkley–Black method, which operates on a similar principle, utilizes the exothermic heat generated by the chemical reaction itself, eliminating the need for external heating. While this simplifies the procedure and requires less equipment, incomplete oxidation may occur, potentially leading to the underestimation of organic matter. The elemental analyzer method involves complete combustion of the sample followed by direct measurement of the resulting gases to determine carbon concentration. This method offers high accuracy and speed; however, it necessitates costly instrumentation and regular maintenance. Alternatively, the LOI method, adopted in this study, estimates organic matter content by calculating the mass loss after high-temperature combustion. Due to its procedural simplicity, cost efficiency, and broad applicability to diverse soil types, the LOI method is widely used in soil science.
The initial organic matter content of each soil sample was determined using the LOI method in accordance with ASTM D 2974 [
20]. All measurements were performed on a dry weight basis. Samples were oven-dried at 90 ± 5 °C to remove moisture prior to combustion, thereby preventing thermal degradation of organic components. Subsequently, the samples were combusted at 440 ± 40 °C for a minimum of five hours, and the OM content was calculated as the difference in mass before and after combustion. Each sample was tested six times, and the average value was reported. The results indicate that the organic matter content was 1.11% for soil sample #1, 0.63% for soil sample #2, and 4.59% for soil sample #3.
2.3. Experiment Procedure of Mechanical Soil Behavior
This study investigates the influence of organic matter content on the geomechanical behavior of permafrost soils through a series of laboratory experiments. Two principal tests were conducted: the standard Proctor compaction test and uniaxial compression tests under subzero temperatures. Soil samples were collected from the central region of Alberta, Canada, where native soils typically contain less than 5% organic matter, excluding black chernozemic soils [
21]. To standardize the initial conditions and eliminate variability associated with naturally occurring organic matter, all soil samples were combusted in a muffle furnace at 440 ± 40 °C for a minimum of five hours. Following this treatment, controlled amounts of Canadian peat moss, widely used in horticultural and geotechnical applications, were added to achieve target organic matter contents of 0.0%, 1.5%, 3.0%, and 4.5%. The organic matter content of the peat moss was verified using the loss-on-ignition method and averaged 99.44%, though, for practical purposes, it was assumed to be 100% in the mixing calculations. It should be noted, however, that, while this approach ensured the consistent control of organic matter content, the addition of peat moss may not fully reproduce the heterogeneous composition and varying decomposition states of natural organic soils, and thus could potentially influence soil structure and properties.
The standard Proctor compaction tests were performed in accordance with ASTM D698 [
22] to evaluate the compaction characteristics of each mixture. A 2.5 kg rammer and a cylindrical mold with an internal diameter of 10 cm were used. Each specimen was compacted in three layers, with 25 blows per layer. The resulting data were then analyzed to determine the optimum moisture content and maximum dry density as a function of organic matter content.
The uniaxial compression tests were carried out on frozen cylindrical specimens to simulate permafrost conditions. The specimens were prepared using a custom-fabricated mold to achieve dimensions of 50 mm in diameter and 100 mm in height, with a target dry unit weight of 1.5 g/cm
3, as shown in
Figure 2. After compaction, deionized water was introduced from the bottom of the mold via a control valve to fully saturate the specimens. The saturated samples were then demolded, sealed with polyethylene wrap to minimize moisture evaporation, and frozen at constant temperatures of −5 °C, −10 °C, and −15 °C for at least 24 h. To minimize thermal gradients and prevent external heat transfer during handling and testing, each specimen was placed in a thermally insulated case made of MC nylon, a material with low thermal conductivity. The cases and specimens were stored together in the freezer to ensure thermal equilibrium prior to testing. During the test, the case was vacuum sealed to prevent internal moisture loss and external temperature fluctuation, as per the method described by [
23]. The frozen specimens were subjected to uniaxial compression testing using a universal testing machine. All tests were performed at a constant strain rate of 1% per minute. Load and displacement data were continuously recorded and used to generate stress–strain curves for each specimen. These results were then analyzed to assess the influence of varying organic content and freezing temperature on the strength characteristics of the permafrost soil.
2.4. Freezing Experiment Setup
Unfrozen water is defined as the portion of pore water that remains in a liquid state even at subzero temperatures, generally expressed as the ratio of unfrozen water to the total water content. Its magnitude is governed by multiple factors, including the freezing temperature, soil fabric, degree of saturation, compaction state, and initial water content [
25]. The presence of unfrozen water weakens interparticle bonding and facilitates the development of ice lenses through capillary forces, which in turn leads to a reduction in the strength of frozen soils [
26,
27]. Therefore, a comprehensive understanding of unfrozen water behavior and its influence on soil strength is fundamental to the assessment of the mechanical and engineering performance of frozen ground. Time domain reflectometry (TDR), which determines volumetric water content by exploiting the dependence of dielectric properties on soil moisture, has been extensively utilized for quantifying unfrozen water content in soil samples [
28].
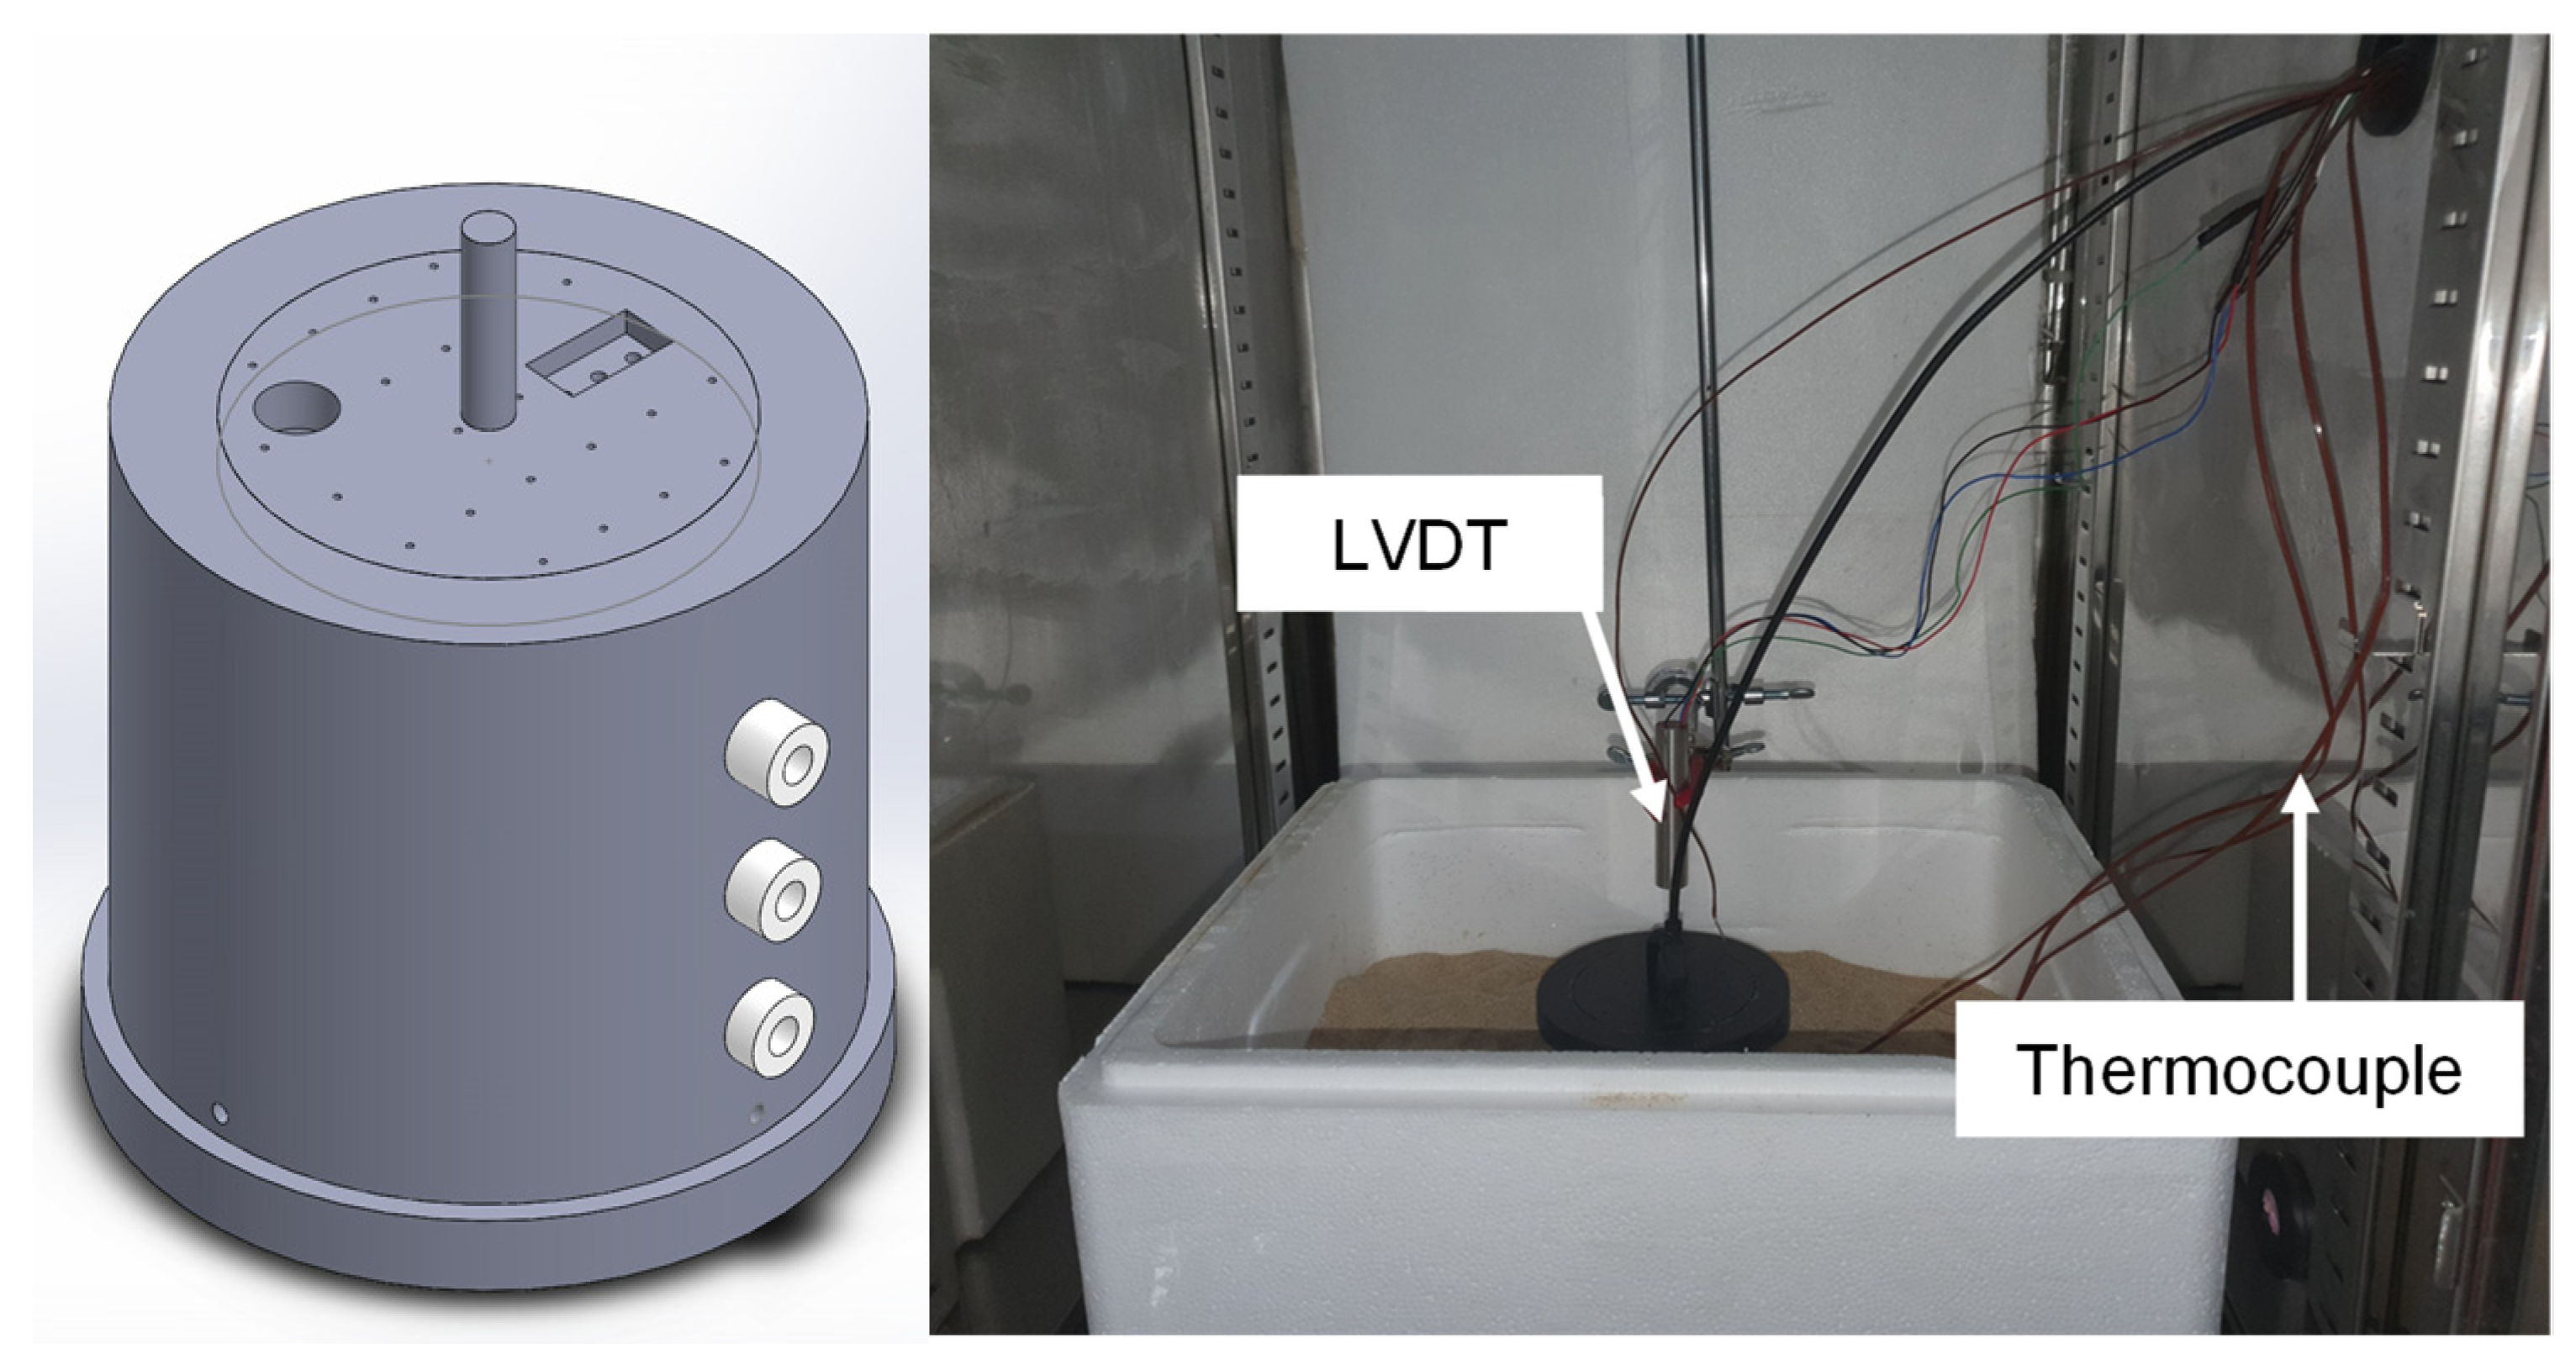
In this study, a cylindrical mold with a diameter and height of 10 cm was fabricated for the purpose of measuring the unfrozen water content, as shown in
Figure 3. To minimize friction between the mold and the sample, MC nylon was used as the mold material. Thermocouples were installed at three vertical positions—2 cm, 5 cm, and 8 cm from the base of the mold—to continuously monitor the temperature distribution within the sample during the freezing process. A time domain reflectometry (TDR) probe was positioned at the top of the mold to measure the unfrozen water content in the sample. The freezing chamber temperature was set to −5 °C, −15 °C, and −30 °C to assess the freezing water content under different thermal conditions. Prior to the measurements, the TDR probe was calibrated for volumetric water content and dielectric constant. The permittivity was then measured using the TDR probe at varying volume fractions of the sample, and the results obtained from the TDR tests were used to calculate the dielectric constant for each fraction [
29].
2.5. Experimental Conditions
To quantify the unfrozen water content in permafrost samples under varying thermal conditions, a series of laboratory freezing tests was conducted using a controlled freezing chamber set at three target temperatures: −5 °C, −15 °C, and −30 °C. Vertical frost heave was monitored using a linear variable differential transformer (LVDT) installed at the top of the specimen mold, allowing precise measurement of sample expansion associated with phase transitions and water migration during freezing. To replicate the one-dimensional heat transfer conditions typical of field permafrost environments, the molds were embedded in Jumunjin standard sand, which acted as an insulating medium to suppress lateral heat flow and promote vertical freezing from the top surface downward. This configuration was intended to approximate natural freezing behavior under field-like thermal gradients.
In addition to a thermocouple embedded within the soil specimen for internal temperature monitoring, an additional thermocouple was positioned above the mold to continuously record ambient chamber temperature throughout the test. All measurements were continued until thermal stabilization was confirmed, defined as the point at which the internal temperature profile reached a steady state. Freezing tests were performed under natural moisture conditions corresponding to in-situ water contents. In most cases, the samples exhibited noticeable heave during the freezing process, except for soil sample #1 at −5 °C and −15 °C, where expansion was negligible. Due to the thermal insulation along the mold’s lateral surfaces, the progression of the freezing front followed a top-down sequence, with the top, middle, and bottom layers freezing consecutively. Although fluctuations in chamber temperature were observed due to intermittent operation of the cooling system, the average measured temperatures closely approximated the respective set-points.
3. Ensemble Learning Prediction Model
In this study, ensemble learning techniques were employed to predict the volumetric water content (θ) of soils under freezing conditions. Random forest (RF) and extreme gradient boosting (XGB) were selected to represent parallel (bagging-based) and sequential (boosting-based) ensemble learning methods, respectively. The database obtained from the experimental study was first introduced in this section, followed by an introduction to RF and XGB. The methodology of obtaining predictor importance using the developed ML models was also introduced.
3.1. Dataset
A total of 597 data points observed in the laboratory experiment were used to develop ensemble learning models in this study. The dataset includes the thirteen predictors composed of time (X1), chamber temperature (X2), and geotechnical properties (X3–X13) found in
Section 2.2.
Table 2 summarizes the statistical descriptions of the dataset used in developing two ensemble learning models.
3.2. Random Forest Algorithm
The RF algorithm is one of the most frequently used bagging-based ensemble learning algorithms [
30,
31], because it shows high performance in many applications. For a given input predictor vector x, the RF model generates N independent decision trees using bootstrap sampling of the training dataset and random feature selection at each split. The final prediction is obtained by averaging the predictions of the individual trees, expressed as follows:
where
denotes the prediction of the
i-th decision tree, and
N indicates the total number of trees in the forest.
The advantages of RF include its robustness against noise, its ability to capture nonlinear relationships, and its suitability for high-dimensional datasets. In addition, RF provides estimates of feature importance by evaluating the mean decrease in impurity across all trees, enabling an assessment of the relative contribution of each predictor to the freezing behavior of soils.
3.3. Extreme Gradient Boosting
The XGB is one of the most powerful sequential learning algorithms, first introduced by [
28]. In this study, the decision tree was adopted as the weak predictor, and the training process was terminated once all trees had been incorporated into the ensemble. Unlike random forest, which generates trees independently, XGB builds trees sequentially such that each subsequent tree minimizes the residuals of the previous ensemble.
The objective function of XGB can be expressed as follows:
where
represents the loss function between the observed
and predicted
values, and
is the regularization term given by the following:
Here, T denotes the number of leaves, represents the leaf weights, is the complexity penalty, and is the regularization parameter. This formulation balances model accuracy and complexity, thereby reducing the risk of overfitting.
Compared with conventional gradient boosting, XGB offers several advantages: (i) the incorporation of regularization to address overfitting, (ii) the flexibility to employ a wide range of loss functions, and (iii) efficient computational performance through parallel processing and optimized tree structures.
For model development in this study, the dataset was divided into training and test subsets at a ratio of 8:2. The training dataset was employed to construct the model, while the test dataset was used to evaluate the generalization capability of the trained ensemble.
3.4. Hyperparameter Tuning
To ensure optimal model performance, the hyperparameters of the RF and XGB models were tuned using a grid search algorithm combined with 5-fold cross-validation. The training dataset, which accounted for 80% of the entire data, was partitioned into five subsets. In each iteration, four subsets were used for training and one subset for validation, thereby minimizing bias and variance in the tuning process.
For RF, the key hyperparameters tuned included the number of estimators, maximum tree depth, and the number of features considered at each split. For XGB, the learning rate, maximum depth, subsampling ratio, and number of estimators were systematically explored. The best-performing hyperparameters were selected based on the lowest average root mean squared error (RMSE) and highest coefficient of determination (R2) across the cross-validation folds.
The optimized hyperparameters used in this study are summarized in
Table 3. This procedure ensured that the chosen parameters were not arbitrarily selected but systematically determined through an exhaustive search of parameter combinations.
3.5. Predictor Importance
The tree-based RF and XGB models provide predictor importance, which can be calculated by mean decrease impurity. The averaged total decrease in node impurity over all trees weighted by the number of data points in the node provides the importance of each predictor in predicting θ. Therefore, the predictor importance of 13 predictors for RF and XGB models was evaluated (predictor importance is dependent on the ensemble model).
4. Results and Discussion
4.1. Mechanical Behavior of Organic Soil
This study evaluated the effects of organic matter content on the compaction characteristics and unconfined compressive strength (UCS) of soils subjected to freezing conditions. The results of the standard Proctor compaction tests are presented in
Table 4. An increase in organic matter content from 0.0% to 4.5% led to a consistent reduction in the maximum dry unit weight and a corresponding increase in the optimum moisture content across all soil types. This trend was accompanied by a decrease in the curvature of the compaction curve, indicating reduced compaction efficiency. Among the three soil samples, soil sample #1 exhibited the highest dry unit weight at all organic content levels, while soil sample #3 displayed the lowest. These differences can be attributed to variations in particle size distribution, mineral composition, and plasticity index. The observed compaction behavior is in agreement with previous studies [
32,
33,
34], which found that the inclusion of organic matter, due to its low specific gravity, high compressibility, and hydrophilic nature, reduces the packing efficiency of soil particles and increases moisture demand during compaction.
The UCS test results under freezing temperatures are shown in
Table 5. All specimens exhibited an increase in strength with decreasing temperature, reflecting the strengthening effect of ice bonding within the soil matrix. Among the specimens, soil sample #2, classified as poorly graded sand (SP), demonstrated a significant increase in UCS with increasing organic matter content, particularly at −10 °C and −15 °C. This behavior is likely attributed to the enhanced water retention capacity of the added organic material, which promotes ice formation and strengthens interparticle bonding in coarse-grained soils. By contrast, soil samples #1 and #3, both classified as clayey sand (SC), showed negligible variation in UCS with organic content, suggesting that, in fine-grained soils, the presence of capillary and adsorbed water reduces the mechanical contribution of organic-bound moisture by limiting ice crystal formation. Two notably low UCS values were observed for soil sample #1 with 0.0% organic content at −10 °C and −15 °C, which deviated substantially from the general trend. These outliers are presumed to result from localized freezing inconsistencies or insufficient sample saturation and were therefore excluded from further analysis.
The current findings partially align with prior work conducted under unfrozen conditions. Ref. [
33] reported that organic-rich soils exhibit increased void ratios and more isolated grain structures, leading to reduced strength and the development of strain hardening. Similarly, ref. [
34] noted that higher organic matter and moisture contents reduce UCS in sawdust-amended soils. Ref. [
35] quantified a strength reduction of up to 43.2% in muskeg soils with increasing organic matter. However, these studies did not account for phase changes in water, and, as such, their applicability to frozen conditions is limited. In frozen soils, strength is governed not only by interparticle friction and cohesion but also by thermal–hydraulic interactions among ice, unfrozen water, and the soil skeleton. In the present study, all samples were compacted to a uniform dry unit weight of 1.5 g/cm
3, enabling a controlled comparison. The results indicate that initial moisture content, more than organic matter content alone, is the primary factor influencing UCS in frozen soils. High moisture content contributes to increased ice content upon freezing, thereby enhancing interparticle bonding and stiffness. Although organic matter indirectly affects frozen strength by modifying the soil’s moisture retention and thermal properties, its direct impact is modulated by soil type and fabric. These findings have important implications for geotechnical practice in cold regions. While organic matter must be considered in soil classification and compaction control, its effect on frozen strength varies with soil texture. In sandy soils, it may enhance strength via ice bonding, whereas in clayey soils, its contribution is minimal. Further research is recommended to evaluate freeze–thaw durability and long-term performance across a wider range of organic soils under varying thermal regimes.
4.2. Freezing Experiments
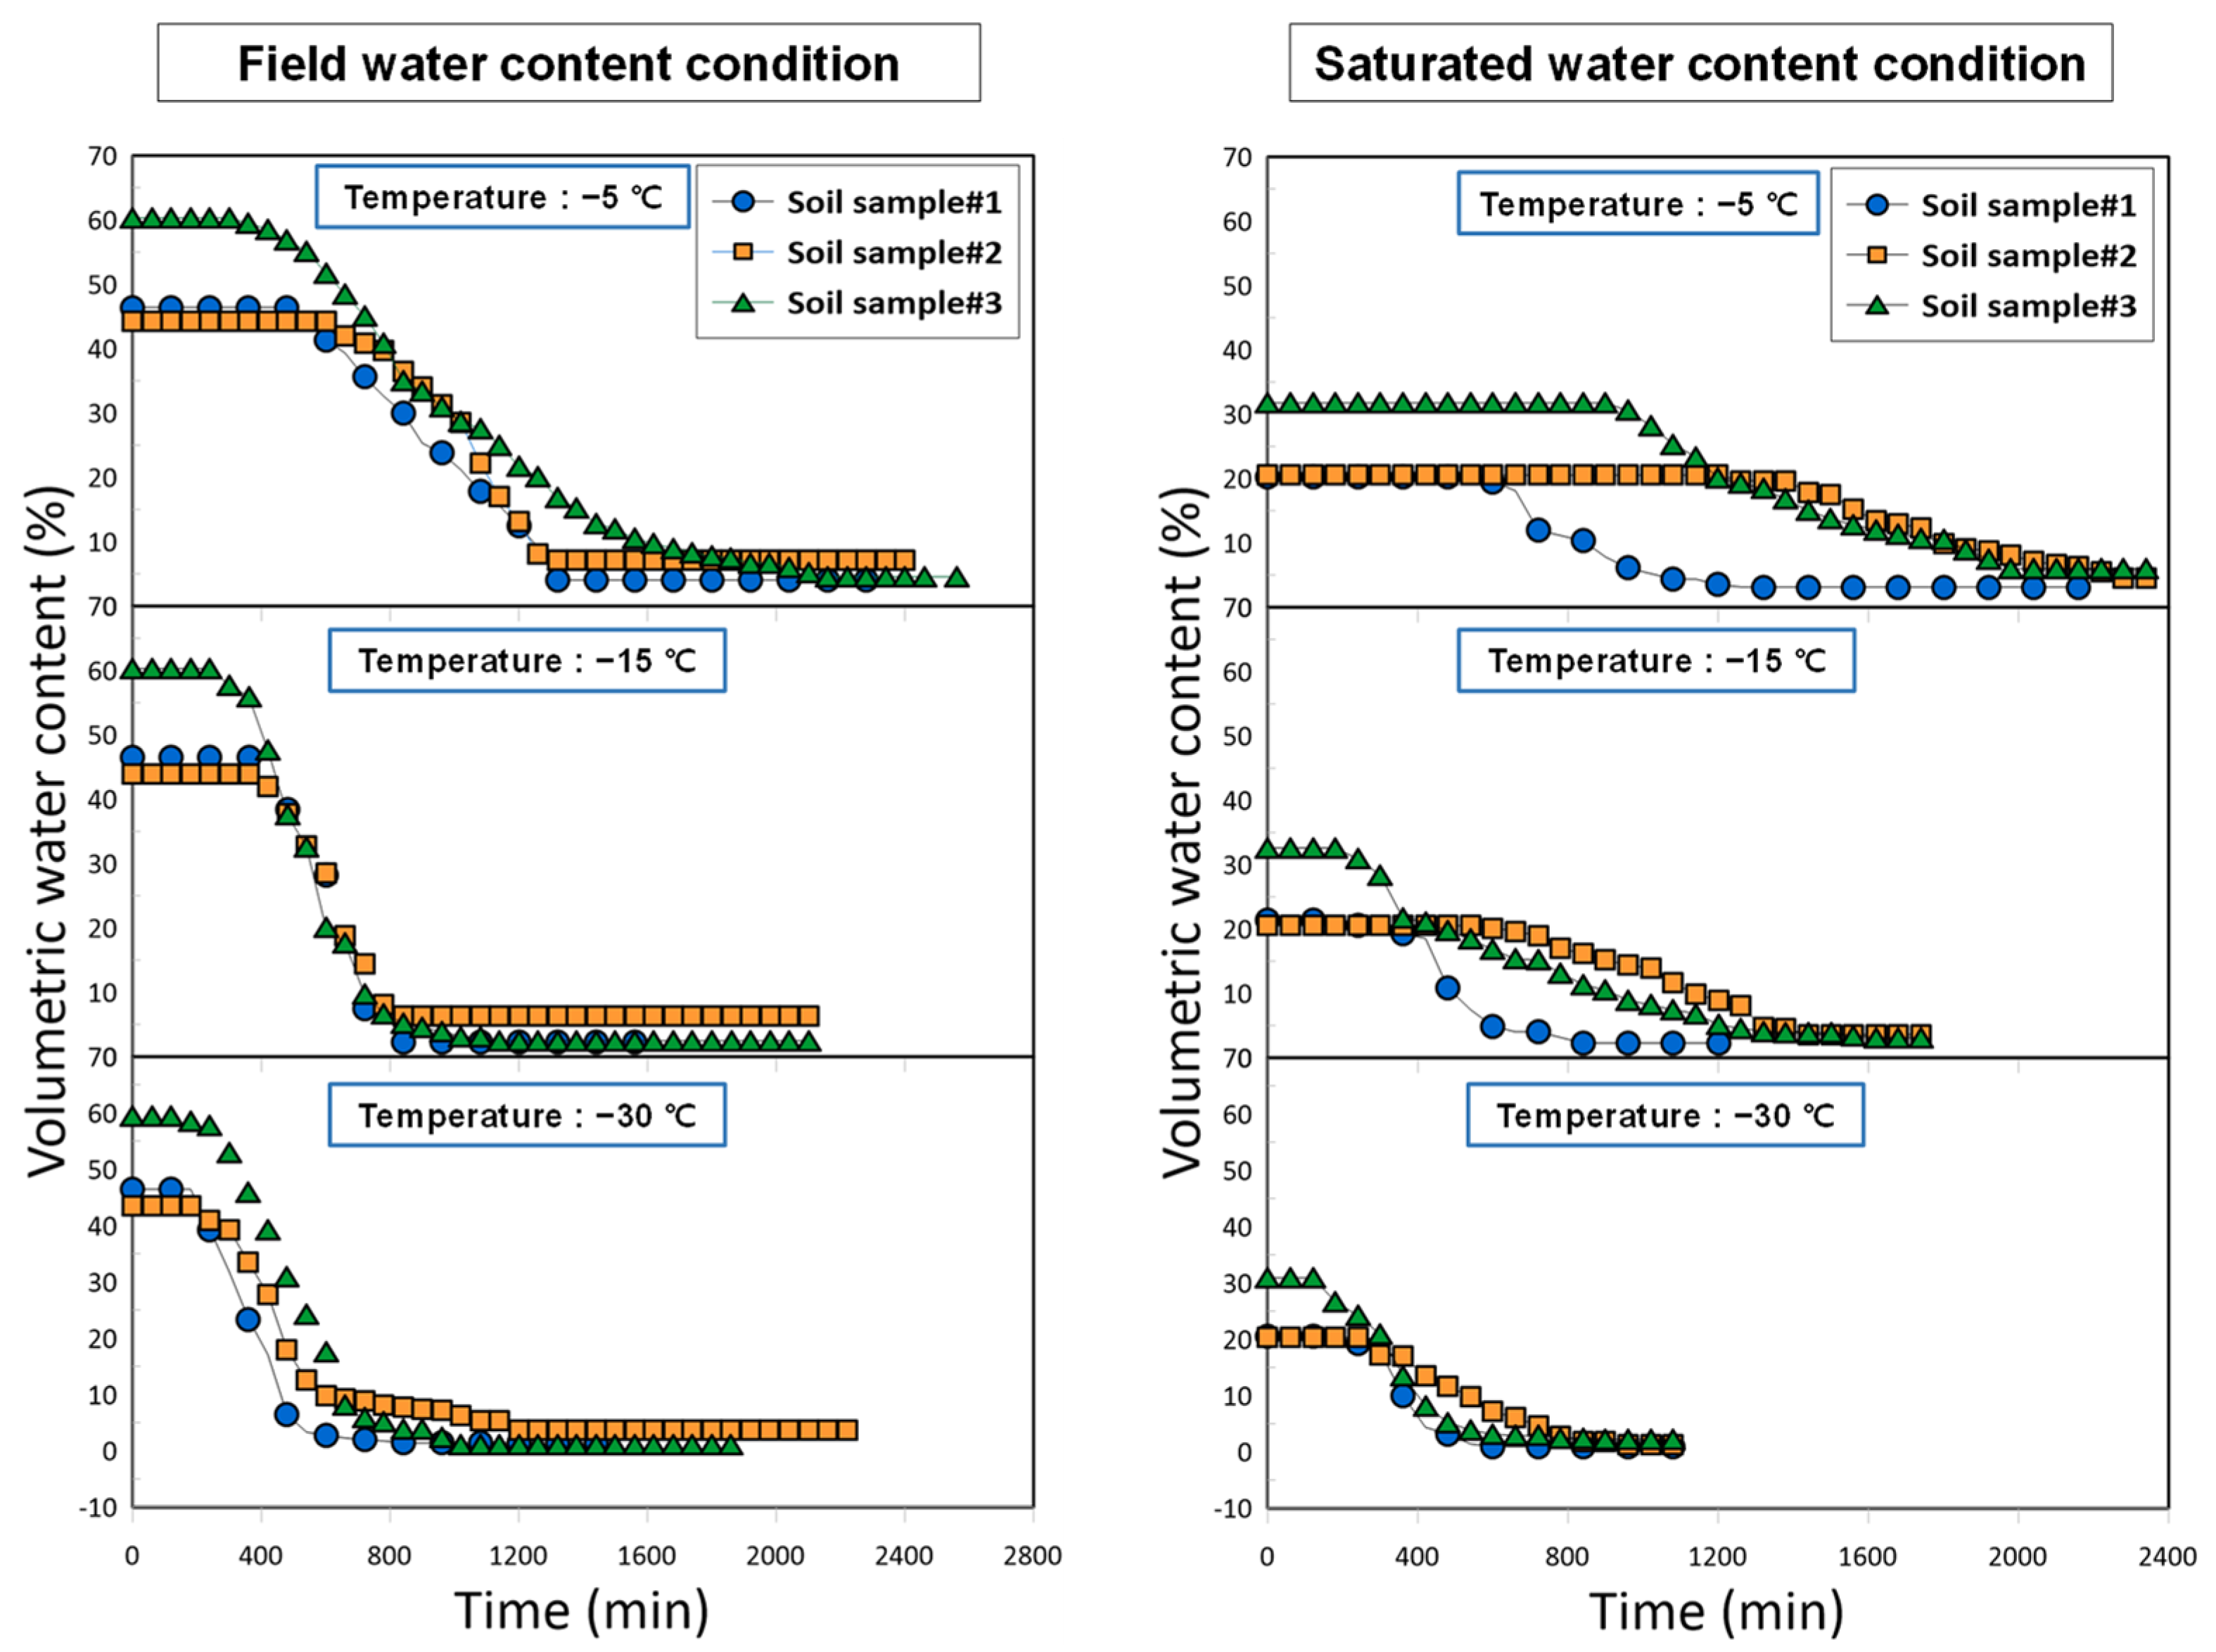
The dielectric permittivity of the permafrost samples was monitored over time using a time domain reflectometry (TDR) probe. Applying a previously established calibration curve, unfrozen water content was calculated as a function of time. Simultaneously, the volumetric deformation of the samples was recorded to assess the effects of freezing duration on sample expansion. As the temperature decreased, the pore water within the soil skeleton progressively transformed into ice, resulting in a continuous reduction in the gravimetric water content. Concurrently, the displacement recorded by the LVDT exhibited a pronounced increase, signifying the initiation of frost heave pressure, which is closely linked to the nucleation and growth of ice lenses in the pore structure [
36]. With further advancement of freezing, both the water content and frost heave pressure gradually converged to steady-state values, indicating that the soil specimen had reached a frozen equilibrium condition. At this equilibrium stage, the residual water content is defined as the unfrozen water content, representing the pore water held in micropores by adsorption and capillary forces despite subfreezing temperatures [
37]. As shown in
Figure 4, higher chamber set temperatures resulted in longer freezing times, thereby delaying the onset of unfrozen water reduction. The comparison between internal temperature data and unfrozen water content indicated that volumetric water content began to decrease once the sample temperature dropped below 0 °C. Following the completion of freezing, the unfrozen water content stabilized at an asymptotic value.
A distinct trend was observed wherein higher set temperatures yielded greater residual unfrozen water content after freezing was complete. This effect was particularly prominent in soil sample #1, which exhibited a markedly higher unfrozen water content due to its substantial fine particle content. Soil samples #1 and #3, both characterized by finer textures, required longer freezing durations and retained more unfrozen water than the coarser-textured soil sample #2. These findings suggest that, in organic-rich permafrost soils, the proportion of fine particles significantly influences both the freezing kinetics and the retention of unfrozen water. The data further imply that, under identical ambient thermal conditions, fine-grained soils are more sensitive to freezing behavior, underscoring the critical role of soil texture in governing phase change dynamics.
Temperatures at different depths within the mold were monitored using thermocouples installed inside the samples. The results indicate that freezing progressed sequentially from the top to the middle and then to the bottom of the specimen, accompanied by a gradual decrease in temperature. At higher chamber set temperatures, the freezing duration was prolonged, thereby delaying the onset of unfrozen water reduction. A decrease in volumetric water content was observed once the internal temperature of the specimen dropped below 0 °C, after which the unfrozen water content gradually stabilized. In addition, higher chamber set temperatures resulted in greater residual unfrozen water content after the completion of freezing. This effect was particularly pronounced in soil sample #1, which contained a high fraction of fine particles and exhibited a substantially larger amount of unfrozen water even after freezing was completed. These results demonstrate that soils with higher fine particle counts are more strongly influenced by ambient thermal conditions and exhibit increased sensitivity in their freezing behavior.
4.3. Performance of ML Models
The predictive performance of the RF and XGB models was evaluated using both the independent test dataset (20% of the total data) and the cross-validation results obtained during hyperparameter tuning. Model accuracy was assessed based on R2 and RMSE.
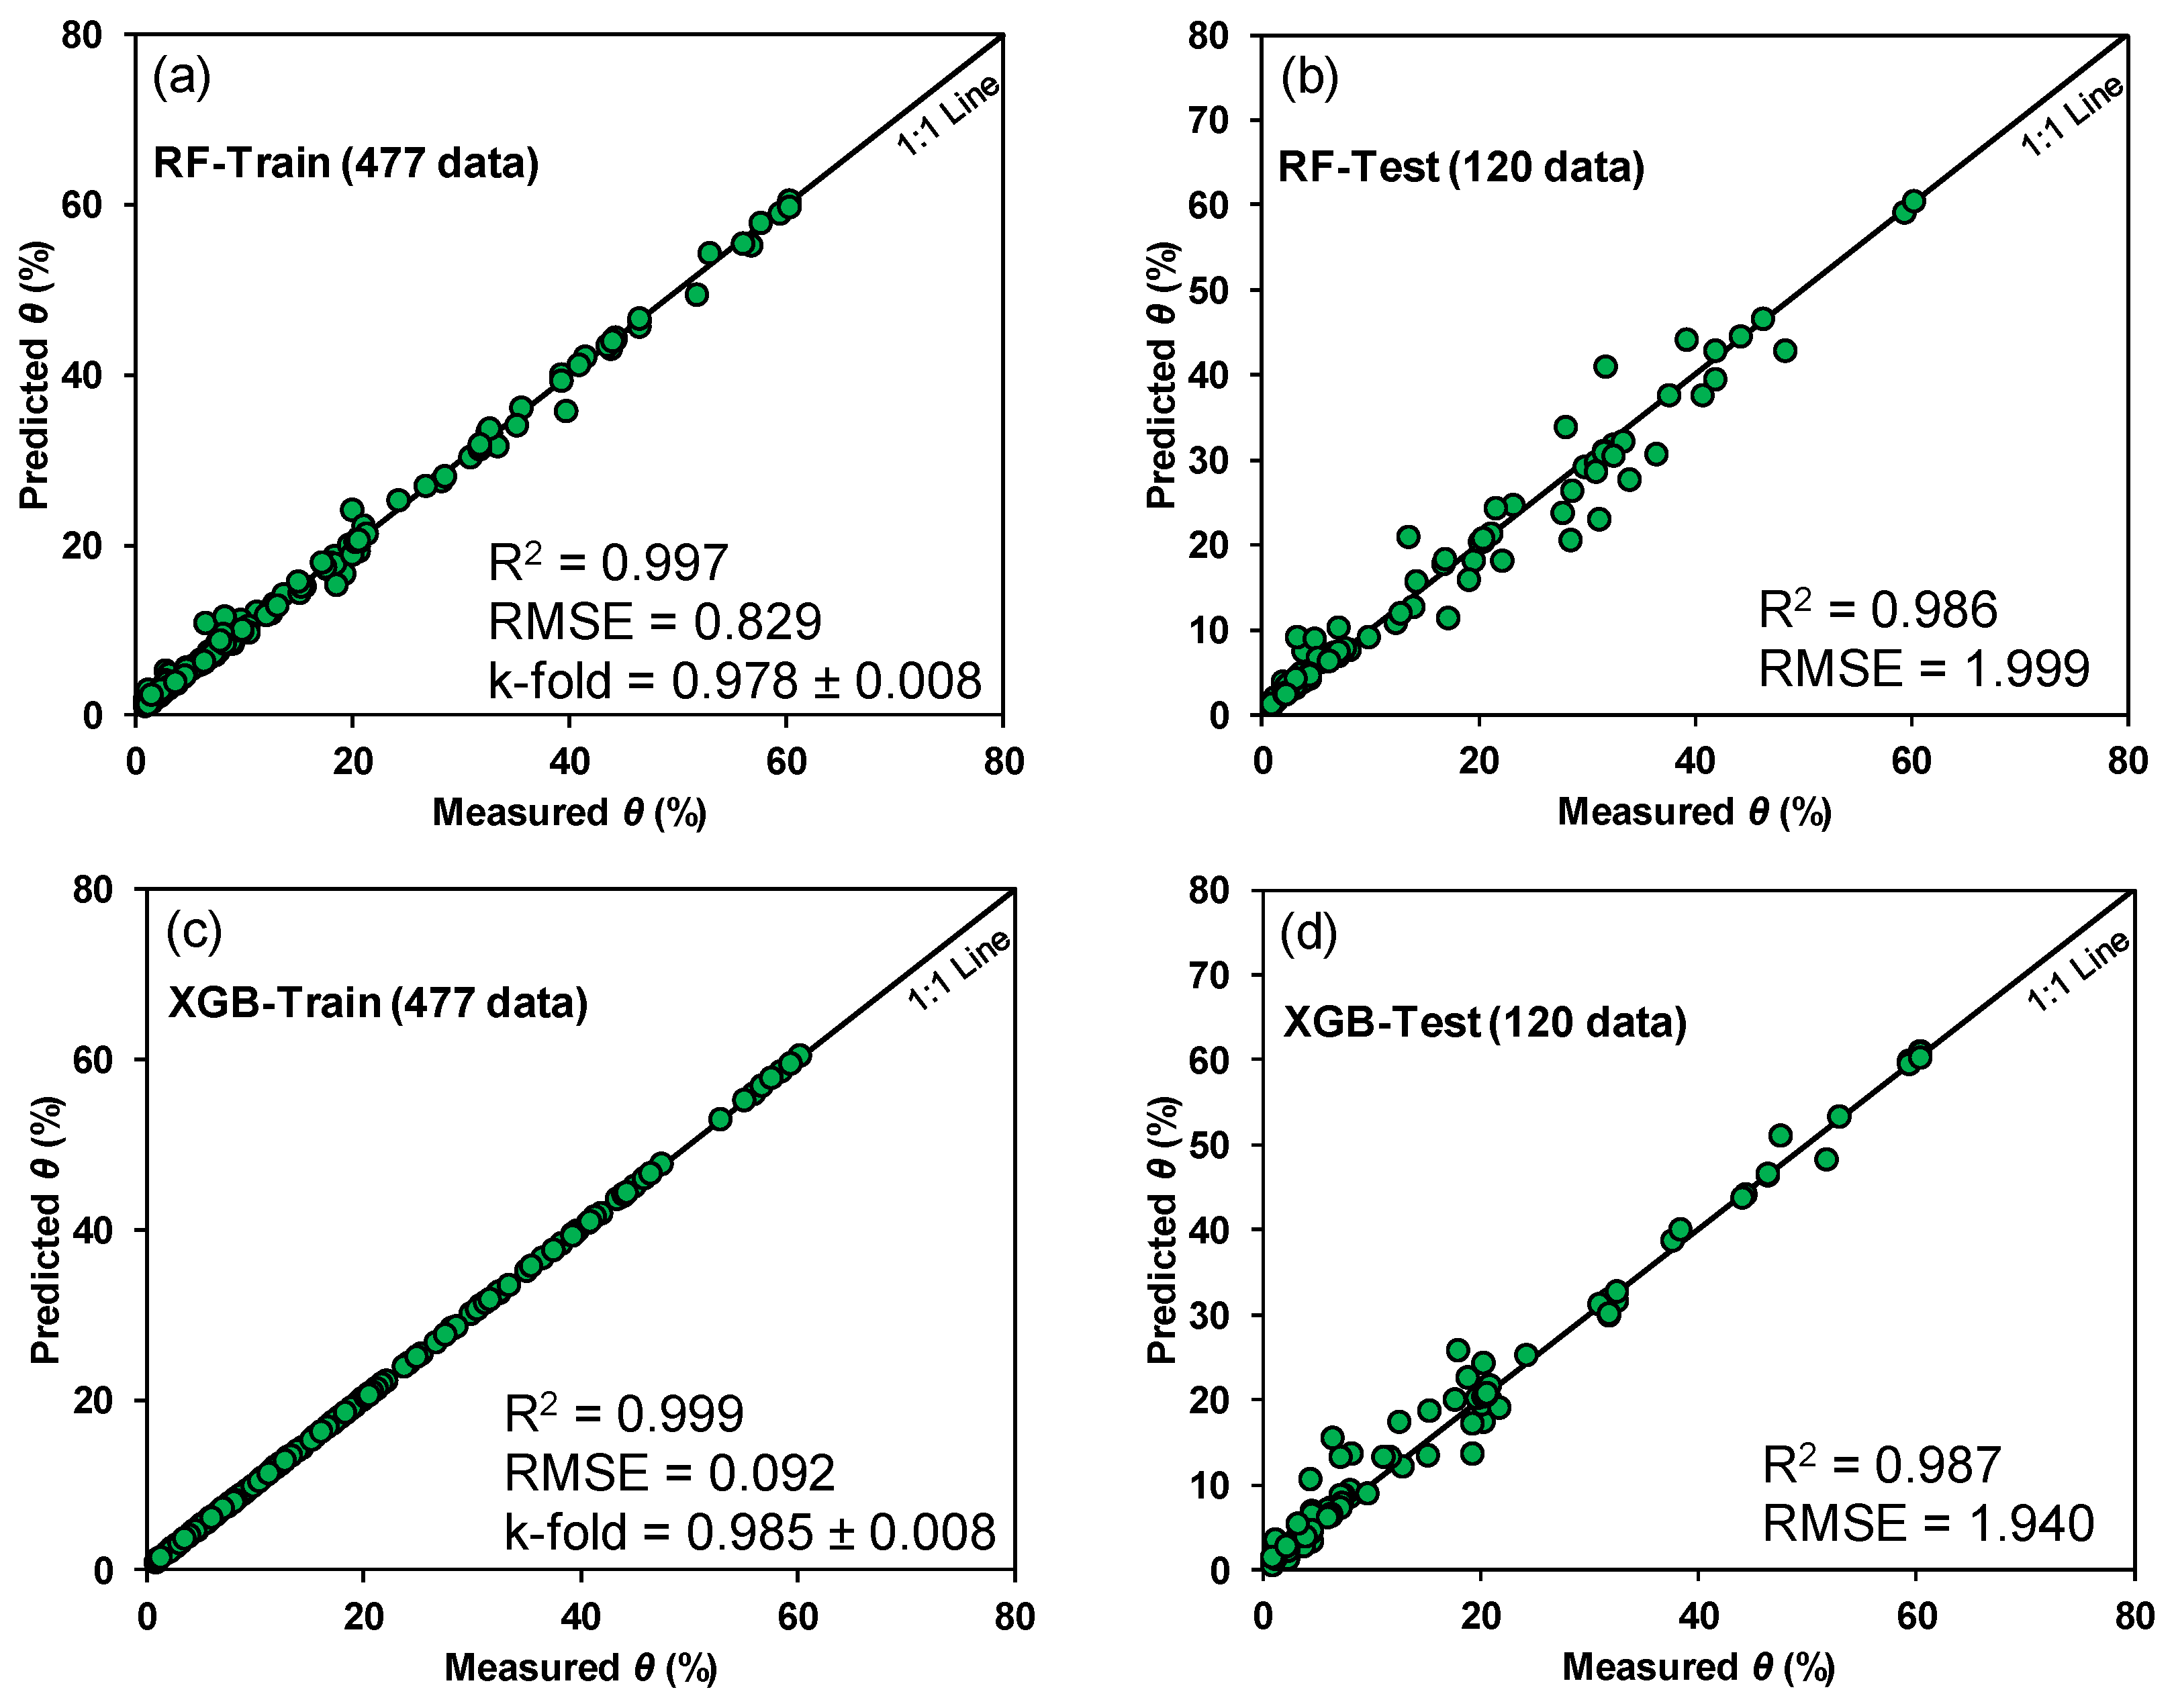
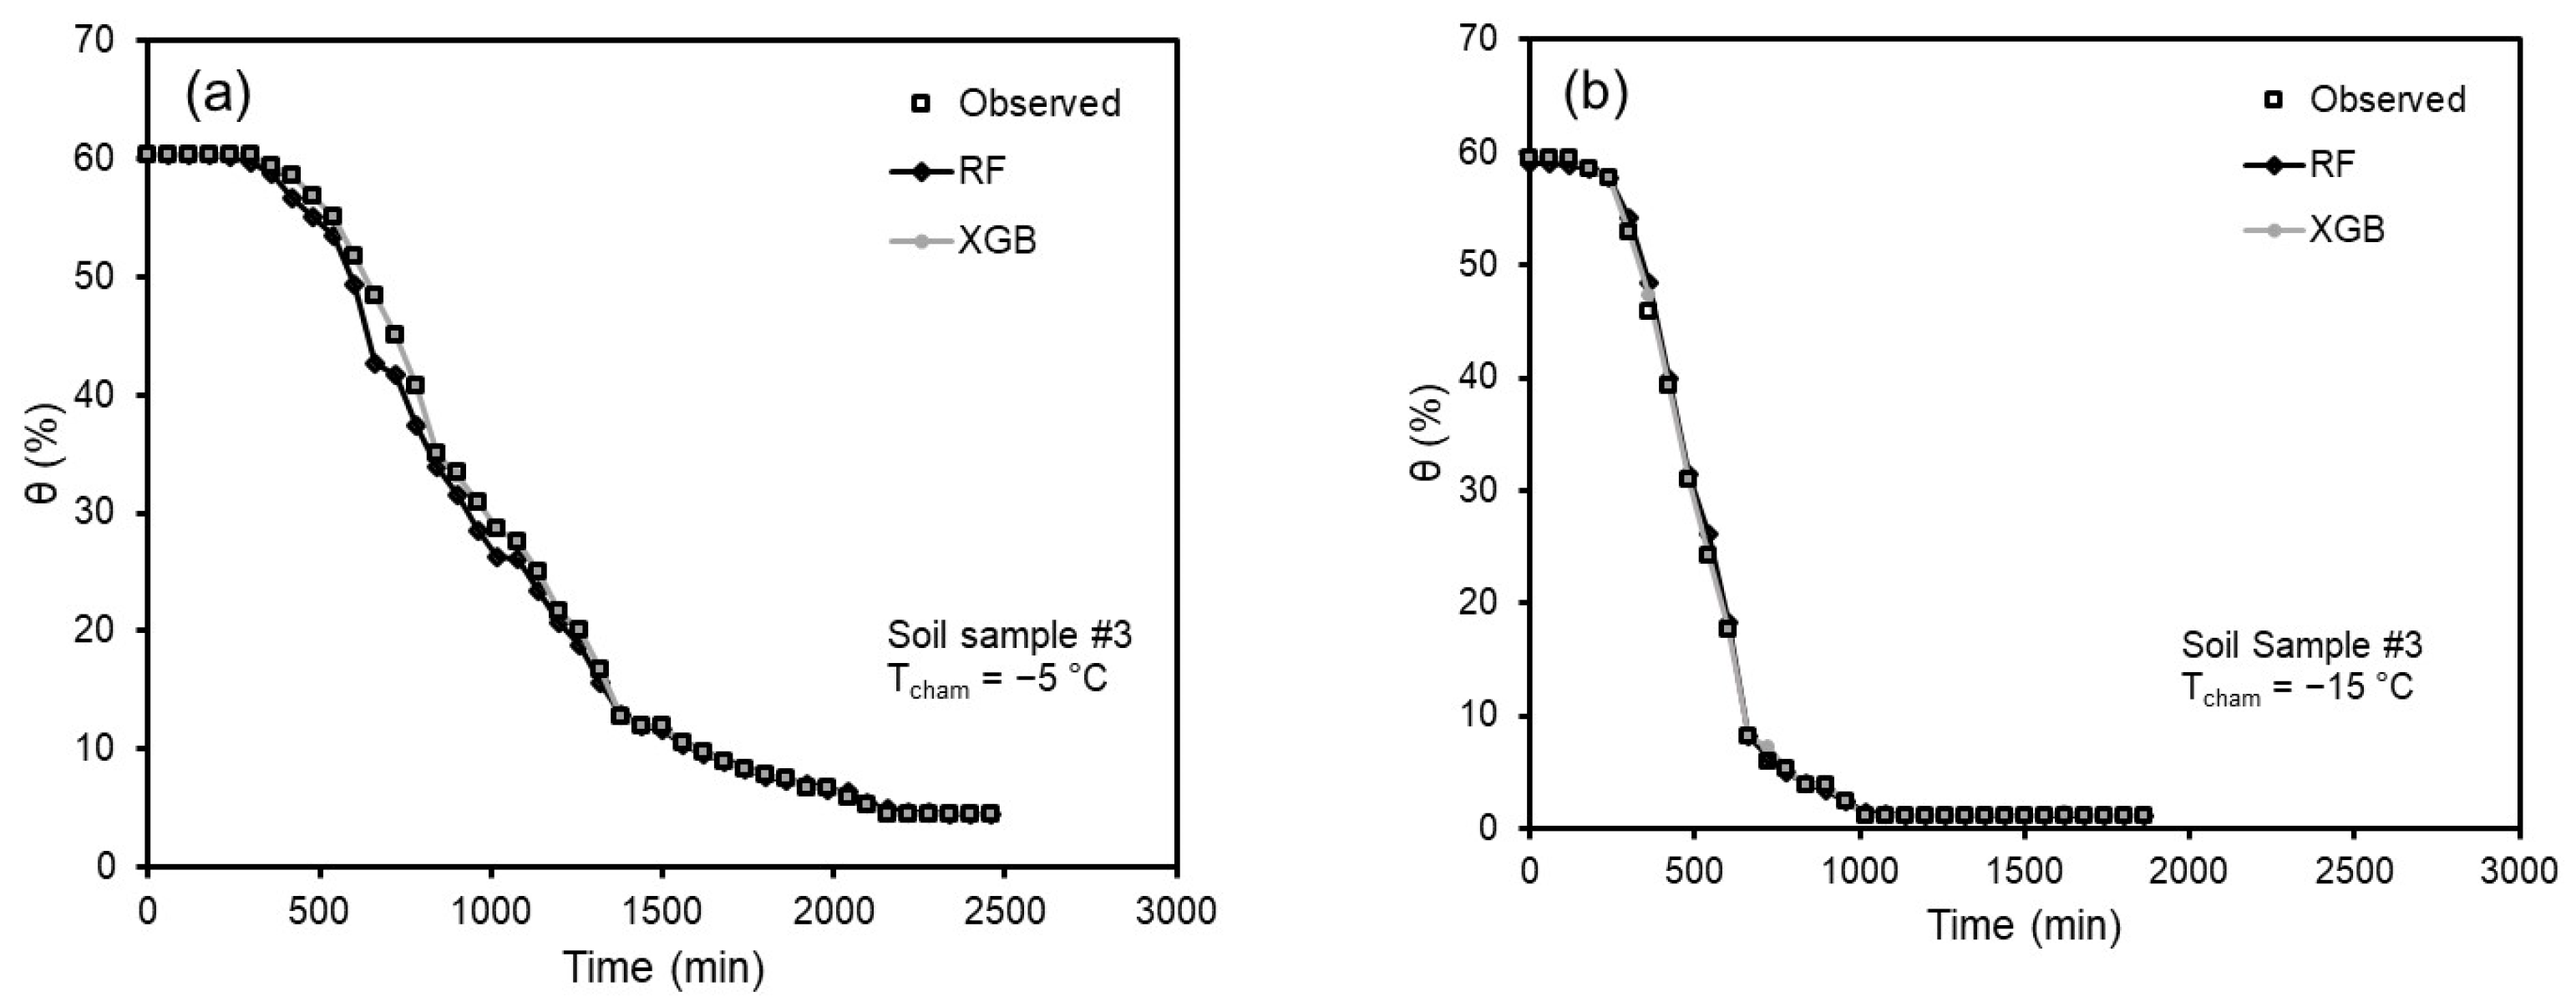
As illustrated in
Figure 5 and
Figure 6, both RF and XGB demonstrated strong predictive capability for volumetric water content (
θ), with R
2 values exceeding 0.9 for the test dataset. The relatively small difference in R
2 and RMSE values between the training and test datasets, together with the consistency of results across cross-validation folds, confirms that the models achieved good generalization without significant overfitting. While the XGB model demonstrated slightly higher accuracy than RF, its extremely high R
2 values for the training dataset suggest a minor overfitting issue, as the high performance observed in
Figure 5c is predominantly valid only for the training data. Expanding the dataset to include a wider range of freezing temperatures, soil types, and water contents would further improve the generalization performance of the models and reduce potential overfitting.
An in-depth error analysis indicated that prediction errors mainly stemmed from three factors: (i) the limited experimental dataset restricted to three freezing temperatures and a small number of water content levels, (ii) variability in soil properties associated with different organic matter contents, and (iii) the highly non-linear freezing–thawing processes, which may not be fully captured by tree-based models. Despite these limitations, the generalization performance of both RF and XGB remained robust within the observed conditions.
In addition, the k-fold cross-validation confirmed the stability of both models, as variations in R2 and RMSE across the folds were negligible. These findings verify that the parameters determined through grid search were appropriate and that the trained ensemble models are capable of reliably predicting the freezing behavior of soils within the experimental conditions considered in this study.
4.4. Predictor Importance
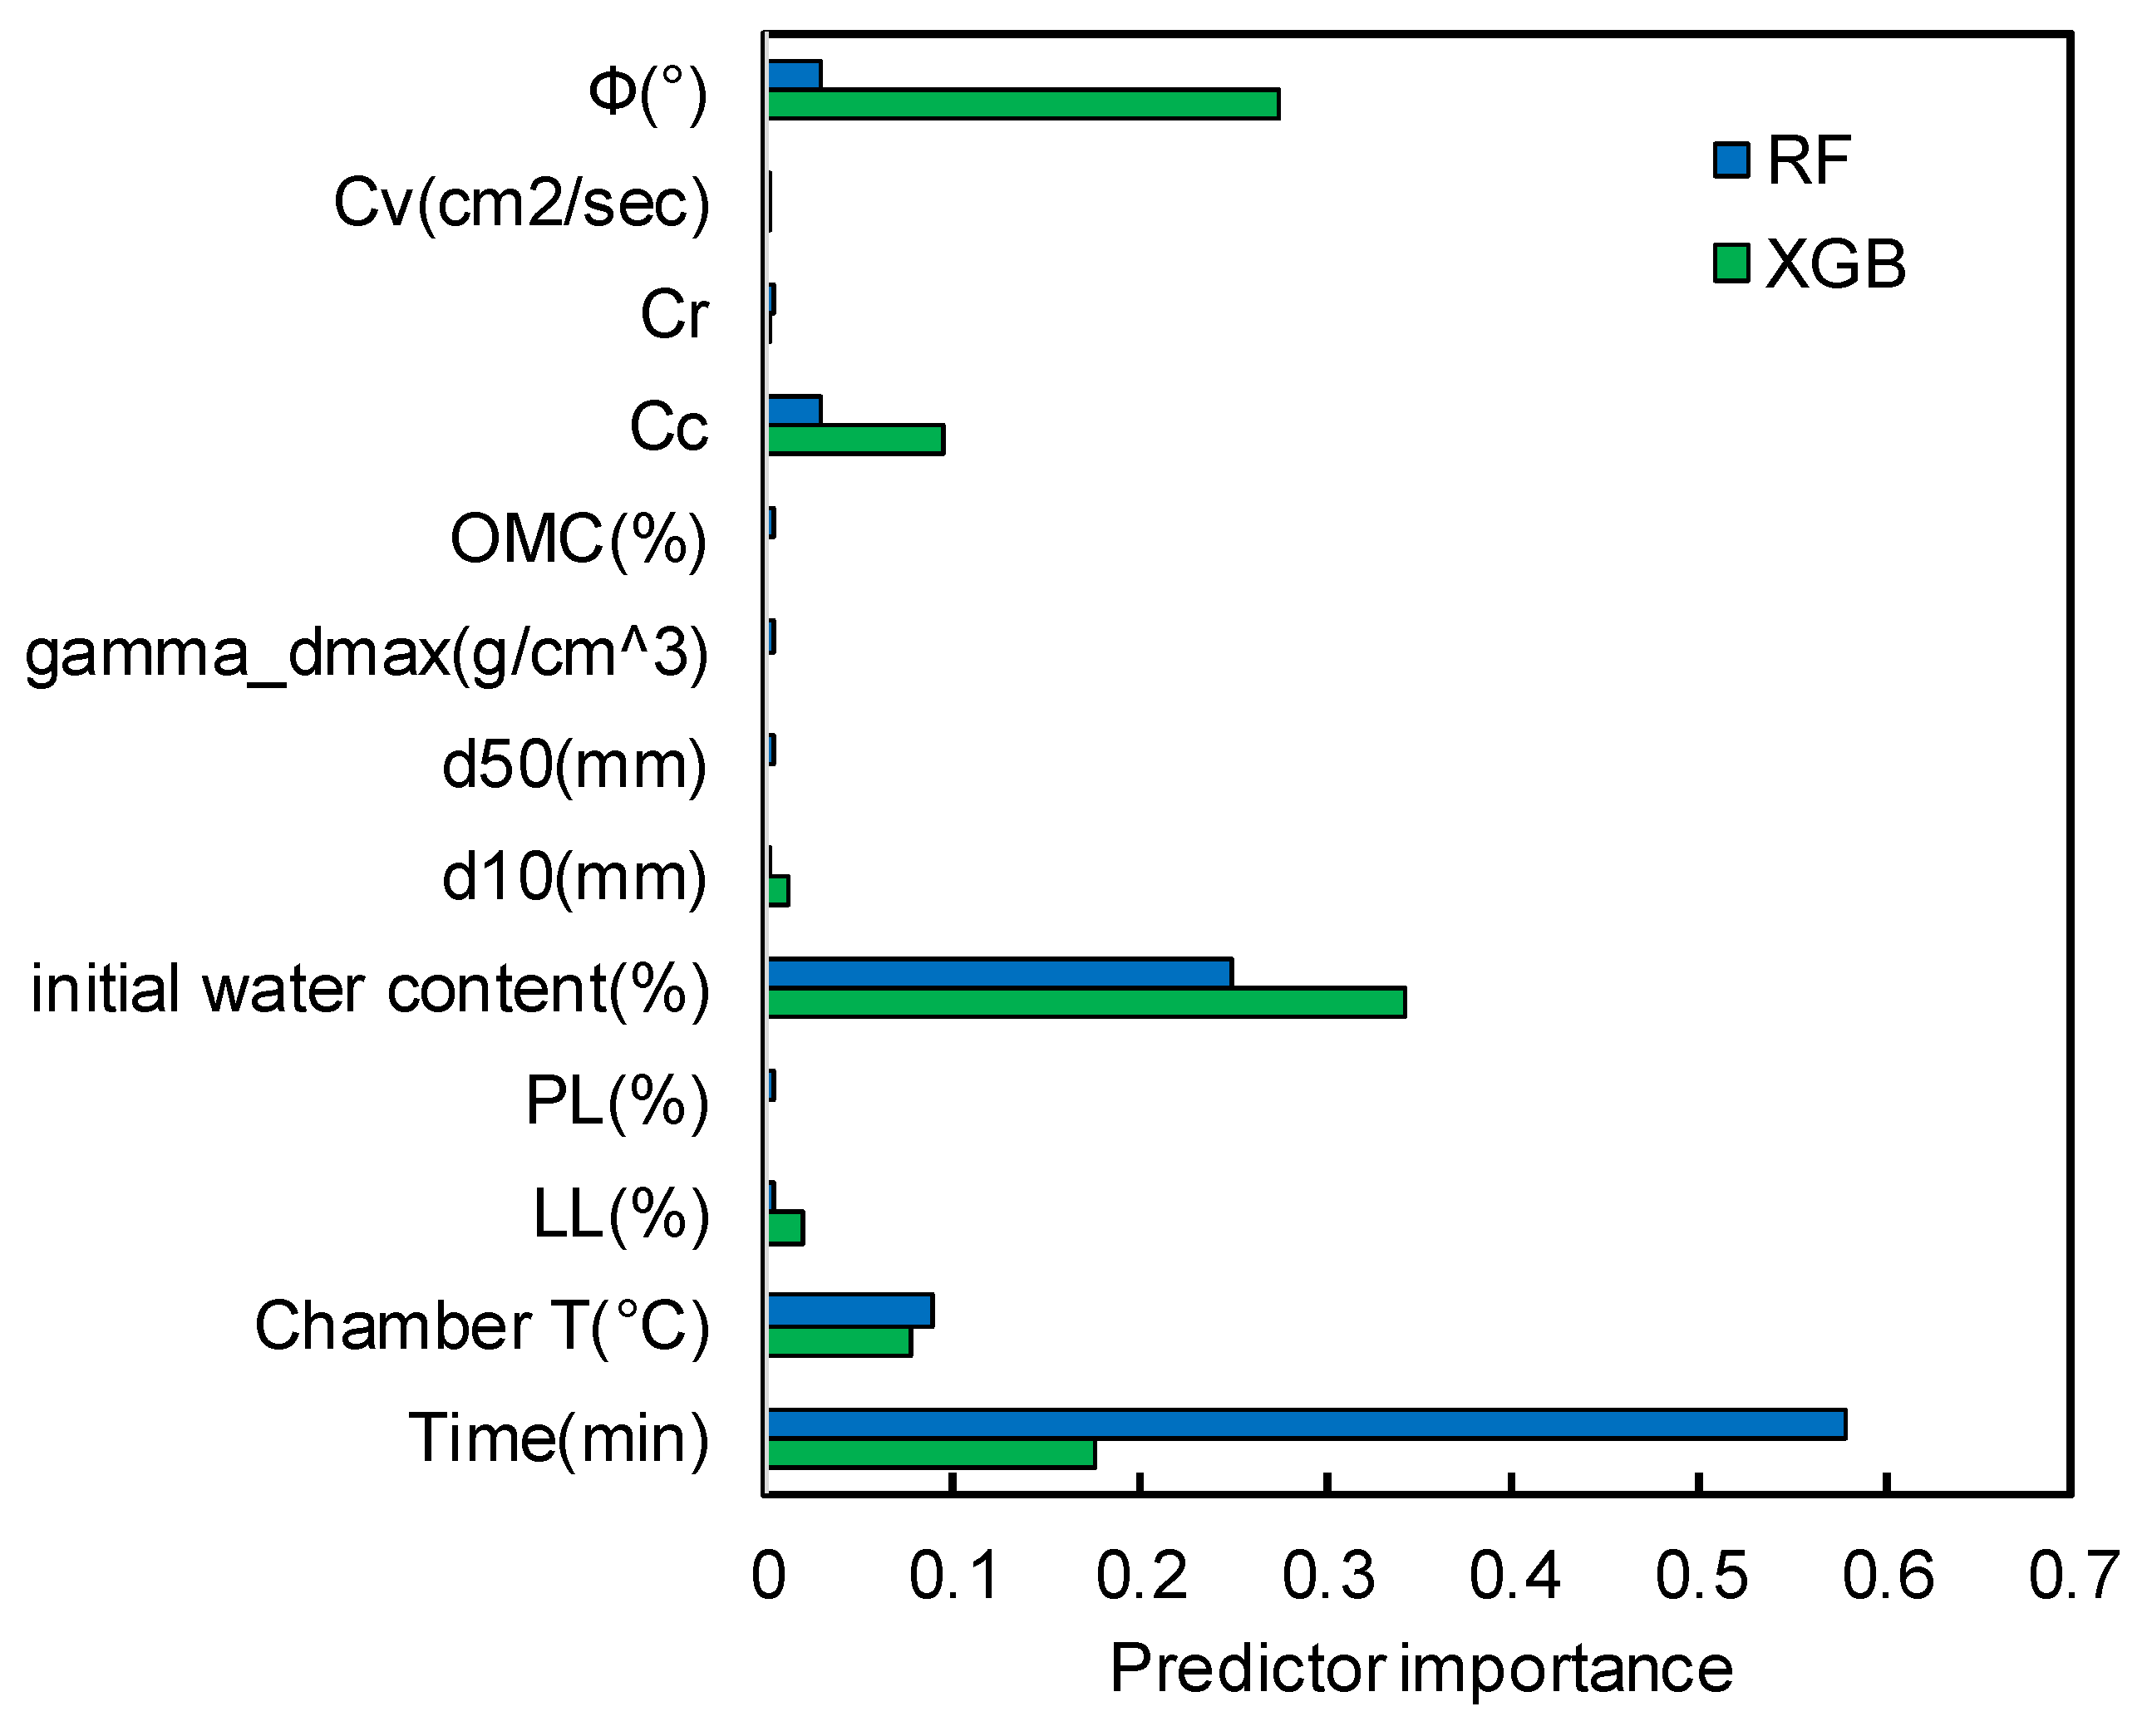
Figure 7 illustrates the predictor importance of 13 predictors using RF and XGB models. For the RF model, the predictor importance was evaluated as an order of time > w
init > T
cham while an important order of w
init > ϕ > time was obtained for the XGB model. Because the predictor importance is dependent on the learning algorithm as mentioned earlier, the discrepancy of predictor importance shown in
Figure 7 is more or less acceptable. However, the shortcoming of
Figure 7 is the incapability of determining the most important predictor (time for RF and w
init for XGB) in predicting θ for soils subjected to freezing. Further investigation would be required to determine more reliable predictor importance using other tree-based ML models.
The high predictor importance of w
init and time that is shown in
Figure 7 is physically intuitive because θ values are a strong function of time, as shown in
Figure 6, and is directly related to w
init. However, for the XGB model, it is notable that friction angle (ϕ) and compressive index (Cc) were evaluated as second and fourth most important predictors, respectively. This implies that geotechnical properties can also be important predictors for the freezing behavior of clayey sand.
4.5. Sensitivity Analysis
Using the developed XGB model, a sensitivity analysis was performed in this study, as shown in
Figure 8 and
Figure 9.
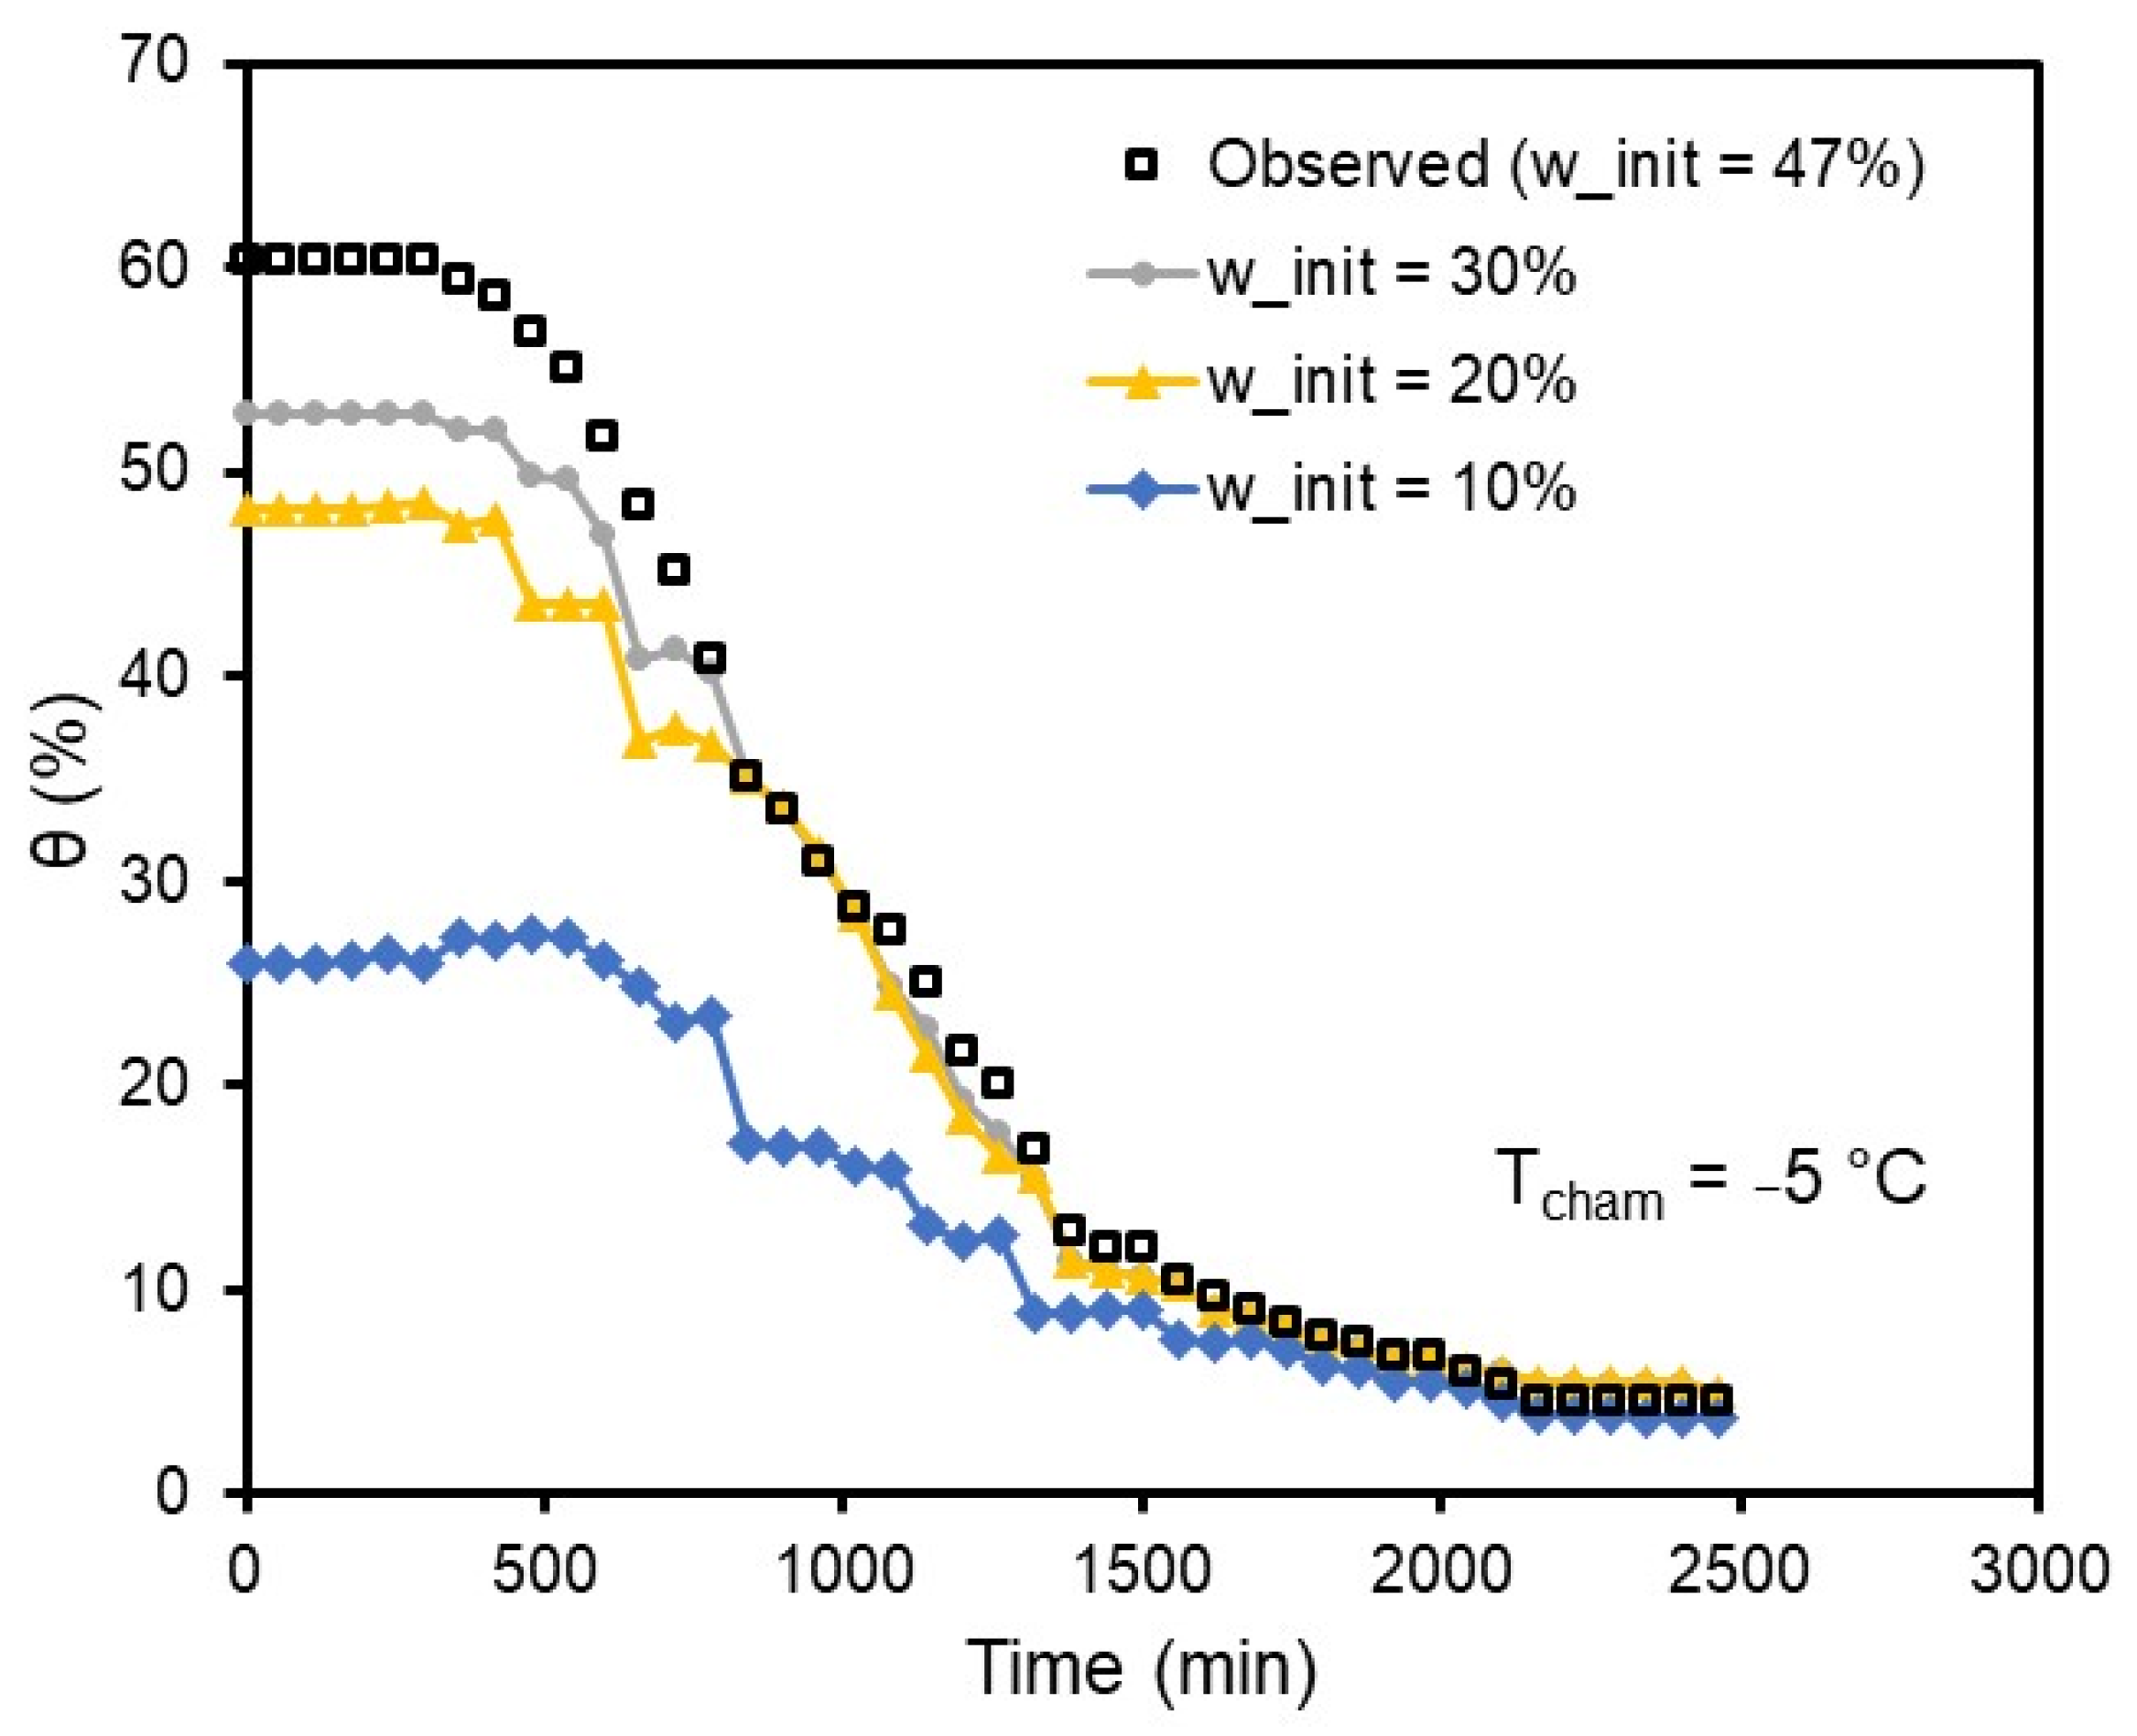
Figure 8 illustrates the freezing behavior of soil sample #3 at initial gravimetric water content (w
init) of 47 (observed), 30, 20, and 10%. The predicted freezing behavior demonstrated reasonable overall trends of
θ as a function of time. However, the large discrepancies observed at untested initial water contents (e.g., 10%, 20%, and 30%) highlight the limitations of the current dataset, which included only a small number of distinct water content levels. This dataset imbalance restricted the model’s extrapolative performance, leading to higher prediction errors outside the trained domain.
As seen in
Figure 9, the predicted freezing behavior using the XGB model shows the reasonable trend of θ values as a function of time. However, the huge discrepancy between initial water content (30, 20, and 10% of w
init correspond to θ
init = 38.5, 25.7, and 12.8%, respectively) indicates the limitation of predictability using the developed XGB model in this study. This can be attributed to the limited number of w
init (=13.78, 30.68, 13.39, 26.21, 26.37, and 49.96%) in the dataset, which led to the low predictability at w
init = 10, 20, and 30%.
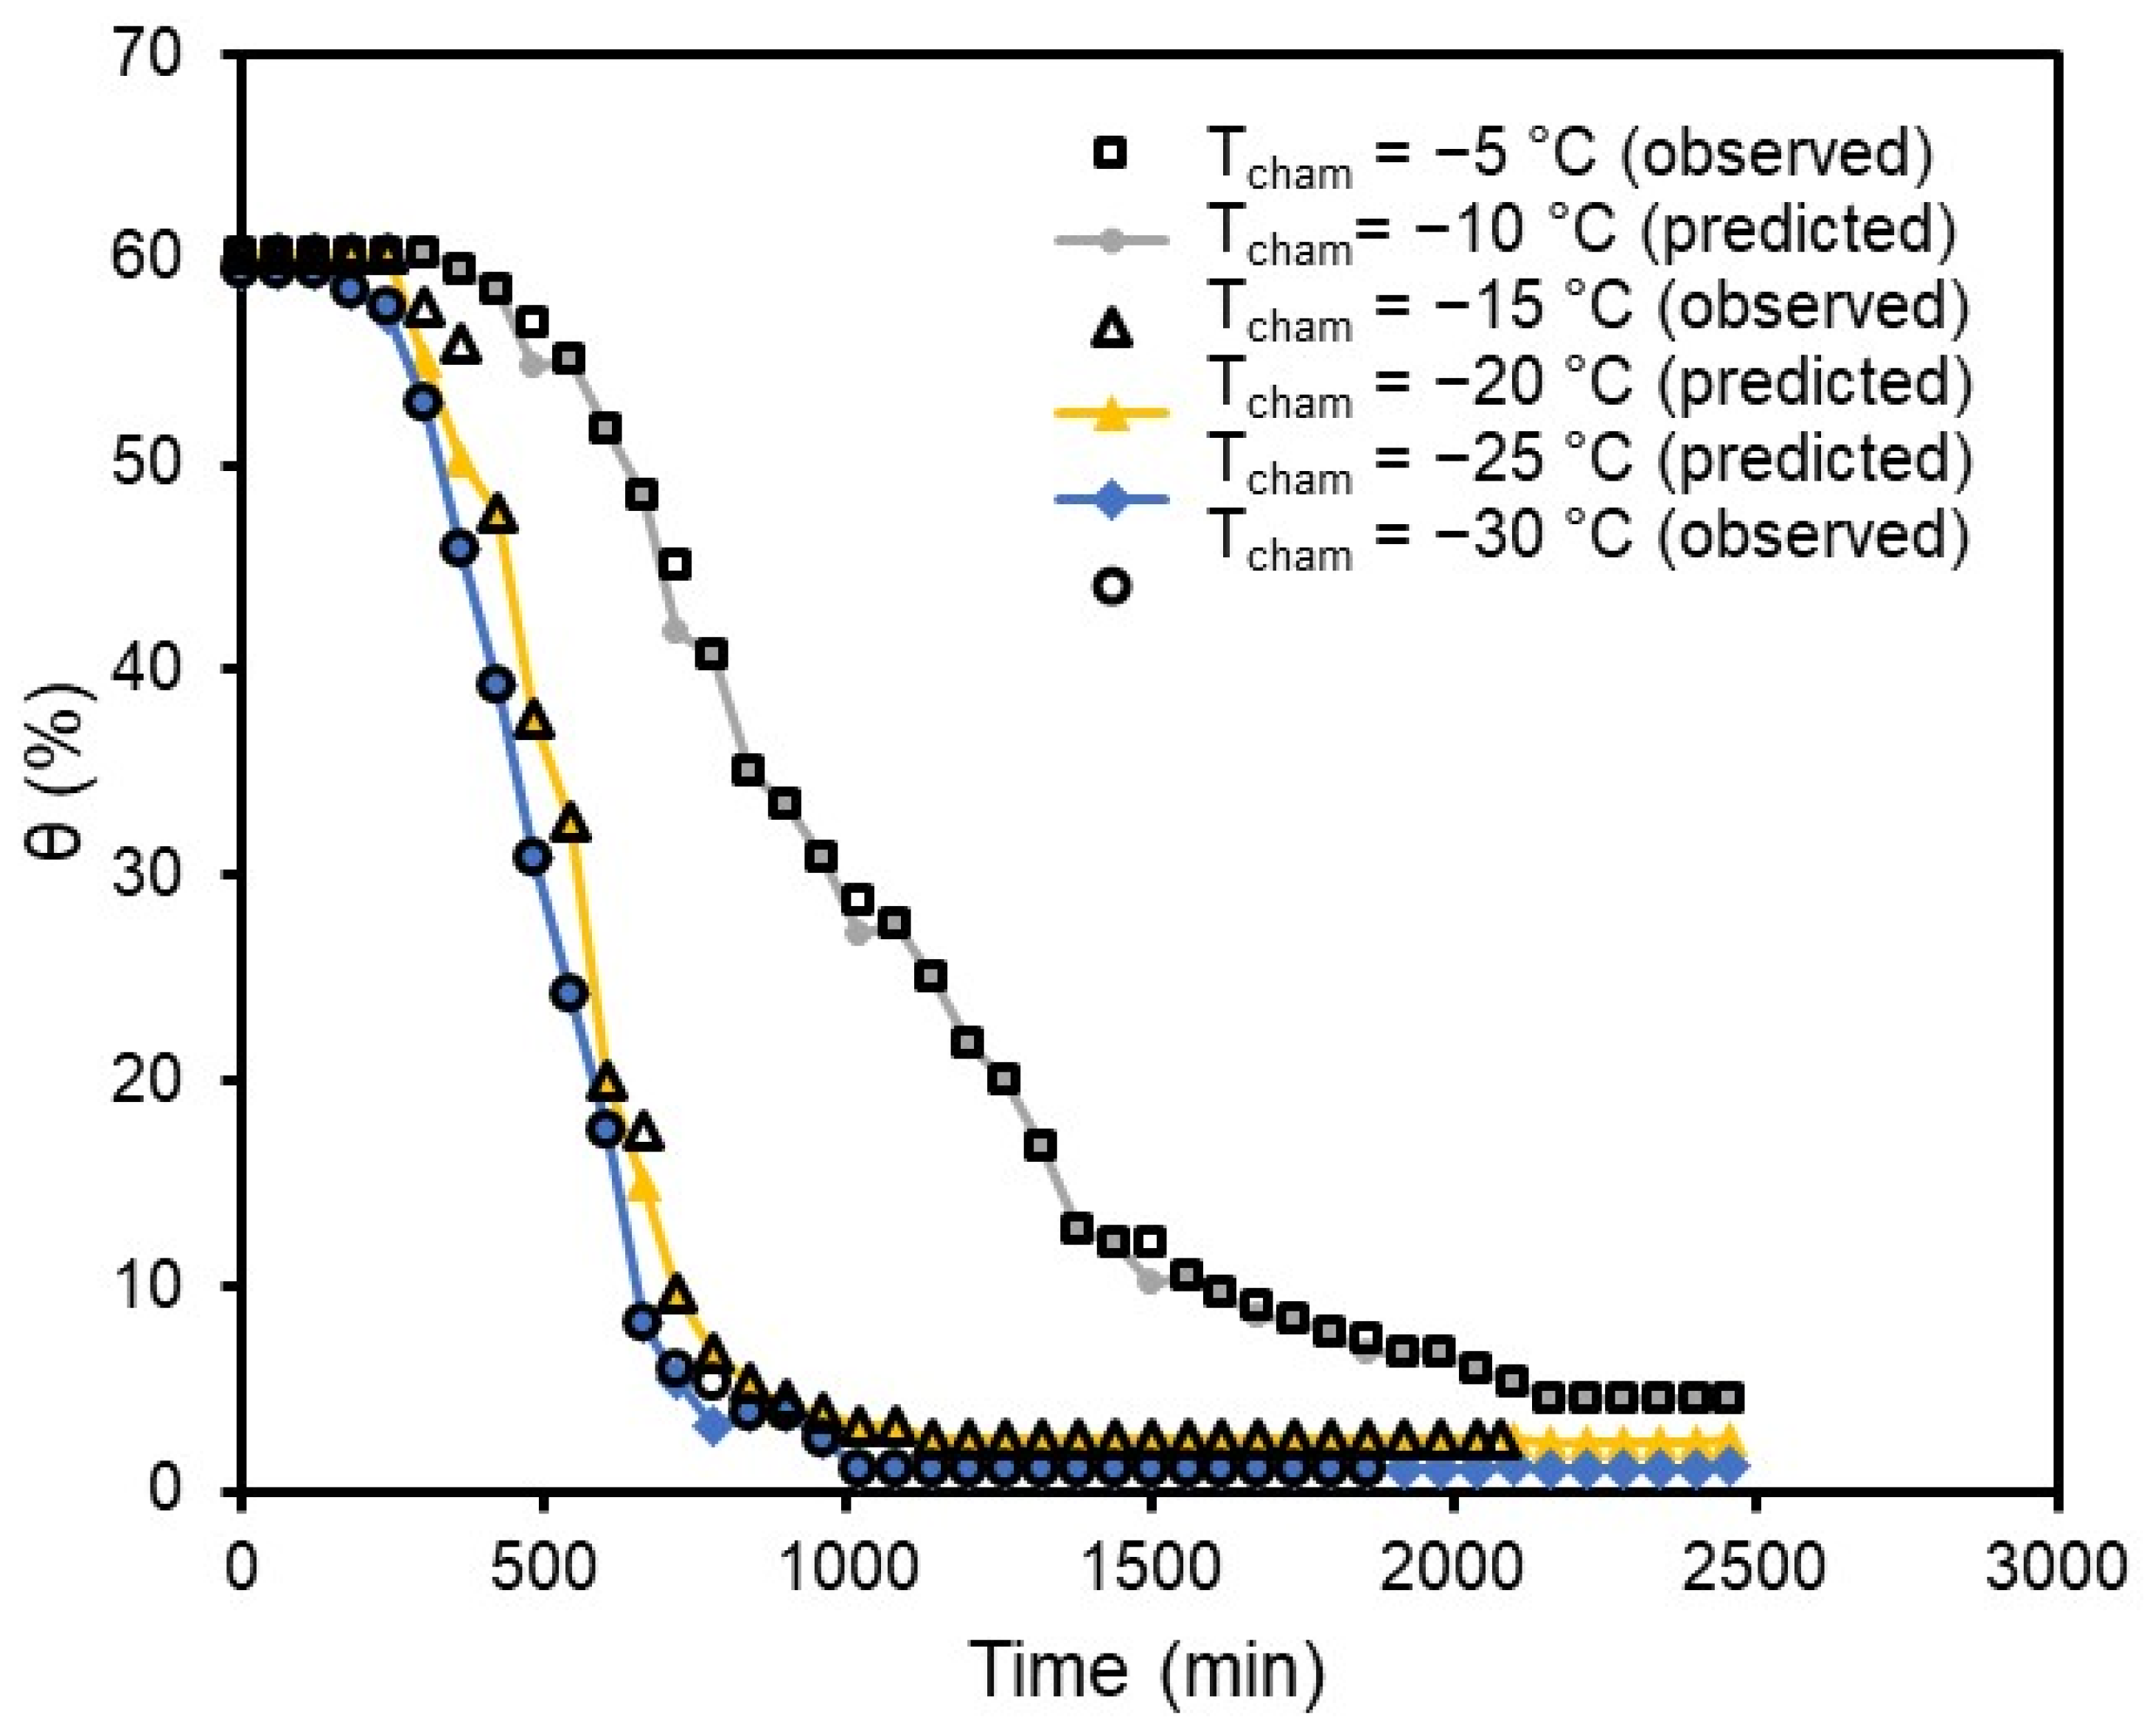
A similar limitation of the XGB model was observed for the prediction of freezing behavior as a function of chamber temperature (T
cham). As seen in
Figure 8, the θ values T
cham = −10 °C were almost identical to those at T
cham = −5 °C, which may not be a reasonable prediction as a lower θ value at a given time can be anticipated as T
cham decreases from −5 to −30 °C (observed values from the experiment). Similarly, predicted θ values at T
cham = −20 and −25 °C were identical to those at T
cham = −15 and −30 °C. Therefore, the developed ensemble models in this study only can provide reliable predictions at T
cham corresponding to experimental conditions (T
cham = −5, −15, and −30 °C). For obtaining good predictability at a wide range of T
cham, a more observed dataset with a variety of T
cham would be required.
The findings of this sensitivity analysis highlight the restricted extrapolative capability of the current models. The limited diversity of the dataset in terms of both initial water contents and freezing temperatures was identified as the primary source of prediction errors under unobserved conditions. To improve predictive robustness, future research should aim to expand the dataset across a broader range of thermal and hydrological conditions, incorporate feature engineering to capture interactions between soil and thermal properties, and explore advanced ensemble approaches such as LightGBM and CatBoost. These measures are expected to reduce prediction errors and enhance the generalization performance of machine learning models applied to soil freezing behavior.
