Abstract
Slope stability is a critical factor in the mining industry, directly impacting operational safety and economic performance. In large open-pit mines, slope failures can cause work stoppages and significant financial losses. Regions like Mongolia, with their complex topography, irregular geometries, and heterogeneous rock conditions, present a particular challenge for assessing slope stability. Conventional two-dimensional (2D) slope stability analysis and deterministic approaches have limitations in accounting for these complex topographies, irregular pit geometries, and lateral resistance forces. For a large open-pit mine in Mongolia, this study applied three-dimensional (3D) analyses with varying slope widths, using both limit equilibrium and finite element methods, to achieve a more reliable stability assessment under complex topographic conditions. To further enhance the reliability of evaluations under heterogeneous rock mass conditions, probabilistic approaches were employed alongside traditional deterministic methods. This enabled a more accurate estimation of safety factors and the identification of potential failure zones. The comparative study results demonstrate that 3D and probabilistic analyses consistently show 17–20% higher factors of safety and lower probabilities of failure than conventional 2D deterministic analyses. These findings highlight the effectiveness of these advanced methods for reliable slope stability assessment in complex geological conditions. Ultimately, the results underscore the importance of incorporating 3D and probabilistic analyses for more accurate and reliable assessments in complex open-pit mining, thereby contributing to improved safety and optimized operational efficiency.
1. Introduction
When modeling for geotechnical structure analysis, 2D models are the most commonly used models due to their relative ease of model construction and rapid computation time [1]. However, 2D analyses cannot fully capture the 3D nature of geotechnical problems and obtain unrealistic results. There are some cases in geotechnical mining problems that necessarily have to be modeled in 3D, and 2D assumptions cannot be applied to them, such as mining slopes with complex geological conditions, pits with irregular geometry, and high curvature [2]. While 2D models can be justified for relatively long open pits with simple geological conditions [3,4], 2D Limit Equilibrium Method (LEM) analysis neglects the normal and horizontal side resisting forces (i.e., end effects) along the sides of the sliding mass which can lead to a conservative estimate of Factor of Safety (FoS) [5]. Neglect of this effect, or simply by applying a rule of thumb adjustment to predict the 3D FoS equivalent, is a serious shortcoming of the current state of the art [6]. Case studies from coal and iron ore mines have demonstrated that 3D modeling into slope stability analysis can significantly enhance the understanding of slope behavior and increase the net present value of an open pit mining project [7,8]. Mongolia, located in the Central Asian Orogenic Belt, is a tectonically active region shaped by multiple phases of mountain-building events. These geological processes have resulted in complex rock structures and significant mineral deposits, particularly in the southern Gobi Desert and the Altai Mountains. Due to these geological complexities, open-pit mines in Mongolia often feature steep slopes, irregular geometries, the presence of intrusive bodies and altered zones, such as oxidized rock that produces pronounced heterogeneity in rock properties, making conventional 2D analyses insufficient for reliable stability assessment. Consequently, 2D methods are unable to identify critical failure zones in real open-pit mines, highlighting the need for 3D analyses to realistically evaluate complex failure mechanisms and the three-dimensional distribution of weak or unstable regions. Therefore, it is essential to apply 3D slope stability analysis methods that can more accurately capture the spatial variability and three-dimensional behavior of the slopes in such terrains. This study conducts a comprehensive rock slope stability analysis using the geotechnical databases from the open-pit mine site in Mongolia. The main objective is to illustrate how 3D slope stability analysis overcome 2D slope stability analysis in terms of identifying critical failure surface, incorporating horizontal extrusion effects, accurately representing realistic geometry. Furthermore, a comparative study using the non-linear Generalized Hoek Brown (GHB) model for LEM and the linear Equivalent Mohr Coulomb (EMC) model for Finite Element Method (FEM) is performed to enhance the reliability and accuracy of the stability analysis at the mining site.
2. Methodology
Slope stability analysis can generally be categorized as empirical, kinematic, LEM, and numerical methods like FEM. The calculation can further be performed in 2D or 3D, using deterministic and/or probabilistic inputs [9]. This research utilizes rock slope stability analysis through LEM with multi-plane analysis (MPA), as well as the Entry and Exit method in terms of deterministic and probabilistic analysis. Also, FEM slope stability analysis will be used in terms of Deterministic analysis. This study provides new insights into 3D probabilistic slope stability in open-pit mining environments by combining limit equilibrium LEM with MPA and the Entry and Exit method, alongside deterministic FEM analyses. The application of MPA significantly enhances the analysis by enabling rapid and comprehensive evaluation of 3D slip surfaces across complex models, reducing the time required to identify critical failure surfaces while improving the accuracy of their estimation. Through automated orientation analysis and advanced search algorithms, MPA simultaneously considers multiple potential slip directions and planes, increasing the reliability of slope stability predictions. By integrating deterministic and probabilistic LEM analyses with FEM verification, the study presents a robust and practical framework for assessing slopes in heterogeneous, topographically complex rock masses, highlighting the efficiency, precision, and analytical advantages offered by MPA in modern slope stability assessment.
2.1. Multi Plane Analysis, Entry and Exit Method in LEM
LEM is commonly used in geotechnical engineering to analyze the slope stability. This method assumes that a slope fails along a critical failure surface, and the FoS is evaluated based on the balance of forces and moments acting on a sliced section of the slope. A simple force balance can be calculated for a sliding rock mass when a few considerations are applied. The simplest form of LEM uses the calculation of FoS to determine slope stability and the most common limit equilibrium techniques are methods of slices. Many of the LEMs perform static equilibrium by driving the soil or rock mass above the assumed slip surface into a finite number of vertical slices [10]. There are several types of LEMs for slices, such as General Limit Equilibrium (GLE), Ordinary or Fellenius, Bishop’s Simplified, and Janbu’s Simplified methods, each addressing different conditions and factors.
Many researchers have studied 3D LEM slope stability analysis based on 2D LEM analysis, which has been extended into columns from the slicing methods [11]. Slope stability analysis is often targeted at topographically complex sites whose features vary greatly in three dimensions or to seemingly simple surface topology with strong and weak internal layers that vary across the site. For these types of sites, it can be difficult to determine where the location of the failure is most likely to be. Typically, an engineer is required to perform tedious and time-consuming analysis at multiple different locations in sequence to find the location of the failure. MPA creates a number of planes across the model, either manually drawn or automatically generated, and enables rapid, thorough, and simple-to-perform analysis of a 3D site at multiple locations simultaneously.
Once the failure surface is located through MPA, a critical slip surface can be searched by slope search methods (Figure 1a). The critical slip surface is determined by evaluating certain slip surfaces with the minimum FoS as the key slip surface for the slope [12]. The accuracy and reliability of slope stability analyses depend significantly on the effectiveness of the search method used to identify the critical slip surface. For this study, the slip surface was assumed to be in circular shape, and we used the Entry and Exit method to find the slope surface. The Entry and Exit method (Figure 1b) allows for the specification of an entry and exit point for a group of circular slip surface in 2D and ellipsoidal slip surfaces in 3D. It is a practical, simple method to use, especially when performing comparative analysis combined with FEM slope stability analysis.
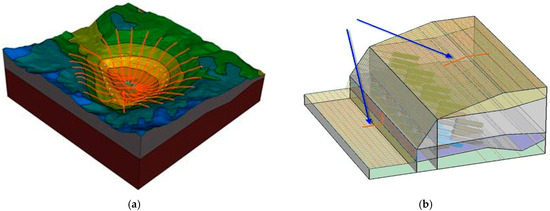
Figure 1.
Multi-plane analysis (MPA) and the Entry and Exit method in 3D LEM analysis. (a) Multi-plane analysis; (b) Entry and Exit method (Blue arrows indicate the entry and exit line of the slope profile).
2.2. Shear Strength Reduction in FEM
While limit equilibrium solutions may require just a few seconds, numerical solutions to large, complex problems can take an hour or more, particularly when discontinuous behavior is involved [13]. For slopes, the FoS is often defined as the ratio of the actual shear strength to the minimum shear strength required to prevent failure [14]. A rational approach to determine the FoS using a finite element or finite difference program involves progressively decreasing the shear strength until collapse ensues. The FoS is the ratio of the rock’s actual strength to the reduced shear strength at failure [13].
The FEM is increasingly being applied to slope stability analysis. One of the most popular techniques for performing FEM slope analysis is the shear strength reduction (SSR) approach [15]. Griffiths [16] suggested that the FEM approach to slope stability analysis over traditional LEMs can be summarized as follows: no prior assumptions are required about the shape or location of the failure surface, and since the FE approach does not use slices, there is no need to assume slice side forces. The FE method preserves global equilibrium until ‘failure’ is reached.
2.3. Probabilistic Approaches in Slope Stability Analysis
The rock slope stability analysis can be performed using deterministic and probabilistic approaches. The deterministic analysis based on the safety factor concept uses fixed representative values for each input parameter involved without considering the variability and uncertainty of the rock mass properties. Probabilistic analysis with the calculation of probability of failure instead of the FoS against failure is emerging in practice [17]. In other words, deterministic analysis cannot deal with uncertainty in terms of variability and uncertainty. The main advantage of the probabilistic method is that it takes into consideration the natural variability and uncertainties of the rock mass properties.
- a.
- Deterministic Anlysis
For this analysis, the stability of the slope is almost described by a single value of FoS. This type of analysis uses a mathematical model, typically the LEM, from which a FoS is obtained based on average values of the rock mass properties as input parameters (Figure 2). Therefore, this type of analysis does not explicitly account for uncertainty, and it assumes that the input variables, taken at their average, are certain.

Figure 2.
Deterministic approach in slope stability analysis.
- b.
- Probabilistic Analysis
In a probabilistic slope stability analysis, the same input parameters as the ones for the deterministic approach can be used with the only difference that the parameters are now described as input random variables and defined by a probability distribution. By using the same mathematical model (e.g., LEM) plus a sampling method such as Monte Carlo Simulation (MCS), the Probability of Failure and the FoS can be calculated (Figure 3).

Figure 3.
Probabilistic approach in slope stability analysis.
3. Overview of the Open Pit Mine Site
To perform stability analysis, the open-pit mine site was outlined, beginning with a detailed overview of the geological and geotechnical background. This included an in-depth description of the site’s current conditions, geological formations, and geotechnical properties, as well as an assessment of the existing situation.
3.1. Site Overview
The open-pit mine site belongs to the Gobi steppe zone, which is located in the northwestern area of Mongolia. The site is situated 1500–2500 m above sea level in the region and has been actively producing gold using open-pit mining techniques since 2012.
The mining site was divided into four areas for final wall assessment in a previous geotechnical investigation. Currently, mining work has been completed on the north and northwest walls of the mining design. The main purpose of this research is to conduct a stability analysis of the deepest part of the completed north and northwest walls. Figure 4 shows the current open-pit design drawing with the final wall assessment of the four sections.
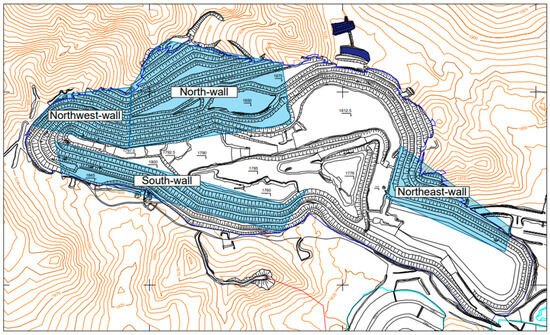
Figure 4.
Design drawing of the open-pit mine with four final walls (The blue-colored sections indicate the studied mining wall assessment).
Geotechnical assessments were conducted at four divided mining walls by QMC (Qualified Mining Consulting) LLC in Mongolia. Figure 5 presents observed minor failures of each mining wall and their current geotechnical situation, and Table 1 summarizes the results of each mining wall assessment by QMC LLC [18].

Figure 5.
Bayan-Airag open-pit mining wall assessment: the (a) northern wall, (b) northeastern wall, and (c) northwestern wall.

Table 1.
Summary of the open-pit mining wall assessment.
The north wall of the open pit mine is relatively high with 150–200 m. This lateral slope is relatively stable, and no geotechnical landslides have occurred. During the geotechnical visual inspection and site visit, many small blocks from cracks, caused by weathering of the sloping side face, were observed that are likely to fall. Due to the strong oxidation of the shale material in the northeast wall, the bond strength has deteriorated, increasing the likelihood of future slips and falls as mining progresses. The western wall of the mine is relatively stable in oxidized shale. There was also a wedge-sized collapse on the side sloping face. Due to factors such as weathering and blast vibration of the face rock on the sloping slope the bench size collapse is likely to result in loose material. The southwestern wall of the mine is not high (30–40 m), and the side slope is cracked to coincide with the direction of the fall. This structure and the nature of the wall material increase the geotechnical risk of the wall slipping when the mine is excavated.
3.2. Geological and Geotechnical Conditions
The geological investigation of the open-pit mine identified several distinct lithotypes, including alluvium/colluvium, oxidized zone, schist, and mafics. Table 2 presents the rock types and the properties of each rock type at the site. Among the various types of rocks, schist constitutes over 90% of the composition. The schist is predominantly slightly weathered (SW) to fresh (FR) schist and is primarily classified as meta-rhyolite, with subordinate occurrences of meta-lapili tuff. The Geological Strength Index (GSI), a classification system used to quantify the strength and stability of rock masses, ranges from 50 to 70 at the site. Some blast damage is evident in the rock mass, which can be expected for an interim wall delineated by production blasting. As the wall had not been pre-split or scaled, some failures can be attributed to disturbance by the excavator during excavation [19]. According to the QMC geotechnical report, the geotechnical assessment of the open-pit mine wall was categorized based on location within the mining site [20,21,22].

Table 2.
Rock types and their properties.
3.3. Rock Mass Strength Parameters
For the GHB criterion, the uniaxial compressive strength (UCS), material constant mi, unit weight, and GSI were obtained from laboratory testing of rock masses (238 rock samples collected from various locations of the open-pit mine), field mapping, and site investigation. Three main rock types—schist, oxidized ore (gossan), and primary ore (massive sulfide)—were identified in previous geotechnical investigation and rock laboratory test results.
For the probabilistic analysis (limited to FEM), the input parameters were determined by calculating their mean values, standard deviation, relative minimum, and relative maximum values. Probability distribution functions (PDFs) were then fitted to the histogram of each parameter. Once the PDFs and corresponding given values were obtained, PLAXIS 3D LEM (V21) software automatically performed probabilistic slope stability estimation using MCS. A total of 10,000 samples were generated for the MCS.
For the deterministic analysis, only schist was considered, as it constitutes the majority of the open-pit mine walls, to get LEM and FEM results that are comparable under consistent conditions. Therefore, a homogeneous rock mass behavior (only schist) was assumed for the deterministic LEM and FEM analyses, while a heterogeneous rock mass (comprising three types of rocks) was assumed for probabilistic LEM analysis. Based on rock mass laboratory testing, field mapping, and site investigation, additional GHB parameters were derived. Figure 6 presents selected PDFs of rock mass parameters used in the probabilistic LEM analysis. The deterministic rock mass (schist) strength parameters for GHB failure criterion are described in Table 3, whereas the probabilistic rock mass strength parameters such as their mean values, standard deviation and other values for GHB failure criterion are described in Table 4.
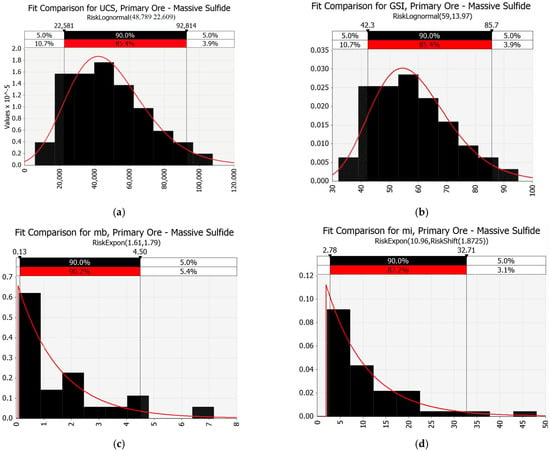
Figure 6.
Fitted distributions of primary ore—massive sulfide. (a) Lognormal distribution of UCS; (b) lognormal distribution of GSI; (c) exponential distribution of mb (reduced value); (d) exponential distribution of mi (material constant).

Table 3.
Deterministic rock mass (schist) strength parameters for GHB failure criterion.

Table 4.
Probabilistic rock mass strength parameters for GHB failure criterion.
Table 3 and Table 4 illustrate the rock mass strength parameters for the GHB (non-linear) model, which was used in both the deterministic and probabilistic LEM analyses.
For the EMC criterion, Rocscience Inc, RSData software was used to determine fitted Mohr–Coulomb values, namely the friction angle and cohesion. An important feature of RSData includes the capability to calculate EMC parameters for non-linear failure envelopes. The EMC parameters are automatically calculated with GHB non-linear strength criterion RSData [23]. Mohr–Coulomb parameters are calculated by determining a linear envelope that provides a “best-fit” over a given stress range of a non-linear envelope using [24]. Figure 7 presents the fitted EMC and GHB model stresses in both the principal stress plane and normal/shear stress plane. As shown in Figure 7, the deterministic rock mass strength parameters corresponding to the EMC linear failure criterion are a cohesion of 488.89 kPa and a friction angle of 21.7°.
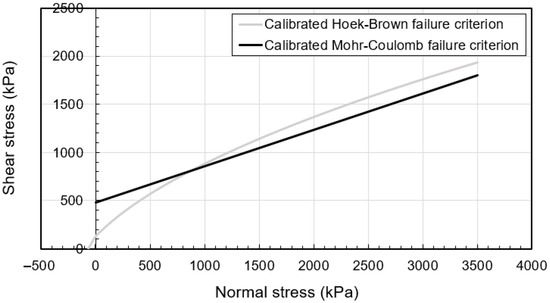
Figure 7.
GHB (non-linear) and EMC (linear) stress in normal/shear stress plane.
4. Slope Stability Analysis
Slope stability analysis in this study is conducted using both the LEM and FEM in 2D and 3D, employing PLAXIS 2D and 3D (V21) software. The analysis includes both deterministic and probabilistic approaches. According to McQuillan [8], a series of models were computed to compare open-pit mine slope stability FoS results based on 2D and 3D LEM in terms of Linear (Mohr-Coulomb) and Non-Linear (Shear-Normal, Generalized Hoek Brown and Barton Bandis) material strength.
The objective of this study is to evaluate slope stability by comparing linear EMC and non-linear GHB models in LEM, as introduced in [8]. The analysis includes 2D profiles, full 3D geometries, and extruded models. Furthermore, the study aims to assess the consistency of FoS results obtained using the FEM when identical model settings were applied across different modeling approaches.
To conduct multiscale slope stability analysis, a series of models were developed and systematically compared according to the flowchart illustrated in Figure 8. A multiscale slope stability analysis was conducted, beginning with an overall site assessment and progressing to detailed analyses of critical slopes. The findings were organized into three phases: Overall scale analysis (Phase 1), 3D sectional scale analysis (Phase 2), and 2D sectional scale analysis (Phase 3). At each scale of analysis, slope stability was evaluated using both the LEM and FEM. For the LEM, both deterministic and probabilistic approaches were applied based on rock mass strength parameters derived from the GHB criterion. In contrast, the FEM analysis used deterministic EMC parameters converted from the non-linear strength envelope. The results from these methods were compared and evaluated to assess consistency and reliability across different modeling approaches.
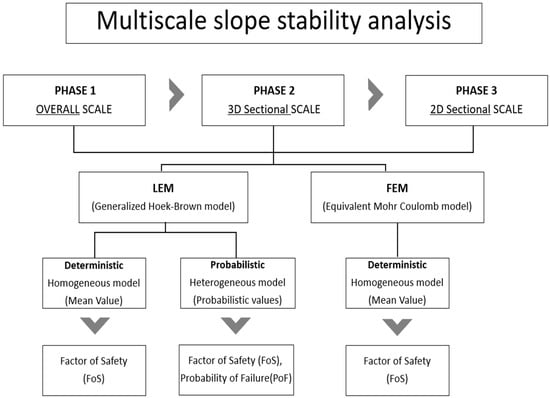
Figure 8.
Schematic flowchart for the multiscale slope stability analysis.
5. Slope Stability Analysis Results
5.1. Overall Scale Analysis (Phase 1)
Figure 9 presents a comparison of the results from full-geometry 3D LEM slope stability analyses conducted for two models; a homogeneous ground model based on parameters derived from deterministic analysis, and a heterogeneous ground model incorporating spatial variability through probabilistic analysis. For the deterministic analysis, FoS results range from 1.52 to 1.66 in the most critical sections (cross-section 4-4′, 5-5′, and 6-6′). For the probabilistic analysis, mean FoS results range from 2.54 to 2.58 with PoF ranging from 1.08% to 1.61% in the critical sections. Figure 10 illustrates the results of the full geometry 3D FEM analysis under deterministic analysis (homogeneous model). The FoS result shows 1.52 in the most critical sections (red to orange color indicates that potential failure slip surfaces) Notably, the 3D FEM results shown in Figure 10 indicate that the critical slipping surface was obtained at the exact location as in the 3D LEM analysis results, near cross-section 4-4′, 5-5′, and 6-6′ in Figure 9a,b.
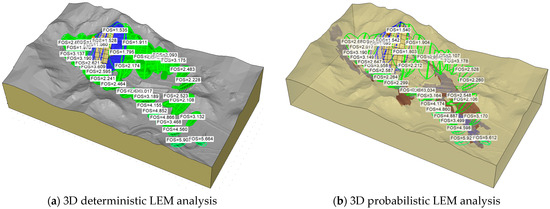
Figure 9.
Results of the full 3D LEM model: (a) Deterministic/Homogeneous model/FoS = 1.52–1.66; (b) Probabilistic/Heterogeneous model/mean FoS = 2.54–2.58, PoF = 1.08–1.61%.
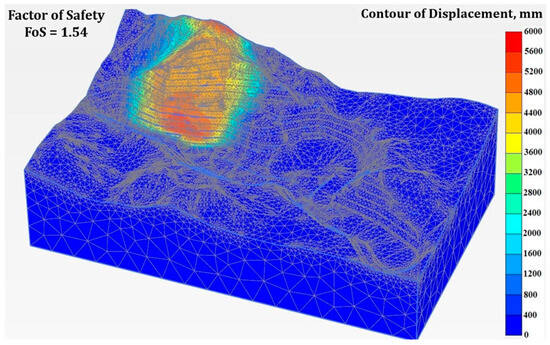
Figure 10.
Full 3D FEM model total deformation, (red to orange colors indicate potential failure slip surfaces in the open-pit mine area; FoS = 1.54).
5.2. Three-Dimensional Sectional Scale Analysis in Critical Section (Phase 2)
From the results of the overall slope stability analysis using 3D deterministic LEM, the three most critical slip surfaces were identified, at cross-section 4-4′, 5-5′, and 6-6′. From these cross-sections, extruded 3D models (100 m and 200 m) were created to compare FoS results. The two extrusion models with widths of 100 m and 200 m were generated by offsetting 50 m and 100 m, respectively, on both sides of the critical slip surface, respectively. The extrusion widths of 100 m and 200 m were selected to create 3D models that effectively capture the geometry and rock structure around the critical slip surfaces at different scales. The 100 m model, created by offsetting 50 m on each side of the slip surface, represents a more localized portion of the slope, while the 200 m model, offset by 100 m on each side, includes a larger volume of the slope and incorporates more of the surrounding rock mass properties. Comparing these two widths allows for evaluating how the model extent affects the computed FoS and ensures that both models provide reliable 3D representations of the slope conditions.
Figure 11 illustrates the results of the 3D deterministic LEM analysis for three critical cross-sections, comparing two extrusion widths. In the model with 100 m extrusion width (Figure 11a–c), the FoS are 1.56, 1.52, and 1.42 for cross-sections 4-4′, 5-5′, and 6-6′, respectively. When the extrusion width is increased to 200 m (Figure 11d,e), the corresponding FoS slightly increases to 1.60, 1.54, and 1.50. These results suggest that the extrusion width, representing the ground condition and extended volume around the critical surface, lead to different results when evaluating slope stability.
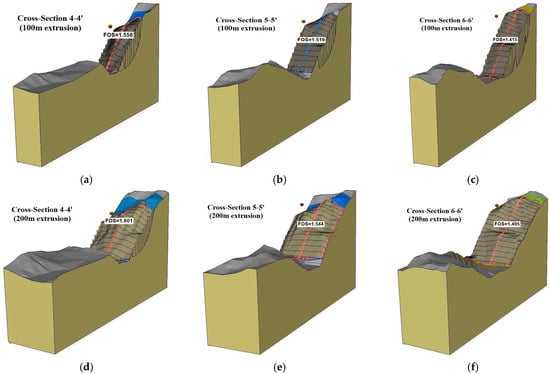
Figure 11.
Results of 3D deterministic LEM analysis. (a–c) Show 100 m extrusion models; (d–f) show 200 m extrusion models with critical cross-sections. (a) 4-4′ 100 m model FoS = 1.56; (b) 5-5′ 100 m model FoS = 1.52; (c) 6-6′ 100 m model FoS = 1.42; (d) 4-4′ 200 m model FoS = 1.60; (e) 5-5′ 200 m model FoS = 1.54; and (f) 6-6′ 200 m model FoS = 1.50.
The 3D deterministic FEM analysis followed the same procedure as 3D deterministic LEM analysis. Figure 12 presents the results of the 3D deterministic FEM analysis for three critical cross-sections, comparing two extrusion widths, 100 m and 200 m. In the 100 m extrusion models (Figure 12a–c), the FoS are 1.57, 1.50, and 1.41 for cross-sections 4-4′, 5-5′, and 6-6′, respectively. When the extrusion width is increased to 200 m (Figure 12d,e), the corresponding FoS increases slightly to 1.60, 1.54, and 1.49. The FoS results from 3D LEM and FEM deterministic analyses were similar, with a difference within 0.01.
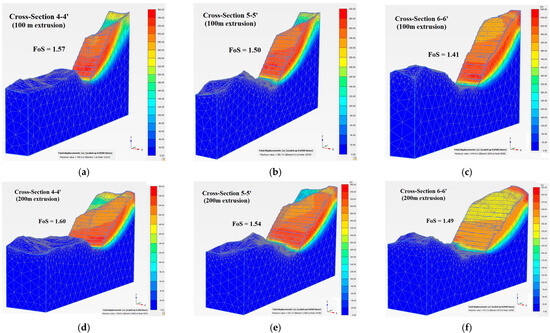
Figure 12.
Results of the 3D deterministic FEM analysis. (a–c) Show 100 m extrusion models; (d–f) show 200 m extrusion models with critical cross-sections. (a) 4-4′ 100 m model FoS = 1.57; (b) 5-5′ 100 m model FoS = 1.50; (c) 6-6′ 100 m model FoS = 1.41; (d) 4-4′ 200 m model FoS = 1.60; (e) 5-5′ 200 m model FoS = 1.54; (f) 6-6′ 200 m model FoS = 1.49.
The 3D probabilistic FEM analysis was conducted on the three most critical slip surfaces (cross-section 4-4′, 5-5′, and 6-6′) identified from the overall 3D deterministic LEM analysis. Stability analyses were performed on 100 m and 200 m extruded models for each cross-section to compare FoS results. The 3D probabilistic LEM analysis results are shown in Figure 13; it should be noted that the extruded models represent the actual open-pit mine geometry using heterogeneous block model with three assigned rock types. For the 3D probabilistic LEM analysis, the FoS results of 100 m extrusion model are 1.55, 1.49, and 1.38, and of the 200 m extrusion models, they are 1.62, 1.57, and 1.48 for cross-sections 4-4′, 5-5′, and 6-6′, respectively, as shown in Figure 13a–c and Figure 13d–f.
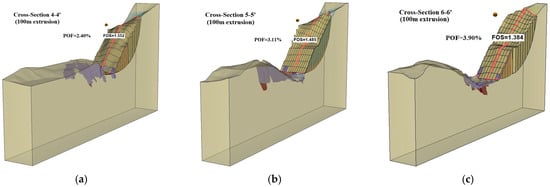

Figure 13.
Results of 3D probabilistic LEM analysis. (a–c) Show 100 m extrusion models, (d–f) show 200 m extrusion models with critical cross-sections. (a) 4-4′ 100 m model FoS = 1.55; (b) 5-5′ 100 m model FoS = 1.49; (c) 6-6′ 100 m model FoS = 1.38; (d) 4-4′ 200 m model FoS = 1.62; (e) 5-5′ 200 m model FoS = 1.57; (f) 6-6′ 200 m model FoS = 1.48.
5.3. Two-Dimensional Sectional Scale Analysis in Critical Section (Phase 3)
Based on the identified critical slip surfaces from Phase 1 (the overall scale analysis), 2D slope stability analysis was conducted in terms of deterministic LEM and FEM and probabilistic LEM. The safety factors of each analysis and cross-section are shown in Figure 14. Both 2D LEM and FEM analyses were using the same conditions as the corresponding 3D analyses in phase 1, with the only difference being the use of 2D cross-sections. For the 2D Deterministic LEM analysis, the FoS results are 1.41, 1.33, and 1.30 for cross-sections 4-4′, 5-5′, and 6-6′, respectively, as shown in Figure 14a–c. For the 2D Deterministic FEM analysis, the FoS results are 1.43, 1.35, and 1.28, and for 2D probabilistic LEM analysis, the FoS results are 1.41, 1.33, and 1.30 for the cross-sections, as shown in Figure 14d–f and Figure 14g–i, respectively. The results indicate no significant difference in FoS values between the 2D probabilistic and 2D deterministic LEM analyses (Figure 14a–c,g–i), despite differences in the model inputs. This consistency can be attributed to the relatively small extent of the minor rock types (primary ore, oxidized ore from Table 4), which are structurally positioned in the left portion of the model.
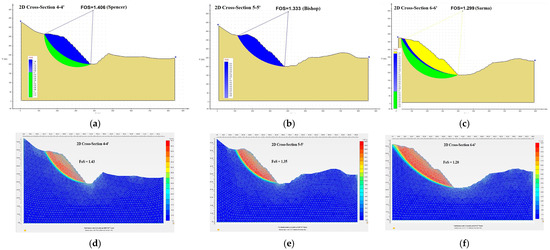

Figure 14.
Results of 2D analysis in critical sections. (a–c) Show 2D cross-section deterministic LEM models; (d–f) show 2D cross-section deterministic FEM models; and (h,i) show 2D cross-section probabilistic LEM models. (a) 4-4′ LEM Det. model FOS = 1.41; (b) 5-5′ LEM Det. model FOS = 1.33; (c) 6-6′ LEM Det. model FOS = 1.30; (d) 4-4′ FEM Det. model FoS = 1.43; (e) 5-5′ FEM Det. model FoS = 1.35; (f) 6-6′ FEM Det. model FoS = 1.28; (g) 4-4′ LEM Prob. model FoS = 1.41; (h) 5-5′ LEM Prob. model FoS = 1.33; and (i) 6-6′ LEM Prob. model FoS = 1.30.
5.4. Comparison of the Results
Slope stability analysis was conducted using both the LEM and the FEM in 2D and 3D. The deterministic and probabilistic approaches were employed to evaluate FoS and PoF under different modeling conditions. The results are summarized in Table 5, Table 6, Table 7 and Table 8, providing a comprehensive comparison of the stability performance for various methods, cross-sections, and modeling assumptions.

Table 5.
Summary of the deterministic FoS results (LEM vs. FEM, homogeneous model) rock mass strength parameters for GHB failure criterion.

Table 6.
Summary of the deterministic FoS results (LEM, heterogeneous model).

Table 7.
Summary of the probabilistic mean FoS results (LEM, heterogeneous model).

Table 8.
Summary of the probabilistic PoF results (LEM, heterogeneous model).
It is important to compare the FoS results obtained from slope stability analyses conducted on the same cross-section. Regardless of the analysis method used, the results show that the FoS tends to decrease as the cross-section progresses from 4–4′ to 6–6′. For example, in cross-section 6-6′ (Table 5), the 2D LEM results range from 1.30 to 1.31, which are fairly consistent with the 2D FEM result of FoS = 1.28, despite the use of different strength models, namely non-linear (GHB) and linear (EMC). The FoS results for the non-linear (GHB) heterogeneous models shown in Table 6 yield similar results to the homogeneous model in Table 5. These findings indicate that the influence of varying rock types on slope stability is relatively minor, while the overall geometry of the slope has a more pronounced effect on the resulting FoS. The differences are observable in Figure 14, particularly between (a) to (c) and (g) to (i) in the 2D sectional scale analysis. Additionally, comparisons between Figure 11 and Figure 13 in the 3D sectional scale analysis indicate that the various rock types are structurally positioned on the opposite side of the analyzed cross-sections, with the volume of oxidized ore, and primary ore is relatively small compared to the dominant rock type, schist. Consequently, in this study, no significant differences in the FoS results were observed between the homogeneous and heterogeneous models, likely due to the above-mentioned reasons.
In Table 7 and Table 8, the probabilistic analysis provides more reliable FoS results in terms of reliability by utilizing statistical tools. By incorporating PDFs rather than relying solely on mean values, these results offer a more accurate representation than deterministic analyses. When considering 3D extrusions, the results for a 100 m extrusion model are similar for both LEM and FEM analyses, as well as for the 200 m extrusion model. However, as the longitudinal length of the model increases, the FoS results also increase. For example, from Table 5, the 3D (100 m extrusion) model for cross-section 5-5′ yields an FoS of 1.52 for LEM (Bishop) and 1.50 for FEM, whereas the 3D (200 m extrusion) model shows a higher FoS of 1.54 for LEM (Bishop) and 1.54 for FEM. This suggests that the extrusion length of the model plays a crucial role in slope stability analysis. As illustrated in Figure 15 and Figure 16, the probabilistic analysis results demonstrate that an increase in model length correlates with a higher mean FoS. The purpose of comparing a variety of analysis methods, despite the similarity in results, is that accurate assumptions and alternative methods can provide reliable outcomes, whether using LEM, FEM, non-linear (GHB), or linear (EMC) approaches.

Figure 15.
Results of 2D and 3D slope stability analyses: (a) FoS results of LEM deterministic vs. probabilistic analysis in terms of 2D and 3D models; (b) FoS results of LEM of slices vs. FEM-SSR method.

Figure 16.
Results of 2D and 3D LEM probabilistic analyses in critical sections. (a) 4-4′ LEM prob. model mean FoS; (b) 5-5′ LEM prob. model mean FoS; (c) 6-6′ LEM prob. model mean FoS.
Figure 15 and Figure 16 illustrate a comparative analysis of 2D and 3D slope stability results using the LEM with various methods of slices and the FEM with the SSR technique, as well as deterministic versus probabilistic approaches. For Figure 15a, the graph compares the FoS and PoF across different geotechnical sections and 2D and 3D analysis methods (including both 100 m and 200 m extrusion models). Three types of FoS values are presented: (1) mean FoS from probabilistic analyses with heterogeneous rock properties, (2) FoS from deterministic analyses with homogeneous properties, and (3) FoS from deterministic analyses assuming homogeneous conditions. The PoF values are plotted by a line graph corresponding to the secondary y-axis. A clear trend is observed in which the FoS decreases and the PoF increases from cross-section 4 to 6, indicating that section 6 is less stable compared to section 4. A comparison of FoS results obtained from the LEM and FEM across different geotechnical sections (4-4′, 5-5′, and 6-6′), using both 2D and 3D deterministic models, is presented in Figure 15b. The LEM results are derived from five slices of methods—Bishop, GLE, Sarma, M-P, and Spencer—while the FEM results are determined using the SSR method. Figure 16 illustrates the mean FoS values obtained from probabilistic analyses for critical sections, using both 2D and 3D models.
6. Conclusions
The main findings of this study and recommendations for future research are summarized as follows.
- Based on the deterministic analysis results, both the 3D GHB (non-linear) and EMC (linear) models yielded similar FoS, indicating consistent behavior despite differences in input parameters and failure criteria. In 3D analyses, the horizontal extruded model significantly influenced the FoS values. Longer extruded lengths resulted in higher FoS values for both LEM using the GHB model and FEM using the EMC model. In contrast, 2D analyses—regardless of whether LEM or FEM was used—consistently produced lower FoS values compared to 3D analyses.
- To evaluate the uncertainty in rock strength parameters, the non-linear GHB model is the most appropriate model in rock slope stability. However, since most geotechnical engineers still use FEM on their analysis due to its reliability and popularity, the fitted EMC can also be utilized with GHB despite its longer computing time. The FEM simulations in this study assume homogeneous material properties within the rock mass to facilitate numerical convergence and reduce computational complexity. While this simplification allows for efficient modeling, it may overlook spatial variations, potentially affecting the predicted locations of critical slip surfaces and FoS values. Recognizing these limitations is important for interpreting the results and underscores the value of complementary approaches, such as 3D LEM with MPA, to capture the effects of heterogeneity and complex slope geometries more accurately.
- Employing 3D LEM-MPA, all open-pit locations can be analyzed at the same time, and exact or possible failure surface locations can be obtained. On the other hand, employing 3D FEM-SSR analysis, critical failure surface can be obtained in the same location as 3D LEM-MPA in terms of displacement and deformation without any slope surface search assumption. The FoS derived from 2D analysis consistently yields lower results compared to the FoS resulting from a 3D approach. This indicates that 2D analyses tend to be overly conservative. Although 2D analysis generally provides reliable and sufficient assessments for most geotechnical applications, its effectiveness can be reduced in more complex three-dimensional settings, such as large-scale mining excavations or other projects involving highly variable rock mass properties and irregular geometries.
- Due to the inherent uncertainty in the nature of rock masses, probabilistic approaches are more appropriate for achieving reliable characterizations of rock mass strength parameters. By incorporating mean values and their PDFs into a probabilistic analysis using MCS, more robust estimations of the FoS and PoF can be obtained in 3D LEM. FEM, on the other hand, require the solution of complex stress–strain relationships and constitutive models, making repeated simulations computationally demanding and time-consuming. As a result, their application has largely been restricted to deterministic analyses or limited sensitivity studies.
- It is important to acknowledge that the deterministic analyses assume a homogeneous rock mass with fixed mean strength parameters, whereas the probabilistic analyses explicitly incorporate heterogeneity by representing the variability of rock mass properties through PDFs. Consequently, the two approaches are based on different geological representations, and their results are not strictly comparable on a one-to-one basis. Instead, the comparison is intended to highlight how incorporating uncertainty and variability influences the evaluation of slope stability, rather than to directly equate the numerical outputs of the deterministic and probabilistic models. Clarifying this distinction strengthens the validity of the comparative conclusions by showing that the probabilistic framework provides a more realistic assessment of slope performance under natural variability, while the deterministic approach serves as a simplified baseline for reference.
- Future research should incorporate multiple analytical methods and software platforms for cross-validation and explore data-driven approaches such as machine learning to enhance the accuracy and automation of probabilistic slope stability analysis. Integrating diverse analytical methods and software platforms is essential for improving the robustness of probabilistic 3D slope stability assessments. A practical approach is to combine MCS with Karhunen–Loève (K-L) random field generation to capture spatial variability in 3D, while optimization techniques such as Particle Swarm Optimization (PSO) can be employed to efficiently identify critical slipping surfaces. This type of hybrid framework, in which LEMs are enhanced with optimization algorithms, allows for more accurate estimation of FoS and PoF while maintaining reasonable computational efficiency.
- Seismic loading and hydrological conditions should be considered, and additional site investigations, including borehole sampling and structural data collection (e.g., faults, joints), are needed to build a more detailed and realistic 3D geotechnical block model. Hydrological inputs are typically obtained from borehole investigations, piezometer installations, and pumping which provide information on groundwater levels, pore pressures, and hydraulic conductivity. Site-specific geotechnical investigations, such as shear-wave velocity profiling or blast vibration monitoring, further refine local seismic inputs. Together, these hydrological and seismic datasets provide the probabilistic distributions for pore pressures and seismic coefficients that can be incorporated into 3D LEM slope stability analyses, enabling more realistic assessments of slope performance under hydro-seismic loading.
Author Contributions
Methodology, T.T. and B.K.; formal analysis, T.T.; data curation, T.T.; validation, S.L. and Y.K.; writing—original draft preparation, T.T.; writing—review and editing, S.L., Y.K. and B.K.; supervision, B.K.; funding acquisition, B.K. All authors have read and agreed to the published version of the manuscript.
Funding
This work was funded by the South Korean Ministry of Environment (MOE) (RS-2025-01842973).
Institutional Review Board Statement
Not applicable.
Informed Consent Statement
Not applicable.
Data Availability Statement
The original contributions presented in this study are included in the article. Further inquiries can be directed to the corresponding author.
Acknowledgments
This work was supported by the Management Technology for Groundwater Dams in Water Supply Vulnerable Areas Program of the Korea Environmental Industry & Technology Institute (KEITI).
Conflicts of Interest
Author Tuvshinbaatar Tsevegmid was employed by the company Bezalel Construction Co., Ltd. The remaining authors declare that the research was conducted in the absence of any commercial or financial relationships that could be construed as a potential conflict of interest.
References
- McQuillan, A.; Bar, N.; Yacoub, T. On the comparison of 2D and 3D stability analyses of an anisotropic slope. In The Evolution of Geotech—25 Years of Innovation, 1st ed.; CRC Press: Boca Raton, FL, USA, 2021; pp. 295–306. [Google Scholar]
- Zebarjadi Dana, H.; Khaloo Kakaie, R.; Rafiee, R.; Yarahmadi Bafghi, A.R. Effects of geometrical and geomechanical properties on slope stability of open-pit mines using 2D and 3D finite difference methods. J. Min. Environ. 2018, 9, 123–135. [Google Scholar]
- Sjöberg, J. Analysis of Large-Scale Rock Slopes. Ph.D. Thesis, Luleå Tekniska Universitet, Luleå, Sweden, 1999. [Google Scholar]
- Wines, D. A comparison of slope stability analyses in two and three dimensions. J. South. Afr. Inst. Min. Metall. 2016, 116, 373–380. [Google Scholar] [CrossRef]
- Shamsoddin Saeed, M.; Maarefvand, P.; Yaaghubi, E. Two and three-dimensional slope stability analyses of final wall for Miduk mine. Int. J. Geo-Eng. 2015, 6, 9. [Google Scholar] [CrossRef][Green Version]
- Stacey, T. Slope stability in high stress and hard rock conditions. In Proceedings of the International Symposium on Rock Slope Stability in Open Pit Mining and Civil Engineering, Perth, Australia, 12–14 September 2007; pp. 187–200. [Google Scholar]
- Bar, N.; Johnson, T.M.; Weekes, G. Using directional shear stress models to predict slope stability in highly anisotropic rock masses. In Proceedings of the ISRM International Symposium—EUROCK, Ürgüp, Turkey, 29–31 August 2016; pp. 123–130. [Google Scholar]
- Bar, N.; McQuillan, A. 3D Limit Equilibrium Slope Stability Analysis for Anisotropic and Faulted Rock Masses in Australian Coal and Iron Ore Mines. In Proceedings of the ISRM International Symposium—10th Asian Rock Mechanics Symposium, Singapore, 29 October–3 November 2018; p. 12. [Google Scholar]
- McQuillan, A.; Bar, N. The necessity of 3D analysis for open-pit rock slope stability studies: Theory and practice. J. South. Afr. Inst. Min. Metall. 2023, 123, 567–578. [Google Scholar] [CrossRef]
- EM 1110-2-1902; Engineering Manual, Engineering and Design, Slope Stability. U.S. Army Corps of Engineers: Washington, DC, USA, 2003.
- Lu, H.; Fredlund, M. Three-dimensional limit equilibrium analysis of open pits. In Proceedings of the 2013 International Symposium on Slope Stability in Open Pit Mining and Civil Engineering, Brisbane, Australia, 25–27 September 2013; pp. 1–14. [Google Scholar]
- Yang, R.; Sun, B.; Wan, Y.; Gao, X. Application of the Improved Entry and Exit Method in Slope Reliability Analysis. Appl. Sci. 2023, 13, 10081. [Google Scholar] [CrossRef]
- Wyllie, D.C.; Mah, C.W. Rock Slope Engineering, Civil and Mining, 4th ed.; CRC Press: Boca Raton, FL, USA, 2005. [Google Scholar]
- Sun, S.; Wang, W.; Zhao, F. Three-Dimensional Stability Analysis of a Homogeneous Slope Reinforced with Micropiles. Math. Probl. Eng. 2014, 4, 864017. [Google Scholar] [CrossRef]
- Griffiths, D.V.; Lane, P.A. Slope stability analysis by finite elements. Geotechnique 1999, 49, 305–318. [Google Scholar] [CrossRef]
- Griffiths, D.V. Slope stability analysis by finite elements. Geotechnique 2001, 51, 609–615. [Google Scholar] [CrossRef]
- Abdulai, M.; Sharifzadeh, M. Probability Methods for Stability Design of Open Pit Rock Slopes: An Overview. Geosciences 2021, 11, 319. [Google Scholar] [CrossRef]
- QMC LLC. Geotechnical Review of Bayan-Airag Open Pit Mine, Mongolia; QMC LLC: Ulaanbaatar, Mongolia, 2020. [Google Scholar]
- PSM Consult Pty Limited. First Operational Geotechnical Review, Australia; PSM Consult Pty Limited: Sydney Australia, 2015. [Google Scholar]
- MineData LLC. Bayan-Airag Open Pit Mine Feasibility Study, Mongolia; MineData LLC: Ulaanbaatar, Mongolia, 2021. [Google Scholar]
- Mining Institute. Bayan-Airag Open Pit Mine Rock Laboratory Test Report, Mongolia; Mining Institute: Ulaanbaatar, Mongolia, 2020. [Google Scholar]
- Mining Institute. Bayan-Airag Open Pit Mine Rock Laboratory Test Report, Mongolia (Updated Version); Mining Institute: Ulaanbaatar, Mongolia, 2007. [Google Scholar]
- Rocscience Inc. RSData Documentation. Available online: https://www.rocscience.com/help/rsdata/documentation (accessed on 31 March 2025).
- Hoek, E.; Carranza-Torres, C.; Corkum, B. Hoek Brown Failure Criterion, 2002 Edition. In Proceedings of the NARMS-TAC Conference, Toronto, ON, Canada, 7–10 July 2002. [Google Scholar]
Disclaimer/Publisher’s Note: The statements, opinions and data contained in all publications are solely those of the individual author(s) and contributor(s) and not of MDPI and/or the editor(s). MDPI and/or the editor(s) disclaim responsibility for any injury to people or property resulting from any ideas, methods, instructions or products referred to in the content. |
© 2025 by the authors. Licensee MDPI, Basel, Switzerland. This article is an open access article distributed under the terms and conditions of the Creative Commons Attribution (CC BY) license (https://creativecommons.org/licenses/by/4.0/).