Abstract
This study investigates the relationship between anchor cable drilling parameters and roadway roof strata properties. The goal is to enable rapid and accurate rock type identification. Field-measured drilling data were processed using data cleaning and wavelet transform noise reduction. Four recognition models were developed and compared: LSTM (Long Short-Term Memory), BiLSTM (Bidirectional Long Short-Term Memory), DBO-LSTM (Dung Beetle Optimizer), and DBO-BiLSTM. The results demonstrate a strong correlation between vibration, pressure signals and rock strength, enabling the effective differentiation of rock types. All models performed exceptionally for coal seams with distinct features, achieving 100% accuracy, precision, recall, and F1 scores. Model performance improved with increased complexity for strata with subtle differences, such as sandstone and mudstone. The DBO-BiLSTM model outperformed others, showing significant improvements in accuracy, recall, and F1 score compared to LSTM, BiLSTM, and DBO-LSTM models. Specifically, accuracy improved by up to 9%, recall by 12.48%, and F1 score by 13.06%. These findings highlight the DBO-BiLSTM model’s superior recognition capability for roof strata drilling signals. This method provides a robust technical foundation for lithology identification in Measurement While Drilling (MWD) systems. It supports more precise and efficient roadway design in complex geological conditions.
1. Introduction
In coal mining, the stability and transparency of roadway roofs are key factors in ensuring miner safety and improving mining efficiency [1,2,3]. Accurate identification of roadway roof strata is crucial for predicting and preventing roof disasters, optimizing support design, and improving resource recovery rates [4,5]. Traditional rock strata identification methods rely on geological exploration, borehole sampling, and laboratory testing. These methods are time-consuming, labor-intensive, costly, and make it difficult to achieve real-time monitoring and dynamic analysis. With the rapid development of sensor technology, signal processing technology, and machine learning algorithms, it is possible to use drilling parameters to identify roadway roof strata intelligently [6].
Drilling parameters, including drilling vibration, pressure, torque, and rotation speed, directly reflect the physical properties of rock, such as hardness, strength, fracture development degree, and rock mass structure [7,8,9]. By analyzing the changes in drilling parameters, the types and properties of rocks can be indirectly inferred [10]. However, the relationship between drilling parameters and rock properties is often nonlinear and multi-factor coupling [11,12]. It is difficult for traditional analysis methods to accurately identify and quantify this relationship. Therefore, developing an intelligent identification method for rock strata based on drilling parameters is of great theoretical and practical value. It can help improve coal mine safety during production and enhance resource development efficiency.
Many studies have identified the properties of rock strata by analyzing signals such as vibration, pressure, and torque generated during drilling. For example, Li et al. established an indoor drilling test platform and, based on the rock-breaking mechanism of the PDC part, derived a quantitative relationship between drilling parameters and the uniaxial compressive strength and shear strength of rocks. This fundamentally studied the mechanical relationship between drilling parameters and rock properties [13]. Qin et al. employed vibration spectrum and acoustic spectrum analysis methods. They investigated the signal characteristics of different rock formations during the drilling process and achieved rock layer identification based on these signals. This provided theoretical support for using vibration and acoustic signals for lithology identification [14]. Zhang et al. integrated the Kernel Fuzzy C-Means (KFCM) algorithm with fuzzy mathematics to achieve rapid lithology identification in coal-bearing strata. This method introduced a new approach to data clustering analysis [15]. Liang et al. proposed a formation identification method based on multiple parameters and Bayesian principles. They optimized model parameters through ROC analysis to improve identification accuracy [16]. Sun et al. developed a comprehensive index based on Modulation Specific Energy and rock drillability assessment. They employed a decoupling model to eliminate permeability effects, increasing lithology identification accuracy to 84%. This demonstrated that comprehensive evaluation indices and data decoupling processing could significantly enhance identification performance [17]. However, these methods still face many challenges in practical applications. The complexity and variability of drilling signals and the similarity of different rock characteristics make it difficult to guarantee the accuracy and stability of recognition results.
To solve the above problems, in recent years, machine learning and deep learning techniques have been introduced into the field of lithology identification [18,19]. Deep learning models have powerful feature extraction and pattern recognition capabilities. They can automatically extract key features related to rock properties from complex drilling signals, significantly improving the accuracy and reliability of rock layer recognition. For example, Stehlíková et al. proposed a method for rock classification based on vibration signals transmitted during rotary drilling. They used machine learning decision tree tools to rapidly and accurately identify rock types [20]. Wang developed a coal–rock interface recognition system based on drilling parameters using an SVM classification algorithm. This system enabled automatic recognition of the coal–rock interface, ensuring the quality of drilling construction [21]. Fernández et al. developed a method for identifying rock mass discontinuities based on MWD data and machine learning classifiers. They established the relationship between the discontinuity index (DI) and drilling parameters and verified the application of this method in different fields. The recognition rate increased to 89–96%, providing a practical engineering solution for underground mining [22]. Zagré et al. developed a tool for accurately identifying coal seam top coal based on MWD data and machine learning classifiers. They achieved real-time identification of coal seams by correcting geophysical logging data through artificial neural network regression [23]. Fang et al. developed a rock classification neural network model based on dynamic numerical simulation and transfer learning. This approach solved the problem of insufficient rock identification data by generating much simulation data [24]. Wu et al. proposed a roof deterioration area identification method based on combining an LSTM recurrent neural network and a random forest algorithm. This method uses borehole measurement signals to effectively identify layered space and deterioration areas [25]. Although existing studies have attempted to use vibration, pressure, torque, and other signals to identify rock strata, the accuracy and stability of these methods still face challenges. The complexity of drilling signals and the similarity of rock strata characteristics make accurate identification difficult.
To improve recognition accuracy, deep learning technology has been introduced into the field of lithology recognition in recent years. Specifically, Long Short-Term Memory (LSTM) networks and Bidirectional LSTM (BiLSTM) networks have become the focus of research due to their powerful capabilities in processing time series data [26]. This study proposes an intelligent identification method of roadway roof strata based on drilling parameters. The relationship between drilling parameters and rock characteristics is analyzed using measured data. Data cleaning and wavelet transform noise reduction are applied for preprocessing. Finally, the BiLSTM model based on DBO optimization is used for strata identification. This method can effectively improve the recognition accuracy of different rock strata and provide technical support for identifying roadway roof rock strata and optimizing support design.
2. Drilling Parameters and Rock Information Acquisition
The drilling parameters are obtained by using an anchor cable drilling test. The acquisition location is the auxiliary transportation roadway of 112205 fully mechanized mining face in Xiaobaodang No.1 Coal Mine. The acquisition area is in the roadway mileage of 4100 m to 4600 m. The roof lithology in the sampling area is predominantly sandstone, with a thickness ranging from 18.92 to 25.9 m and an average thickness of 22.41 m. Locally, thin coal seams and mudstone interlayers are present. The strata have a dip angle of less than 1°. The uniaxial compressive strength of the immediate roof ranges from 16.20 to 27.20 MPa, with an average of 21.65 MPa. The acquisition equipment includes multi-parameter sensors (integrated pressure, torque, rotation speed, and vibration), cable-type displacement sensors, and mine-specific, intrinsically safe, multi-parameter measuring instruments while drilling, as shown in Figure 1. The collected drilling parameters include pressure, torque, rotation speed, and vibration. In total, 57 on-site drilling tests were conducted, with one set of data collected per test. Within each set, data were recorded at 1 s intervals. Due to varying drilling durations in each test, the data points per set ranged from approximately 5000 to 7000.
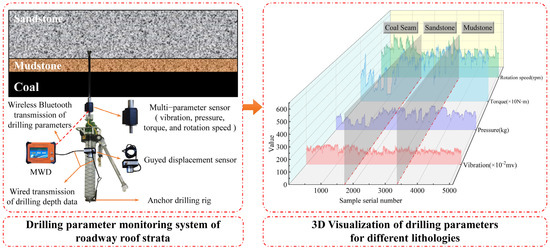
Figure 1.
Drilling parameter acquisition schematic diagram.
The roof rock layer drilling peep instrument determines the rock layer information. The peeping location and area correspond to the drilling parameter acquisition points. The acquisition equipment is a YS(B) type drilling peep instrument. The main components are the host, probe, data line, probe rod, and power supply. The collected rock information covers rock properties, rock thickness, etc.
Table 1 presents a selection of the collected drilling parameters and corresponding lithology data, which serve as the foundation for analyzing the relationship between drilling signals and rock properties. These data provide critical insights into parameter variations such as drilling vibration and pressure, which are key indicators of different rock types.

Table 1.
Examples of drilling parameters and rock information.
3. Drilling Parameter Analysis and Data Processing
3.1. Correlation Analysis Between Drilling Parameters and Rock Strength
3.1.1. Data Coherence Analysis
To analyze the consistency and variability of the drilling test results, statistical indicators such as standard deviation (SD) and coefficient of variation (CV) can be used to quantify the fluctuation and stability of the results from multiple experiments.
- (1)
- Compute SDwhere Xi is each individual experimental result; is the mean of all results; and n is the total number of experiments.
- (2)
- Compute CV
The standard deviation and coefficient of variation of the drilling test data were calculated, and the results are shown in Table 2. By analyzing the stability and reliability of four key parameters—rotation speed, pressure, torque, and vibration—from three aspects—mean, SD, and CV—it can be observed that the overall data exhibit good controllability, with some parameters’ fluctuations within a reasonable range, indicating potential for further optimization.

Table 2.
Statistical summary of key parameters from drilling test results.
The coefficient of variation for rotation speed falls within the moderate fluctuation range (10–20%), indicating high data stability. The control of rotation speed during the experiment was relatively precise, with minimal error. The coefficient of variation for pressure is higher (>20%) but still within a reasonable and controllable range, possibly influenced by dynamic changes in the experimental environment. However, this fluctuation characteristic still effectively reflects the pressure distribution under different working conditions. The torque parameter exhibits good stability, with a coefficient of variation lower than pressure and vibration, indicating uniform torque control, which aligns with experimental expectations. Its lower fluctuation suggests strong predictability of the torque parameter during the experiment, providing reliable data support. The vibration parameter exhibits a certain degree of fluctuation. Its coefficient of variation is similar to that of pressure, indicating that the data remain within a controllable range. The more considerable fluctuation in vibration signals may result from changes in the experimental environment and equipment operation. However, it also highlights the sensitivity of vibration signals in rock layer identification.
In summary, further optimization of the model and data processing methods can enhance the reliability of this dataset. This will improve the accuracy of coal mine roof strata identification and increase the model’s practical application value in engineering.
3.1.2. Pearson Correlation Analysis
Pearson correlation analysis was used to quantify the correlation between drilling parameters and rock strength. Pearson correlation analysis is a statistical method used to measure the strength and direction of the linear relationship between two continuous variables. The analysis results are usually represented by a Pearson correlation coefficient, ranging from −1 to 1.
- (1)
- When the correlation coefficient is 1, there is a completely positive correlation; the two variables are linearly positively correlated. When one variable increases, the other variable also increases.
- (2)
- When the correlation coefficient is −1, it means a complete negative correlation; the two variables are linearly negatively correlated. When one variable increases, the other variable decreases.
- (3)
- When the correlation coefficient is 0, there is no linear relationship, but it does not mean there is no other type of relationship between the two variables.
The calculation formula of the Pearson correlation coefficient is as follows:
where Xi and Yi are the observed values of the two variables and their mean values, respectively.
The correlation analysis results between drilling parameters and rock strength are shown in Figure 2.
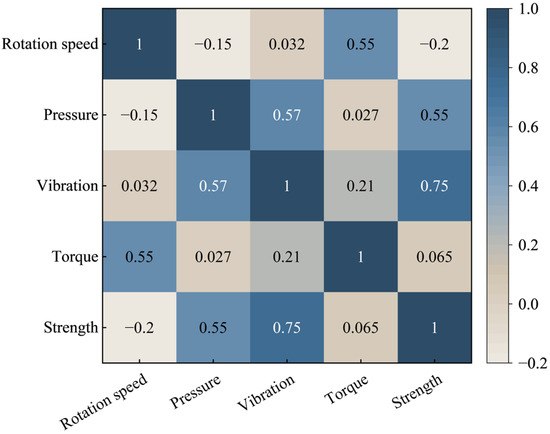
Figure 2.
Correlation heat map.
According to the Pearson correlation heat map, there are different degrees of correlation between drilling parameters and between drilling parameters and rock strength. The correlation between rotation speed and torque is the highest, with a coefficient of 0.55, indicating a moderate positive correlation between them. This is because torque is directly influenced by rotation speed; as the speed increases, the resistance from the rock also rises, leading to a corresponding increase in torque. The correlation between rotation speed and rock strength is relatively weak, with a coefficient of −0.2, showing a slight negative correlation. This may be because higher-strength rocks require lower rotation speeds to prevent excessive wear and bit damage, while softer rocks allow higher speeds with less resistance. The correlation between pressure and vibration is also significant, with a coefficient of 0.57, indicating a strong positive correlation. Higher drilling pressure can explain this, enhancing the interaction force between the bit and the rock, leading to more pronounced vibrations. The correlation between pressure and rock strength is also high, with a coefficient of 0.55, showing a moderate positive correlation. Generally, higher-strength rocks require higher drilling pressures to maintain drilling efficiency, which accounts for this relationship. The correlation between vibration and rock strength is the most significant, with a coefficient of 0.75, indicating a strong positive correlation between them. This is likely because more substantial rocks generate more resistance to drilling, causing more intense vibrations as the drill bit encounters increased cutting resistance. In contrast, the correlation between vibration and rotation speed is the lowest, with a coefficient of only 0.032, which is almost negligible. This suggests that rotation speed alone has little impact on vibration, likely because factors such as bit–rock interaction and pressure play a more dominant role in vibration generation. Finally, the correlation between torque and speed is also high, with a 0.55 coefficient indicating a moderate positive correlation. This relationship arises because the bit requires more cutting force as speed increases, increasing torque. However, the correlation between torque and rock strength is relatively low, with a 0.065 coefficient indicating a weak correlation. This may be due to differences in rock fragmentation mechanisms—some high-strength rocks fracture in a brittle manner, requiring less torque. In contrast, softer rocks may generate more friction and resistance, leading to inconsistent effects on torque.
3.1.3. Multiple Correlation Analysis
- (1)
- Multicollinearity detection
Detecting multicollinearity among the independent variables before performing multiple correlation analysis is necessary to avoid issues such as model instability or poor interpretability.
Variance Inflation Factor (VIF): If VIF > 10, it indicates strong multicollinearity between the independent variables, and consideration should be given to removing or merging highly correlated variables.
- (2)
- Multiple linear regression model
The multiple linear regression model is constructed in the following form:
where Y is the dependent variable (strength); X1, X2, X3, X4 are the independent variables, where X1 is the rotation speed, X2 is the pressure, X3 is the vibration, and X4 is the torque; b0, b1, b2, b3, b4 are the regression coefficients; and ε is the error term.
- (3)
- Model training and evaluation
Model fitting: The model is trained using ordinary least squares (OLS).
Multiple correlation coefficient (R2): Used to evaluate the overall explanatory power of the model. It represents the degree to which the model explains the dependent variable, with a value closer to 1 indicating a better fit.
Significance Tests:
F-test: Tests the overall significance of the model (p-value < 0.05 indicates significance).
t-test: Tests the significance of each independent variable’s regression coefficient (p-value < 0.05 indicates significance).
As shown in Table 3, the model’s R2 is 0.302, indicating that the four factors (rotation speed, pressure, vibration, and torque) do not effectively predict or explain variations in strength. The model passed the F-test (F = 1092.00, p = 0.000 < 0.05), and the VIF values are all below 10, suggesting no severe multicollinearity issue, confirming the model’s reliability. Additionally, the P-values of the t-tests for all four independent variables are less than 0.05. The regression coefficients for pressure and vibration are positive. In contrast, the coefficient for torque is negative, indicating that pressure, vibration, and torque have a weak positive correlation with strength in the model. In contrast, rotation speed has a negative correlation with strength. This result is consistent with the correlation analysis, further validating the model’s reliability. The regression equation is y1 = 2.302 − 0.044x1 + 0.180x2 + 0.380x3 − 0.146x4.

Table 3.
Multiple correlation analysis.
The following conclusions were drawn based on the above analysis: Pearson correlation analysis indicates that vibration has the strongest correlation with strength, followed by pressure. The multiple correlation analysis shows that rotation speed, pressure, vibration, and torque do not effectively predict or explain variations in strength. Therefore, this study identifies vibration and pressure as key signals for recognizing the characteristics of roadway roof strata. The strong correlation between vibration and pressure suggests that these parameters can effectively reflect variations in rock strength, providing reliable data support for identifying the properties of roadway roof rock.
During the drilling process, the interaction between the drill bit and the rock alters the local stress field and induces the expansion of microcracks and the disturbance of the rock mass structure. The mechanical properties of different lithologies result in varying responses to drilling disturbances. For example, due to its high brittleness, sandstone is prone to secondary fractures under high-frequency vibrations, further weakening the integrity of the rock mass. In contrast, with its strong plasticity, mudstone may undergo creep deformation under sustained stress, leading to gradual structural adjustments. These changes in a rock’s physical properties can be indirectly monitored and analyzed through the frequency-domain characteristics of vibration signals (such as energy distribution) and the time-varying trends of pressure signals. This helps reveal the intrinsic correlation between drilling parameters and lithology, providing a reliable basis for lithology identification.
3.2. Analysis of Original Drilling Parameters
The anchor cable drilling operation usually involves the stages of drilling, standard drilling, and back drilling. After analyzing the on-site drilling data, some data with a complex rock strata combination were selected. Figure 3 shows the measured data of three drilling parameters: vibration, pressure, and displacement when the drilling rig is drilling into a specific rock combination. It can be seen from the figure that the vibration and pressure signals show a clear correspondence regardless of the position of the drill bit in the rock layer or the working condition.
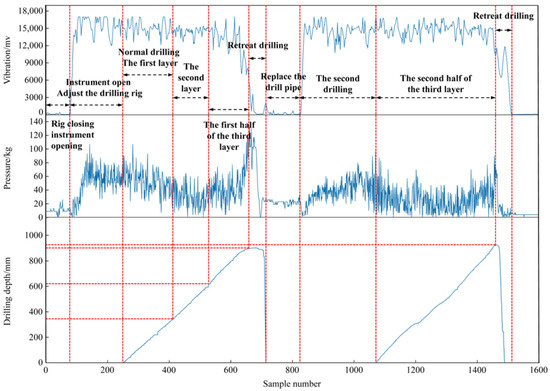
Figure 3.
Original drilling parameter analysis example.
Specifically, when the rig is normally drilled in layers 1, 2, and 3, the vibration and pressure values are higher. This shows that coal and rock cutting require an immense oil pressure in the normal drilling process and will produce strong vibration. In contrast, the vibration and pressure values of the drilling rig during the drilling and withdrawal stages are lower. When drilling, the vibration and pressure values gradually increase from the minimum to the normal drilling level; during the withdrawal, the vibration and pressure values gradually decrease from the normal drilling level.
Figure 4 shows the corresponding drilling profile results. From Figure 4, it can be seen that the first layer is mudstone, with a thickness of 382 mm. Its vibration value is low (mean 14,176.24 mv), and the pressure value is high (mean 51.33 kg). This reflects the low strength and high plasticity of the mudstone. During drilling, due to its high plasticity, the drill bit causes low vibration. However, due to its low strength, higher drilling pressure is needed to maintain drilling efficiency, resulting in higher pressure values. The second layer is coal, with a thickness of 230 mm. Its vibration value increases (mean 14,392.57 mv), and the pressure value decreases (mean 26.29 kg). Compared to mudstone, coal has lower strength and brittleness. The drill bit easily causes fractures and vibrations, leading to higher vibration values. Coal also has lower cutting resistance, so less pressure is required during drilling, resulting in lower pressure values. The third layer is sandstone, with a thickness of 1205 mm. Both vibration and pressure values increase (mean 14,786.92 mv, 56 kg). Sandstone is harder, creating greater cutting resistance during drilling, which requires more drilling pressure, leading to higher pressure values. At the same time, the hardness and brittleness of the rock cause stronger vibrations, which results in higher vibration values. These data changes reflect the influence of different rock layer mechanical properties on drilling parameters.
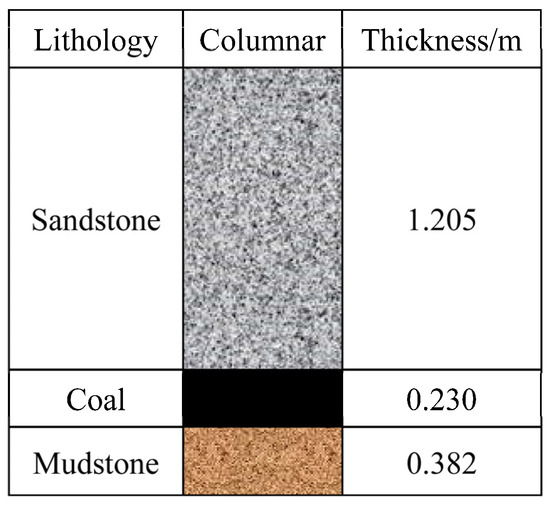
Figure 4.
Borehole peep results.
The comprehensive analysis shows that the variation trend of vibration and pressure during drilling reflects the influence of rock characteristics on drilling parameters. An in-depth analysis of vibration and pressure parameters provided an understanding of the dynamic changes in the drilling process, which can accurately reflect the working condition of the drilling rig and provide a scientific basis for identifying roadway roof strata.
3.3. Drilling Parameter Data Preprocessing
3.3.1. Non-Drilling Stage Data
During the drilling process of the drilling rig, a large number of non-drilling data are generated due to the drilling processes, adding drill pipe, returning drill pipe, tool replacement, etc., which will interfere with the analysis of normal drilling state data. Therefore, special treatment is needed to avoid interference with the results of data analysis. The pressure F and vibration a were used as the evaluation indexes to judge whether the drilling rig is in a non-drilling state, and a binary state discriminant function was constructed. When the constructed discriminant function is 0, the drilling rig is judged to be in a non-drilling state, and the data must be eliminated. When the discriminant function is 1, it is determined that the drilling rig is in a working state and the data are retained. The construction function is as follows:
where F is pressure, and a is vibration.
In the processing, the datum of each moment is calculated one by one, and then the vacant period datum of I = 0 is eliminated.
3.3.2. Abnormal Data Processing
Because of the variability of geological conditions and the subjective operation of operators in the drilling process of drilling rigs, some abnormal values would inevitably appear in the original data. These abnormal values, or outliers, are data points that significantly deviate from the expected or typical pattern of the dataset. They may result from various factors, such as unexpected geological anomalies, equipment malfunctions, or human errors during drilling. Identifying and addressing these outliers is crucial to ensure the accuracy and reliability of subsequent data analysis and decision-making processes. To deal with these outliers and missing values, this paper used the quartile method to identify the abnormal parts of the data. It used the Lagrange interpolation method to fill these abnormal or missing data. The IQR (interquartile range) method is a commonly used outlier detection method that identifies and processes outliers by analyzing the middle part of data distribution. This method mainly uses the quartiles of the dataset (i.e., the 25%, 50%, and 75% quantiles of the data) to determine which data points deviate from the normal range.
where Q1 is the lower quartile, that is, 25% of the data points in the dataset are less than or equal to Q1; Q3 is the upper quartile, that is, 75% of the data points in the dataset are less than or equal to Q3; IQR is the range between quartiles, that is, the range of 50% between datasets; M is the lower limit of non-abnormal value; and N is the upper limit of non-abnormal value.
3.3.3. Drilling Signal Data Denoising
To effectively preprocess drilling signal data, this study employed Wavelet Denoising technology. Wavelet Denoising decomposes the signal into different frequency bands through wavelet transform and applies threshold processing to the wavelet coefficients of each band to remove noise. Unlike traditional Fourier transform, wavelet transform features multi-resolution analysis, allowing localized processing in both the time and frequency domains, making it particularly suitable for denoising non-stationary signals.
- (1)
- Selection of Wavelet BasisThe choice of wavelet basis significantly affects signal reconstruction, denoising performance, and feature preservation (e.g., transient characteristics and edge information). In this study, the following wavelet bases were selected:
- (1)
- Daubechies (db4, db6): Daubechies wavelets have compact support and high symmetry. db4 is suitable for smoother signals, while db6 is better at capturing fine details.
- (2)
- Symlet (sym4): Symlet is the symmetric version of Daubechies wavelets, offering better symmetry and lower ringing effects. It is suitable for denoising and reconstructing signals where smoothness is required.
- (3)
- Coiflet (coif3): Coiflet wavelets excel in symmetry and approximation, providing high signal reconstruction and denoising accuracy.
- (2)
- Decomposition Levels
Decomposition level refers to the number of layers a signal is decomposed into during the wavelet transform. It determines the scale and number of frequency bands the signal is divided into. More decomposition levels retain more details of the signal but may also increase reconstruction errors, as more high-frequency noise is preserved, affecting reconstruction accuracy.
- (3)
- Thresholding MethodsTwo thresholding methods were adopted in this study:
- (1)
- BayesShrink: Based on the Bayesian criterion, it adaptively sets the threshold according to the noise level of the signal. It generally achieves more precise denoising while preserving key features of the signal.
- (2)
- NeighShrink: An adaptive thresholding method based on neighborhood information. It adjusts the threshold by considering the average of neighboring signals. Compared to BayesShrink, NeighShrink produces smoother denoising results but may slightly underperform in signal-to-noise ratio (SNR).
- (4)
- Result Analysis
Four wavelet bases (db4, db6, sym4, and coif3), three decomposition levels (3, 4, and 5), and two thresholding methods (BayesShrink and NeighShrink) were used to denoise drilling pressure signals. The denoising performance was evaluated using signal-to-noise ratio (SNR), mean square error (MSE), and signal fidelity (PRD). The results are shown in Table 4.

Table 4.
Denoising results with different wavelet transform parameters.
According to Table 4, the denoising performance is optimal when the wavelet basis is db4, the decomposition level is 3, and the thresholding method is BayesShrink. Therefore, the final selected parameter combination was wavelet basis db4, decomposition level 3, and BayesShrink. A comparison between the optimal denoised signal and the original noisy signal is shown in Figure 5.
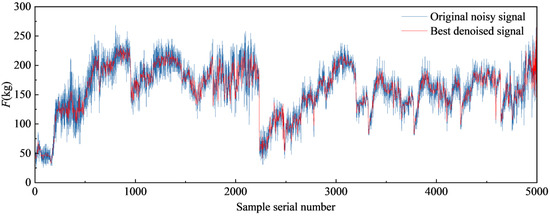
Figure 5.
Comparison of the optimal denoised signal and the original noise signal.
Taking the collected drilling parameters as the data preprocessing object, a set of drilling data was selected to show several common working conditions in the drilling process. Figure 6 shows the complete drilling process, including drilling, standard drilling, and withdrawal. Among them, the drill pipe needs to be returned when the drill pipe is added, so each time the drill pipe is added, there will be a short empty drilling stage. At this time, all the data will be reduced to zero, which is a non-drilling stage. The normal drilling stage data shown in Figure 6 are the focus of this paper. In addition, Figure 6 also clearly shows the abnormal values in the drilling data. The data and outliers in the non-drilling stage were eliminated by data preprocessing operation, and the processed data were denoised. Finally, the preprocessing results of drilling parameter data are shown in Figure 7.
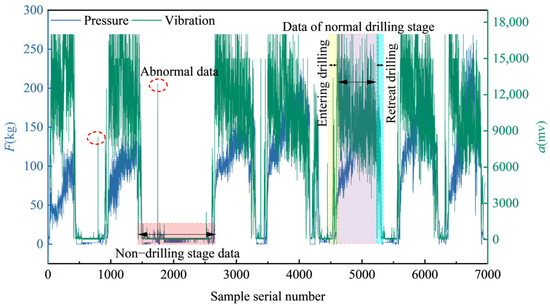
Figure 6.
Original data of drilling parameters.
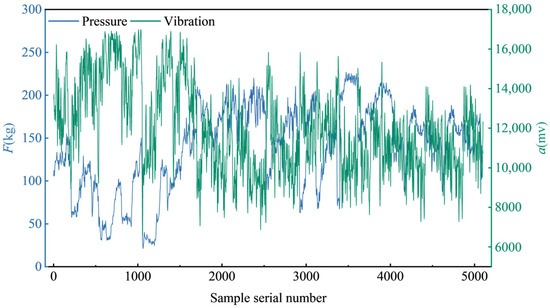
Figure 7.
Drilling parameter display after data processing.
4. Roof Strata Identification Model of the Roadway
4.1. Algorithm Principle
4.1.1. Dung Beetle Optimizer
Dung Beetle Optimizer (DBO) is a swarm intelligence optimization algorithm that simulates the behavior of dung beetles. Xue and Shen proposed this algorithm in 2022, and its design was inspired by the natural behavior of dung beetles, including ball-rolling, dancing, foraging, stealing, and breeding [27].
The dung beetle optimization algorithm uses an iterative method to find the optimal solution by simulating the foraging behavior of dung beetles in nature. While finding food (i.e., solutions), dung beetles follow specific paths and constantly adjust their behavior according to environmental information to improve search efficiency.
The algorithm steps are as follows:
- (1)
- Initialization
Population initialization: Initialize the dung beetle population. Each dung beetle represents a potential solution. The initial solution can be generated randomly.
Parameter setting: Set the parameters of the dung beetle optimization algorithm, such as population size and the maximum number of iterations.
- (2)
- Evaluation function
Fitness evaluation: Calculate the fitness value corresponding to each dung beetle, and the fitness function is defined according to the specific problem to evaluate the pros and cons of the solution.
- (3)
- Iterative process (dung beetle behavior simulation)
Rolling behavior: Dung beetles explore by rolling dung balls when looking for food. In the algorithm, this step corresponds to the neighborhood search for the solution.
Following behavior: dung beetles follow the optimal individual or neighbor when handling food. This corresponds to the information exchange and sharing between individuals in the algorithm.
Separation behavior: After the food is moved to the right place, the dung beetle separates to find a new food source. This step corresponds to the global search for the solution to prevent falling into the local optimum.
- (4)
- Update mechanism
Location update: Based on dung beetle behavior, update the location of each dung beetle in the population, that is, update the solution.
Fitness update: recalculate the fitness value of each solution.
- (5)
- Convergence judgment
Termination condition: determine whether the termination condition is reached, such as the maximum number of iterations or the convergence of fitness value. If the termination condition is reached, the optimal solution is output. Otherwise, continue the iteration.
4.1.2. Bidirectional Long Short-Term Memory
Because the drilling process of the drilling rig is continuous, the drilling signal data collected by the sensor had a causal relationship with time. The prediction result at the current moment needs to be determined by using the state information of the past moment and the subsequent moment as input. The traditional Long Short-Term Memory network (LSTM) is a recurrent neural network that can learn long-term information independently. Still, because it can only transmit information from front to back, it cannot consider the impact of future information on the current moment. A Bidirectional Long Short-Term Memory network (BiLSTM) is an enhanced LSTM, especially suitable for processing and predicting time series data. BiLSTM combines the advantages of LSTM and captures the forward and backward dependencies in the sequence through a two-way structure, thereby improving the ability to understand and predict complex sequence data. The BiLSTM network structure is shown in Figure 8, which mainly includes four parts: input layer, forward LSTM layer, backward LSTM layer, and output layer [28].
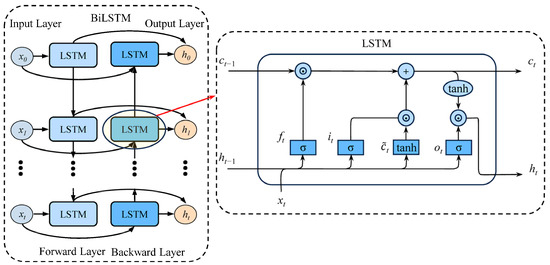
Figure 8.
BiLSTM structure diagram.
The calculation process of the LSTM part is as follows:
where ft, it, and ot are the units of the forgetting gate, input gate, and output gate. is the candidate memory unit; and Wf, Wi, Wc, and Wo are the weight matrices of the first four units. bf, bi, bc, bo are the bias of the first four units; and ct−1 and ct are the memory unit state of the previous time step and the memory unit state of the current time step, respectively. ht−1 and ht are the hidden state of the last time step and current step, respectively. σ is the sigmoid activation function.
BiLSTM captures the bidirectional dependence of the sequence by combining the output of the forward LSTM and the backward LSTM. The calculation process is as follows:
where xt is the input of the current time step; is the output of the forward LSTM layer; is the hidden state of the previous time step; is the output of the backward LSTM layer; is the hidden state of the next time step; LSTMFW is the weight matrix of forward LSTM; LSTMBW is the weight matrix of backward LSTM; and ht is the final output of BiLSTM.
4.2. Model Construction
4.2.1. Establishment of the DBO-BiLSTM Model
This study constructs a roadway roof strata recognition model combining the DBO algorithm and BiLSTM neural network, as shown in Figure 9. The construction process of the model is divided into four main steps:
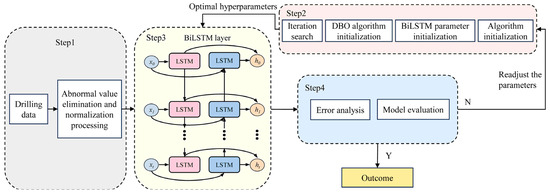
Figure 9.
DBO-BiLSTM roof strata recognition model structure.
- (1)
- Data acquisition and preprocessing: First, the field-measured drilling signal data are collected and sorted. Then, the data are cleaned, the outliers are removed, and normalization is performed to standardize it.
- (2)
- Model initialization: This step initializes the BiLSTM model and the DBO algorithm parameters. It includes setting the population size, the maximum number of iterations, the number of optimization parameters and their boundaries, the maximum number of training rounds, the initial learning rate, and the regularization parameters.
- (3)
- Model training and recognition: The preprocessed drilling parameters are input into the BiLSTM model. During the training process, the model outputs the results of rock formation recognition.
- (4)
- Model evaluation and result output: After the model training is completed, the model is evaluated. If there is a significant error between the model’s output and the expected target, adjust the relevant parameters and repeat the above steps; if the error is within the acceptable range, the final prediction result is output.
4.2.2. Model Training and Evaluation Index
- (1)
- Model training
To handle the significant differences in the dimensions and magnitudes of different drilling parameters, the collected data were normalized to ensure that the data remained within the (0~1) range. Therefore, minimum–maximum normalization based on linear transformation was applied to the original data with the following calculation formula:
where X is the original value of the data; Xmin is the minimum value of the dataset; Xmax is the maximum value of the dataset; and Xnorm is the normalized value.
The normalized data were used as the training model’s input parameter, and the roadway roof strata recognition model based on DBO-BiLSTM was established. The four drilling parameters of n, F, T, and an under-different-rock condition were used as training feature variables, and 3000 standard data were selected as training samples. For the lithology of the data selection section, including coal, sandstone, and mudstone, 1, 2, and 3 were used as lithology data identification labels. The training and prediction data were divided according to the ratio of 8:2.
After the random disruption of the dataset and division of the training set according to the ratio of 8:2 for sample training, the training results of the roof strata recognition model based on DBO-BiLSTM were gathered, as shown in Figure 10. Through the fitness curve of Figure 10a DBO, it can be seen that when the number of iterations is 6, the number of hidden layer nodes, initial learning rate, and L2 regularization coefficient of the model achieve the best values, which are 33, 0.0301, and 2.4312 × 10⁻⁴, respectively. The recognition results of the model are shown in Figure 10b, and the recognition accuracy of coal with significant differences in characteristics is 100%. The recognition accuracy of sandstone and mudstone with similar characteristics is 90.25% and 88.25%. Among 800 sandstone samples, 78 were mistakenly identified as mudstone, and 94 were mistakenly identified as sandstone among 800 mudstone samples. The overall recognition accuracy of the model for the training set is 92.83%.
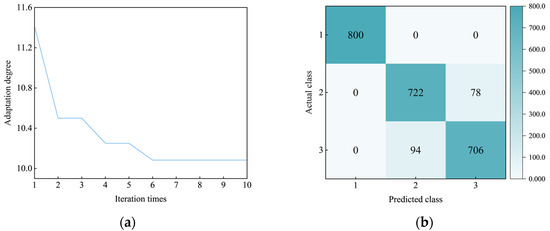
Figure 10.
DBO-BiLSTM model training results: (a) DBO fitness curve; and (b) DBO-BiLSTM recognition results.
To compare the performance of the DBO-BiLSTM model, the LSTM, BiLSTM, and DBO-LSTM models are used to train and identify the drilling signal datasets. The confusion matrix of each model is shown in Figure 11. The results show that the DBO-BiLSTM model has the least misrecognition data, proving the model’s significant advantages in training effect.
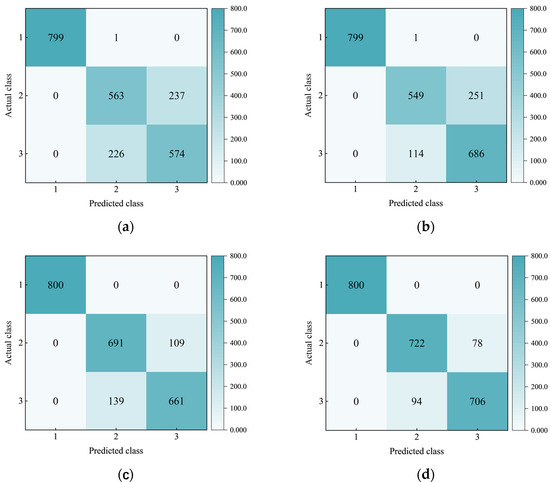
Figure 11.
Confusion matrix of training recognition results of each model: (a) LSTM; (b) BiLSTM; (c) DBO-LSTM; and (d) DBO-BiLSTM.
The recognition accuracy of the four models for each lithology was calculated to facilitate comparison, as shown in Table 5. The results show that the recognition accuracy of the four models of LSTM, BiLSTM, DBO-LSTM, and DBO-BiLSTM was improved. The reason is that the LSTM model only focuses on the one-way long-term dependence of data and is less sensitive to contextual information, resulting in insufficient information utilization, which limits the performance and flexibility of the model. In contrast, the bidirectional structure of BiLSTM improves the model’s flexibility and can better capture contextual information, thereby improving the model’s accuracy and feature representation ability. The DBO algorithm further improves the prediction accuracy and performance of the model by optimizing the hyperparameters of the LSTM and BiLSTM models, such as the number of hidden layer nodes, the initial learning rate, and the L2 regularization coefficient. In addition, for coals with significant differences in features, all four models show high recognition accuracy. However, in the face of sandstone and mudstone with similar characteristics, the false recognition rate of the model is relatively high. The reason may be that the nuances between the three lithologies put forward higher requirements for the distinguishing ability of the model.

Table 5.
The training recognition accuracy of each model.
In terms of performance, the training times of the four models were tested. The LSTM model had the shortest training time, approximately 11 s, with low computational complexity, but its recognition accuracy was relatively low. The BiLSTM model took 14 s to train. While the bidirectional structure increased the computational cost slightly, it significantly improved lithology classification accuracy. The DBO-LSTM model had a training time of 15 s. Optimizing hyperparameters with the DBO algorithm further enhanced recognition accuracy. The DBO-BiLSTM model, with the highest computational cost, took 22 s to train, but it performed best in recognizing complex lithologies.
Although the DBO-BiLSTM model’s training time was the longest among the four models, it performed the best in recognition accuracy thanks to its optimized hyperparameters and bidirectional learning mechanism. The improvement in lithology recognition accuracy more than compensates for the increased computational cost, especially in application scenarios that require high-precision lithology identification.
- (2)
- Evaluation index
When identifying the three coal, sandstone, and mudstone lithologies, the multivariate classification evaluation index can be used to measure the generalization ability of different models. Similar to binary classification, the evaluation principle of multivariate classification problems is also based on analyzing the classification results of samples. The binary classification divides the samples into positive and negative classes. By setting the classification threshold, four recognition results can be obtained: true positive class (TP, that is, both the label and the recognition result are positive), false positive class (FP, that is, the label is negative but identified as positive), true negative class (TN, that is, both the label and the recognition result are negative), and false negative class (FN, that is, the label is positive but identified as negative). Based on the recognition results, the confusion matrix was constructed, and the evaluation indexes such as accuracy, precision, recall, and F1-Score of the model were calculated to evaluate the overall performance of the model comprehensively, specifically as follows:
Accuracy: Represents the proportion of the number of samples correctly predicted by the model to the total number of samples. The calculation formula is as follows:
Precision: Measures the proportion of actual positive samples among all samples identified as positive. The calculation formula is as follows:
Recall: Represents the proportion of correctly identified positive samples out of all actual positive samples. The calculation formula is as follows:
F1-Score: The harmonic mean of precision and recall, balancing the two. It is designed to provide a comprehensive assessment of model performance. The calculation formula is as follows:
5. Analysis and Evaluation of Identification Results
5.1. Identification Results Analysis
The trained roof strata recognition model was applied to the test set samples for verification. The confusion matrix of the recognition results is shown in Figure 12, and the recognition accuracy of each model for lithology is shown in Table 6. The results show that the accuracy of coal seam classification is the highest, and the accuracy of the four models on such samples is 100%. The second is the classification performance of sandstone and mudstone. The accuracy rates of LSTM, BiLSTM, DBO-LSTM, and DBO-BiLSTM models in sandstone are 63.50%, 68.00%, 80.50%, and 89.50%, respectively. The accuracy rates in mudstone are 72.50%, 81.00%, 82.50%, and 87.00%, respectively. Different lithology identification models can achieve completely accurate predictions on coal seams with significant differences in characteristics. However, the four models with similar characteristics have been misidentified in the sandstone and mudstone. The analysis results show that with the increase in model complexity and optimization degree, the recognition ability of lithological characteristics is also enhanced. For example, in the recognition results of 200 sets of LSTM models, 73 sets of sandstones were mistakenly identified as mudstones, and 55 sets of mudstones were mistakenly identified as sandstones. In the identification results of 200 groups of DBO-BiLSTM models, the number of sandstones misidentified as mudstones decreased to 21 groups, and the number of mudstones misidentified as sandstones decreased to 32 groups, which correspond to decreases of 3.5 times and 1.7 times, respectively.
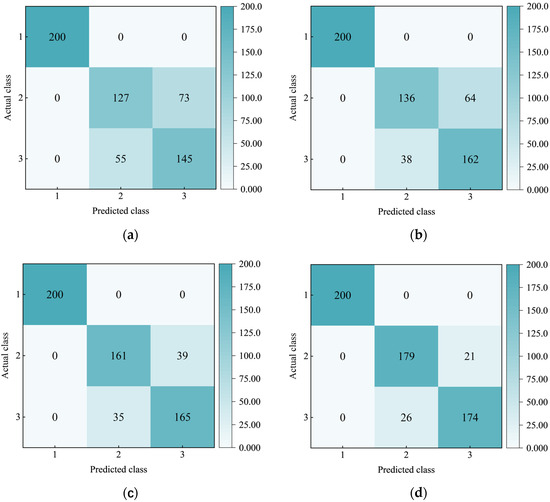
Figure 12.
Confusion matrix of recognition results of each model: (a) LSTM; (b) BiLSTM; (c) DBO-LSTM; and (d) DBO-BiLSTM.

Table 6.
Recognition accuracy of each model.
In addition, the identification results of the four models have no misidentification of sandstone or mudstone as coal seam or coal seam as sandstone or mudstone. This indicates that the DBO-BiLSTM model shows higher accuracy and a lower false recognition rate than other models when identifying the similar lithology of sandstone and mudstone. By optimizing the hyperparameters and using the two-way learning mechanism, the DBO-BiLSTM model effectively improves the ability to distinguish lithological features, especially when dealing with rock strata with similar features; it can provide more accurate classification results. Therefore, the DBO-BiLSTM model has significant advantages in complex lithology identification tasks and provides more reliable prediction results.
5.2. Identification Results Evaluation
Table 7 shows the performance evaluation results of the roof strata recognition model. The results show that each model’s accuracy, precision, recall, and F1-Score are 100% when identifying coal seams, indicating excellent performance when dealing with coal seams with significant differences. For sandstone and mudstone, the evaluation indexes of the model are gradually improved, indicating that the performance is progressively enhanced with the increase in model complexity and optimization degree.

Table 7.
Model evaluation index results.
Figure 13 intuitively shows the recognition accuracy, precision, recall rate, and F1 score of different models on the test set. From the four evaluation indicators, the DBO-BiLSTM model had the best performance. Compared with LSTM, BiLSTM, and DBO-LSTM models, the accuracy of the DBO-BiLSTM model was improved by 9%, 6.11%, and 3%, respectively. The accuracy was improved by 11.94%, 7.61%, and 2.94%, respectively. The recall rate increased by 12.48%, 7.96%, and 3.57%, respectively. The F1 scores increased by 13.06%, 8.75%, and 4.02%, respectively. The results of the model performance evaluation show that the DBO-BiLSTM model shows higher reliability and accuracy in identifying drilling signal datasets in roof strata.
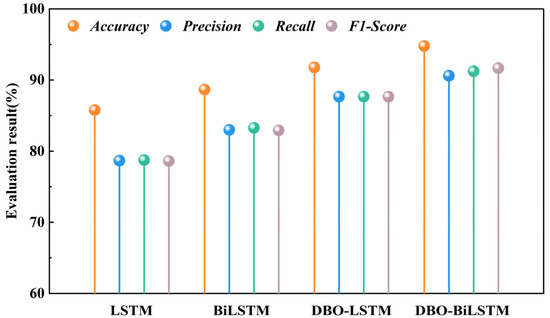
Figure 13.
A comparison of the results of each model evaluation index.
6. Discussion
This study aims to establish a high-precision, real-time roadway roof strata identification model based on drilling parameters. The goal is to enhance the accuracy and efficiency of rock layer identification under complex geological conditions. This research adopts a data-driven approach, unlike traditional geological exploration and laboratory testing methods. It enables real-time monitoring and dynamic analysis, providing a scientific foundation for coal mine roadway support design. The key innovation lies in combining the Dung Beetle Optimizer (DBO) with Bidirectional Long Short-Term Memory (BiLSTM) models. This results in the proposed DBO-BiLSTM rock layer identification model. The model leverages the efficiency of DBO for hyperparameter optimization and the bidirectional learning capabilities of BiLSTM for processing time-series data. This significantly improves the accuracy and stability of rock layer identification. The model effectively differentiates similar rock types, such as sandstone and mudstone by extracting deep features from vibration and pressure signals. This overcomes the limitations of existing methods, which often struggle to distinguish these similar layers. Current research mainly focuses on the linear analysis of single parameters or traditional machine learning models. However, rock layers exhibit similar characteristics and signal fluctuations in complex geological conditions. Existing methods show poor recognition accuracy and stability, especially in the high-precision identification of similar rock layers like sandstone and mudstone. This study introduces BiLSTM and DBO optimization algorithms combined with multi-parameter features to address this challenge. This approach fills a gap in current research and offers a new method for the accurate identification and intelligent management of coal mine roadway roof strata.
To highlight the superiority of the proposed DBO-BiLSTM model, this paper compares its identification accuracy with various mathematical methods, machine learning models, and neural network models. The comparison includes multiple linear regression (MLR), the Threshold Judgment Method (TJM), Minimum Euclidean Distance Classification (MEDC), Support Vector Machine (SVM), and Back Propagation Neural Network (BP). The comparison results, shown in Figure 14, indicate that the DBO-BiLSTM model significantly outperforms other models regarding identification accuracy. Further analysis reveals that, except for the DBO-BiLSTM model, the other five models exhibit considerable misidentifications, especially when distinguishing between sandstone and mudstone. The errors are particularly pronounced when mathematical methods are employed. This further validates the superiority of the DBO-BiLSTM model in identifying similar rock types, such as sandstone and mudstone. Furthermore, the DBO-BiLSTM model was used to test the raw data without preprocessing, with the results corresponding to DBO-BiLSTM’ in Figure 14. The recognition accuracy was only 79.32%, significantly lower than the accuracy achieved after data preprocessing. The comparison confirms the effectiveness of wavelet transform denoising, non-drilling phase data removal, and Lagrange interpolation for anomaly correction. These techniques enhance data quality and improve recognition accuracy. It further demonstrates the critical role of data preprocessing in improving model robustness and classification performance.
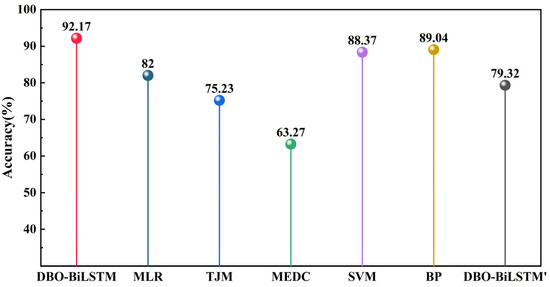
Figure 14.
Comparison of recognition accuracy of each model.
Accurately identifying rock layer types in coal mine roadway support design ensures construction safety and efficiency. The DBO-BiLSTM model enhances rock layer identification accuracy, providing a more substantial scientific basis for selecting appropriate support parameters. This model is applied in real-time monitoring during roadway construction alongside the Measurement While Drilling (MWD) system. The MWD system collects drilling data through sensors in real time. The DBO-BiLSTM model processes this data to identify rock layers accurately. Engineers can optimize support design parameters based on these results, including support methods, material selection, and support strength. This improves both safety and construction efficiency. The implementation plan integrates the MWD system with the DBO-BiLSTM model to ensure the continuous availability of rock layer information. This integration allows timely adjustments to support design strategies, preventing improper support and safety hazards caused by the misidentification of rock layers. Additionally, the system predicts potential risks associated with different rock layers, providing targeted warnings and countermeasures. This further enhances the controllability and safety of the construction process.
Although the DBO-BiLSTM model performs excellently in lithology identification, it still has certain limitations. First, the model heavily relies on high-quality drilling parameter data, making it vulnerable to sensor errors and signal noise. These factors may affect identification accuracy. Second, its generalization ability under complex geological conditions remains uncertain. Its adaptability to fractured zones or areas with well-developed joints requires further testing. Third, the BiLSTM structure and DBO optimization involve high computational costs. This may limit practical applications, especially on embedded or low-power devices. The model relies solely on drilling parameters such as pressure and vibration. It does not incorporate rock’s physical and chemical properties, such as geophysical logging or mineral composition. Integrating these factors could further enhance identification accuracy.
This study focuses on the relationship between lithology and drilling parameters, exploring its application in identifying roadway roof strata characteristics. Since rock lithology significantly influences drilling parameter variations, different lithological formations are analyzed to verify their impact. A lithology identification method based on drilling parameters is then proposed. However, tectonic stress, joint and fracture development, in situ stress conditions, and water content affect roadway roof stability. These factors can introduce disturbances to drilling parameters, impacting identification accuracy. Therefore, future research should integrate these elements and incorporate multi-source data. These include seismic exploration, acoustic logging, and in situ stress measurements. By doing so, lithology identification models can be further optimized, improving prediction stability and applicability.
7. Conclusions
Based on measured data from anchor cable drilling in coal mine roadway roofs, this study developed a method for identifying rock strata using drilling vibration and pressure signals. Various recognition models were constructed, including LSTM, BiLSTM, DBO-LSTM, and DBO-BiLSTM. The preprocessed vibration and pressure data were used as input, while rock type served as the output. The results show the following:
- (1)
- This study strongly correlates drilling vibration, pressure signals, and rock formation strength. By applying a deep learning model, the recognition accuracy reached 94.78%. Compared to traditional methods, this approach enables real-time lithology monitoring during coal mine roadway excavation. It enhances the scientific reliability and safety of roadway support design.
- (2)
- This study introduces an innovative combination of DBO and BiLSTM, proposing the DBO-BiLSTM model. DBO optimizes hyperparameters, while BiLSTM enhances bidirectional temporal feature extraction. This significantly improves the distinction between similar rock formations, such as sandstone and mudstone. The overall test set accuracy reached 94.78%, showing 9%, 6.11%, and 3% improvements compared to LSTM, BiLSTM, and DBO-LSTM, respectively. The F1-Score also increased by 13.06%, 8.75%, and 4.02%.
- (3)
- A borehole signal denoising method based on the wavelet transform is proposed. This method uses the db4 wavelet, three-level decomposition, and a Bayesian threshold. The signal-to-noise ratio (SNR) reached 20.13 dB, representing a 15–20% improvement compared to other parameter combinations. Additionally, non-drilling phase data removal and outlier interpolation using the Lagrange method reduce high noise and interference in field data. This provides a high-quality data foundation for accurate model recognition.
- (4)
- The research results can be directly integrated into the MWD system, enabling real-time lithology identification and support optimization for coal mine roadway construction. This method predicts the potential risks associated with different rock formations, optimizes support parameter configurations, and enhances coal mine safety and construction efficiency.
Author Contributions
Conceptualization, J.C.; methodology, C.Z.; validation, J.L.; data curation, W.Z.; writing—original draft preparation, J.C.; writing—review and editing, Z.D.; funding acquisition, Z.D. All authors have read and agreed to the published version of the manuscript.
Funding
This research was funded by the Natural Science Basic Research Program of Shaanxi Province (Shaanxi Coal and Chemical Industry Group Co., Ltd. Joint Fund Project, Grant No. 2021JLM-06).
Institutional Review Board Statement
Not applicable.
Informed Consent Statement
Not applicable.
Data Availability Statement
The data used in this study have been uploaded to Baidu Cloud, and the link is https://pan.baidu.com/s/1VPRV0dBauk8cmmRD0hmIqA?pwd=f2mf (accessed on 22 January 2025).
Acknowledgments
Thanks to Xiaoqiang Xue and Xiaoyong Wang from Shaanxi Xiaobaodang Mining Co., Ltd. for their important contributions in formulating the data collection plan and providing equipment for this study.
Conflicts of Interest
The authors declare no conflicts of interest.
Abbreviations
The following abbreviations are used in this manuscript:
| LSTM | Long Short-Term Memory |
| BiLSTM | Bidirectional Long Short-Term Memory |
| DBO | Dung Beetle Optimizer |
| MWD | Measurement While Drilling |
| KFCM | Kernel Fuzzy C-Means |
| ROC | Receiver Operating Characteristic |
| DI | Discontinuity Index |
| IQR | Interquartile Range |
| TP | True Positive |
| FP | False Positive |
| TN | True Negative |
| FN | False Negative |
References
- Yuan, L.; Zhang, P. Key technology and path thinking of dynamic reconstruction of mine transparent geological model. J. China Coal Soc. China 2023, 48, 1–14. [Google Scholar]
- Wang, G.; Du, Y.; Chen, X.; Wang, H.; Bao, J.; Xing, Z.; He, Y.; Han, A.; Gu, Y. Development and innovative practice from coal mine mechanization to automation and intelligence: Commemorating the 50th anniversary of the founding of Journal of Mine Automation. J. Mine Autom. China 2023, 48, 1–18. [Google Scholar]
- Wang, S.; Sun, Q.; Gu, C.; Li, P.; Gen, J.; Wang, S.; Shi, Q. The development of geoscientific research promoted by coal exploitation. China Coal China 2024, 50, 2–8. [Google Scholar]
- Yue, Z.; Yue, X.; Yang, R.; Wang, X.; Dai, S.; Li, Y. Progress of lithology identification technology while drilling. J. Min. Sci. Technol. 2022, 7, 389–402. [Google Scholar]
- Kang, H. Support technologies for deep and complex roadways in underground coal mines: A review. Int. J. Coal Sci. Technol. 2014, 1, 261–277. [Google Scholar]
- Zhang, Y.; Xu, X.; Kan, Z. Research status and tendency on underground rotary drilling dynamics in coal mine. Coal Sci. Technol. 2019, 47, 145–151. [Google Scholar]
- Schunnesson, H. Rock characterisation using percussive drilling. Int. J. Rock Mech. Min. Sci. 1998, 35, 711–725. [Google Scholar]
- Zhang, Y.; Zhang, N.; Liu, P.; He, B. Study on drilling dynamic characteristics and stratum information identification of anchor hole in typical coal-bearing stratum. Coal Sci. Technol. 2021, 49, 177–185. [Google Scholar]
- Van Eldert, J.; Schunnesson, H.; Saiang, D.; Funehag, J. Improved filtering and normalizing of Measurement-While-Drilling (MWD) data in tunnel excavation. Tunn. Undergr. Space Technol. 2020, 103, 103467. [Google Scholar]
- Gui, M.W.; Soga, K.; Bolton, M.D.; Hamelin, J.P. Instrumented Borehole Drilling for Subsurface Investigation. J. Geotech. Geoenvironmental Eng. 2002, 128, 283–291. [Google Scholar]
- Song, L.; Li, N.; Li, Q. Study of intrinsic relationship between mechanical parameters and parameters of rotary penetration test of soft rock. Chin. J. Rock Mech. Eng. 2011, 30, 1274–1282. [Google Scholar]
- Kahraman, S.; Bilgin, N.; Feridunoglu, C. Dominant rock properties affecting the penetration rate of percussive drills. Int. J. Rock Mech. Min. Sci. 2003, 40, 711–723. [Google Scholar]
- Li, S.; Liu, B.; Xu, X.; Nie, L.; Liu, Z.; Song, J.; Sun, H.; Chen, L.; Fan, K. An overview of ahead geological prospecting in tunneling. Tunn. Undergr. Space Technol. 2017, 63, 69–94. [Google Scholar]
- Qin, M.; Wang, K.; Pan, K.; Sun, T.; Liu, Z. Analysis of signal characteristics from rock drilling based on vibration and acoustic sensor approaches. Appl. Acoust. 2018, 140, 275–282. [Google Scholar]
- Zhang, Y.; Zhang, N.; Shao, J.; Zhong, Z. Fuzzy identification of coal-bearing strata lithology based on drilling parameter clustering. J. China Coal Soc. 2019, 44, 2328–2335. [Google Scholar]
- Liang, D.; Tang, H.; Wu, Z.; Zhang, Y. Stratum identification based on multiple drilling parameters and probability classification. Rock Soil Mech. 2022, 43, 1123–1134. [Google Scholar]
- Sun, X.; Cheng, J.; Wan, Z.; Liu, K.; Yan, W.; Xue, M.; Xing, K. Comprehensive indicators optimization construction and lithology measurement while drilling based on drilling parameters. Bull. Eng. Geol. Environ. 2024, 83, 222. [Google Scholar]
- Ding, Z.; Li, X.; Huang, X.; Wang, M.; Tang, Q.; Jia, J. Feature extraction, recognition, and classification of acoustic emission waveform signal of coal rock sample under uniaxial compression. Int. J. Rock Mech. Min. Sci. 2022, 160, 105262. [Google Scholar]
- Ding, Z.; Li, X.; Tang, Q.; Jia, J.; Gao, C.; Wang, S. Research on rock crack classification based on acoustic emission waveform feature extraction technology. Lithosphere 2022, 2022, 5804064. [Google Scholar]
- Stehlíková, B.; Bogdanovská, G.; Flegner, P.; Francakova, R.; Drancak, L. The proposal of a method for rock classification using a vibration signal propagated during the rotary drilling process. Appl. Sci. 2023, 13, 11315. [Google Scholar] [CrossRef]
- Wang, J. Research on coal-rock interface recognition system based on drilling parameters. Coal Geol. Explor. 2023, 51, 72–80. [Google Scholar]
- Fernández, A.; Sanchidrián, J.A.; Segarra, P.; Gómez, S.; Li, E.; Navarro, R. Rock mass structural recognition from drill monitoring technology in underground mining using discontinuity index and machine learning techniques. Int. J. Min. Sci. Technol. 2023, 33, 555–571. [Google Scholar]
- Zarge, G.E.; Gamache, M.; Labib, R.; Shlenchak, V. Machine learning algorithms for real-time coal recognition using monitor-while-drilling data. Int. J.Min. Reclam. Environ. 2024, 38, 27–52. [Google Scholar]
- Fang, Y.; Wu, Z.; Jiang, L.; Tang, H.; Fu, X.; Shen, J. Dynamic numerical simulation and transfer learning-based rapid rock identification during Measurement While Drilling (MWD). Processes 2024, 12, 1260. [Google Scholar] [CrossRef]
- Wu, J.; Zhao, Z.; Wang, X.; Wang, Y.; Xiang, X.; You, Z. Intelligent identification and prediction of roof deterioration areas based on measurements while drilling. Sensors 2024, 24, 7421. [Google Scholar] [CrossRef] [PubMed]
- Ding, Z.; Zhang, C.; Huang, X.; Liu, Q.; Liu, B.; Gao, F.; Li, L.; Liu, Y. Recognition method of coal-rock reflection spectrum using wavelet scattering transform and bidirectional long short-term memory. Rock Mech. Rock Eng. 2024, 57, 1353–1374. [Google Scholar]
- Xue, J.; Shen, B. Dung beetle optimizer: A new meta-heuristic algorithm for global optimization. J. Supercomput. 2023, 79, 7305–7336. [Google Scholar]
- Lu, Y.; Tang, L.; Liu, Z.; Zhou, L.; Yang, B.; Jiang, Z.; Liu, Y. Unsupervised quantitative structural damage identification method based on BiLSTM networks and probability distribution model. J. Sound Vib. 2024, 590, 118597. [Google Scholar]
Disclaimer/Publisher’s Note: The statements, opinions and data contained in all publications are solely those of the individual author(s) and contributor(s) and not of MDPI and/or the editor(s). MDPI and/or the editor(s) disclaim responsibility for any injury to people or property resulting from any ideas, methods, instructions or products referred to in the content. |
© 2025 by the authors. Licensee MDPI, Basel, Switzerland. This article is an open access article distributed under the terms and conditions of the Creative Commons Attribution (CC BY) license (https://creativecommons.org/licenses/by/4.0/).