Abstract
Traditionally, machine learning models in healthcare rely on centralized strategies using raw data. This poses limitations due to the amount of available data, which becomes hard to aggregate due to privacy concerns. Federated learning has been emerging as a new paradigm to improve model performance. It exploits information on the parameters from other clients while never sharing personal data from the patients. We present a proof-of-concept of federated learning techniques in the case of an automated screening tool for frailty in the older population. We used a frailty-specific dataset called FRELSA, with patients from nine regions of the UK used to simulate a scenario with regional hospitals. We compared three different strategies: separate regional training with no communication; federated averaging, the most widely used strategy for healthcare; and finally, global training on the full dataset for comparison. All three strategies were validated with two architectures: logistic regression and a neural network. Results show that federated strategies outperform local training and achieve global-like performance while preserving patient privacy. For Logistic Regression, the global validation F-score was 0.737 and the federated aggregated score was 0.735, offering improvement in seven of the nine regions. For Multi Layer Perceptron, the global validation F-score was 0.843 and the federated aggregated score was 0.834, improving in all nine regional models. The federated strategy is equivalent to pooling all the data together while avoiding all complications related to data privacy and sharing. The results of this study show that the proposed strategy is a viable method for improving frailty screening in healthcare systems.
1. Introduction
Machine Learning (ML) and Deep Learning (DL) techniques have shown great potential in improving healthcare, with applications from computer vision, to Natural Language Processing (NLP), to exploiting information in Electronic Health Records (EHR) [1]. Specifically, EHR datasets are growing daily and are used to enhance clinical decision-making by detecting diseases in early stages, determining the level of risk, and even predicting the appearance of complications based on the patient’s history [2]. Traditionally, ML models are trained on raw data using centralized approaches, which pose challenges for their implementation in healthcare settings. First, while a large amount of data is required to achieve satisfactory performance from the models, these data are typically scattered between various health centers. Second, healthcare applications must comply with strict privacy regulations on personal data, such as the EU General Data Protection Regulation (GDPR) [3] and the Health Insurance Portability and Accountability Act (HIPAA) in the USA [4].
One effective solution to these problems can be found in Federated Learning (FL) techniques, which have grown in popularity in recent years in healthcare as well as in other areas. Federated Learning is a relatively new solution in ML, motivated by the need for more considerable and more significant amounts of data and the necessity of preserving the privacy of data providers. FL was proposed for the first time in 2016 [5], and is based on the idea of exploiting information from many different clients or data providers to train bigger and better-performing models without ever sharing raw data among the clients. It has successfully found applications in many fields, such as healthcare [6,7], networks [8], Internet of Things (IoT) [9], and transportation [10].
In the last few years, several FL strategies have been proposed; these can be roughly divided into centralized and distributed FL [11]. Centralized techniques revolve around a leading organization or server, which provides the model architectures and aggregates the information received by the clients or data providers. The central server only coordinates the federated operations; it never receives raw data from the clients, only information on the results of the distributed training rounds. Centralized settings are the most common and straightforward and have been applied in all the aforementioned fields, including healthcare. On the other hand, in distributed techniques there is no central server coordinating the aggregation and passing of information. These architectures are instead based on direct Peer2Peer (P2P) communication, making them more complex to define, less vulnerable to malevolent clients [12], and more common in network applications. In healthcare applications, centralized FL techniques allow hospitals to share information on the parameters of DL models, which provides benefits while complying with regulations. Moreover, many healthcare centers lack the means or data volumes to produce such models or practical screening tools on their own. Thus, agglomerating information from different healthcare facilities can provide those that do not have these assets with ML models for detecting diseases, and can also improve the performance of existing local models [13].
Frailty is a syndrome related to aging, characterized by the loss of independence and high vulnerability [14]. Specifically, it affects both physical and cognitive function, and leads to frequent hospitalization, disability, and decline of mental capabilities. One of the most common frailty definitions regarding the physical aspect of this pathology is the Fried’s Frailty Phenotype (FFP), introduced in 2001 by Fried et al. [15]. It assesses five criteria: weight loss, slowness, weakness, low physical activity, and exhaustion. If patients meet three of the five criteria, they are considered frail; if they meet one or two, they are classified as pre-frail; otherwise, they are considered robust. Because all five criteria are measurable, this definition allows for a data-driven approach to frailty detection or prediction by leveraging healthcare data [16,17]. In order to create an effective electronic tool for frailty screening in older populations, data protection and privacy concerns are key problems that must be addressed [18]. For these reasons, we propose using FL techniques in a frailty early-detection scenario. To the best of our knowledge, no applications of FL or experiments have previously been performed in a frailty setting. FL strategies have been applied to fall detection [19,20], neurodegenerative diseases [21,22], and mortality [23,24]; although related to frailty, these target variables are substantially different from the FFP, and in most cases can be considered a consequence of it. Fried et al. aimed to define a phenotype [15] that can detect the earliest signs of pathology, and consequently avoid the related risks, based on patients falling below even one of the five criteria used in the definition of frailty (i.e., pre-frailty).
2. Materials and Methods
This section describes the tools and methods used to simulate the frailty setting and train frailty detection models using FL.
2.1. FRELSA Dataset
The FRailty English Longitudinal Study of Ageing (FRELSA) dataset is specific to frailty studies, and was presented by the authors of the current paper in 2024 [25]. It was generated from the English Longitudinal Study of Ageing (ELSA) [26], a study conducted in the UK, which started collecting data in 2002 and followed up every two years, for nine waves of data collection. The core of the data collection was a self-completed questionnaire regarding general health, household and family, social situation, economic and financial situation, working and retirement, education, and many other aspects of the participant’s life [27,28]. The key characteristic of FRELSA is the computation of the FFP level of patients, who can be frail, pre-frail, or non-frail; these data were obtained in wave 6 of the ELSA study. Specifically, the FRELSA dataset counts 5303 participants, of whom 2772 are non-frail (52.3%), 2128 are pre-frail (40.1%), and 403 are frail (7.6%).
These patients are divided into nine different regions, with the distribution shown in Figure 1. In addition to these nine regions of England, seven patients from Scotland and eleven from Wales are present in the cohort. However, these regions have been excluded due to insufficient data for a meaningful regional training set. The frailty distribution among the nine selected regions is shown in Table 1. It is evident that the dataset is imbalanced and lacks frail participants. Following the procedure of previous studies using FRELSA, we grouped pre-frail and frail participants into a single class [25], resulting in a binary classification problem with a balanced dataset. This choice is coherent with the study’s goal of experimenting with FL techniques for early detection of frailty. Arguably, with proper screening tool usage, most detections would be of pre-frail patients, and only a small part of the positives would be already frail. Hence, in addition to balancing the training sets, we feel that this choice also makes the validation sets more adherent to a real scenario, where distinguishing non-frail from at-risk (pre-frail or frail) is clinically meaningful. It can be seen from Table 1 that all the regional datasets are fairly balanced after this precaution is taken. The most unbalanced data are from “Yorkshire and The Humber”, with 57.1% of the population being non-frail, and the “West Midlands”, with 54.1% of the population being pre-frail/frail.
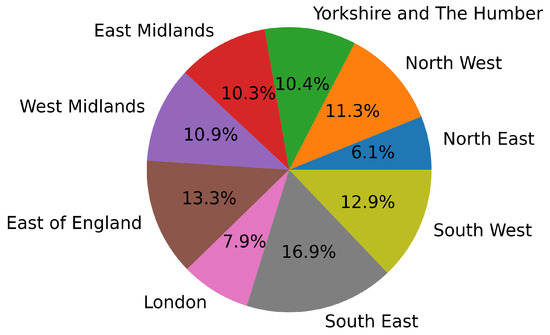
Figure 1.
Regional distribution of the FRELSA dataset.

Table 1.
Distribution of frailty levels in all the regions.
By separating the participants by their region of residence, we can simulate an ideal setting for FL implementation, in which each region represents a hospital or a clinic. We can imagine all patients from a region going to the same health center or that each healthcare regional system has an electronic tool for frailty screening (e.g., a questionnaire). In the latter case, each region would have its models tailored to the characteristics of its population; still, a limited amount of data would be available to train them. Applying FL techniques in this scenario would increase the information available for model training by sharing model parameters with other regions, without the need to ever receive or share patient data.
2.2. Experiment Settings
We adopted three different strategies and compared them throughout the experiments. First, regional training was performed, meaning that the models were trained separately with the data from each region. This scenario simulates a realistic situation in which there is no information sharing among the clients and each healthcare center can only exploit its own resources to develop a frailty screening tool. The second strategy was federated training, the novel approach proposed in the article. After each training round, there is an aggregation phase, meaning that the parameters of the regional models are sent to the central server, which generates the updated model for the following epoch. This process simulates implementing the proposed strategy in a scenario in which neighboring health centers benefit from the others’ training and information. Finally, we trained the models on the full dataset. This strategy does not match a real case, as pooling all patient data would be impossible due to privacy restrictions, and is only implemented for comparison.
For the experiments, we assumed that all clients collect the same features for prediction, making this study an example of horizontal FL [29]. These features are collected through questions and medical examinations administered separately to the patients in every hospital. We imagine that the hospitals in this scenario are willing to cooperate in order to improve their frailty early-detection methods, but are limited by data privacy restrictions. Hence, we assume that the model features are either the intersection of all features already collected by the hospitals, or that all clients agree on starting a data collection process through a standard screening questionnaire.
Specifically, in our setting, fifty features are used in the experiments. Both the feature count and the selection process were repeated from our previous work on the same dataset [25]. These variables were extracted from over 6000 available dataset features through the MultiSURF ranking algorithm [30], a relief-based feature selection process proposed specifically for bioinformatics data. This method was applied globally on the dataset in order to exploit all the information present in the data. This global selection would not be possible in a real scenario without pooling the data. However, it is necessary here in order to ensure that we are comparing the federated strategy with the best possible global model. Assuming that the federated strategy performs equal or better than the global model, the validity of the results would be questionable with any other choice of variables. The final fifty variables are easy to collect through a questionnaire, and their nature varies from mobility issues, to Activities of Daily Living (ADL), to self-perception and day-to-day feelings. For more information on the feature count, selection process, and final set of features used in the experiments, readers may refer to the original article [25].
The core and possibly primary focus of FL research is the aggregation function [11]. It defines how the information coming from each local training round is handled and aggregated. In particular, at each round, the clients train the architecture received from the server for a certain number of epochs, send the resulting parameters to the server, then wait for the next training round and updated model. Hence, the central server receives the updated parameters from the clients, generates the new model through the aggregation function, and sends it out for the following iteration. A schematization of one training round is presented in Figure 2.
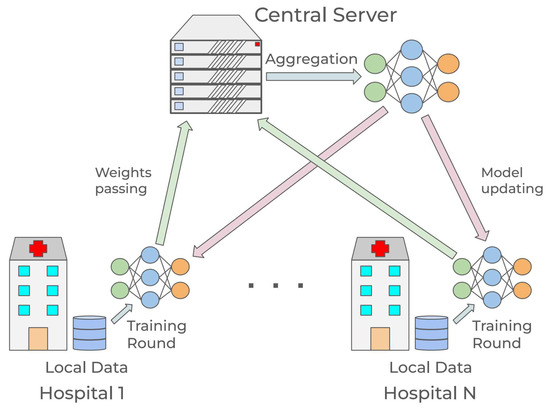
Figure 2.
Schematization of federated learning in a healthcare scenario.
The most classical and possibly most widely used aggregation function is called Federated Averaging (FedAvg), in which several random clients are selected for the training round and the central model is updated using the weighted average of the clients’ parameters, with the weights determined by the proportion of the clients’ data volume [31]. The FedAvg functioning is explained in Equation (1), where are the selected clients for round t, is the weight factor, and is the local weight after training in round t.
Other standard aggregation functions include FedProx [32], FedNova [33] for normalization techniques, Scaffold [34] and FedCurv [35] for data heterogeneity, MOON [36], which acts directly on the loss function to minimize discrepancies between global and local models, and Per-FedAvg [37] for personalized local models. Although every aggregation function offers some specific advantage, FedAvg is the most widely used and accepted baseline in healthcare-related FL research; hence, all of the federated experiments presented in the rest of this paper use FedAvg. Moreover, in this proof of concept, all data originally come from the same source, making advanced aggregation strategies less critical in this controlled setting. While it is true that there are differences in the regional data, it has been shown that under the assumption of convexity, FedAvg converges in non-IID scenarios, only slower [38]. Moreover, it has been demonstrated that in medical settings and experiments similar to the ones presented here, FedAvg outperforms methods such as FedCurv that are designed to address data heterogeneity [39].
The architectures selected to test and compare the three strategies are Logistic Regression (LR) and Multi Layer Perceptron (MLP). The initial FRELSA study [25] proposed a baseline of standard ML models to validate the dataset. LR was the best-performing model in the baseline. Hence, it was selected for validation under federated settings in this study. In a later study, more complex and refined MLP architectures were trained using the same dataset [40] on the task of early frailty detection. We decided to include these models in our experiments so as to make a meaningful comparison with previous work and results. We adopted the same architecture optimized in the previous studies in order to keep the comparison between global and federated strategy meaningful. Specific information on the model hyperparameters is presented in Appendix B.
It is essential to specify that the training process described in Figure 2 would be a one-time operation instead of a real-time process. While it requires a degree of cooperation among clients and the central server, it does not have time constraints, and once finished it is unnecessary to repeat it. The model resulting from the training is provided to each client, and the clients can then use it as a screening tool independently from the rest of the hospitals and the central server. This allows the system to avoid any problems related to live operations, coordination, and computational bottlenecks.
To validate and evaluate the training results, we adopted a 5-fold cross-validation in all three strategies, complementing it with the federated architecture following the method from previous studies [41]. First, a classic 5-fold split was performed separately on the nine regional datasets. Then, at each step of cross-validation, one fold per region was selected to be the validation set. Consequently, the regional, global, and federated training all take place in the same step of the cross-validation. All three strategies use the same training and validation sets, meaning that the global training uses the union of the local sets. This validation strategy was implemented to keep the comparison metrics as meaningful as possible. The metric evaluation was performed regionally; to compare it with the global strategy, it was also combined with a weighted average, where each region’s data volume provided the weights.
3. Results
This section presents the results of the experiments. First, the proposed LR and MLP architectures were trained separately on regional data to determine their performance without information sharing. The precision, recall, and F-score results of the 5-fold cross-validation for the LR and the MLP models are shown in Table 2 and Table 3, respectively. The first nine lines compare the local training results to the metrics of the federated model validated on each region. The second-to-last lines of the two tables report the federated strategy aggregated metrics, computed as a weighted average of the local clients’ metrics. Finally, the last line reports the results of the global training on the full dataset. A more detailed table with accuracy, Area Under the Receiving Operating Characteristic curve (AUROC), and Precision-Recall Area Under the Curve (PRAUC) is presented in Appendix A.
Table 2.
Comparison of the metrics of the LR model on the three different strategies for frailty detection. All regional training metrics and federated and global training metrics are reported.
Table 3.
Comparison of the metrics of the MLP model on the three different strategies for frailty detection. All regional training metrics and federated and global training metrics are reported.
Comparing the results, it is interesting to notice the differences between models and strategies. From Table 2, it can be observed that the LR federated strategy outperforms local models in seven out of the nine regions (based on F-score) and that the discrepancies between local and federated metrics vary considerably from region to region. These results show that LR is not the ideal architecture to exploit the complete dataset information, and works better on specific regions and data distributions. The best metrics are reached by the federated model on the East Midlands dataset, despite the fact that it is not the best performing region in local training. Despite the differences in regional performance, the aggregated metrics for the federated model are the same as for the whole dataset, all falling within a margin. In conclusion, with this architecture, very little performance is lost when implementing federated strategies compared to global training; however, some regions do not benefit from adoption of the final federated model. Nevertheless, it is important to remember that each client can evaluate their own performance at the end of the training by using local data, then decide whether or not to implement the federated model. Even in the case of a health center not benefiting directly from the federated strategy and not adopting the final model, they will still have contributed to improving the healthcare system by sharing their information with other centers.
This situation does not present itself in the case of the more refined MLP architecture, with which all nine regions improve the frailty screening metrics using the federated model. Moreover, as shown in Table 3, MLP outperforms LR in every region, as expected. Just as in the case of LR, the East Midlands dataset does not provide the best local results, but the federated model reaches its best overall metrics on this dataset. Again, there is very little difference between the aggregated metrics for the federated strategy and those obtained on the full dataset. The discrepancy is so tiny that the performance can be considered equivalent: the F-score is for federated training and for complete dataset training, and all metrics stay within a margin. These results suggest that adopting the federated strategy with this architecture and setting is equivalent to pooling the data from all clients. Comparisons with both regional and global models demonstrate the effectiveness of healthcare centers cooperating through a federated strategy.
The code for the FL experiments was implemented in Python 3.10 using the library flower [42], and is available on GitHub (https://github.com/gsi-upm/fl_for_frailty (accessed on 8 September 2025)).
4. Discussion
This paper presents the first proof-of-concept of the viability of Federated Learning techniques in a frailty detection setting. We simulated nine healthcare organizations aggregating information on their respective models towards the common goal of frailty detection among elderly people without the need to share any patient data.
Our auspicious results show that FL techniques represent a viable solution to the data privacy problem in healthcare, specifically for frailty detection. By sharing information between hospitals the predictive models for early detection of frailty provide improved performance while respecting all data privacy regulations. The federated models are practically indistinguishable from the global ones and substantially improve the performance of local architectures, as discussed in Section 3. Such results lead to the belief that adopting FL techniques in the case of early frailty detection would have no theoretical downsides and that any healthcare system with hospitals willing to cooperate could benefit from it.
However, this work has an explicit limitation in that it is a proof of concept developed using data from a longitudinal study and does not consider the practical and technical difficulties that would arise during an actual implementation.
Moreover, no region is lacking in data quantity or quality; hence, the differences in performance could be limited compared to a real scenario. This factor also helps to reduce problems related to data collection, such as missing data or collection time discrepancies.
Designing and deploying a federated infrastructure involving numerous hospitals poses practical challenges. Specifically, the central server’s role is crucial to ensuring client coordination and upholding all privacy protocols. Moreover, technical and operational hurdles will surely arise when coordinating various hospitals with little experience in this process. These problems are complex to replicate in a simulated and controlled experiment, and we chose not to consider them in this proof of concept. Also, due to their unpredictable nature, they would be hard to simulate. However, this topic should not be underestimated when transferring this technology to real healthcare systems. Thus, the proposed method should be validated in future work through experiments in a real case study using hospital data.
A final limitation of this study is the interpretability of the proposed models. It has been shown that interpretability is crucial to ensuring that professionals can trust the results of models and integrate them into their work routines [43]. However, the scope of this study is to assess the viability of FL techniques in improving early detection of frailty. Developing an interpretability module, while useful in practical applications, would not add to the research question of this proof-of-concept; hence, we decided to leave it for future work.
Another exciting future line of research involves the aggregation function. In this study, we adopted the simplest FedAvg function, which was the ideal choice for demonstrating the viability of a federated strategy in our frailty scenario and creating a benchmark. In the future, different aggregation functions could be tested in the case of frailty; alternatively, new functions could proposed by the research community. In this line of work, it is essential to leave the controlled environment provided by the FRELSA dataset and move to more heterogeneous data that better represent the discrepancies between health centers and their real data distributions.
In conclusion, FL shows promising results when applied to the task of early frailty detection. More research and additional collaboration with practitioners are needed in order to apply the results of this proof-of-concept to a real-world scenario and deploy a whole federated frailty system in a region or a country while ensuring that all healthcare facilities contribute to and benefit from it.
Author Contributions
M.L.: conceptualization, methodology, software, formal analysis, investigation, data curation, writing—original draft, visualization. Á.C.: conceptualization, methodology, validation, writing—review and editing, supervision, project administration, funding acquisition. C.Á.I.: conceptualization, methodology, validation, writing—review and editing, supervision, project administration, funding acquisition. All authors have read and agreed to the published version of the manuscript.
Funding
Funding was received for this work. All of the funding sources for the work described in this publication came from the AROMA/MIRATAR project, grant TED2021-132149B-C42, funded by MICIU/AEI/10.13039/501100011033 and by the European Union NextGenerationEU/PRTR.
Data Availability Statement
Original unlabelled data are available under request at https://www.elsa-project.ac.uk/ (accessed on 8 September 2025). To generate the frailty labels, go to https://github.com/gsi-upm/fl_for_frailty (accessed on 8 September 2025). In the same repository, there is a file specifically matching the study participants’ unique identifiers to their frailty labels.
Acknowledgments
We want to thank all the MIRATAR (grant TED2021-132149B-C42, funded by MICIU/AEI/10.13039/501100011033 and by the European Union NextGenerationEU/PRTR) project participants as well as our colleagues from CIBER (Centro de Investigación Biomédica en Red), UCLM (Universidad de Castilla-La Mancha), and UC3M (Universidad Carlos III de Madrid). We also thank our colleague J. Fernando Sánchez Rada for his precious tips and suggestions at critical times.
Conflicts of Interest
The authors declare that they have no known competing financial interests or personal relationships that could have appeared to influence the work reported in this paper.
Appendix A. Extended Results
In this appendix, all the results from the experiment discussed in Section 3 are presented in Table A1.
Table A1.
Comparison of all metrics on the three different strategies for frailty detection. All regional training metrics and federated and global training metrics are reported.
Table A1.
Comparison of all metrics on the three different strategies for frailty detection. All regional training metrics and federated and global training metrics are reported.
| Accuracy | Precision | Recall | F-Score | AUROC | PR-AUC | |||||||
|---|---|---|---|---|---|---|---|---|---|---|---|---|
| LogReg | Local | FedAvg | Local | FedAvg | Local | FedAvg | Local | FedAvg | Local | FedAvg | Local | FedAvg |
| South East | 0.758 | 0.796 | 0.758 | 0.796 | 0.745 | 0.793 | 0.748 | 0.788 | 0.81 | 0.86 | 0.811 | 0.865 |
| East of England | 0.724 | 0.732 | 0.726 | 0.735 | 0.719 | 0.737 | 0.718 | 0.738 | 0.81 | 0.803 | 0.813 | 0.808 |
| South West | 0.75 | 0.752 | 0.749 | 0.759 | 0.744 | 0.753 | 0.745 | 0.751 | 0.811 | 0.835 | 0.813 | 0.837 |
| North West | 0.726 | 0.718 | 0.729 | 0.717 | 0.726 | 0.715 | 0.724 | 0.713 | 0.819 | 0.774 | 0.818 | 0.774 |
| West Midlands | 0.683 | 0.744 | 0.683 | 0.74 | 0.682 | 0.729 | 0.681 | 0.727 | 0.754 | 0.821 | 0.759 | 0.825 |
| Yorksh. & Hum. | 0.71 | 0.703 | 0.707 | 0.702 | 0.696 | 0.701 | 0.698 | 0.703 | 0.766 | 0.796 | 0.771 | 0.81 |
| East Midlands | 0.724 | 0.816 | 0.727 | 0.821 | 0.722 | 0.812 | 0.721 | 0.809 | 0.789 | 0.897 | 0.787 | 0.898 |
| London | 0.715 | 0.765 | 0.719 | 0.766 | 0.717 | 0.761 | 0.714 | 0.756 | 0.771 | 0.828 | 0.776 | 0.829 |
| North East | 0.726 | 0.691 | 0.728 | 0.693 | 0.726 | 0.69 | 0.725 | 0.687 | 0.781 | 0.78 | 0.782 | 0.783 |
| Federated | 0.74 | 0.741 | 0.737 | 0.735 | 0.816 | 0.818 | ||||||
| Full dataset | 0.74 | 0.743 | 0.737 | 0.737 | 0.817 | 0.82 | ||||||
| MLP | Local | FedAvg | Local | FedAvg | Local | FedAvg | Local | FedAvg | Local | FedAvg | Local | FedAvg |
| South East | 0.763 | 0.79 | 0.762 | 0.795 | 0.751 | 0.789 | 0.754 | 0.787 | 0.843 | 0.892 | 0.849 | 0.895 |
| East of England | 0.774 | 0.897 | 0.783 | 0.895 | 0.766 | 0.891 | 0.767 | 0.891 | 0.845 | 0.933 | 0.844 | 0.919 |
| South West | 0.791 | 0.831 | 0.792 | 0.835 | 0.782 | 0.832 | 0.782 | 0.832 | 0.86 | 0.932 | 0.883 | 0.939 |
| North West | 0.779 | 0.816 | 0.781 | 0.819 | 0.775 | 0.818 | 0.775 | 0.817 | 0.85 | 0.903 | 0.879 | 0.947 |
| West Midlands | 0.725 | 0.791 | 0.725 | 0.801 | 0.724 | 0.79 | 0.721 | 0.79 | 0.814 | 0.862 | 0.812 | 0.85 |
| Yorksh. & Hum. | 0.752 | 0.832 | 0.75 | 0.835 | 0.739 | 0.825 | 0.742 | 0.827 | 0.809 | 0.931 | 0.818 | 0.946 |
| East Midlands | 0.754 | 0.904 | 0.754 | 0.908 | 0.75 | 0.906 | 0.749 | 0.906 | 0.847 | 0.998 | 0.852 | 0.998 |
| London | 0.737 | 0.869 | 0.744 | 0.876 | 0.747 | 0.857 | 0.734 | 0.862 | 0.84 | 0.938 | 0.838 | 0.924 |
| North East | 0.739 | 0.808 | 0.745 | 0.809 | 0.737 | 0.827 | 0.736 | 0.807 | 0.831 | 0.889 | 0.845 | 0.977 |
| Federated | 0.836 | 0.84 | 0.835 | 0.834 | 0.919 | 0.928 | ||||||
| Full dataset | 0.844 | 0.847 | 0.841 | 0.843 | 0.923 | 0.931 | ||||||
Appendix B. MLP Hyperparameters
In this appendix, the hyperparameters of the MLP architecture presented in Section 2 are collected. The hyperparameters were obtained through an optimization process involving all the data from the full dataset. Although this would not be possible in a real scenario, it is the only way to ensure a fair comparison between the federated strategy and the global model. Providing all possible advantages to the centralized baseline is essential in order to avoid the results being skewed towards the federated model.
The optimization was performed using Optuna 4.4 [44], a hyperparameter optimization software.
Table A2.
Best hyperparameters of the MLP for early detection (wave 6 data).
Table A2.
Best hyperparameters of the MLP for early detection (wave 6 data).
| Hyperparameter | Optimal Value |
|---|---|
| Learn rate | |
| Hidden layers | 2 |
| Neurons l1 | 512 |
| Learn rate l1 | |
| Dropout l1 | 0.4 |
| Neurons l2 | 128 |
| Learn rate l2 | |
| Dropout l2 | 0.5 |
References
- Esteva, A.; Robicquet, A.; Ramsundar, B.; Kuleshov, V.; DePristo, M.; Chou, K.; Cui, C.; Corrado, G.; Thrun, S.; Dean, J. A guide to deep learning in healthcare. Nat. Med. 2019, 25, 24–29. [Google Scholar] [CrossRef]
- Poongodi, T.; Sumathi, D.; Suresh, P.; Balusamy, B. Deep learning techniques for electronic health record (EHR) analysis. In Bio-Inspired Neurocomputing; Springer: Berlin/Heidelberg, Germany, 2021; pp. 73–103. [Google Scholar] [CrossRef]
- European Union. Regulation (EU) 2016/679 of the European Parliament and of the Council of 27 April 2016 (General Data Protection Regulation). Official Journal of the European Union, L 119, 2016, pp. 1–88. EUR-Lex. Available online: https://eur-lex.europa.eu/eli/reg/2016/679/oj (accessed on 8 September 2025).
- Hash, J.; Bowen, P.; Johnson, L.; Smith, C.; Steinberg, D. An Introductory Resource Guide for Implementing the Health Insurance Portability and Accountability Act (HIPAA) Security Rule. 2005. Available online: http://www.med.a51.nl/sites/default/files/pdf/NIST.SP.800-66r2.pdf (accessed on 8 September 2025).
- Konečný, J.; McMahan, H.B.; Yu, F.X.; Richtarik, P.; Suresh, A.T.; Bacon, D. Federated Learning: Strategies for Improving Communication Efficiency. arXiv 2016, arXiv:1610.05492. [Google Scholar] [CrossRef]
- Rahman, A.; Hossain, M.; Muhammad, G.; Kundu, D.; Debnath, T.; Rahman, M.; Khan, M.; Tiwari, P.; Band, S. Federated learning-based AI approaches in smart healthcare: Concepts, taxonomies, challenges and open issues. Clust. Comput. 2023, 26, 2271–2311. [Google Scholar] [CrossRef] [PubMed]
- Dhade, P.; Shirke, P. Federated Learning for Healthcare: A Comprehensive Review. Eng. Proc. 2023, 59, 230. [Google Scholar] [CrossRef]
- Chen, X.; Zhu, G.; Deng, Y.; Fang, Y. Federated Learning Over Multihop Wireless Networks With In-Network Aggregation. IEEE Trans. Wirel. Commun. 2022, 21, 4622–4634. [Google Scholar] [CrossRef]
- Nguyen, D.C.; Ding, M.; Pathirana, P.N.; Seneviratne, A.; Li, J.; Vincent Poor, H. Federated Learning for Internet of Things: A Comprehensive Survey. IEEE Commun. Surv. Tutor. 2021, 23, 1622–1658. [Google Scholar] [CrossRef]
- Wang, S.; Liu, F.; Xia, H. Content-based vehicle selection and resource allocation for federated learning in IoV. In Proceedings of the 2021 IEEE Wireless Communications and Networking Conference Workshops (WCNCW), Nanjing, China, 29 March 2021; IEEE: New York, NY, USA, 2021; pp. 1–7. [Google Scholar] [CrossRef]
- Qi, P.; Chiaro, D.; Guzzo, A.; Ianni, M.; Fortino, G.; Piccialli, F. Model aggregation techniques in federated learning: A comprehensive survey. Future Gener. Comput. Syst. 2024, 150, 272–293. [Google Scholar] [CrossRef]
- Zhou, X.; Liang, W.; Wang, K.I.K.; Yan, Z.; Yang, L.T.; Wei, W.; Ma, J.; Jin, Q. Decentralized P2P Federated Learning for Privacy-Preserving and Resilient Mobile Robotic Systems. IEEE Wirel. Commun. 2023, 30, 82–89. [Google Scholar] [CrossRef]
- Sheller, M.J.; Reina, G.A.; Edwards, B.; Martin, J.; Bakas, S. Multi-institutional deep learning modeling without sharing patient data: A feasibility study on brain tumor segmentation. In Proceedings of the Brainlesion: Glioma, Multiple Sclerosis, Stroke and Traumatic Brain Injuries: 4th International Workshop, BrainLes 2018, Held in Conjunction with MICCAI 2018, Granada, Spain, 16 September 2018; Revised Selected Papers, Part I 4. Springer: Berlin/Heidelberg, Germany, 2019; pp. 92–104. [Google Scholar] [CrossRef]
- Clegg, A.; Young, J.; Iliffe, S.; Rikkert, M.O.; Rockwood, K. Frailty in elderly people. Lancet 2013, 381, 752–762. [Google Scholar] [CrossRef]
- Fried, L.P.; Tangen, C.M.; Walston, J.; Newman, A.B.; Hirsch, C.; Gottdiener, J.; Seeman, T.; Tracy, R.; Kop, W.J.; Burke, G.; et al. Frailty in Older Adults: Evidence for a Phenotype. J. Gerontol. Ser. A 2001, 56, M146–M157. [Google Scholar] [CrossRef]
- Eskandari, M.; Parvaneh, S.; Ehsani, H.; Fain, M.; Toosizadeh, N. Frailty Identification Using Heart Rate Dynamics: A Deep Learning Approach. IEEE J. Biomed. Health Inform. 2022, 26, 3409–3417. [Google Scholar] [CrossRef]
- Le Pogam, M.A.; Seematter-Bagnoud, L.; Niemi, T.; Assouline, D.; Gross, N.; Trächsel, B.; Rousson, V.; Peytremann-Bridevaux, I.; Burnand, B.; Santos-Eggimann, B. Development and validation of a knowledge-based score to predict Fried’s frailty phenotype across multiple settings using one-year hospital discharge data: The electronic frailty score. eClinicalMedicine 2022, 44, 101260. [Google Scholar] [CrossRef]
- Florez-Revuelta, F.; Mihailidis, A.; Ziefle, M.; Colonna, L.; Spinsante, S. Privacy-Aware and Acceptable Lifelogging services for older and frail people: The PAAL project. In Proceedings of the 2018 IEEE 8th International Conference on Consumer Electronics—Berlin (ICCE-Berlin), Berlin, Germany, 2–5 September 2018; pp. 1–4. [Google Scholar] [CrossRef]
- Qi, P.; Chiaro, D.; Piccialli, F. FL-FD: Federated learning-based fall detection with multimodal data fusion. Inf. Fusion 2023, 99, 101890. [Google Scholar] [CrossRef]
- Afandy, P.F.; Ng, P.C.; Plataniotis, K.N. Federated Learning for Hierarchical Fall Detection and Human Activity Recognition. In Proceedings of the 2024 IEEE 10th World Forum on Internet of Things (WF-IoT), Ottawa, ON, Canada, 10–13 November 2024; pp. 1–6. [Google Scholar] [CrossRef]
- Ouyang, X.; Shuai, X.; Li, Y.; Pan, L.; Zhang, X.; Fu, H.; Cheng, S.; Wang, X.; Cao, S.; Xin, J.; et al. ADMarker: A Multi-Modal Federated Learning System for Monitoring Digital Biomarkers of Alzheimer’s Disease. In Proceedings of the 30th Annual International Conference on Mobile Computing and Networking, Washington, DC, USA, 18–22 November 2024; pp. 404–419. [Google Scholar]
- Umair, M.; Khan, M.S.; Hanif, M.; Ghaban, W.; Nafea, I.; Mohammed, S.N.; Saeed, F. Privacy-Preserving Dementia Classification from EEG via Hybrid-Fusion EEGNetv4 and Federated Learning. Front. Comput. Neurosci. 2025, 19, 1617883. [Google Scholar] [CrossRef]
- Deng, T.; Hamdan, H.; Yaakob, R.; Kasmiran, K.A. Personalized federated learning for in-hospital mortality prediction of multi-center ICU. IEEE Access 2023, 11, 11652–11663. [Google Scholar] [CrossRef]
- Kerkouche, R.; Acs, G.; Castelluccia, C.; Genevès, P. Privacy-preserving and bandwidth-efficient federated learning: An application to in-hospital mortality prediction. In Proceedings of the Conference on Health, Inference, and Learning, Virtual, 8–10 April 2021; pp. 25–35. [Google Scholar]
- Leghissa, M.; Carrera, Á.; Iglesias, C.A. FRELSA: A dataset for frailty in elderly people originated from ELSA and evaluated through machine learning models. Int. J. Med. Inform. 2024, 192, 105603. [Google Scholar] [CrossRef]
- ELSA. English Longitudinal Study of Ageing. 2024. Available online: https://www.elsa-project.ac.uk/ (accessed on 23 April 2024).
- Steptoe, A.; Breeze, E.; Banks, J.; Nazroo, J. Cohort Profile: The English Longitudinal Study of Ageing. Int. J. Epidemiol. 2012, 42, 1640–1648. [Google Scholar] [CrossRef]
- Banks, J.; Batty, G.D.; Breedvelt, J.; Coughlin, K.; Crawford, R.; Marmot, M.; Nazroo, J.; Oldfield, Z.; Steel, N.; Steptoe, A.; et al. English Longitudinal Study of Ageing: Waves 0–10, 1998–2023. 2025. Available online: https://beta.ukdataservice.ac.uk/datacatalogue/doi/?id=5050#!#31 (accessed on 8 September 2025).
- Yang, Q.; Liu, Y.; Chen, T.; Tong, Y. Federated Machine Learning: Concept and Applications. ACM Trans. Intell. Syst. Technol. 2019, 10, 1–9. [Google Scholar] [CrossRef]
- Urbanowicz, R.J.; Olson, R.S.; Schmitt, P.; Meeker, M.; Moore, J.H. Benchmarking relief-based feature selection methods for bioinformatics data mining. J. Biomed. Inform. 2018, 85, 168–188. [Google Scholar] [CrossRef]
- McMahan, H.B.; Moore, E.; Ramage, D.; y Arcas, B.A. Federated Learning of Deep Networks using Model Averaging. CoRR 2016, abs/1602.05629. Available online: https://openreview.net/forum?id=emqdv1Dlsf (accessed on 8 September 2025).
- Li, T.; Sahu, A.K.; Zaheer, M.; Sanjabi, M.; Talwalkar, A.; Smith, V. Federated optimization in heterogeneous networks. Proc. Mach. Learn. Syst. 2020, 2, 429–450. [Google Scholar] [CrossRef]
- Wang, J.; Liu, Q.; Liang, H.; Joshi, G.; Poor, H.V. Tackling the objective inconsistency problem in heterogeneous federated optimization. In Proceedings of the Advances in Neural Information Processing Systems 33 (NeurIPS 2020), Virtual, 6–12 December 2020; Volume 33, pp. 7611–7623. [Google Scholar] [CrossRef]
- Karimireddy, S.P.; Kale, S.; Mohri, M.; Reddi, S.; Stich, S.; Suresh, A.T. Scaffold: Stochastic controlled averaging for federated learning. In Proceedings of the International Conference on Machine Learning, PMLR, Virtual, 13–18 July 2020; pp. 5132–5143. [Google Scholar] [CrossRef]
- Zhang, B.; Mao, Y.; Xu, H.; Chen, Y.; Muazu, T.; He, X.; Wu, J. Overcoming Forgetting Using Adaptive Federated Learning for IIoT Devices With Non-IID Data. IEEE Internet Things J. 2025, 12, 21025–21037. [Google Scholar] [CrossRef]
- Li, Q.; He, B.; Song, D. Model-contrastive federated learning. In Proceedings of the IEEE/CVF Conference on Computer Vision and Pattern Recognition, Virtual, 19–25 June 2021; pp. 10713–10722. [Google Scholar] [CrossRef]
- Fallah, A.; Mokhtari, A.; Ozdaglar, A. Personalized federated learning: A meta-learning approach. arXiv 2020, arXiv:2002.07948. [Google Scholar] [CrossRef]
- Li, X.; Huang, K.; Yang, W.; Wang, S.; Zhang, Z. On the Convergence of FedAvg on Non-IID Data. arXiv 2019, arXiv:1907.02189. [Google Scholar] [CrossRef]
- Casella, B.; Esposito, R.; Cavazzoni, C.; Aldinucci, M. Benchmarking FedAvg and FedCurv for Image Classification Tasks. arXiv 2023, arXiv:2303.17942. [Google Scholar] [CrossRef]
- de Enciso, J.; Leghissa, M.; Araque, O.; Carrera, A. Exploring temporal features in health records for frailty detection. In Proceedings of the Actas XLII Congreso Anual de la Sociedad Española de Ingeniería Biomédica (CASEIB 2024), SEIB, Sevilla, Spain, 13–15 November 2024; pp. 273–276. [Google Scholar]
- Yao, J.; Sharma, A. Continual Federated Learning for Dynamic Data Environments. In Proceedings of the 2024 IEEE Pacific Rim Conference on Communications, Computers and Signal Processing (PACRIM), Victoria, BC, Canada, 21–23 August 2024; pp. 1–6. [Google Scholar] [CrossRef]
- Beutel, D.J.; Topal, T.; Mathur, A.; Qiu, X.; Fernandez-Marques, J.; Gao, Y.; Sani, L.; Kwing, H.L.; Parcollet, T.; Gusmão, P.P.d.; et al. Flower: A Friendly Federated Learning Research Framework. arXiv 2020, arXiv:2007.14390. [Google Scholar] [CrossRef]
- Vellido, A. The importance of interpretability and visualization in machine learning for applications in medicine and health care. Neural Comput. Appl. 2020, 32, 18069–18083. [Google Scholar] [CrossRef]
- Akiba, T.; Sano, S.; Yanase, T.; Ohta, T.; Koyama, M. Optuna: A Next-generation Hyperparameter Optimization Framework. In Proceedings of the 25th ACM SIGKDD International Conference on Knowledge Discovery and Data Mining, Anchorage, AK, USA, 4–8 August 2019; pp. 2623–2631. [Google Scholar] [CrossRef]
Disclaimer/Publisher’s Note: The statements, opinions and data contained in all publications are solely those of the individual author(s) and contributor(s) and not of MDPI and/or the editor(s). MDPI and/or the editor(s) disclaim responsibility for any injury to people or property resulting from any ideas, methods, instructions or products referred to in the content. |
© 2025 by the authors. Licensee MDPI, Basel, Switzerland. This article is an open access article distributed under the terms and conditions of the Creative Commons Attribution (CC BY) license (https://creativecommons.org/licenses/by/4.0/).