Article

A Study on the Monitoring and Response Mechanism of Highway Subgrade Structures Based on Ultra-Weak FBG Sensing Array

1
National Engineering Research Center of Fiber Optic Sensing Technology and Networks, Wuhan University of Technology, Wuhan 430070, China
2
School of Mechanical and Electronic Engineering, Wuhan University of Technology, Wuhan 430070, China
3
Fujian Provincial Expressway Technology Innovation Research Institute Co., Ltd., Fuzhou 350001, China
*
Author to whom correspondence should be addressed.
Appl. Sci. 2025, 15(18), 9930; https://doi.org/10.3390/app15189930
Submission received: 13 August 2025 / Revised: 3 September 2025 / Accepted: 9 September 2025 / Published: 10 September 2025
(This article belongs to the Special Issue Advances in Structural Health Monitoring in Civil Engineering)

Abstract

Conducting structural monitoring of highway subgrades is crucial for investigating damage evolution mechanisms under dynamic load-temperature coupling effects. However, existing sensing technologies struggle to achieve distributed, long-term, and high-precision measurements of subgrade structures. Therefore, this study employs next-generation fiber-optic array sensing technology to construct a distributed monitoring system based on weak reflection grating arrays. A dual-parameter sensing network for strain and temperature was designed and installed during the expansion and renovation of a highway in Fujian Province, enabling high-precision monitoring of the entire continuous strain field and temperature field of the subgrade structure. Through a comprehensive analysis of dynamic loading test data and long-term monitoring records, the system revealed the dynamic response patterns of subgrade structures under the interaction of modulus differences, burial depth effects, temperature gradients, and load parameters. It elucidated the mechanical sensitivity of flexible base layers and the interlayer stress redistribution mechanism. The study validated that grating array sensors not only offer advantages such as easy installation, a high survival rate, and excellent durability but also enable high-capacity, long-distance, and high-precision measurements of subgrade structures. This provides a new technical approach for full lifecycle monitoring of expressways.

1. Introduction

As the core arteries of modern transportation networks, the structural integrity of expressways directly impacts both the efficiency of national economic operations and public travel safety. With the deepening implementation of China’s “Transportation Powerhouse” strategy, the total length of expressways nationwide exceeded 177,000 km by the end of 2023, handling 76% of inter-city freight transportation and 58% of passenger transportation volume [1]. However, under the dual pressures of surging traffic volume (with an average annual growth rate of 6.8%) and increasing heavy-load vehicles (with an axle load overlimit rate of 12.3%), early-built expressways have entered a concentrated major repair phase. Road maintenance funding alone reached 32 billion yuan in 2024 [2]. This severe situation imposes higher demands on pavement structural performance monitoring technologies, urgently requiring the establishment of a scientific and precise preventive maintenance decision-making system.
Under the coupled effects of complex climatic and traffic conditions, pavement structures exhibit typical nonlinear damage characteristics [3]. In humid and hot regions like Fujian, annual precipitation reaches 1800–2000 mm, with humidity consistently exceeding 75%. This unique environment causes traditional semi-rigid bases to readily develop thermal contraction cracks and scour damage [4,5]. To address this, a novel composite flexible base structure has emerged. It employs a layered design comprising “dense-graded asphalt macadam + graded crushed stone + cement-stabilized crushed stone,” enhancing structural durability through a balanced mechanical combination of rigid and flexible elements. However, engineering practice indicates that the interlayer deformation coordination mechanism of such structures remains incompletely understood. Particularly under the coupled effects of dynamic wheel loads and temperature gradients, the interlayer contact state is prone to progressive deterioration, triggering pathologies such as reflective cracking and interlayer slippage [6,7,8]. Statistics show that interlayer failure accounts for 34% of early-stage damage, directly reducing pavement service life by 30–40%.
Currently, highway infrastructure monitoring is advancing toward automation, precision, and intelligence, with comprehensive acquisition of structural condition information serving as the foundation for achieving intelligent systems. The primary sensors used for highway structural monitoring today fall into two main categories: point-type electromagnetic sensors and fiber optic sensors. The former, with examples including resistive strain gauges and piezoelectric sensors, typically only capture response information at discrete local points like cross-sections, making it difficult to achieve comprehensive status perception of the entire highway structure [9]. The latter, with examples including distributed fiber optic sensing systems based on Brillouin optical scattering, while possessing continuous measurement capabilities, suffer from issues like low strain measurement accuracy and slow response speed [10,11], making it challenging to meet the dynamic monitoring demands under actual traffic loads.
In contrast, weak-reflectance fiber Bragg grating (WFBG) distributed systems demonstrate significant advantages in highway structural monitoring [12,13,14]. Compared to point-based electromagnetic sensors, WFBG systems leverage ultra-low reflectivity grating design and hybrid multiplexing techniques [15,16] to achieve high-density deployment of tens of thousands of measurement points on a single fiber. This enables spatial resolution as fine as 1 m, overcoming the limitations of traditional point sensors that struggle to achieve full-area sensing. Compared to Brillouin scattering-based distributed fiber sensing, WFBG not only enables full-coverage distributed measurements but also delivers high-precision measurements in localized areas. It captures real-time dynamic strain responses induced by vehicle loads, making it suitable for comprehensive real-time dynamic monitoring of highway subgrade structures [17].
To address the unique requirements of highway subgrade structures, this study employs flexible-packaged sensing optical cables. Tailored burial schemes are designed for different structural layer materials. Utilizing a multi-channel, high-sampling-frequency array grating signal demodulator, a high-capacity, high-precision distributed strain and temperature monitoring system is established. This system has been applied in the structural monitoring of a modified and expanded highway embankment in Fujian Province, enabling in-depth investigation into the response patterns of the subgrade structure under vehicle-environment coupling effects.

2. Principle

The essence of fiber Bragg gratings (FBGs) lies in establishing periodic refractive index modulation structures within the fiber core, with their physical formation mechanism involving ultraviolet laser-induced photosensitive effects [18]. When interference fringes of specific wavelengths act upon germanium-doped quartz fiber, the core material undergoes permanent structural reorganization, forming a refractive index modulation region with a periodicity of Λ (as shown in Figure 1). According to coupled-mode theory, this periodic structure induces phase matching between forward and backward guided modes, resulting in characteristic wavelength reflection when the Bragg condition is satisfied [19]:
λ B = 2 n e f f Λ
The formula shows the center wavelength of the fiber optic grating; the effective refractive index of the fiber core; and the grating period.
When external temperature or strain causes changes, drift occurs. By detecting the amount of drift, parameter sensing can be achieved.
Traditional FBGs typically feature high reflectivity (>10%), resulting in strong reflected signals. However, during array multiplexing, they are prone to spectral overlap and multi-grating crosstalk issues, limiting their distributed sensing capabilities. To overcome this limitation, this study employs weak-reflectance fiber Bragg grating (WFBG) technology. WFBGs maintain the sensing principle while reducing reflectivity to the order of a few thousandths, significantly mitigating optical path crosstalk [20] and enabling large-scale array multiplexing. WFBG array sensing networks commonly utilize wavelength-division and time-division multiplexing techniques. Figure 2 shows the schematic of a grating array distributed sensing system [21]. Under external loads (stress, temperature, etc.), the wavelength of the corresponding grating changes. By employing time-division demodulation to determine the location and wavelength-division demodulation to measure the wavelength shift, the system achieves both measurement and localization of external physical quantities [22].

3. Monitoring Plan

3.1. Typical Flexible Subgrade Structure Composition

This study focuses on optimizing the subgrade structure for a typical composite flexible base asphalt pavement in Fujian Province, addressing the complex service environment of the southeastern coastal region characterized by heavy rainfall, high temperatures (summer pavement surface temperatures can reach up to 60 °C), and heavy traffic loads. The structure employs a six-layer composite system, arranged from top to bottom as follows: modified asphalt concrete skid-resistant surface course (AC-16C), medium-grade modified asphalt concrete base course (AC-20C), dense-graded asphalt-stabilized crushed stone upper base course (ATB-25), graded crushed stone lower base course, 3% cement-stabilized crushed stone subbase, and natural subgrade. The graded crushed stone layer serves as a flexible transition layer, connecting the upper asphalt structure with the lower semi-rigid cement-stabilized layer. This creates a stress gradient structure characterized by “flexibility above and rigidity below,” effectively mitigating reflective cracking caused by abrupt changes in interlayer stiffness. The design modulus, thickness, and splitting strength of each structural layer are shown in Table 1.

3.2. Deployment Plan

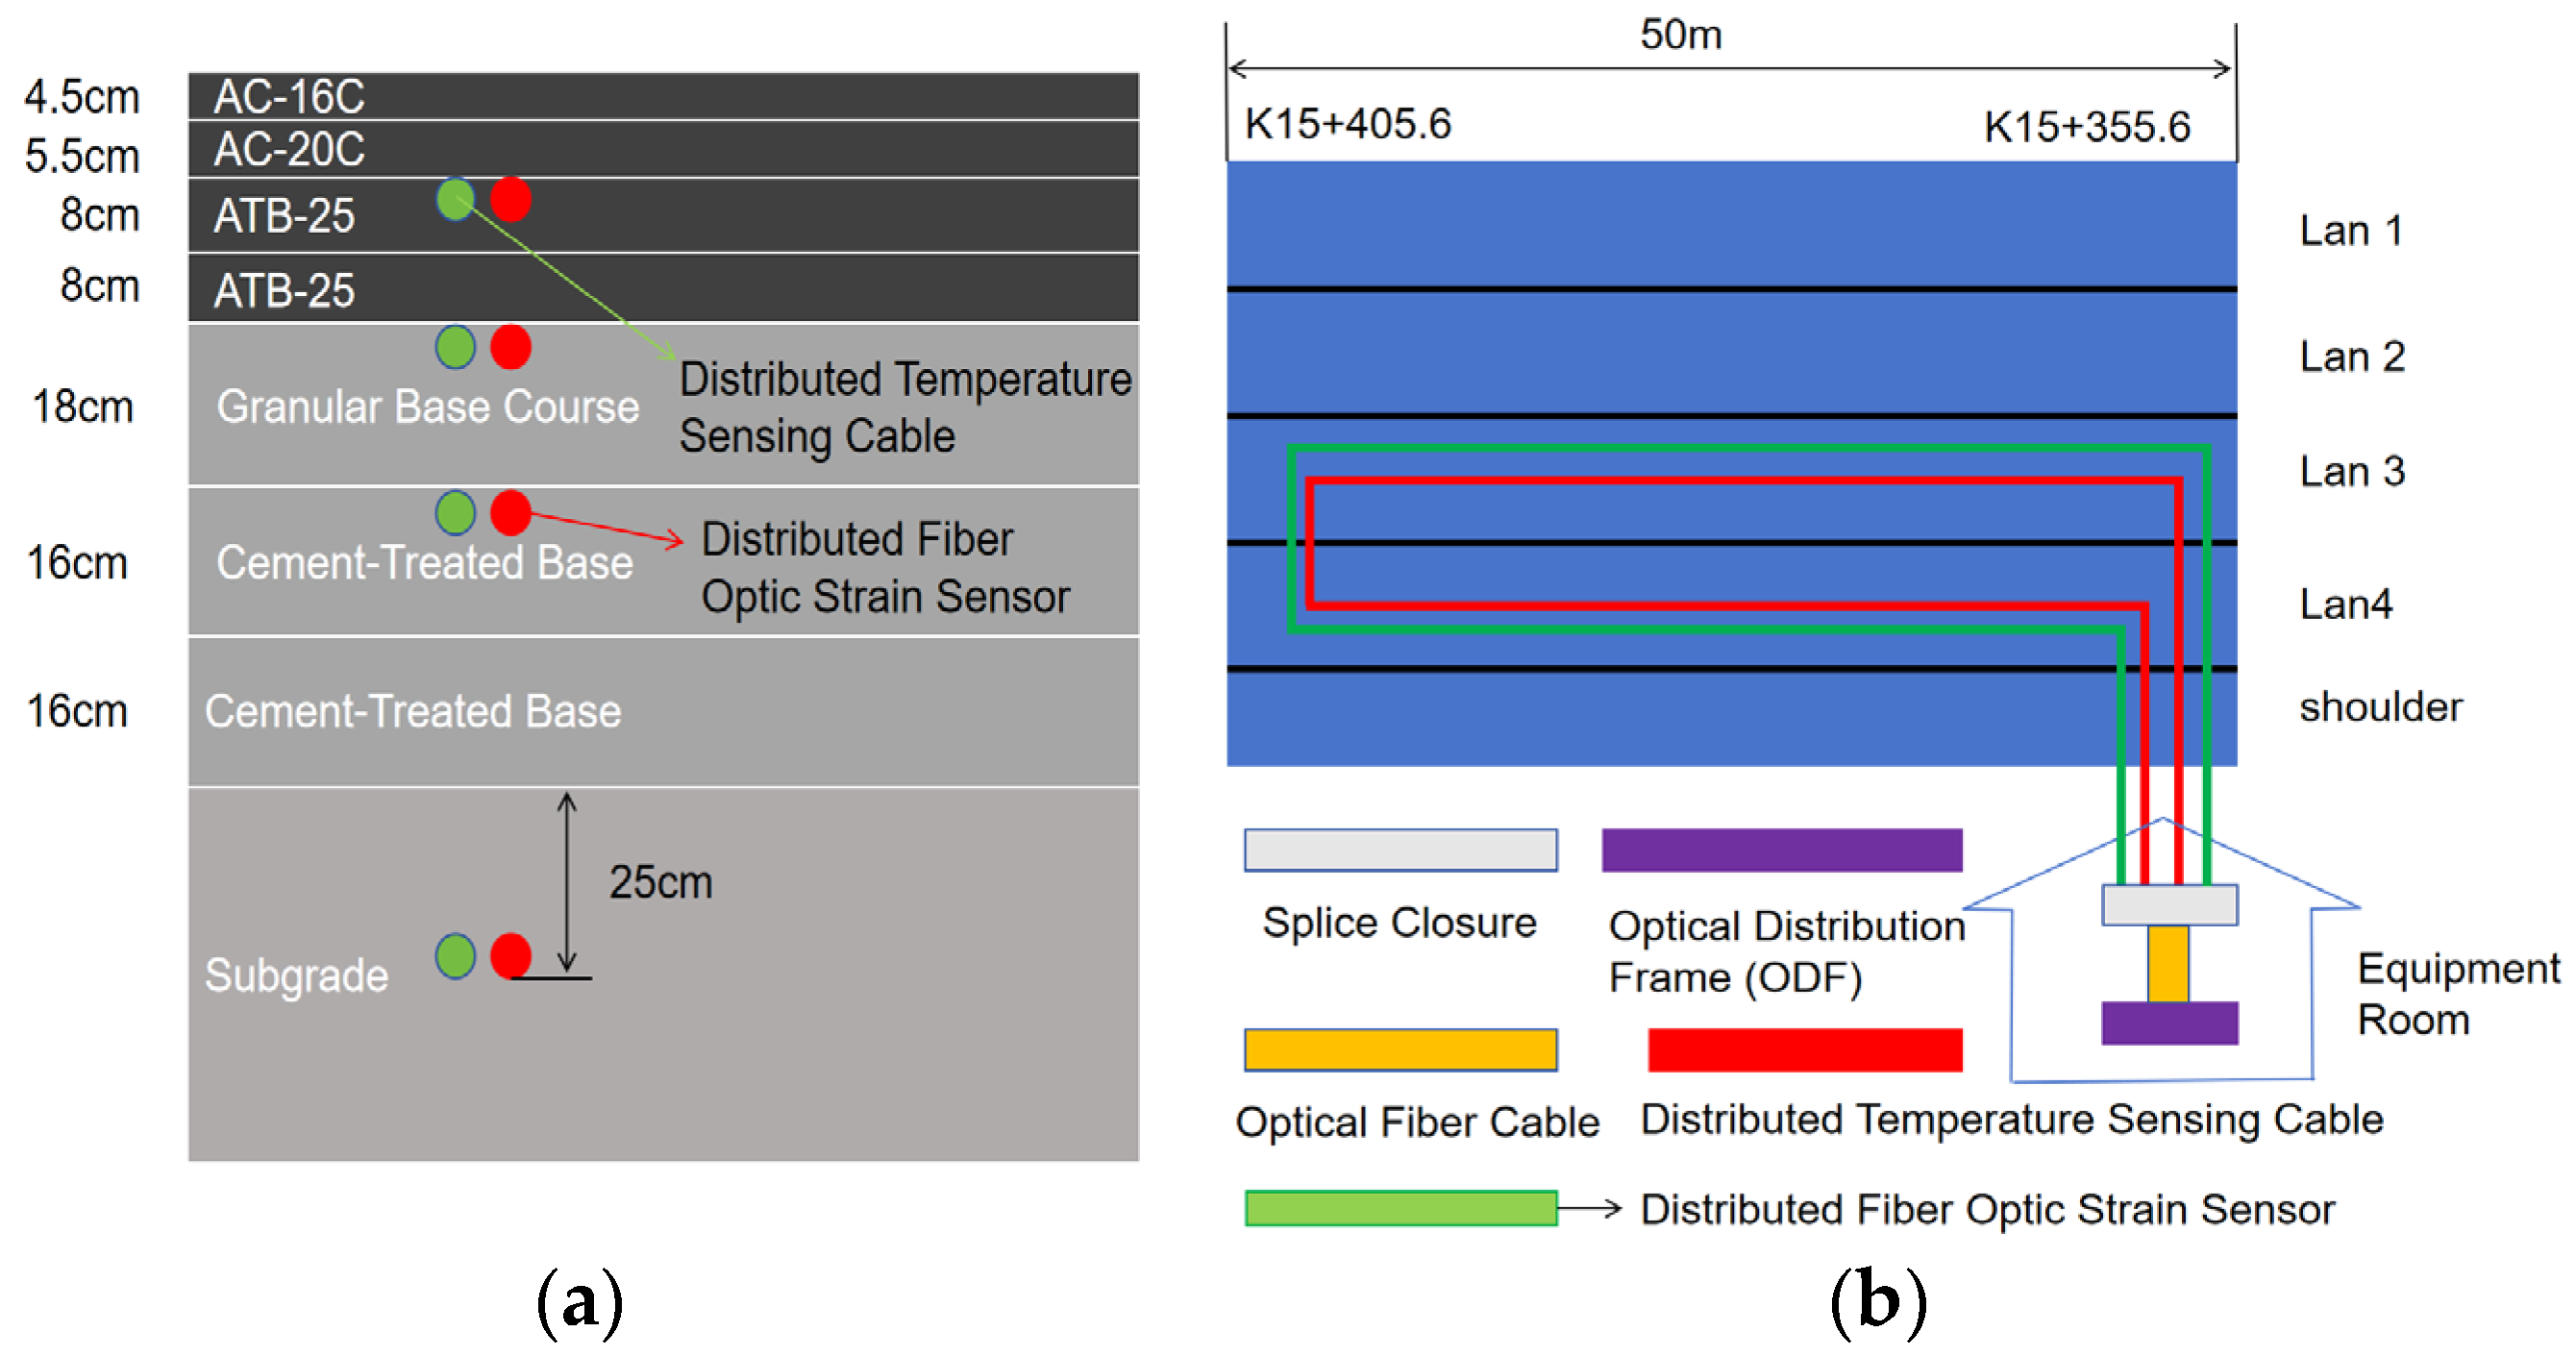
To achieve precise sensing of multi-layer strain and temperature responses within the subgrade structure, this study designed and implemented a systematic sensor cable layout plan in a 50-m test section. The overall layout follows the principles of “layered embedding, directional deployment, and differentiated construction” to ensure that the grating array accurately reflects mechanical changes under real-world conditions. The specific deployment scheme of the optical cables within the roadbed structure is shown in Figure 3.
Considering the construction characteristics of different structural layers, the layout plan was optimized accordingly. The technical details are as follows:
(1)
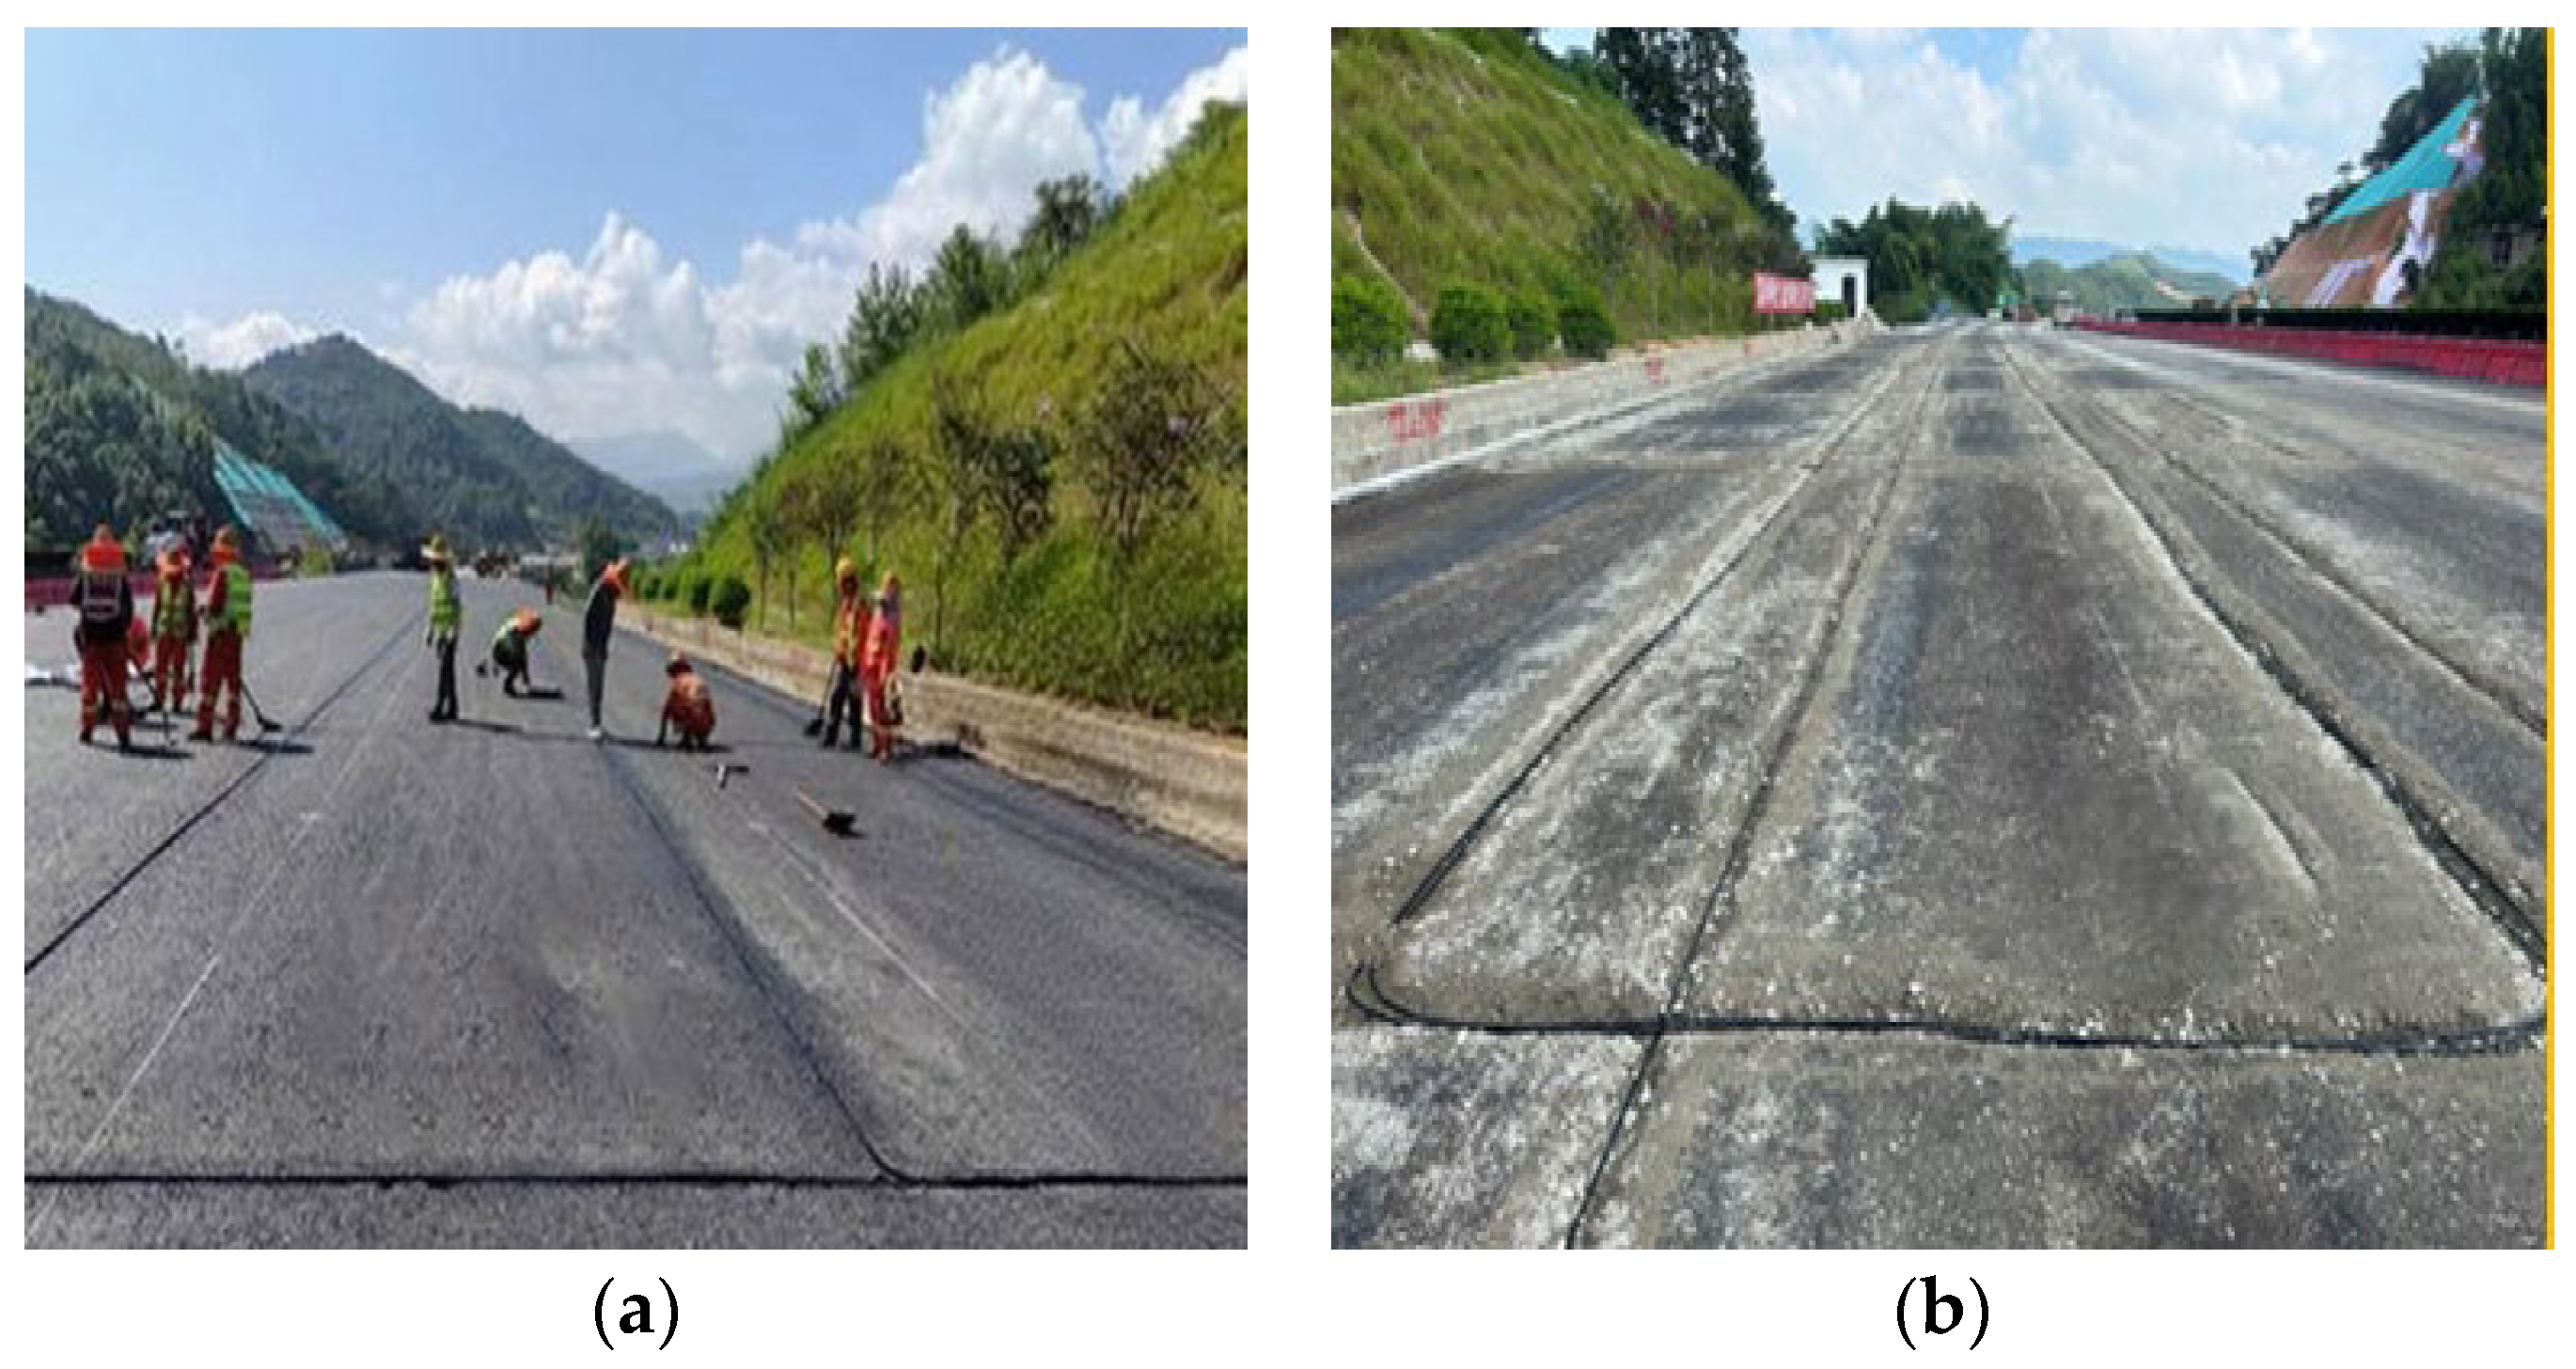
High-temperature conditions for ATB-25 upper and lower layers: The paving temperature of the ATB layer can reach 160–180 °C, and traditional epoxy encapsulation is prone to failure due to thermal degradation. To ensure the stability of the sensor optical cable under high-temperature conditions, a high-temperature-resistant slot-cutting process is adopted: after the surface layer has cooled to a constructable temperature, a specialized slot-cutting device is used to excavate a rectangular slot measuring 4 cm (width) × 3 cm (depth). After laying the optical cable, the slot is filled and sealed with asphalt cold patch material.
(2)
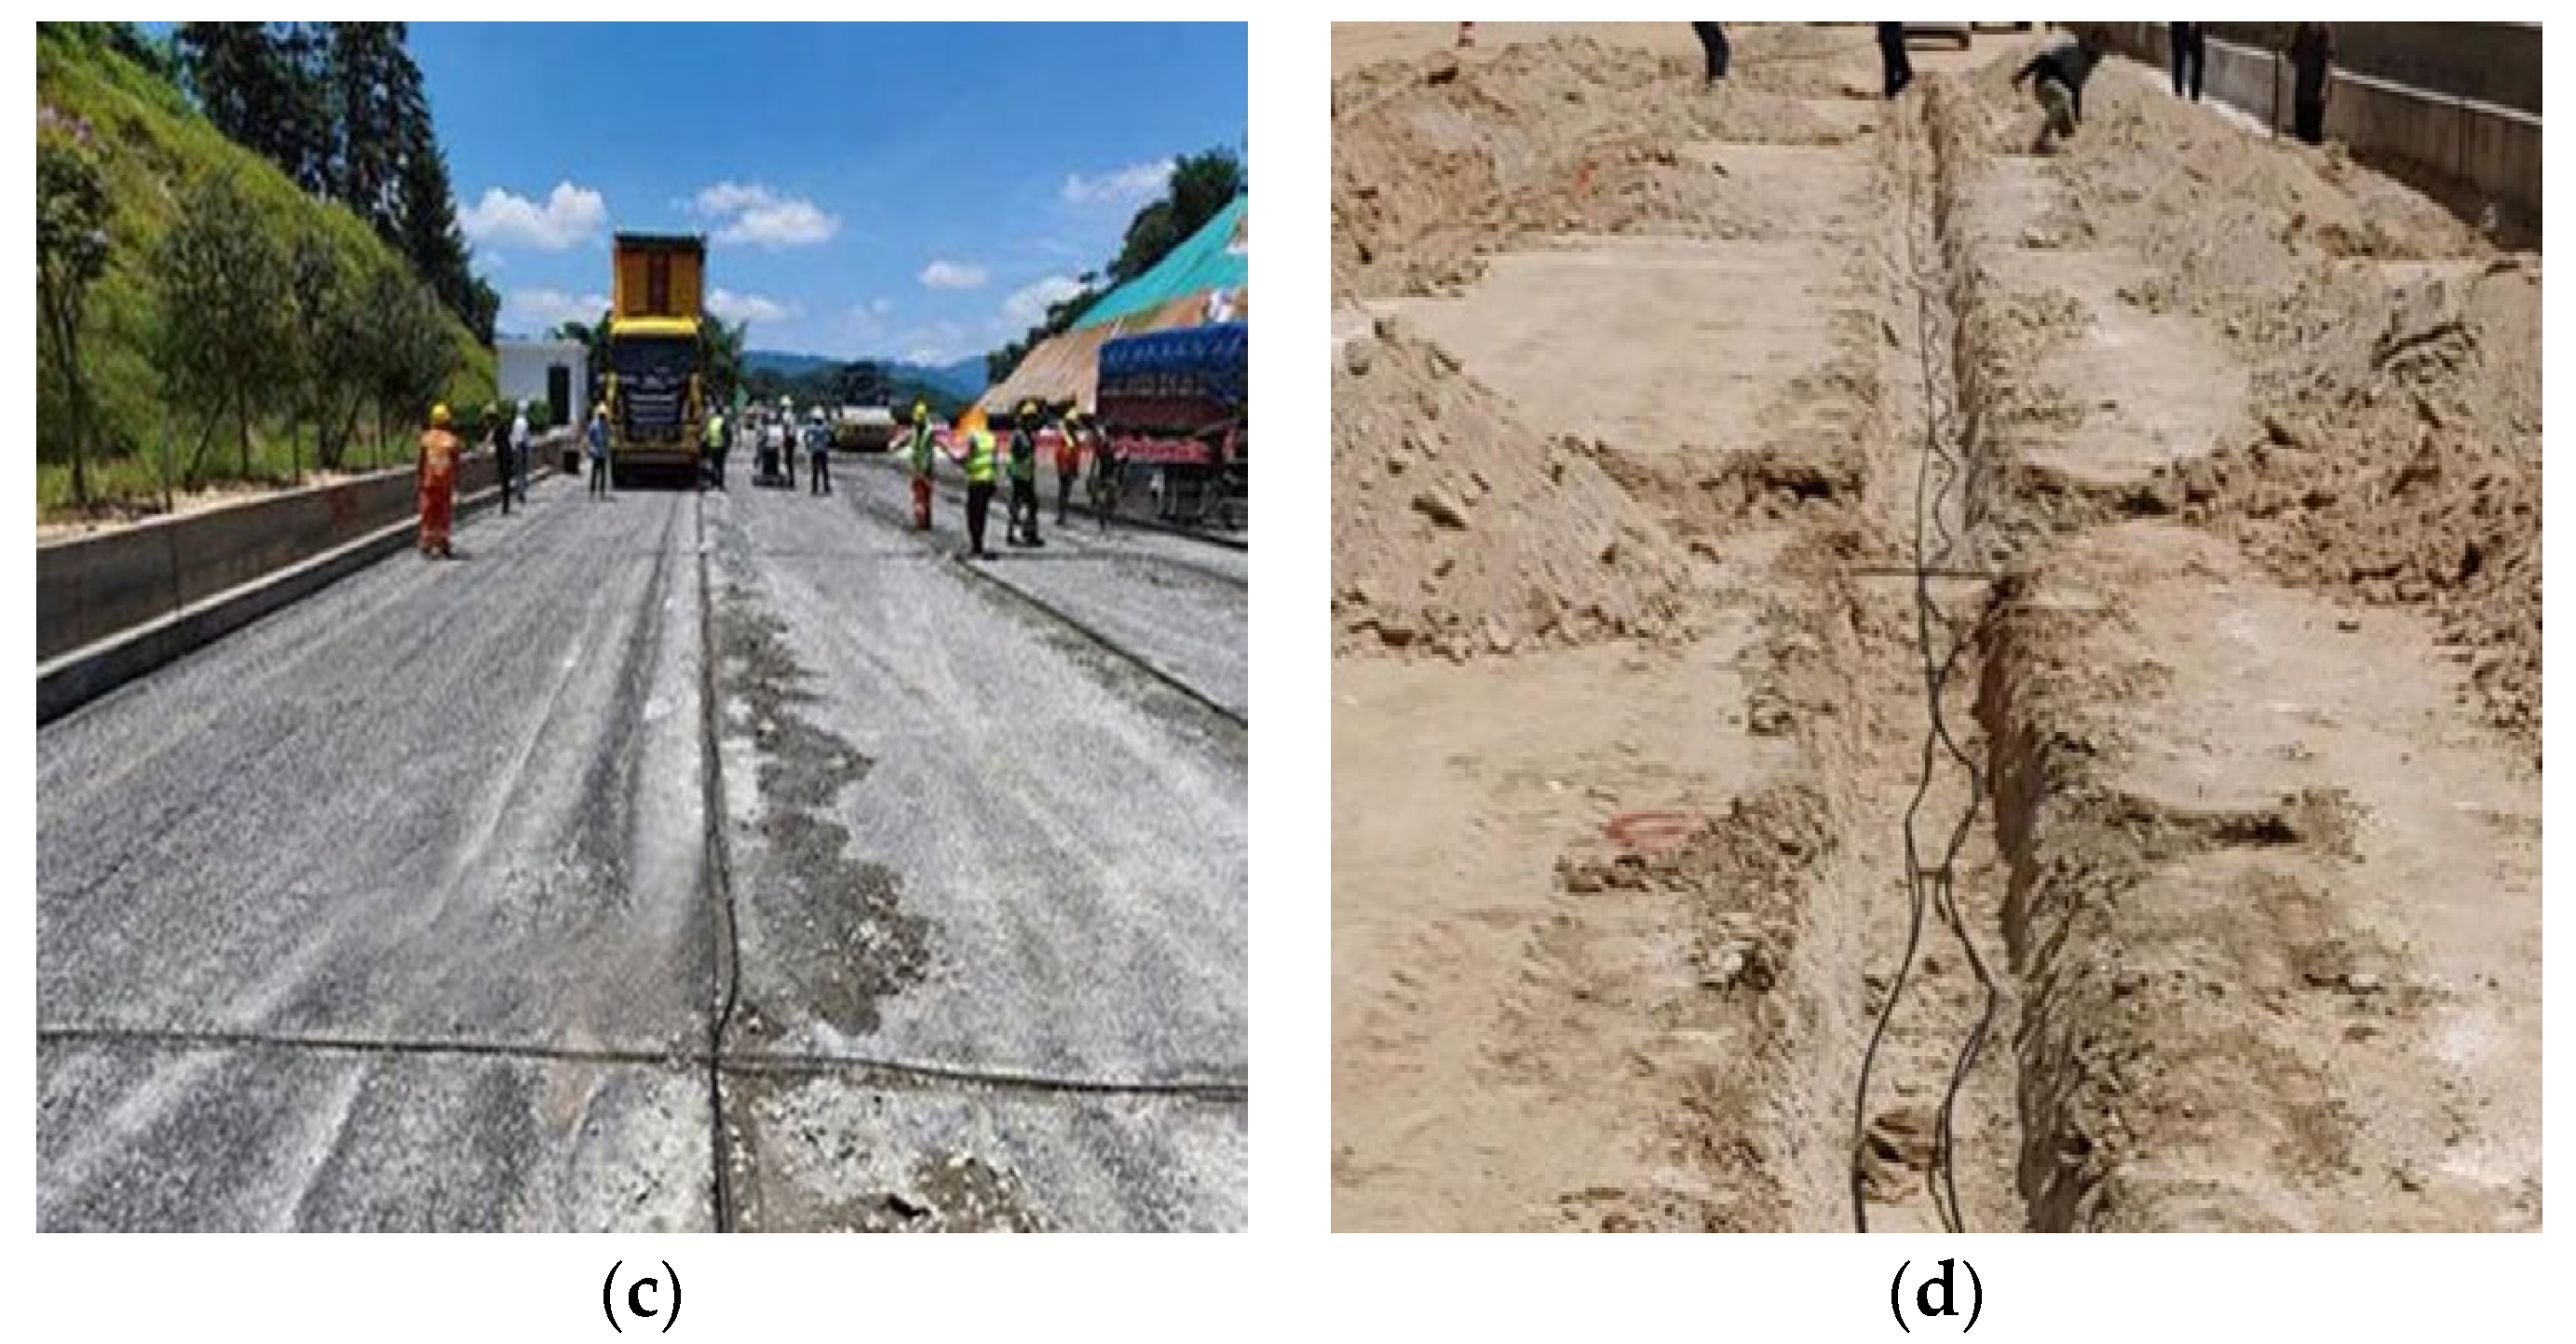
Granular Base Course and Cement-Treated Base to resist mechanical damage: The middle and lower layers are at risk of being crushed by the tracks of the paver during construction. Longitudinal cable laying can avoid equipment operation paths, while transverse laying requires enhanced protection. This involves excavating a protective trench with dimensions of 5 cm (width) × 4 cm (depth) using a pre-cut slot method and then backfilling with cement mortar after cable laying to enhance mechanical resistance and stability.
(3)
Subgrade: In the soil layer, trenches are dug and cables are laid. The trench dimensions are 10 cm (width) × 25 cm (depth). After laying the optical cable, the original soil is used to backfill the trench in layers and compacted to ensure the burial depth, positioning accuracy, and long-term stability.
Figure 4 shows the actual scene of sensor optical cable installation during the construction of each structural layer. After embedding the sensor optical cables in each layer of the roadbed, the signals are connected to the demodulator inside the equipment room. Through running car tests, the sensor positions and identification numbers for each layer are determined, establishing the correspondence between sensor identification numbers and monitoring locations as shown in Figure 5 below.

3.3. System Configuration and Data Acquisition Plan

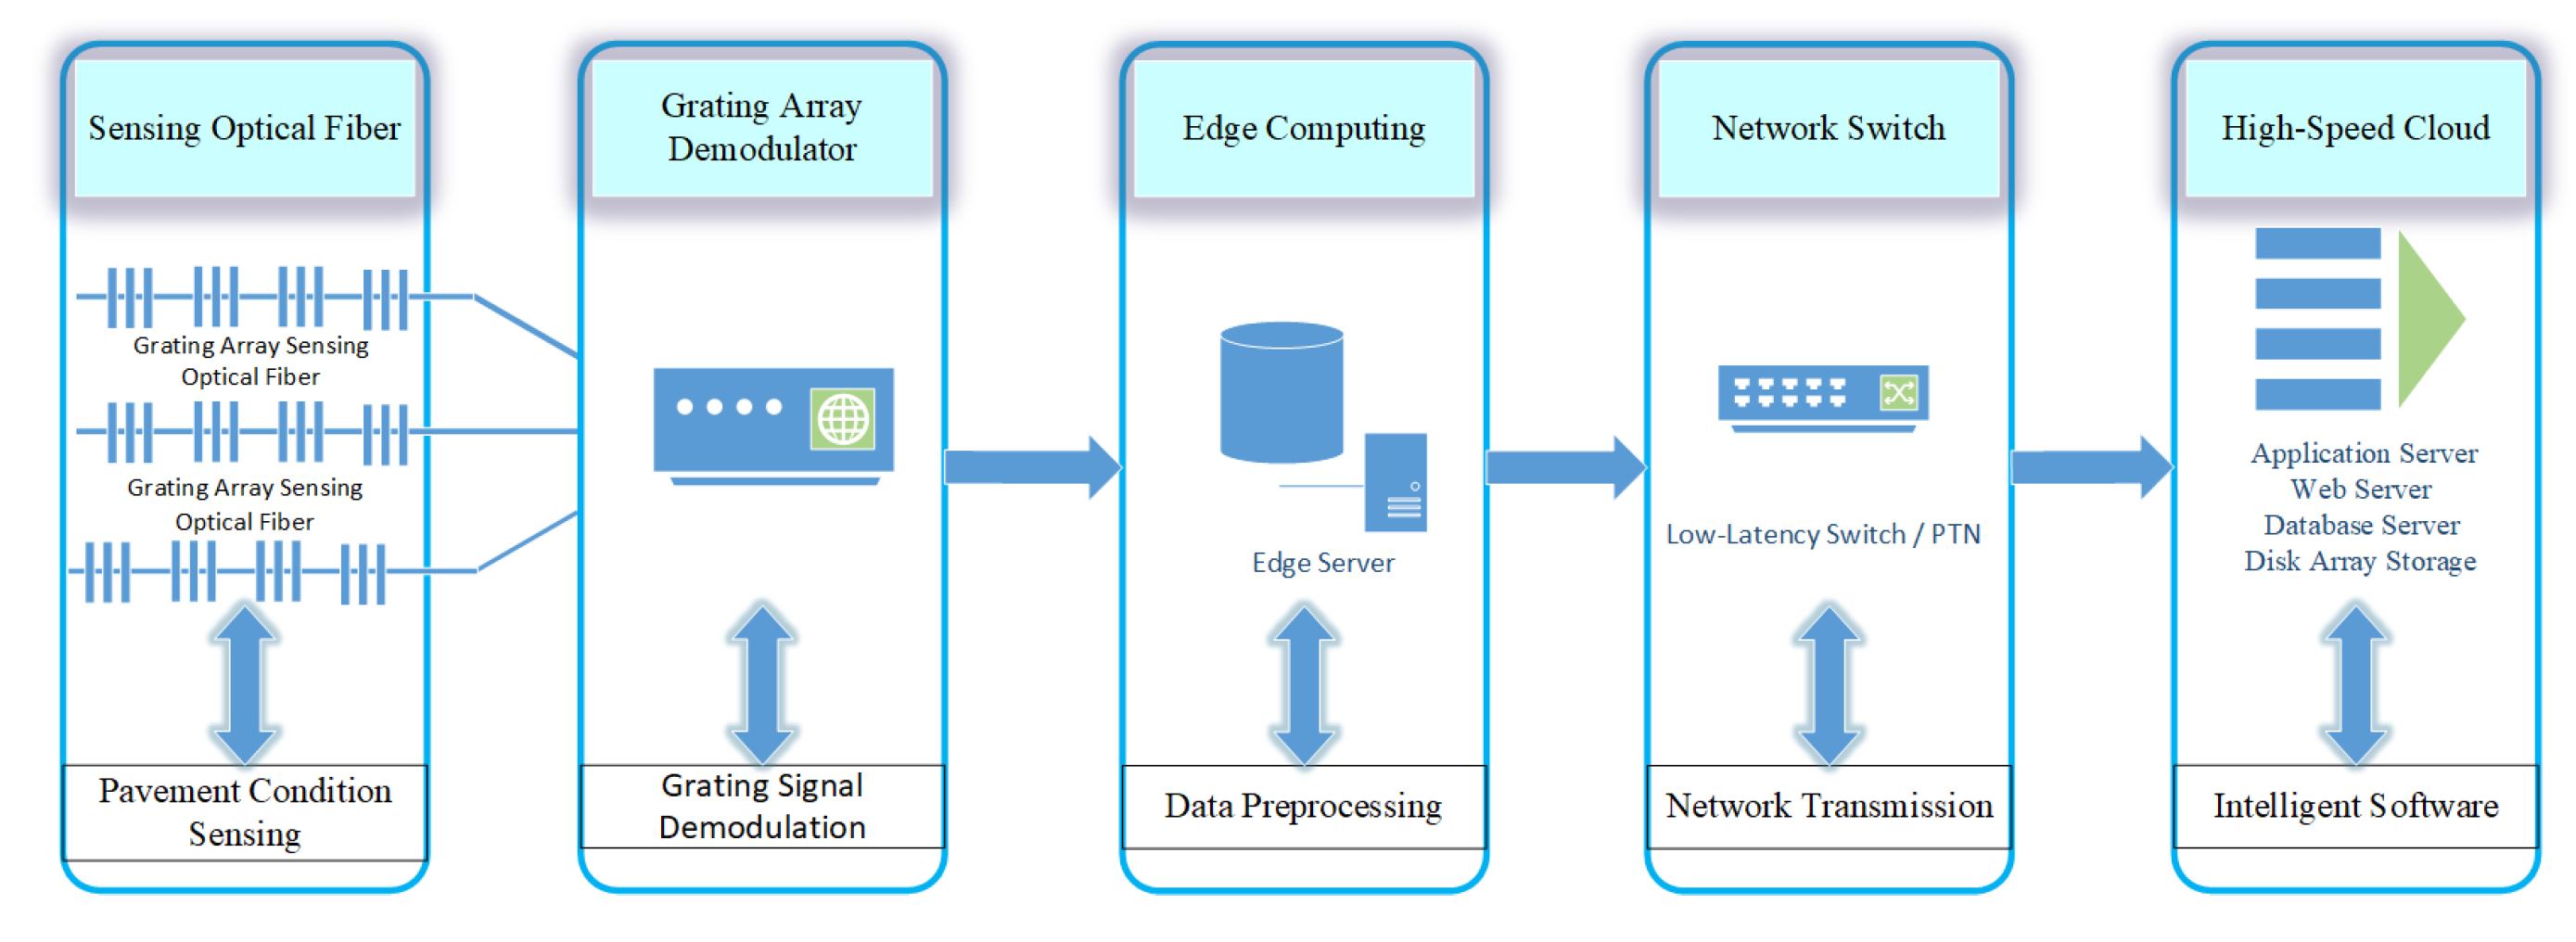
To monitor the dynamic response of multi-layer roadbed structures on expressways under various loads and environmental conditions before and after traffic operation, this study developed a complete distributed data acquisition system based on weak reflectivity fiber Bragg grating (WFBG) technology. The system primarily comprises five functional modules: grating array sensing network, grating signal demodulation system, edge computing preprocessing, network transmission channel, and intelligent analysis software, as shown in Figure 6 The system is designed around three core objectives: comprehensive structural state sensing, high-frequency demodulation, and intelligent decision support. It leverages multi-physics field sensing, high-speed edge processing, and intelligent platform integration to ensure highway structural safety and operational efficiency.
The system consists of the following five core components:
(1)
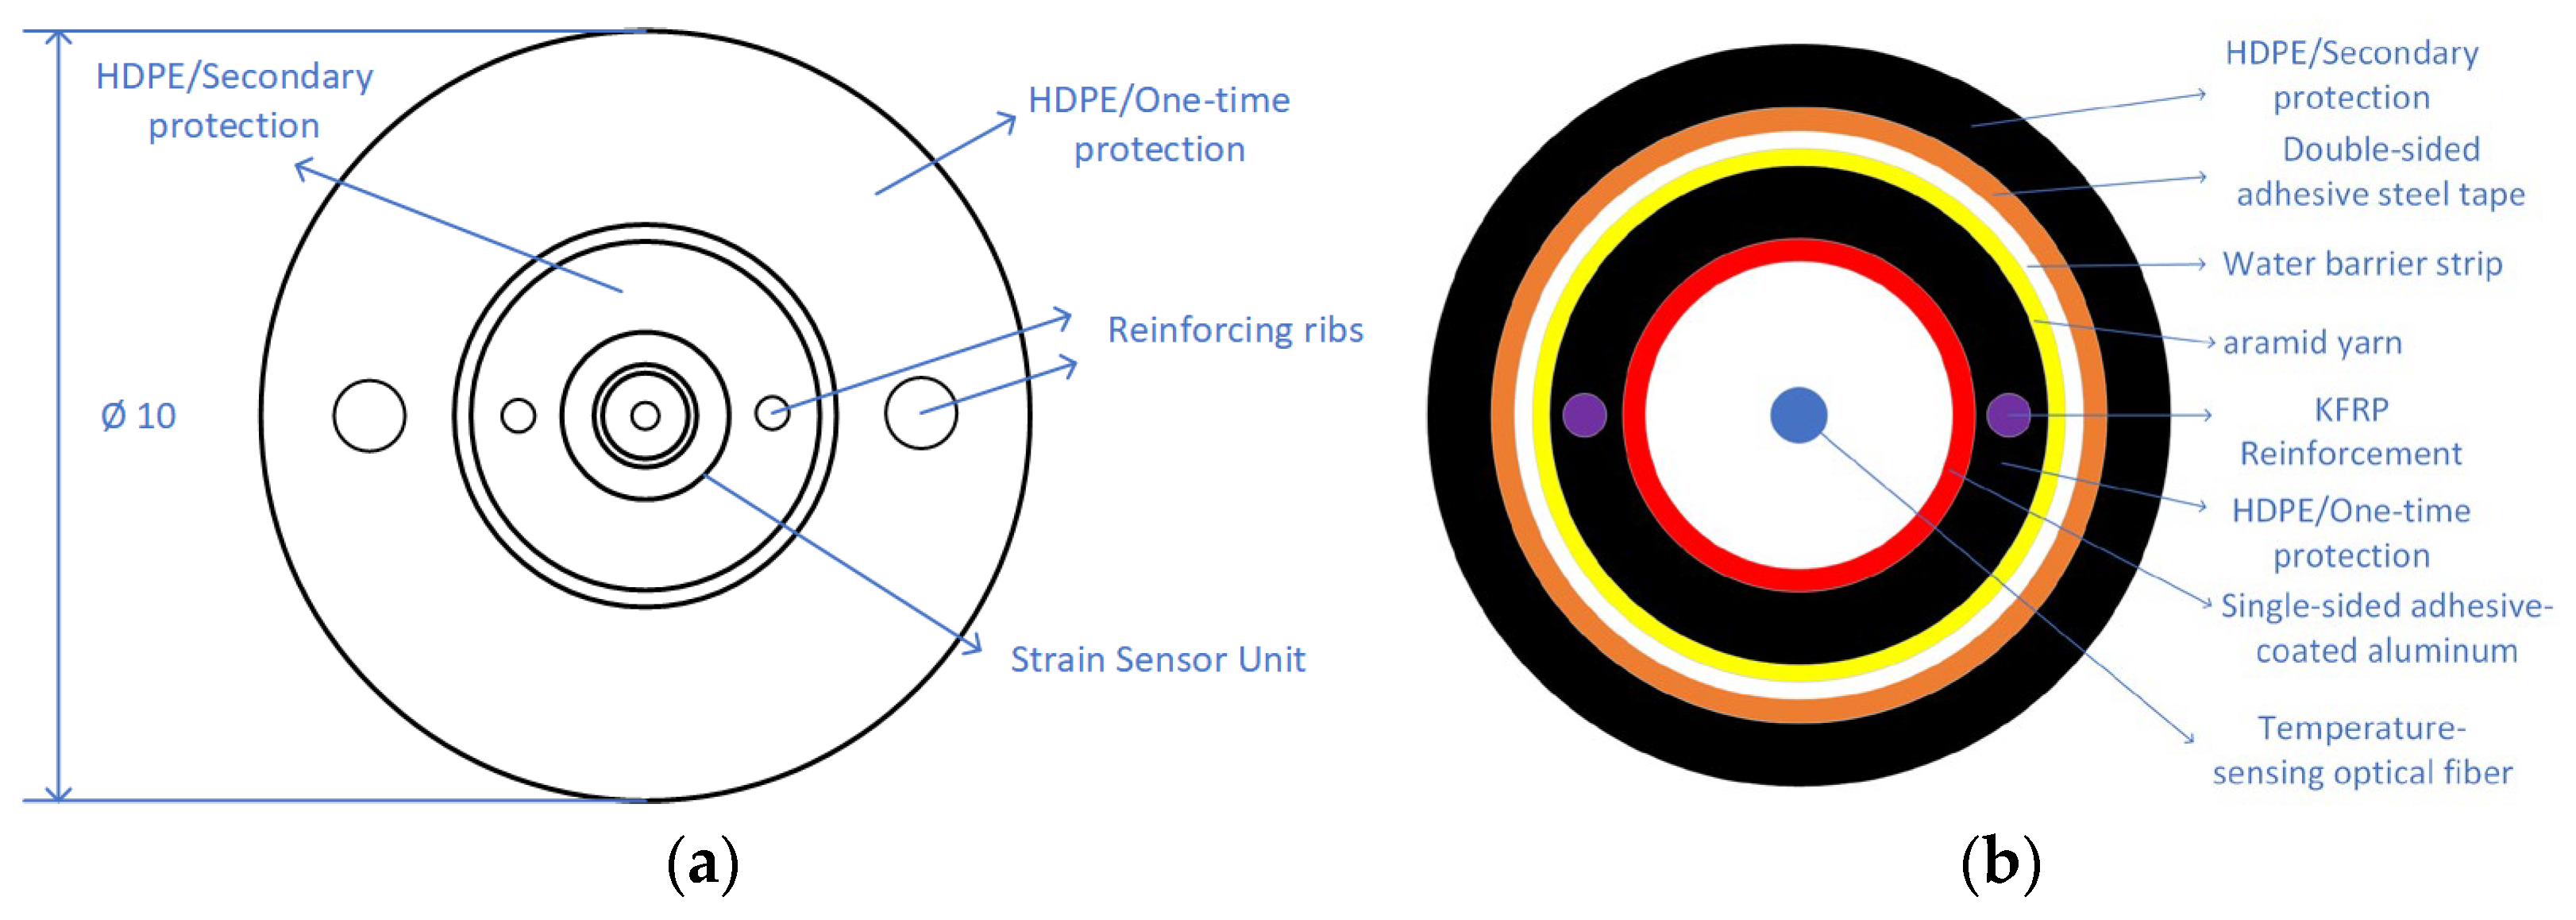
This section constitutes the system’s primary sensing layer, primarily composed of fiber optic strain sensing cables and temperature sensing cables deployed within various structural layers. The cross-section of the sensing cable is shown in Figure 7. Figure 7a depicts a direct-buried strain sensing cable employing a central tube structure with an internal fixed-point configuration. This design allows for the application of prestress to the sensing fiber, enabling continuous strain monitoring over large gauge lengths. The strain optical cable incorporates dual protective layers. The first layer features a strain unit structure with a stainless steel spiral armor tube design, embedded with two parallel steel wires as reinforcing elements. The second layer employs a steel tape longitudinal wrapping combined with parallel steel wire reinforcement, significantly enhancing the cable’s overall mechanical strength. A structural adhesive is uniformly filled between the two protective layers, improving the overall stiffness and strain transmission performance of the strain-sensing optical cable. Figure 7b shows the direct-burial temperature sensing optical cable, featuring a central tube structure with embedded sensing fibers and accompanying fibers. The excess length of the accompanying fibers is controlled between 2‰ and 3‰ to ensure the sensing fibers remain free from stress. To enhance mechanical performance and accommodate direct burial installation, a dual-armor, dual-sheath structure provides reinforced protection. The inner sheath consists of aluminum cladding and HDPE, while the outer sheath comprises steel tape and HDPE.
(2)
This module serves as the data acquisition hub for the entire system. Utilizing a high-speed spectral demodulator (as shown in Figure 8), it converts optical signals transmitted back from the sensing network into raw electrical signals containing physical quantity information such as strain and temperature. The demodulation process supports wavelength-division/time-division multiplexing demodulation mechanisms and features high-frequency sampling capabilities, ensuring distortion-free capture throughout the entire dynamic response process. This system employs a weak-reflection grating array with a central wavelength of 1550 nm, a grating length of 10 mm, a reflectivity of approximately 0.1%, and a sensor spacing of 1 m. Signal demodulation employs both wavelength-division and time-division multiplexing demodulation techniques. The demodulator features four channels, with each channel capable of supporting up to five kilometers of sensing optical cable. It offers a wavelength resolution of 1 pm, strain measurement accuracy of 2 μm, and temperature measurement accuracy of 0.5 °C.
(3)
Edge computing and data preprocessing: The demodulated raw electrical signals will undergo preliminary analysis and preprocessing by the edge computing server to extract key feature indicators, such as peak strain, strain frequency spectrum, and structural response curves. The edge server is deployed in a roadside machine room, supporting local rapid computation and data caching, effectively alleviating transmission pressure and improving response efficiency.
(4)
Network transmission channel: The system uses a low-latency, high-reliability industrial communication network to transmit edge preprocessing results back to the upper-level high-speed cloud platform via 4G/5G, dedicated lines, or fiber optic links, ensuring data real-time and integrity, and constructing a structure-communication-computing integrated closed loop.
(5)
Intelligent Analysis Software Platform: This module is deployed on a high-speed cloud platform and integrates a variety of intelligent functions, including structural condition sensing, dynamic response analysis, health assessment, early warning and prediction, and service life assessment. The platform enables functional modules such as “multi-layer strain field visualization,” “multi-time-period load-temperature coupling diagnosis,” and “zoned health risk warning,” and provides data support and decision-making basis for operational needs such as smart mobility, smart management, smart maintenance, and smart guidance.

3.4. Load Test Plan

(1)
Load test:
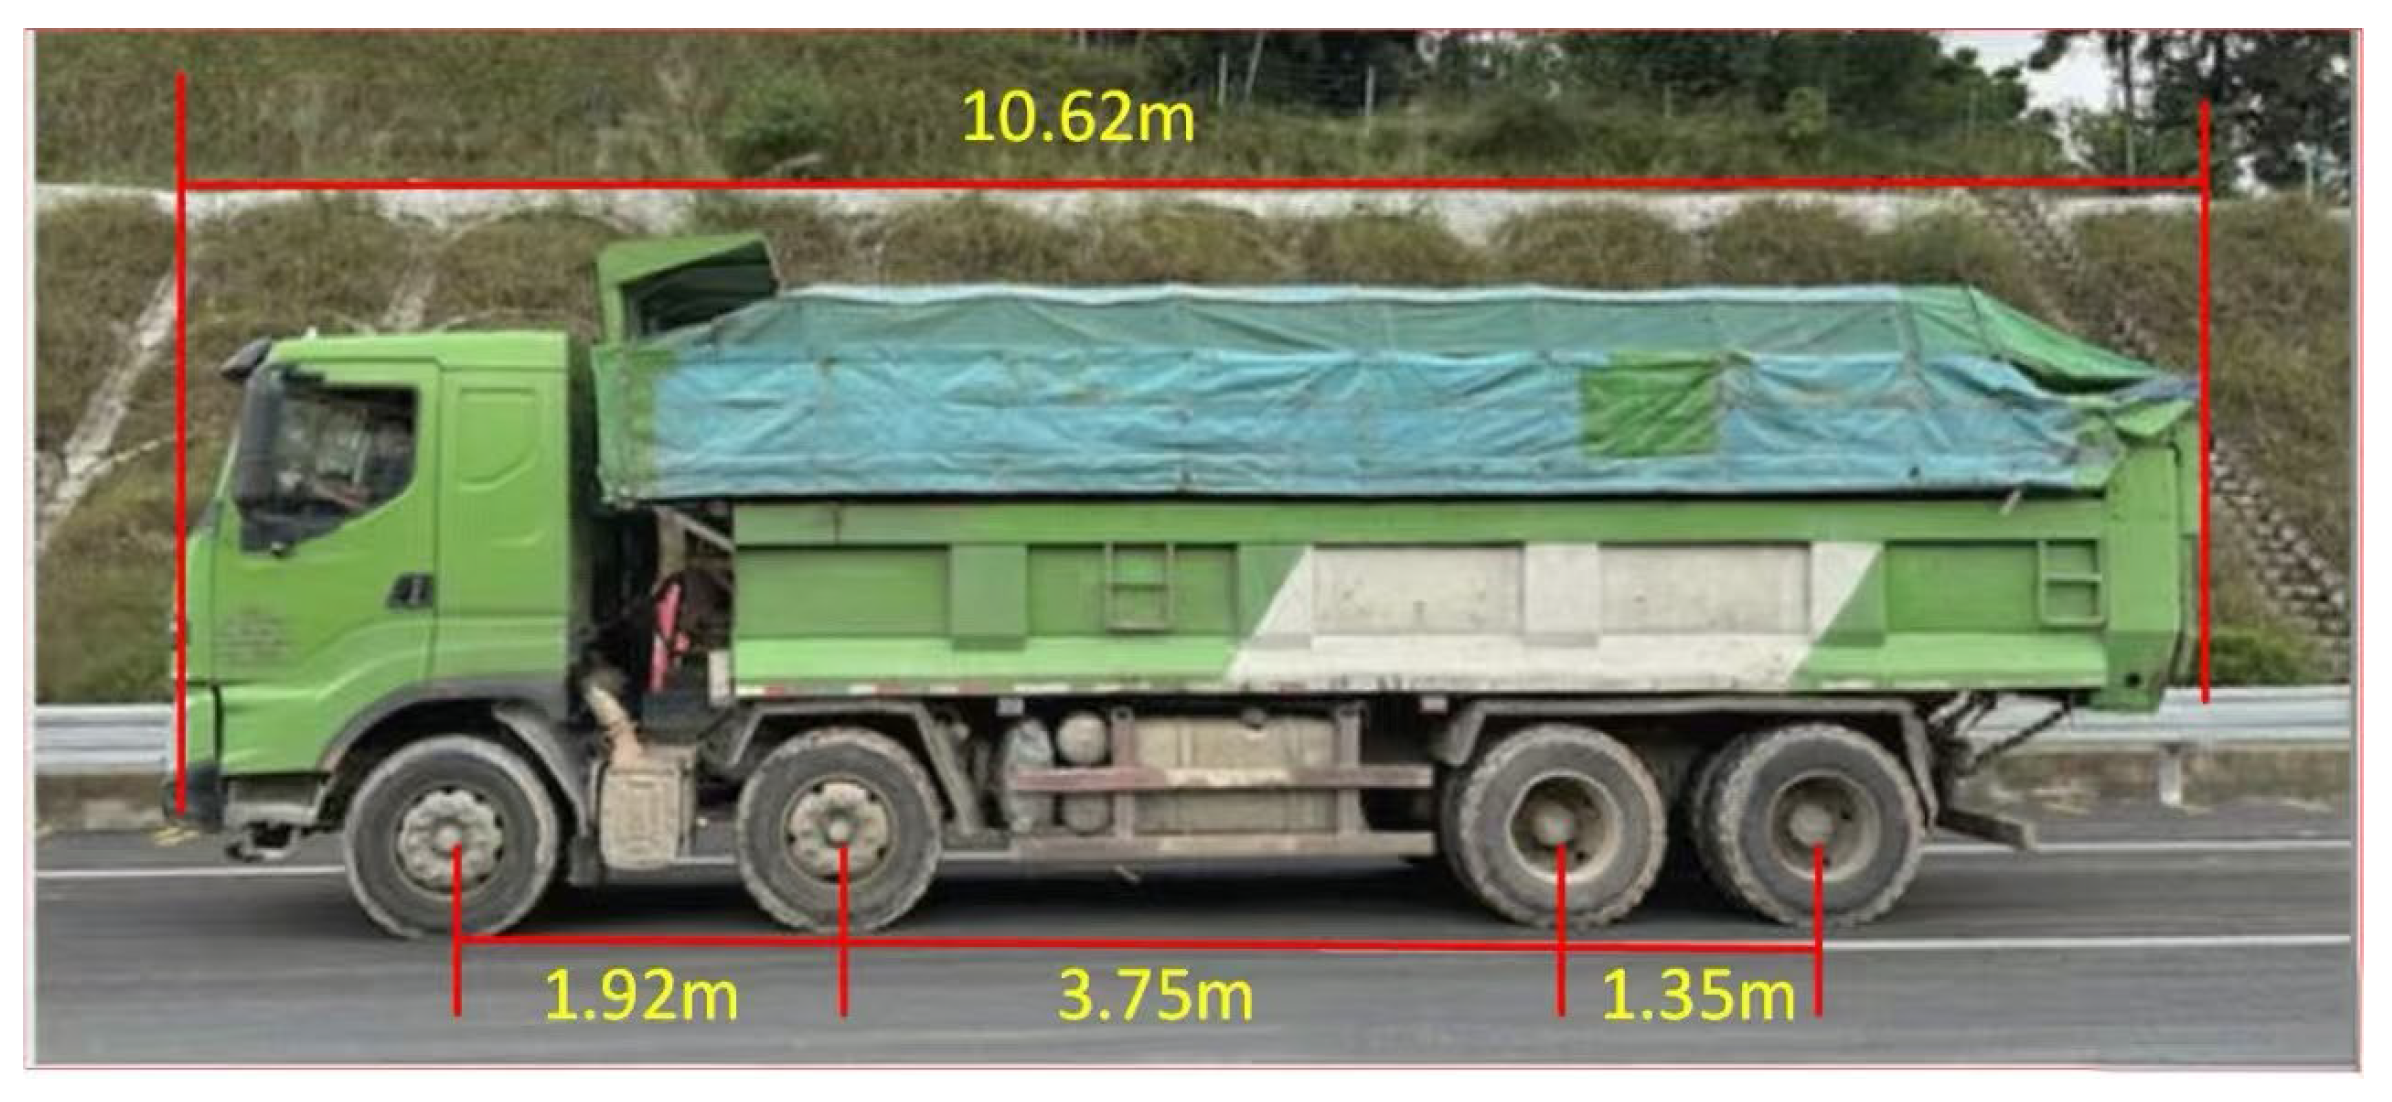
This study employed a 48-ton dual-axle standard heavy-duty truck (geometric parameters shown in Figure 9) to conduct in situ dynamic loading tests on a 50-m monitoring section of newly constructed pavement. The dynamic loading experiment established two sets of controlled variables: vehicle speed (10, 20, 30 km/h) and travel direction (forward and reverse). Three repeated vehicle loading tests were conducted within the 50-m monitoring zone to eliminate random errors. Concurrently, dynamic strain time-history curves were collected for each structural layer within the subgrade to analyze stress transfer patterns under different operating conditions.
(2)
Actual Traffic Load Monitoring
A.
Stress Field Monitoring
After the road is opened to traffic, dynamic response data is continuously collected through a buried strain sensor network, and a strain response database is constructed based on long-term monitoring data. To eliminate the impact of vehicle parameter randomness, data screening criteria are set:
a.
Vehicle gross weight > 10 tons;
b.
Maximum tensile strain of graded crushed stone layer > 5 με
For traffic load events that meet the screening criteria, segmented processing is performed according to the set time window (e.g., 00:00–2:00, 08:00–10:00, and the entire day cycle). For each time segment, the strain time history data recorded by the sensors deployed in each structural layer are extracted. The peak values of tensile strain and compressive strain are calculated, and the average values for that time segment are further determined. Ultimately, a multi-time segment strain response average envelope curve is constructed to describe the typical load transfer characteristics and stress evolution patterns between structural layers under different traffic flow conditions.
B.
Temperature Field Monitoring
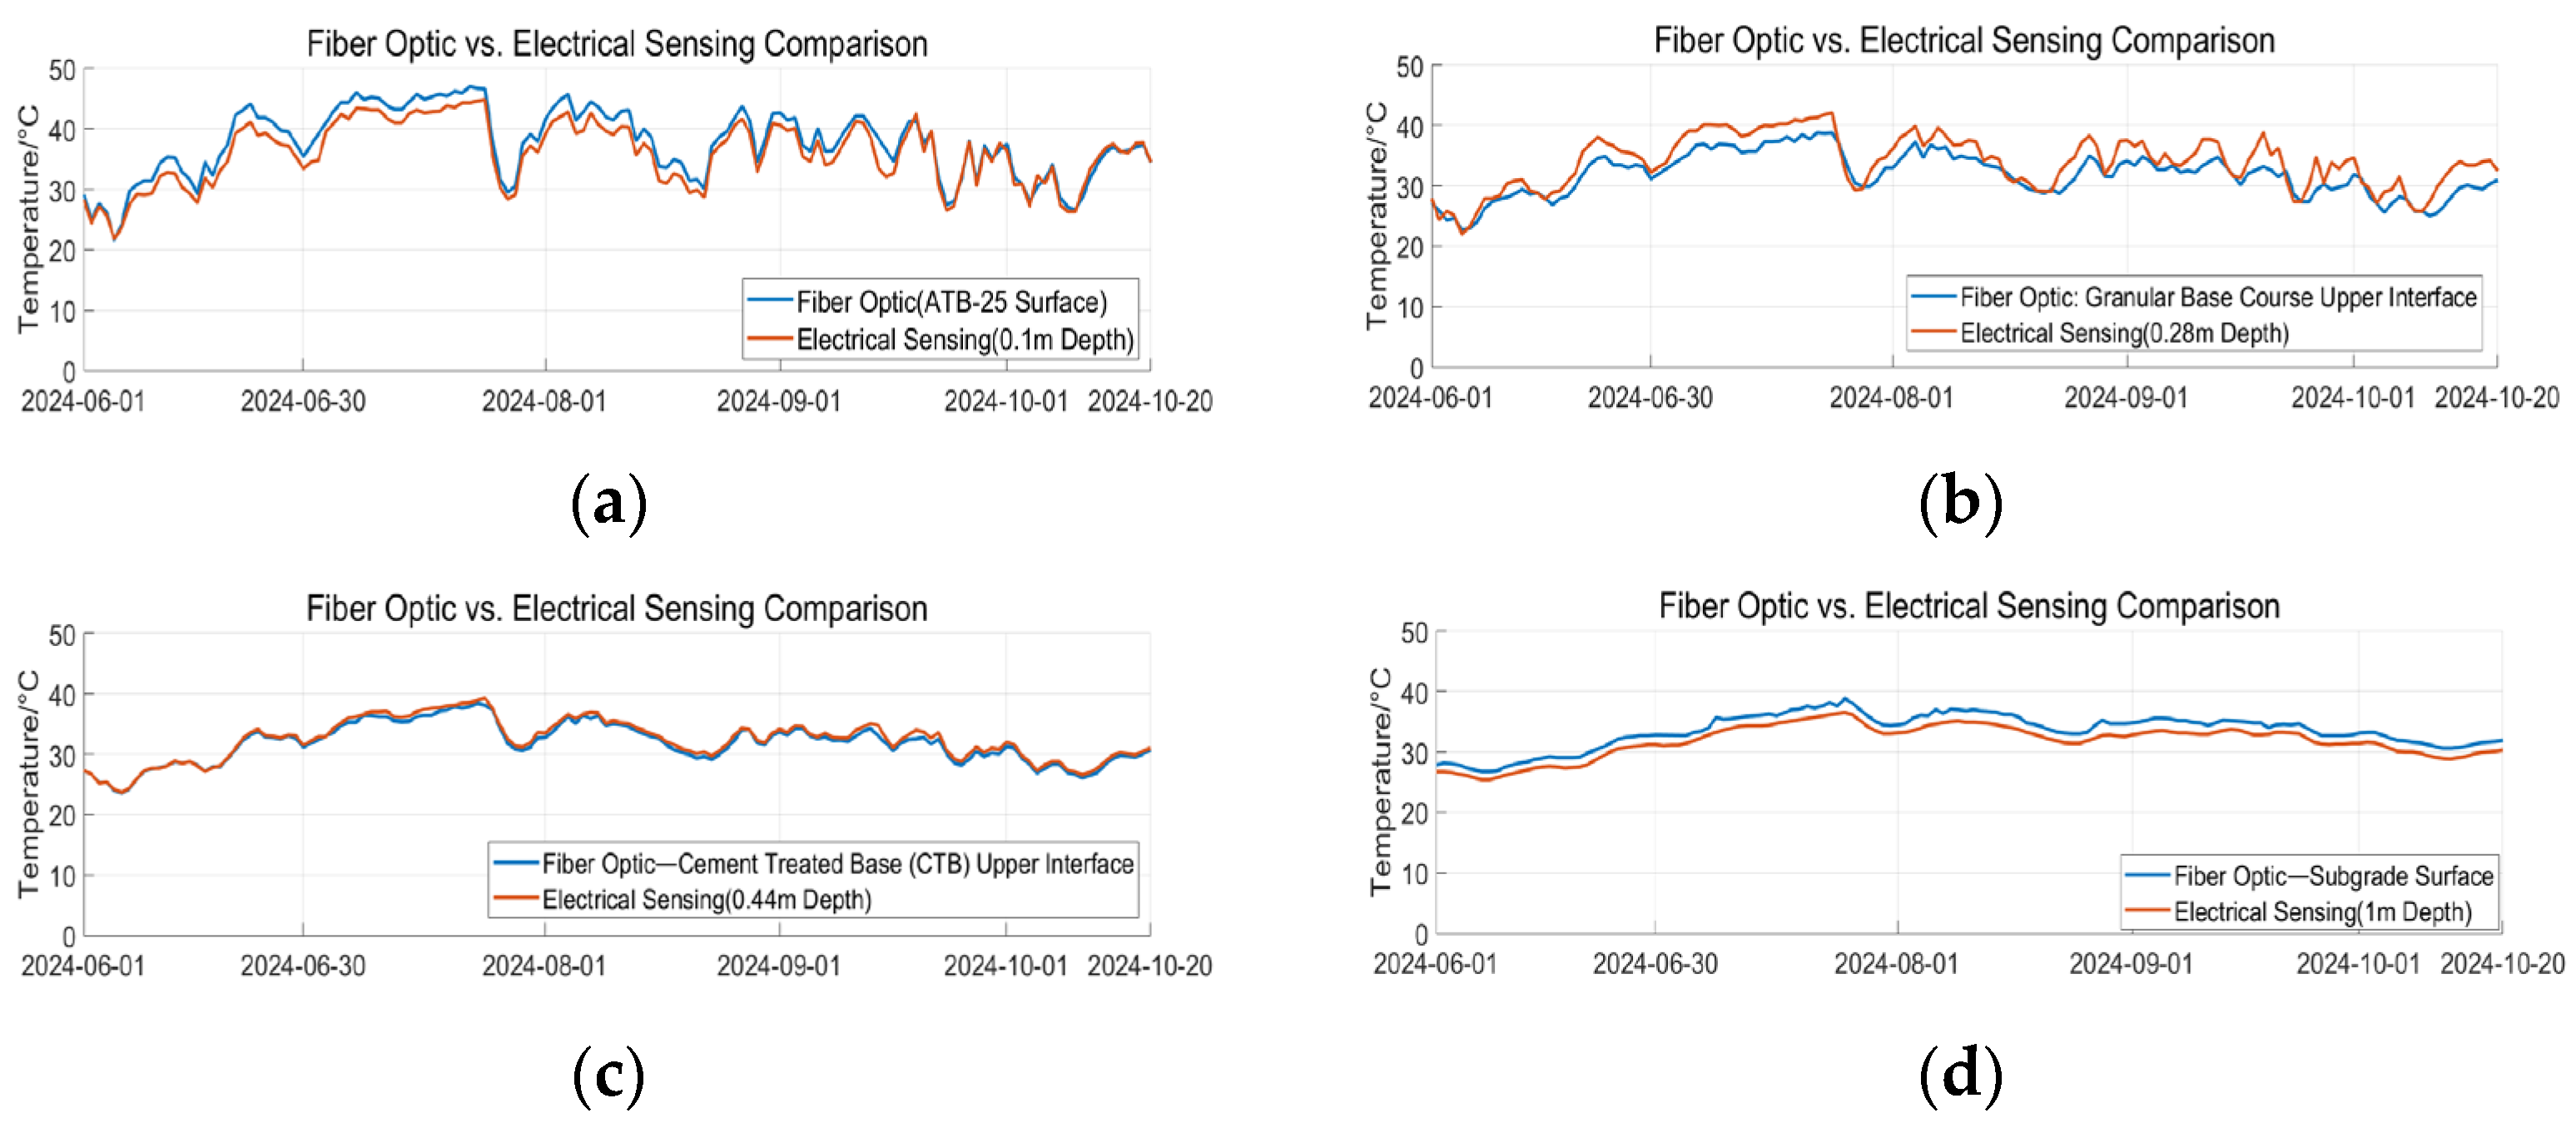
Following the reopening of the road to traffic, this study conducted long-term monitoring of the temperature field post-traffic resumption to assess the thermal response characteristics of the structure under environmental changes. Based on the measured data from 1 June to 20 October, a systematic comparison and analysis were conducted between the fiber optic temperature sensing results and the temperature values measured by the electrical measurement method to verify the accuracy and sensitivity of the fiber optic temperature measurement technology in a dynamic thermal environment. Furthermore, a layered temperature evolution database for the structure was established to provide support for research on multi-physics field coupling mechanisms.

4. Experimental Results and Data Analysis

4.1. Strain Propagation Patterns in Roadbeds Under Dynamic Loads

Smooth filtering was applied to the experimental loading data prior to traffic opening, with a sliding window size of 3. Data from measurement points at a relative mileage of 30 m are shown in Figure 10. It can be observed that under the influence of vehicle moving loads, the longitudinal strain within the road structure exhibits an asymmetric distribution characterized by alternating tensile and compressive strains. The specific characteristics are detailed in Table 2.
After applying a smoothing filter to the pre-opening test loading data, the peak tensile and compressive strain values at each measurement point were selected to plot the average strain envelope curve for the entire four-lane section, as shown in Figure 11. The test results indicate that the envelope shapes of all structural layers are essentially consistent, with each layer exhibiting distinct speed sensitivity. Both peak tensile and compressive strains decrease as vehicle speed increases. Table 3 shows the reduction in peak tensile and compressive strain for each layer when the speed increased to 30 km/h. Statistical tests conducted at a significance level of α = 0.01 revealed that the strain response of each structural layer to speed changes exhibited high statistical significance (p < 0.01). Further comparison of strain variation magnitudes across layers revealed that the ATB layer and graded layer exhibited the highest sensitivity, while the cement-stabilized layer and subgrade layer demonstrated relatively lower sensitivity. To quantify the consistency of envelope curves across structural layers at different speeds, this study introduced the similarity coefficient metric for analysis. The similarity coefficient was calculated using the Pearson Correlation Coefficient (PCC), whose mathematical expression is as follows:
r = i = 1 n ( x i x ¯ ) ( y i y ¯ ) i = 1 n ( x i x ¯ ) 2 i = 1 n ( y i y ¯ ) 2
In this context, xi and yi represent the strain peak values at the i-th measurement point under two different vehicle speeds, respectively, and μ is the mean value of the corresponding sequence, with n denoting the total number of measurement points. The correlation coefficient r ranges from −1 to 1. When r approaches 1, it indicates that the two data sequences are highly linearly correlated, meaning that the strain envelope curves have essentially the same shape. By calculating the similarity of the strain envelope curves under the two vehicle speeds of 10 km/h and 30 km/h, the similarity coefficients for each structural layer are obtained as shown in Table 3. The results show that the similarity coefficient for the water-stabilized layer is the highest (0.9815), indicating that its response morphology remains highly stable at different vehicle speeds. In contrast, the similarity coefficient for the soil layer is relatively low (0.9625), which may be attributed to its loose material structure and complex stress diffusion pathways.
The interlayer response differences stem from the nonlinear coupling effect between the dynamic modulus of the material and the load application time. Theoretical analysis indicates that increasing vehicle speed reduces the load dwell time by 36.7% (30 km/h vs. 10 km/h), significantly weakening the strain accumulation effect in viscoelastic materials (graded crushed stone) and enhancing their dynamic response sensitivity compared to semi-rigid base layers (ATB, cement-stabilized layer). Monitoring data from distributed fiber optic grating arrays confirm that speed control can reduce the fatigue damage rate of granular layers. The multi-level synchronous monitoring technology achieves precise capture of dynamic responses through the synergistic effects of spatial resolution and sampling frequency, providing high spatio-temporal resolution observational methods to support dynamic optimization design of pavement structures.

4.2. Layered Characteristics of Structural Thermal Response to Temperature Gradients

Analysis of the temperature data collected by the temperature-sensitive optical cable was conducted, focusing on the relative mileage of 30 m. The temperatures measured by the fiber optic temperature measurement method and the electrical measurement method at 12:00 p.m. each day were compared over the long term, as shown in Figure 12. The experimental results indicate that the overall trends in temperature field changes across all layers measured by the fiber optic temperature measurement method and the electrical measurement method are consistent, and both methods confirm that the temperature field of the road structure exhibits layered differences. When analyzed by layer, for the ATB layer and graded layer, the maximum temperature measured by the optical method was higher than that measured by the electrical method, while the minimum temperature was basically consistent with the electrical method. In terms of amplitude of change, the optical method was slightly higher than the electrical method; for the stabilized layer and soil layer: throughout the observation period, the measurement results and amplitude of change of the optical method and electrical method were basically consistent. The above results indicate that in the shallow layers of the roadbed structure, the optical measurement method, due to its rapid thermal response and strong interference resistance, can sensitively capture transient temperature changes (such as the thermal reflection effect of the asphalt layer); in the deep layers, due to the homogenization of the medium and thermal inertia, the monitoring results of the two methods tend to converge.
Based on long-term observations of the temperature time-history curves of each structural layer at relative mile markers 10 m and 30 m along the test section (Figure 13a,b June–November 2024, sampling interval of 10 min) and short-term observations (Figure 13c,d, 10 June 2024) of the temperature field distribution along the test section, the following conclusions can be drawn:
(1)
The layering pattern of the temperature field is distinct: temperature variations across layers exhibit consistency in long-term trends and seasonal fluctuations, but the amplitude of short-term daily temperature fluctuations decreases with increasing burial depth. Among these, the ATB layer, as a shallow structural layer, is most significantly influenced by external environmental factors (such as temperature fluctuations and solar radiation), exhibiting the most pronounced temperature fluctuations. Compared to the graded layer, the ATB layer exhibits a wider daily temperature variation range. For example, on 10 June, its daily maximum temperature was significantly higher than that of the graded layer, while its daily minimum temperature was notably lower. This phenomenon clearly reflects the rapid response characteristic of the shallow structural layer to surface thermal conditions.
(2)
Consistency at different mileage locations: The thermal response patterns at the 10 m and 30 m measurement points are highly consistent, indicating that the layered differences in the road temperature field can be regarded as a spatially uniform phenomenon, primarily dominated by burial depth and unrelated to the local location of the mileage points.
A comparison and analysis of temperature data collected at 12:00 on 5 July and 15 August revealed that, as shown in Figure 14, the temperature distributions at different locations within the same structural layer at the same time were highly consistent, indicating that the system exhibits excellent spatial consistency and can accurately reflect the layered characteristics of the temperature field across the entire test section. Additionally, the temperature distribution patterns at different times exhibit smooth changes, with clear temperature differences between layers, demonstrating the stability and high repeatability of the sensing system during long-term operation. This characteristic enables fiber optic temperature measurement technology to be used for continuous tracking and precise assessment of road structure temperature fields, showcasing significant engineering application value.

4.3. Verification of the Stability of Sensor Systems in Long-Term Service

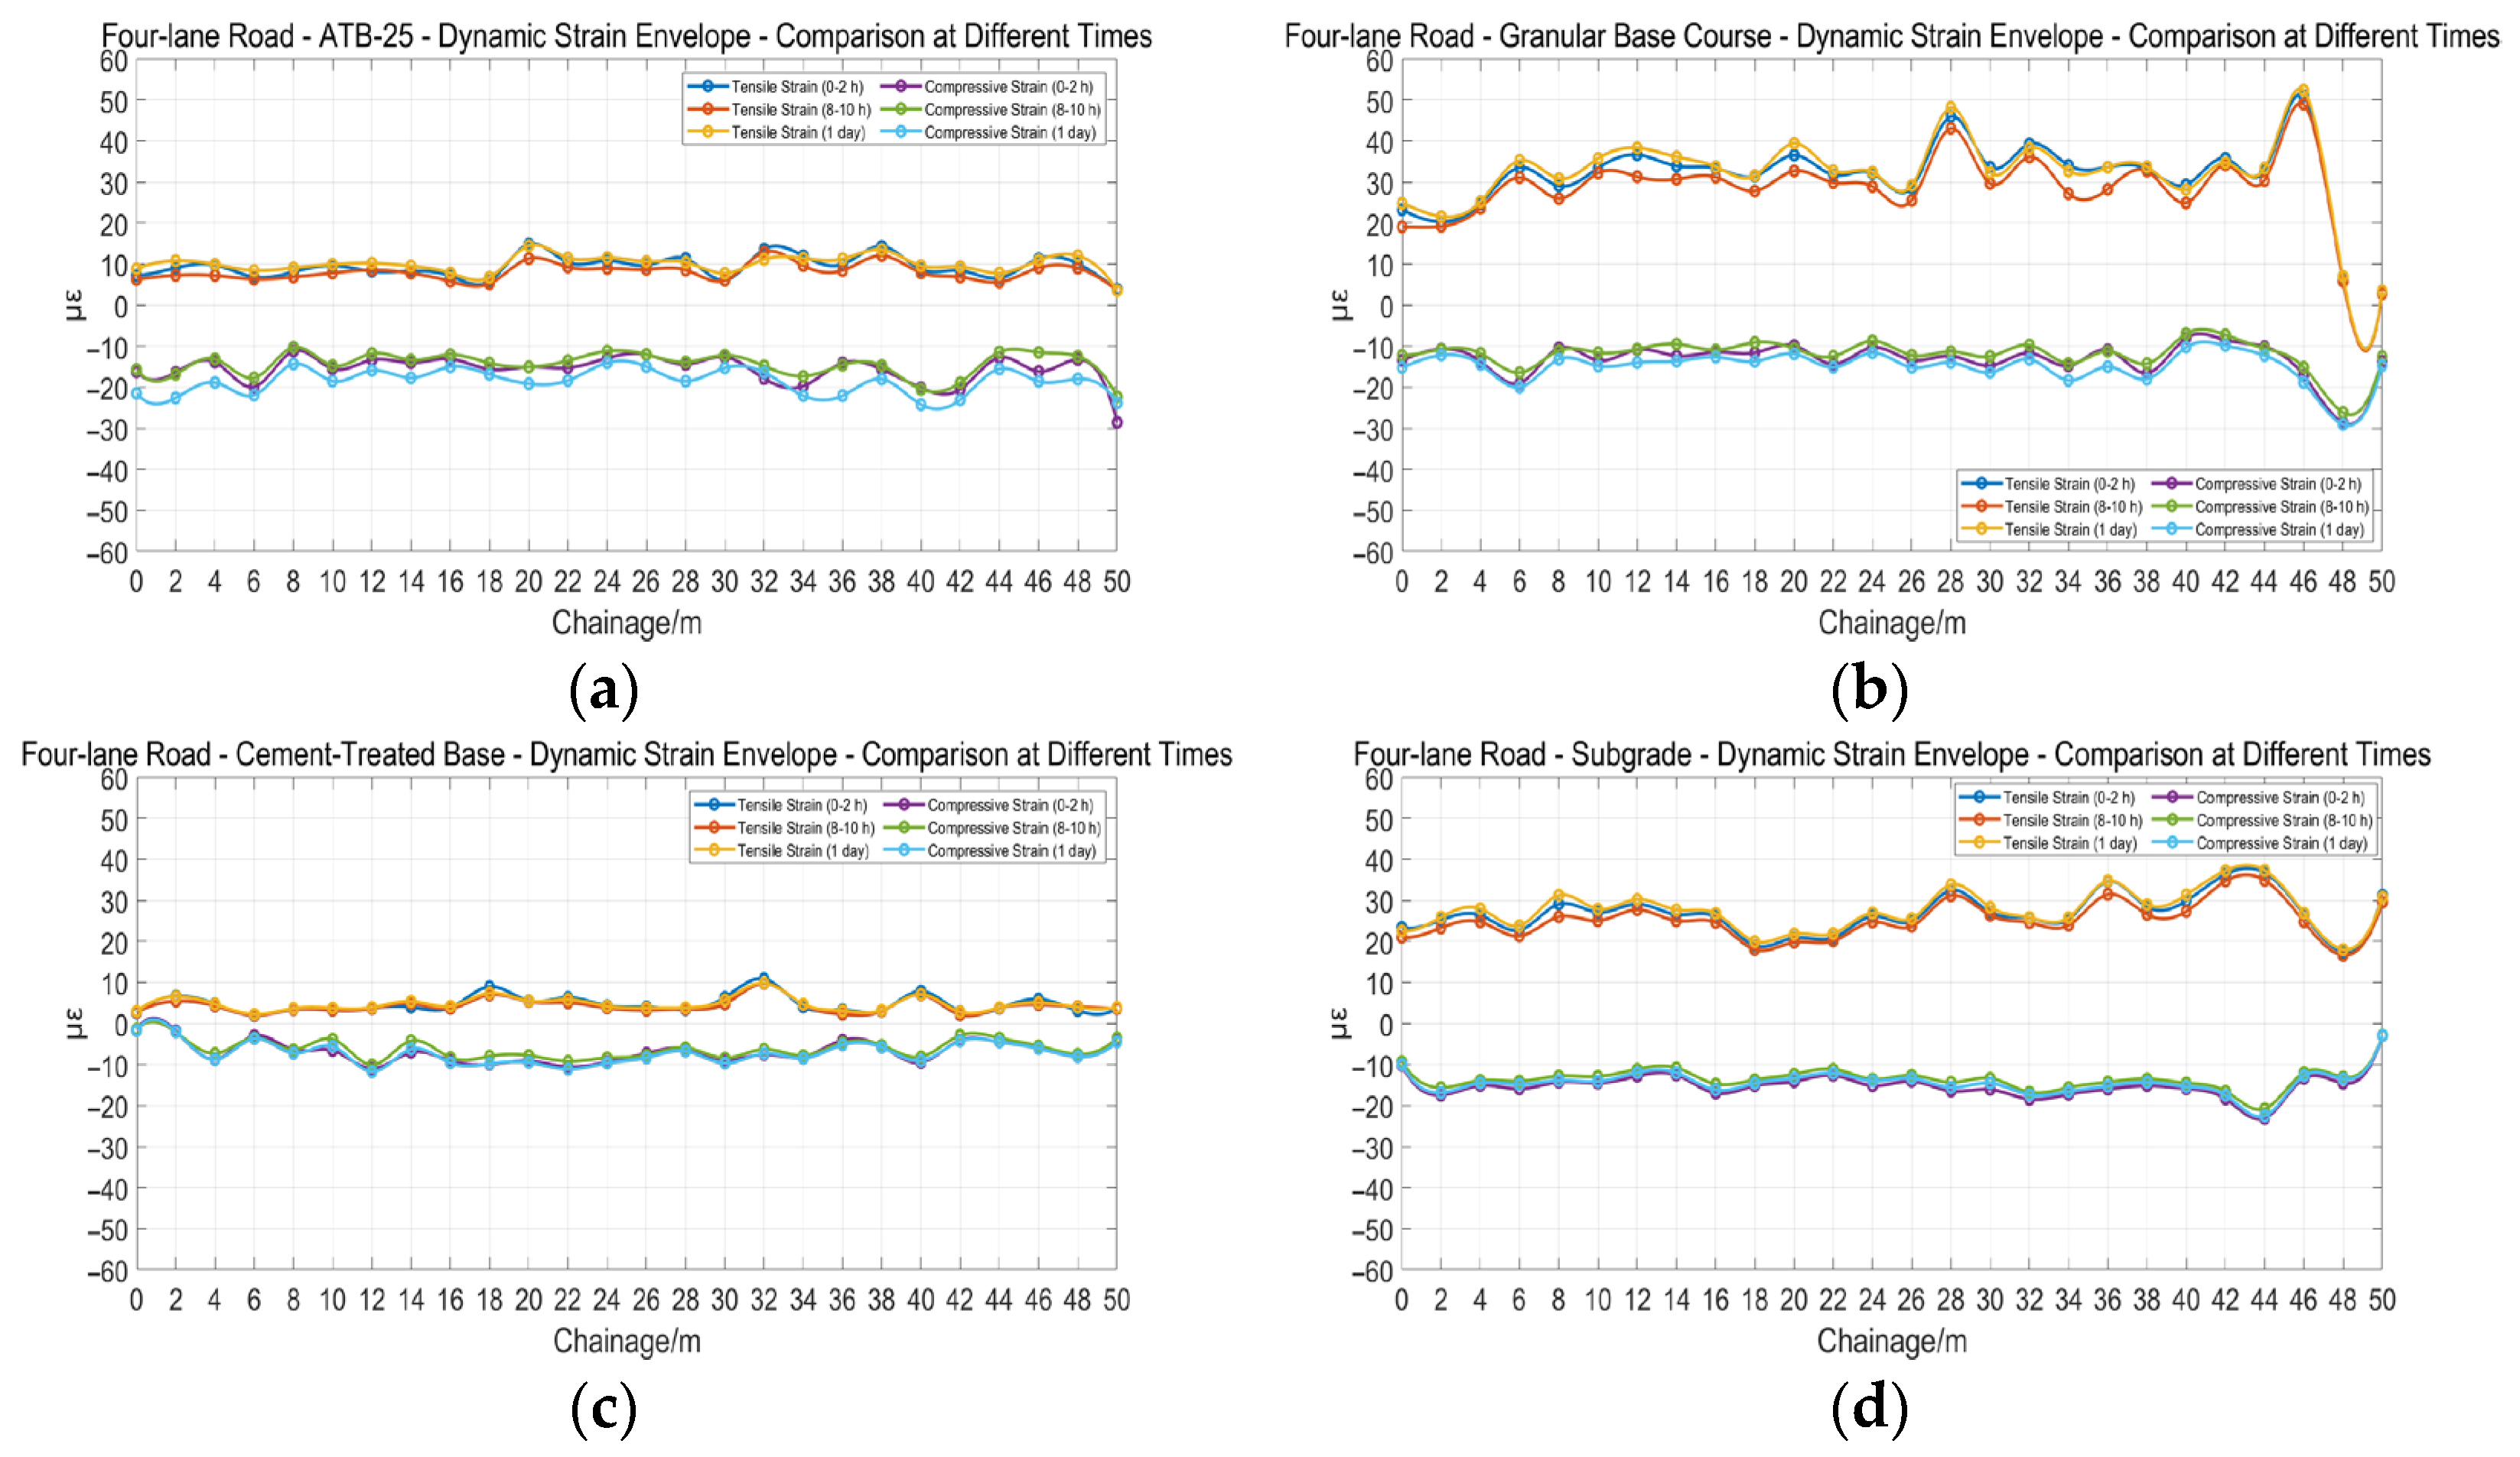
As shown in Figure 14, through strain analysis of vehicle traffic on a four-lane highway during three typical time periods (0–2 a.m., 8–10 a.m., and the entire day) on 26 October 2024, it was found that the mean strain envelope curves of the ATB layer, graded layer, stabilized layer, and subgrade soil layer exhibited significant consistency in terms of morphological characteristics and amplitude range. Specifically, the maximum strain fluctuation amplitude for the ATB layer and graded layer is ±5 με (Figure 15a,b), while the strain amplitude for the stabilized layer remains stable within ±1.5 με (Figure 15c,d). The envelope waveforms of all structural layers exhibit over 95% alignment across different time periods, indicating that the fiber optic grating sensing system possesses excellent temporal stability.
Further comparison of traffic data from 26 October and 26 December reveals (Figure 16) that the strain envelope curves for the ATB layer, graded layer, and stabilized layer remain highly consistent, but the subgrade layer exhibits localized changes in certain areas. Notably, the maximum tensile/compressive strain of the ATB layer on 26 December was lower than that in October, while the maximum tensile/compressive strain of the water-stabilized layer and subgrade layer showed minimal changes. Temperature gradient analysis indicates that the influence of external temperature on the subgrade decreases with burial depth, resulting in lower temperature sensitivity of the deep subgrade layer.

5. Conclusions

This study employs weak-reflective bragg grating (WFBG) array sensing technology to establish a real-time monitoring system for the entire multi-layer structure of expressways across multiple physical fields. Through differentiated deployment techniques, high-precision demodulation, dynamic load testing, and long-term data analysis, the following key conclusions were drawn:
(1)
Grating array sensors offer convenient installation and deployment, high survival rates, ease of constructing three-dimensional sensing networks and monitoring systems for road infrastructure, and extended service life (the system has been in operation for over two years).
(2)
Grating array sensors enable full-field, high-precision distributed measurement of strain and temperature, providing reliable technical support for continuous strain field and temperature field monitoring.
(3)
By analyzing data from grating array monitoring, the relationship between structural response and parameters such as modulus, embedment depth, temperature, load, and vehicle speed has been examined. This has provided preliminary insights into the response mechanism of highway subgrade structures.

Author Contributions

Q.N.: Conceptualization, Writing—review and editing, Methodology. S.Y.: Writing—review and editing, Writing—original draft, Formal analysis. Y.K.: Investigation, Data curation, Conceptualization. J.Z.: Project administration, Funding acquisition, Conceptualization. S.L.: Writing—review and editing, Conceptualization. L.Y.: Writing—review and editing, Project administration. Y.Y.: Methodology, Data curation. All authors have read and agreed to the published version of the manuscript.

Funding

The National Natural Science Foundation of China (Grant No. U2433209), Major Program (JD) of Hubei Province, China (Grant No. 2023BAA017), and the Unveiling and Leading Technology Project (ZLGS-1, Traffic Safety of the Yangtze River Bridge Project Based on Array Grating Fiber Optic Sensing Technology).

Conflicts of Interest

Author Juncheng Zeng was employed by the company Fujian Provincial Expressway Technology Innovation Research Institute Co., Ltd. The remaining authors declare that the research was conducted in the absence of any commercial or financial relationships that could be construed as a potential conflict of interest.

References

  1. Girish, S.; Putman, B.J.; Kumar, A.; Nagarajan, S. Evaluation of the sensitivity of the MEPDG to Bottom-Up fatigue cracking in South Carolina. Int. J. Pavement Res. Technol. 2024, 17, 1225–1238. [Google Scholar] [CrossRef]
  2. Yang, L.; Hu, Y.; Zhang, H. Comparative study on asphalt pavement Rut based on analytical models and test data. Int. J. Pavement Eng. 2020, 21, 781–795. [Google Scholar] [CrossRef]
  3. Li, J.; Wang, L.; Xiong, H.; Yang, H. Research on characterization of asphalt pavement performance by acoustic emission Technology. Int. J. Pavement Res. Technol. 2023, 16, 444–473. [Google Scholar] [CrossRef]
  4. Alavi, A.H.; Hasni, H.; Lajnef, N.; Chatti, K. Continuous health monitoring of pavement systems using smart sensing technology. Constr. Build. Mater. 2016, 114, 719–736. [Google Scholar] [CrossRef]
  5. Almeida, A.; Picado-Santos, L. Asphalt Road Pavements to Address Climate Change Challenges—An Overview. Appl. Sci. 2022, 12, 12515. [Google Scholar] [CrossRef]
  6. Dhandapani, B.P.; Mullapudi, R.S. Cement-grouted bituminous mixtures containing reclaimed asphalt pavement material: Design and mechanical properties Road. Mater. Pavement Des. 2024, 26, 1865–1889. [Google Scholar] [CrossRef]
  7. Shi, Z.; Yue, J.; Xu, L.; Wang, X. Peridynamics for Fracture Analysis of Reflective Cracks in Semi-Rigid Base Asphalt Pavement. Appl. Sci. 2022, 12, 3486. [Google Scholar] [CrossRef]
  8. Fiandaca, D.; Di Matteo, A.; Patella, B.; Moukri, N.; Inguanta, R.; Llort, D.; Mulone, A.; Mulone, A.; Alsamahi, S.; Pirrotta, A. An Integrated Approach for Structural Health Monitoring and Damage Detection of Bridges: An Experimental Assessment. Appl. Sci. 2022, 12, 13018. [Google Scholar] [CrossRef]
  9. Braunfelds, J.; Senkans, U.; Skels, P.; Janeliukstis, R.; Porins, J.; Spolitis, S.; Bobrovs, V. Road Pavement Structural Health Monitoring by Embedded Fiber-Bragg-Grating-Based Optical Sensors. Sensors 2022, 22, 4581. [Google Scholar] [CrossRef] [PubMed]
  10. Zhang, M.; Hu, H.; Ren, C.; Shang, Z.; Ma, X. Evaluation of Grouting Effectiveness on Cracks in Cement-Stabilized Macadam Layer Based on Pavement Mechanical Response Using FBG Sensors. Appl. Sci. 2025, 15, 7312. [Google Scholar] [CrossRef]
  11. Baba, T.; Saidin, N.; Hasbullah, N.F.; Ahmad, I. Radiation tolerant fiber Bragg gratings: Review of FBG sensing. J. Opt. 2025. [Google Scholar] [CrossRef]
  12. Qiu, L.; Zhu, Z.; Wang, H.; Dong, Y. Distributed optical fiber pressure sensor based on Brillouin scattering. In Optics Frontiers Online 2020: Distributed Optical Fiber Sensing Technology and Applications; SPIE: Bellingham, WA, USA, 2021; Volume 11607, pp. 34–38. [Google Scholar] [CrossRef]
  13. Zhang, J.; Wang, M.; Zhang, N.; Huang, X.; Chen, D. A novel demodulation technique for identical weak fiber Bragg grating array sensing with improved performance. In Optics Frontiers Online 2020: Distributed Optical Fiber Sensing Technology and Applications; SPIE: Bellingham, WA, USA, 2021; Volume 11607, pp. 68–73. [Google Scholar] [CrossRef]
  14. Zhao, L.; Chen, Y.; Xu, Z.; Zhang, X.; Mou, Q. Brillouin frequency shift error estimation formula for distributed optical fiber sensing technology based on Brillouin scattering. Appl. Opt. 2022, 61, 4354–4362. [Google Scholar] [CrossRef] [PubMed]
  15. Xinxing, G.; Bo, L. A high-precision bidirectional time-transfer system over a single fiber based on wavelength-division multiplexing and time-division multiplexing. Front. Phys. 2023, 10, 1080966. [Google Scholar] [CrossRef]
  16. Qin, H.; Li, C.; Luo, B.; Tang, P. Force monitoring in steel-strand anchor cables using quasi-distributed embedded FBG sensors. Constr. Build. Mater. 2024, 438, 137192. [Google Scholar] [CrossRef]
  17. Kashaganova, G.; Kozbakova, A.; Kartbayev, T.; Togzhanova, K.; Alimseitova, Z.; Sergazin, G. Design of a Fiber Temperature and Strain Sensor Model Using a Fiber Bragg Grating to Monitor Road Surface Conditions. Inventions 2024, 9, 100. [Google Scholar] [CrossRef]
  18. Jiahui, C.; Haiwei, F.; Miao, C. Temperature Sensing Demodulation System Based on Weakly Reflective Fiber Grating. Opt. Commun. Res. 2025, 3, 82–87. [Google Scholar] [CrossRef]
  19. Yang, L.; Lifan, L.; Qiuyang, H. Rayleigh Scattering Crosstalk Suppression Technology for Quasi-Distributed Acoustic Wave Sensing Systems. Acta Opt. Sin. 2024, 44, 450–458. [Google Scholar]
  20. Hou, Z.; Cao, D.; Peng, P.; Ding, X.; Ma, T.; Cheng, J. Analysis of Strain Transfer Characteristics of Fiber Bragg Gratings for Asphalt Pavement Health Monitoring. Materials 2025, 18, 3489. [Google Scholar] [CrossRef] [PubMed]
  21. Alhussein, A.N.D.; Qaid, M.R.T.M.; Agliullin, T.; Valeev, B.; Morozov, O.; Sakhabutdinov, A. Fiber Bragg Grating Sensors: Design, Applications, and Comparison with Other Sensing Technologies. Sensors 2025, 25, 2289. [Google Scholar] [CrossRef] [PubMed]
  22. Amaya, A.; Sierra-Pérez, J. Toward a Structural Health Monitoring Methodology for Concrete Structures under Dynamic Loads Using Embedded FBG Sensors and Strain Mapping Techniques. Sensors 2022, 22, 4569. [Google Scholar] [CrossRef] [PubMed]
Figure 1. FBG Schematic Diagram.
Applsci 15 09930 g001
Figure 2. Schematic Diagram of Grating Array Distributed Sensing System.
Applsci 15 09930 g002
Figure 3. Optical Sensing Cable Deployment Location Diagram. (a) Typical Cross-section of Highway Subgrade; (b) Plan View of Highway Subgrade.
Applsci 15 09930 g003
Figure 4. Four-layer Roadbed Paving at Site. (a) ATB-25; (b) Granular Base Course; (c) Cement-Treated Base; (d) Subgrade.
Applsci 15 09930 g004aApplsci 15 09930 g004b
Figure 5. Grating Number and Position Mapping Table.
Applsci 15 09930 g005
Figure 6. Interactive System Block Diagram.
Applsci 15 09930 g006
Figure 7. Cross-section of Sensing Optical Cable. (a) Strain-sensitive optical cable; (b) Temperature Fiber Optic Cable.
Applsci 15 09930 g007
Figure 8. Signal Demodulator.
Applsci 15 09930 g008
Figure 9. Experimental Vehicle Dimensions.
Applsci 15 09930 g009
Figure 10. Time-History Curves for Four-Layer Pavement System. (a) ATB-25; (b) Granular Base Course; (c) Cement-Treated Base; (d) Subgrade.
Applsci 15 09930 g010
Figure 11. Dynamic Strain Envelope Contours of Four-Lane Roadbed Layers under Variable Speeds. (a)ATB-25; (b) Granular Base Course; (c) Cement-Treated Base; (d) Subgrade.
Applsci 15 09930 g011aApplsci 15 09930 g011b
Figure 12. Comparative Analysis of Long-Term Monitoring Data: Fiber Optic Thermometry vs. Electrical Resistance Sensing (a) ATB-25; (b) Granular Base Course; (c) Cement-Treated Base; (d) Subgrade.
Applsci 15 09930 g012
Figure 13. Temperature Time-History Curves at Different Chainages. (a) Multi-layer Temperature Comparison at Chainage 10 m; (b) Multi-layer Temperature Comparison at Chainage 30 m; (c) Multi-layer Temperature Comparison at Chainage 10 m; (d) Multi-layer Temperature Comparison at Chainage 30 m.
Applsci 15 09930 g013aApplsci 15 09930 g013b
Figure 14. Temperature distribution comparison diagram.
Applsci 15 09930 g014
Figure 15. Time-Resolved Dynamic Strain Envelopes in Multilayered Pavement (Four-Lane Road). (a) ATB-25; (b) Granular Base Course; (c) Cement-Treated Base; (d) Subgrade.
Applsci 15 09930 g015
Figure 16. Bitemporal Strain Response Variability Across Pavement Strata (Four-Lane Road). (a) ATB-25; (b) Granular Base Course; (c) Cement-Treated Base; (d) Subgrade.
Applsci 15 09930 g016
Table 1. Subgrade Material Properties.
Material NameDesign Modulus (MPa)Pavement Thickness (cm)Tensile Splitting Strength (MPa)
20 °C15 °C
AC-16C Modified Asphalt Concrete (Anti-skid Wearing Course)130019004.51.1
AC-20C Medium-graded Modified Asphalt Concrete (Binder Course)120018005.51.0
ATB-25 Dense Graded Asphalt Treated Base (Upper Base)12001400160.8
Graded Crushed Stone (Lower Base)40018
3% Cement Stabilized Gravel (Subbase)1000 (Deflection Calculation)320.8
2400 (Tensile Stress Calculation)
Earthwork Subgrade40.5
Table 2. Dynamic Strain Response.
Structural LayerDominant Strain TypeCharacteristic Value (με @10 km/h)
ATB-25Compressive−48.07
Granular Base CourseTensile80.50
Cement-Treated BaseCompressive−25.71
SubgradeTensile87.45
Table 3. Strain Response to Vehicle Speed in Layered Pavement System.
Structural LayerTensile Strain ReductionCompressive Strain ReductionSensitivity RankingSimilarity Coefficientp
ATB-2510.8%32.7%20.96542.385 × 10−9
Granular Base Course27.9%44.6%10.96605.264 × 10−8
Cement-Treated Base12.8%18.2%30.98150.004
Subgrade14.8%11.3%40.96250.002
Disclaimer/Publisher’s Note: The statements, opinions and data contained in all publications are solely those of the individual author(s) and contributor(s) and not of MDPI and/or the editor(s). MDPI and/or the editor(s) disclaim responsibility for any injury to people or property resulting from any ideas, methods, instructions or products referred to in the content.