Article

Enhanced Sensitivity of 17-α-Ethinylestradiol (EE2) Detection Using Carbon Quantum Dots-Integrated Tapered Optical Fiber

by
Rosyati Hamid
1,
Yasmin Mustapha Kamil
2,*,
Ahmad Zaharin Aris
3,
Muhammad Hafiz Abu Bakar
4,
Fariza Hanim Suhailin
5,
Mohammed Thamer Alresheedi
6,
Eng Khoon Ng
7 and
Mohd Adzir Mahdi
4,8,*
1
Faculty of Electrical & Electronics Engineering Technology, Universiti Malaysia Pahang Al-Sultan Abdullah, Pekan 26600, Pahang, Malaysia
2
Department of Microbiology, Faculty of Biotechnology and Biomolecular Sciences, Universiti Putra Malaysia, Serdang 43400, Selangor, Malaysia
3
International Institute of Aquaculture and Aquatic Sciences, Universiti Putra Malaysia, Port Dickson 71050, Negeri Sembilan, Malaysia
4
Wireless and Photonics Networks Research Centre, Faculty of Engineering, Universiti Putra Malaysia, Serdang 43400, Selangor, Malaysia
5
Physics Department, Faculty of Science, Universiti Teknologi Malaysia, Skudai 81310, Johor Bahru, Malaysia
6
Department of Electrical Engineering, College of Engineering, King Saud University, P.O. Box 800, Riyadh 11421, Saudi Arabia
7
Department of Engineering, University of Cambridge, Cambridge CB3 0FA, UK
8
Institute of Nanoscience and Nanotechnology (ION2), Universiti Putra Malaysia, Serdang 43400, Selangor, Malaysia
*
Authors to whom correspondence should be addressed.
Appl. Sci. 2025, 15(18), 9890; https://doi.org/10.3390/app15189890
Submission received: 11 July 2025 / Revised: 27 August 2025 / Accepted: 3 September 2025 / Published: 9 September 2025

Abstract

In this study, we developed a tapered optical fiber sensor enhanced with carbon quantum dots (CQDs) for the detection of 17-α-ethinylestradiol (EE2). The sensor operates on the changes in refractive index induced by the interaction between EE2 and antibodies on its surface. The incorporation of CQDs significantly increased the available surface area for receptor–analyte interactions, leading to enhanced sensor performance. The sensor demonstrated high sensitivity of 2.4925 nm/(ng/L) within a detection range of 1 to 10 ng/L, with a strong correlation coefficient (R2 = 0.998). A detection limit as low as 0.0426 ng/L (0.144 pM) was achieved, along with a low dissociation constant of 2.19 × 10⁻¹¹ M as determined by the Langmuir isotherm model. These findings highlight the potential of the CQD-functionalized optical fiber sensors as a promising tool for sensitive and selective EE2 detection in environmental monitoring applications.

1. Introduction

Optical fiber sensors have attracted significant interest in chemical and biosensing applications due to their impressive performances and enormous potential in sensing technologies. Since then, optical fiber sensors have been incorporated into diverse sensing platforms, and tremendous efforts have been made to improve their performance. One effective strategy involves tapering the optical fiber, which reduces its diameter and strengthens the evanescent field interaction with the surrounding medium along the fiber waist. To further improve the sensor performance, researchers have explored the use of nanomaterials as surface modifiers. These materials range from metallic nanoparticles [1,2] to carbon-based nanostructures [3,4]. When deposited on the fiber surface, nanomaterials increase the interaction area between the propagated light and the sensing elements, owing to their high surface-to-volume ratio. Recent studies have demonstrated that integrating nanomaterials with tapered optical fibers (TOFs) can significantly enhance sensing performance by combining the optical advantages of tapering with the functional benefits of nanomaterials [4,5].
Carbon quantum dots (CQDs) are one of the most promising nanoparticles that have been used widely in optical fiber sensors [6,7]. CQDs are quasi-0D carbon-based fluorescent nanoparticles sized around 10 nm [8]. CQDs have gained significant attention in optical sensing owing to their remarkable properties, such as high durability, stability, ease of modification, fluorescence emission, low toxicity, biocompatibility, and eco-friendliness [9,10]. Structurally, CQDs are layers of graphite with a core-shell architecture, where the core consists of sp2 hybridized carbon atoms, resembling graphite [11]. This core is then surrounded by a shell that is composed of multifunctional groups, such as carboxylates (-COOH), hydroxyl (-OH), amino (-NH2) and carbonyl (-CO) derivatives [12]. Their abundance of oxygen-containing functional groups play a crucial role in enabling covalent bonding and further surface functionalization. The integration of CQDs into TOFs has been widely explored to enhance sensor performance in various application. Hui et al. reported a CQD-coated TOF for ferric ion (Fe3+) detection, where the formation of Fe3+ chelates on the taper surface induced measurable spectral shifts due to local refractive index changes [7]. Nazri et al. demonstrated improved sensitivity in chlorophyll detection by incorporating a CQD-polyvinyl alcohol (PVA) composite film onto the TOF, achieving a lower detection limit of 0.78 ppm compared to 1.02 ppm in their earlier work [13]. Polokhin et al. enhanced the sensitivity of a TOF sensor for Rhodamine B by a factor of ten using a single-walled carbon nanotube (SWCNT) coating [3]. Similarly, Zainuddin et al. achieved a 43% increase in sensitivity for Leptospira DNA detection by modifying the TOF surface with CQDs [14,15]. These advancements underscore the significant impact of nanomaterial surface modification on enhancing TOF sensor sensitivity, making them increasingly attractive for high-performance optical biosensing.
Given their enhanced performance, TOF platforms are now being explored for more demanding applications, such as the detection of endocrine-disrupting compounds (EDCs), which continue to pose significant detection challenges. 17-α-ethinylestradiol (EE2), a synthetic estrogen widely used in oral contraceptives, is a potent EDC that persists in aquatic environments even at trace concentrations. It disrupts the endocrine systems of aquatic organisms, leading to adverse effects on reproduction and growth, and poses significant risks to human health [16,17,18]. Due to its high potency, the predicted no-effect concentration (PNEC) of EE2 in water is as low as 0.1 ng/L, compared to estrone (E1), 17-β-estradiol (E2), and estriol (E3), with PNEC of 6, 2, and 60 ng/L, respectively [19]. More stringent recommendations, such as those from Decision 495/2015/EU, set an even lower PNEC for EE2 at 0.035 ng/L, further highlighting its potency and the associated environmental risks [20,21,22]. This stringent threshold necessitates the development of ultra-sensitive detection methods capable of identifying EE2 at sub-nanogram levels. Various methods have been developed to solve the analytical difficulties in measuring EE2 at ng/L levels, each with unique strengths. Enzyme-Linked Immunosorbent Assay (ELISA) offers high sensitivity and specificity due to its use of antibodies that selectively bind to EE2, enabling precise quantification even at very low concentrations [23,24,25,26]. Liquid chromatography-mass spectrometry (LC-MS), a highly advanced technique, provides high sensitivity and accuracy, with the ability to separate, identify, and quantify EE2 in complex mixtures [27,28,29]. Meanwhile, electrochemical sensors provide rapid, on-site detection of EE2 with high sensitivity and the potential for miniaturization and integration into portable devices [30,31,32]. Despite the development of various detection methods for EE2, achieving a detection limit that meets the requirement of 0.035 ng/L remains challenging for most techniques. Therefore, there are still opportunities to develop the EE2 detection sensor using alternative approaches.
In this study, we propose a novel biosensing approach that integrates CQDs onto a TOF (CQD-TOF), creating an optically enhanced interface for EE2 detection. The CQD-TOF biosensor is functionalized with polyclonal antibodies (PAb) as a specific receptor to capture the targeted analyte, EE2. To the best of our knowledge, this work presents the first reported application of a CQD-coated TOF biosensor for EE2 detection. This platform demonstrates significant potential for achieving high sensitivity, strong selectivity and low detection limits, offering a promising strategy for the optical monitoring of EE2 in environmental samples.

2. Materials and Methods

2.1. Materials

Sodium chloride (99.5%), sodium hydroxide (NaOH), 3-aminopropyltriethoxysilane (APTES), and glutaraldehyde were obtained from Sigma Aldrich, St. Louis, MO, USA. Phosphate-buffer saline tablets Dulbecco A (PBS, Oxoid, Wesel, Germany) were sourced from LabMal, Selangor, Malaysia. 17-α-ethinylestradiol (EE2) was acquired from MedChem, Monmouth Junction, NJ, USA. The EE2 polyclonal antibody (PA1 75138) was procured from Thermo Fisher Scientific, Waltham, MA, USA. Deionized (DI) water used in the experiments was purified using the Milli-Q water purification system (Merck Millipore, Darmstadt, Germany).

2.2. Experimental Setup and Fabrication of TOF

Figure 1a shows the experimental setup of the CQD-TOF sensor for EE2 detection. The fabricated TOF was securely mounted on a customized acrylic sample holder, which featured a microchannel groove capable of holding up to 100 µL of liquid sample. The groove was deep enough to fully submerge the tapered region of the TOF. A broadband amplified spontaneous emission (ASE) light source, operating in the 1500–1600 nm range, was utilized as the incident light source. The ASE with the transmission power averaging 30 mW was coupled to one end of the TOF. The other end of the TOF was connected to an optical spectrum analyzer (OSA). The OSA was linked to the computer for real-time visualization and recording of the transmission spectrum.
The fabrication of TOF was performed using standard single-mode fiber (SMF-28, 9/125 µm). The TOF was fabricated by a Vytran GPX-3000 workstation (Thorlabs, Morganville, NJ, USA) using the heat-and-pull method. This tapering process reduces the waist diameter of the optical fiber down to micrometer scale, which induces evanescent waves. The parameters were preset in the system with a filament power of 48 W and a motorized stage speed of 1 mm/s. The fabrication process involved creating a TOF with precise dimensions: a taper waist diameter of 12 μm, a taper waist length of 15 mm, and down and up-taper lengths of 5 mm each, as depicted in Figure 1b. The selected taper geometry was based on the optimized parameters obtained in our previous work [33]. The parameters were chosen to balance between the sensitivity and mechanical stability. The modal evolution in tapered fiber was investigated using simulation models of Lumerical Mode Solutions, which demonstrated redistribution of the guided mode into cladding and higher-order modes in the waist region, thereby enhancing the evanescent field interaction [33]. These prior results provide theoretical support for the present taper design.

2.3. Deposition of CQDs on TOF

The CQD solution used in this experiment was obtained from the Department of Chemical and Environmental Engineering, Faculty of Engineering, UPM. The CQDs used in this work were synthesized via the hydrothermal carbonization (HTC) method, using carboxymethylcellulose derived from oil palm empty fruit bunch as the carbon source, with the reaction carried out at 200 °C for 6 h [34]. The initial concentration of the CQD solution was 2.3 g/L, which was then diluted with deionized water to 1.15 g/L for use throughout this research. The CQD solution was characterized using a fluorescence spectrometer to investigate the photoluminescence (PL). The elemental composition of the CQD solution was obtained using Energy Dispersive X-ray Spectroscopy (EDXS). Transmission electron microscopy (TEM) and high-resolution transmission electron microscopy (HRTEM) were used to determine the structure and morphology of the synthesized CQDs. EDXS, TEM and HRTEM characterization were conducted using ZEISS LEO 912 AB. Using the TEM image, ImageJ (version 1.53a) was used to analyze the size of the CQDs.
The CQDs solution used in this work is an inorganic material with oxygenated functional groups that allow direct attachment onto the TOF without the need for prior surface functionalization, as shown in Figure 1c. The CQD layer was deposited onto the tapered region using the dip-coating method. In this process, the TOF was secured on the sample holder with the tapered region positioned within the microchannel groove. The fiber ends were connected to ASE at the input and OSA at the output. Under broadband ASE illumination, approximately 50 µL of CQD solution was pipetted over the tapered region until the region was fully immersed. After controlled incubation times (10–50 min), the CQD solution was drained, and the region was rinsed with DI water thrice to remove any unbound molecules. The output spectrum was recorded after the TOF was air-dried for 5 min [35].
To develop a TOF sensor for EE2 detection, the incubation time of CQDs onto tapered optical fiber was varied to manipulate the thickness of the CQDs layer. As reported in the previous works [35,36], modification of the active sensing layer thickness may affect sensor sensitivity. Thus, the sensor sensitivity towards EE2 detection was examined with the immersion time of CQDs for 10, 20, 30, 40, and 50 min. After being submerged in the CQDs solution for the time allocated, the tapered region was washed thoroughly with distilled water to remove any unbound molecules on the sensing surface. Then the tapered area was air-dried for 5 min to ensure the evaporation of any excess water. Next, the output spectrum was measured using OSA.
The CQD-TOF was characterized using Raman spectroscopy (WITec Alpha 300R) to analyze its elemental and molecular compositions. Additionally, the elemental composition of the CQD-TOF was assessed using EDXS. The surface morphology of the CQD-TOF was analyzed using Atomic Force Microscopy (AFM) (Dimension Edge with Scanasyst, Brunker Crest).

2.4. Surface Modification for EE2 Detection Using CQD-TOF

Surface functionalization, a process that enables the conjugation of inorganic materials with organic biomolecules, was performed on the CQD-TOF, as shown in Figure 2. Firstly, the tapered region was immersed in 0.1 M NaOH for 50 min to enrich the surface with hydroxyl groups (-OH). Because CQDs have a larger surface area per volume ratio, it is believed that a greater volume of hydroxyl group molecules may be bonded to the sensing surface as compared to a bare TOF. Next, the hydroxylated tapered region was silanized for 45 min using 2% (v/v) of APTES diluted in deionized water. During this process, covalent bonds were formed between the hydroxyl (-OH) groups on the hydroxylated surface and the silanol groups in APTES. This reaction leaves the terminal amine (-NH2) exposed, creating an aminopropyl-terminated surface. The exposed amino groups are essential for the immobilization of organic compounds in the following steps. After silanization, the tapered region was immersed in 2.5% (v/v) of glutaraldehyde diluted in PBS for 45 min. The two reactive ends (-COH) in glutaraldehyde are vital to crosslink the two free terminal amines (-NH2); one from previous APTES and the other from the EE2 antibody. Following that, the tapered region was immobilized with 0.1 μM of EE2 antibodies for 30 min. In this process, the free end terminal of the aldehyde group (-COH) reacts to the antibody’s amine group (-NH2), forming a strong covalent bond. Finally, the EE2 solution was introduced at the sensing region for 15 min. The concentrations of EE2 solution were varied in order to determine the sensor’s performance in terms of sensitivity, limit of detection, binding affinity, and selectivity. Between each surface modification step, the sensing region was washed three times with distilled water to remove unbound molecules, then left to dry at room temperature for 5 min. The output spectrum after each process was recorded using OSA to monitor the wavelength shift.

3. Results

3.1. Characterization of CQDs Solution

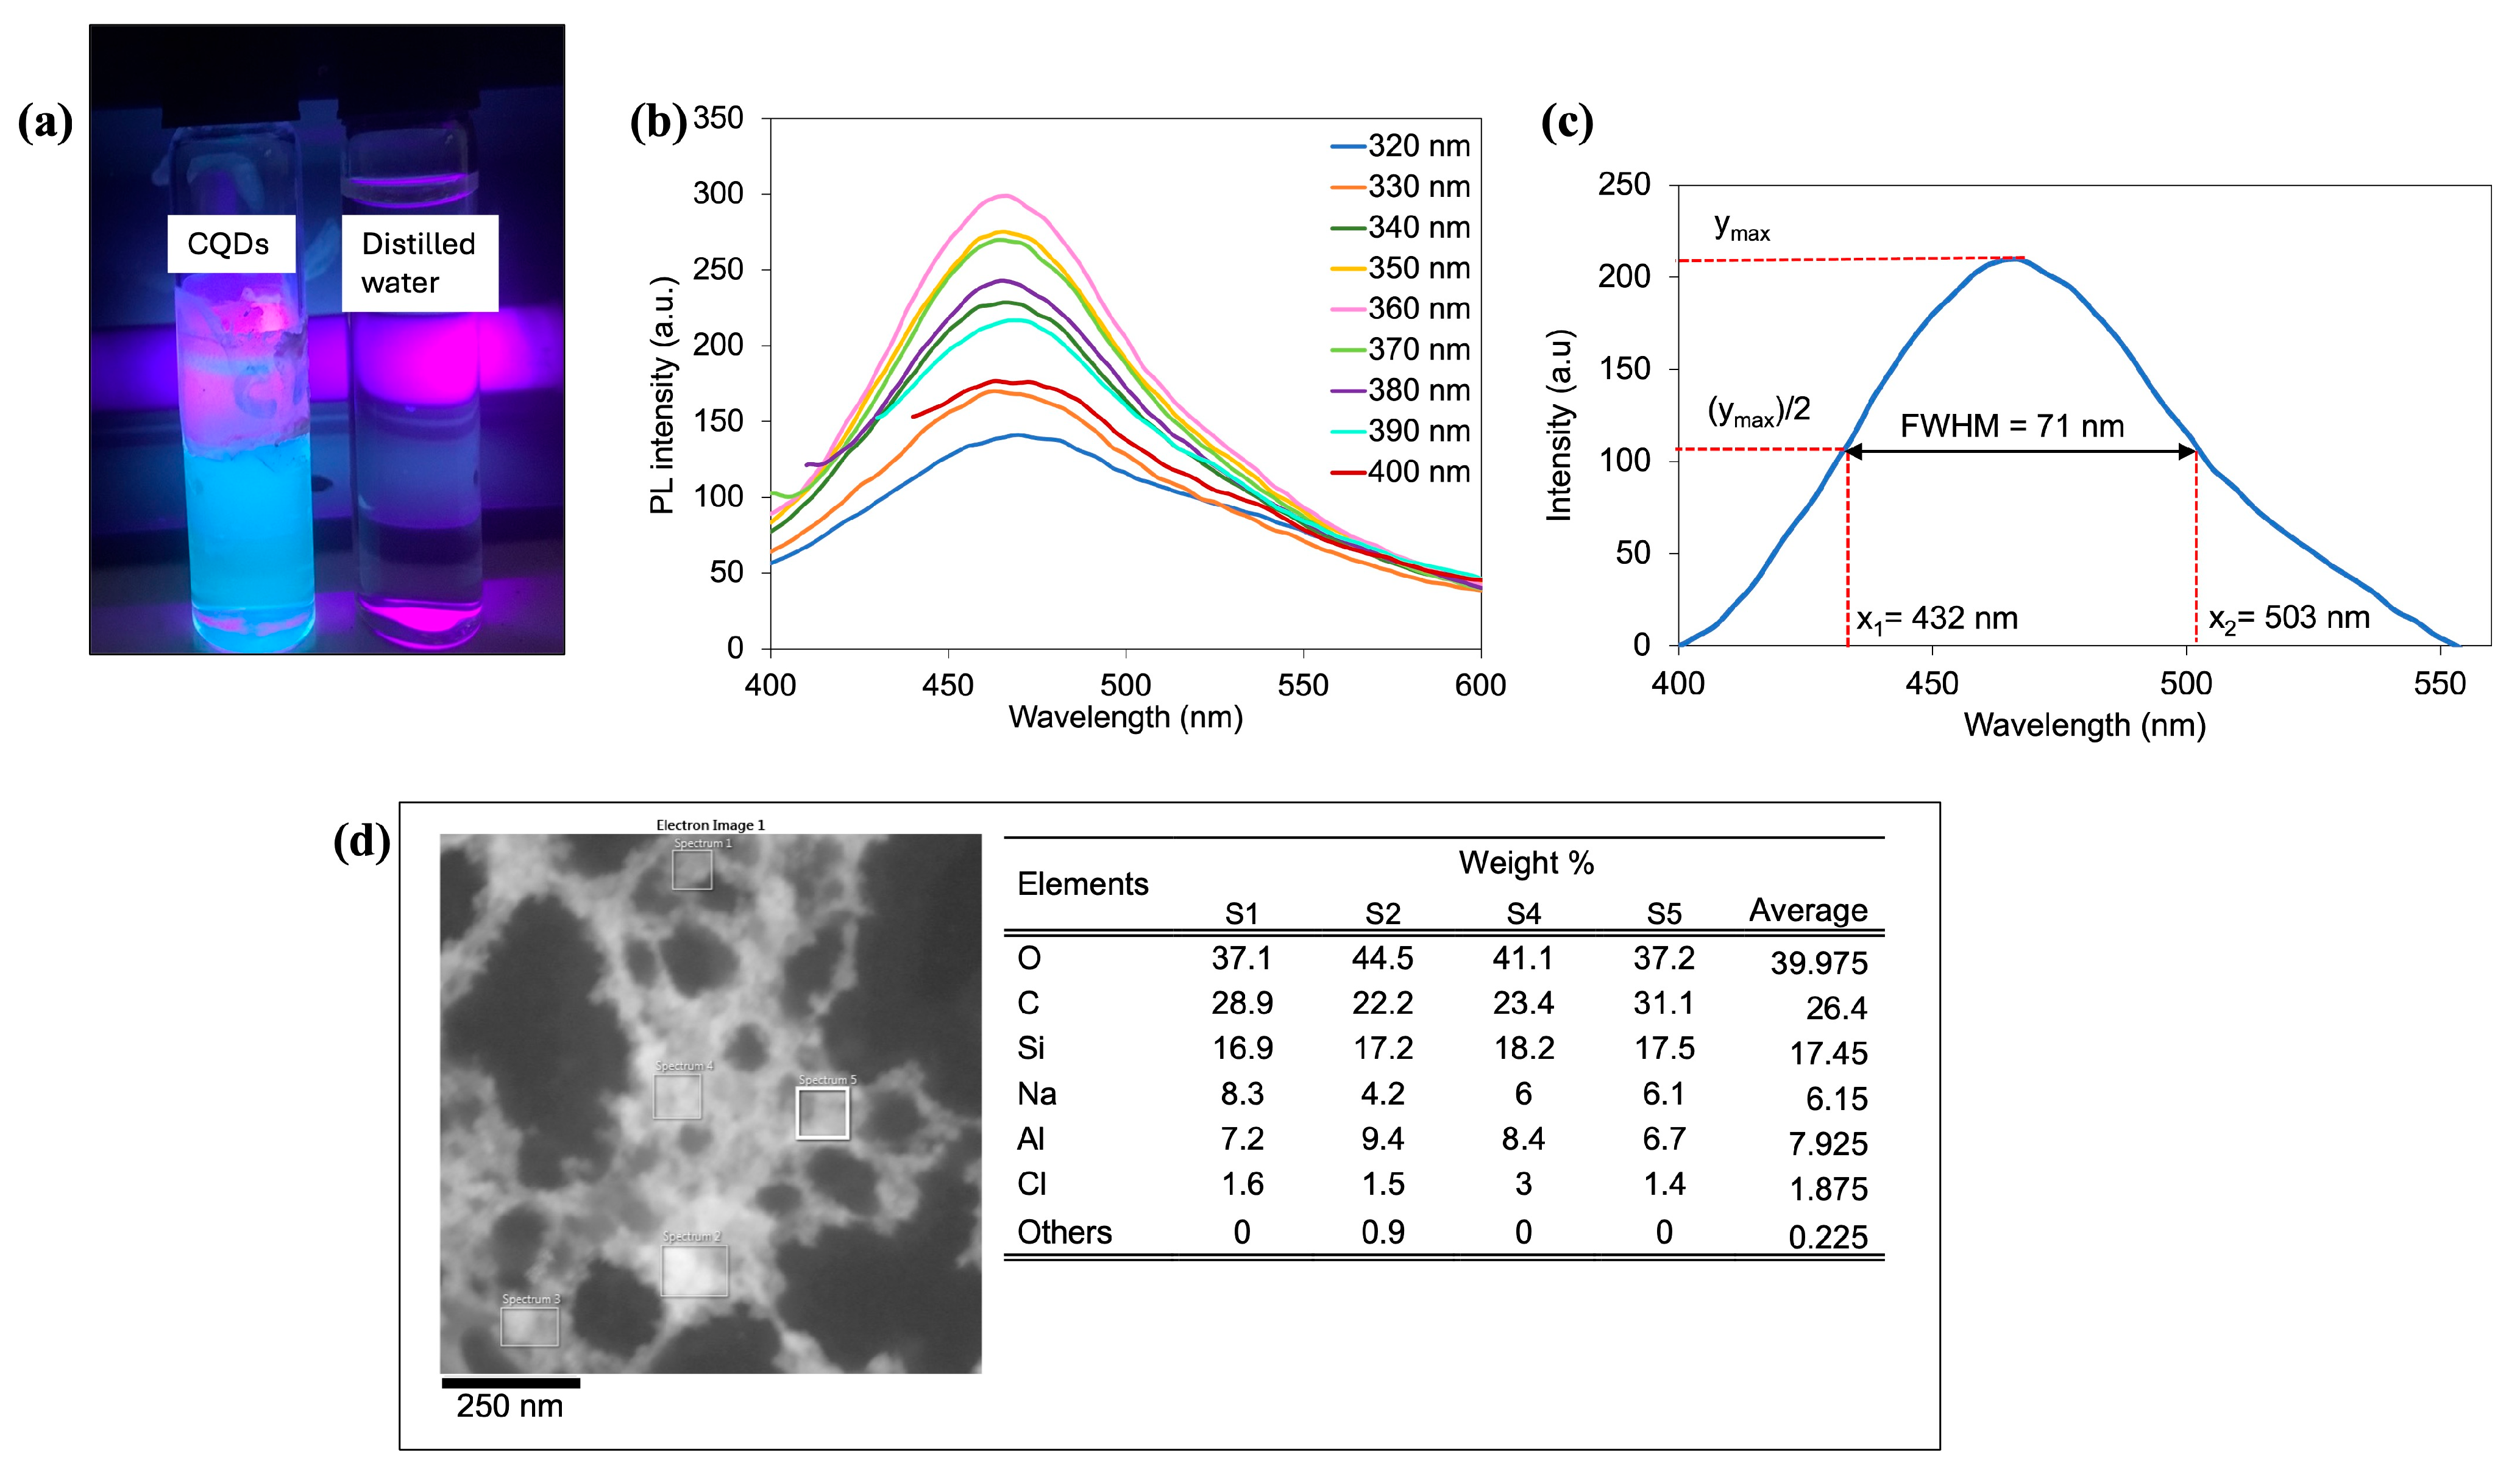
In Figure 3a, blue fluorescence was observed when the CQD solution was illuminated with a UV lamp. The blue fluorescence indicates the presence of nanomaterials, in this case CQDs, as the smaller-sized dots emit higher energy, which is blue light due to greater quantum confinement [37].
Photoluminescence (PL) of the CQD solution was obtained using a fluorescence spectrometer, which measured the emission and excitation light of CQDs across a range from 200 to 1000 nm. The results, depicted in Figure 3b, show intense emission peaks centered at 470 nm. The PL intensity increased with excitation wavelengths ranging from 320 to 360 nm, without a significant shift in peak wavelength. However, the PL intensity decreased for the excitation wavelengths between 370 and 400 nm, with a slight red shift by 8 nm in the emission peak. This observation is consistent with previous findings [38]. Additionally, the observed effect of PL at lower wavelengths suggests that the CQD particles are relatively small, as smaller particles typically exhibit PL effects at lower wavelengths [8]. Furthermore, for excitation wavelength at 360 nm, the full width at half maximum (FWHM) was determined at 71 nm, as shown in Figure 3c. With FWHM being less than 80 nm, these CQDs are considered narrow bandwidth quantum dots, emitting light in a very specific wavelength range, which can be advantageous in optical biosensing by offering increased efficiency [39].
The elemental composition of CQDs in aqueous solution was obtained using EDXS and was determined at five different spots, as shown in Figure 3d. As seen from the table, the CQD solution predominantly contained 39.975% oxygen (O), 26.4% carbon (C), and 17.45% silicon (Si). The presence of sodium (Na), aluminum (Al), chlorine (Cl), and other elements contributes only a small percentage of the weight, with 6.15%, 7.925%, 1.875%, and 0.225%, respectively. Therefore, the purity of the synthesized CQDs is validated since there were no unexpected elements detected in the spectra [38].
Figure 4a shows the TEM image at 20 nm resolution, revealing the spherical shape of the CQDs. Analysis of the TEM image using ImageJ software indicates that the CQDs have a particle size distribution ranging from 3 to 6.5 nm, with an average diameter of 5.2 nm, as shown in the histogram of Figure 4b. The homogenous morphology and narrow size distribution reveal the mono-dispersed behaviour of the CQDs [34]. Such uniformity is essential for ensuring reproducibility in [40]. Additionally, the HRTEM image at a resolution of 5 nm, presented in Figure 4c, reveals the crystalline nature of the CQD core, with a lattice distance of 0.309 nm, as measured in Figure 4d. The interplanar spacing is attributed to the distance between adjacent carbon atoms in the crystal lattice in the (100) diffraction plane of graphite [41].
Overall, the photoluminescent properties of the CQDs are valuable for confirming their synthesis and quality, as they indicate well-dispersed, optically active nanoparticles whose favorable surface chemistry supports bioconjugation. Moreover, their nanoscale dimensions provide a high surface-to-volume ratio that is essential for effective surface enhancement of the TOF sensor.

3.2. Characterization of CQD-TOF

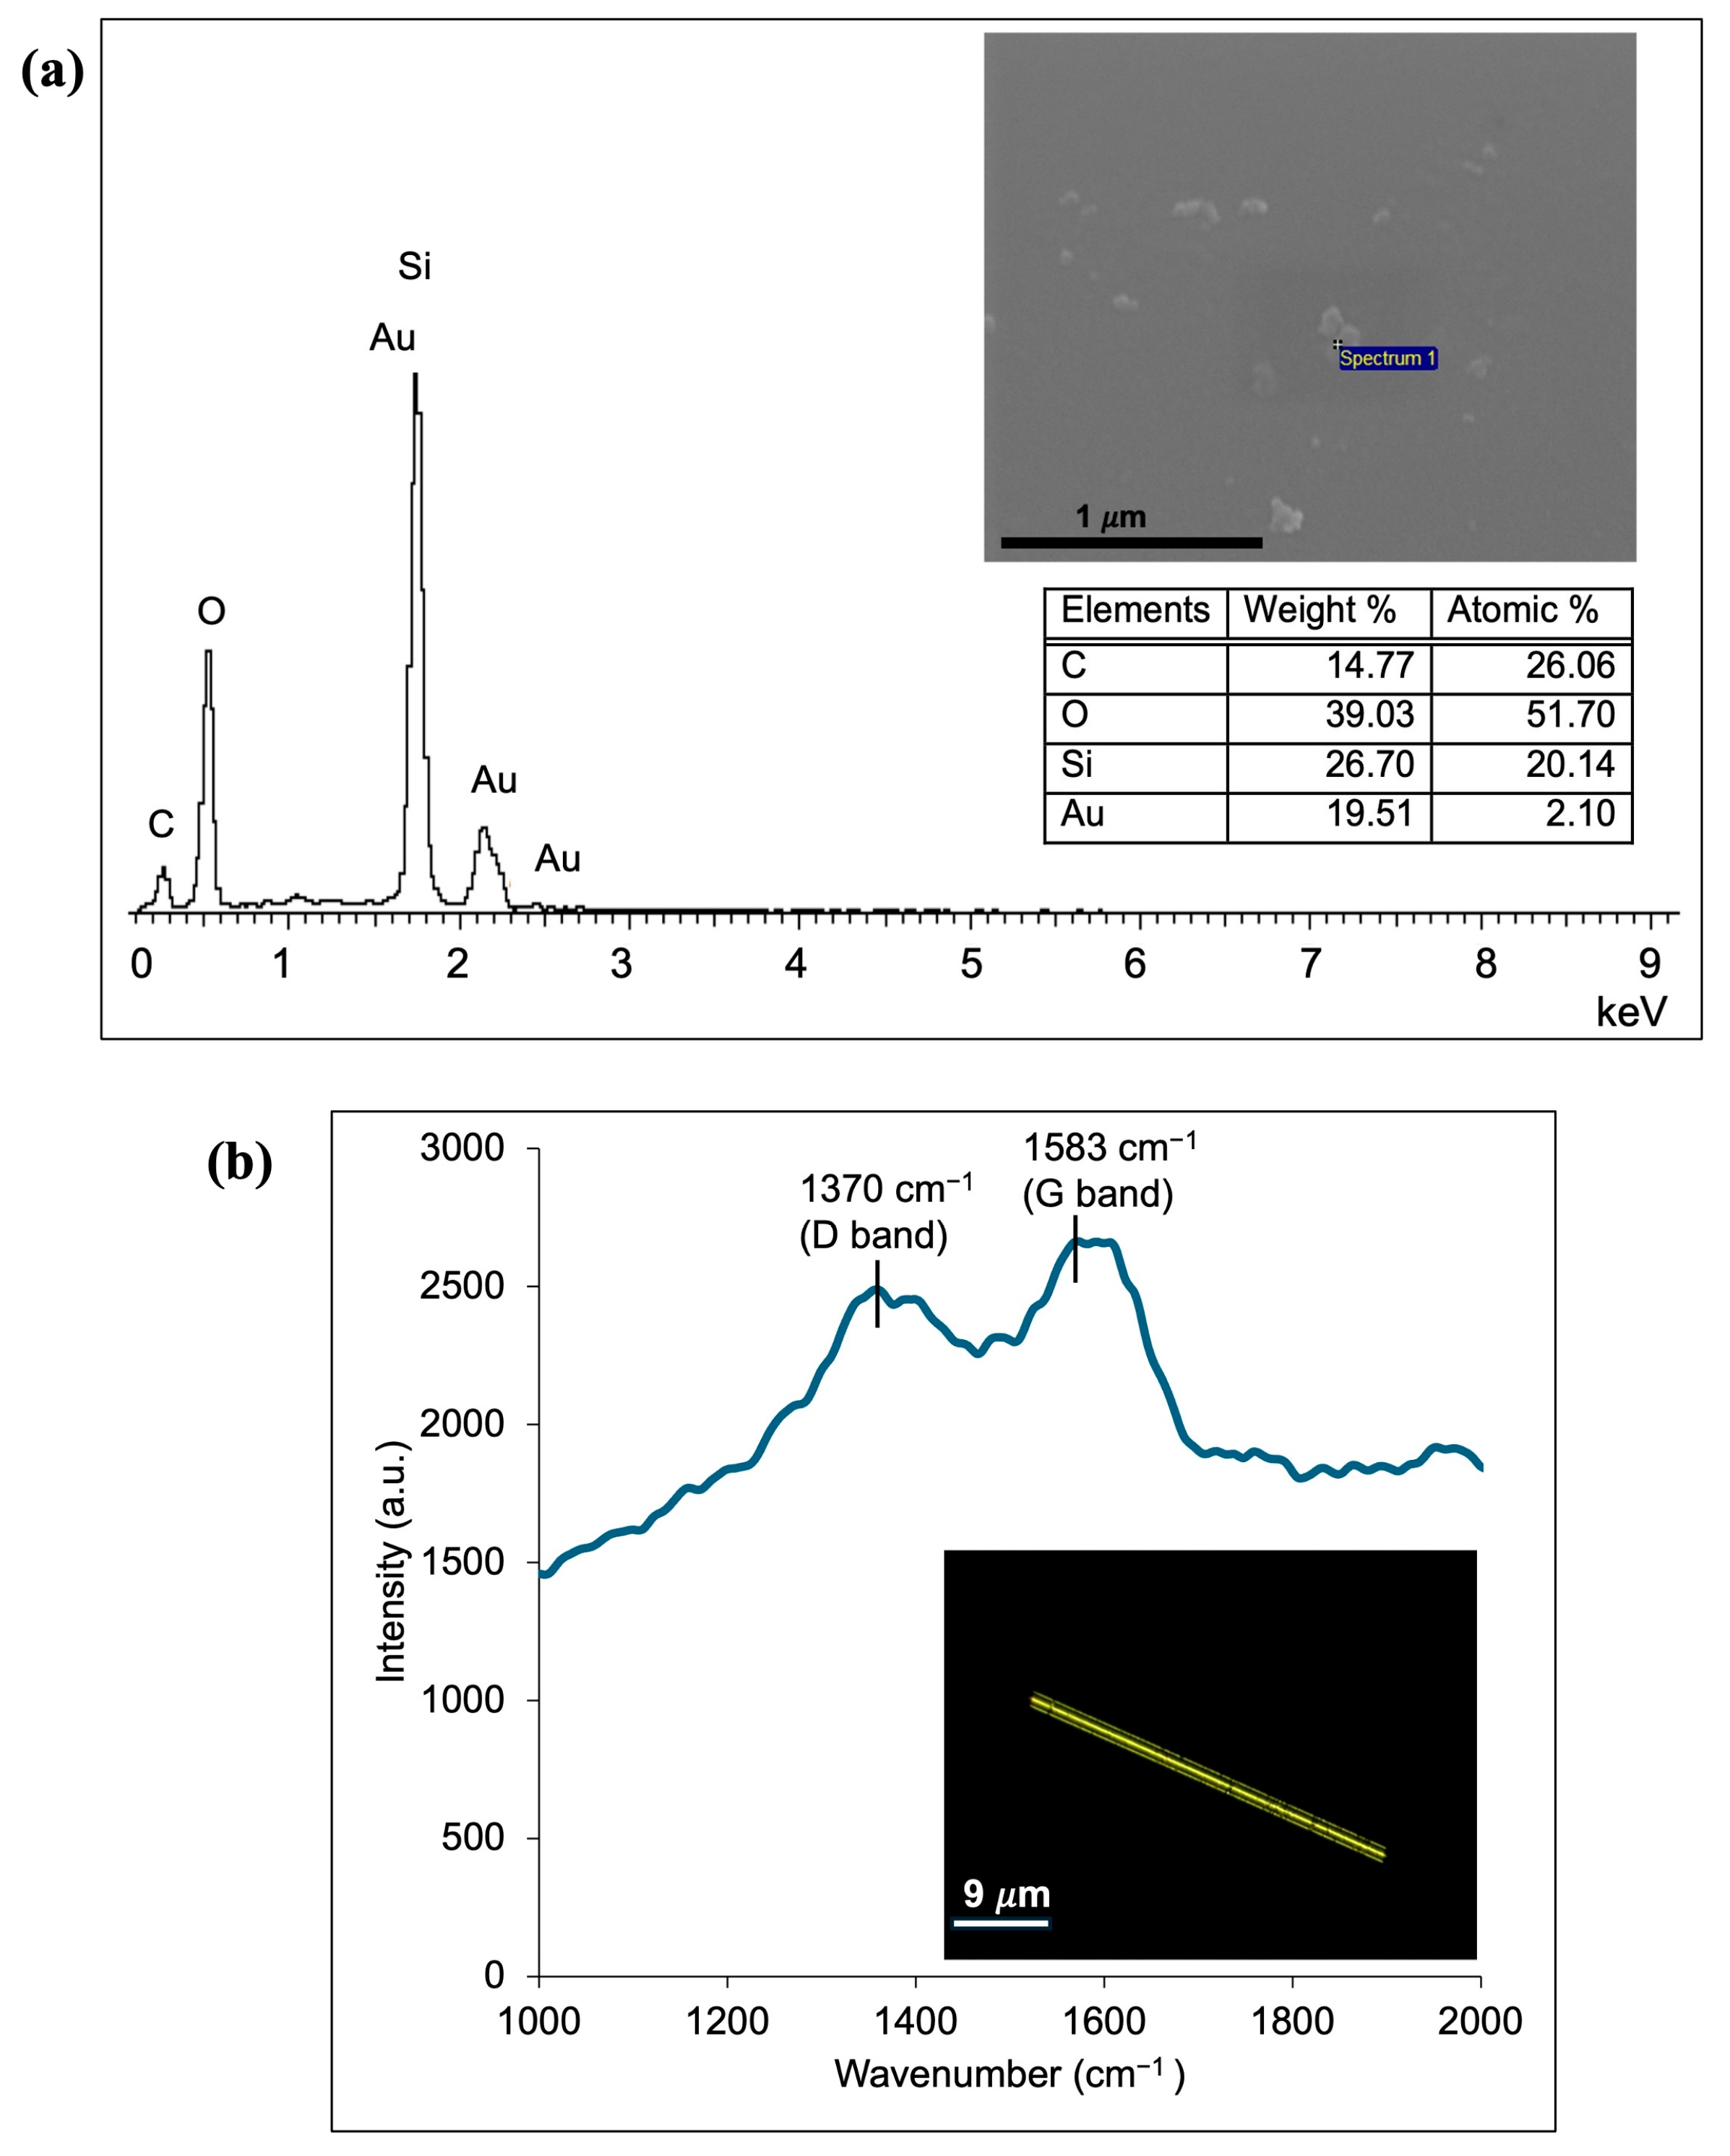
The elemental composition of CQD-TOF was determined using EDX analysis, as shown in Figure 5a. The inset features the corresponding FESEM image and a table with their elemental weight and atomic percentage composition. The EDX data reveal the following atomic percentages: 26.01% carbon (C), 51.70% oxygen (O), 20.14% silicon (Si), and 2.10% gold (Au). A small amount of Au is present due to the gold sputter coating applied to the optical fiber for enhanced resolution imaging. Raman spectroscopy was employed to further analyze the molecular and elemental composition of CQD-TOF. The technique identifies chemicals by measuring the scattered light when a laser excitation source is directed at the sample. In this work, the Raman spectrum was obtained using WITec Alpha 300R with an excitation wavelength of 488.146 nm. Figure 5b illustrates the spectrum of CQDs on tapered optical fiber, measured at the range of 1000–2000 cm−1. The two prominent peaks observed in the result, at 1370 and 1583 cm−1, represent a D- and G-band peak, respectively. The D-band (D for defect) peak indicates defects and disorder in the sp3 carbon structure [42], whereas the band G (G for graphite) peak is related to the E2g vibrational mode, which arises from the symmetric stretching of sp2 carbon atoms [43]. The Raman spectrum obtained in this work is aligned with those reported in other research works, confirming the successful integration of CQDs on the TOF [42,43,44].
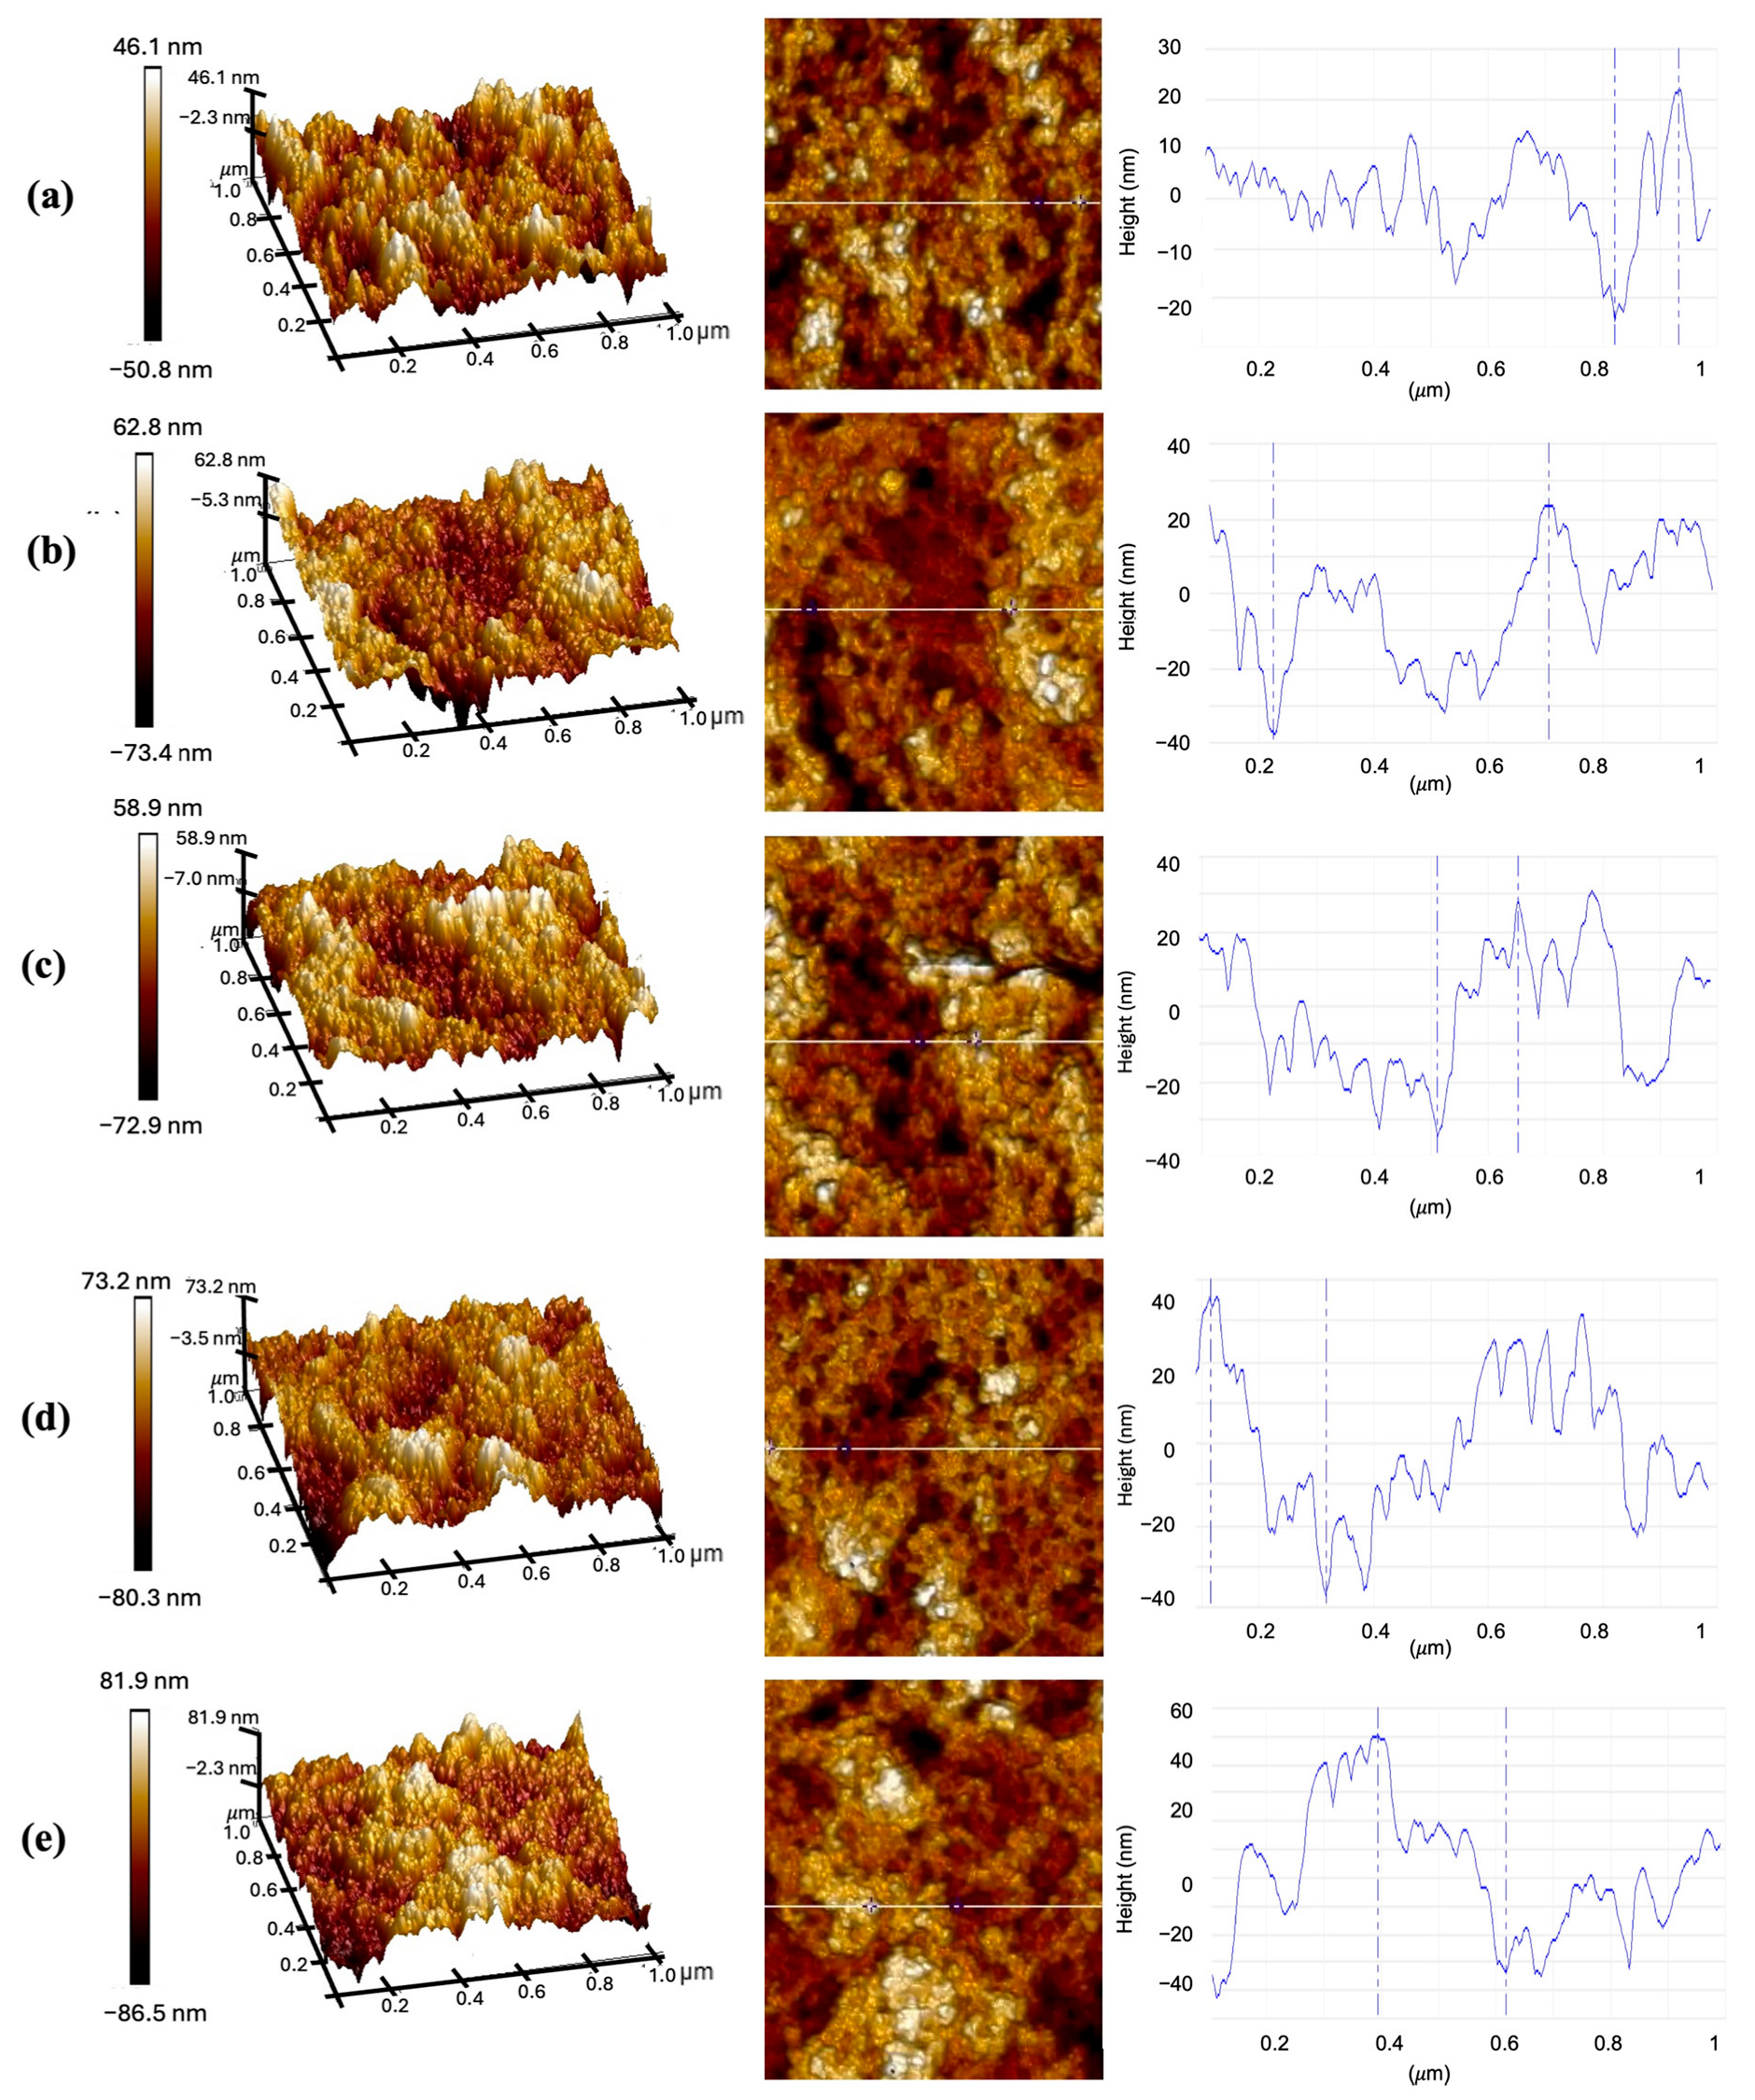
Characterization using AFM was performed to assess the average roughness and thickness with different immersion times of CQD solutions. The AFM samples were prepared by depositing the CQD solution for 10, 20, 30, 40, and 50 min, followed by rinsing with deionized water and drying at room temperature. Figure 6a–e shows the AFM images of CQD corresponding to each immersion time. The surface topographies of each immersion time exhibited similar surface texture without any distinct conformational changes. This observation indicates a homogenous distribution of CQD on the surface area, attributed to the small size of CQD nanoparticles. The surface roughness of each image is measured using the root mean square (RMS) of the measured surface, Rq. Besides that, the sample thickness was measured using the height profile of lines drawn on the corresponding 2D images by taking into account the vertical distance from the highest peak to the lowest valley. Table 1 displays Rq and the thickness of CQD at different deposition times, ranging from 10 to 50 min. Based on the table, Rq increases gradually from 1.25 nm to a maximum of 1.67 nm as the deposition time increases. On another note, the thickness increases from 46.340 nm to a maximum of 84.329 nm.

3.3. EE2 Detection Using CQD-TOF

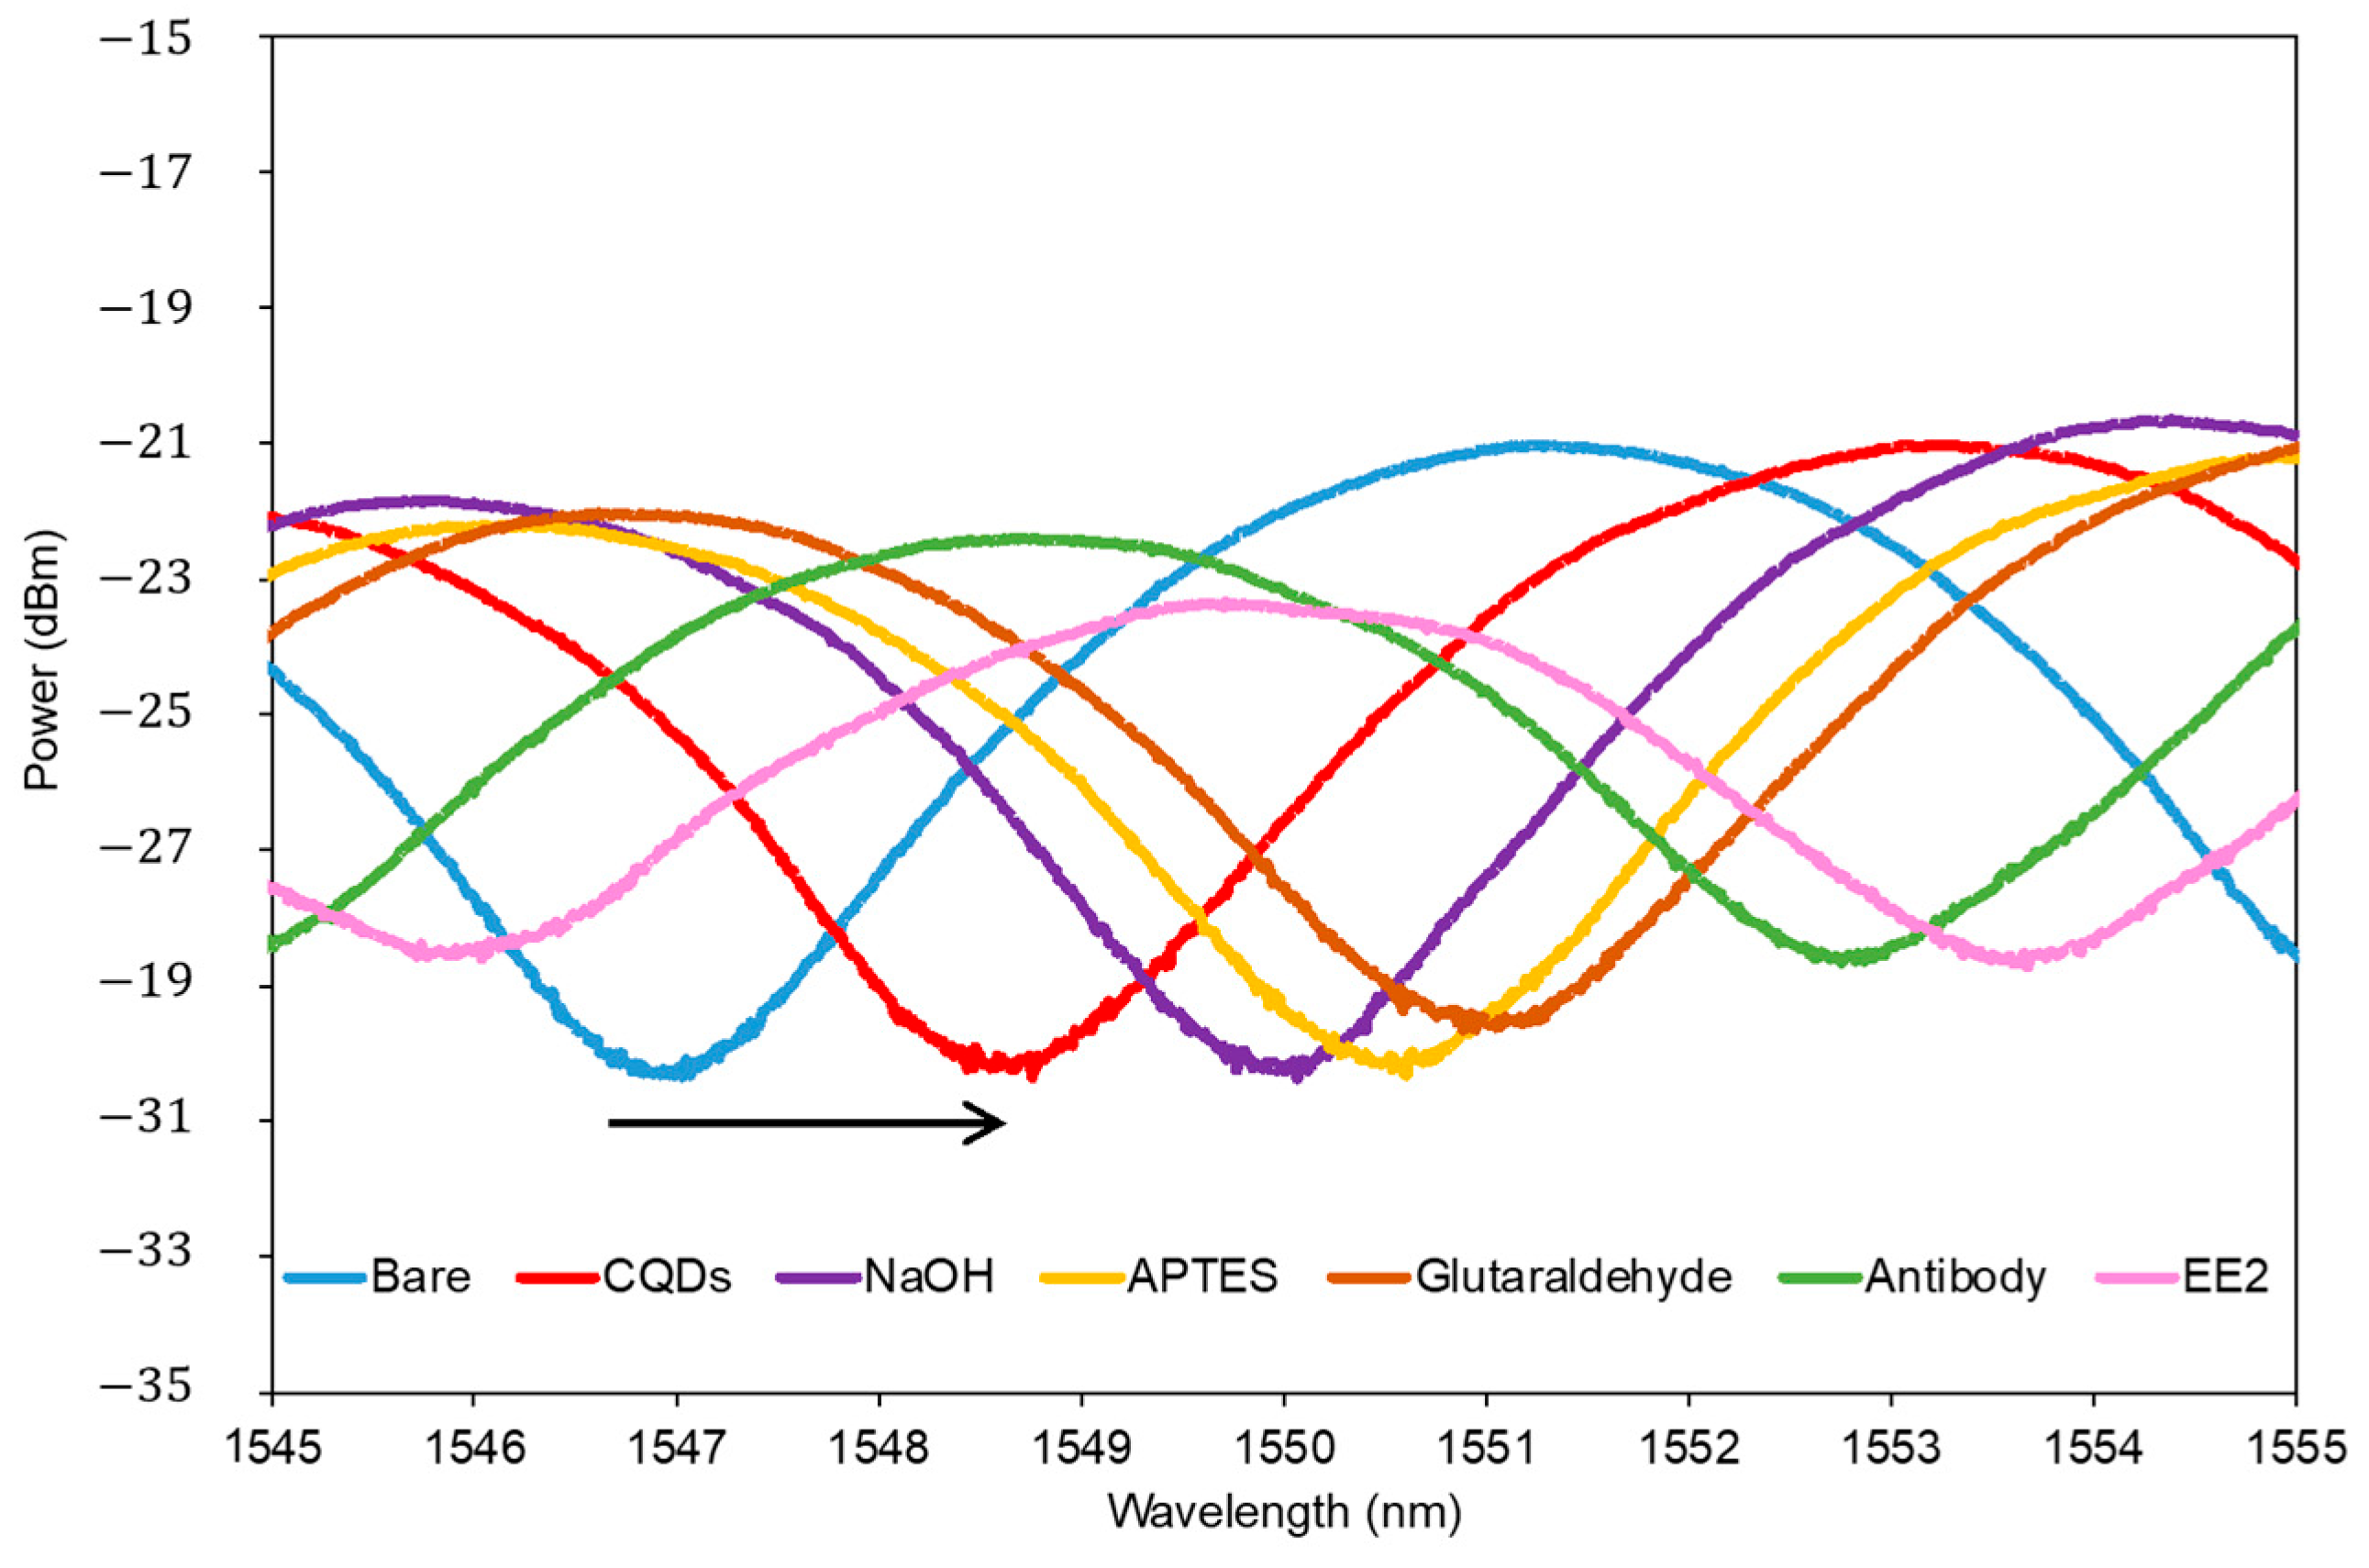
Figure 7 shows the output spectrum of TOF before any surface modification and after incubation with CQD, NaOH, APTES, glutaraldehyde, the EE2 antibody, and the target analyte of EE2. Spectra were taken when the TOF had been completely dried. The observed consistent red shift indicates the increment of refractive index at the surface area, resulting from the formation of layers by bi-functional linkers between molecules. This confirms the successful development of a sensing layer for EE2 detection using bio-functionalized CQD-TOF.
In evanescent wave-based sensors using TOFs, light propagation undergoes significant changes due to the tapering of the fiber. Initially, in the untapered region, light remains confined within the core of the single-mode fiber, allowing only the fundamental mode to propagate through total internal reflection. As the core diameter of the TOF reduces, the V-number decreases, which dictates the number of modes that can propagate. At a certain point in the tapered region, the core becomes too small to confine the light entirely, leading to the excitation of higher-order modes. These higher-order modes propagate in the cladding instead of the core, and the light begins to extend beyond the core into the cladding, thus promoting the interaction between the evanescent wave and the external environment. At the up-taper region, the coupling effect between fundamental and higher-order modes generates an interferometric pattern output spectrum. The transmission spectrum is described as [15]:
    I = I 1 + I 2 + 2 I 1 I 2   c o s   ( ϕ )  
where I1 and I2 indicate the intensities of the fundamental and higher-order modes, respectively, and ϕ is the phase shift between these modes. The phase difference is given by [14]:
ϕ = 2 π n e f f L w λ
where L w is the tapered waist length, λ is the incident light wavelength, and n e f f is the difference between the effective refractive index of the core/cladding,   n e f f c and the effective refractive index of the external surrounding, n e f f e x t . As surface modification increases the refractive index of the external environment, n e f f between the core/cladding and the external medium decreases. This reduction in n e f f alters the phase of the propagating light, leading to a shift in the interference pattern.
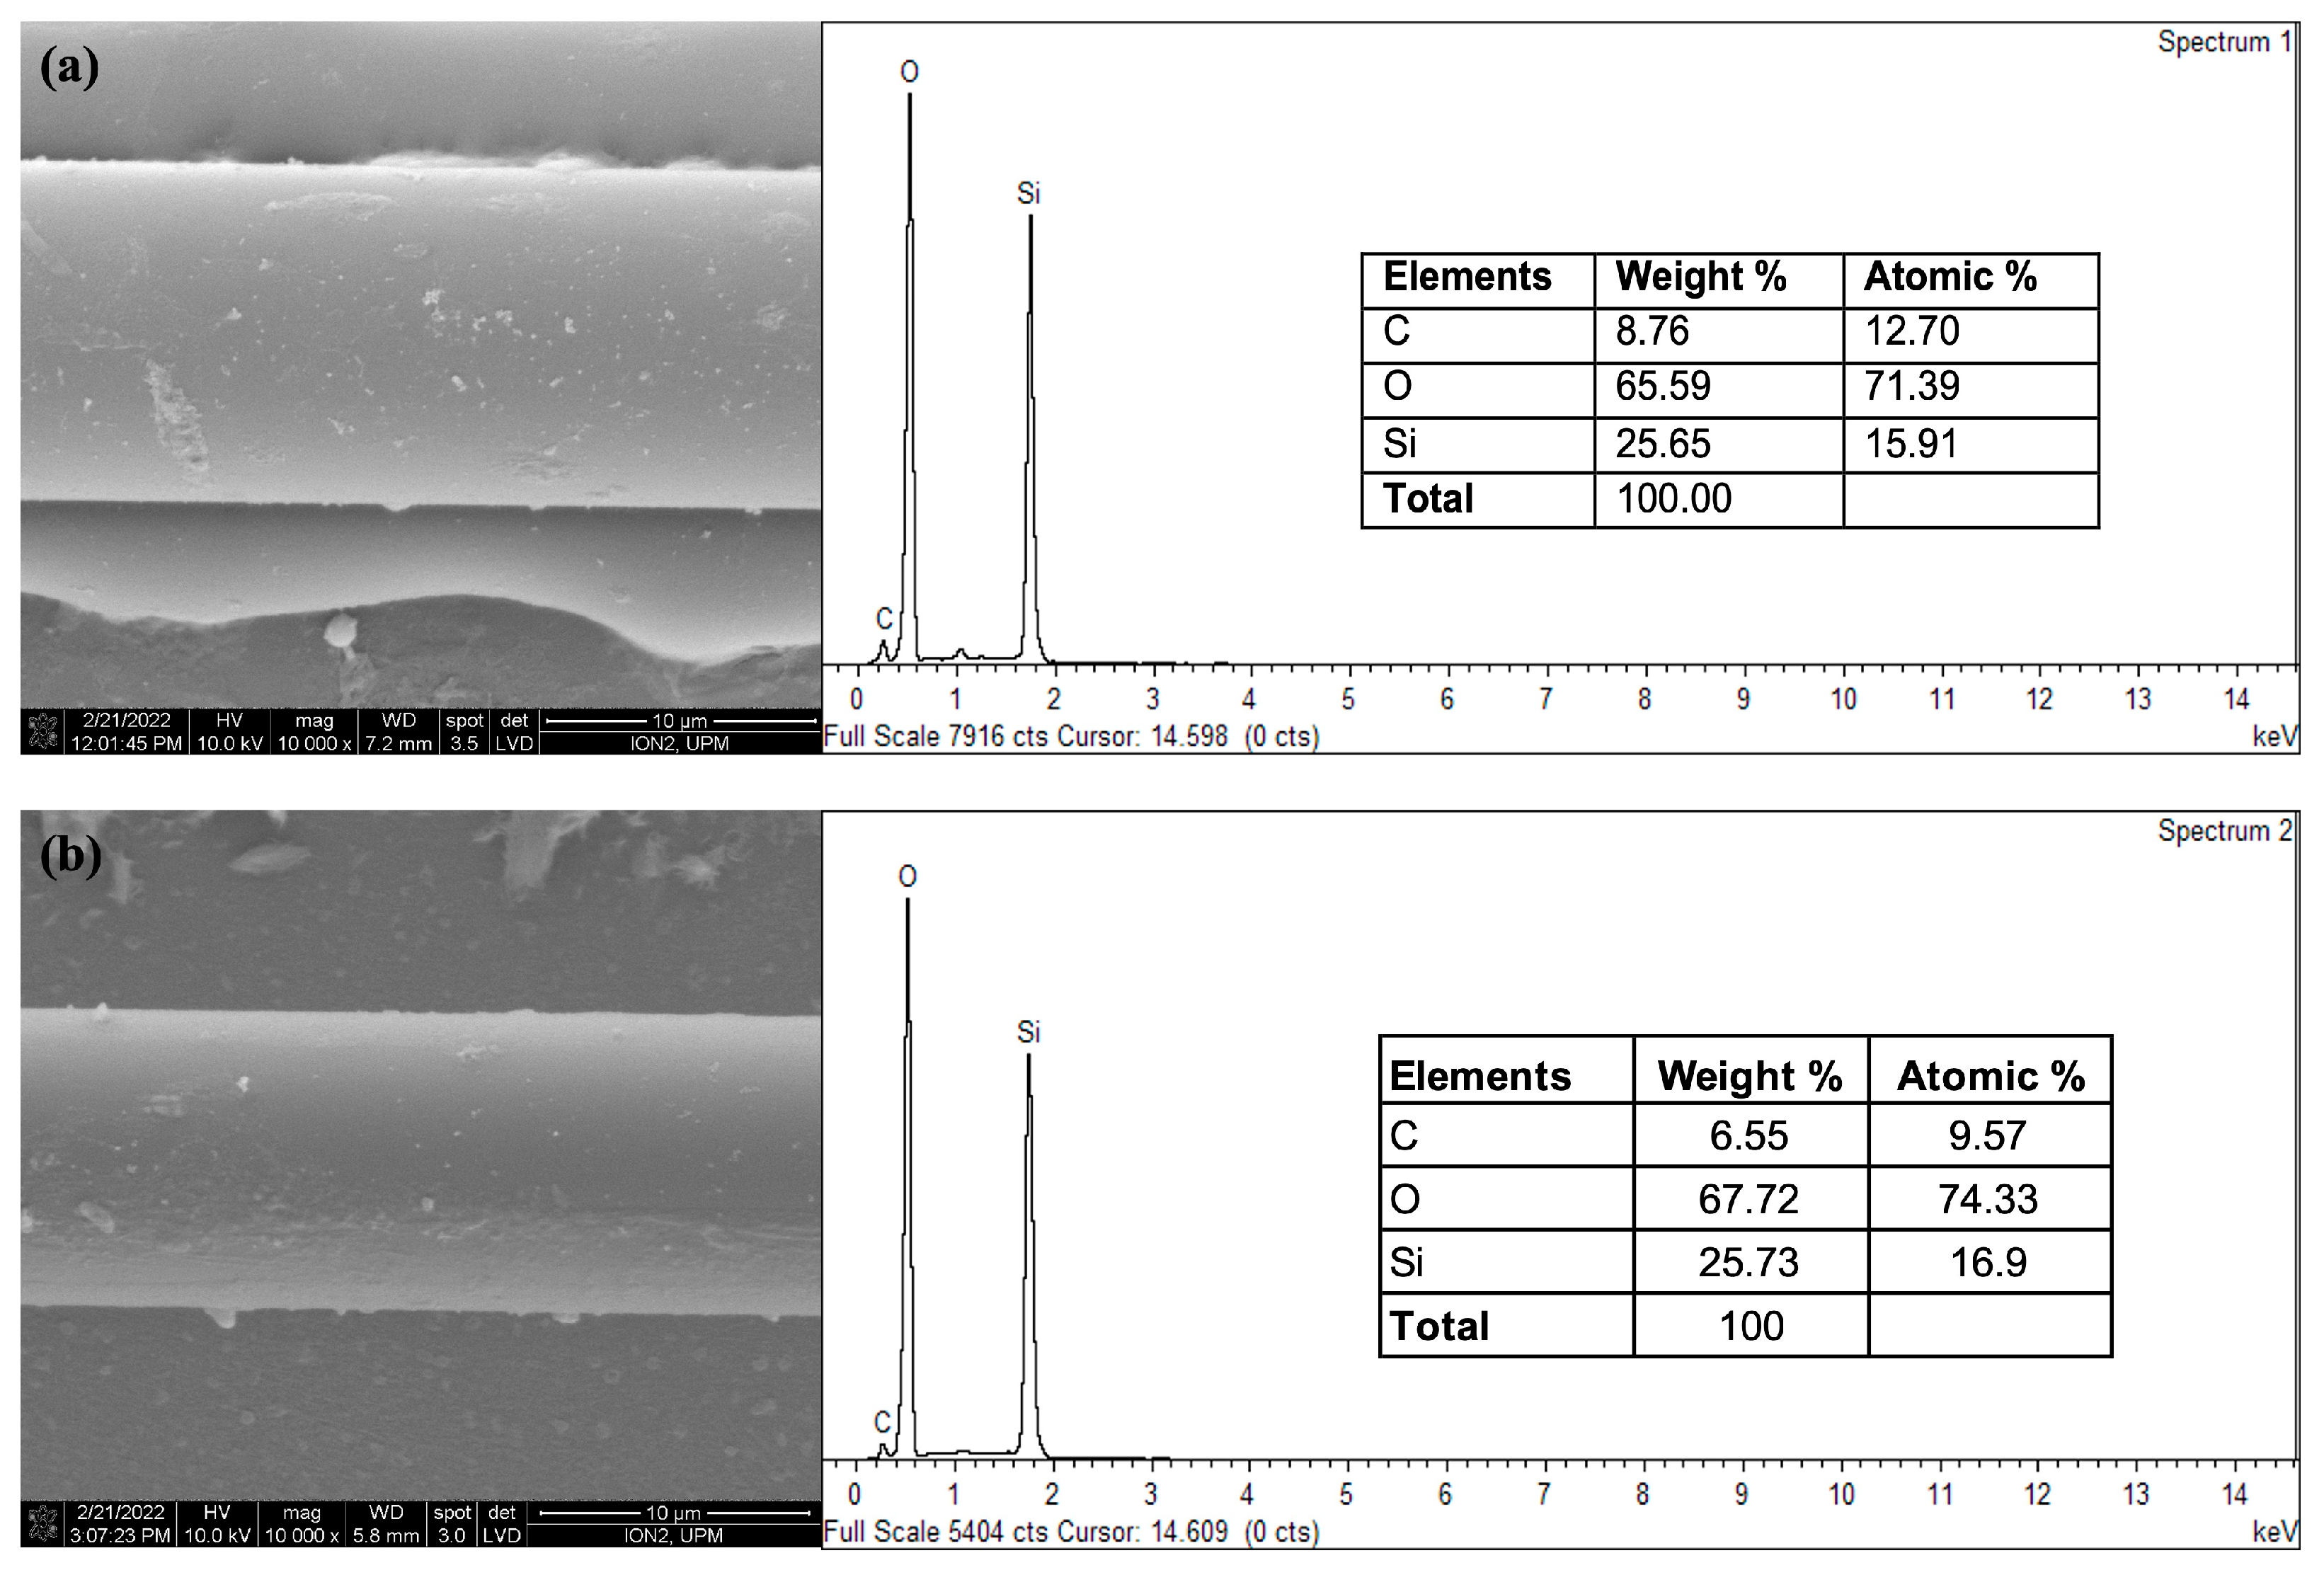
The surface morphologies of the CQD-TOF after the introduction of antibody and EE2 were observed using FESEM under 10k magnification, as shown in Figure 8. In conjunction with the FESEM, EDXS analysis was performed to identify the elemental composition of each TOF sample. Figure 8a shows that the surface morphology after antibody immobilization exhibited large strand-like structures dispersed across the surface, likely due to the relatively large size of antibodies. In contrast, Figure 8b illustrates a smoother surface texture after the introduction of EE2, suggesting conformational changes and indicating the successful binding of EE2 to the bound antibodies. Meanwhile, both EDXS spectra indicate similar elemental trends, with O being the most abundant element, followed by Si and C. However, after EE2 exposure, a reduction in C and an increase in Si and O content were observed. These significant variations in the atomic weight of molecules before and after EE2 detection suggest the successful formation of a new bond between antibodies and EE2 [45].
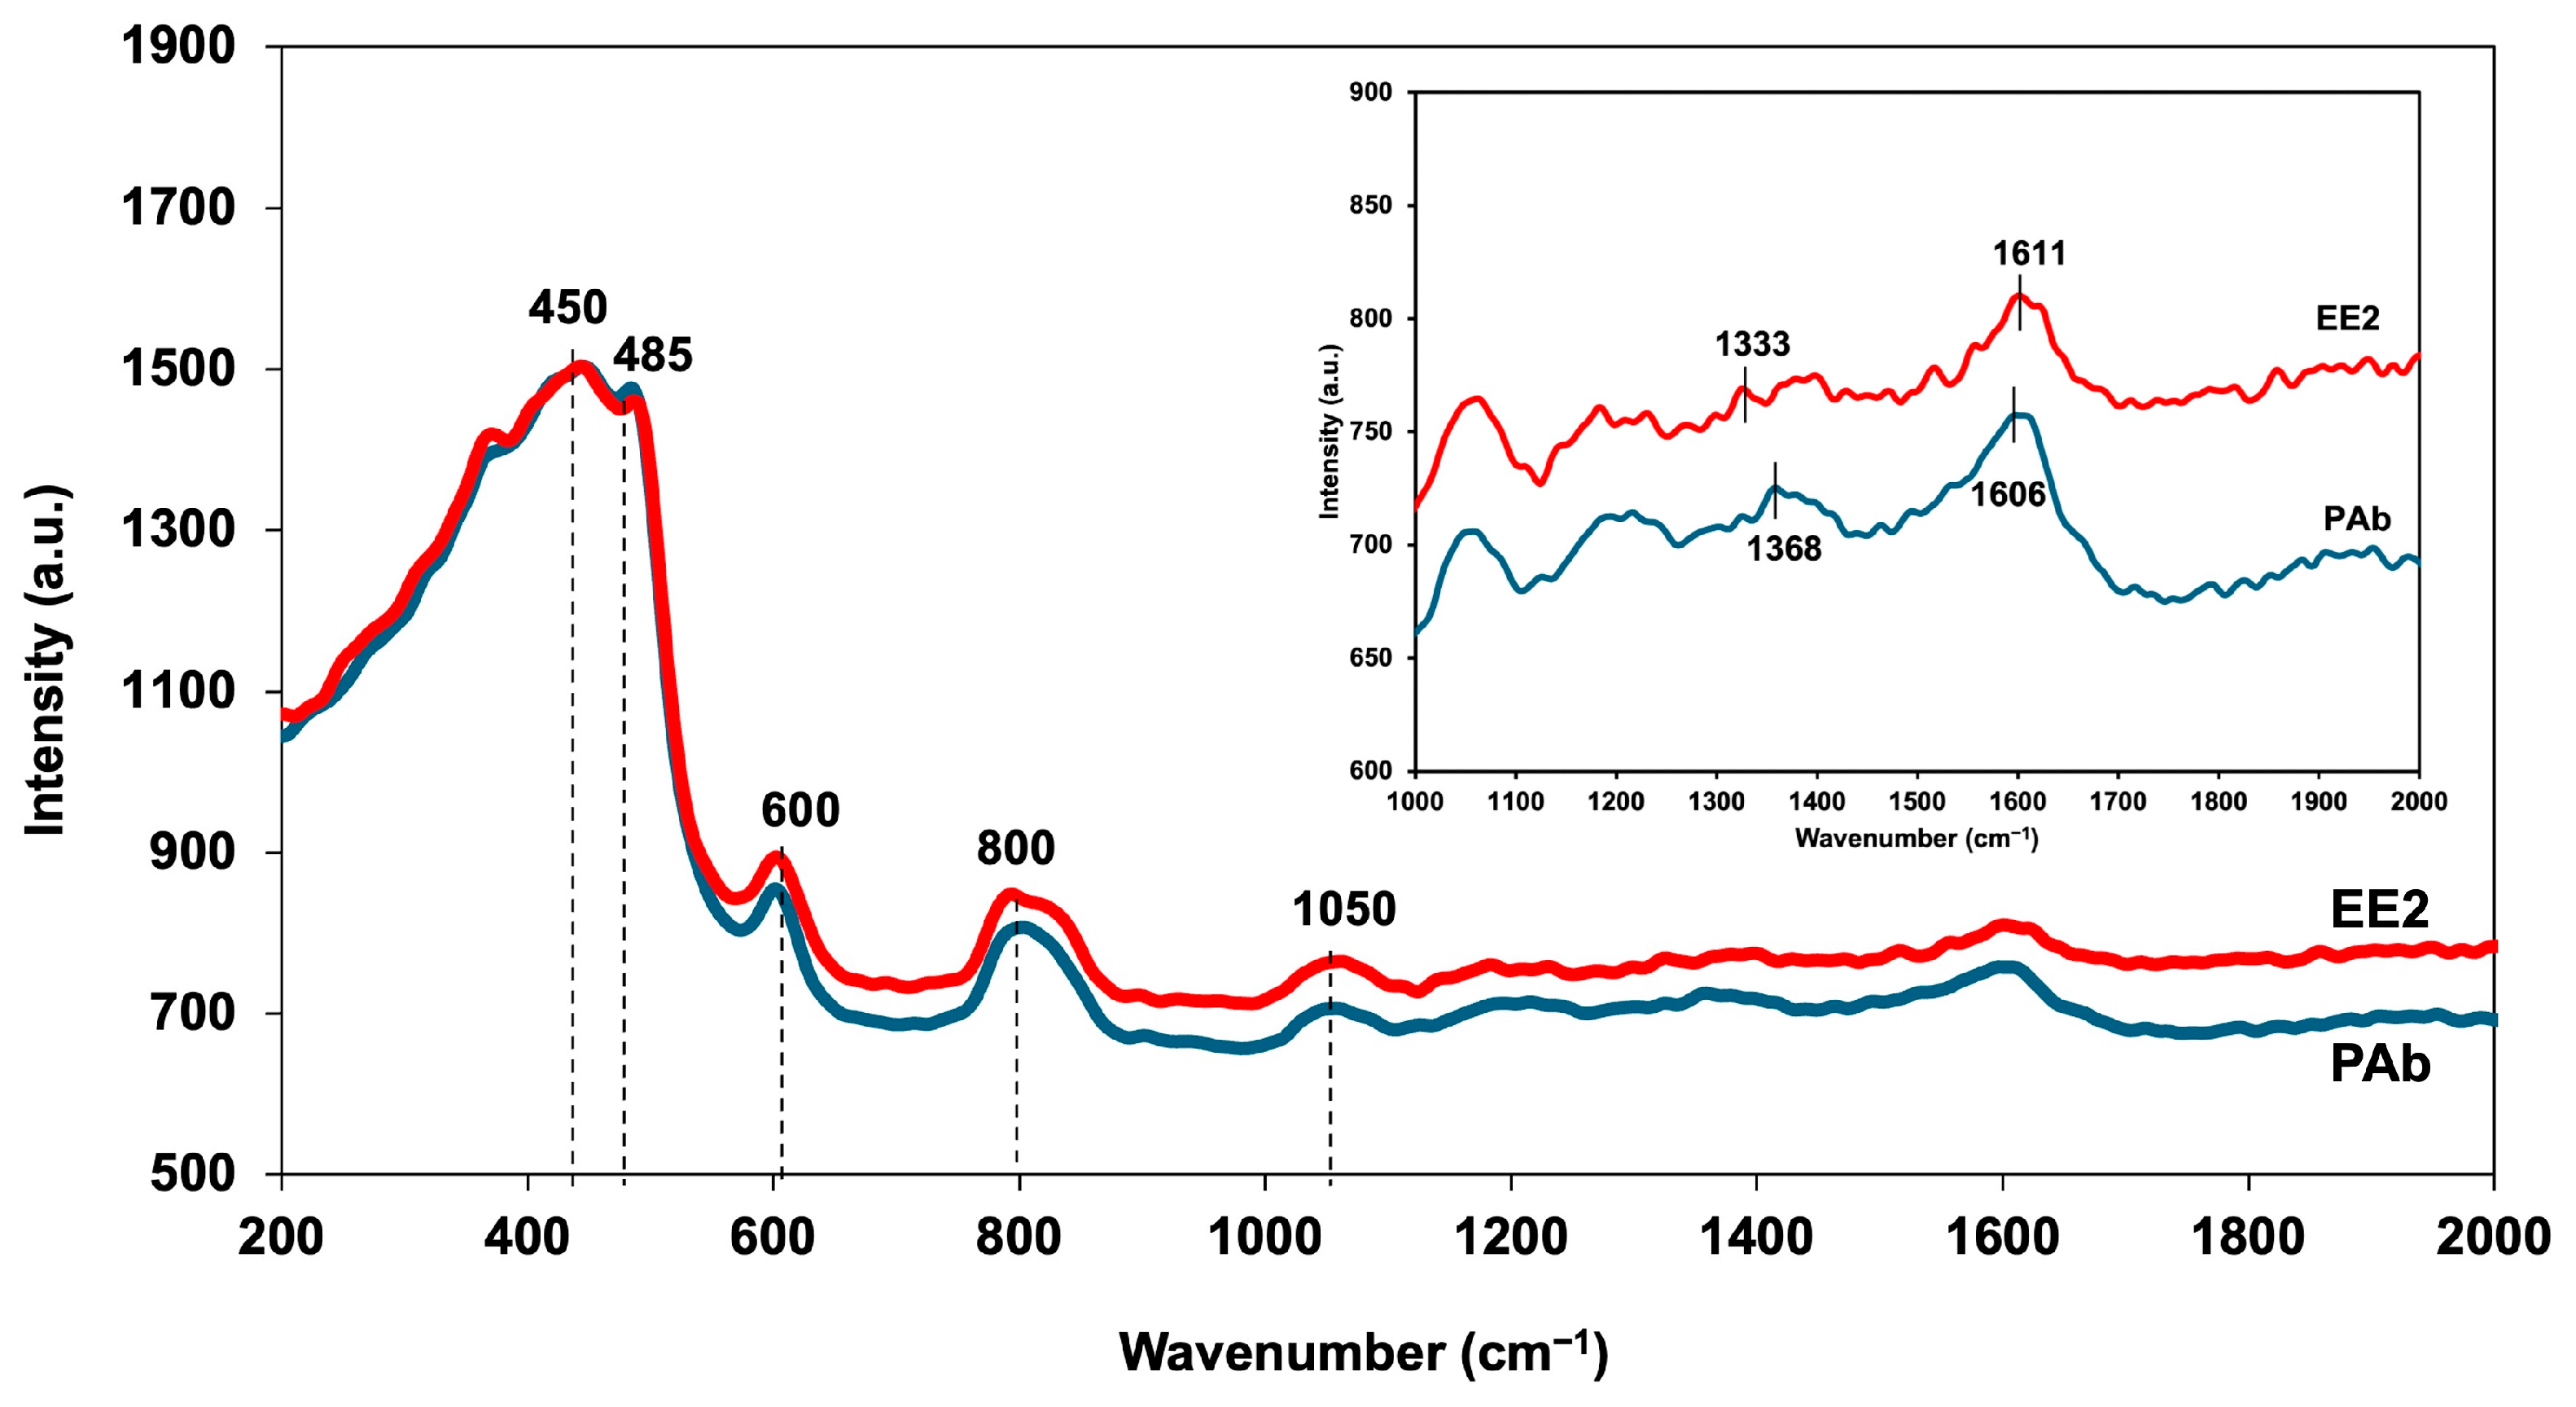
Raman spectroscopy analysis on CQD-TOF was performed to identify molecular changes after the introduction of EE2 polyclonal antibody (PAb) and EE2. Figure 9 displays the Raman spectra of PAb and the target analyte EE2 from 200 to 1600 cm−1. The bending vibration and symmetric stretching of the Si-O-Si linkage is associated with band peaks at 450, 485, 600, and 800 cm−1 [46,47,48]. The vibrational mode of C-H bonds was observed at the 800 cm−1 band peak [49], while the C-O stretching was identified at 1050 cm−1 peak [50]. Lastly, the N-H bending associated with C-N stretch deformation in the Amide II bond was detected at 1600 cm−1 [50]. The inset of Figure 8 shows an enlarged section of the spectra, highlighting the D- and G-bands from the earlier CQD deposition. Notably, the D-band peak shifted from 1368 to 1333 cm−1 and the G-band peak shifted from 1606 to 1611 cm−1, indicating a difference in the spectra before and after EE2 detection. Specifically, the D-band shifted to a shorter wavelength, while the G-band shifted to a longer wavelength. These shifts can be a result of chemical modifications, such as the increment of oxygen-containing functional groups on the sensing surface layer, which alter the carbon structure and its vibrational properties [51].

3.4. Selectivity of CQD-TOF

A selectivity test was conducted to evaluate the ability of the CQD-TOF sensor to selectively detect the target analyte, EE2, while disregarding other estrogen hormones. Figure 10 shows the wavelength shift differences for estrone (E1) and EE2, at 1 ng/L. For comparison, the wavelength shift in a methanol solution diluted in deionized water (MeOH + DI), which served as a blank for both E1 and EE2, was also measured. The results demonstrated that E1 exhibited a slight wavelength shift, comparable to that of the blank solution, suggesting the responses were due to non-specific binding. In contrast, the sensor response to EE2 showed the largest and most significant wavelength shift, indicating strong selectivity towards EE2. This high selectivity can be attributed to the strong affinity between EE2 and the immobilized antibodies on the sensing surface. Furthermore, the integration of CQDs provides more active sites, enhancing the interaction between antibodies and EE2.

3.5. Sensitivity of and Limit of Detection of CQD-TOF Sensor

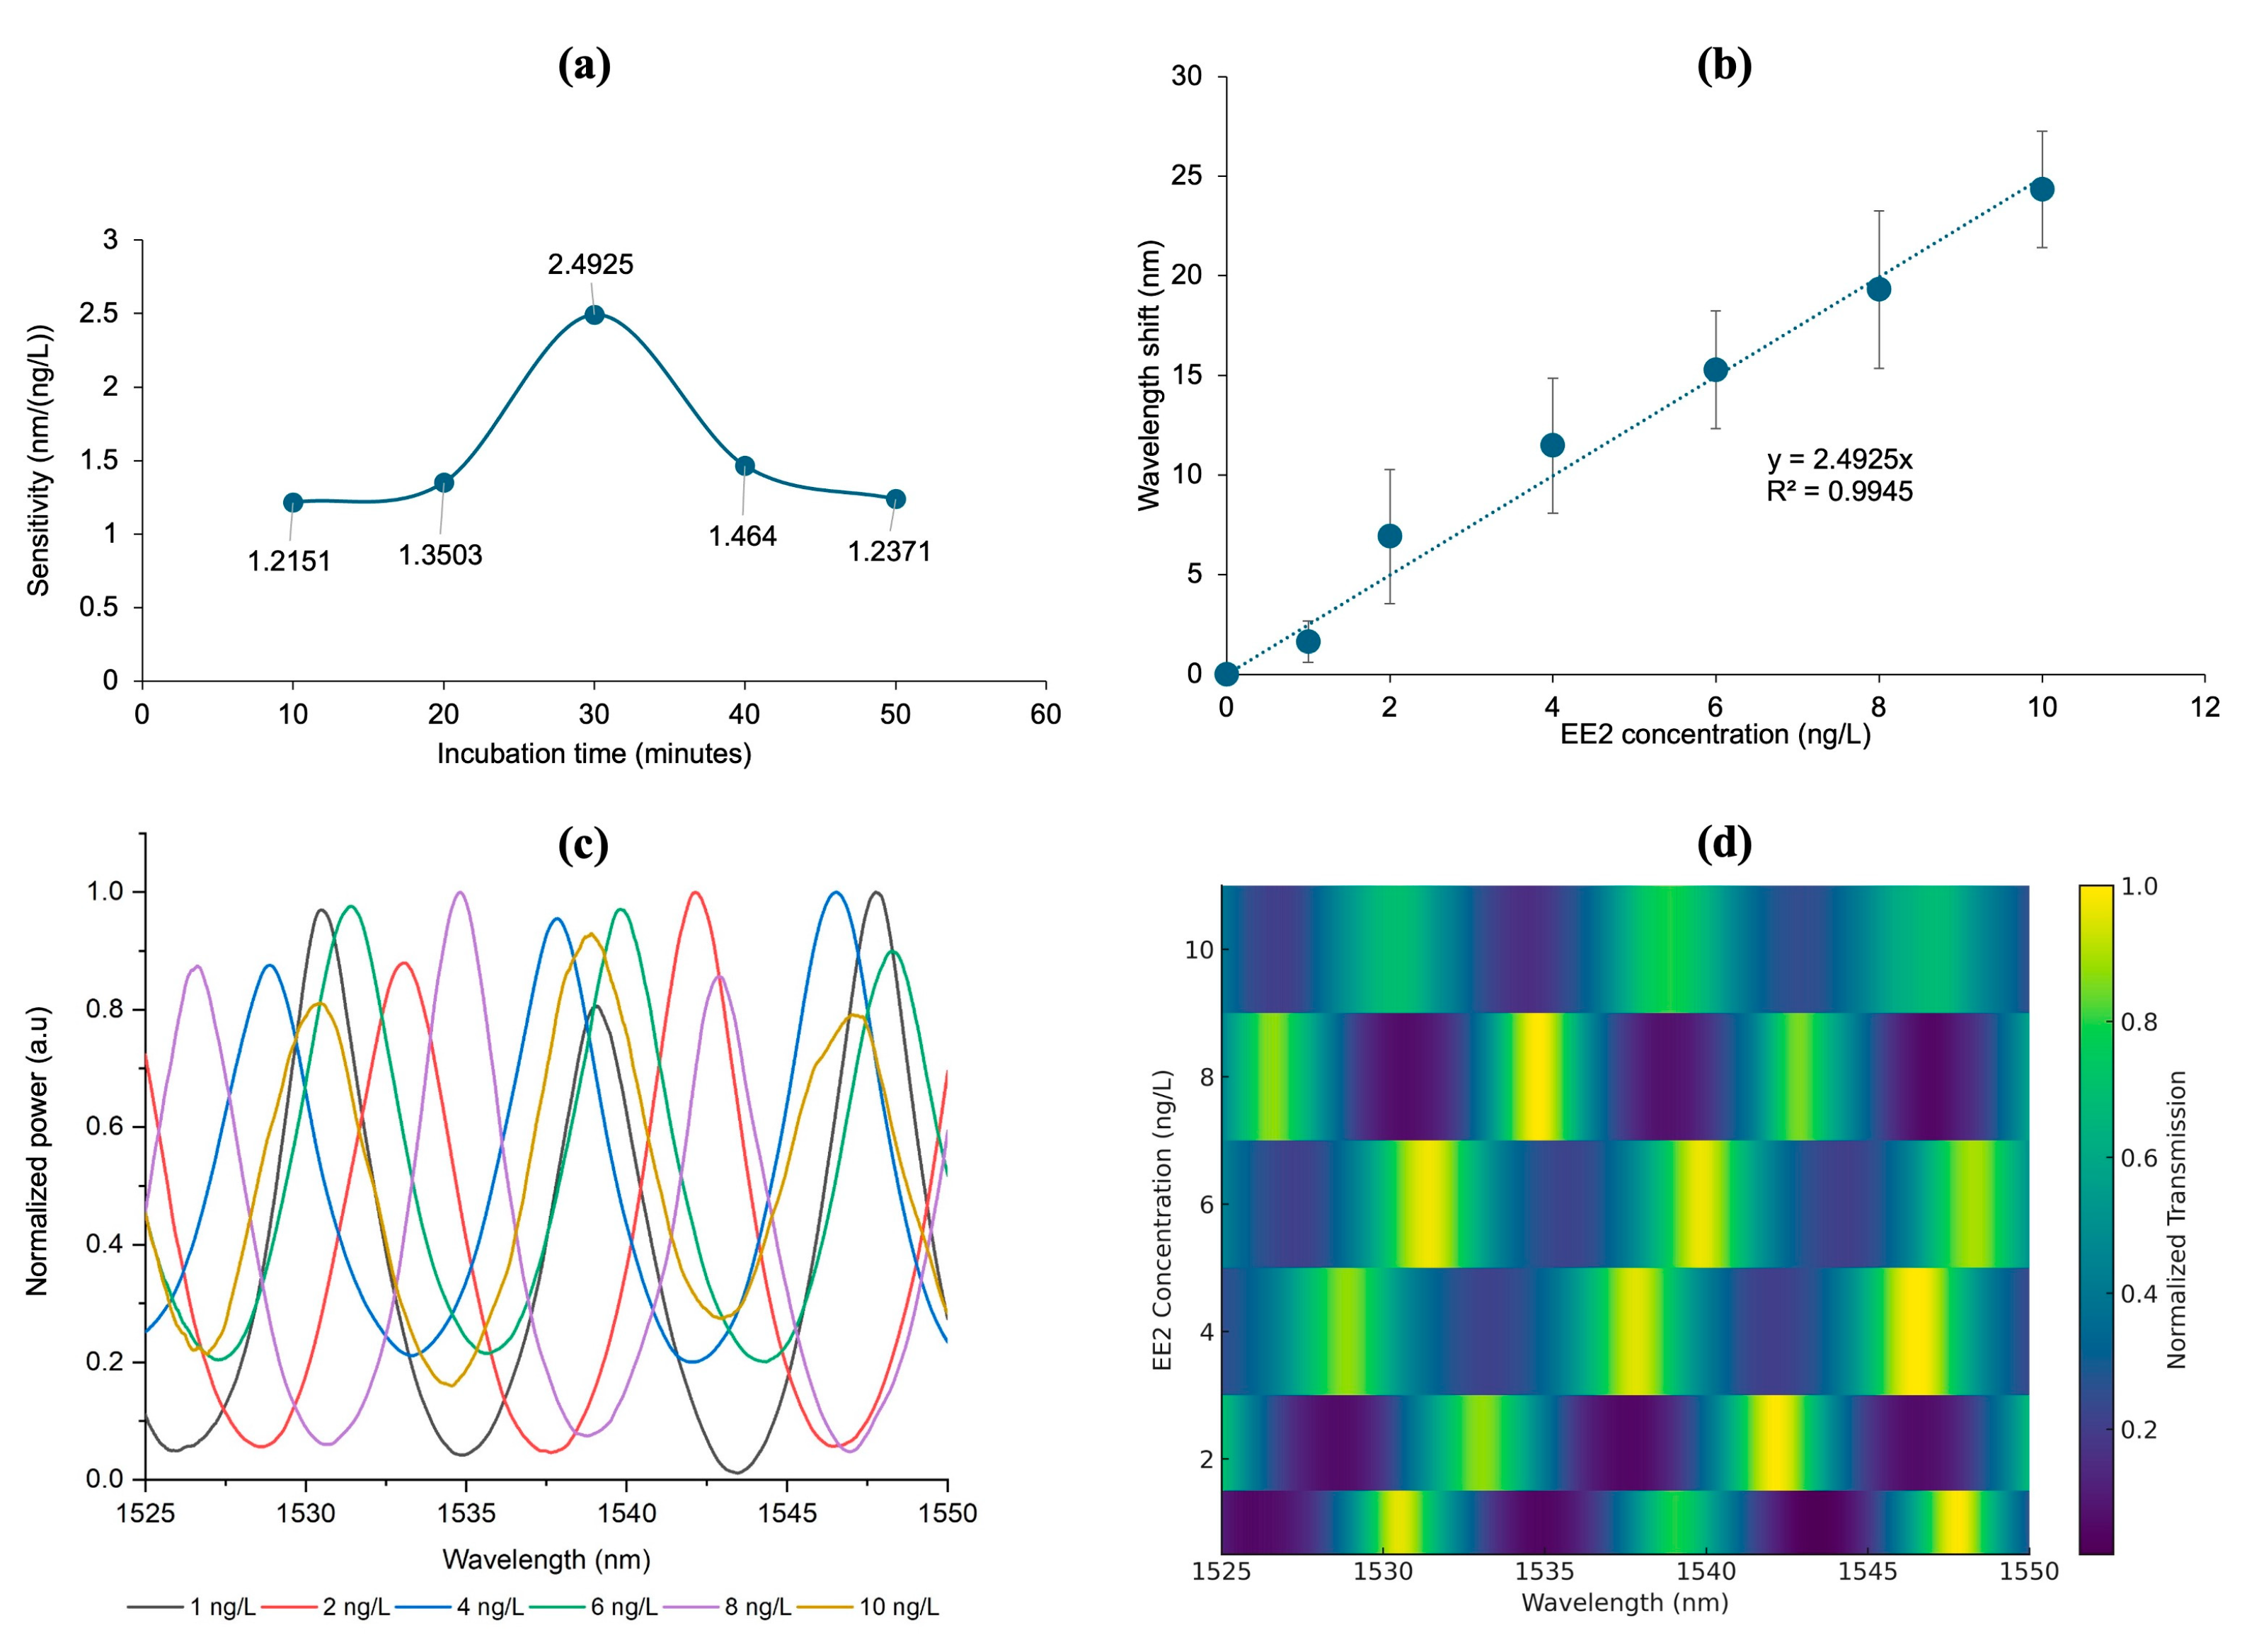
The sensitivity of the CQD-TOF sensor was evaluated by measuring the wavelength shift in the output spectrum when exposed to varying concentrations of EE2, ranging from 1 to 10 ng/L. Each concentration was tested on a newly fabricated CQD-TOF with different CQD layer thicknesses, controlled by immersion times of 10, 20, 30, 40, and 50 min. The wavelength shift for each concentration were measured for each incubation time. Sensitivity was determined by the gradient of the linear calibration curves reveal sensitivity of 1.2151 nm/(ng/L), 1.3503 nm/(ng/L), 2.4925 nm/(ng/L), 1.464 nm/(ng/L), and 1.2371 nm/(ng/L) for the immersion of 10, 20, 30, 40, and 50 min, respectively.
Figure 11a shows the relationship between the sensitivity of the CQD-TOF toward different immersion times. The figure reveals that the sensitivity was increased with immersion times of 10, 20, and 30 min, peaking at 2.4925 nm/(ng/L). However, sensitivity declined to 1.4640 and 1.2371 nm/(ng/L) after 40 and 50 min of immersion, respectively. This observation is consistent with previous studies, which have shown that increased surface roughness initially enhances sensitivity. However, excessive roughness and thickness may impede light interaction in the sensing zone, potentially reducing the sensor sensitivity [52,53,54].
Therefore, the 30-min incubation time was identified as the optimal incubation period, resulting the highest sensitivity at 2.4925 nm/(ng/L). To verify reproducibility under this optimized condition, triplicate measurements were performed using independently prepared samples. The resulting spectra showed consistent wavelength shifts, and the averaged values with standard deviations ±2.51 (Figure 11b). As shown in the figure, the wavelength shift increases linearly with the EE2 concentration in the range of 1–10 ng/L, with an excellent correlation coefficient (R2 = 0.9945). Figure 11c displays the overlaid normalized transmission spectra at different EE2 concentrations, qualitatively illustrating the interference fringes caused by refractive index changes from antibody–EE2 binding. However, the wavelength shift obtained to determine the sensor sensitivity were extracted from individual dips or peaks rather than directly from the overlapping curves. To provide a clearer visualization of this spectral evolution, Figure 11d shows the same data in a heatmap format (1525–1550 nm), where the spectra dips indicated by the darker intensity, and the peaks indicated by the lighter intensity.
Compared to our previous work using a non-coated TOF sensor [55], the integration of CQDs resulted in a significant enhancement in sensitivity. The CQD-TOF sensor exhibited a sensitivity of 2.4925 nm/(ng/L), approximately two-fold higher than the 1.0877 nm/(ng/L) achieved with the non-coated TOF configuration. This improvement can be attributed to the unique physicochemical properties of CQDs, which include a high surface-to-volume ratio and abundant surface functional groups. These characteristics facilitate more effective immobilization of antibodies and enhance the interaction between the target analyte (EE2) and the sensing surface.
The limit of detection (LOD) was calculated to determine the minimum measurable concentration of EE2 by the sensor. The LOD was obtained using the standard 3σ/S method [56], where σ is the standard deviation of the blank solution wavelength shift (σ = 0.0354), and S is the sensitivity of the sensor (S = 2.4925 nm/(ng/L)). This CQD-TOF sensor shows an LOD of 0.0426 ng/L, equivalent to 0.144 pM. This value is a significant improvement over our previous work using a standard TOF sensor, which exhibited an LOD of 1 ng/L [55]. The LOD obtained in this study is also comparable to other established research methods utilizing nanomaterials for EE2 detection. Table 2 presents a comparative overview of various nanomaterial-modified biosensors reported for EE2 detection. While the LOD achieved in this work is 0.0426 ng/L, it is not the lowest among reported methods. However, this value is highly competitive and comparable to other advanced sensing strategies using the electrochemical method. For instance, although one study reports an exceptionally low LOD of 0.07 pg/L using an EIS method with GO [31], most other methods report LODs in the ng/L to μg/L range, demonstrating that our sensor performs comparably with the majority of existing approaches. Moreover, the proposed CQD-TOF sensor achieves an LOD that meets the PNEC threshold of 0.1 ng/L, which is widely considered a benchmark for environmentally relevant EE2 detection. Although it does not surpass the more stringent Decision 2015/495/EU threshold of 0.035 ng/L, the current result represents a substantial step forward in the development of optical biosensors for EDC monitoring. The combination of competitive sensitivity, specificity, and the simplicity of the TOF design underscores the potential of this method for practical environmental monitoring applications.

3.6. Binding Affinity of CQD-TOF Sensor

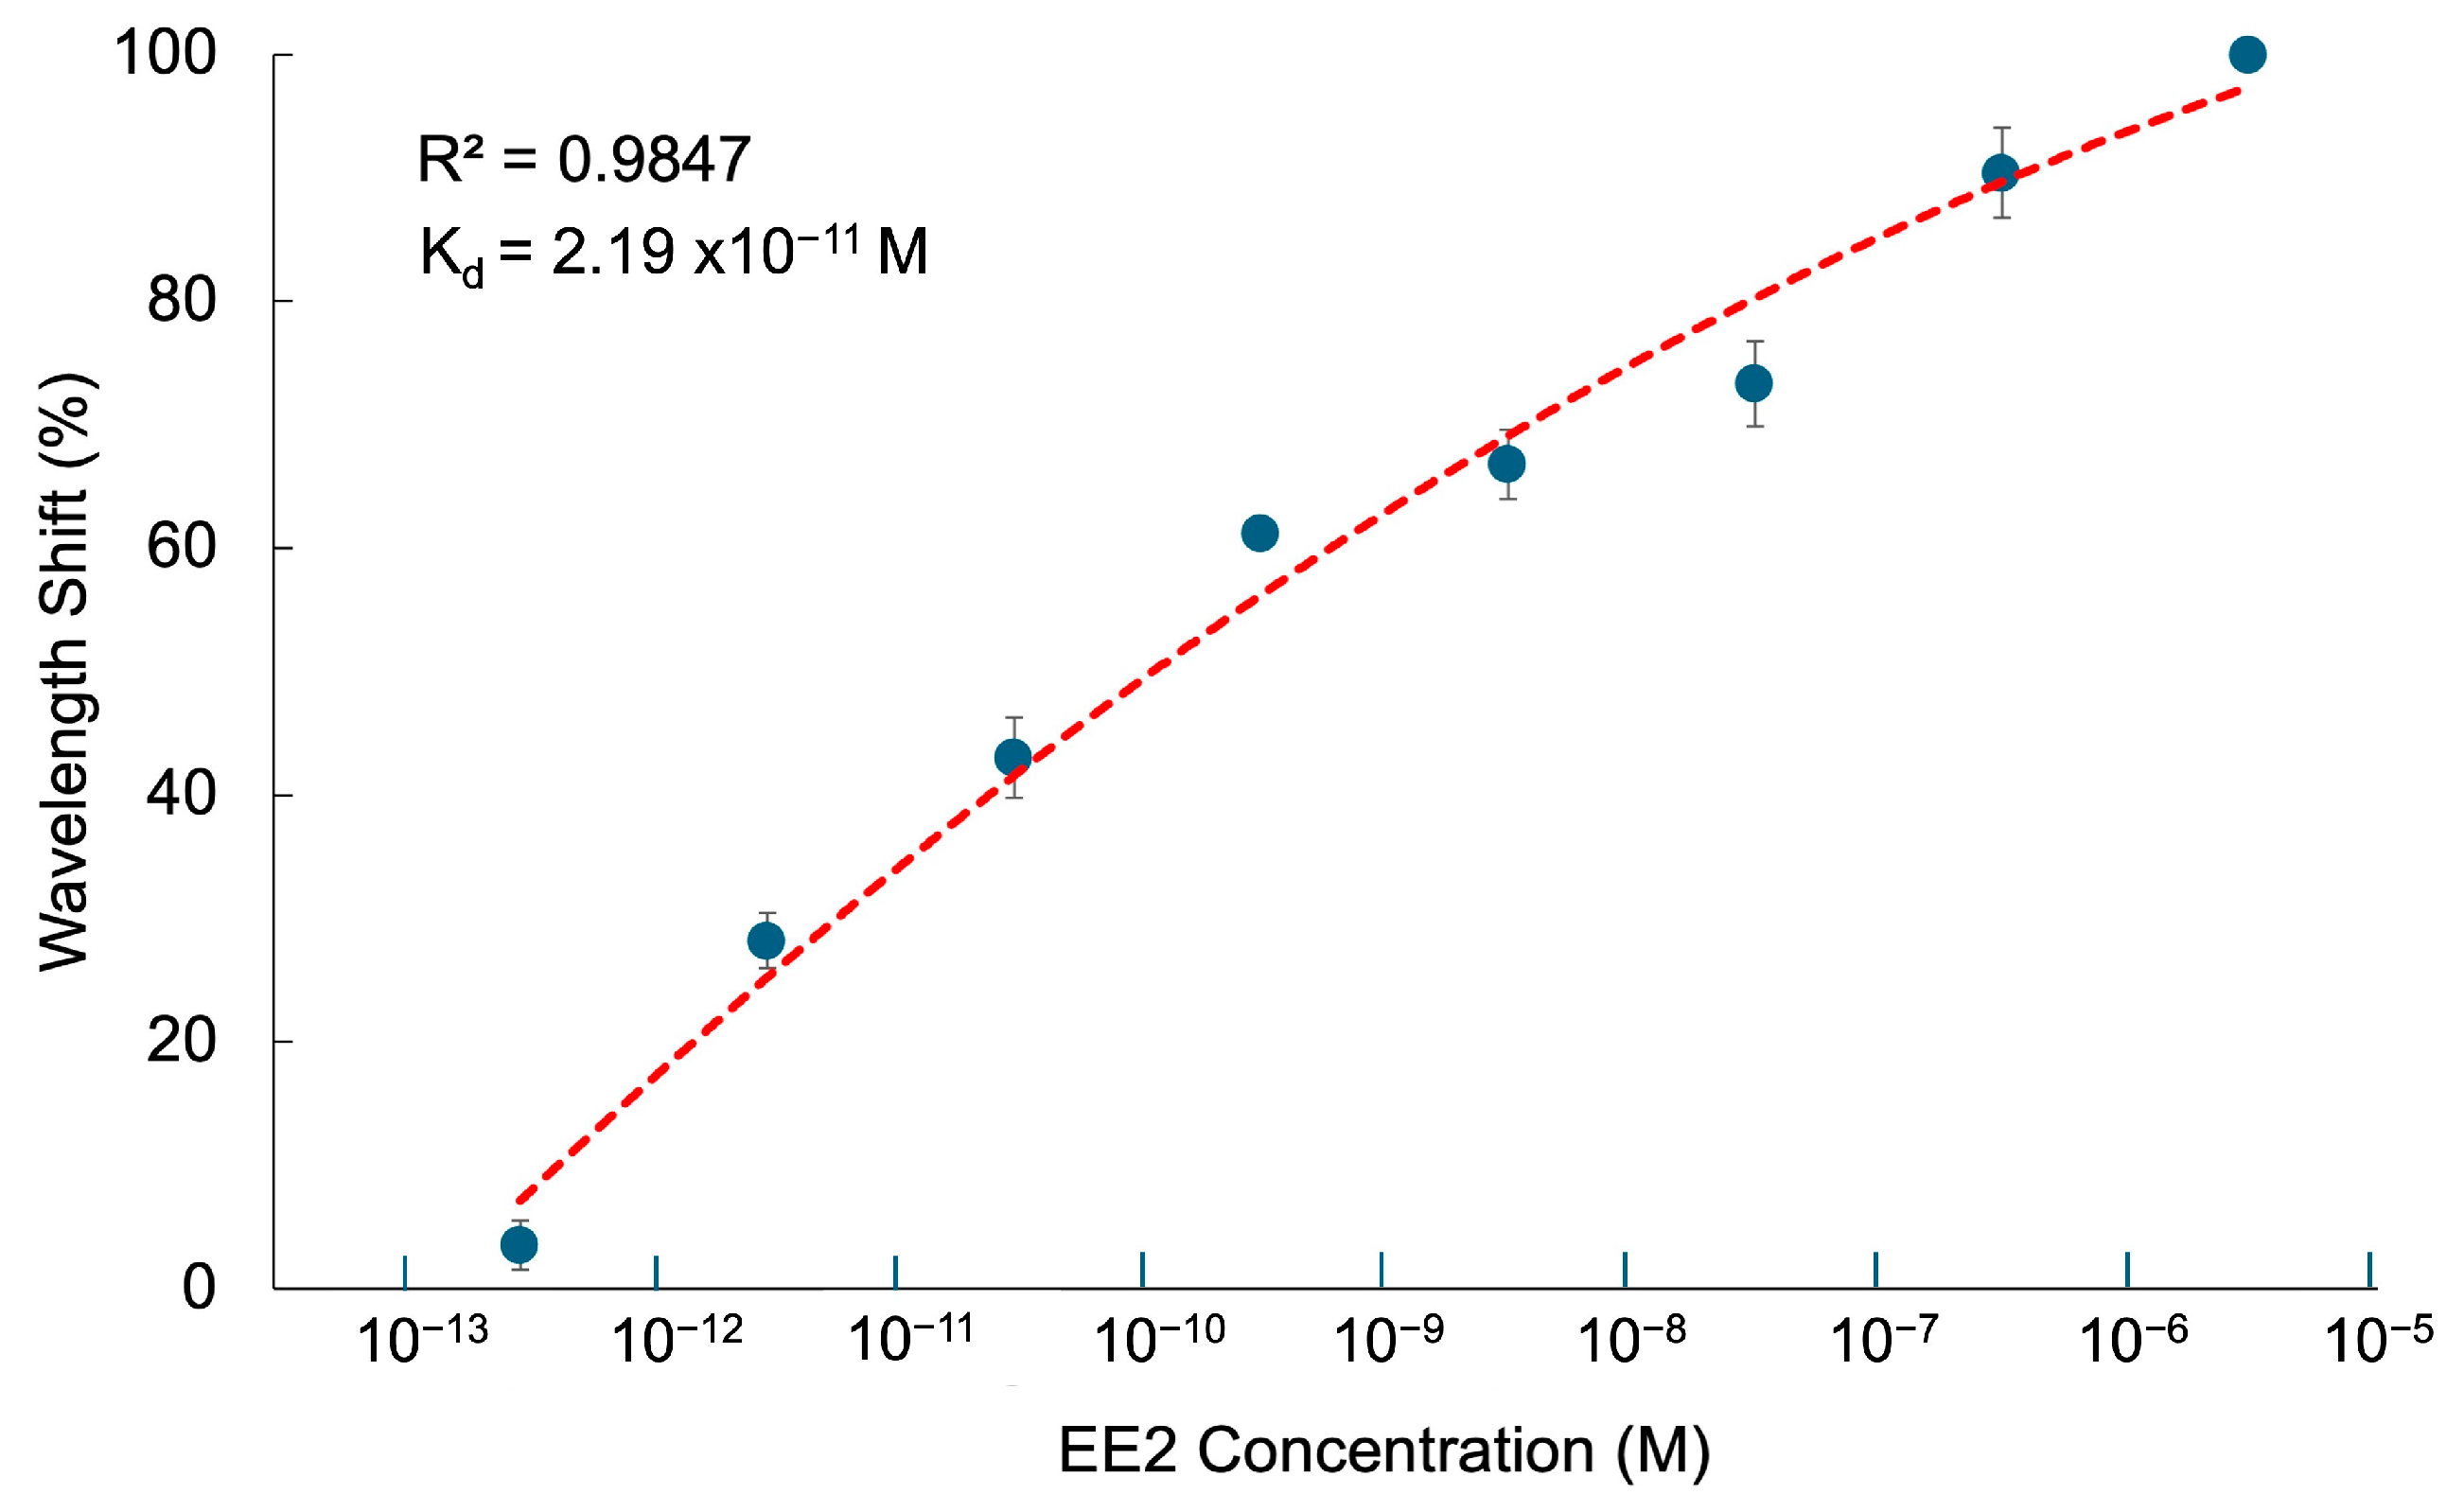
Using the optimized thickness of CQD-TOF, the relationship between output spectrum wavelength shift and EE2 concentrations ranging from 0.3374 pM to 3.374 μM (0.1 ng/L to 1.0 mg/L) was conducted to determine the binding affinity, as depicted in Figure 12. To determine the binding affinity between receptor and analyte, the data were fitted into the Langmuir adsorption isotherm equation as represented by [62]:
λ = λ m a x C K d + C
where λ denotes the wavelength shift caused by EE2 adsorption onto the CQD-TOF sensor, C is the EE2 concentration, λ m a x signifies the maximum wavelength shift, and K d is the equilibrium binding dissociation constant. The calculated K d was found to be 2.19 × 10⁻¹¹ M, with R2 = 0.9847. The lower K d value revealed that the CQD-TOF has a higher affinity towards EE2 compared to what was achieved without the integration of CQDs in [55]. The improvement is most likely due to the increment of surface area relative to the volume of CQDs, leading to a rise in the number of interaction sites and, consequently stronger binding affinity. This finding validates that integrating the CQDs on the TOF as an active sensing layer onto the TOF sensor is essential for improving EE2 detection.

4. Conclusions

In this study, a highly sensitive TOF sensor was developed by integrating CQDs to enhance EE2 detection. The incorporation of CQDs provided a larger surface sensing area, resulting in enhanced analyte interaction and improved sensor performance. With an optimized thickness CQDs layer obtained through a 30-min immersion process, the sensor achieved a sensitivity of 2.4925 nm/(ng/L) and a binding affinity of 2.19 × 10⁻¹¹ M. The sensor also exhibited excellent selectivity toward EE2, producing a distinct optical response compared to the negative control, E1. Furthermore, the sensor demonstrated a validated detection limit of 0.0426 ng/L, confirming its capability for trace-level EE2 monitoring. Overall, the CQDs modification significantly improved the TOF sensor’s sensitivity, selectivity, affinity, and detection limit, validating its potential for environmental biosensing application.

Author Contributions

Conceptualization, M.A.M. and Y.M.K.; methodology, A.Z.A. and Y.M.K.; validation, A.Z.A. and Y.M.K.; formal analysis, R.H., F.H.S. and E.K.N.; investigation, R.H.; resources, M.H.A.B. and M.T.A.; writing—original draft preparation, R.H.; writing—review and editing, M.A.M. and Y.M.K.; visualization, M.A.M.; supervision, M.A.M.; project administration, M.A.M.; funding acquisition, M.T.A. All authors have read and agreed to the published version of the manuscript.

Funding

This research was funded by the Ministry of Higher Education Malaysia under the Geran Putra Berimpak (GP-GPB/2022/9732200) and the King Saud University, Kingdom of Saudi Arabia, under the Ongoing Research Funding Program (ORF-2025-336).

Institutional Review Board Statement

Not applicable.

Informed Consent Statement

Not applicable.

Data Availability Statement

The original contributions presented in the study are included in the article, further inquiries can be directed to the corresponding authors.

Conflicts of Interest

The authors declare no conflicts of interest.

References

  1. Zheng, D.; Pisano, F.; Collard, L.; Balena, A.; Pisanello, M.; Spagnolo, B.; Mach-Batlle, R.; Tantussi, F.; Carbone, L.; De Angelis, F.; et al. Toward Plasmonic Neural Probes: SERS Detection of Neurotransmitters through Gold-Nanoislands-Decorated Tapered Optical Fibers with Sub-10 nm Gaps. Adv. Mater. 2023, 35, 2200902. [Google Scholar] [CrossRef]
  2. Zheng, D.; Kashif, M.F.; Piscopo, L.; Collard, L.; Ciracì, C.; De Vittorio, M.; Pisanello, F. Tunable Nanoislands Decorated Tapered Optical Fibers Reveal Concurrent Contributions in Through-Fiber SERS Detection. ACS Photonics 2024, 11, 3774–3783. [Google Scholar] [CrossRef]
  3. Polokhin, A.A.; Shaman, Y.P.; Itrin, P.A.; Panyaev, I.S.; Sysa, A.A.; Selishchev, S.V.; Kitsyuk, E.P.; Pavlov, A.A.; Gerasimenko, A.Y. Tapered Optical Fiber Sensor Coated with Single-Walled Carbon Nanotubes for Dye Sensing Application. Micromachines 2023, 14, 579. [Google Scholar] [CrossRef]
  4. Puspita, I.; Irawati, N.; Madurani, K.A.; Kurniawan, F.; Koentjoro, S.; Hatta, A.M. Graphene- and Multi-Walled Carbon Nanotubes-Coated Tapered Plastic Optical Fiber for Detection of Lard Adulteration in Olive Oil. Photonic Sens. 2022, 12, 220411. [Google Scholar] [CrossRef]
  5. Liu, J.; Li, R.; Yang, B. Carbon Dots: A New Type of Carbon-Based Nanomaterial with Wide Applications. 2020. Available online: https://pubs.acs.org/doi/pdf/10.1021/acscentsci.0c01306?ref=article_openPDF (accessed on 1 November 2022).
  6. Khalaf, A.L.; Abdallah, A.; Shabaneh, A. Carbon Nanotubes and Graphene Oxide Applications in Optochemical Sensors; Elsevier Inc.: Amsterdam, The Netherlands, 2019. [Google Scholar] [CrossRef]
  7. Hui, S.; Yap, K.; Chan, K.K.; Zhang, G.; Tjin, S.C.; Yong, K. Carbon Dot-functionalized Interferometric Optical Fiber Sensor for Detection of Ferric Ions in Biological Samples. ACS Appl. Mater. Interfaces 2019, 11, 28546–28553. [Google Scholar] [CrossRef] [PubMed]
  8. Abd Rani, U.; Ng, L.Y.; Ng, C.Y.; Mahmoudi, E. A Review of Carbon Quantum Dots and Their Applications in Wastewater Treatment; Elsevier: Amsterdam, The Netherlands, 2020. [Google Scholar] [CrossRef]
  9. Omar, N.A.S.; Fen, Y.W.; Irmawati, R.; Hashim, H.S.; Ramdzan, N.S.M.; Fauzi, N.I.M. A Review on Carbon Dots: Synthesis, Characterization and Its Application in Optical Sensor for Environmental Monitoring. Nanomaterials 2022, 12, 2365. [Google Scholar] [CrossRef] [PubMed]
  10. Pudza, M.Y.; Abidin, Z.Z.; Abdul-Rashid, S.; Yassin, F.M.; Noor, A.S.; Abdullah, M. Synthesis and Characterization of Fluorescent Carbon Dots from Tapioca. ChemistrySelect 2019, 4, 4140–4146. [Google Scholar] [CrossRef]
  11. Sciortino, A.; Cannizzo, A.; Messina, F. Carbon Nanodots: A Review—From the Current Understanding of the Fundamental Photophysics to the Full Control of the Optical Response. C 2018, 4, 67. [Google Scholar] [CrossRef]
  12. Pramanik, A.; Biswas, S.; Kumbhakar, P. Solvatochromism in highly luminescent environmental friendly carbon quantum dots for sensing applications: Conversion of bio-waste into bio-asset. Spectrochim. Acta A Mol. Biomol. Spectrosc. 2018, 191, 498–512. [Google Scholar] [CrossRef]
  13. Nazri, N.A.; Azeman, N.H.; Bakar, M.H.; Mobarak, N.N.; Masran, A.S.; Zain, A.R.; Mahdi, M.A.; Saputro, A.G.; Wung, T.D.; Luo, Y.; et al. Polymeric carbon quantum dots as efficient chlorophyll sensor-analysis based on experimental and computational investigation. Opt. Laser Technol. 2024, 170, 110259. [Google Scholar] [CrossRef]
  14. Zainuddin, N.H.; Chee, H.Y.; Rashid, S.A.; Ahmad, M.Z.; Bakar, M.H.; Mahdi, M.A.; Yaacob, M.H. Carbon quantum dots functionalized tapered optical fiber for highly sensitive and specific detection of Leptospira DNA. Opt. Laser Technol. 2023, 157, 108696. [Google Scholar] [CrossRef]
  15. Zainuddin, N.H.; Chee, H.Y.; Ahmad, M.Z.; Mahdi, M.A.; Bakar, M.H.A.; Yaacob, M.H. Sensitive Leptospira DNA detection using tapered optical fiber sensor. J. Biophotonics 2018, 11, e201700363. [Google Scholar] [CrossRef]
  16. Liu, J.; Wang, R.; Huang, B.; Lin, C.; Zhou, J.; Pan, X. Biological effects and bioaccumulation of steroidal and phenolic endocrine disrupting chemicals in high-back crucian carp exposed to wastewater treatment plant effluents. Environ. Pollut. 2012, 162, 325–331. [Google Scholar] [CrossRef]
  17. Niu, C.; Zhang, C.; Liu, J. Capture-SELEX of DNA Aptamers for Estradiol Specifically and Estrogenic Compounds Collectively. Environ. Sci. Technol. 2022, 56, 17702–17711. [Google Scholar] [CrossRef]
  18. Jackson, L.M.; Klerks, P.L. Impact of Long-Term Exposure to 17A-Ethinylestradiol in the Live-Bearing Fish Heterandria formosa. Arch Environ. Contam. Toxicol. 2019, 77, 51–61. [Google Scholar] [CrossRef]
  19. Caldwell, D.J.; Mastrocco, F.; Anderson, P.D.; Länge, R.; Sumpter, J.P. Predicted-no-effect concentrations for the steroid estrogens estrone, 17β-estradiol, estriol, and 17α-ethinylestradiol. Environ. Toxicol. Chem. 2012, 31, 1396–1406. [Google Scholar] [CrossRef] [PubMed]
  20. Sousa, J.C.; Ribeiro, A.R.; Barbosa, M.O.; Ribeiro, C.; Tiritan, M.E.; Pereira, M.F.; Silva, A.M. Monitoring of the 17 EU Watch List contaminants of emerging concern in the Ave and the Sousa Rivers. Sci. Total Environ. 2019, 649, 1083–1095. [Google Scholar] [CrossRef] [PubMed]
  21. Klaic, M.; Jirsa, F. 17α-Ethinylestradiol (EE2): Concentrations in the environment and methods for wastewater treatment—An update. R. Soc. Chem. 2022, 12, 12794–12805. [Google Scholar] [CrossRef]
  22. Zhang, C.; Li, Y.; Wang, C.; Niu, L.; Cai, W. Occurrence of endocrine disrupting compounds in aqueous environment and their bacterial degradation: A review. Crit. Rev. Environ. Sci. Technol. 2016, 46, 1–59. [Google Scholar] [CrossRef]
  23. Patrícia, C.; Lima, D.L.D.; Schneider, R.J.; Otero, M.; Esteves, V.I. Development of ELISA methodologies for the direct determination of 17 b-estradiol and 17 a-ethinylestradiol in complex aqueous matrices. J. Environ. Manag. 2013, 124, 121–127. [Google Scholar] [CrossRef]
  24. Uraipong, C.; Allan, R.D.; Li, C.; Kennedy, I.R.; Wong, V.; Alice, N. A survey of 17α-ethinylestradiol and mestranol residues in Hawkesbury River, Australia, using a highly specific enzyme-linked immunosorbent assay (ELISA) demonstrates the levels of potential biological significance. Ecotoxicol Environ. Saf. 2017, 144, 585–592. [Google Scholar] [CrossRef]
  25. Schneider, C.; Schöler, H.F.; Schneider, R.J. Direct sub-ppt detection of the endocrine disruptor ethinylestradiol in water with a chemiluminescence enzyme-linked immunosorbent assay. Anal Chim Acta 2005, 551, 92–97. [Google Scholar] [CrossRef]
  26. Schneider, C.; Schöler, H.F.; Schneider, R.J. A novel enzyme-linked immunosorbent assay for ethynylestradiol using a long-chain biotinylated EE2 derivative. Steroids 2004, 69, 245–253. [Google Scholar] [CrossRef] [PubMed]
  27. Gusmaroli, L.; Insa, S.; Petrovic, M. Development of an online SPE-UHPLC-MS/MS method for the multiresidue analysis of the 17 compounds from the EU B Watch list. Anal Bioanal. Chem. 2018, 410, 4165–4176. [Google Scholar] [CrossRef] [PubMed]
  28. Schoeman, C.; Cukrowska, E.; Chimuka, L. Determination of estrogen hormones in raw and treated water samples by reverse phase ultra-fast liquid chromatography mass spectrometry—A case study in Johannesburg South, South Africa. Water SA 2018, 44, 111–117. [Google Scholar]
  29. Honda, L.; Becerra-Herrera, M.; Richter, P. Liquid chromatography–time-of-flight high-resolution mass spectrometry study and determination of the dansylated products of estrogens and their hydroxylated metabolites in water and wastewater. Anal Bioanal. Chem. 2018, 410, 7909–7919. [Google Scholar] [CrossRef]
  30. Scala-Benuzzi, M.L.; Soler-Illia, G.J.; Raba, J.; Battaglini, F.; Schneider, R.J.; Pereira, S.V.; Messina, G. Immunosensor based on porous gold and reduced graphene platform for the determination of EE2 by electrochemical impedance spectroscopy. J. Electroanal. Chem. 2021, 897, 115604. [Google Scholar] [CrossRef]
  31. Barton, H.; Berbel-Filho, W.M.; Consuegra, S.; Francis, L.; Tizaoui, C.; Conlan, R.S.; Teixeira, S.R. Ultrasensitive environmental assessment of xeno-estrogens in water samples using label-free graphene immunosensors. Anal Biochem. 2018, 548, 102–108. [Google Scholar] [CrossRef]
  32. Pavinatto, A.; Mercante, L.A.; Facure, M.H.; Pena, R.B.; Sanfelice, R.C.; Mattoso, L.H.; Correa, D.S. Ultrasensitive biosensor based on polyvinylpyrrolidone/chitosan/reduced graphene oxide electrospun nanofibers for 17α -ethinylestradiol electrochemical detection. Appl. Surf. Sci. 2018, 458, 431–437. [Google Scholar] [CrossRef]
  33. Kamil, Y.M.; Bakar, M.A.; Mustapa, M.A.; Yaacob, M.H.; Abidin, N.H.; Syahir, A.; Lee, H.J.; Mahdi, M.A. Label-free Dengue E protein detection using a functionalized tapered optical fiber sensor. Sens. Actuators B Chem. 2018, 257, 820–828. [Google Scholar] [CrossRef]
  34. Issa, M.A.; Abidin, Z.Z.; Sobri, S.; Abdul-Rashid, S.; Mahdi, M.A.; Ibrahim, N.A.; Pudza, M.Y. Fabrication, characterization and response surface method optimization for quantum efficiency of fluorescent nitrogen-doped carbon dots obtained from carboxymethylcellulose of oil palms empty fruit bunch. Chin. J. Chem. Eng. 2020, 28, 584–592. [Google Scholar] [CrossRef]
  35. Kamil, Y.M.; Bakar, M.H.; Yaacob, M.H.; Syahir, A.; Lim, H.N.; Mahdi, M.A. Dengue e Protein Detection Using a Graphene Oxide Integrated Tapered Optical Fiber Sensor. IEEE J. Sel. Top. Quantum Electron. 2019, 25, 1–8. [Google Scholar] [CrossRef]
  36. Mustapha Kamil, Y.; Al-Rekabi, S.H.; Yaacob, M.H.; Syahir, A.; Chee, H.Y.; Mahdi, M.A.; Abu Bakar, M.H. Detection of dengue using PAMAM dendrimer integrated tapered optical fiber sensor. Sci. Rep. 2019, 9, 13483. [Google Scholar] [CrossRef] [PubMed]
  37. Singh, A.; Mohapatra, P.K.; Kalyanasundaram, D.; Kumar, S. Self-functionalized ultrastable water suspension of luminescent carbon quantum dots. Mater. Chem. Phys. 2019, 225, 23–27. [Google Scholar] [CrossRef]
  38. Aghamali, A.; Khosravi, M.; Hamishehkar, H.; Modirshahla, N.; Behnajady, M.A. Synthesis and characterization of high efficient photoluminescent sunlight driven photocatalyst of N-Carbon Quantum Dots. J. Lumin. 2018, 201, 265–274. [Google Scholar] [CrossRef]
  39. Yuan, F.; Yuan, T.; Sui, L.; Wang, Z.; Xi, Z.; Li, Y.; Li, X.; Fan, L.; Tan, Z.A.; Chen, A.; et al. Engineering triangular carbon quantum dots with unprecedented narrow bandwidth emission for multicolored LEDs. Nat. Commun. 2018, 9, 2249. [Google Scholar] [CrossRef]
  40. Wang, Y.; Hu, A. Carbon quantum dots: Synthesis, properties and applications. J. Mater. Chem. C Mater. 2014, 2, 6921–6939. [Google Scholar] [CrossRef]
  41. Zhang, Q.; Wang, R.; Feng, B.; Zhong, X.; Ostrikov, K. Photoluminescence mechanism of carbon dots: Triggering high-color-purity red fluorescence emission through edge amino protonation. Nat. Commun. 2021, 12, 6856. [Google Scholar] [CrossRef]
  42. Gaddam, R.R.; Vasudevan, D.; Narayan, R.; Raju, K.V. Controllable synthesis of biosourced blue-green fluorescent carbon dots from camphor for the detection of heavy metal ions in water. RSC Adv. 2014, 4, 57137–57143. [Google Scholar] [CrossRef]
  43. Sun, R.; Liu, S. Synthesis of photoluminescent carbon dots and its effect on chondrocytes for knee joint therapy applications. Artif. Cells Nanomed. Biotechnol. 2019, 47, 1321–1325. [Google Scholar] [CrossRef] [PubMed]
  44. Das, T.; Saikia, B.K.; Dekaboruah, H.P.; Bordoloi, M.; Neog, D.; Bora, J.J.; Lahkar, J.; Narzary, B.; Roy, S.; Ramaiah, D. Blue-fluorescent and biocompatible carbon dots derived from abundant low-quality coals. J. Photochem. Photobiol. B 2019, 195, 1–11. [Google Scholar] [CrossRef]
  45. Mohsin, A.Z.; Sukor, R.; Mustapha-Kamil, Y.; Shatar, L.; Selamat, J.; Meor-Hussin, A.S.; Ismail, I.H.; Mahdi, M.A. Sensitive Detection of Goat αs1-Casein Using Tapered Optical Fiber Sensor. IEEE J. Sel. Top. Quantum Electron. 2021, 27, 1–7. [Google Scholar] [CrossRef]
  46. Manghnani, M.H.; Hushur, A.; Sekine, T.; Wu, J.; Stebbins, J.F.; Williams, Q. Raman, Brillouin, and nuclear magnetic resonance spectroscopic studies on shocked borosilicate glass. J. Appl. Phys. 2011, 109, 2346. [Google Scholar] [CrossRef]
  47. Wang, M.; Cheng, J.; Li, M.; He, F. Raman spectra of soda-lime-silicate glass doped with rare earth. Physica B Condens. Matter. 2011, 406, 3865–3869. [Google Scholar] [CrossRef]
  48. Fesenko, O.; Dovbeshko, G.; Dementjev, A.; Karpicz, R.; Kaplas, T.; Svirko, Y. Graphene-enhanced Raman spectroscopy of thymine adsorbed on single-layer graphene. Nanoscale Res. Lett. 2015, 10, 163. [Google Scholar] [CrossRef] [PubMed]
  49. Long, B.T.V.; Huege, F.R. The Laser-Raman Spectrum of Ferrocene. Chem. Commun. 1968, 20, 1239–1241. [Google Scholar] [CrossRef]
  50. Aksoy, C.; Severcan, F. Role of vibrational spectroscopy in stem cell research. Spectroscopy 2012, 27, 167–184. [Google Scholar] [CrossRef]
  51. Cheruku, R.; Bhaskaram, D.S.; Govindaraj, G. Variable range hopping and relaxation mechanism in graphene oxide sheets containing sp3 hybridization induced localization. J. Mater. Sci. Mater. Electron. 2018, 29, 9663–9672. [Google Scholar] [CrossRef]
  52. Qazi, H.H.; Memon, S.F.; Ali, M.M.; Irshad, M.S.; Ehsan, S.A.; Salim, M.R.; Mohammad, A.B.; Zulkifli, M.Z.; Idrees, M. Surface roughness and the sensitivity of D-shaped optical fibre sensors. J. Mod. Opt. 2019, 66, 1244–1251. [Google Scholar] [CrossRef]
  53. Zhong, N.; Zhu, X.; Liao, Q.; Wang, Y.; Chen, R.; Sun, Y. Effects of surface roughness on optical properties and sensitivity of fiber-optic evanescent wave sensors. Appl Opt. 2013, 52, 3937–3945. [Google Scholar] [CrossRef]
  54. Śmietana, M.; Dudek, M.; Koba, M.; Michalak, B. Influence of diamond-like carbon overlay properties on refractive index sensitivity of nano-coated optical fibres. Phys. Status Solidi (A) Appl. Mater. Sci. 2013, 210, 2100–2105. [Google Scholar] [CrossRef]
  55. Hamid, R.; Kamil, Y.M.; Aris, A.Z.; Bakar, M.H.; Suhailin, F.H.; Alresheedi, M.T.; Ng, E.K.; Mahdi, M.A. Detection of 17-α-Ethinylestradiol with Bio-Functionalized Tapered Optical Fiber Sensor. Measurement 2024, 238, 115305. [Google Scholar] [CrossRef]
  56. Semwal, V.; Gupta, B.D. Highly selective SPR-based fiber optic sensor for the detection of hydrogen peroxide. Sens. Actuators B Chem. 2021, 329, 129062. [Google Scholar] [CrossRef]
  57. Nodehi, M.; Baghayeri, M.; Ansari, R.; Veisi, H. Electrochemical quantification of 17 α–Ethinylestradiol in biological samples using a Au/Fe3O4 @ TA/MWNT/GCE sensor. Mater. Chem. Phys. 2020, 244, 122687. [Google Scholar] [CrossRef]
  58. Monteiro, M.D.; Sant’Anna, M.V.; Santos Junior, J.C.; Macedo, J.F.; Alves, A.A.; de Oliveira, S.; Silva, J.; Gimenez, I.F.; Midori Sussuchi, E. Reduced Graphene Oxide-based Sensor for 17α-Ehinylestradiol Voltammetric Determination in Wastewater, Tablets and Synthetic Urine Samples. Electroanalysis 2022, 34, 1422–1430. [Google Scholar] [CrossRef]
  59. Braga, G.B.; Oliveira, A.E.; Pereira, A.C. Total Determination of Estrogenic Phenolic Compounds in River Water Using a Sensor Based on Reduced Graphene Oxide and Molecularly Imprinted Polymer. Electroanalysis 2018, 30, 2176–2184. [Google Scholar] [CrossRef]
  60. Canevari, T.D.; Cincotto, F.H.; Nakamura, M.; Machado, S.A.; Toma, H.E. Efficient electrochemical biosensors for ethynylestradiol based on the laccase enzyme supported on single-walled carbon nanotubes decorated with nanocrystalline carbon quantum dots. Anal. Methods 2016, 39, 7254–7259. [Google Scholar] [CrossRef]
  61. Scala-Benuzzi, M.L.; Raba, J.; Soler-Illia, G.J.; Schneider, R.J.; Messina, G.A. Novel Electrochemical Paper-Based Immunocapture Assay for the Quantitative Determination of Ethinylestradiol in Water Samples. Anal. Chem. 2018, 90, 4104–4111. [Google Scholar] [CrossRef] [PubMed]
  62. Omar, N.A.; Fen, Y.W.; Abdullah, J.; Mustapha Kamil, Y.; Daniyal, W.M.; Sadrolhosseini, A.R.; Mahdi, M.A. Sensitive Detection of Dengue Virus Type 2 E-Proteins Signals Using Self-Assembled Monolayers/Reduced Graphene Oxide-PAMAM Dendrimer Thin Film-SPR Optical Sensor. Sci. Rep. 2020, 10, 2374. [Google Scholar] [CrossRef]
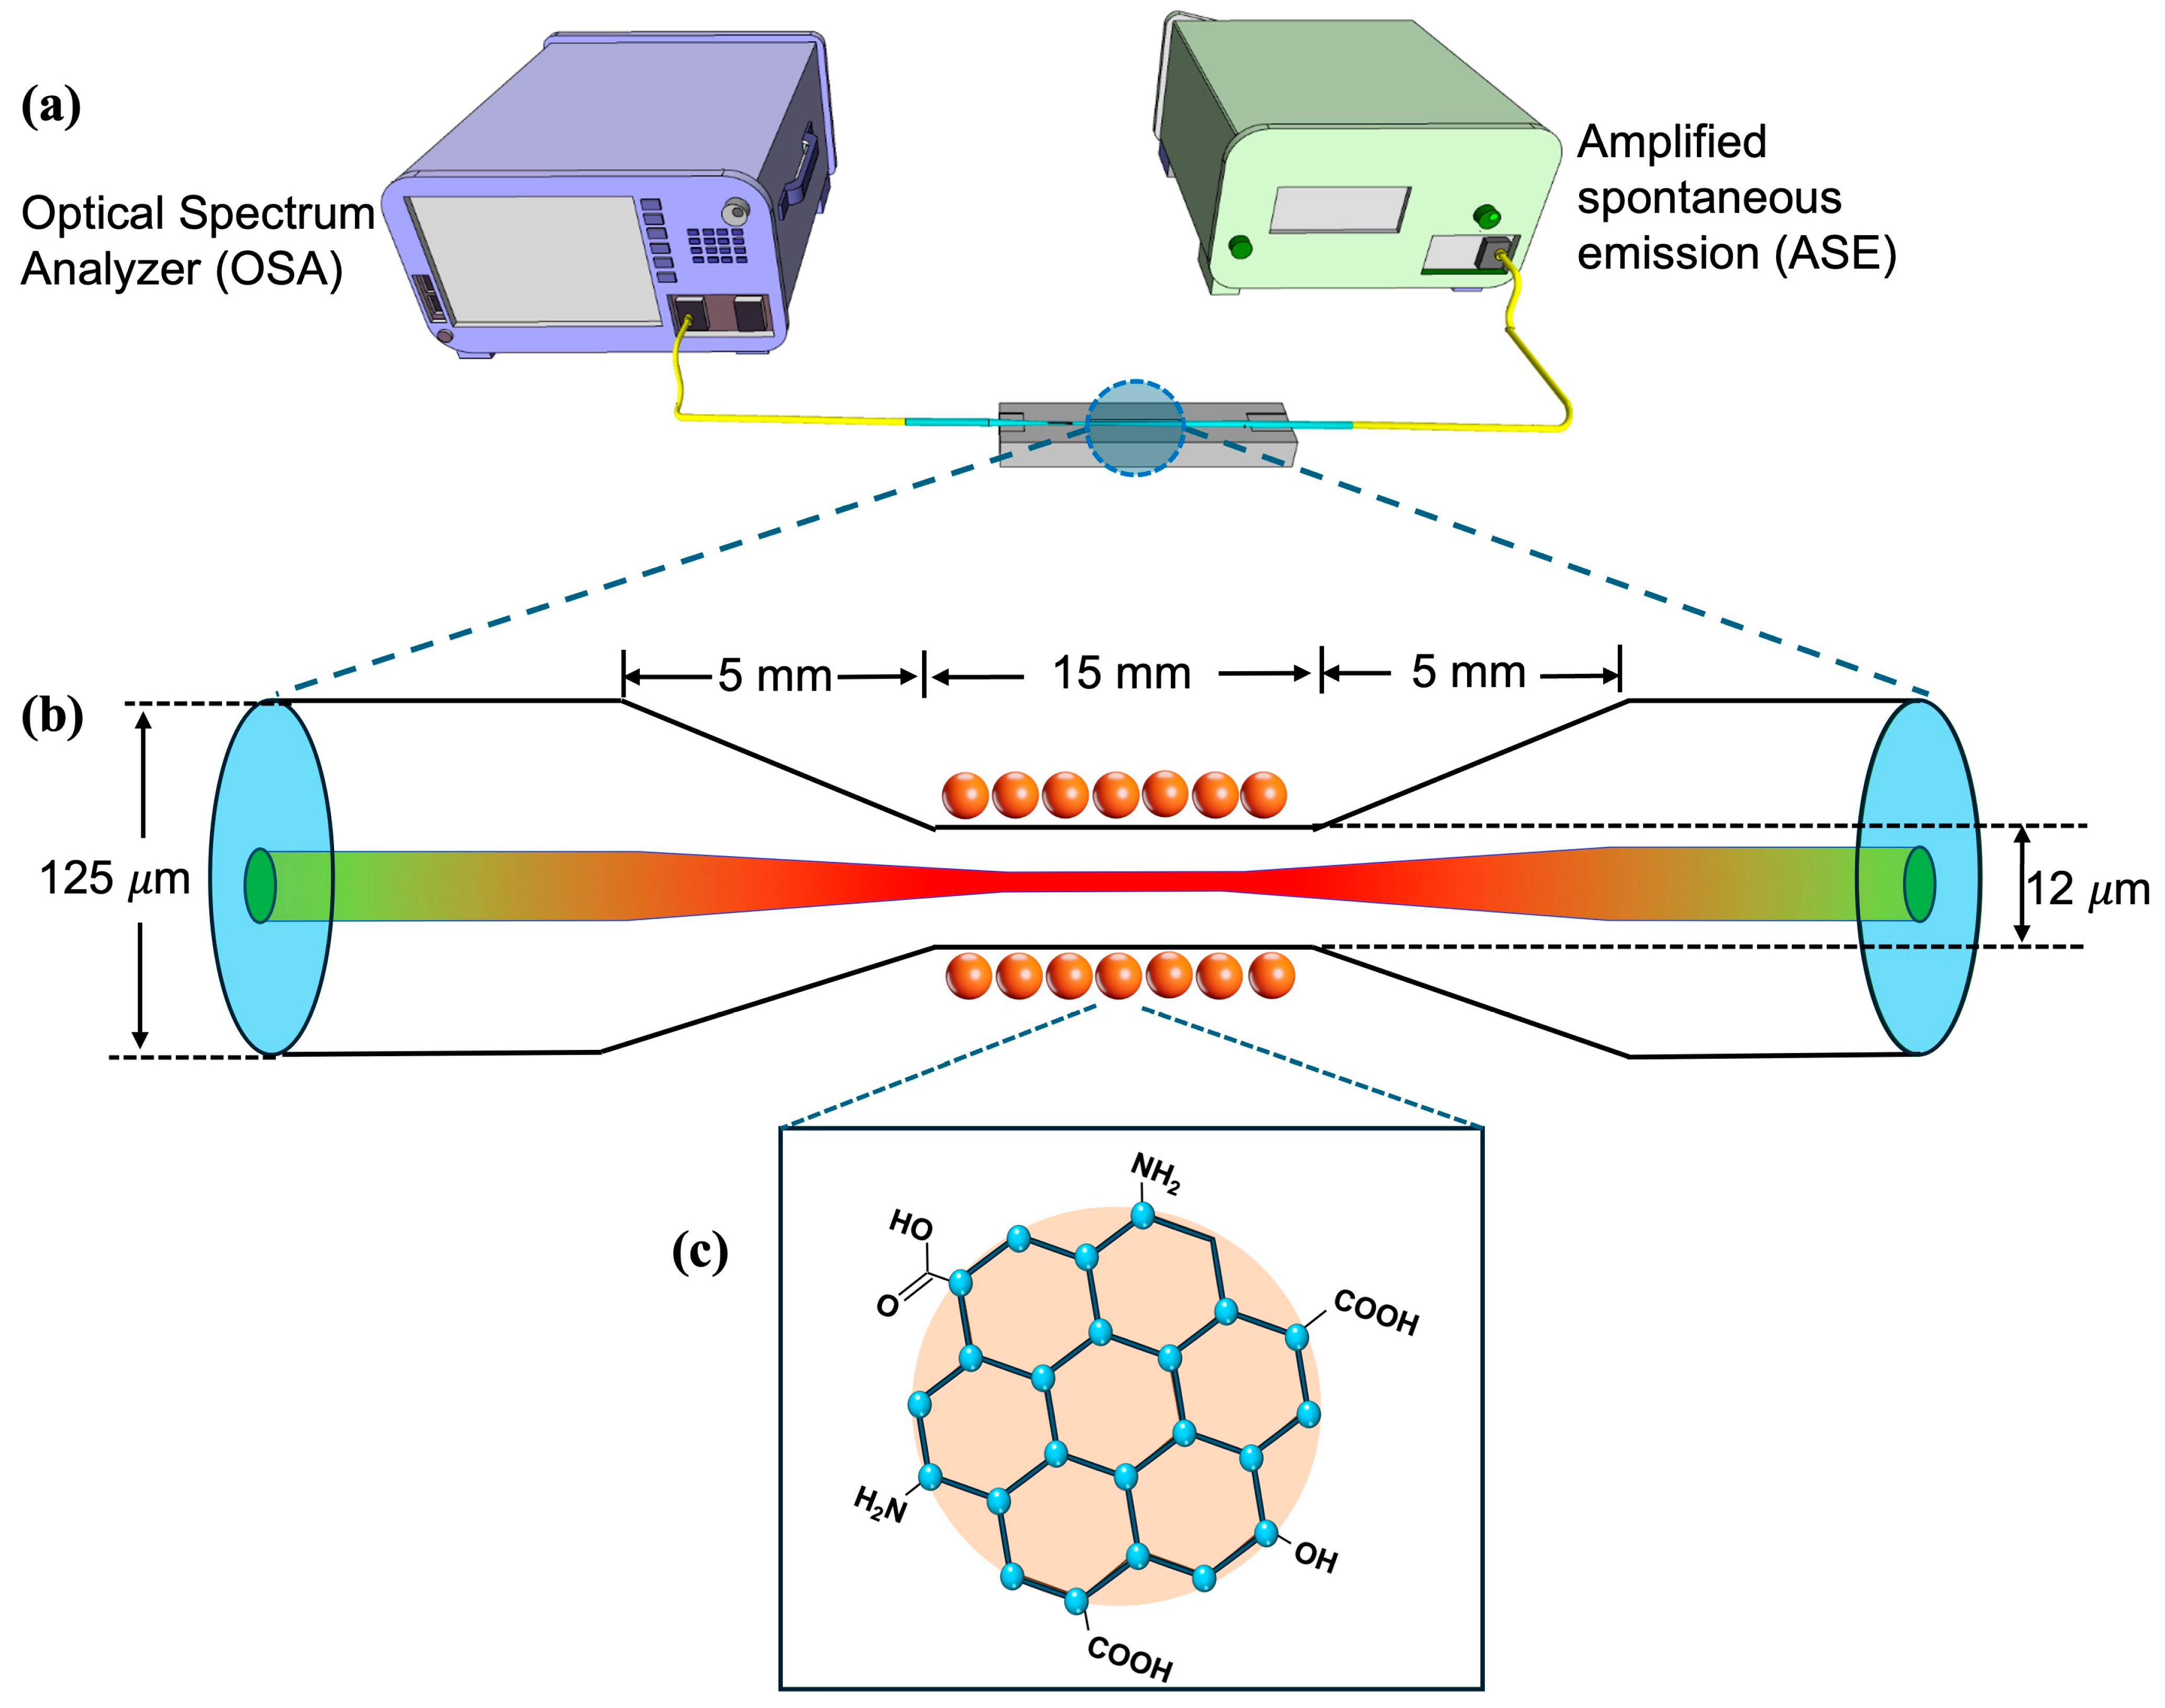
Figure 1. (a) Experimental setup of CQD-coated TOF for EE2 detection sensor, (b) the tapered fiber dimension, and (c) the molecular structure of the CQDs.
Applsci 15 09890 g001
Figure 2. The sensing layer of EE2 detection onto the CQD-TOF using bi-functional linkers of NaOH, APTES, Glutaraldehyde, EE2 antibody (represented as the blue y-shaped symbol), and EE2 (as the red circle).
Applsci 15 09890 g002
Figure 3. The optical properties and composition of the characterized CQDs. (a) The CQDs solution was compared to distilled water when both were exposed to UV light. (b) The PL spectra of the CQDs at different excitation wavelengths. (c) FWHM of the PL intensity for CQDs under excitation of 360 nm. (d) Elemental composition of CQD solution in EDXS.
Applsci 15 09890 g003
Figure 4. TEM analysis: (a) TEM image of CQDs, (b) particle size distribution histogram, (c) high-resolution TEM image of CQDs with the green box indicating the region selected for lattice fringe analysis, and (d) corresponding intensity profile showing the interplanar spacing value of 0.309 nm.
Applsci 15 09890 g004
Figure 5. Characterization of CQD-TOF. (a) The EDXS spectra of CQD on TOF with the insets showed the corresponding SEM image and the elemental composition percentage, (b) The Raman spectrum reveals the presence of D-band and G-band, with the inset showing the microscopic image of CQD-TOF used in Raman measurement.
Applsci 15 09890 g005
Figure 6. Surface topography of AFM images (1 μm × 1 μm) of CQD with different deposition times: (a) 10 min, (b) 20 min, (c) 30 min, (d) 40 min, and (e) 50 min. The figure displays the topographic scan in 3D on the left, in 2D in the center, and the height profiles along the corresponding line on the right.
Applsci 15 09890 g006
Figure 7. Optical spectrum of the CQD-TOF after each sensing layer process. The arrow indicates the progressive red shift of the wavelength corresponding to the sequential functionalization steps on the fiber surface.
Applsci 15 09890 g007
Figure 8. FESEM images and EDXS spectra of the CQD-TOF after introduction of (a) antibody, and (b) EE2.
Applsci 15 09890 g008
Figure 9. Raman spectra of CQD-TOF after immersing in PAb and EE2, with inset showing the presence of D-band and G-band peaks.
Applsci 15 09890 g009
Figure 10. The sensor selectivity toward EE2 compared to other types of analytes.
Applsci 15 09890 g010
Figure 11. (a) The sensitivity of CQD-TOF under different incubation time shows the optimized sensitivity at 30 min where (b) the wavelength shift towards different EE2 concentration shows good linearity which corresponds to (c) optical spectrum attained for EE2 at concentrations 1–10 ng/L and its heatmap transmission (d) that indicates the dips (dark blue) and peaks (light green) of respective optical spectrum.
Applsci 15 09890 g011
Figure 12. Wavelength shift toward EE2 concentrations from 0.3374 pM to 3.374 μM using CQD-TOF to determine binding affinity.
Applsci 15 09890 g012
Table 1. Roughness and thickness of CQDs-coated sensing surface with different time depositions.
Deposition Time (min) Roughness (nm)Thickness (nm)
101.2546.340
201.4360.395
301.5562.592
401.6472.156
501.6784.329
Table 2. Comparison between various nanoparticle-modified EE2 biosensors with the proposed method.
MethodNPs ModifierRecognition MechanismLODLDRRef.
EISAu/rGOAntibody binding1.5 ng/L0–120 ng/L[30]
EISGOAntibody binding0.07 pg/L0.075–200 ng/L[31]
Electrochemical DPVAu/CNTDirect oxidation0.987 µg/L0.00296–35.568 mg/L[57]
Electrochemical DPVrGODirect oxidation2.0126 µg/L0.0118–2.454 mg/L[58]
Electrochemical DPVrGOMIP rebinding79.44 µg/L0.0474–4.446 mg/L[59]
Electrochemical DPV CNT/CQDsEnzymatic oxidation1.1856 µg/L0.0474–4.446 mg/L [60]
Electrochemical SWVrGOAntibody binding0.1 ng/L0.5–120 ng/L[61]
Electrochemical amperometryrGOEnzymatic oxidation0.044 ng/L0.0741–5.928 ng/L[32]
TOFCQDsAntibody binding0.0426 ng/L0–10 ng/LThis work
NPs—Nanoparticles, LOD—Limit of Detection, LDR—Linear Detection Range, EIS—Electrochemical impedance spectroscopy, DPV—Differential Pulse Voltammetry, SWV—Square Wave Voltammetry, TOF—Tapered Optical Fiber, rGO—reduced Graphene Oxide, GO—Graphene Oxide, CNT—Carbon Nanotubes, CQDs—Carbon Quantum Dots, MIP—Molecular Imprinted Polymer.
Disclaimer/Publisher’s Note: The statements, opinions and data contained in all publications are solely those of the individual author(s) and contributor(s) and not of MDPI and/or the editor(s). MDPI and/or the editor(s) disclaim responsibility for any injury to people or property resulting from any ideas, methods, instructions or products referred to in the content.