Review

Variable Dilation Angle Models in Rocks, a Review

by
Javier Arzúa
1,2,*,
Daniel Ibarra-González
1 and
Edison Martínez-Bautista
1
1
Department of Metallurgical and Mining Engineering, Universidad Católica del Norte, Antofagasta 1240000, Chile
2
Centro de Investigación en Tecnología, Energía y Procesos Industriales, CINTECX, GESSMin Group, Department of Natural Resources and Environmental Engineering, Universidade de Vigo, 36310 Vigo, Spain
*
Author to whom correspondence should be addressed.
Appl. Sci. 2025, 15(18), 9872; https://doi.org/10.3390/app15189872
Submission received: 5 August 2025 / Revised: 30 August 2025 / Accepted: 7 September 2025 / Published: 9 September 2025
(This article belongs to the Special Issue Advances and Technologies in Rock Mechanics and Rock Engineering)

Abstract

This paper presents a comprehensive review of dilation angle models in rock mechanics. Dilation, a characteristic behavior of geomaterials, such as rocks and rock masses, involves volumetric changes during plastic deformation. This study focuses on the dilation angle, a key parameter for measuring dilation, and its dependence on the plastic strain history and confining stress. The review covers ten variable dilation angle models developed over the past two decades and analyzes their equations, parameters, and main features. These models range from simple approaches with few parameters to complex formulations that involve multiple coefficients. The strengths and limitations of each model, including their applicability to different rock types and testing conditions, are presented. Key findings include the importance of considering both plastic strain history and confining stress in dilatancy models, the variation in approaches for defining the onset of plastic strain, and the challenges in standardizing and comparing different models. This review also highlights the ongoing debate regarding the influence of rock type, specimen size, and structure on dilatant behavior. This review contributes to the field of rock mechanics by providing a comprehensive overview of the current dilatancy models, their applications, and limitations. It serves as a valuable resource for researchers and practitioners in geomechanical engineering, particularly in areas such as tunnel design, mining engineering, and petroleum extraction, where understanding the post-peak behavior of rocks may be crucial.

1. Introduction

Continuous technological and economic development has enabled deeper excavations, sometimes under complex geomechanical conditions [1,2,3,4]. These excavations often correspond to large underground structures facing environments with difficult geomechanical conditions [5,6,7]. If any underground work is considered to generate induced stresses that modify the in situ stresses [8], a good characterization of the stress–strain behavior of the rock mass is of utmost importance [9,10,11].
Traditionally, the focus of studies on the stress–strain behavior of rocks and rock masses has been pre-peak behavior because the main task of the engineer usually involves avoiding failure [11,12,13,14]. Therefore, the pre-peak behavior of rocks and rock masses is reasonably well known, although some topics still require research (e.g., brittleness or the effect of confining pressures) [11,15,16,17]. Nevertheless, some specific tasks such as hydrofracking, caving mining, depillaring, or the yielding radius around a tunnel, to mention just a few, require knowledge of not only the pre-peak behavior, but also the post-peak stress–strain behavior [6,15,18,19,20]. Unfortunately, unlike pre-peak behavior, post-peak behavior has not been widely studied owing to difficulties in obtaining reliable results [13,21,22].
Studying the stress–strain behavior at the rock mass (or excavation) scale is generally beyond the scope of most projects for technical or economic reasons. Interestingly, some studies have found that the mode of failure of rocks and rock masses is similar regardless of the scale [23,24]. For this reason, researchers resort to laboratory testing, where advances in the stiffness and servo control of testing equipment, together with a controlled environment, allow observation of the post-peak behavior of rocks by obtaining complete stress–strain curves from uniaxial or triaxial compression tests [15,21,25,26,27,28], thus expanding the knowledge of the rock being tested [26].
Characterizing the post-peak behavior of rocks requires obtaining a series of geomechanical parameters able to reproduce such behavior. Among others, the dilation angle serves to characterize the dilatant behavior of rocks because it allows the reproduction of the complex volumetric strain of the specimen in the post-peak stage [2,7,25,29,30,31,32] and to account for the damage in crystalline rocks [27,33].
Despite significant advances, knowledge of rock dilatancy remains fragmented, and the relationship between dilation angle, plastic strain, and confinement has not been standardized. This lack of standardization complicates the comparison between studies and the selection of appropriate models for different rock types. Recognizing these gaps, the present study focuses on compiling and examining eleven existing variable dilation angle models, presenting their main characteristics as well as their advantages and limitations. By systematically reviewing these models, the intention of this bibliographical review is not to provide a comprehensive comparative analysis, but rather to highlight common shortcomings and unresolved questions in previous and current research, thereby providing a clearer understanding of rock dilatancy. Ultimately, this study seeks to bridge the gap between existing knowledge and practical application, offering a foundation for the standardization of procedures to determine the dilation angle and guiding the development of improved models in future research.
The methodology used for the development of this work consisted of a systematic search for information through electronic resources, mainly in the SCOPUS and Web of Science (WoS) databases, selected due to their large number of internationally indexed and cited scientific publications [34,35].
The search strategy was based on the use of keywords related to rock dilatancy. To define the framework, filters were applied considering only publications after 2010, and the relevance of the articles was prioritized based on the number of citations relative to the year of publication. Subsequently, the abstracts were reviewed, evaluating the objective, the methodology used, and the contributions related to the knowledge of dilatancy, discarding those that did not meet the established criteria. These steps follow the general structure of systematic searches, which include scoping, searching, screening and reporting phases [36,37].
The selected works were organized into categories according to the focus of the model and the variables involved.
Inclusion criteria:
  • Publications in indexed journals, book chapters, and conference proceedings.
  • Studies that explicitly address dilatancy in rocks or models of dilation angle.
  • References that include equations related to the dilation angle.
  • Publications from the year 2010 onwards.
Exclusion criteria:
  • Studies applied to other materials (such as concrete, soils, or others).
  • Articles on constitutive models without relevant contributions to dilatancy.
  • Articles in languages other than English.
The fundamentals and models are described in the following sections.

2. Complete Stress–Strain Curves

Uniaxial and triaxial compressive strength tests performed in the laboratory are primarily aimed at determining the strength of rock specimens under certain stress conditions by recording the axial load at which a cylindrical rock specimen fails [38,39,40,41,42]. These strength test results allow us to obtain the combination of stresses that result in the failure of the intact rock (i.e., the failure criterion) [43]. Under this primary objective, traditional strength tests usually finish when the rock fails and the maximum strength is achieved [41,43,44,45,46]. To attain the residual state, it is necessary to continue the test beyond its maximum strength until an approximately constant strength value is reached, which is known as residual strength [25,41,47,48]. Just as a failure criterion can be obtained for maximum strength, a failure criterion can also be obtained for residual strength [25,49,50,51]. Although the most used failure criteria (Hoek–Brown and Mohr–Coulomb) can be considered to obtain this characterization of the residual strength, their application is not straightforward because they were not originally intended for that purpose and require some adjustments [52,53,54].
The maximum and residual strengths can be obtained by recording the load to which the rock specimen is subjected [41]. More information can be obtained if other sensors are added to the test setup. For example, and in accordance with the objectives of this study, if strain gauges or displacement sensors (that is LVDT) are added, the deformation of the rock specimen during the loading process can be recorded [41,47]. This allows researchers to obtain the stress–strain curves (Figure 1). The stress–strain curves are a graphical representation of the deformations of a rock specimen during the loading process [41,55,56]. These curves are called “completes” when they show the three components of deformation (axial, radial, and volumetric) and reach the residual state [28,41,57,58,59].
To better understand this deformational behavior, the different components of the deformations are represented in Figure 1. The axial strain (ε1) is defined as the ratio of the decrease in length to the original length under each loading condition [41]. According to the sign convention in geomechanics, the axial strain is represented against the maximum principal stress on the positive x-axis (blue curve in Figure 1). The radial, diametrical, or transversal strain (ε3) is defined as the ratio of the increase in the radius or diameter to the initial radius or diameter, respectively [41]. According to the sign convention in rock mechanics, the radial strain is represented against the maximum principal stress on the negative x-axis (red curve in Figure 1). Likewise axial and radial strain, volumetric strain (εv) is defined as the ratio of the variation in volume of the specimen during the loading process to the initial volume [41]. There are two tendencies to represent the volumetric strain: on the one hand, following the way of representing the other strains, it can be represented against the major principal stress on the abscissa axis, and on the other hand, it can also be represented against the axial strain on the negative axis of the ordinates. The last option is chosen to represent the volumetric deformation (green curve) in Figure 1.
Recording the different strains during the strength tests allows researchers to obtain the most relevant geomechanical parameters of the pre- and post-peak behaviors.

2.1. Pre-Peak Phase

The pre-peak behavior, both in rocks and rock masses, is frequently described by linear theories [60,61,62,63]. Various authors have described the important thresholds for this behavior (Figure 1) [64,65,66,67]. In the pre-peak phase, it is possible to obtain the elastic parameters: Young’s modulus, E, as the slope of the axial strain against axial stress (maximum principal stress), and Poisson’s ratio, ν, as the ratio between the slopes of the radial and axial strains against the axial stress, both calculated in the elastic region [40,41,68,69]. The elastic region corresponds to the zone where the deformations of the specimen are recovered if the load reduces to zero [41,68,70].
It is also possible to estimate the stress levels known as Crack Closure (CC), Crack Initiation (CI), and Crack Damage (CD) [24,38,44,71,72,73,74].
Crack Closure (CC) corresponds to the stress where most of the existing microcracks, microcavities and weak planes (microdefects in general) oriented sub-perpendicular to the maximum principal stress have almost closed. From this stress level to the crack damage stress, the axial strain -axial stress relationship can be considered as elastic. Up to this stress, all the internal processes tend to contract the specimen.
Crack Initiation (CI) corresponds to the stress at which the growth of microcracks oriented parallel to the load begins. This corresponds to the beginning of the radial strain—axial stress nonlinearity (the beginning of the lateral plastic or irreversible deformation). Dilatant behavior begins with this stress, but the rock dilates less than it contracts (the specimen still contracts, but at a lower rate).
Crack Damage (CD) or yield-point corresponds to the point where the growth of microcracks begins to interact with each other and begins to propagate unstably. This corresponds to the beginning of the nonlinearity of the axial strain—axial stress curve. It is a useful indicator of the dilatant behavior of the samples because it marks the beginning of the axial plastic deformation. At this point, dilatant behavior becomes more important than contractional behavior; therefore, the specimen begins to dilate, although it still has a lower volume than it initially had.
It should be noted that relying solely on the strains to estimate these stress levels is not very accurate; it is usually better to rely on the measurements of acoustic emissions (AE) to determine them more precisely [75,76,77].
The peak or maximum strength (σ1peak) corresponds to the stress at which the specimen fails. Moments before this stress level, the initial volume of the specimen is reached, and moments after the specimen reaches its maximum dilatancy rate (the greatest variation rate in volume) [2,7].
From the CD stress onwards (strictly speaking, from the CI stress onwards), it must be considered that the total strains recorded by the sensors have an elastic component and a plastic component (Equation (1)) [3,30]:
ε i = ε i e + ε i p ,
where εi refers to the total strain, subscript i refers to the different possible strains (i = 1 for axial, i = 3 for radial, and i = v for volumetric), and e and p stand for elastic and plastic, respectively.
As will be explained later, the plastic component of the strains plays a relevant role in the definition of the dilation angle; therefore, it is important to be able to differentiate both components of the strain. One way to do so is to use loading and unloading cycles during the test [25,27,30]; however, in the case that these cycles are not available, the simplification that the elastic moduli do not change during the test can be considered, and the plastic strains can be obtained using Equations (2)–(4) [7].
ε 1 p = ε 1 σ 1 E
ε 3 p = ε 3 + σ 1 E · ν
ε v p = ε 1 p 2 ε 3 p ,
where σ1 refers to the axial stress, and the remaining parameters have already been defined.
To quantify plastic damage, a softening parameter, η or γp, must be used. This parameter can be defined in different ways: (i) plastic shear strain (γp) (Equation (5)) [30], which is obtained from the difference between the axial and radial plastic strains (with its sign, which finally results in the addition of the absolute values of these plastic strains); (ii) equivalent plastic strain (ēp) (Equation (6)) [78], which is obtained from the increments of the principal plastic strains; and (iii) a modification of the previous one developed by Itasca [30,79] that allows it to be implemented in the FLAC3D software (Δēps) (Equation (7)):
γ p = ε 1 p ε 3 p ,
e ¯ p = η ˙ = 2 3 ε ˙ 1 p ε ˙ 1 p + ε ˙ 2 p ε ˙ 2 p + ε ˙ 3 p ε ˙ 3 p ,
Δ e ¯ p s = 1 2 Δ ε 1 p s Δ ε m p s 2 + 1 2 Δ ε m p s 2 + 1 2 Δ ε 3 p s Δ ε m p s 2 ,
where Δ ε m p s = Δ ε 1 p s Δ ε 3 p s / 3 .
This softening parameter (in any form) is used to link the variation in the dilation angle in the models. It is generally defined as the plastic shear strain (Equation (5)); however, the different definitions of this parameter tend to complete the specifications of plastic degradation during numerical simulation [80].
Strictly speaking, the plastic strains initiate at the point of initiation of stable fissure propagation (CI) because it is the stress level at which the parallel-to-the-load microdefects begin to extend [44]. Nevertheless, the plastic strains between the CI and CD stress levels are usually negligible compared with those after the CD stress [2,81,82]. Moreover, considering the CI as the starting point of the plastic strains results in negative dilation angles because the specimen still reduces its volume between the CI and CD stresses [2,81]. Therefore, most variable dilation angle models consider the CD stress as the starting point of plastic strains [2,7,66,83,84,85,86]. To simplify the existence of the inelastic behavior, some models consider the peak strength as the starting point of the plastic strains [30,87,88].
Both simplifications (i.e., considering CD stress or peak strength as the starting point of the plastic strains) give as a result that the plastic strain associated with the start of dilation is not equal to zero; therefore, to consider these thresholds, Equations (2) and (3) or Equations (5)–(7) can be modified to shift the initial point of the models to a null plastic strain. For instance, Equation (5) can be rewritten as
γ s h i f t e d p = γ p γ C D   o r   p e a k p ,
where the subscript shifted indicates that it is the modified parameter, and the subscript CD or peak indicates that plastic strains begin to be considered from the CD stress or from the peak strength, respectively. The same procedure can also be used for Equations (2), (3), (6), and (7).

2.2. Post-Peak Phase

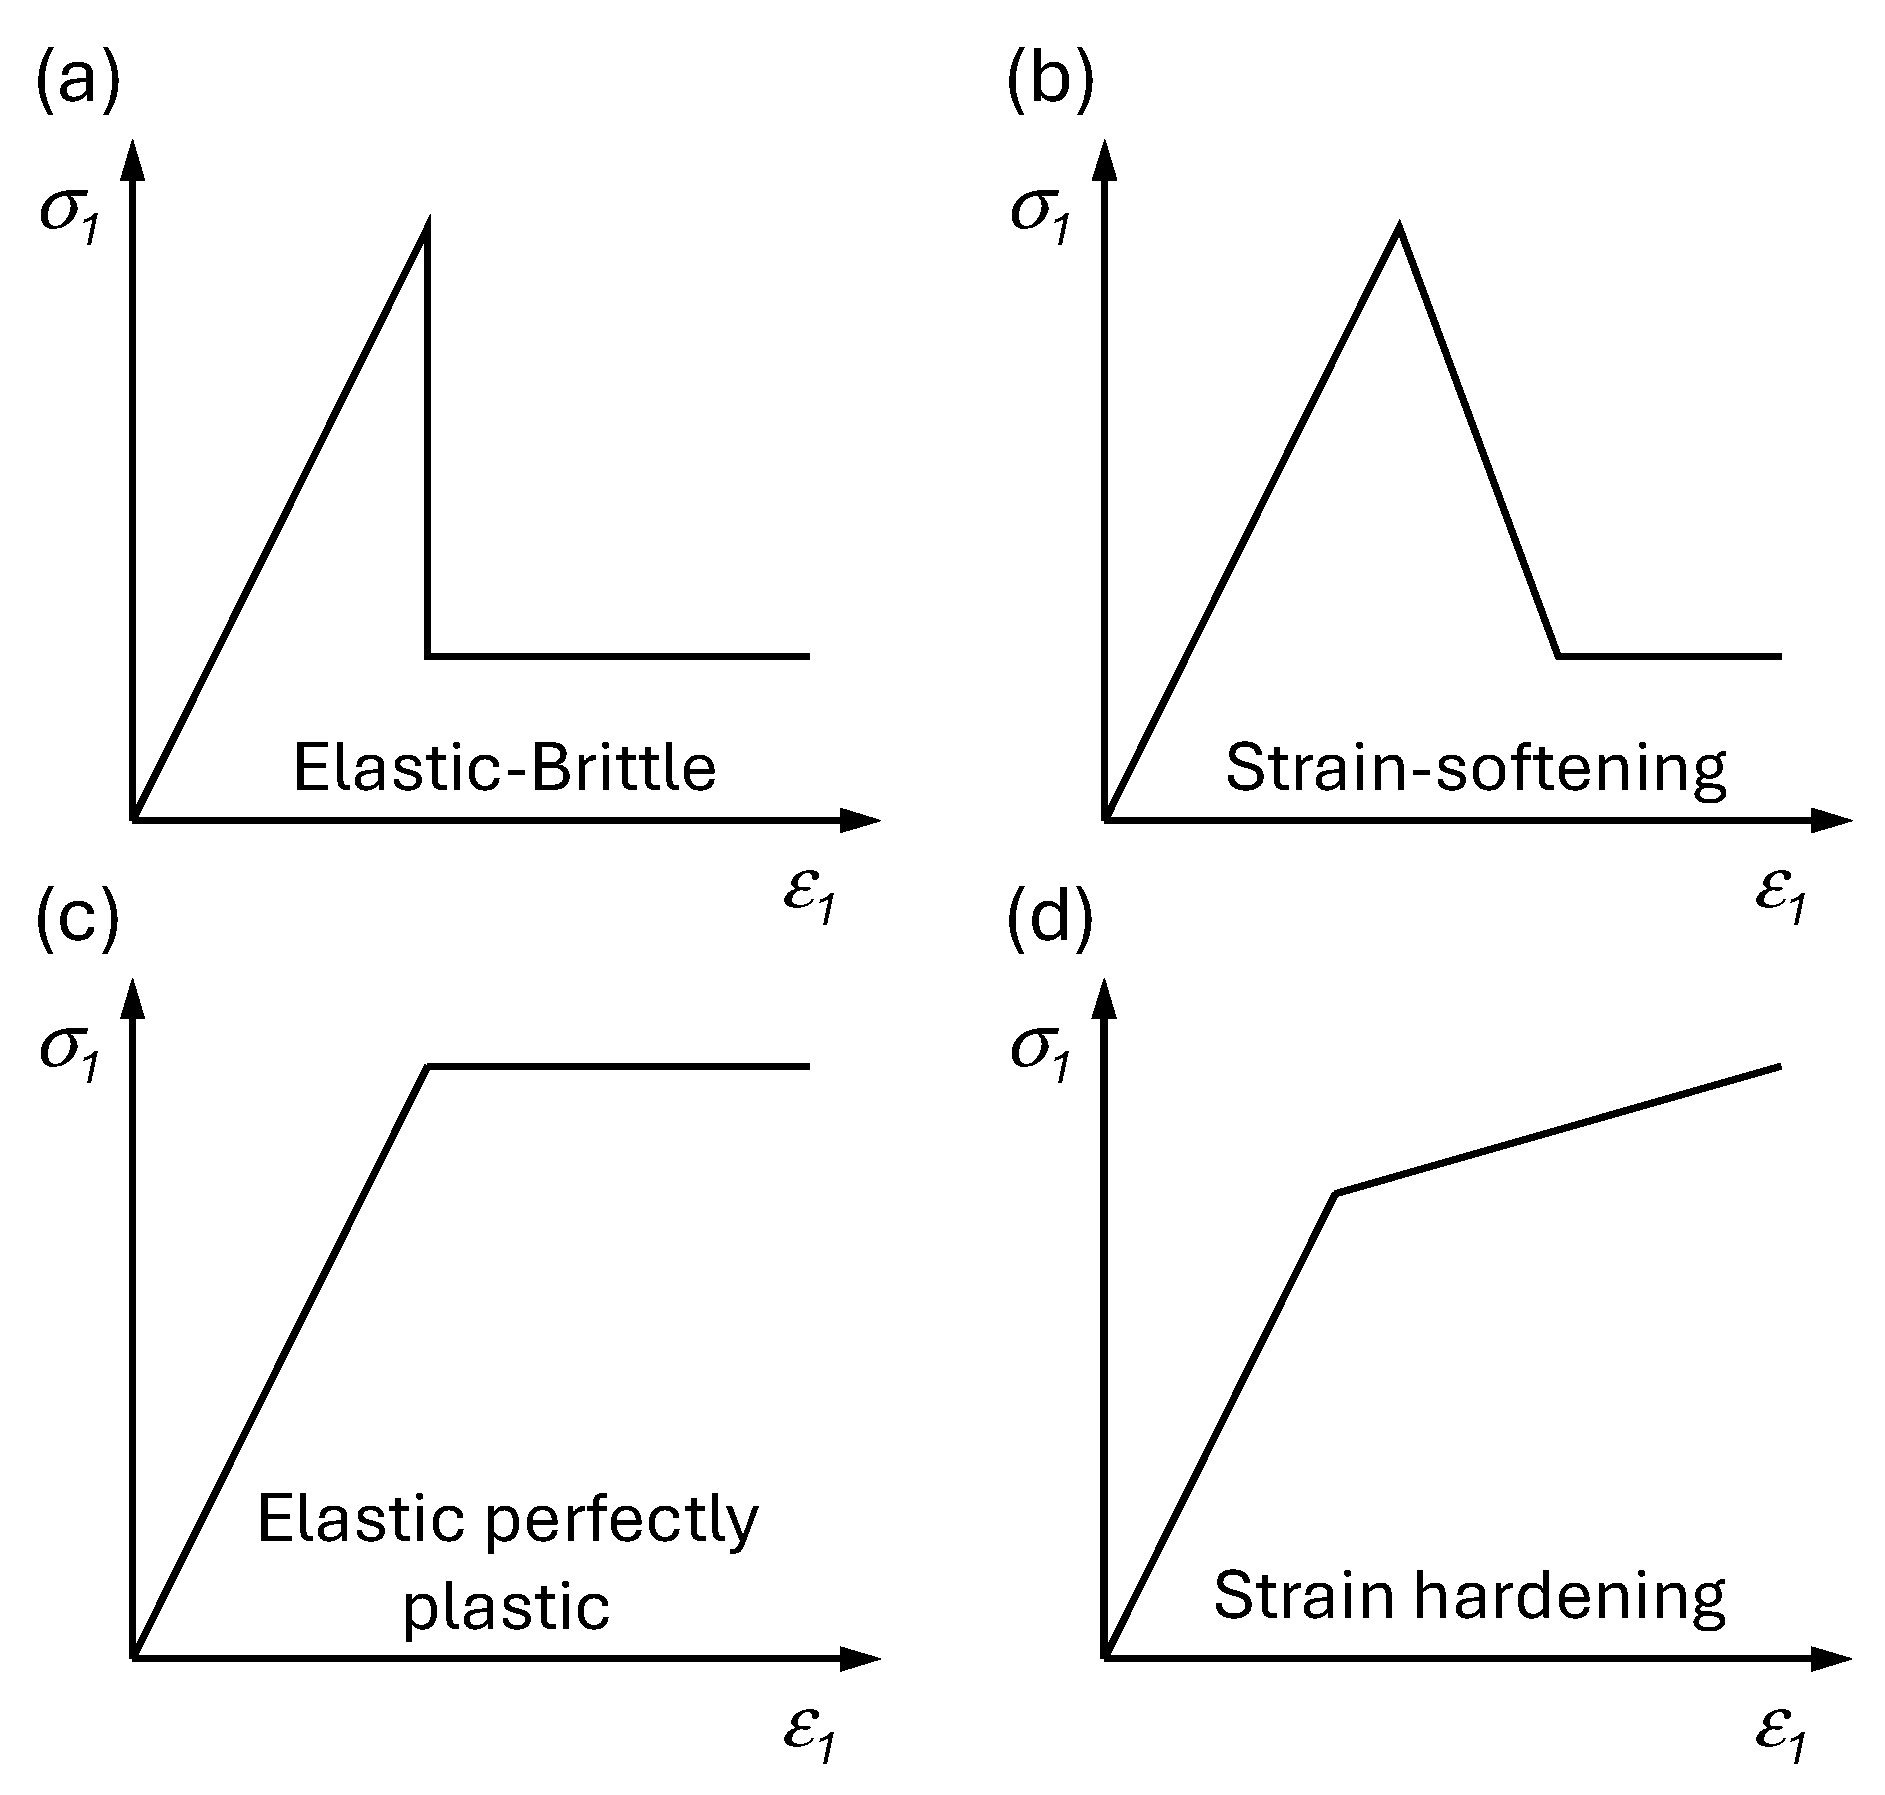
The post-peak phase begins at the peak strength and extends to the residual strength, including the transition from peak to residual strength [41,47,48,65]. There are four types of behavior in this phase (Figure 2) [60,89,90,91,92]:
(i) Elastic–brittle (Figure 2a): This behavior is characterized by a sudden decrease in strength from the peak to the residual strength without almost any increase in strain.
(ii) Strain softening (Figure 2b): The transition from peak to residual strength is gradual and is associated with an increase in axial strain.
(iii) Elastic–perfectly plastic (Figure 2c): There is no transition between peak and residual strength, both are the same, and any load increment is transformed into strain without losing strength.
(iv) Strain hardening (Figure 2d): Once the peak strength is reached, any load increment will be associated with an increment in strength and strain, but with a lower slope than that before the peak strength.
Figure 2. Simplified models of post-peak behavior: (a) Elastic–brittle, (b) strain softening, (c) elastic–perfectly plastic, and (d) strain hardening [89].
Applsci 15 09872 g002
According to these definitions, elastic-brittle and elastic-perfectly plastic behaviors are the limiting cases of the more general strain-softening behavior [80,93,94]. Strain-hardening behavior only occurs for very high confinements [95]; therefore, it is not considered because engineering applications do not usually deal with this situation.
Uniaxial compressive strength tests usually feature brittle behavior, although it depends on the relative stiffnesses of the specimen and the testing equipment [57] as well as on the load and strain velocity [96,97,98,99,100]; meanwhile, in triaxial tests, the rock specimens may exhibit strain-softening behavior, elastic-perfectly plastic behavior, or strain-hardening behavior, depending on the confinement [95,101].
Elastic-brittle and elastic-perfectly plastic behaviors are relatively easy to model. Conversely, strain-softening behavior requires the characterization of how stress and strains are related on the transition from peak to residual strength with a softening parameter, η [102,103,104]. Moreover, there are some rocks that feature a decrease in strain in this transition, denominated as Class II (energy must be released from the rock to continue the transition from peak to residual strength in a controlled manner), while other rocks feature an increase in strain, denominated as Class I (energy must be added to the rock to reach residual strength) [39,98].
To characterize the post-failure behavior of a strain-softening rock, it is necessary to know not only the peak and residual failure criteria, but also the parameters that serve to define the relation between the stress and the strains [104]. For example, a correct characterization of this behavior may be attained if the dilation angle and the drop modulus, M (computed as the slope of the axial stress–axial strain curve after peak strength and during the softening phase) are known, or if the dilation angle and the associated plastic parameter are known [25,105]. Therefore, it is important to correctly characterize the evolution of the dilation angle to study the post-peak behavior.
Dilatancy corresponds to the change in volume that a material undergoes when plastic deformation occurs because of the shear distortion of the material itself [30,78,106]. Two main mechanisms cause volumetric expansion in intact rock: (i) the opening of cracks, which is more significant in the pre-peak stage of a test, and (ii) shear dilatancy, which becomes important with the appearance of planes of weakness [7,13]. The dilation angle (ψ), introduced for the first time by Hansen [107], is the most appropriate parameter for measuring dilatancy. It can be related to incremental plastic deformations and is useful for obtaining the slope of the tangent to the irrecoverable strain locus (orange dashed curve in Figure 1) [5,69,81,108].
Vermeer and de Borst [78], starting from the theory of plasticity, suggested an equation to characterize the dilation angle at a fixed confining pressure, which relates the increments of the volumetric plastic deformation ( ε ˙ v p ) and the major principal plastic strain ( ε ˙ 1 p ) (Equation (9)):
ψ = a r c s i n ε ˙ v p 2 ε ˙ 1 p + ε ˙ v p .
Various approaches have been used to study the dilation angle. Several studies have simplified the dilation angle to a constant or linear value [80,109], such as the recommendation of Vermeer and de Borst [78], the relationships for rock masses proposed by Hoek and Brown [89], and the relationship with the GSI proposed by Alejano et al. [110].
However, it has been shown that the dilation angle depends on the history of plastic deformation and the confinement [29]. Experimental studies have shown that dilatancy depends largely on the confining stress, decreasing in magnitude with increasing confinement because volumetric expansion is inhibited by compression [7,25,66]. Different dilatancy models have been developed to describe this dependence [2,5,7], other more complex models that integrate the intermediate principal stress [88,111], and models that only depend on the deformation history [27,30,66].
The most noticeable difference between the variable dilatancy models is that they consider different plastic strain starting points. Some models consider the beginning of plastic strains at the peak strength, while others consider the Crack Damage stress because although there are small plastic strains beginning from the CI, they are negligible compared to those after the CD. Another significant difference is the internal variable used by the models to characterize the softening parameter. Most of the models use the shear plastic deformation (Equation (5)) owing to its simplicity of calculation compared to other possibilities.
This study focuses on variable dilatancy models dependent on confinement and plastic strain, highlighting the relevance of eleven specific models extracted from the literature. A concise description of the models is provided. At the end of the next section, all the models studied are summarized, including the main formulae and the key characteristics of each model.

3. Dilatancy Models

As mentioned above, first dilation approaches considered a null or a constant dilation angle related to the friction angle [2,89]. According to the equation of Vermeer and De Borst [78] (Equation (9)), a null dilation angle implies that the rock does not change its volume, which is incorrect according to the experimental results (Figure 1). Moreover, a constant dilation angle implies that the rock suffers a constant variation in volume, which is also incorrect (Figure 1). Therefore, according to the experimental results, the dilation angle varies as the plastic deformation of the rock increases, and a model capable of reproducing the dilatant behavior of rocks must consider this variation.
One of the first variable dilatancy models for rocks presented in the literature is that of Alejano and Alonso [30], who proposed a model to estimate dilatancy with a focus on the implementation of numerical methods. They reviewed previous studies and revisited a series of laboratory tests. This model sought to be simple, for which a series of inelastic phenomena (not elastic, but not plastic in the strict sense of the word) that occur before reaching the peak strength were ruled out (Figure 3) and assumed a linear behavior of axial strain on pre-peak, softening, and residual phases.
It is divided into two parts: one for calculating the peak dilation angle, ψpeak (Equation (10)), and another for the decay of the dilation angle, Kψ (Equation (11)). Its main advantage is that these equations depend on a single new parameter, γp*, to simulate the behavior of the rock mass. Despite its simplicity, the model provided reasonable results for the decay of the dilation angle with plasticity. However, it failed to capture the value of ψpeak correctly for all rock types [7,25,61]:
ψ p e a k = ϕ 1 + l o g 10 σ c i · l o g 10 σ c i σ 3 + 0.1 ,
where σci is the intact unconfined strength, σ 3 is the confining stress, and ϕ is the friction angle.
K ψ = 1 + K ψ , p e a k 1 · e γ p γ p , * ,
where Kψ,peak is obtained as observed from the test reinterpretation and γp,* is calculated using Equation (12):
γ p , * = γ p l n K ψ 1 K ψ , p e a k 1 .
Zhao and Cai [2] proposed a more complex mathematical model. Using an empirical approach, they proposed a mathematical expression based on plastic shear strain (Equation (13)):
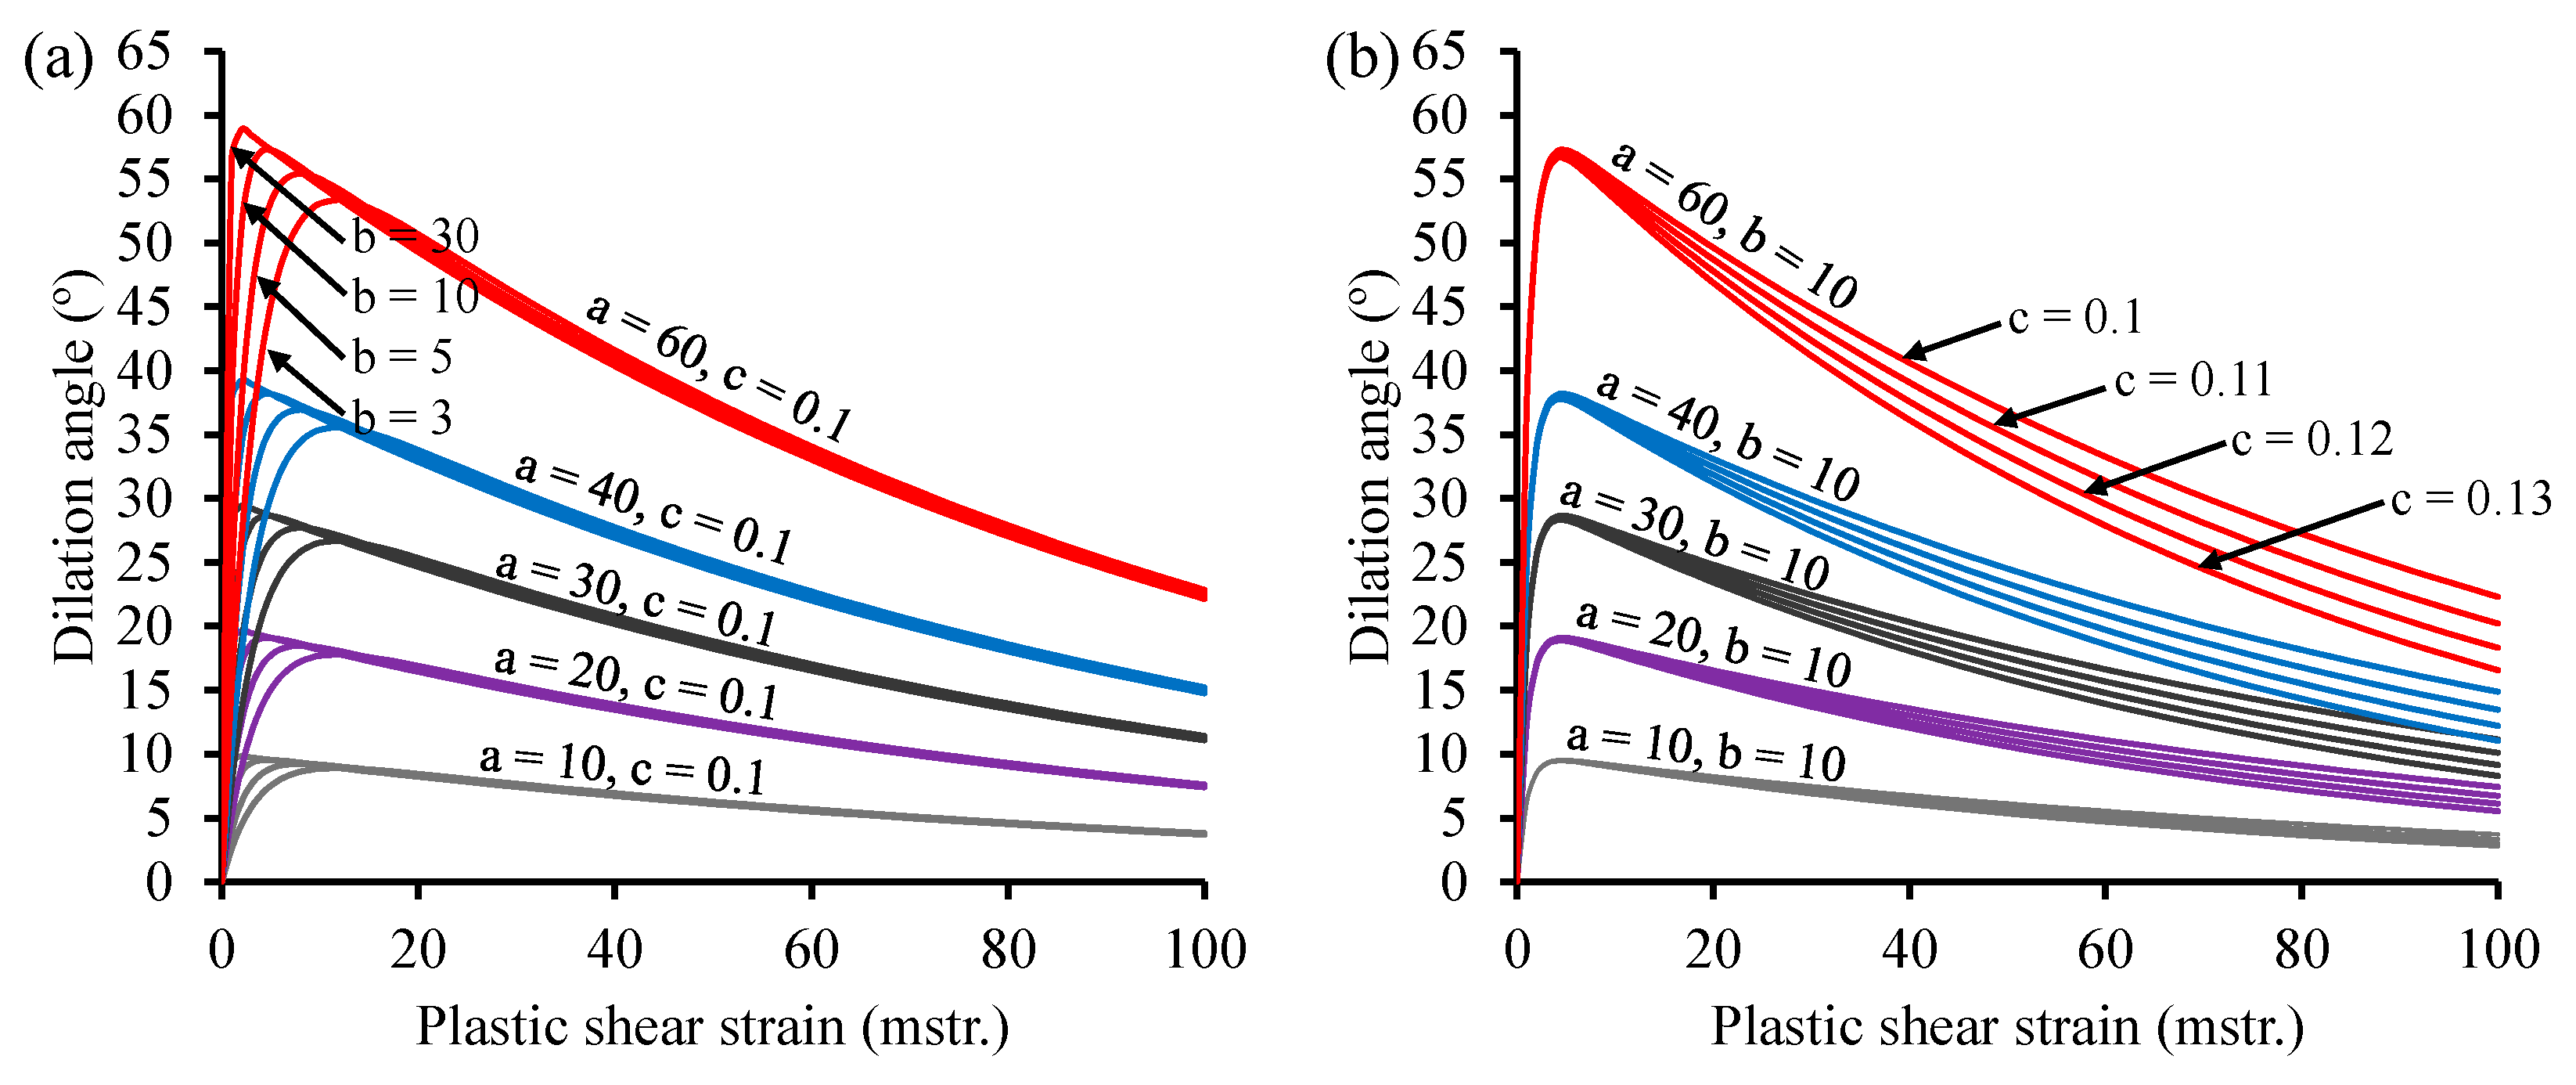
ψ = a · b · e b γ p e c γ p c b .
The model consists of three main parameters (a, b, and c). Each parameter mainly controls the value of the peak dilation angle (a), the position of the peak dilation angle in terms of plastic strain (b), and the decay from the peak dilation angle (c), although all of them also affect the characteristics of the other parameters (Figure 4).
These parameters, in turn, depend on the confining pressure, σ3. The model is finally defined by nine fitting coefficients in total (a1, a2, a3, b1, b2, b3, c1, c2, and c3) (Equations (14)–(16)):
a = a 1 + a 2 · e σ 3 a 3 ,
b = b 1 + b 2 · e σ 3 b 3 ,
c = c 1 + c 2 · σ 3 c 3 .
Furthermore, the authors characterized seven different rock types and proposed grouping the coefficients of the equations based on the grain size. This model accurately captures the behavior of the dilation angle in a good manner (Figure 5). However, this model is not easily applicable in practice because of the complexity of calculating nine parameters without a clear physical meaning (that is, they cannot be correlated with other geomechanical parameters) and because the solution, in practice, may not be univocal.
Pourhosseini and Shabanimashcool [5] developed a constitutive model to describe the nonlinear behavior of intact rock under cyclic loading, which, in addition to characterizing the dilatancy, included the description of the pre-peak elastic behavior and the strain-softening behavior. The model assumes that the propagation of cracks during post-peak deformation is a process of loss of cohesion, maintaining a constant friction angle, and that the rock reaches the peak dilation angle when it reaches the peak strength, whereas the dilation angle diminishes during softening and tends to stabilize in the residual state.
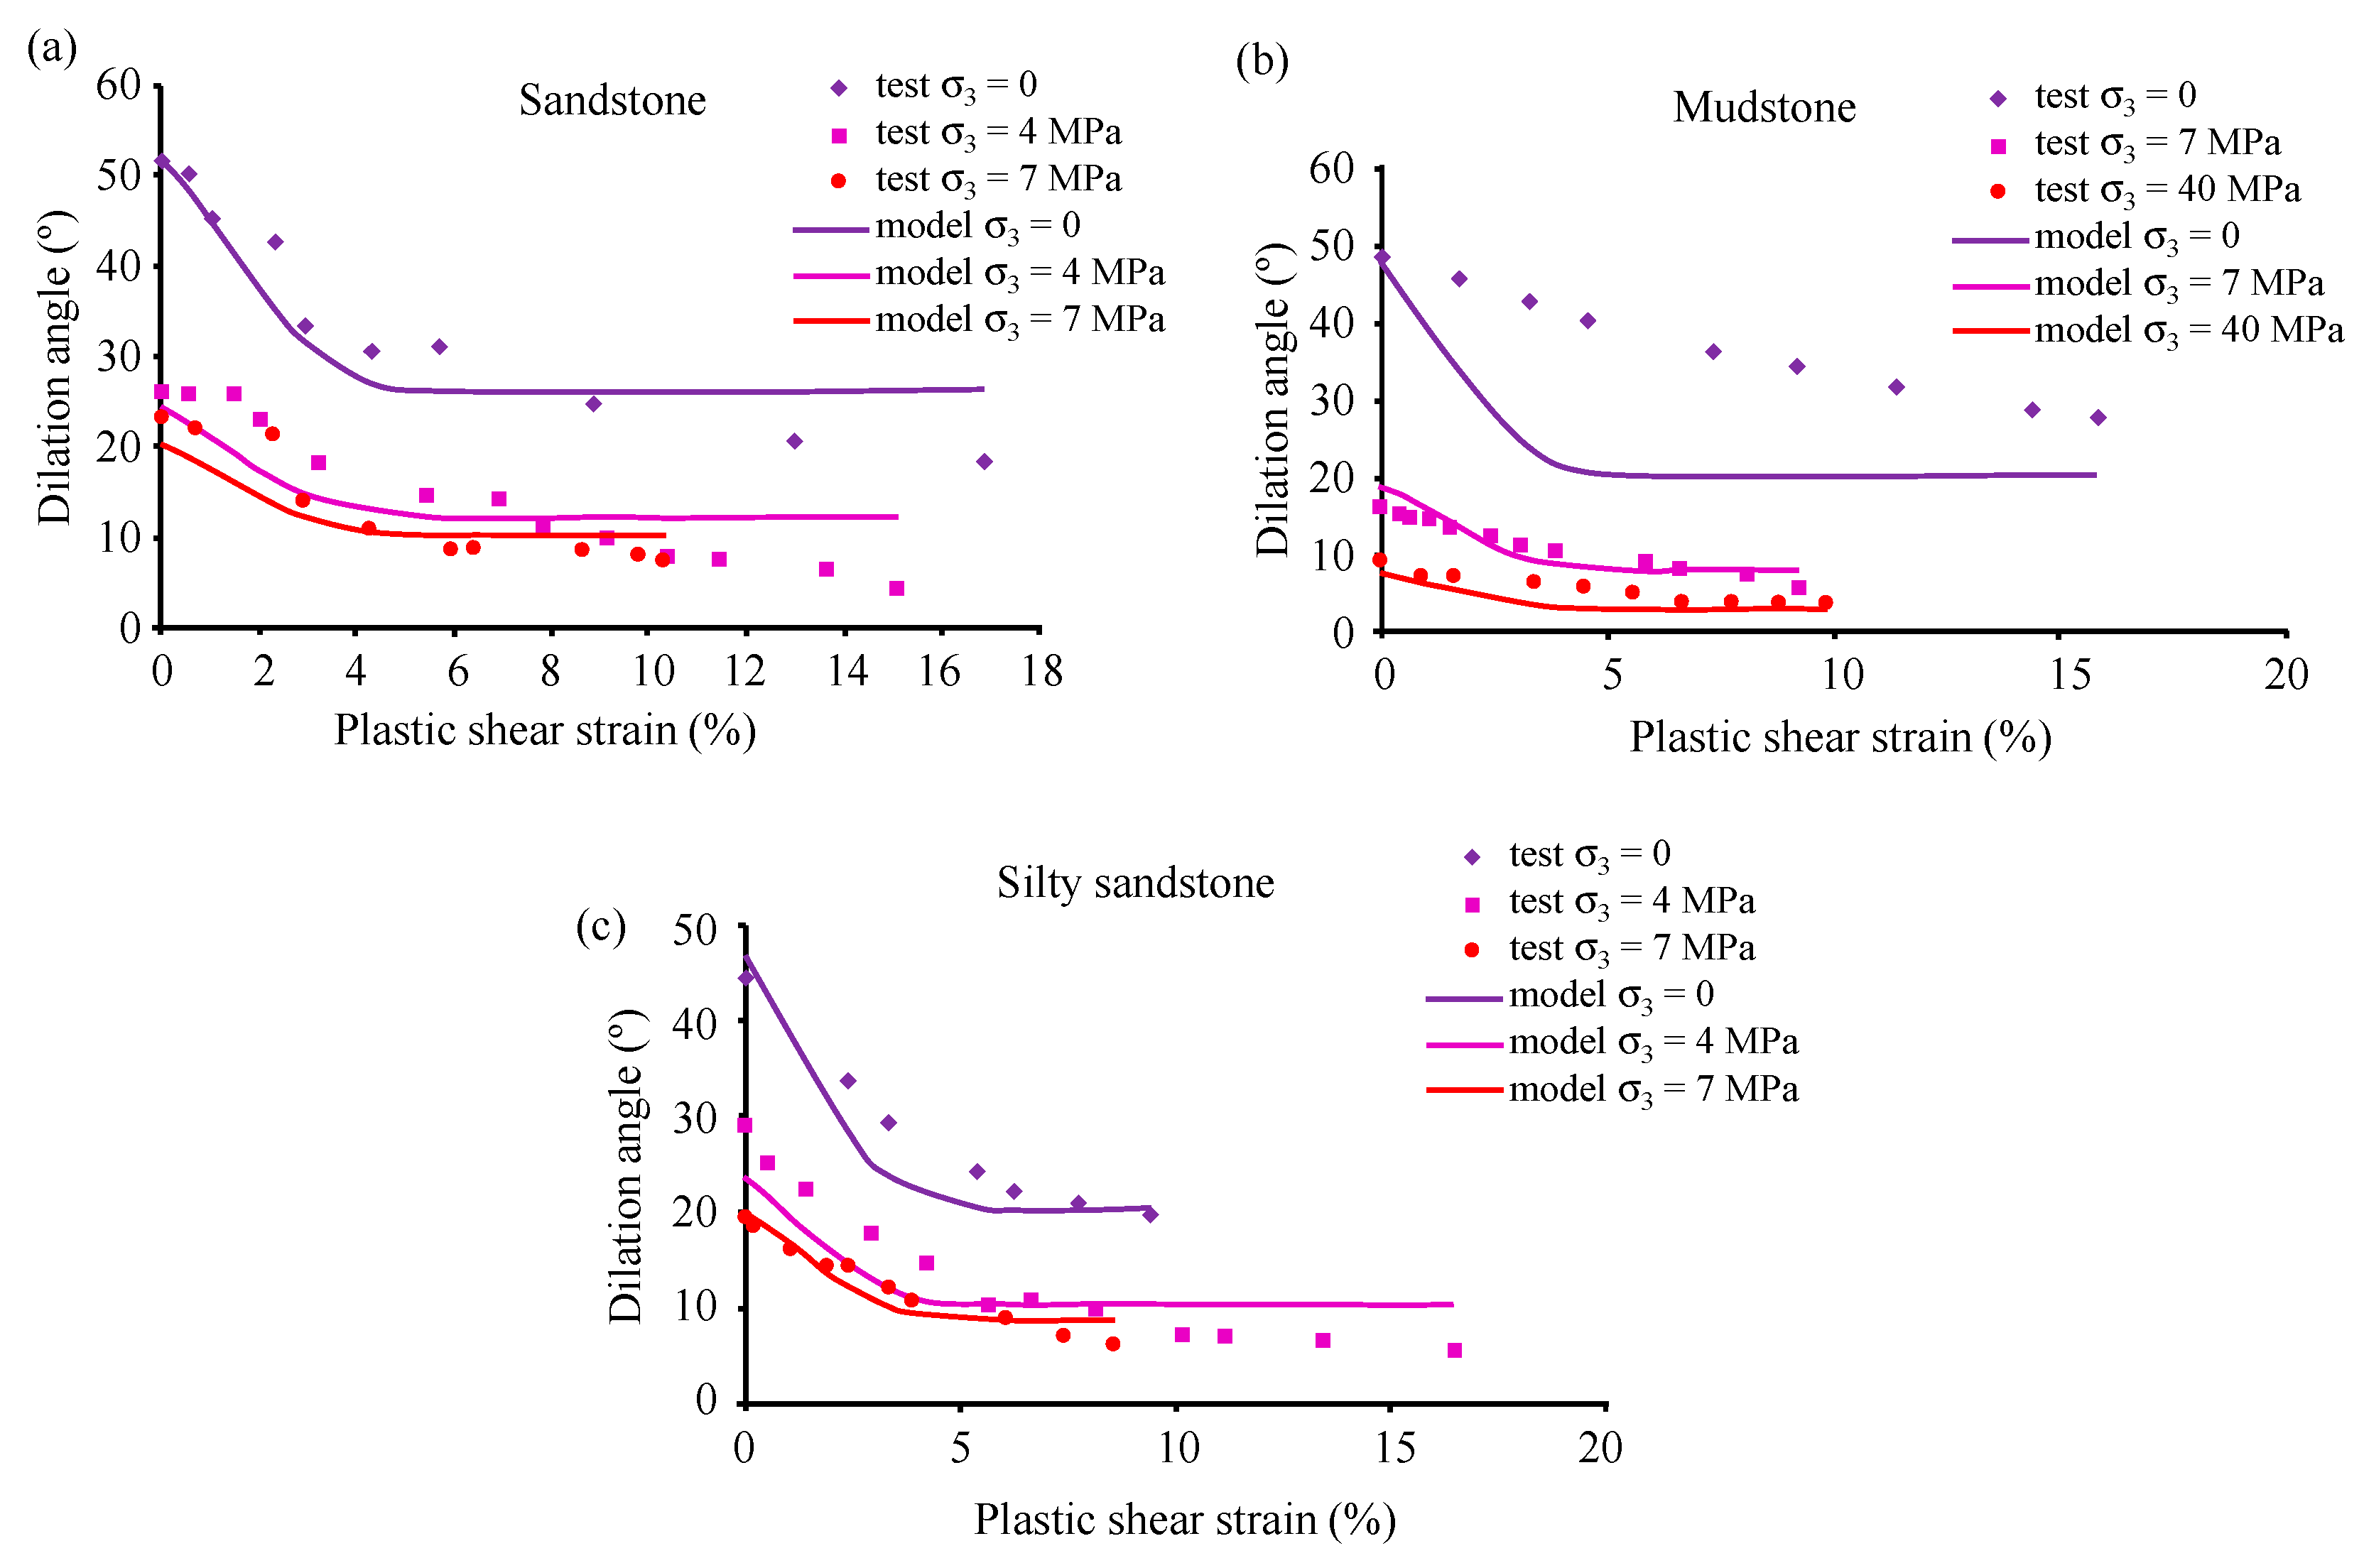
Based on servo-controlled strength tests on three different types of sedimentary rocks (sandstone, silty sandstone, and mudstone), the authors proposed a cohesion-loss model and a model to estimate the dilation angle. The empirical model was proposed to predict the peak value of the dilation angle as a function of the friction angle, ϕ, uniaxial compressive strength, σci, and confining stress, σ3 (Equation (17)), presenting specific values for the three types of rocks tested.
ψ p e a k = A · l n ϕ · σ c i σ 3 + 0.1 B ,
where A and B are model parameters that depend on the rock type.
The authors also proposed an equation for the mobilization of the dilation angle during softening because they experimentally verified that the dilation angle decreases with an increase in the plastic shear strain (γp) (Equation (18)). The proposed model correlated well with most test results. However, there is no good correlation for mudstones with low confining pressures (Figure 6).
ψ = ψ p e a k · 1 t a n h 100 · γ p t a n h 10 + 0.001 .
Finally, the proposed functions (variable dilatancy model and cohesion loss model) were verified by implementing them in a 3D finite-difference numerical code (FDM) to simulate triaxial strength tests, accurately capturing the post-peak behavior of the simulated rocks.
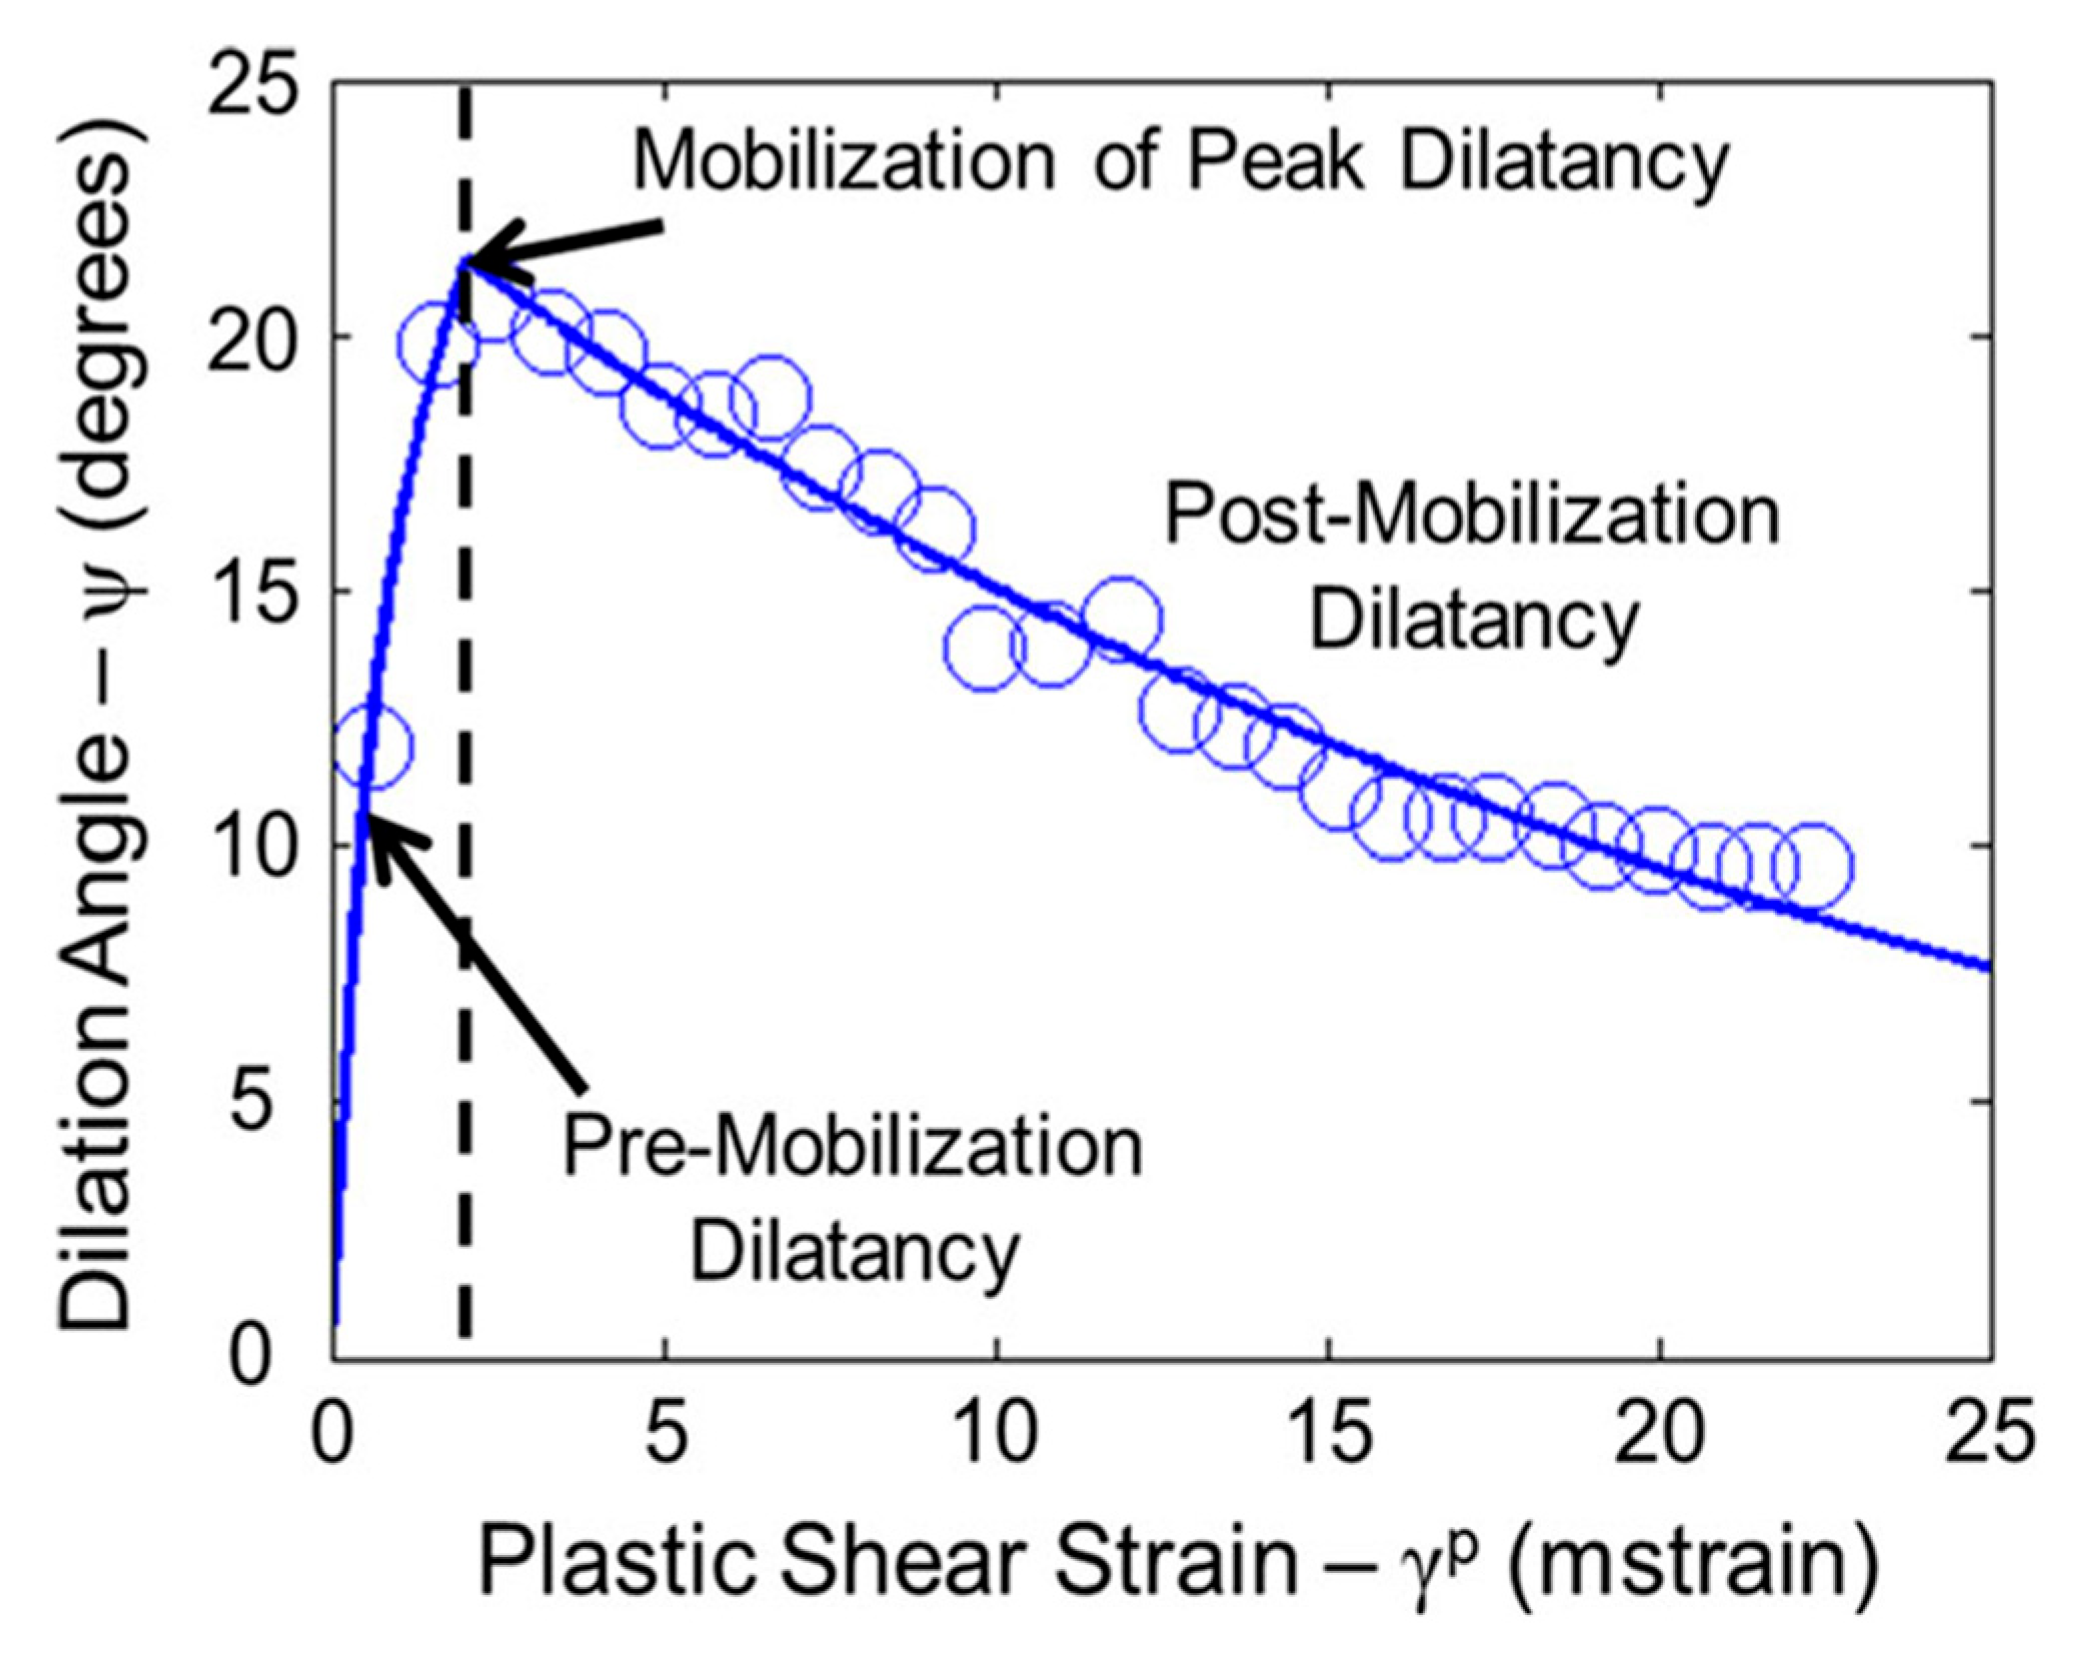
Walton and Diederichs [7] developed a model of intermediate complexity compared with previous models, which only requires four to seven parameters, depending on the data available to characterize the behavior of dilatancy.
This model is based on a function (Equation (19)) divided into three parts.
i.
Pre-mobilization of dilatancy, where the dilation angle increases.
ii.
Mobilization of the peak dilatancy, where the dilation angle reaches its maximum value.
iii.
Post-mobilization of dilatancy, where the dilation angle decreases to zero.
ψ σ 3 , γ p = α · γ p · ψ p e a k e α 1 α · γ m   w h e n   γ p < γ m · e α 1 α ψ p e a k · α · l n γ p γ m + 1   w h e n   γ m · e α 1 α γ p < γ m ψ p e a k · e γ p γ m γ *   w h e n   γ p γ m ,
where
α = α 0 + α · σ 3 ,
γ * = γ 0   w h e n   σ 3 = 0 γ   w h e n   σ 3 0 .
ψ p e a k σ 3 = ϕ p e a k 1 + l o g 10 U C S · l o g 10 U C S σ 3 + 0.1     f o r   s e d i m e n t a r y   r o c k s ϕ p e a k · 1 β e 1 β 0 β β · σ 3   w h e n   σ 3 < e 1 β 0 β β ϕ p e a k · β 0 β · l n σ 3   w h e n   σ 3 > e 1 β 0 β β   f o r   c r y s t a l l i n e   r o c k s ,
where γp is the plastic shear strain, α0 determines the curvature of the pre-mobilization portion of the curve for σ3 = 0, α’ determines how the pre-mobilization curvature changes as a function of σ3, γm defines the plastic shear strain at which peak dilation is achieved, β0 defines the sensitivity of ψpeak to σ3 at low confinement, β’ defines the sensitivity of ψpeak to σ3 at high confinements, γ0 defines the decay rate of the dilation angle at post-mobilization for zero confinement, γ’ defines the decay rate of the dilation angle at post-mobilization for non-zero confinement, σ3 is the confining stress, and UCS is the uniaxial compressive strength.
The pre-mobilization phase is represented by a logarithmic curve with a tangent segment that connects to the origin. The post-mobilization phase is represented by an exponential decay function (Figure 7).
One of the advantages of presenting each part separately is the ability to study the influence of the parameters separately and achieve correlations with geomechanical parameters. In addition, the authors provide information on how to estimate each parameter of the model, whether data from laboratory tests are available.
The authors get a good agreement of their model with that of Zhao and Cai [2] and experimental results (Figure 8).
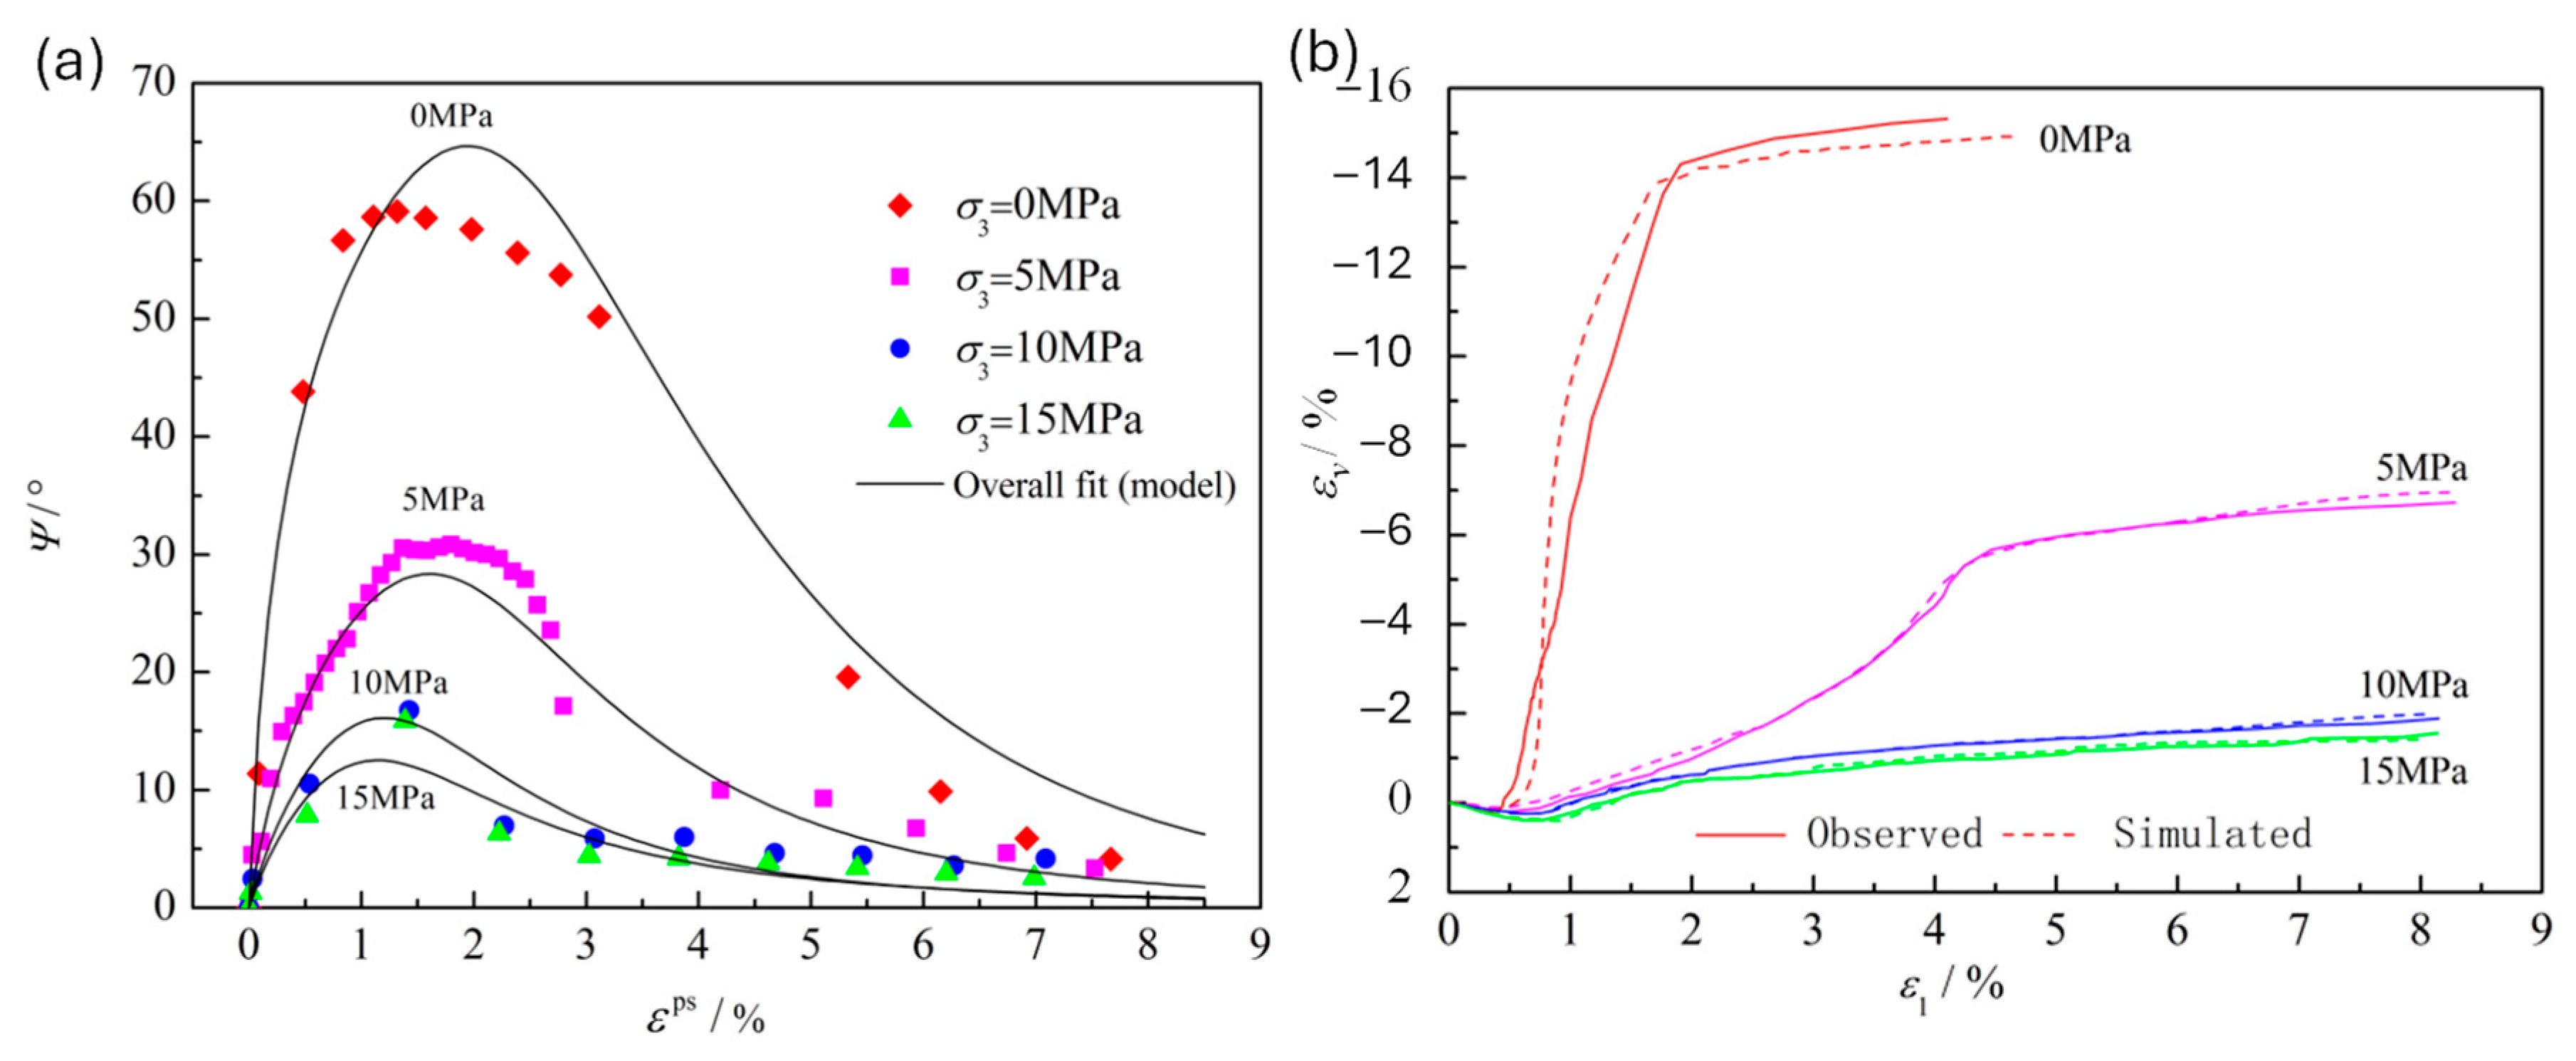
Chen et al. [83] developed a variable dilation angle model that considers the effects of confinement and equivalent plastic strain from uniaxial and triaxial compression tests on rock salt samples from Qiajiang, China. Following the methodology of Zhao and Cai [2], strength test results with confinements of 0, 5, 10, and 15 MPa were fitted to a logarithmic model dependent on four parameters (Equation (23)).
ψ = a · l n b · ε p s c ε p s d + 1 + 1 ,
where a, b, c, and d are fitting parameters, and εps is the plastic shear strain defined as in Equation (7).
These parameters, a, b, c, and d, in turn, depend on the confining stress. The model is finally defined by 12 parameters in total (a1, a2, a3, b1, b2, b3, c1, c2, c3, d1, d2, and d3) (Equations (24)–(27)):
a = a 1 · e a 2 · σ 3 + a 3 ,
b = b 1 · e σ 3 b 2 + b 3 ,
c = c 1 · σ 3 4 + c 2 · σ 3 3 + c 3 ,
d = d 1 + d 2 · e d 3 · σ 3 .
The authors obtained reasonably good agreement with experimental data of rock salt cores from the Qianjiang deposit (Figure 9a). Finally, the authors implemented the proposed variable dilation model in a FLAC3D compression strength test simulation and obtained results that agreed with the experimental observations (Figure 9b).
Rahjoo and Eberhardt [84] proposed a new empirical variable dilatancy model able to capture the dilatancy characteristics of the rock with a minimum number of input parameters, which facilitates its determination from triaxial compression tests and its implementation in numerical codes. The proposed model is based on the dilatancy model of Zhao and Cai [2] because its formulation describes the characteristics through a single equation; however, the authors introduce the normalization approach suggested by Walton and Diederichs [7] to reformulate it, where ψ and γp are normalized to the maximum dilation angle, ψpeak, and the shear plastic strain at which this peak dilation angle occurs, γppeak, respectively (Equation (28) or Equations (29)–(32)).
ψ ψ p e a k σ 3 = c b c · b c b c b · γ p γ p e a k p σ 3 1 · b c γ p γ p e a k p σ 3 1 ,
where b and c, are the fitting parameters of the model proposed by Zhao and Cai [2] Equations (15) and (16).
Alternatively, in a simplified manner:
Y = n n 1 n · X 1 · n X 1 n 1 ,
where
Y = ψ ψ p e a k σ 3 ,
X = γ p γ p e a k p σ 3 ,
n = b c .
The novelty of using this normalized space is that instead of formulating a dilatancy curve in the coordinates ψγp and modifying the parameters without knowing exactly how they affect the shape and size of the curve, the proposed model is a function of a single parameter (n) that the authors indicate that depends on the confining pressure and whose variation does not significantly affect the shape of the normalized dilatancy curve. Additionally, the authors recommended modeling its trend using simple decay equations for n and ψpeak, requiring only an initial value (n0 and ψpeak,0) and a decay rate (αn and αψ) Equations (33) and (34):
n σ 3 = n 0 · e α n · σ 3 ,
ψ p e a k σ 3 = ψ p e a k , 0 · e α ψ · σ 3 .
Regarding γppeak, the authors indicated that a constant value could be used for most rocks.
Compared to the model proposed by Zhao and Cai [2], the total number of parameters required for the proposed model was reduced to five. Compared with the Walton and Diederichs [7] model, the proposed model is defined by a single function that is valid for all values of confining pressure and plastic shear strain, γp.
Wang et al. [85], developed and implemented a coupled macro and meso-mechanical model for coal in FLAC3D, based on elastoplastic mechanics and the principles of energy dissipation and release. Since stress–strain curves cannot adequately reflect damage accumulation, strain localization, and microcrack propagation in the loaded coal, the authors observed the meso-behaviors using a data acquisition system of acoustic emissions (AE). Thus, they were able to better identify the progressive processes involved in coal failure. Furthermore, this model incorporates anisotropy by combining a statistical approach with the discrete fracture network (DFN) method to integrate it into FLAC3D and validate it by comparing the numerical results with the experimental data.
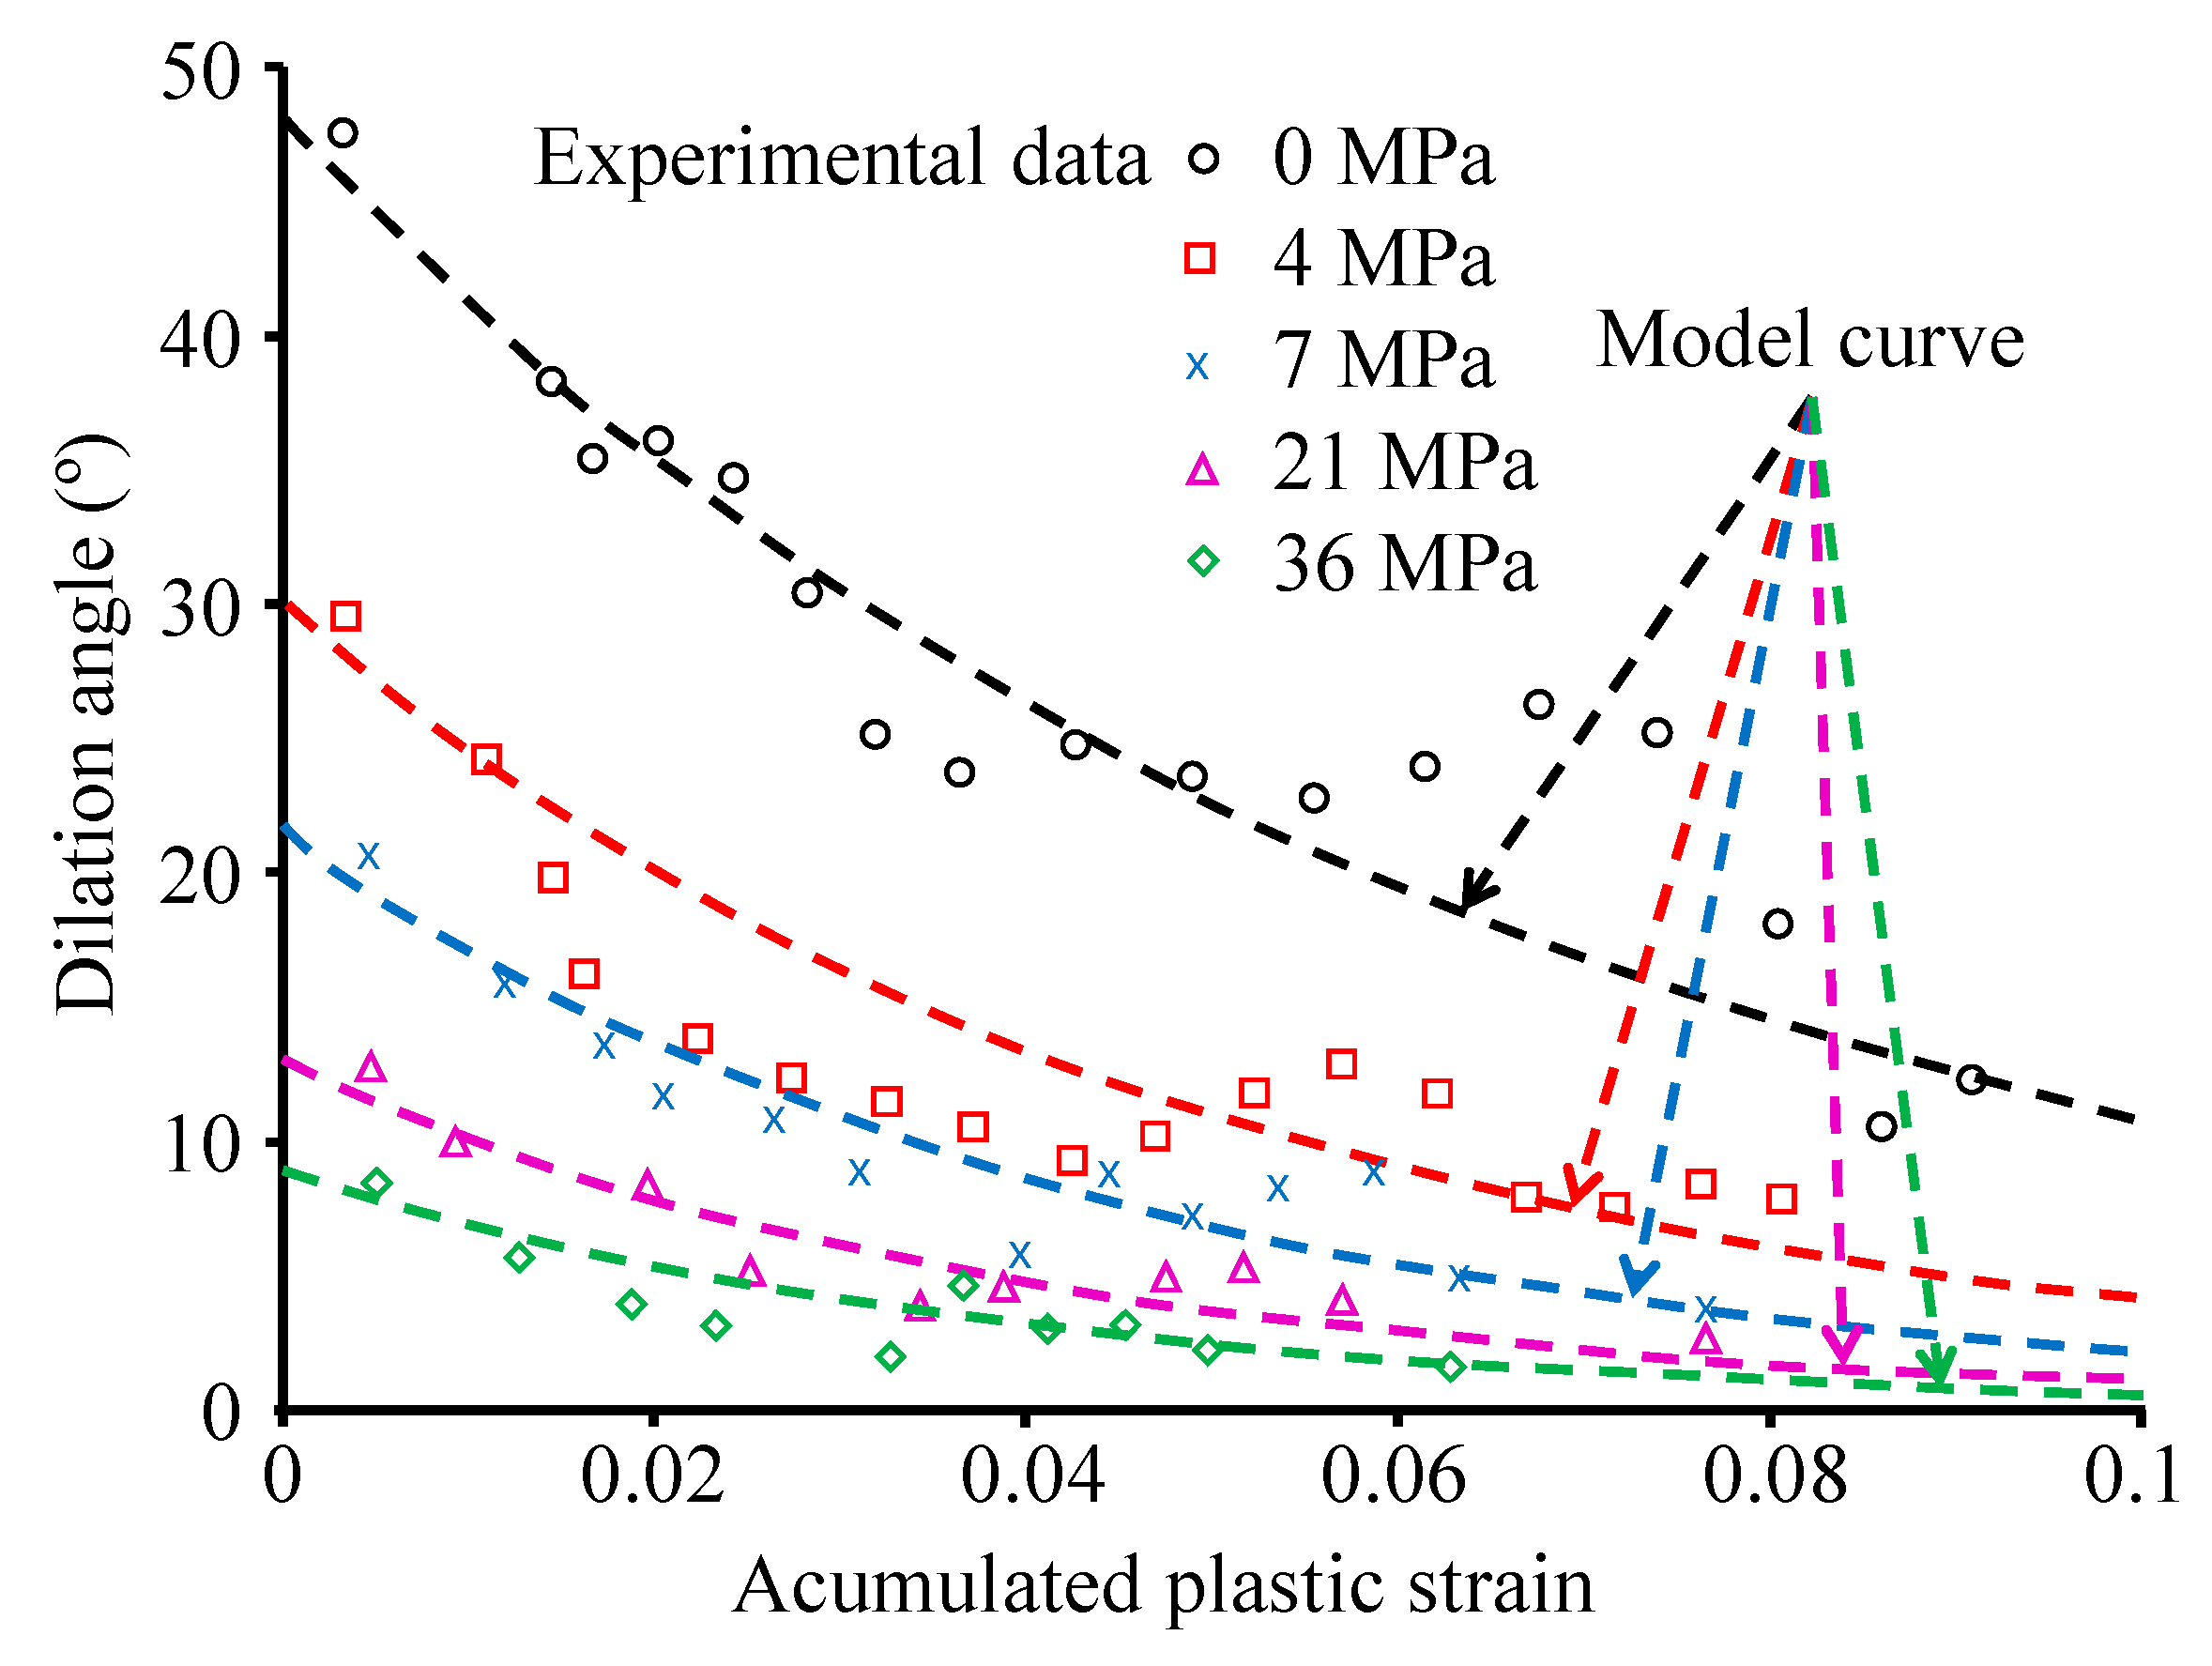
First, they fitted a negative exponential function to the experimental data to demonstrate the evolution of the dilation angle, both with the accumulated plastic strain (APS) and minor principal stress.
In the Zhao and Cai [2] model, the obtained dilation angle features values close to zero or even negative, which corresponds to the closing process of pre-existing microcracks at the beginning of the loading stage, implying a decrease in volume. However, Wang et al. [85] suggested that the incremental deformation of this stage should not be attributed to plastic flow. Therefore, they did not consider this stage in the development of the model, which resembles the framework proposed by Alejano and Alonso [30]. The difference with the model of Alejano and Alonso [30] is that Wang et al. considered the volumetric strain starting from the yield point (CD) instead of from the point of peak strength. The proposed equation (Equation (35)) effectively predicts the behavior of the dilation angle in coal samples under different stress states using parameters that are easily determinable (Figure 10):
ψ σ 3 , ξ = ψ 0 · a 1 · e a 2 · σ 3 + a 3 · e b 1 1 b 2 · e b 3 · σ 3 ξ ,
where ψ(σ3,ξ) is the dilation angle during yield stage, ψ0 is the initial dilation angle under uniaxial compression, ai and bi are fitting parameters, and ξ is the accumulated plastic strain.
Subsequently, they defined a strain-softening law for coal, characterizing cohesion using a modified Weibull-type functional distribution. Furthermore, they measured the energy conversion by monitoring the stress and strain variations in all the elements of the specimen during each calculation step in FLAC3D, noting that the degree of heterogeneity and discharge rate of the confining stress have a significant impact on the stress–strain response and evolution of AE events in loaded coal. The model effectively captures deformability, compressive strength, and AE characteristics, and realistically simulates the microcrack generation and propagation process.
Jin et al. [87] developed a model for the evolution of the strength parameters and dilation angle based on 30 types of rocks collected from the literature. The authors defined the internal plastic variable (κ) as a nonlinear function of the confining stress (Equation (36)), because if plastic strains are considered as an internal variable, it would lead to errors in the estimation, as occurs in various models in the literature according to Jin et al. [87];
κ = 2 3 e p T e p f σ 3 / σ c = e ¯ p f σ 3 / σ c ,
where ep is the vector of the deviatoric plastic strain (starting from the initial yield point), e ¯ p is the equivalent plastic strain, f(σ3/σc) is the confining pressure function, σ3 is the confining pressure, and σc is the unit stress.
The authors indicate that κ = 0 at the initial yield point, and κ = 1 at the starting point of the residual stage. Therefore, Equation (37) can be derived as follows:
f σ 3 / σ c = 2 3 e p T e p = e ¯ p .
The authors obtain the values of the critical equivalent plastic strain for different rocks and confinements and, to obtain the most suitable functions, they fitted 23 different functions based on only two or three parameters, so that they were close to the linear confining stress function. Among the 23 analyzed functions, they chose one with three parameters (Equation (38)) because it featured a better correlation with experimental data than the best one with only two parameters.
f = A 1 + A 2 σ 3 σ c A 3 .
The authors state that in the variable dilatancy models of Alejano and Alonso [30], Zhao and Cai [2], Pourhosseini and Shabanimashcool [5], and Wang et al. [85], the equivalent critical plastic strains or critical shear plastic strains under different confining stresses have the same value, which influences the correctness of the models. Therefore, to analyze the evolution of the dilation angle considering the influence of the internal plastic variable and confining stress, they proposed a negative exponential function (Equation (39)) that can correctly simulate the evolution of the dilation angle and overcome the defects of the existing models [87]:
ψ = α 1 · 1 + σ 3 σ c α 2 · e β 1 1 + σ 3 σ c β 2 · κ   w i t h 0 κ 1 ,
where α1 is the peak dilation angle, α2 denotes the influence of the confining stress on α1, β1 represents the decay rate of the dilation angle when increasing plastic internal variable under uniaxial compression, and β2 denotes the impact of the confining pressure on the decay rate β1.
In the residual stage (κ > 1), the authors indicate that κ can be assumed to be equal to 1.
The fitting parameters (α1, α2, β1, β2) were fitted through universal global optimization algorithms using the 1stOpt software, showing that most of the fitting curves agreed well with the discrete data, with a correlation coefficient R2 greater than 0.8 for most of the 30 compiled rocks (Figure 11).
Zhao and Li [86] proposed a dilatancy model that is based on separately applying the influences of plastic deformation history and confinement, corresponding to a simple piecewise expression, with five parameters that have clear physical meaning: (i) peak dilation angle (ψmax), (ii) limit dilation angle (ψlim), (iii) dilation angle decay rate (a), (iv) decay rate due to confinement (b), and (v) the value of the internal variable (κ) in the peak angle of dilatancy (κ*) (Equation (40)):
ψ κ , σ 3 = e b σ 3 · ψ m a x κ κ * 0.5 w h e n       κ κ * ψ m a x ψ l i m · e a · κ κ * 2 + ψ l i m w h e n   κ κ * .
They fitted the model to 13 types of rock extracted from the literature (Figure 12), obtaining better fits than those of Zhao and Cai [2] and Walton and Diederichs [7] on average, in addition to having fewer parameters than these models. Furthermore, the internal variable can be either the plastic shear strain (γp) or equivalent plastic strain ( ϵ ¯ p ).
Cai et al. [61] developed a model for the behavior of post-peak dilatancy (PPD) using the Alejano and Alonso [30] model as a basis because of its simplicity. The authors indicate that the constant 0.1 used in the Alejano and Alonso model to avoid numerical singularity (Equation (10)) may cause a theoretical error. Therefore, the authors studied the influence of this constant (Δ) in the model by varying its value from 1 to 0.001. The authors identified that the value of ψpeak/ϕ is very sensitive to this constant and proposed that the value of this constant may be dependent on the specific studied rock and the confinement.
Consequently, the authors modified the Alejano and Alonso model by introducing a new parameter (k) that correlates with the quality of the rock (assessed by the uniaxial compressive strength) in a linear manner, avoiding the numerical singularity and defining the model using two parameters (k and γp*) (Equation (41)):
ψ = ϕ l o g 10 k · l o g 10 σ 3 σ c i + k · e γ p γ p * .
Furthermore, they fitted the new model parameter for 11 different types of rock, considering both crystalline (hard) and sedimentary (soft) rocks, and found that a k value of 0.01 would be a good approach for most types of rocks, although its value may be obtained for each rock if strength test data are available.
Finally, they applied the model together with a 3D failure criterion to study the mechanical response of a circular tunnel and concluded that its application is more suitable for large-scale sedimentary (soft) rocks.
Wang et al. [99] analyzed the process of dilation of a granitic gneiss in cyclic triaxial strength tests from an energetic point of view. They used the cyclic loading to decompose the total energy into elastic strain energy (recoverable) and dissipation energy (damage). The authors defined a damage variable as the ratio of the dissipation energy at any point during the test to the dissipation energy at the peak strength. They also defined an energy dissipation rate as the ratio of the dissipation energy to the total energy at any point during the test. The authors analyzed the evolution of these parameters (damage variable and energy dissipation rate) as the test progresses and discovered that the damage variable features a linear relationship with plastic shear strain after the initial compaction phase, and that the slope of this trend depends on the confining stress, attaining a very good fit with an exponential function.
The authors proposed a two-parameter function to represent the behavior of the dilation angle with the plastic shear strain (Equation (42)). This equation is very similar to that obtained by Zhao and Cai [2], although they reached it from a different approach.
ψ = P 1 P 2 e P 2 γ p e P 1 γ p P 1 + P 2 .
The authors also identified that the dilation angle depends on the confining stress. They do not propose any equation to account for the confining stress dependency but give different values of the fitting parameters for different confining stresses.
Table 1 summarizes the 10 variable dilation angle models retrieved, showing their equations and main features.

4. Concluding Remarks

Dilation is a characteristic of geomaterials such as rocks and rock masses. Under load, rocks first contract and then dilate, showing a different volumetric strain behavior than that of axial or radial strain, which monotonically vary their value. Dilation is related to plastic deformations. Rock dilates because the growth of internal micro- or macrocracks requires a change in volume. Therefore, characterizing dilatancy implicitly implies knowing the plastic behavior of rocks, which is required for some specific engineering tasks, like optimization of reinforcement in highly stressed environments, caving mining or petroleum and gas extraction, just to mention a few.
Characterization of dilation usually must resort to laboratory-scale testing, since it is a controlled scenario that allows to aisle variables, and because very large-scale testing (such as the scale of a tunnel or a crown pillar in caving mining) is usually impractical for technical and economic issues.
The most appropriate parameter for characterizing dilation is the dilation angle. It is related to the plastic strain and is a good indicator of the volume change rate. The characterization of the dilation angle also requires the identification of its dependencies. It has been experimentally identified in laboratory tests that the dilation angle depends on the plastic strain history of rocks (the dilation angle attains a maximum value near the peak strength and then decreases as the plastic strain develops). Similarly, it has also been established that the minimum principal stress affects dilatancy (as the confining stress in conventional triaxial tests increases, the dilation angle diminishes because the increase in volume is restricted by lateral stress). It has also been identified that different rock types (sedimentary or crystalline) behave differently, and even the same type of rock behaves differently.
Following this line, all the proposed (and reviewed in this study) models add dependencies on both the confining stress and plastic strain history, although some models differ on the point where the plastic strain begins (some disregard any existing pre-peak plastic strain, whereas others consider plastic strains beginning from the Crack Damage stress). Some models also propose different parameter values or equations for different types of rocks. In addition, comparison between different models is not easy because there is a lack of standardization, and the models use different approaches and parameters, making it challenging to choose the most appropriate model for a given situation.
The dilatant behavior of rocks has been studied by only a few authors since the 1970s, and although some key advancements have been achieved in the last 20 years, there is still room for improvement in our knowledge of dilatancy.
These improvements could begin with the standardization of the procedures for the determination of the dilation angle. Until now, the ISRM Suggested Method for the complete stress–strain curve for intact rock in uniaxial compression [138] is the document that indicates how to perform uniaxial compression tests reaching the residual state, but there is no other Suggested Method for triaxial tests reaching the residual phase or a Suggested Method for determining the dilation angle. In addition, the existing Suggested Method does not describe how to decompose the total strain into its elastic and plastic components. It is known that plastic strains begin at a stress known as Crack Initiation (CI), but they are negligible compared to those after the Crack Damage stress (CD). Which stress should be considered as the initial point for the plastic strains? Considering the CI as the initial point for plastic strains is strictly the correct decision, but making so will result in negative dilation angles according to the Vermeer and De Borst [78] equation (Equation (9)) because the rock is still contracting between the CI and the CD. Therefore, it seems reasonable to consider CD as the initial point of the plastic strain, disregarding those between CI and CD. On the other hand, disregarding the plastic strains between CD and the peak strength may induce errors because it is precisely around this zone where the peak dilation angle is attained.
One of the aspects that may be identified is that, usually, the number of available experimental dilation angle data points is limited (Figure 6, Figure 9, and Figure 10, for instance), especially in the surroundings of the peak dilation angle. This may be because conventional testing equipment may be inappropriate for correctly capturing the failure of rock specimens. Fairhurst and Hudson [138] pointed out that the testing setup requires high-stiffness load frames, fast servocontrol, correct choice of feedback signal and strain measurement transducers, specimen preparation techniques, etc., but also indicated that testing some high-strength rocks becomes at best difficult. The unfulfillment of all these requirements may result in the loss of data points, especially immediately after the peak strength, or even recording the whole system (testing equipment and rock specimen) characteristics, which may result in an inaccurate calculation of the dilation angle.
Another assumption generally considered is that the elastic components of the strains are calculated using the pre-peak elastic moduli, irrespective of the analyzed phase (pre- or post-peak). Some studies, like that of Hou and Cai [139] for instance, show that Young’s modulus and Poisson’s ratio are not constant all along the stress–strain curve, but according to the CWFS model [44,140,141] they depend on the relation between cohesive and frictional components of the strength. If one assumes that the transition from peak to residual strength and the residual phase itself are cohesion loss processes, it seems reasonable to also consider the dependence of the elastic moduli on plastic strain. It is also important to note that the cyclical loading-unloading used to identify the elastic and plastic components of strains (as shown in Figure 1) induces increasing damage to the rock each time a cycle is performed, so the number of cycles performed per test should also be standardized to make test results comparable.
Apart from these practical concerns, there are still some other aspects that have not been addressed. As previously stated, it is known that the dilation angle depends on the plastic strain history and confining stress, and some efforts have been made to identify its dependence on the structure by the research group of the authors [13,58,142]. However, there have not been any studies on the dilation angle dependence on size or the effects of other variables usually considered in determining the mechanical properties of rocks, such as the temperature or water content.
The standardization of the procedures for determining the dilation angle could be a good starting point to address these dependencies of the dilation angle as well as new ones that will surely arise. More standardized experimental results will allow researchers to set the limits of existing models or to propose new models that better reflect the dilatant behavior of rocks.
Finally, this review contributes to the understanding of rock dilatancy with implications for both theoretical research and practical engineering applications in rock mechanics.

Author Contributions

Conceptualization, J.A.; methodology, D.I.-G. and J.A.; investigation, D.I.-G. and E.M.-B.; writing—original draft preparation, D.I.-G. and E.M.-B.; writing—review and editing, J.A., D.I.-G. and E.M.-B.; supervision, J.A.; funding acquisition, J.A. All authors have read and agreed to the published version of the manuscript.

Funding

This research was partially funded by the National Agency for Research and Development (ANID) of Chile, under project FONDECYT Iniciación #11190065. The APC was partially funded by the Universidad de Vigo.

Institutional Review Board Statement

Not applicable.

Informed Consent Statement

Not applicable.

Data Availability Statement

No new data was created.

Acknowledgments

The authors would like to acknowledge the National Agency for Research and Development (ANID) of Chile for partially funding this research, provided by the Fondecyt Iniciación Project No. 11190065. During the preparation of this manuscript, the authors used Paperpal, v. 2.129.3.0, for the purposes of checking English grammar and usage. The authors have reviewed and edited the manuscript and take full responsibility for the content of this publication.

Conflicts of Interest

The authors declare no conflicts of interest.

References

  1. Zhou, Y.; Sheng, Q.; Li, N.; Fu, X.; Zhang, Z.; Gao, L. A constitutive model for rock materials subjected to triaxial cyclic compression. Mech. Mater 2020, 144, 103341. [Google Scholar] [CrossRef]
  2. Zhao, X.G.; Cai, M. A mobilized dilation angle model for rocks. Int. J. Rock Mech. Min. Sci 2010, 47, 368–384. [Google Scholar] [CrossRef]
  3. Walton, G.; Diederichs, M.S. Dilation and Post-peak Behaviour Inputs for Practical Engineering Analysis. Geotech. Geol. Eng. 2015, 33, 15–34. [Google Scholar] [CrossRef]
  4. Liu, Y.; Dai, F. A review of experimental and theoretical research on the deformation and failure behavior of rocks subjected to cyclic loading. J. Rock Mech. Geotech. Eng. 2021, 13, 1203–1230. [Google Scholar] [CrossRef]
  5. Pourhosseini, O.; Shabanimashcool, M. Development of an elasto-plastic constitutive model for intact rocks. Int. J. Rock Mech. Min. Sci 2014, 66, 1–12. [Google Scholar] [CrossRef]
  6. Sinha, S.; Walton, G. Modeling behaviors of a coal pillar rib using the progressive S-Shaped yield criterion. J. Rock Mech. Geotech. Eng. 2020, 12, 484–492. [Google Scholar] [CrossRef]
  7. Walton, G.; Diederichs, M.S. A New Model for the Dilation of Brittle Rocks Based on Laboratory Compression Test Data with Separate Treatment of Dilatancy Mobilization and Decay. Geotech. Geol. Eng. 2015, 33, 661–679. [Google Scholar] [CrossRef]
  8. Eberhardt, E. Numerical modelling of three-dimension stress rotation ahead of an advancing tunnel face. Int. J. Rock Mech. Min. Sci. 2001, 38, 499–518. [Google Scholar] [CrossRef]
  9. Wu, F.; Deng, Y.; Wu, J.; Li, B.; Sha, P.; Guan, S.; Zhang, K.; He, K.; Liu, H.; Qiu, S. Stress-strain relationship in elastic stage of fractured rock mass. Eng. Geo. 2020, 268, 105498. [Google Scholar] [CrossRef]
  10. Morris, J.P.; Lomov, I.N.; Glenn, L.A. A constitutive model for stress-induced permeability and porosity evolution of Berea sandstone. J. Geophys. Res. Solid Earth. 2003, 108, 2485. [Google Scholar] [CrossRef]
  11. Liu, J.; Wu, N.; Si, G.; Zhao, M. Experimental study on mechanical properties and failure behaviour of the pre-cracked coal-rock combination. Bull. Eng. Geol. Environ. 2021, 80, 2307–2321. [Google Scholar] [CrossRef]
  12. Brown, E.T.; Trollope, D.H. Strength of a model of jointed rock. J. Soil Mech. Found. Div.—Am. Inst. Civ. Engrs. 1970, 96, 685. [Google Scholar] [CrossRef]
  13. Walton, G.; Alejano, L.R.; Arzúa, J.; Markley, T. Crack Damage parameters and dilatancy of artificially jointed granite samples under triaxial compression. Rock Mech. Rock Eng. 2018, 51, 1637–1656. [Google Scholar] [CrossRef]
  14. McQuillan, A.; Canbulat, I.; Oh, J. Methods applied in Australian industry to evaluate coal mine slope stability. Int. J. Min. Sci. Technol. 2020, 30, 151–155. [Google Scholar] [CrossRef]
  15. Gao, F.; Kang, H. Effects of pre-existing discontinuities on the residual strength of rock mass—Insight from a discrete element method simulation. J. Struct. Geol. 2016, 85, 40–50. [Google Scholar] [CrossRef]
  16. Munoz, H.; Taheri, A.; Chanda, E.K. Fracture energy-based brittleness index development and brittleness quantification by pre-peak strength parameters in rock uniaxial compression. Rock Mech Rock Eng. 2016, 49, 4587–4606. [Google Scholar] [CrossRef]
  17. Li, Y.; Jia, D.; Rui, Z.; Peng, J.; Fu, C.; Zhang, J. Evaluation method of rock brittleness based on statistical constitutive relations for rock damage. J. Pet. Sci. Eng. 2017, 153, 123–132. [Google Scholar] [CrossRef]
  18. Kumar, D.; Gutierrez, M.; Frash, L.P.; Hampton, J.C. Numerical modelling of experimental hydraulic fracture initiation and propagation in enhanced geothermal systems. In Proceedings of the 49th US Rock Mechanics/Geomechanics Symposium, San Francisco, CA, USA, 28 June–1 July 2015. [Google Scholar]
  19. Zhang, Z.; Liu, X.; Cheng, L.; Wu, S.; Zhang, B. A rheological constitutive model for damaged zone evolution of a tunnel considering strain hardening and softening. Geomech. Geophys. Geo-Energ. Geo-Res. 2020, 6, 56. [Google Scholar] [CrossRef]
  20. Gadepaka, P.R.; Jaiswal, A. A novel approach for the assessment of caving behaviour in a bord and pillar depillaring panel by using continuum modelling. Int. J. Rock Mech. Min. Sci. 2023, 170, 105476. [Google Scholar] [CrossRef]
  21. Hudson, J.A.; Crouch, S.L.; Fairhurst, C. Soft, stiff and servo-controlled testing machines: A review with reference to rock failure. Eng. Geo. 1972, 6, 155–189. [Google Scholar] [CrossRef]
  22. Zhao, H.; Liu, C.; Huang, G. Dilatancy behavior and permeability evolution of sandstone under triaxial compression. R. Soc. Open Sci. 2021, 8, 201792. [Google Scholar] [CrossRef]
  23. Bieniawski, Z.T. The effect of specimen size on compressive strength of coal. Int. J. Rock Mech. Min. Sci. Geomech. Abstr. 1968, 5, 325–326. [Google Scholar] [CrossRef]
  24. Brace, W.F.; Paulding, B.W., Jr.; Scholz, C. Dilatancy in the fracture of crystalline rocks. J. Geophys. Res. 1966, 71, 3939–3953. [Google Scholar] [CrossRef]
  25. Arzúa, J.; Alejano, L.R. Dilation in granite during servo-controlled triaxial strength tests. I Int. J. Rock Mech. Min. Sci. 2013, 61, 43–56. [Google Scholar] [CrossRef]
  26. Zheng, Z.; Feng, X.T.; Yang, C.X.; Zhang, X.W.; Li, S.J.; Qiu, S.L. Post-peak deformation and failure behaviour of Jinping marble under true triaxial stresses. Eng. Geol. 2020, 265, 105444. [Google Scholar] [CrossRef]
  27. Wang, Q.; Chen, W.; Peng, W.; Wang, Y.; Zhou, Y.; Peng, Z. Uniaxial compressive damage evolution and constitutive modelling of fissure-like rocks under different loading rates based on acoustic emission. Sci. Rep. 2025, 15, 2119. [Google Scholar] [CrossRef] [PubMed]
  28. Cai, M.; Hou, P.Y.; Zhang, X.W.; Feng, X.T. Post-peak stress-strain curves of brittle hard rocks under axial-strain-controlled loading. Int. J. Rock Mech. Min. Sci. 2021, 147, 104921. [Google Scholar] [CrossRef]
  29. Detournay, E. Elastoplastic model of a deep tunnel for a rock with variable dilatancy. Rock Mech. Rock Eng. 1986, 19, 99–108. [Google Scholar] [CrossRef]
  30. Alejano, L.R.; Alonso, E. Considerations of the dilatancy angle in rocks and rock masses. Int. J. Rock Mech. Min. Sci. 2005, 42, 481–507. [Google Scholar] [CrossRef]
  31. Shalev, E.; Lyakhovsky, V.; Ougier-Simonin, A.; Hamiel, Y.; Zhu, W. Inelastic compaction, dilation and hysteresis of sandstones under hydrostatic conditions. Geophys. J. Int. 2014, 197, 920–925. [Google Scholar] [CrossRef]
  32. Salehnia, F.; Collin, F.; Charlier, R. On the variable dilatancy angle in rocks around underground galleries. Rock Mech. Rock Eng. 2017, 50, 587–601. [Google Scholar] [CrossRef]
  33. Cieślik, J. Dilatancy as a measure of fracturing development in crystalline rocks. Op. Geosci. 2018, 10, 484–490. [Google Scholar] [CrossRef]
  34. Rethlefsen, M.L.; Kirtley, S.; Waffenschmidt, S.; Ayala, A.P.; Moher, D.; Page, M.J.; Koffel, J.B. PRISMA-S: An extension to the PRISMA Statement for Reporting Literature Searches in Systematic Reviews. Syst. Rev. 2021, 10, 39. [Google Scholar] [CrossRef]
  35. Bramer, W.M.; Rethlefsen, M.L.; Kleijnen, J.; Franco, O.H. Optimal database combinations for literature searches in systematic reviews: A prospective exploratory study. Syst. Rev. 2017, 6, 245. [Google Scholar] [CrossRef]
  36. Booth, A.; Sutton, A.; Clowes, M.; Martyn-St James, M. Systematic Approaches to a Successful Literature Review, 3rd ed.; Sage: Sydney, Australia, 2021; ISBN 978-152-97-1184-4. [Google Scholar]
  37. Gusenbauer, M.; Haddaway, N.R. Which academic search systems are suitable for systematic reviews or meta-analyses? Evaluating retrieval qualities of Google Scholar, PubMed, and 26 other resources. Res. Synt. Methods 2019, 11, 181–217. [Google Scholar] [CrossRef] [PubMed]
  38. Bieniawski, Z.T. Mechanism of brittle fracture of rock: Part I—Theory of the fracture process. Int. J. Rock Mech. Min. Sci. Geomech. Abstr. 1967, 4, 395–406. [Google Scholar] [CrossRef]
  39. Wawersik, W.R.; Fairhurst, C. A study of brittle rock fracture in laboratory compression experiments. Int. J. Rock Mech. Min. Sci 1970, 7, 561–575. [Google Scholar] [CrossRef]
  40. Hudson, J.A.; Harrison, J.P. Engineering Rock Mechanics an Introduction to the Principles; Elsevier Science Ltd.: Amsterdam, The Netherlands, 1997; Volume 440. [Google Scholar] [CrossRef]
  41. ISRM. The Complete ISRM Suggested Methods for Rock Characterization, Testing and Monitoring: 1974–2006; Ulusay, R., Hudson, J.A., Eds.; Prepared by the commission on testing methods, ISRM; ISRM: Ankara, Turkey, 2007; ISBN 978-9-759-36754-1. [Google Scholar]
  42. Siratovich, P.A.; Heap, M.J.; Villeneuve, M.C.; Cole, J.W.; Kennedy, B.M.; Davidson, J.; Reuschlé, T. Mechanical behaviour of the Rotokawa Andesites (New Zealand): Insight into permeability evolution and stress-induced behaviour in an actively utilised geothermal reservoir. Geothermics. 2016, 64, 163–179. [Google Scholar] [CrossRef]
  43. Hoek, E.; Brown, E.T. Empirical strength criterion for rock masses. J. Geotech. Eng. Div. ASCE. 1980, 106, 1013–1035. [Google Scholar] [CrossRef]
  44. Martin, C.D.; Chandler, N.A. The progressive fracture of Lac du Bonnet granite. Int. J. Rock Mech. Min. Sci. & Geomech. Abstr. 1994, 31, 643–659. [Google Scholar] [CrossRef]
  45. Hoek, E.; Carranza-Torres, E.T.; Corkum, B. Hoek-Brown criterion—2002 Edition. In Mining and Tunnelling Innovation and Opportunity, Proceedings of the 5th North American Rock Mechanics Symposium and 17th Tunnelling Association of Canada Conference, Toronto, ON, Canada, 7–10 July 2002; Hammah, R., Bawden, W., Curran, J., Telesnicki, M., Eds.; University of Toronto: Toronto, ON, Canada, 2002; pp. 267–273. [Google Scholar]
  46. Rafiei Renani, H.; Martin, C.D. Cohesion degradation and friction mobilization in brittle failure of rocks. Int. J. Rock Mech. Min. Sci. 2018, 106, 1–13. [Google Scholar] [CrossRef]
  47. Yang, S.Q.; Jing, H.W.; Wang, S.Y. Experimental investigation on the strength, deformability, failure behavior and acoustic emission locations of red sandstone under triaxial compression. Rock Mech. Rock Eng. 2012, 45, 583–606. [Google Scholar] [CrossRef]
  48. Hashiba, K.; Okubo, S.; Fukui, K. A new testing method for investigating the loading rate dependency of peak and residual rock strength. Int. J. Rock Mech. Min. Sci. 2006, 43, 894–904. [Google Scholar] [CrossRef]
  49. He, M.; Zhang, Z.; Zheng, J.; Chen, F.; Li, N. A new perspective on the constant mi of the Hoek–Brown failure criterion and a new model for determining the residual strength of rock. Rock Mech. Rock Eng. 2020, 53, 3953–3967. [Google Scholar] [CrossRef]
  50. Gao, F.; Kang, H. Experimental study on the residual strength of coal under low confinement. Rock Mech. Rock Eng. 2017, 50, 285–296. [Google Scholar] [CrossRef]
  51. Walton, G.; Gaines, S.; Alejano, L.R. Validity of continuous-failure-state unloading triaxial tests as a means to estimate the residual strength of rocks. J. Rock Mech. Geotech. Eng. 2021, 13, 717–726. [Google Scholar] [CrossRef]
  52. Walton, G.; Labrie, D.; Alejano, L.R. On the residual strength of rocks and rock masses. Rock Mech. Rock Eng. 2019, 52, 4821–4833. [Google Scholar] [CrossRef]
  53. Alejano, L.R.; Walton, G.; Gaines, S. Residual strength of granitic rocks. Tunn. Undergr. Space Technol. 2021, 118, 104189. [Google Scholar] [CrossRef]
  54. Peng, J.; Cai, M.; Rong, G.; Yao, M.D.; Jiang, Q.H.; Zhou, C.B. Determination of confinement and plastic strain dependent post-peak strength of intact rocks. Eng. Geol. 2017, 218, 187–196. [Google Scholar] [CrossRef]
  55. Lajtai, E.Z. Brittle fracture in compression. Int. J. Fract. 1974, 10, 525–536. [Google Scholar] [CrossRef]
  56. Huang, B.; Liu, J. The effect of loading rate on the behavior of samples composed of coal and rock. Int. J. Rock Mech. Min. Sci. 2013, 61, 23–30. [Google Scholar] [CrossRef]
  57. Arzúa, J.; Alejano, L.R.; Clérigo, I.; Pons, B.; Méndez, F.; Prada, F. Stability analysis of a room & pillar hematite mine and techniques to manage local instability problems. In Rock Engineering and Rock Mechanics: Structures in and on Rock Masses, Proceedings of the Eurock 2014, ISRM European Regional Symposium, Vigo, Spain, May 27–29 2014; ISRM: Lisbon, Portugal, 2014. [Google Scholar] [CrossRef]
  58. Arzúa, J.; Alejano, L.R.; Walton, G. Strength and dilation of jointed granite specimens in servo-controlled triaxial tests. Int. J. Rock Mech. Min. Sci. 2014, 69, 93–104. [Google Scholar] [CrossRef]
  59. Kuang, Z.; Qiu, S.; Li, S.; Du, S.; Huang, J.; Chen, X. A new brittleness index based on the characteristics of complete stress-strain behaviors. Rock Mech. Rock. Eng. 2021, 54, 1109–1128. [Google Scholar] [CrossRef]
  60. Fang, Z.; Harrison, J.P. A mechanical degradation index for rock. Int. J. Rock Mech. Min. Sci. 2001, 38, 1193–1199. [Google Scholar] [CrossRef]
  61. Cai, W.; Zhu, H.; Liang, W.; Wang, X.; Su, C.; Wei, X. A post-peak dilatancy model for soft rock and its application in deep tunnel excavation. J. Rock Mech. Geotech. Eng. 2023, 15, 683–701. [Google Scholar] [CrossRef]
  62. Jaeger, J.C.; Cook, N.G.W.; Zimmerman, R. Fundamentals of Rock Mechanics, 4th ed.; Wiley-Blackwell: Hoboken, NJ, USA, 2007; ISBN 978-0-632-05759-7. [Google Scholar]
  63. Meyer, B.R.; Jacot, R.H. Impact of stress-dependent Young’s moduli on hydraulic fracture modelling. In Proceedings of the 38th US Rock Mechanics/Geomechanics Symposium, Washington, DC, USA, 7–10 July 2001. [Google Scholar]
  64. Hoek, E.; Martin, C.D. Fracture initiation and propagation in intact rock—A review. J. Rock Mech. Geotech. Eng. 2014, 6, 287–300. [Google Scholar] [CrossRef]
  65. Ramírez-Oyanguren, P.; Alejano, L. Mecánica de Rocas: Fundamentos e Ingeniería de Taludes; Red DESIR: Madrid, Spain, 2008; ISBN 978-8-496-39817-7. (In Spanish) [Google Scholar]
  66. Ren, C.; Yu, J.; Cai, Y.; Yao, W.; Lai, Y.; Li, B. A novel constitutive model with plastic internal and damage variables for brittle rocks. Eng. Fract. Mech. 2021, 248, 107731. [Google Scholar] [CrossRef]
  67. Walton, G.; Hedayat, A.; Kim, E.; Labrie, D. Post-yield Strength and Dilatancy Evolution Across the Brittle–Ductile Transition in Indiana Limestone. Rock Mech. Rock Eng. 2017, 50, 1691–1710. [Google Scholar] [CrossRef]
  68. Al-shayea, N.A. Effects of testing methods and conditions on the elastic properties of limestone rock. Eng. Geol. 2004, 74, 139–156. [Google Scholar] [CrossRef]
  69. Medhurst, T.P.; Brown, E.T. A study of the mechanical behaviour of coal for pillar design. Int. J. Rock Mech. Min. Sci. 1998, 35, 1087–1105. [Google Scholar] [CrossRef]
  70. Fossen, H. Structural Geology; Cambridge University Press: New York, NY, USA, 2010; ISBN 978-0-521-51664-8. [Google Scholar]
  71. Bruning, T.; Karakus, M.; Nguyen, G.D.; Goodchild, D. Experimental study on the damage evolution of brittle rock under triaxial confinement with full circumferential strain control. Rock Mech. Rock Eng. 2018, 51, 3321–3341. [Google Scholar] [CrossRef]
  72. Chen, Y.; Zuo, J.; Li, Z.; Dou, R. Experimental investigation on the crack propagation behaviors of sandstone under different loading and unloading conditions. Int. J. Rock Mech. Min. Sci. 2020, 130, 104310. [Google Scholar] [CrossRef]
  73. Xu, R.; Zhang, S.; Li, Z.; Yan, X. Experimental investigation of the strain rate effect on crack initiation and crack damage thresholds of hard rock under quasi-static compression. Acta Geotech. 2023, 18, 903–920. [Google Scholar] [CrossRef]
  74. Bai, Q.; Friedel, M.; Konietzky, H. Experimental investigation of stress unloading effects on rocl damage and confining pressure-dependent crack initiation stress of porous sandstone under true triaxial stress environments. Rock Mech. Bull. 2024, 3, 100111. [Google Scholar] [CrossRef]
  75. Lockner, D.A.; Byerlee, J.D.; Kuksenko, V.; Ponomarev, A.; Sidorin, A. Quasi-static fault growth and shear fracture energy in granite. Nature 1991, 6313, 39–42. [Google Scholar] [CrossRef]
  76. Nicksiar, M.; Martin, C.D. Evaluation of methods for determining crack initiation in compression tests on low-porosity rocks. Rock Mech. Rock Eng. 2012, 45, 607–617. [Google Scholar] [CrossRef]
  77. Abbas, H.A.; Mohamed, Z.; Kudus, S.A. Deformation behaviour, crack initiation and crack damage of weathered composite sandstone-shale by using the ultrasonic wave and the acoustic emission under uniaxial compressive stress. Int. J. Rock Mech. Min. Sci. 2023, 170, 105497. [Google Scholar] [CrossRef]
  78. Vermeer, P.A.; de Borst, R. Non-associated plasticity for soils, concrete and rock. Heron 1984, 29, 1–64. [Google Scholar]
  79. Itasca. User Manual for FLAC, Version 4.0; Itasca Consulting Group, Inc.: Minneapolis, MN, USA, 2000. [Google Scholar]
  80. Yi, K.; Kang, H.; Ju, W.; Liu, Y.; Lu, Z. Synergistic effect of strain softening and dilatancy in deep tunnel analysis. Tunn. Undergr. Space Technol. 2020, 97, 103280. [Google Scholar] [CrossRef]
  81. Walton, G.; Diederichs, M.S.; Arzúa, J. A detailed look at pre-peak dilatancy in a granite—Determining “plastic” strains from laboratory test data. In Rock Engineering and Rock Mechanics: Structures in and on Rock Masses, Proceedings of the Eurock 2014, ISRM European Regional Symposium, Vigo, Spain, 27–29 May 2014; ISRM: Vigo, Spain, 2014. [Google Scholar] [CrossRef]
  82. Cai, W.; Dou, L.; Ju, Y.; Cao, W.; Yuan, S.; Si, G. A plastic strain-based damage model for heterogeneous coal using cohesion and dilation angle. Int. J. Rock Mech. Rock Eng. 2018, 110, 151–160. [Google Scholar] [CrossRef]
  83. Chen, Y.; Ma, L.; Fan, P.; Yang, X.; Dong, L. Nonlinear Volumetric Deformation Behavior of Rock Salt Using the Concept of Mobilized Dilatancy Angle. Open J. Civ. Eng. 2016, 10, 524–531. [Google Scholar] [CrossRef]
  84. Rahjoo, M.; Eberhardt, E. A simplified dilation model for modeling the inelastic behavior of rock. In 50th US Rock Mechanics/Geomechanics Symposium; ARMA: Houston, TX, USA, 2016; Volume 3, pp. 1957–1961. [Google Scholar]
  85. Wang, J.; Wang, Z.; Yang, S. A coupled macro- and meso-mechanical model for heterogeneous coal. Int. J. Rock Mech. Min. Sci. 2017, 94, 64–81. [Google Scholar] [CrossRef]
  86. Zhao, R.; Li, C. A New Dilation Angle Model for Rocks. Rock Mech. Rock Eng. 2022, 55, 5345–5354. [Google Scholar] [CrossRef]
  87. Jin, J.; She, C.; Shang, P. Evolution models of the strength parameters and shear dilation angle of rocks considering the plastic internal variable defined by a confining pressure function. Bull. Eng. Geol. Environ. 2021, 80, 2925–2953. [Google Scholar] [CrossRef]
  88. Yang, F.; Zhou, H.; Zhang, C.; Hu, D.; Lu, J.; Meng, F. An elastoplastic coupling mechanical model for hard and brittle marble with consideration of the first stress invariant effect. Eur. J. Environ. Civ. Eng. 2016, 22, 405–428. [Google Scholar] [CrossRef]
  89. Hoek, E.; Brown, E.T. Practical Estimates of Rock Mass Strength. Int. J. Rock Mech. Min. Sci. 1997, 34, 1165–1186. [Google Scholar] [CrossRef]
  90. Wang, S.; Zheng, H.; Li, C.; Ge, X. A finite element implementation of strain-softening rock mass. Int. J. Rock Mech. Min. Sci. 2011, 48, 67–76. [Google Scholar] [CrossRef]
  91. Hou, P.Y.; Cai, M. Post-peak stress-strain curves of brittle hard rocks under different loading environment system stiffness. Rock Mech. Rock Eng. 2023, 55, 3837–3857. [Google Scholar] [CrossRef]
  92. Chen, J.; Wang, W.; Chen, L. A strain hardening and softening constitutive model for hard brittle rocks. Appl. Sci. 2023, 13, 2764. [Google Scholar] [CrossRef]
  93. Davarpanah, S.M.; Shargi, M.; Narimani, S.; Török, A.; Vásárhelyi, B. Brittle-ductile transition stress of different rock types and its relationship with uniaxial compressive strength and Hoek-Brown material constant (mi). Sci. Rep. 2023, 13, 1186. [Google Scholar] [CrossRef]
  94. Paterson, M.S.; Wong, T.F. Experimental Rock Deformation—The Brittle Field, 2nd ed.; Springer: Berlin, Germany, 2005; ISBN 978-3-540-24023-5. [Google Scholar]
  95. Von Karaman, T. Festigkeitsversuche unter allseitigem druck. Verh. Dtsch. Ing. 1911, 55, 1749–1757. [Google Scholar]
  96. Peng, S.S. Time-dependent aspects of rock behavior as measured by a servocontrolled hydraulic testing machine. Int. J. Rock Mech. Min. Sci. Geomech. Abstr. 1973, 10, 235–236, IN212–IN22, 237–246. [Google Scholar] [CrossRef]
  97. Paraskevopoulou, C.; Perras, M.; Diederichs, M.; Amann, F.; Löw, S.; Lam, T.; Jensen, M. The three stages of stress-relaxation—Observations for the time dependent behaviour of brittle rocks based on laboratory testing. Eng. Geol. 2017, 216, 56–75. [Google Scholar] [CrossRef]
  98. He, Z.; Wu, G.; Zhu, J. Mechanical properties of rock under uniaxial compression tests of different control modes and loading rates. Sci. Rep. 2024, 14, 2164. [Google Scholar] [CrossRef]
  99. Wang, B.; Zhu, J.; Jin, Z.; Xu, D.; Zhu, Y.; Guo, Z. Energy dissipation and dilation processes of rock mass under different loading conditions. Sci. Rep. 2025, 15, 17303. [Google Scholar] [CrossRef]
  100. Cui, G.; Meng, F.; Wang, W.; Liu, P.; Wen, Y.; Yue, Z.; Zhou, H.; Zhang, L. Deformation rate effects in the circumferential strain-controlled post-peak loading tests. Rock Mech. Rock Eng. 2025, 58, 8173–8194. [Google Scholar] [CrossRef]
  101. Hadizadeh, J.; Rutter, E.H. The low temperature brittle-ductile transition in quartzite and occurrence of cataclastic flow in nature. Geol Rundsch. 1983, 72, 493–503. [Google Scholar] [CrossRef]
  102. Lazemi, H.A.; Soleiman Dehkordi, M. Application of TBM operational parameters to estimate the drop modulus, case study: Karaj–Tehran water conveyance tunnel of Iran. Int. J. Geo-Eng. 2016, 7, 6. [Google Scholar] [CrossRef]
  103. Bai, Y.; Guan, S.; Tang, Z.; Florez-Lopez, J. Strain-degradation analysis of tunnel structures based on twin-shear unified strength criterion. Lat. Am. J. Solid Struct. 2020, 17, e251. [Google Scholar] [CrossRef]
  104. Lin, Q.; Cao, P.; Wang, P. Study of post-peak strain-softening mechanical behavior of rock material based on Hoek-Brown criterion. Adv. Civ. Eng. 2018, 2018, 6190376. [Google Scholar] [CrossRef]
  105. Zheng, Z.; Liu, H.; Zhuo, L.; Xiao, M.; Xie, H.; He, J.; Peng, M. Experimental study on the dilatancy and energy evolution behaviors of red-bed rocks under unloading conditions. Materials 2023, 16, 5759. [Google Scholar] [CrossRef]
  106. Castro-Filgueira, U.; Alejano, L.R.; Ivars, D.M. Particle flow code simulation of intact and fissured granitic rock samples. J. Rock Mech. Geotech. Eng. 2020, 12, 960–974. [Google Scholar] [CrossRef]
  107. Hansen, B. Line ruptures regarded as narrow rupture zones: Basic equations based on kinematic considerations. Proc. Conf. Earth Press. Probl. 1958, 1, 39–48. [Google Scholar]
  108. Jaiswal, A.; Shrivastva, B.K. Numerical simulation of coal pillar strength. Int. J. Rock Mech. Min. Sci. 2009, 46, 779–788. [Google Scholar] [CrossRef]
  109. Brown, E.T.; Bray, J.W.; Ladanyi, B.; Hoek, E. Ground response curves for rock tunnels. J. Geotech. Eng. 1983, 109, 15–39. [Google Scholar] [CrossRef]
  110. Alejano, L.R.; Alonso, E.; Rodríguez-Dono, A.; Fernández-Manín, G. Application of the convergence-confinement method to tunnels in rock masses exhibiting Hoek-Brown strain-softening behaviour. Int. J. Rock Mech. Min. Sci. 2010, 47, 150–160. [Google Scholar] [CrossRef]
  111. Rahjoo, M.; Eberhardt, E. Development of a 3-D confinement-dependent dilation model for brittle rocks; part 2, formulation and parameterization based on the Cartesian plastic strain increments ratios approach. Int. J. Rock Mech. Min. Sci. 2021, 148, 104773. [Google Scholar] [CrossRef]
  112. Crouch, S.L. Experimental determination of volumetric strains in failed rock. Int. J. Rock Mech. Min. Sci. Geomech. Abstr. 1970, 7, 589–603. [Google Scholar] [CrossRef]
  113. Farmer, I. Engineering Behavior of Rocks, 2nd ed.; Chapman and Hall Ltd.: London, UK, 1983; ISBN 978-0-412-13980-2. [Google Scholar]
  114. Hassani, F.P.; White, M.J.; Branch, D. Behaviour of yielded rock in tunnel design. In Proceedings of the Second International Conference on Stability in Underground Mining, Lexington, KY, USA, 6–8 August 1984. [Google Scholar]
  115. Zhang, J.C. Experimental and modelling investigations of the coupled elastoplastic damage of a quasi-brittle rock. Rock Mech. Rock Eng. 1970, 51, 465–478. [Google Scholar] [CrossRef]
  116. Kumar, R.; Sharma, K.G.; Varadarajan, A. Post-peak response of some metamorphic rocks of India under high confining pressures. Int. J. Rock Mech. Min. Sci. 2010, 47, 1357–1362. [Google Scholar] [CrossRef]
  117. Xie, N.; Zhu, Q.Z.; Xu, L.H.; Shao, J.F. A micromechanics-based elastoplastic damage model for quasi-brittle rocks. Comput. Geotech. 2011, 38, 970–977. [Google Scholar] [CrossRef]
  118. Chen, L.; Wang, C.P.; Liu, J.F.; Liu, J.; Wang, J.; Jia, Y.; Shao, J.F. Damage and plastic deformation modeling of Beishan granite under compressive stress conditions. Rock Mech. Rock Eng. 2015, 48, 1623–1633. [Google Scholar] [CrossRef]
  119. Sun, C.; Zhang, S.G.; Jia, B.X.; Wu, Z.Q. Physical and numerical model tests on post-peak mechanical properties of granite. Chin. J. Geo. Eng. 2015, 37, 847–852. (In Chinese) [Google Scholar] [CrossRef]
  120. Zhang, S.G.; Liu, J.Q.; Chen, P.P.; Sun, C.A.; Wang, Y.T. Experimental research on mechanical properties of granite under water-rock coupling. Chin. J. Rock Mech. Eng. 2015, 34, 520–527. (In Chinese) [Google Scholar] [CrossRef]
  121. Jiang, Q.; Zhong, S.; Cui, J.; Feng, X.T.; Song, L. Statistical characterization of the mechanical parameters of intact rock under triaxial compression: An experimental proof of the Jinping marble. Rock Mech. Rock Eng. 2016, 49, 4631–4646. [Google Scholar] [CrossRef]
  122. Zhang, Q.; Jiang, B.S.; Lv, H.J. Analytical solution for a circular opening in a rock mass obeying a three-stage stress-strain curve. Int. J. Rock Mech. Min. Sci. 2016, 86, 16–22. [Google Scholar] [CrossRef]
  123. Yao, M.D.; Rong, G.; Zhou, C.B.; Peng, J. Effects of thermal damage and confining pressure on the mechanical properties of coarse marble. Rock Mech. Rock Eng. 2016, 49, 2043–2054. [Google Scholar] [CrossRef]
  124. Zhang, H.J.; Li, C.C. Effects of confining stress on the post-peak behaviour and fracture angle of Fauske marble and Iddefjord granite. Rock Mech. Rock Eng. 2019, 52, 1377–1385. [Google Scholar] [CrossRef]
  125. Zhang, L.; Gao, S.; Wang, Z.; Cong, Y. Analysis of marble failure energy evolution under loading and unloading conditions. Chin. J. Rock Mech. Eng. 2013, 32, 1572–1578. (In Chinese) [Google Scholar]
  126. Zhang, C.Q.; Feng, X.T.; Zhou, H.; Qiu, S.; Yang, Y.S. Rock mass damage induced by rockbursts occurring on tunnel floors: A case study of two tunnels at the Jinping II Hydropower Station. Environ. Earth Sci. 2014, 71, 441. [Google Scholar] [CrossRef]
  127. Liu, Z.B.; Shao, J.F. Strength behavior, creep failure and permeability change of a tight marble under triaxial compression. Rock Mech. Rock Eng. 2017, 50, 529–541. [Google Scholar] [CrossRef]
  128. Liu, J.; Li, J.P. Experimental research on sandstone pre-peak unloading process under high confining pressure. Chin. J. Rock Mech. Eng. 2011, 30, 473–479. (In Chinese) [Google Scholar]
  129. Yang, S.Q. Experimental study on deformation, peak strength and crack damage behavior of hollow sandstone under conventional triaxial compression. Eng. Geol. 2016, 213, 11–24. [Google Scholar] [CrossRef]
  130. Zong, Y.J.; Han, L.J.; Wei, J.J.; Wen, S.Y. Mechanical and damage evolution properties of sandstone under triaxial compression. Int. J. Min. Sci. Technol. 2016, 26, 601–607. [Google Scholar] [CrossRef]
  131. Xia, Y.J.; Li, L.C.; Tang, C.A.; Li, X.Y.; Mas, S.; Li, M. A new method to evaluate rock mass brittleness based on stress-strain curves of class I. Rock Mech. Rock Eng. 2017, 50, 1123–1139. [Google Scholar] [CrossRef]
  132. Chen, Z.Q.; He, C.; Ma, G.Y.; Xu, G.W.; Ma, C.C. Energy damage evolution mechanism of rock and its application to brittleness evaluation. Rock Mech. Rock Eng. 2019, 52, 1265–1274. [Google Scholar] [CrossRef]
  133. Lu, Y.L.; Wang, L.G.; Yang, F.; Li, Y.J.; Chen, H.M. Post-peak strain softening mechanical properties of weak rock. Chin. J. Rock Mech. Eng. 2010, 29, 640–648. (In Chinese) [Google Scholar]
  134. Yu, H.C.; Zhang, X.S.; Liu, H.D.; Huang, Z.Q.; Shi, G.C. Stress relaxation behavior of silty mudstone considering the effect of confining pressure. Environ. Earth Sci. 2016, 75, 1001. [Google Scholar] [CrossRef]
  135. Yang, S.Q.; Tian, W.L.; Jing, H.W.; Huang, Y.H.; Yang, X.X.; Meng, B. Deformation and damage failure behavior of mudstone specimens under single-stage and multi-stage triaxial compression. Rock Mech. Rock Eng. 2019, 52, 673–689. [Google Scholar] [CrossRef]
  136. Zhang, J.; Ai, C.; Li, Y.W.; Che, M.G.; Gao, R.; Zeng, J. Energy-based brittleness index and acoustic emission characteristics of anisotropic coal under triaxial stress condition. Rock Mech. Rock Eng. 2018, 51, 3343–3360. [Google Scholar] [CrossRef]
  137. Jia, C.J.; Xu, W.Y.; Wang, S.S.; Wang, R.; Yu, J. Experimental analysis and modeling of the mechanical behavior of breccia lava in the dam foundation of the Baihetan Hydropower Project. Bull. Eng. Geol. Environ. 2019, 78, 2681–2695. [Google Scholar] [CrossRef]
  138. Fairhurst, C.E.; Hudson, J.A. Draft ISRM suggested method for the complete stress-strain curve for intact rock in uniaxial compression. Int. J. Rock Mech. Min Sci. 1999, 36, 279–289. [Google Scholar] [CrossRef]
  139. Hou, P.Y.; Cai, M. A modified Hoek-Brown model for determining plastic strain-dependent post-peak strength of brittle rock. Rock Mech. Rock Eng. 2023, 56, 2375–2393. [Google Scholar] [CrossRef]
  140. Hajiabdolmajid, V.; Kaiser, P.K.; Martin, C.D. Mobilised strength components in brittle failure of rock. Geotechnique. 2003, 53, 327–336. [Google Scholar] [CrossRef]
  141. Hajiabdolmajid, V.; Kaiser, P.K.; Martin, C.D. Modelling brittle failure of rock. Int. J. Rock Mech. Min. Sci. 2002, 39, 731–741. [Google Scholar] [CrossRef]
  142. Arzúa, J.; Alejano, L.R. Study of the mechanical behavior of intact and jointed rocks in laboratory with particular emphasis on dilatancy. In Proceedings of the 10th Asian Rock Mechanics Symposium (ARMS10) and the 2018 ISRM International Symposium, Singapore, 29 October–3 November 2018; Zhao, Z., Zhou, Y., Shang, J., Eds.; ISRM: Singapore, 2018; ISBN 978-981-11-9003-2. [Google Scholar]
Figure 1. Complete stress–strain curves of a triaxial strength test (σ 3 = 2 MPa) in a granite specimen with unloading and reloading cycles. The pre-peak (E, ν, CI, CD, σ1peak) and post-peak (M, σ1residual) parameters are also indicated.
Applsci 15 09872 g001
Figure 3. Actual and ideal stress–strain relationships as proposed by the Alejano and Alonso variable dilatancy model. Note that the axial stress–axial strain relationships in the model are linear, as is the pre-peak portion of the volumetric strain–axial strain relationship. Also note that the model disregards pre-peak plastic strains [30].
Applsci 15 09872 g003
Figure 4. Parameters of the mobilized dilation angle model of Zhao and Cai [2] controlling the position of the peak dilation angle and shape of the dilation angle decay: (a) a and b as variables with c = 0.1, and (b) a and c as variables with b = 10 [2].
Applsci 15 09872 g004
Figure 5. Graphical results of the Zhao and Cai [2] mobilized dilation angle model for seven rocks [2] and three granites [25] at a confinement of 1 MPa.
Applsci 15 09872 g005
Figure 6. Test and model results of the variation in the dilation angle on post-peak stage versus the plastic parameter for (a) sandstone, (b) mudstone, and (c) silty sandstone [5].
Applsci 15 09872 g006
Figure 7. Dilation angle behavior as a function of the plastic shear strain obtained from the Walton and Diederichs model [7].
Applsci 15 09872 g007
Figure 8. Results of the Walton and Diederichs [7] variable dilatancy model compared to actual test results and the Zhao and Cai model [2] for (a) witerwatersrand quartzite [112], (b) mudstone [113], (c) weak sandstone [114], and (d) Carrara marble [81].
Applsci 15 09872 g008
Figure 9. (a) Experimental results and Chen et al. model of dilation angle for a series of rock salt specimens, and (b) actual and simulated volumetric-axial strain curves of rock salt specimens [83].
Applsci 15 09872 g009
Figure 10. Comparison of experimental data and Wang et al. model of variable dilatancy [85].
Applsci 15 09872 g010
Figure 11. Coefficients of determination (R2) of the 30 analyzed types of rocks collected from bibliography [25,47,67,115,116,117,118,119,120,121,122,123,124,125,126,127,128,129,130,131,132,133,134,135,136,137] fitted by Equation (39) [87].
Applsci 15 09872 g011
Figure 12. Zhao and Li model fitted to 4 rocks as an example [86]. The data points are colored according to the tested confinement and the fitted surface colors only indicate a change in the value of the dilation angle.
Applsci 15 09872 g012
Table 1. Summary of retrieved dilatancy models.
ModelEquationsMain Features
Alejano and Alonso [30] ψ p e a k = ϕ 1 + l o g 10 σ c i · l o g 10 σ c i σ 3 + 0.1
K ψ = 1 + K ψ , p e a k 1 · e γ p γ p , *
The A&A model estimates the angle of maximum dilatancy and how it decays from that value with just one parameter. It considers plastic deformations from the peak strength. Useful for sedimentary rocks.
Zhao and Cai [2] ψ = a · b · e b γ p e c γ p c b Z&C developed a mathematical model with good agreement with experimental results. Based on 9 coefficients that lack physical meaning. The fitting of the 9 coefficients may give non-univocal results. It considers plastic deformations from the CD stress. It may fit any type of rock.
Pourhosseini and Shabanismashcool [5] ψ p e a k = A · l n ϕ · σ c i σ 3 + 0.1 B
ψ = ψ p e a k · 1 t a n h 100 · γ p t a n h 10 + 0.001
The P&S model describes the maximum dilation angle and how it descends from that value with only three parameters. The authors considered 3 types of rock for their study (sandstones, silty sandstones and mudstones).
Walton and Diederichs [7] ψ p e a k σ 3 = ϕ p e a k 1 + l o g 10 U C S · l o g 10 U C S σ 3 + 0.1     f o r   s e d i m e n t a r y   r o c k s ϕ p e a k · 1 β e 1 β 0 β β · σ 3   w h e n   σ 3 < e 1 β 0 β β ϕ p e a k · β 0 β · l n σ 3   w h e n   σ 3 > e 1 β 0 β β   f o r   c r y s t a l l i n e   r o c k s
ψ σ 3 , γ p = α · γ p · ψ p e a k e α 1 α · γ m   w h e n   γ p < γ m · e α 1 α ψ p e a k · α · l n γ p γ m + 1   w h e n   γ m · e α 1 α γ p < γ m ψ p e a k · e γ p γ m γ *   w h e n   γ p γ m
The W&D model describes the behavior of the dilation angle through a piecewise function, simplifying its study. It makes a distinction between the maximum dilation angle for sedimentary and crystalline rocks. It requires adjusting 4 to 7 parameters depending on the available information. The model considers plastic deformations starting from the CD.
Chen et al. [83] ψ = a · l n b · ε p s c ε p s d + 1 + 1 Chen et al. model is a 12-parameter model that can be implemented in FLAC3D. The model considers the plastic deformations starting from the CD. It was only validated in specimens of salt rock.
Rahjoo and Eberhardt [84] ψ ψ p e a k σ 3 = c b c · b c b c b · γ p γ p e a k p σ 3 1 · b c γ p γ p e a k p σ 3 1 The R&E model considers a normalized space (ψ⁄ψpeak, γp⁄γppeak) of the Zhao and Cai [2] model, simplifying the number of required parameters from 9 to 5. Since it is based on the Z&C model, it should be applicable to any type of rock.
Wang et al. [85] ψ σ 3 , ξ = ψ 0 · a 1 · e a 2 · σ 3 + a 3 · e b 1 1 b 2 · e b 3 · σ 3 ξ W et al. model is a 6-parameter model that considers the plastic deformations starting from the CD. It was only validated in one type of coal.
Jin et al. [87]) ψ = α 1 · 1 + σ 3 σ c α 2 · e β 1 1 + σ 3 σ c β 2 · κ    
κ = 2 3 e p T e p f σ 3 / σ c = e ¯ p f σ 3 / σ c
J et al. model is a 6-parameter model that considers plastic deformations from the peak strength. It defines an internal variable (κ) as a nonlinear function of confinement and plastic deformations. Validated in 30 different rock types collected from the literature.
Zhao and Li [86] ψ κ , σ 3 = e b σ 3 · ψ m a x κ κ * 0.5 w h e n   κ κ * ψ m a x ψ l i m · e a · κ κ * 2 + ψ l i m w h e n   κ κ * Z&L model is a piecewise simple model that uses 5 fitting parameters with a clear physical meaning. It can consider the plastic deformations starting from the peak strength or from the CD. They fitted the model to 13 types of rock collected from the literature.
Cai et al. [61] ψ = ϕ l o g 10 k · l o g 10 σ 3 σ c i + k · e γ p γ p * The Cai et al. model is based on the model of Alejano and Alonso [30]. It depends solely on two parameters (k and γp*). The authors fitted the model to 11 different rock types.
Wang et al. [99] ψ = P 1 P 2 e P 2 γ p e P 1 γ p P 1 + P 2 Wang et al. model is based on an energetic approach. It depends on two parameters but has no dependence on confining stress. They fitted four test results of a granite gneiss.
Disclaimer/Publisher’s Note: The statements, opinions and data contained in all publications are solely those of the individual author(s) and contributor(s) and not of MDPI and/or the editor(s). MDPI and/or the editor(s) disclaim responsibility for any injury to people or property resulting from any ideas, methods, instructions or products referred to in the content.