Article

Analysis of the Relationship Between Production Process Determinants and Production Flow Control Methods

by
Krzysztof Żywicki
Faculty of Mechanical Engineering, Poznan University of Technology, Piotrowo 3 Street, 60-965 Poznan, Poland
Appl. Sci. 2025, 15(18), 10300; https://doi.org/10.3390/app151810300
Submission received: 2 September 2025 / Revised: 19 September 2025 / Accepted: 19 September 2025 / Published: 22 September 2025

Abstract

Production flow control is a key area affecting the productivity of production systems. The use of an appropriate control method ensures that customer requirements are met while maintaining an acceptable level of production costs. In many cases, the choice of control method does not allow for significant improvements in production processes, as the known guidelines are not very detailed. This article presents research on the impact of factors related to products, production processes, and customer orders on, for example, the number of technological operations, the number of production stations, product demand (product, process, and order conditions—PPOC), and the effectiveness of production flow control methods. This research was conducted for selected product families (water and gas fittings) for which various production flow control solutions were developed. The most popular control methods were used: push–schedule, supermarket-type pull, sequential pull, mixed pull, and drum-buffer-rope. The criteria for evaluation were in-process stocks and lead time of materials in the production process. As a result of the ranking, relationships were identified by indicating how the values of PPOC factors affect the effectiveness of a given production flow control method. The results of this research can serve as guidelines for companies in selecting the most appropriate method of controlling production processes.

1. Introduction

The selection of a production flow control method also affects quality and cost. Material flow control is a key element of production planning and control, and different methods impact various performance metrics, which in turn affect quality and cost [1]. Furthermore, the usage of quality controls has a direct influence on the productivity of production systems, impacting management ratios, such as cycle times, service level, stocks, and capacity utilization [2].
Effective production flow requires the integration of various control mechanisms and coordination across different stages of production and supply chains [3,4,5]. This includes managing inventory, optimizing logistics, and ensuring real-time information flow [3,4,5].
The flow of materials in production systems can be controlled using push–pull (just-in-time) control mechanisms or hybrid push–pull control mechanisms. Although push–pull systems limit work-in-progress (WIP) levels, they are susceptible to equipment failures, which affect production efficiency [6,7].
The most popular methods for controlling production flow include push, pull (kanban), sequential pull (FIFO), and drum-buffer-rope. There are different types and variations of these methods [1,2].
Kanban is highly effective in environments where demand is variable and unpredictable [8,9,10]. It allows for quick adjustments and minimizes inventory levels by producing only what is needed based on actual customer demand [8,9,10]. Kanban systems work well in settings where production control is decentralized, allowing local stations to signal their needs to upstream processes [11,12]. Implementing the kanban system in multi-stage and multi-type production systems can be challenging due to the complexity of managing numerous kanban cards and ensuring synchronization between stages [13,14].
The first-in, first-out (FIFO) method is a straightforward dispatching rule where the first item to enter the system is the first to be processed. It is often used in conjunction with other systems like kanban to manage the sequence of production [15,16]. FIFO methods help in maintaining the order of processing and can be used to reduce the complexity of decision-making in high-mix production environments [16,17]. While simple, FIFO does not account for the variability in processing times or the presence of bottlenecks, which can lead to inefficiencies in more complex production systems [15,18]. FIFO systems consistently achieve lower work-in-process levels and shorter customer wait times compared to kanban systems, making them preferable in scenarios where minimizing inventory and lead times is critical [19]. The parameterization of FIFO, such as the number of cards and withdrawal cycles, plays a crucial role in optimizing its performance across different production environments [20].
The drum-buffer-rope method (DBR) is suitable for complex production systems, such as job shops or flow shops with non-identical parallel machines, where detailed scheduling and capacity constraints are critical [21,22,23,24]. This method is ideal for environments where identifiable bottlenecks exist. It focuses on planning schedules that take these constraints into account in order to optimize throughput [21,25,26]. It is effective in managing environments with high variability in processing times and demand, using buffers to protect against disruptions. They also require dynamic adjustments to respond to changes in demand and production conditions, which can be resource-intensive [27,28,29].
The comparison of the supermarket pull method, drum-buffer-rope method, and FIFO method reveals distinct operational characteristics and applications in manufacturing contexts. Each method offers unique advantages in managing work-in-process inventories and enhancing delivery performance, which are critical for lean production systems. The following sections delve into the specifics of each method and their comparative effectiveness [1].
Kanban, DBR, and FIFO have different mechanisms and applications in production control. Kanban is very effective in managing inventory and work in progress through a pull system, DBR excels at optimizing throughput by focusing on bottlenecks, and FIFO provides a simple sequencing rule but can be inefficient in complex environments. Understanding these differences can help you choose the right system based on your specific needs and production constraints [17,21,30,31].
The choice of production flow control method is crucial, as it has a direct impact on efficiency, productivity, quality, and costs. Different methods have their advantages and disadvantages, so specific needs and characteristics of the production system must be considered when making a decision. Some methods focus on optimizing production processes, while others aim to minimize work in progress and maximize efficiency. The literature provides valuable information on the effectiveness of these methods. For example, studies [1,2] present significant results indicating the impact of different production flow control methods on efficiency but do not indicate specific criteria for selecting the appropriate method based on the values of factors and conditions of production processes.
This article presents the results of an analysis indicating the relationships between the values of selected factors characterizing the product and the production process and the methods of production flow control. These relationships determine which method is more effective as the value of the factor increases.

2. Materials and Methods

This research involved conducting a comparative analysis of production flow control methods, taking into account conditions related to factors determining the structure of products, the structure of technological processes, and customer orders (product, process, and order conditions—PPOC). The aim of this analysis was to attempt to define general rules facilitating the selection of the production flow control method most appropriate for the given conditions of production processes. This analysis was conducted for selected product families, the subjects of completed research projects. These included water and gas fittings (gas cylinder valves, water pipe connectors). The selection was based on the diversity of product design features, manufacturing processes, and customer demand. New production flow control solutions were developed for each product family. Next, PPOC factors and evaluation criteria were defined to assess their effectiveness. A ranking method was then used to determine the correlations (Figure 1).

2.1. Production Flow Control Methods

Production flow control solutions were developed for each product family using various methods. These included
  • Push–schedule—material flow is based on production schedules without taking into account the current demand of cooperating production stations;
  • Pull, supermarket-type—material flow is based on the actual consumption of materials, parts, and products in a supermarket that serves as a stock between cooperating production cells;
  • Sequential pull—flow takes place according to a fixed production sequence but with control of the quantity of parts between production cells;
  • Mixed pull—material flow is carried out using the supermarket-pull and sequential-pull methods;
  • Drum-buffer-rope—flow is regulated taking into account bottlenecks in the production process.
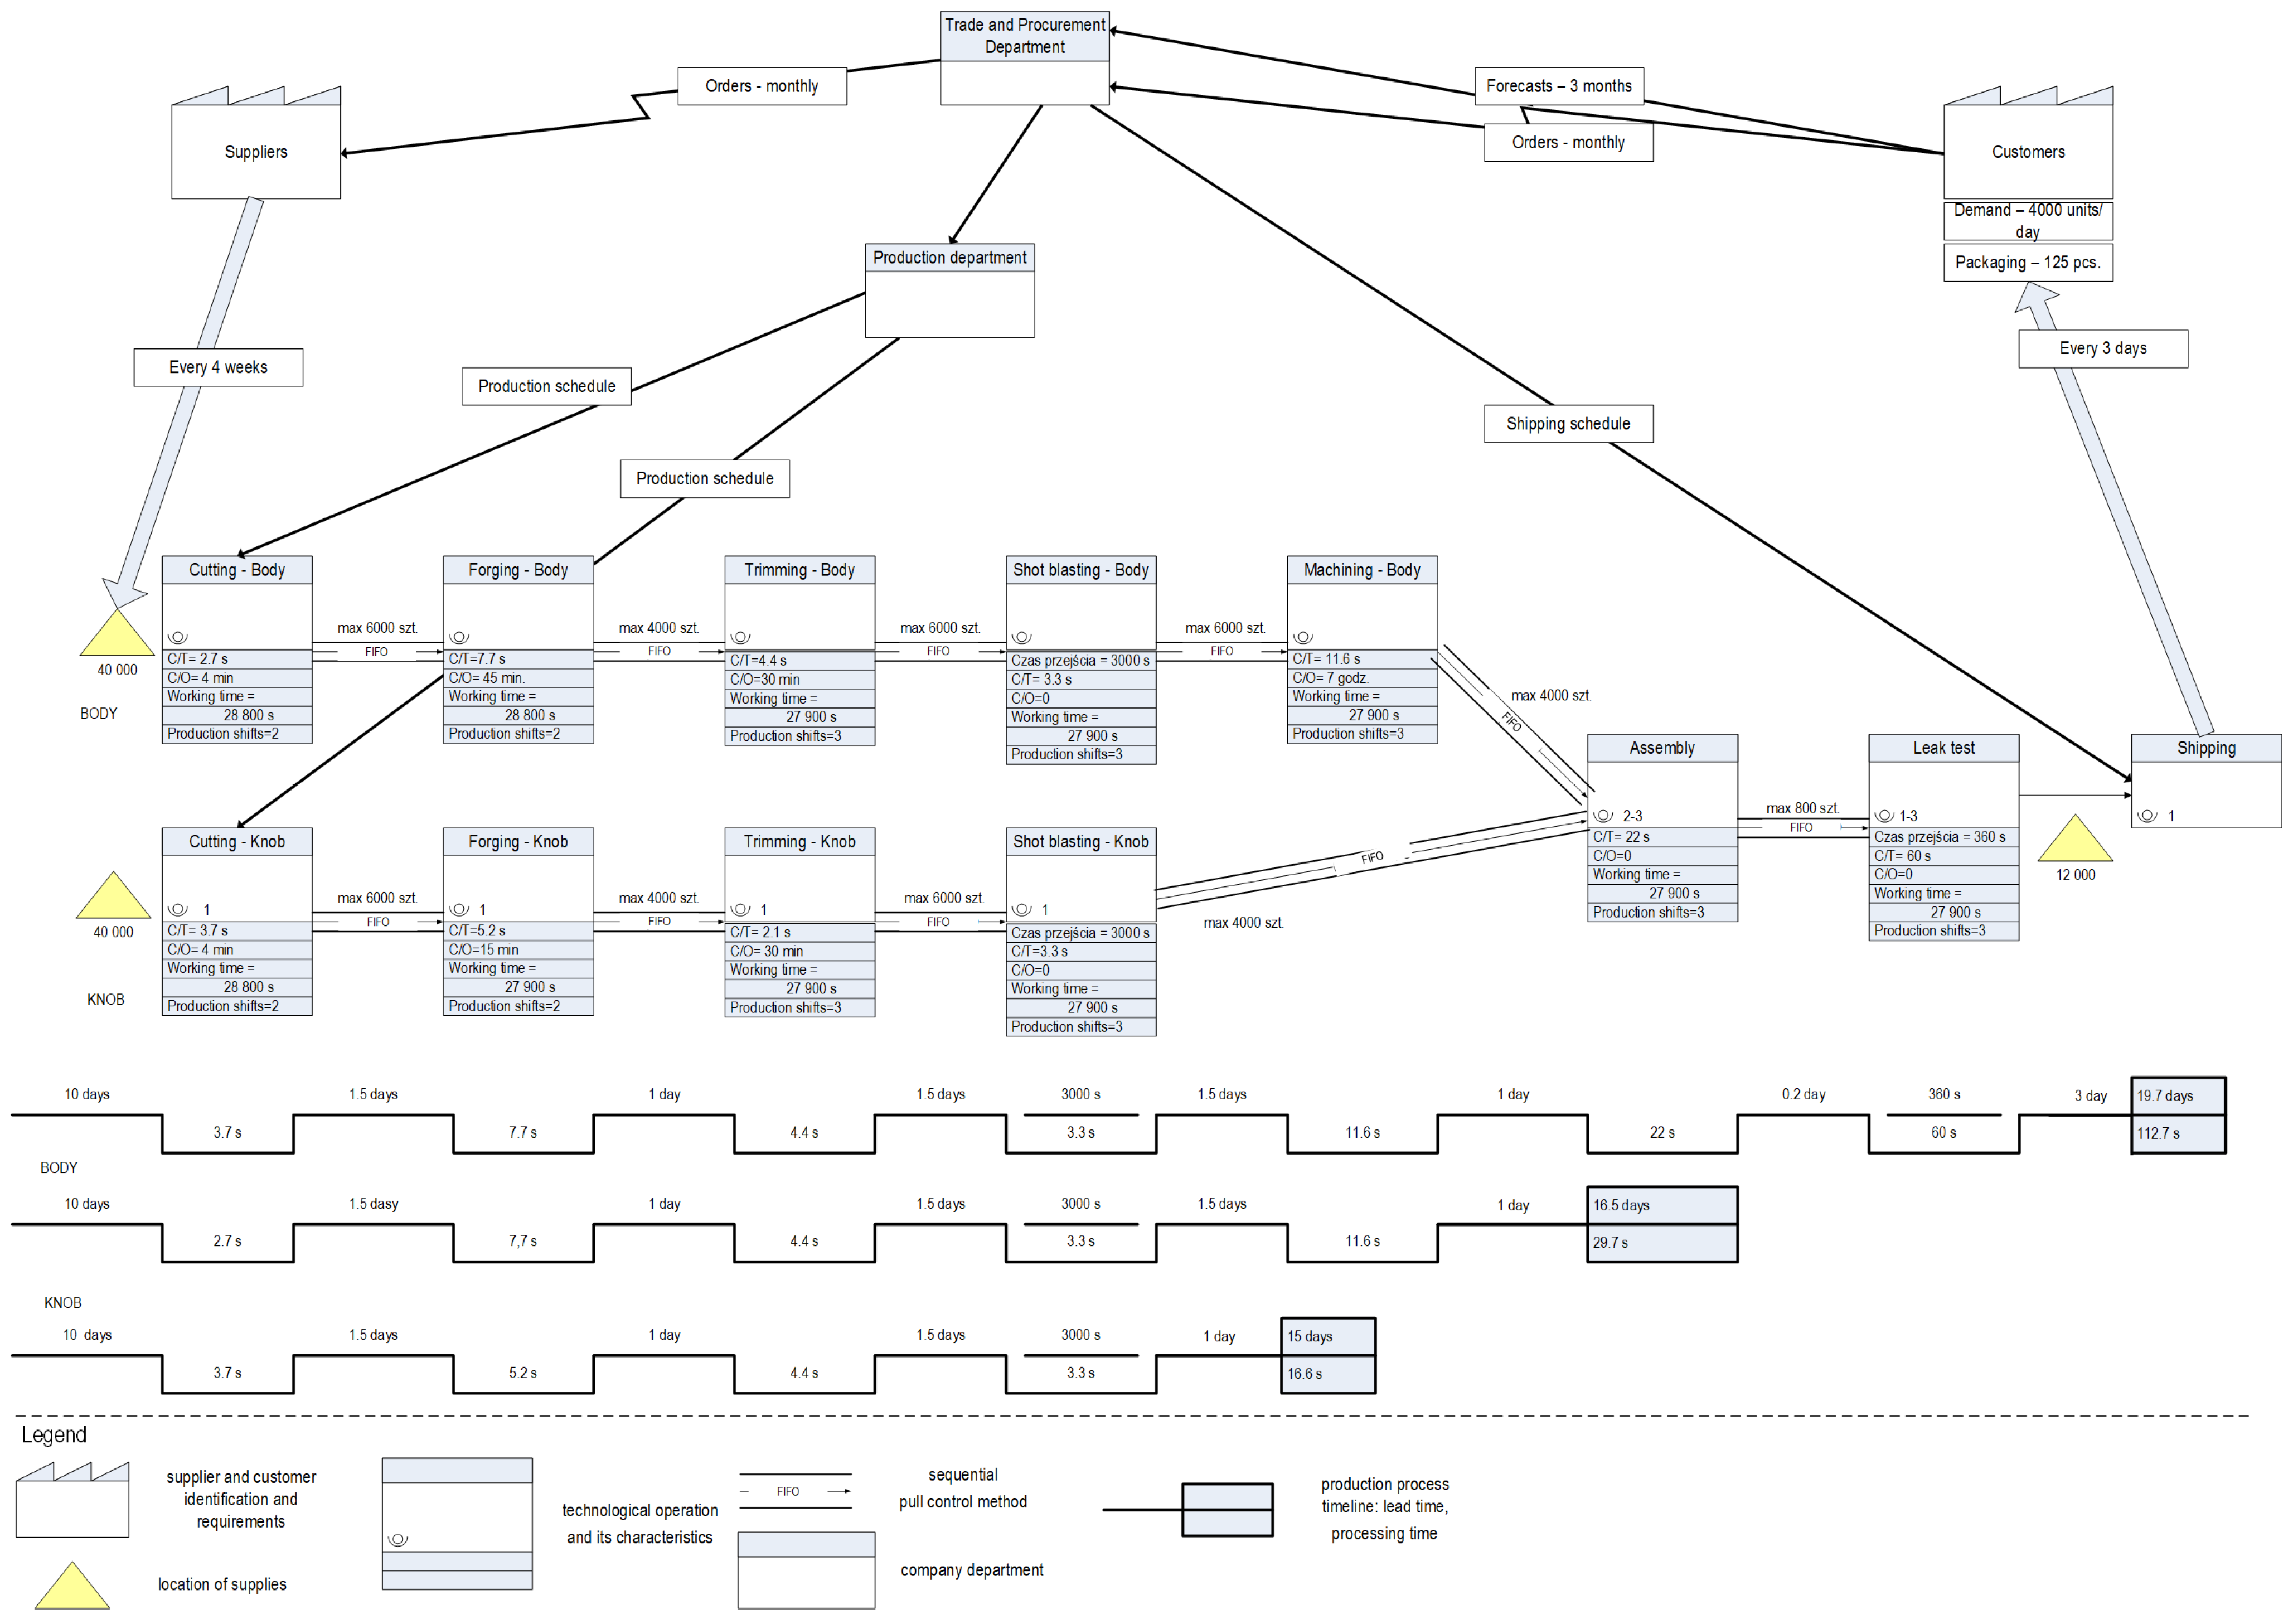
The value-stream mapping (VSM) method was used to design new production flow control solutions. This method was used to illustrate the flow of materials and information for selected control methods and the parameters obtained. A total of 25 solutions were developed for 5 selected product families. An example of a map for a selected product family is presented in Figure 2.

2.2. Factors for PPOC

The following PPOC factors were applied in the analysis:
  • Number of components in finished products, including
    • Average number of components for products in a product family;
    • Range of the number of components in a product family—determines the range of variability in the number of components in a given product family.
  • Number of technological operations in the technological process—determines the number of technological operations required to manufacture products in a product family.
  • Number of production stations shared in production processes—determines how many of these production stations are used to manufacture components of products in the family, which determines the production stations where the flow of materials ‘intersects’.
  • Unit time of technological operations, including
    • Average unit time of technological operations (time to produce one unit of a product in a technological operation) for processes in a given product family;
    • Range of unit times—determines the range of variability of these times for a product family;
    • Technological process time—determines the total unit time for the execution of technological operations.
  • Average daily demand for products–determines the total demand for products in the family for a period of one year in relation to one working day.
  • Average frequency of product orders–determines the average frequency with which products are ordered by customers.
These are some of the key factors influencing the implementation of production processes and material flow.
The following were selected for the evaluation of solutions using different production flow control methods:
  • Lead time—the time it takes for material to pass through the production process from the moment the raw materials are received to the shipment of finished products;
  • Total in-process stocks in the production process—the sum of inventory between successive stages of the production process.

2.3. Data Preparation and Analysis

The results of the evaluation criteria were prepared for each product family. The results were determined for each production-control-method solution. Table 1 presents a summary of the results of in-process stocks and lead times for the analyzed product families.
In the next step, the values of the defined PPOC factors for the analyzed product families were determined. The results are presented in Table 2.
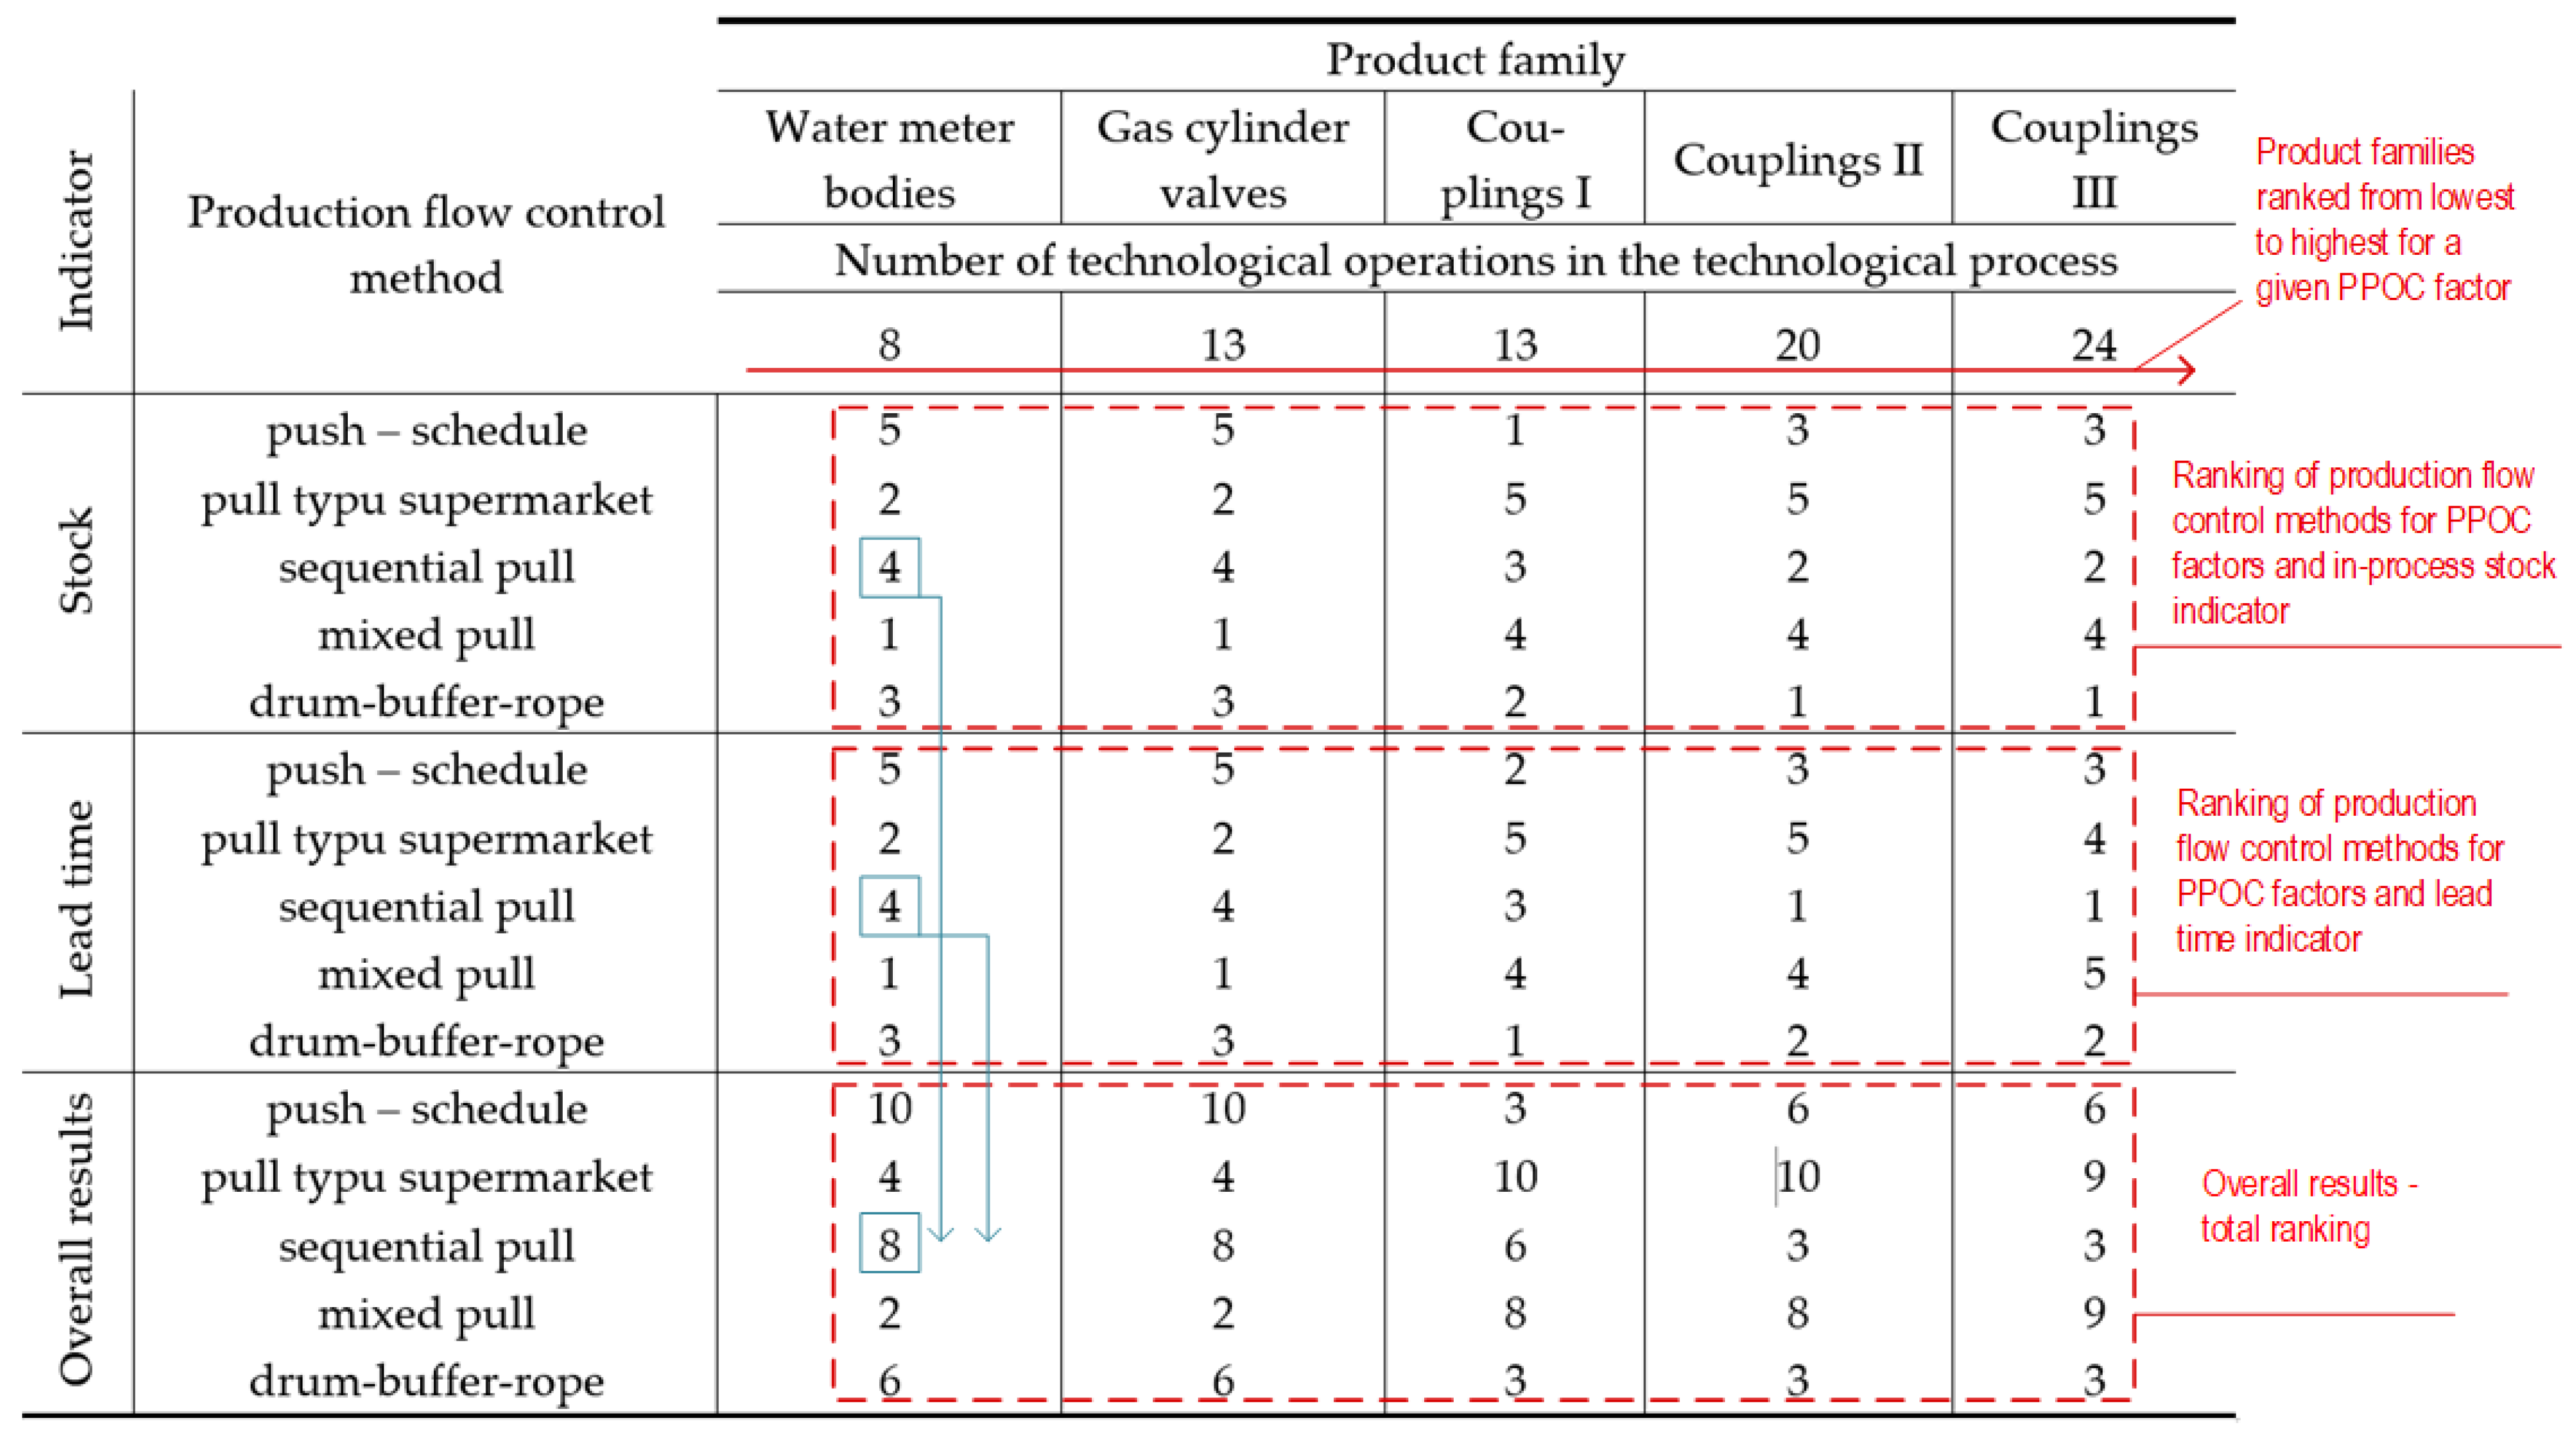
A ranking method was used to determine the relationship between PPCO and production flow control methods (indicator values). A five-point scale (1–5) was used, where 1 means that a given control method achieves the best results compared to other methods. A value of 5 means that the method obtained the worst indicator value.
In the first step, product families were ranked from lowest to highest value for a given PPOC factor (data from Table 2). Next, for the criteria (indicators), a ranking of production flow control methods was determined based on the results obtained (values from Table 1). Then, the overall ranking value of the control method was calculated as the sum of the rankings for the evaluation criteria.
Figure 3 presents an example of data preparation and ranking for the PPOC factor. The factor value ranges from 8 to 24 technological operations. In this example, for a factor value of 8, the best inventory value was obtained for the mixed-pull method. This method also allows for the shortest lead time. The overall results indicate that the method mixed pull is the most appropriate for the analyzed indicator value.
Other PPOC factors were analyzed in the same way and the results are presented below.

3. Results

3.1. Number of Components of Finished Products

The increase in the average number of product components affects
  • Lower in-process stocks when using the sequential-pull and drum-buffer-rope methods.
  • Increased in-process stocks when using the supermarket-pull and mixed-pull methods.
  • A reduction in material transit time for the sequential-pull method.
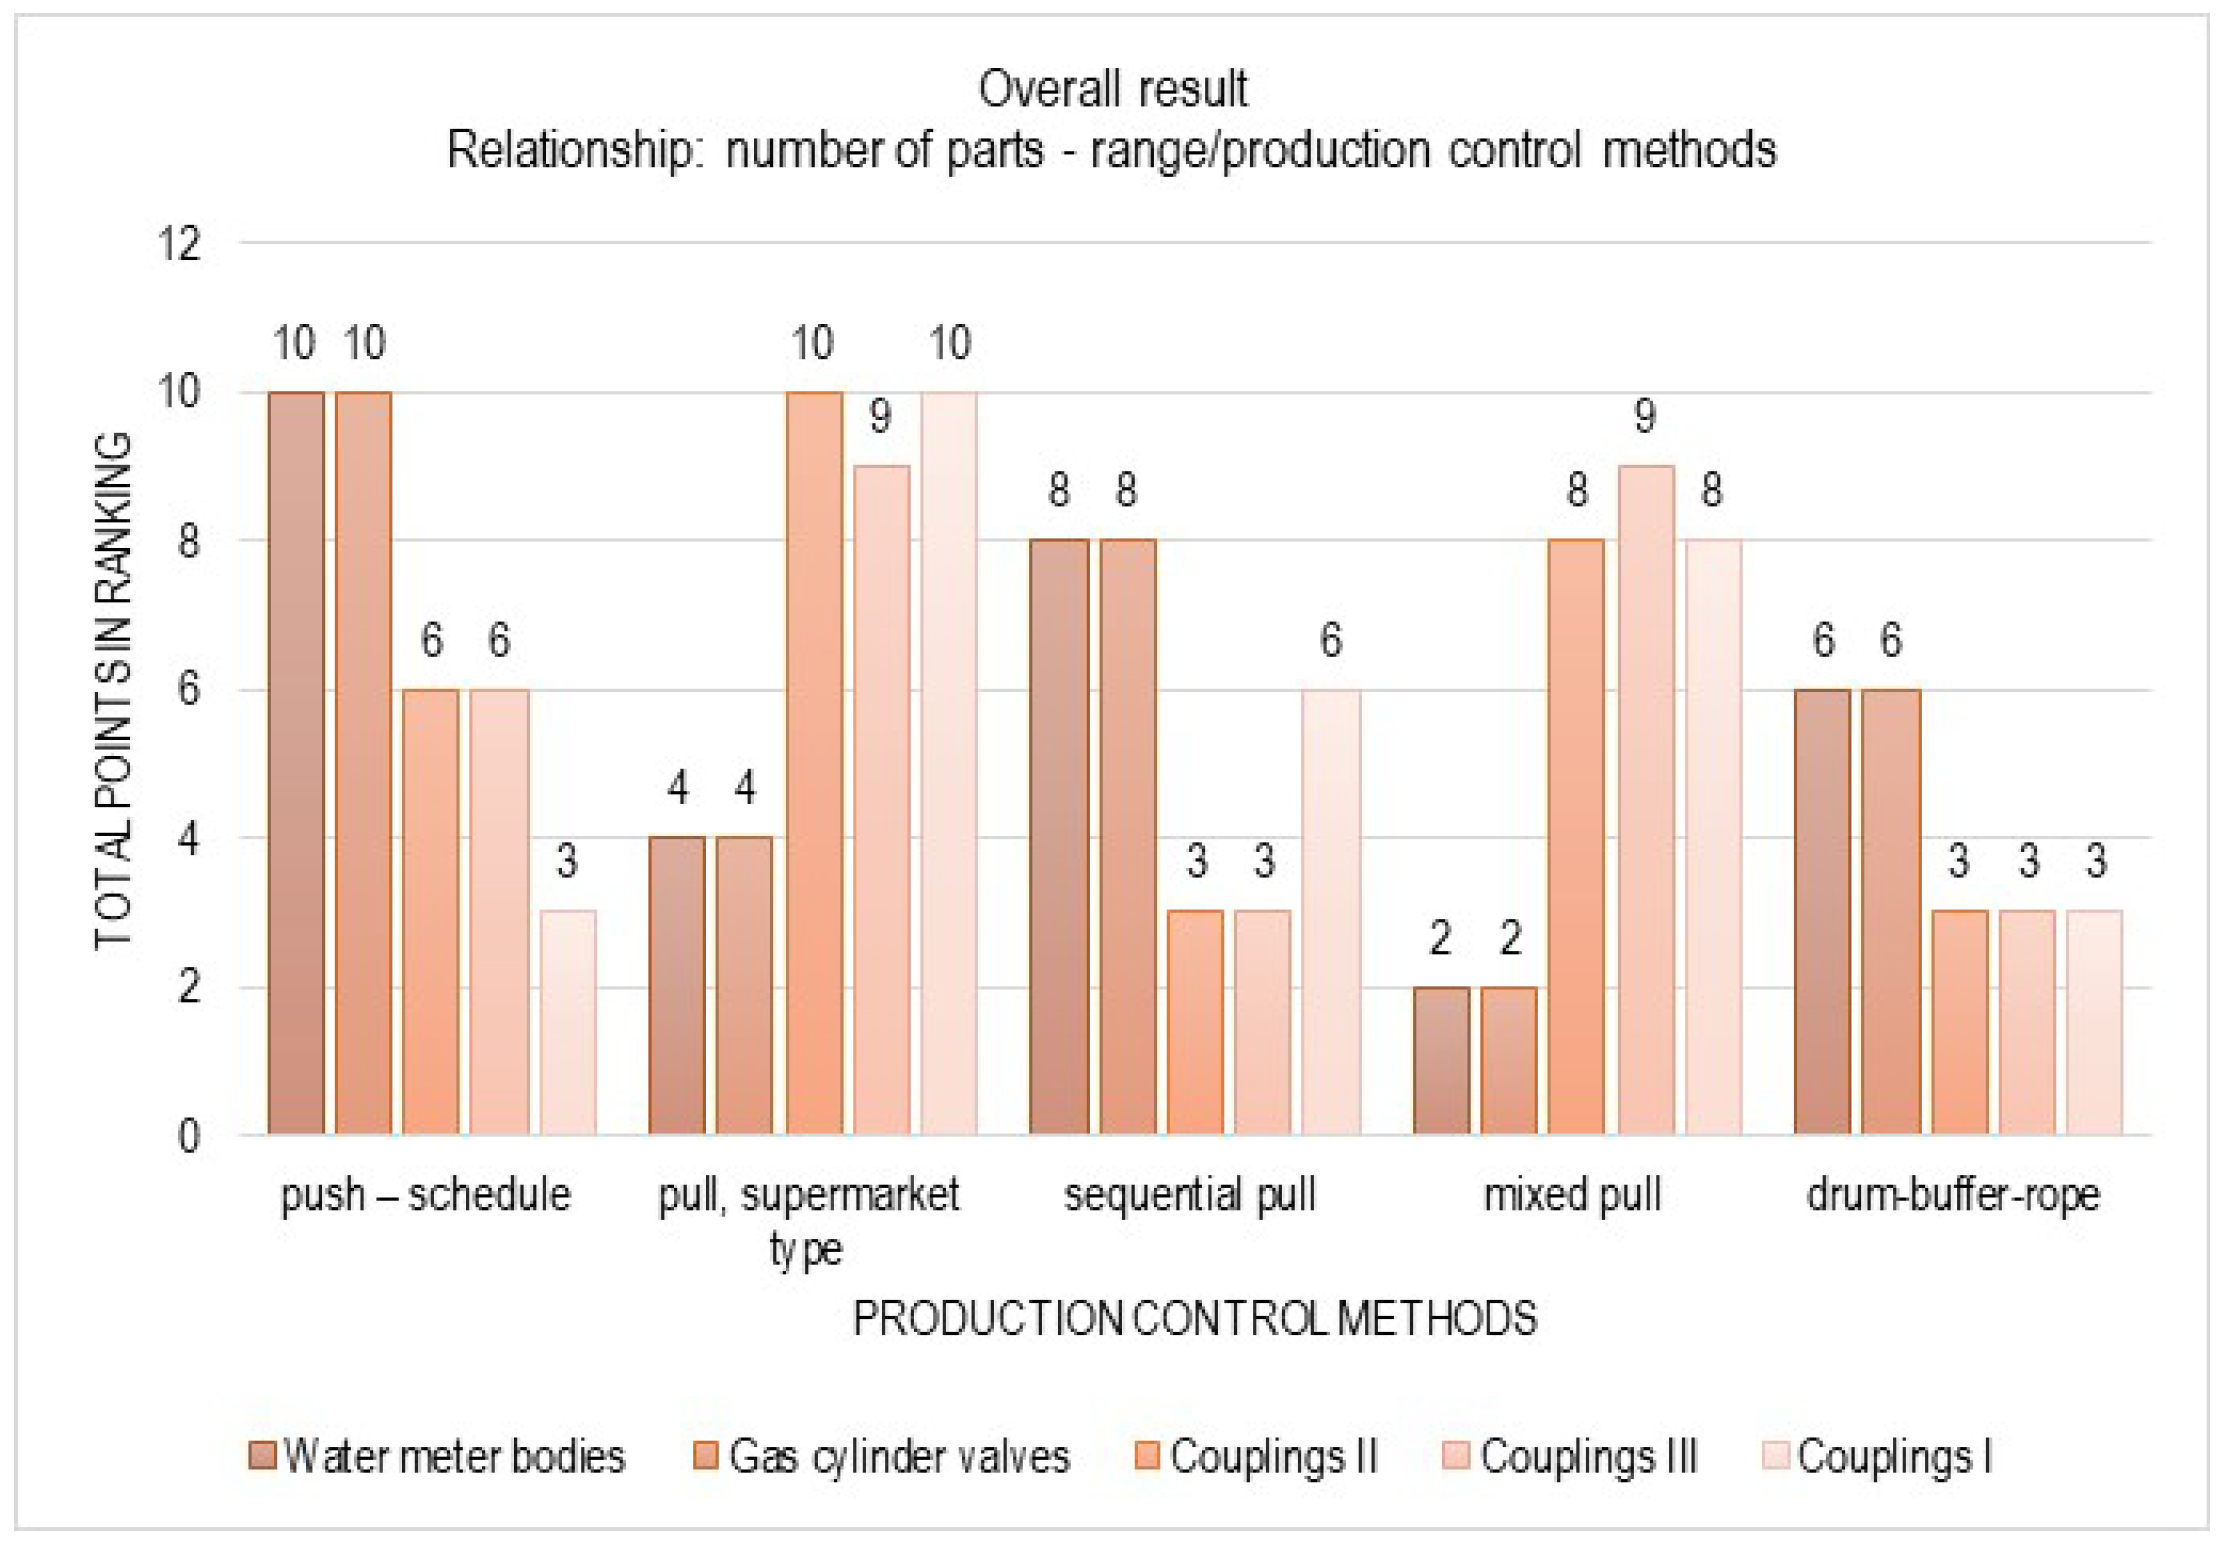
In general, as the average number of components in products increases, the use of supermarket-pull and mixed-pull methods results in a deterioration in the evaluation criteria. In contrast, the sequential-pull method allows for their improvement. In the case of the other methods, there are no clear relationships (Figure 4).
The increase in the range of product components affects
  • An increase in in-process stocks when using the supermarket- and mixed-pull methods;
  • A decreasing trend in material throughput time for the push–schedule and drum-buffer-rope methods.
In general, as the average number of components in products increases, the use of supermarket- and mixed-pull methods results in a deterioration in the evaluation criteria. On the other hand, the push–schedule and drum-buffer-rope methods allow for their improvement. In the case of the other methods, there are no clear relationships (Figure 5).

3.2. Number of Shared Production Stations

The increase in the number of shared production stations affects
  • An increase in in-process stocks when using the supermarket- and mixed-pull methods;
  • A reduction in material throughput time when using the sequential-pull method.
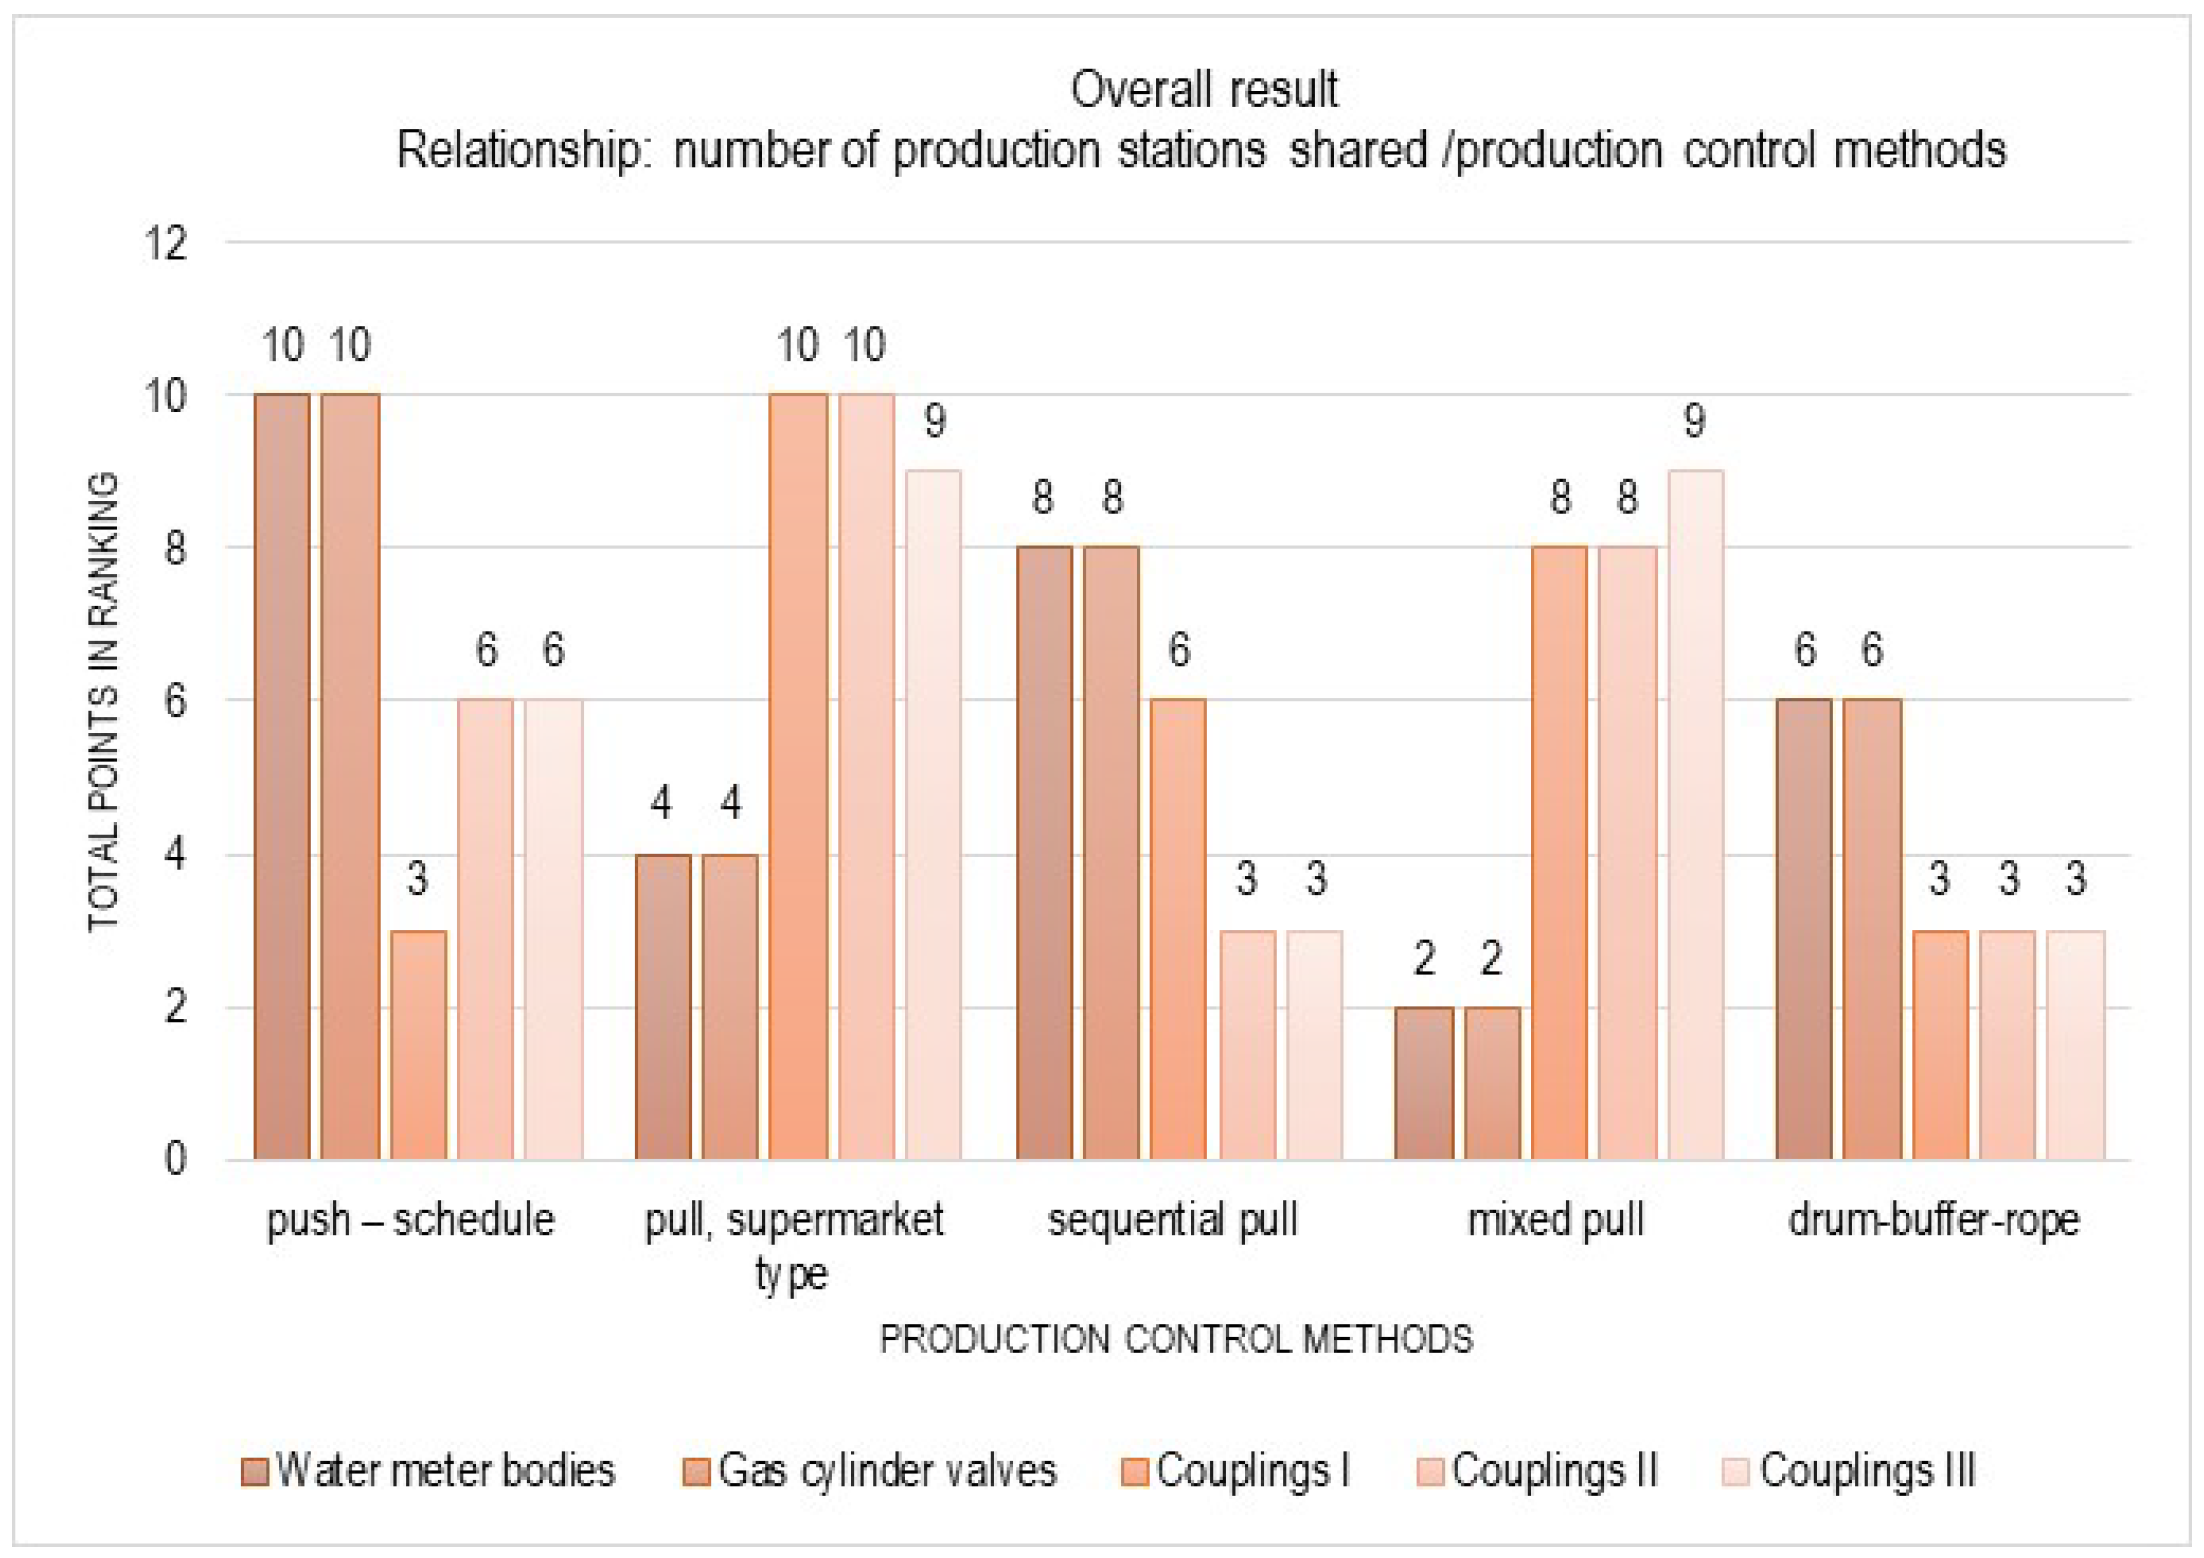
In general, as the average number of shared production stations increases, the use of supermarket- and mixed-pull methods results in a deterioration in the evaluation criteria. On the other hand, the sequential-pull and drum-buffer-rope methods allow for their improvement. In the case of other methods, there are no clear relationships (Figure 6).

3.3. Unit Time of Technological Operations

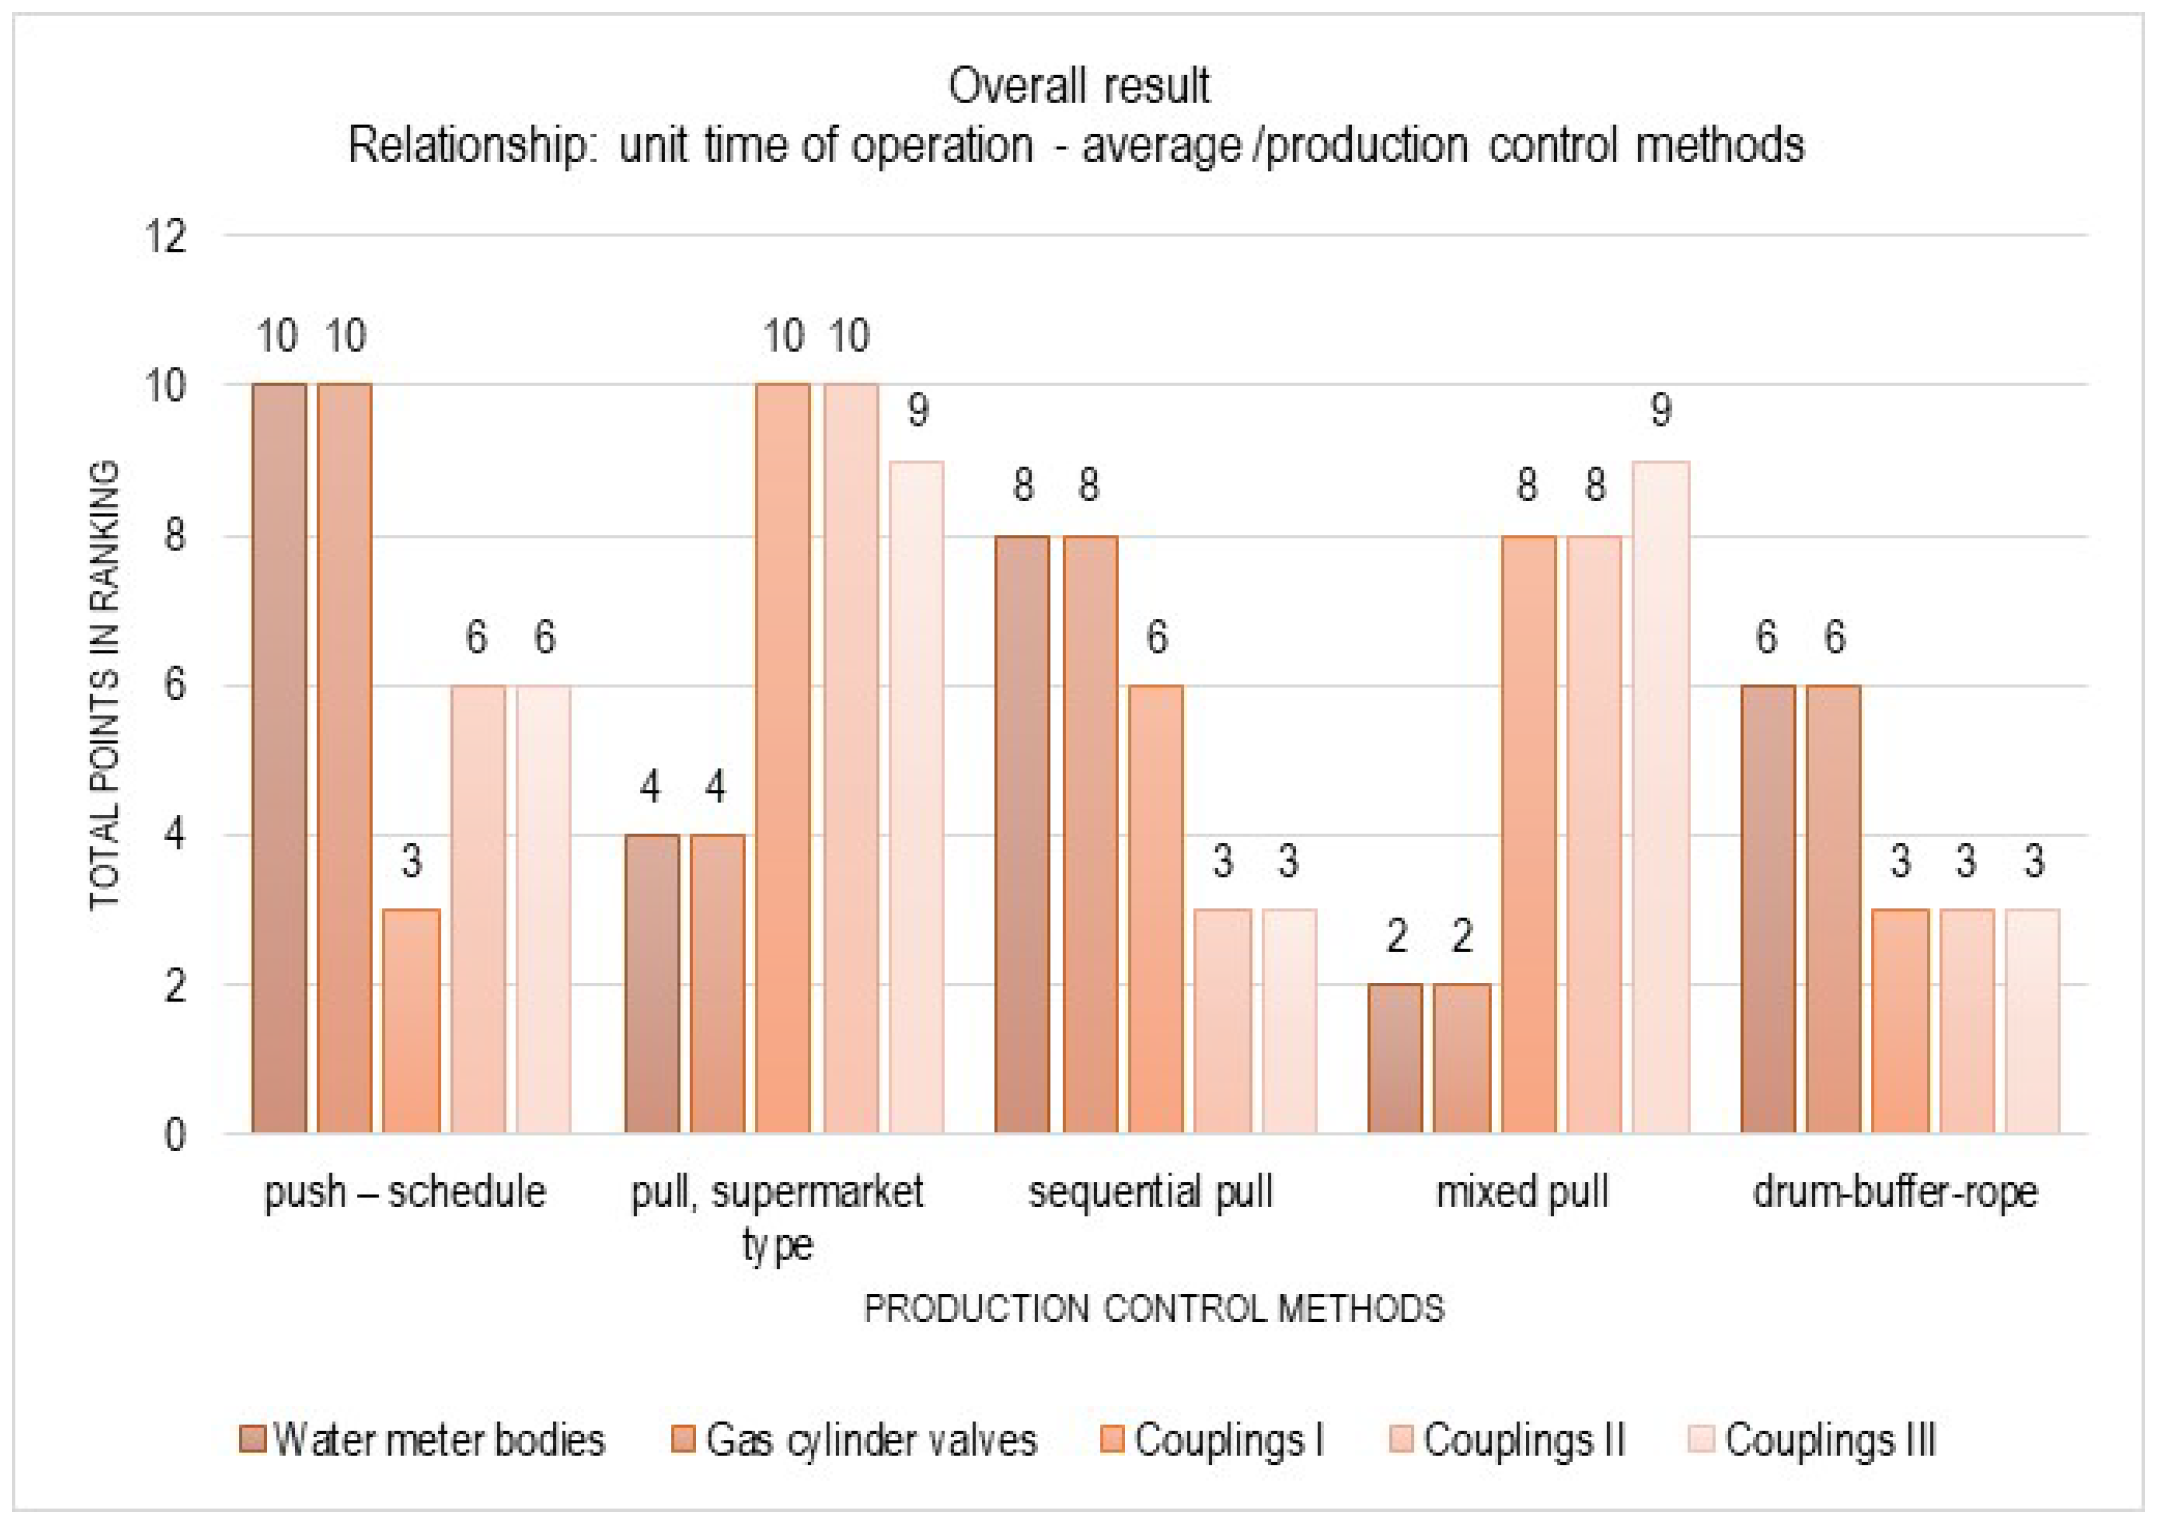
The increase in the average unit time of technological operations affects
  • Obtaining increasingly smaller values of in-process stocks when using the sequential-pull method and the drum-buffer-rope method;
  • The increase in material flow time in the case of the mixed-pull method.
It can be concluded that as the average unit time of technological operations increases, the use of supermarket- and mixed-pull methods causes a deterioration in the evaluation criteria. On the other hand, the sequential-pull and drum-buffer-rope methods allow for their improvement. In the case of other methods, there are no clear relationships (Figure 7).
The increase in the unit time range of technological operations affects
  • A reduction in the value of in-process stocks when using the supermarket- and mixed-pull methods;
  • Stocks in the case of sequential-pull and drum-buffer-rope methods;
  • An increase in material flow time in the case of the mixed-pull method.
In general, as range unit time of technological operations increases, the use of supermarket- and mixed-pull methods results in a deterioration in the evaluation criteria. On the other hand, the sequential-pull and drum-buffer-rope methods allow for their improvement. In the case of other methods, there are no clear relationships (Figure 8).
An increase in time of technological operations (technological-process execution time) affects
  • The lowering of in-process stocks when using the supermarket- and mixed-pull methods;
  • Inventory values when using the sequential-pull and drum-buffer-rope methods;
  • The increase in material transit time when using the mixed-pull method.
It can be concluded that as the average number of parts in products increases, the use of supermarket- and mixed-pull methods causes a deterioration in the evaluation criteria. On the other hand, the sequential-pull and drum-buffer-rope methods allow for their improvement. In the case of other methods, there are no clear relationships (Figure 9).

3.4. Number of Technological Operations

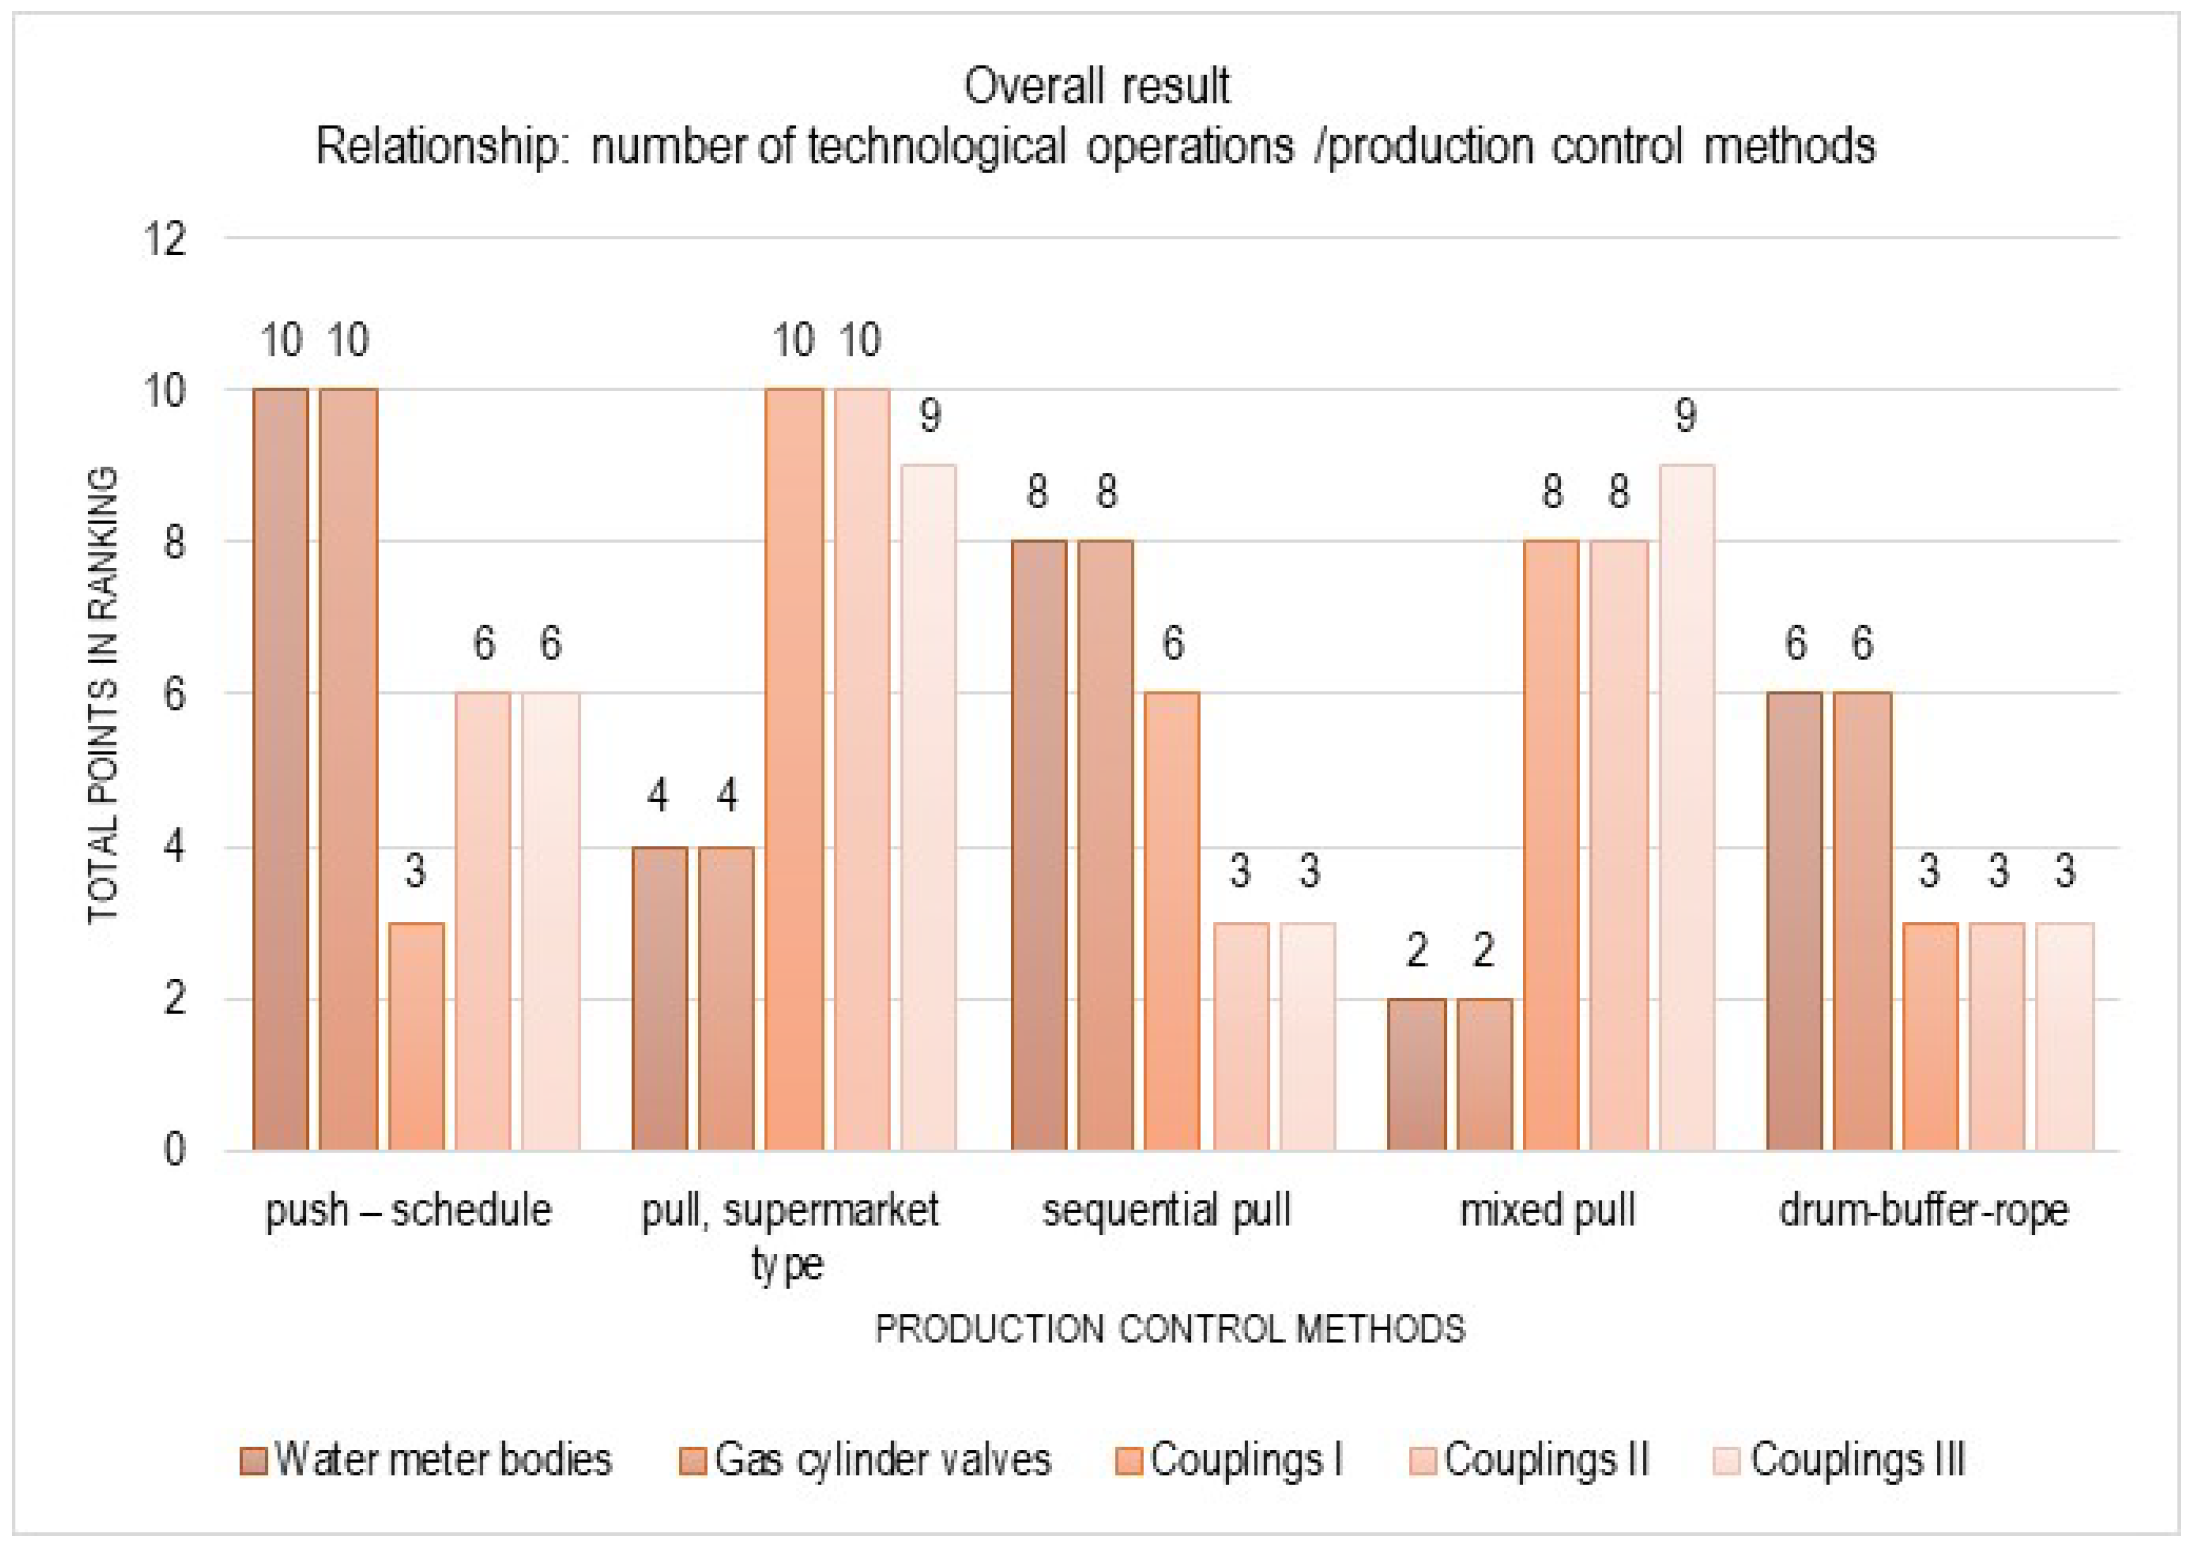
The increase in the number of technological operations affects
  • Obtaining increasingly lower values of in-process stocks when using the sequential-pull and drum-buffer-rope methods;
  • The increase in material flow time in the case of the mixed-pull method.
In general, as number of technological operations increases, the use of supermarket and mixed pull methods results in a deterioration in the evaluation criteria. On the other hand, sequential pull and drum-buffer-rope methods allow for their improvement. In the case of other methods, there are no clear relationships (Figure 10).

3.5. Demand for Products

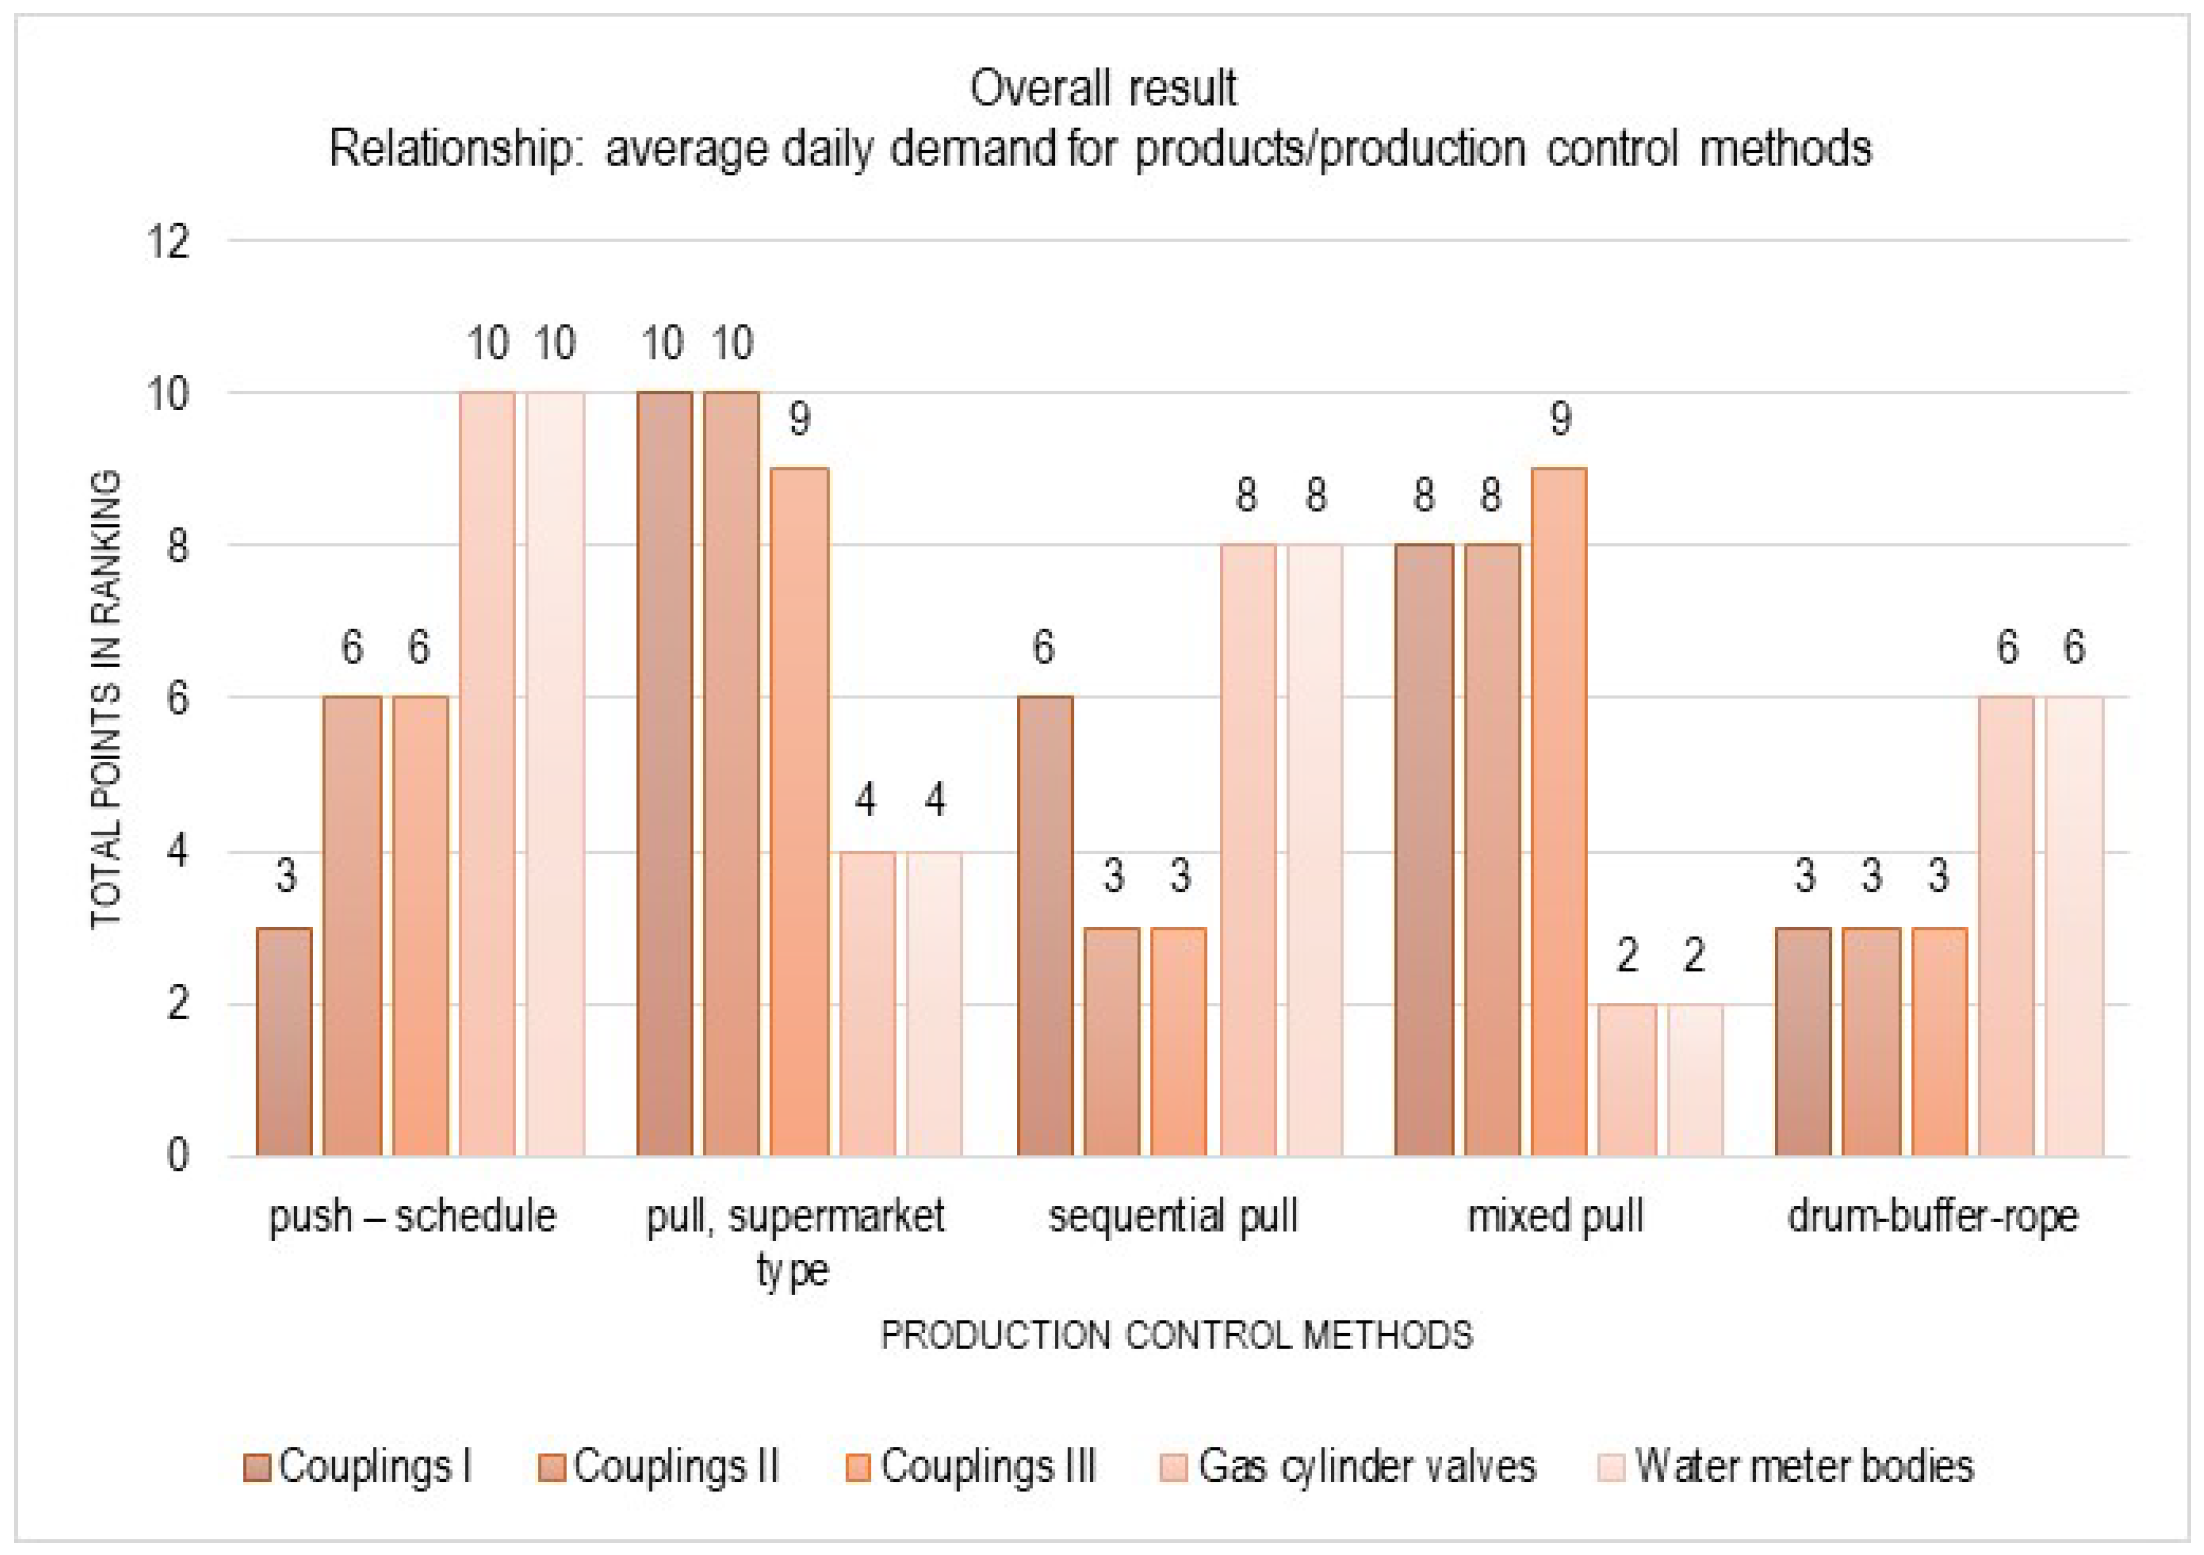
The increase in average daily demand for products affects
  • An increase in-process stocks and longer material transit times in the case of the push–schedule method;
  • Shorter material flow times and lower inter-operational stocks in the case of the supermarket- and mixed-pull methods.
In general, as the demand for products increases, the use of the push–schedule and drum-buffer-rope methods results in a deterioration of the evaluation criteria values. On the other hand, the supermarket-pull method allows for their improvement. In the case of the other methods, there are no clear relationships (Figure 11).
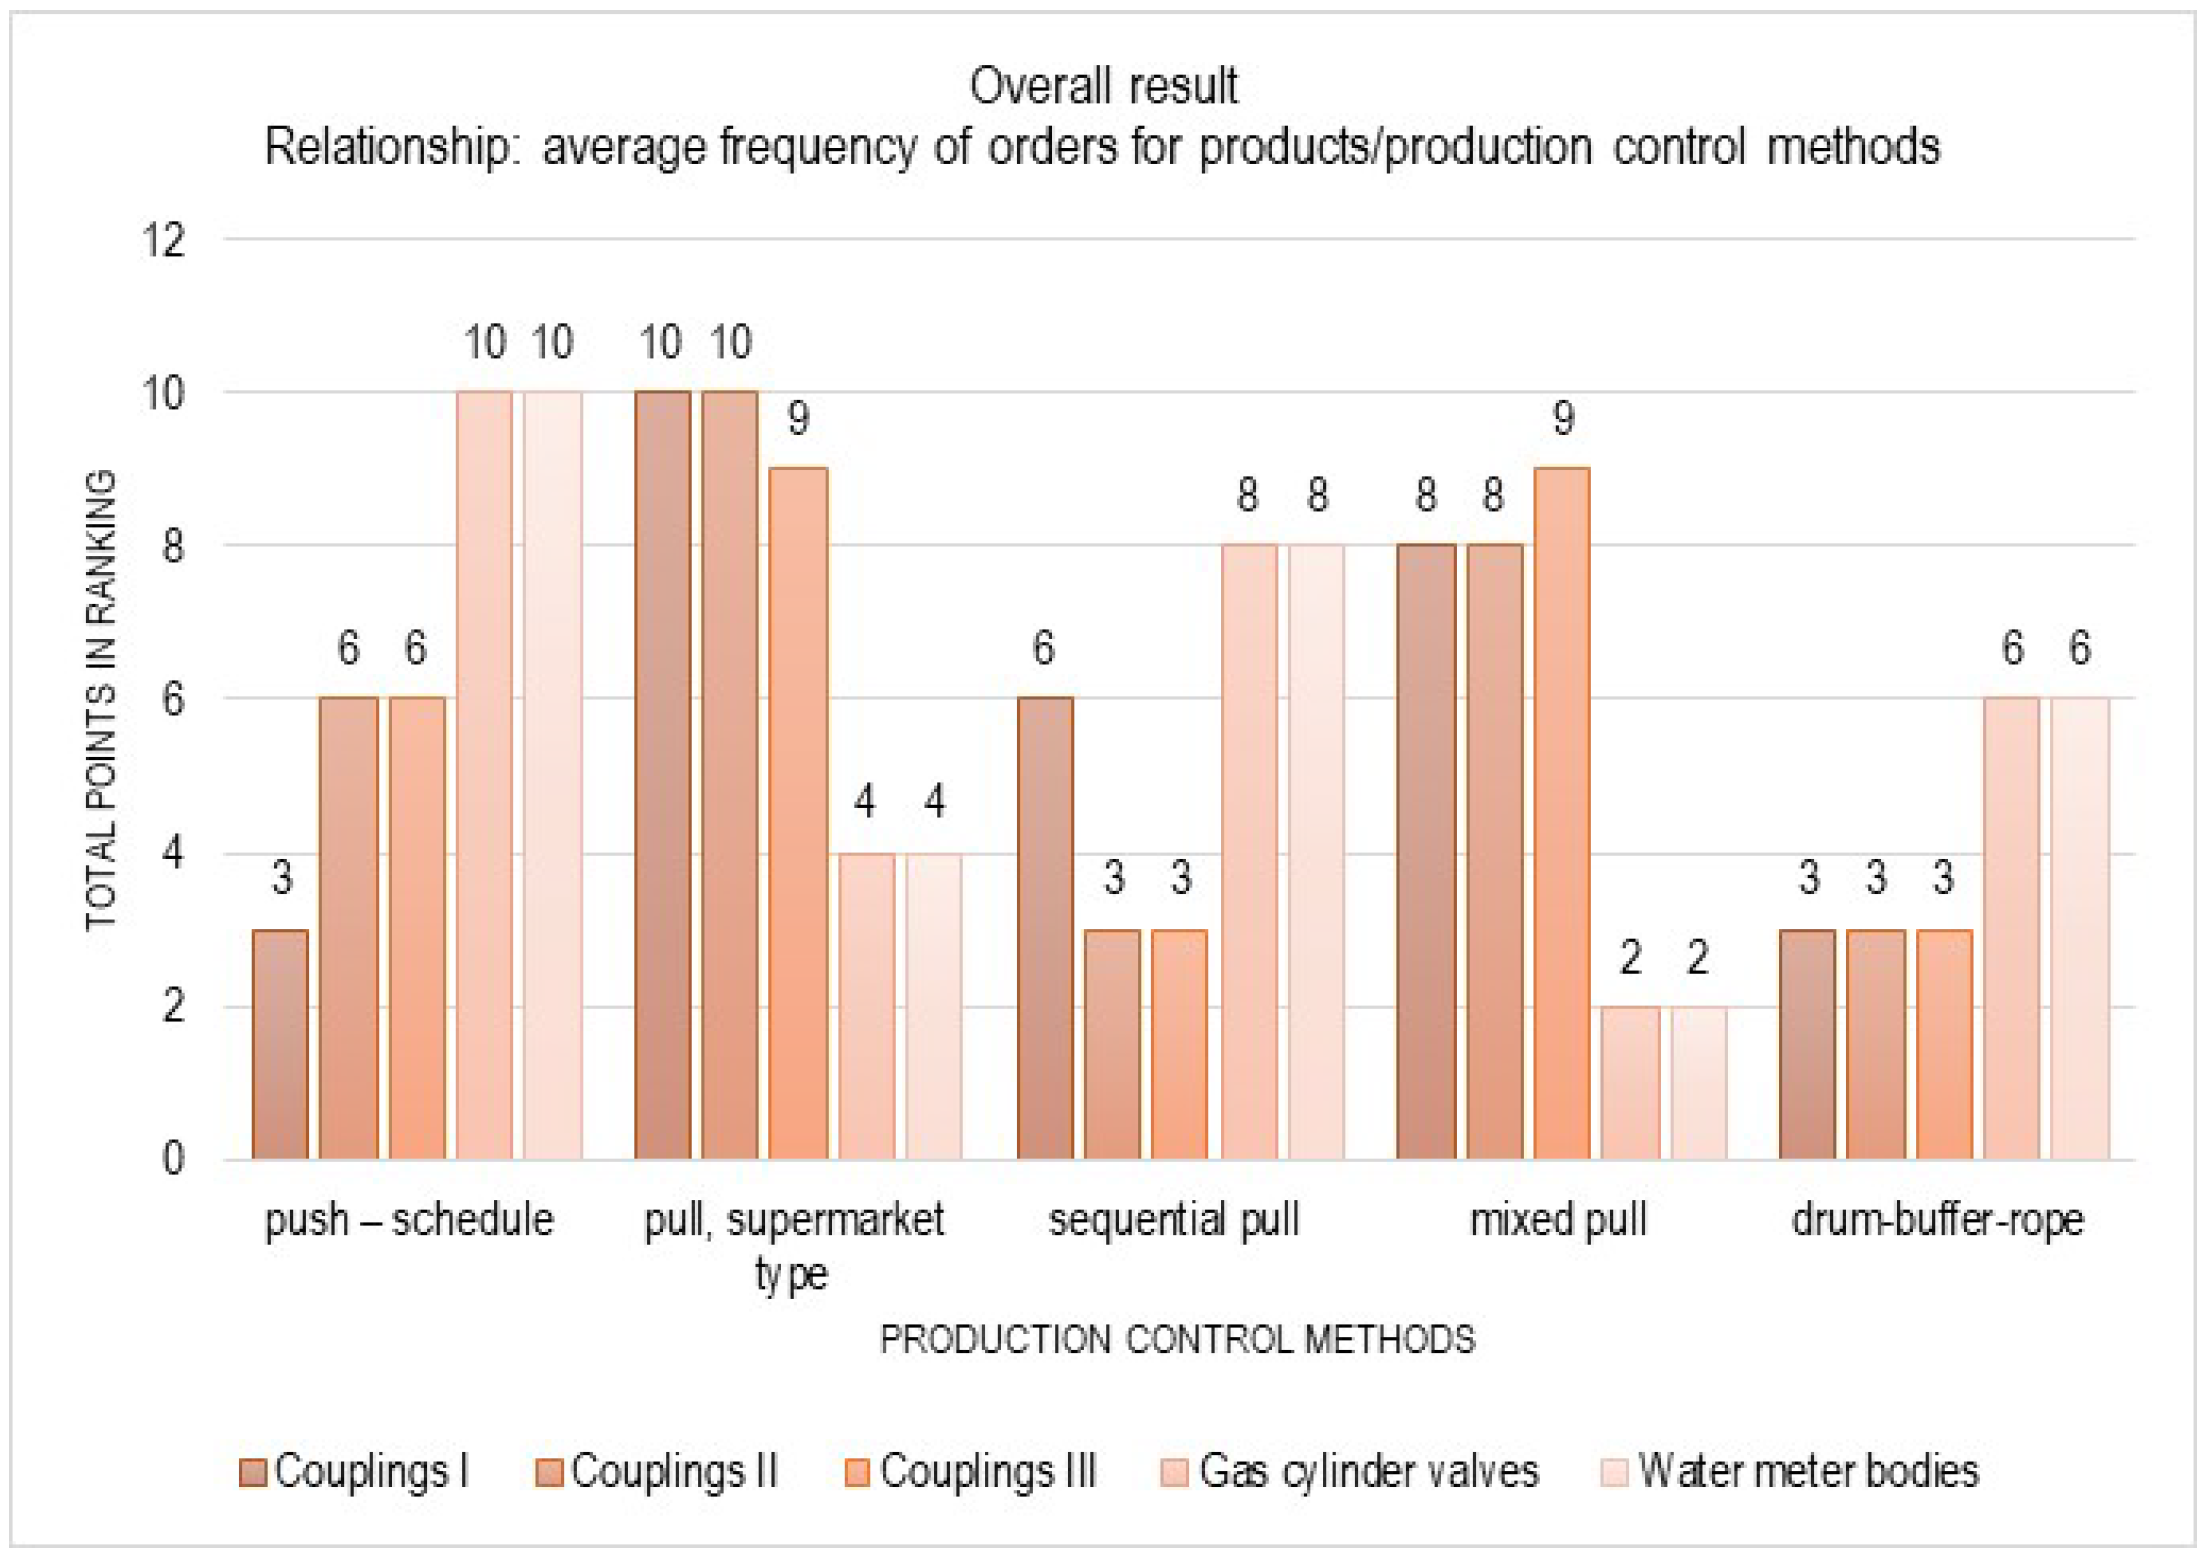
An increase in the average frequency of orders for products affects
  • An increase in in-process stocks and longer material throughput times in the case of the push–schedule method;
  • Shorter material flow times and lower inter-operational stocks in the case of the supermarket- and mixed-pull methods.
The overall results indicate that as the average frequency of product orders increases, the use of the push–schedule and drum-buffer-rope methods results in a deterioration in the evaluation criteria values. In contrast, the supermarket-pull method allows for their improvement. In the case of the other methods, there are no clear relationships (Figure 12).

4. Discussion

Based on the ranking method used, an attempt was made to generalize the results. A matrix of relationships between PPOC factors and production flow control methods was developed (Table 3). For increasing values of the factors, it was determined whether there is a relationship with the control method. An ‘up’ arrow (↑) means that the relationship exists, and with an increase in the value of the PPOC factor, a given production flow control method allows for better evaluation indicators than other methods. A ‘down’ arrow (↓) means that there is a relationship, but it indicates an inverse relationship, and with an increase in the value of the PPOC factor, a given production flow control method allows for obtaining worse evaluation indicator values than other methods. In the absence of a clear relationship, the symbol ‘⎯’ was used.
This analysis indicates that, in most cases, there is a relationship between PPC factors and production flow control methods. The pull-schedule method shows the lowest degree of correlation. This may be due to the influence of other PPOC factors than those included in the analysis.
The sequential pull and drum-buffer-rope methods have the highest number of relationships with PPOC factors, and these relationships indicate that as these factors increase, they allow for better lead time and in-process stock values.
As the value of PPOC factors increases, the supermarket- and mixed-pull methods obtain worse evaluation criteria values for most PPOC factors. The indicated relationships concern process and product factors.
However, in the case of factors related to product demand (average daily demand and order frequency), the results indicate that pull methods (supermarket and mixed) are more effective.
It can also be concluded that the drum-buffer-rope method is the most flexible. This is indicated by the overall evaluation results, where this method obtained the smallest range of results, from three to six. The results indicate that the application of this method allows for the achievement of balanced results for lead time and in-process stock indicators.

5. Conclusions

Achieving efficient and effective production flow requires, above all, the adoption of an appropriate production flow control method. Due to the diverse nature of production processes, a given method will not work in all technical and organizational conditions of a production system. Selecting an appropriate/acceptable control method that will contribute to improving the efficiency of production flow usually requires the development of several variants. To this end, it is necessary to analyze many factors related to the specific nature of the production processes, e.g., demand, available resources, and technological processes.
The presented research results indicate the rules governing the relationship between PPOC factors and production flow control methods. They can serve as a basis for taking measures to improve production flow by implementing the most effective control method.
The identified relationships and analysis results can be applied in various industrial sectors. Determining product families and PPOC values will enable a more accurate selection of production flow control methods, taking into account the characteristics of production processes. The indicated relationships also point to the impact of decisions made in the production preparation process. Product design and technological-process structure are important factors influencing the efficiency of material and information flow in production processes.
Further research will focus on determining the relationship for a larger number of product families and different levels of PPOC factors.

Funding

This research was funded by statutory activity financed by the Polish Ministry of Science and Higher Education, grant number (0613/SBAD/4940).

Institutional Review Board Statement

Not applicable.

Informed Consent Statement

Not applicable.

Data Availability Statement

The original contributions presented in this study are included in the article. Further inquiries can be directed to the author.

Conflicts of Interest

The author declares no conflicts of interest.

References

  1. Thürer, M.; Fernandes, N.O.; Lödding, H.; Stevenson, M. Material Flow Control in Make-to-Stock Production Systems: An Assessment of Order Generation, Order Release and Production Authorization by Simulation; Flexible Services and Manufacturing Journal; Springer: Berlin/Heidelberg, Germany, 2024; Volume 37. [Google Scholar]
  2. Gómez Paredes, F.J.; Godinho Filho, M.; Thürer, M.; Jabbour, C.J.C. Factors for choosing production control systems in make-to-order shops: A systematic literature review. J. Intell. Manuf. 2022, 33, 639–674. [Google Scholar] [CrossRef]
  3. Karaman, A.; Altiok, T. Approximate analysis and optimization of batch ordering policies in capacitated supply chains. Eur. J. Oper. Res. 2009, 193, 222–237. [Google Scholar] [CrossRef]
  4. Nayera, E.; Said, E.; Ashraf, E.-D. Implementing Performance-Based Analysis in Supply Chain Management: Review and Extension Proceedings; Annual Conference—Canadian Society for Civil Engineering: Vancouver, BC, Canada, 2017. [Google Scholar]
  5. Theuer, H.; Pahl, M. Market survey: Material flow control systems. Product. Manag. 2015, 20, 36–45. [Google Scholar]
  6. Peng, Y.; Guan, Z.; Ma, L.; Li, P. A mathematical programming method for flow path design in high-mix and low-volume flow manufacturing. In Proceedings of the 2008 IEEE In-Ternational Conference on Industrial Engineering and Engineering Management, Macao, China, 8–11 December 2008. [Google Scholar]
  7. Pekarcikova, M.; Trebuna, P.; Kliment, M.; Dic, M. Solution of Bottlenecks in the Logistics Flow by Applying the Kanban Module in the Tecnomatix Plant Simulation Software. Sustainability 2021, 13, 7989. [Google Scholar] [CrossRef]
  8. Kumar, A.; Kumar, N.; Mondal, S.; Biswas, T. A Survey-Based Study to Understand Various Aspects of Kanban; Lecture Notes in Networks and Systems; Springer: Singapore, 2022; Volume 461. [Google Scholar]
  9. Schweizer, T. Comparing cone-partitioned plate and cone-standard plate shear rheometry of a polystyrene melt. J. Rheol. 2003, 47, 1071–1085. [Google Scholar] [CrossRef]
  10. Rusli, M.H.M.; Jaffar, A.; Muhamud-Kayat, S.; Ali, M.T. Selection criterion of production methods used in the kanban pull system at Malaysian auto suppliers. In Proceedings of the IEOM 2015—5th International Conference on Industrial Engineering and Operations Management, Proceeding, Dubai, United Arab Emirates, 3–5 March 2015. [Google Scholar]
  11. Thürer, M.; Fernandes, N.O.; Stevenson, M.; Li, C.D. Centralised vs. decentralised control decision in card-based control systems: Comparing kanban systems and COBACABANA. Int. J. Prod. Res. 2019, 57, 322–337. [Google Scholar] [CrossRef]
  12. Tošanović, N.; Štefanić, N. Evaluation of Pull Production Control Mechanisms by Simulation. Processes 2022, 10, 5. [Google Scholar] [CrossRef]
  13. Mitsuyuki, K.; Kojima, F.; Douba, H.; Arai, E. Operation Method for Multi-Types and Multi-Stages Kanban System Using Discrete Event Simulation Nippon Kikai Gakkai Ronbunshu; C Hen/Transactions of the Japan Society of Mechanical Engineers: Shinjuku, Japan, 2004; Part C. [Google Scholar]
  14. Grieco, A.; Caricato, P.; Margiotta, P. Beyond Kanban: POLCA-Constrained Scheduling for Job Shops. Algorithms 2025, 18, 340. [Google Scholar] [CrossRef]
  15. Guo, Y.-H.; Qian, X.-S. Jisuanji Jicheng Zhizao Xitong. Integrated production planning and control system based on drum-buffer-rope theory. Comput. Integr. Manuf. Syst. C. 2006, 12, 252–256. [Google Scholar]
  16. Krom, P.; Ahmad, R.; Mustafa, S.A.; Sin, T.C. Implementation of Kanban-Based Fifo System to Minimize Lead Time at Automated Optical Inspection Operation—A Case Study in Semiconductor Industry; Lecture Notes in Mechanical Engineering; Springer: Singapore, 2021; pp. 97–108. [Google Scholar]
  17. Wiesse, D.; Roser, C. Supermarkets vs. FIFO lanes: A comparison of work-in-process inventories and delivery performance. In IFIP Advances in Information and Communication Technology; Springer: Cham, Switzerland, 2016; pp. 651–658. [Google Scholar]
  18. Lin, Y.-H.; Shie, J.-R.; Lee, C.-E. A WIP-based dispatching rule for photolithography area in wafer fabrication factories. In Proceedings of the 36th International Conference on Computers and Industrial Engineering, ICC and IE 2006, Orlando, FL, USA, 20–23 June 2006; Scopus: Jerusalem, Israel, 2006. [Google Scholar]
  19. Yang, K.K. Managing a flow line with single-kanban, dual-kanban or conwip. Prod. Oper. Manag. 2000, 9, 349–366. [Google Scholar] [CrossRef]
  20. Seiringer, W.; Bokor, B.; Altendorfer, K. Evaluating Production Planning and Control Systems in Different Environments: A Comparative Simulation Study. In Proceedings of the Winter Simulation Conference (WSC), Orlando, FL, USA, 15–18 December 2024. [Google Scholar]
  21. Sirikrai, V.; Yenradee, P. Modified drum-buffer-rope scheduling mechanism for a non-identical parallel machine flow shop with processing-time variation. Int. J. Prod. Res. 2006, 44, 3509–3531. [Google Scholar] [CrossRef]
  22. Guo, Y.-H.; Qian, X.-S. Jisuanji Jicheng Zhizao Xitong/Shop floor control in wafer fabrication based on drum-buffer-rope theory. Comput. Integr. Manuf. Syst. C. 2006, 12, 111–116. [Google Scholar]
  23. Liu, X.; Shen, L.; Zhang, K. Estimating the Probability Distribution of Construction Project Completion Times Based on Drum-Buffer-Rope Theory. Appl. Sci. 2021, 11, 7150. [Google Scholar] [CrossRef]
  24. Yue, L.; Xu, G.; Mumtaz, J.; Chen, Y.; Zou, T. Order Releasing and Scheduling for a Multi-Item MTO Industry: An Efficient Heuristic Based on Drum Buffer Rope. Appl. Sci. 2022, 12, 1925. [Google Scholar] [CrossRef]
  25. Bokor, B.; Seiringer, W.; Altendorfer, K. Integrating Simulation Budget Management into Drum-Buffer-Rope: A Study on Parametrization and Reducing Computational Effort; Lecture Notes in Computer Science (including subseries Lecture Notes in Artificial Intelligence and Lecture Notes in Bioinformatics); Springer: Cham, Switzerland, 2025. [Google Scholar]
  26. Rabbani, M.; Tanhaie, F. A Markov chain analysis of the effectiveness of drum-buffer-rope material flow management in job shop environment. Int. J. Ind. Eng. Comput. 2015, 6, 457–468. [Google Scholar] [CrossRef]
  27. Georgiadis, P.; Politou, A. Dynamic Drum-Buffer-Rope approach for production planning and control in capacitated flow-shop manufacturing systems. Comput. Ind. Eng. 2013, 65, 689–703. [Google Scholar] [CrossRef]
  28. Ma, L.-L.; Chen, J. Modeling and simulating of time buffer control for engine remanufacturing system. In Proceedings of the 2009 International Conference on Information Engineering and Computer Science, ICIECS 2009, Wuhan, China, 19–20 December 2009. [Google Scholar]
  29. Khalil, R.A.; Stockton, D.J.; Fresco, J.A. Managing the effects of variability in drum-buffer-rope systems. Int. J. Ind. Syst. Eng. 2008, 3, 53–69. [Google Scholar] [CrossRef]
  30. Koh, S.-G.; Bulfin, R.L. Comparison of DBR with CONWIP in an unbalanced production line with three stations. Int. J. Prod. Res. 2004, 42, 391–404. [Google Scholar] [CrossRef]
  31. Watson, K.J.; Patti, A. A comparison of JIT and TOC buffering philosophies on system performance with unplanned machine downtime. Int. J. Prod. Res. 2008, 46, 1869–1885. [Google Scholar] [CrossRef]
Figure 1. Scope and research plan.
Applsci 15 10300 g001
Figure 2. Example of a process map for a gas cylinder valve using the sequential-pull method.
Applsci 15 10300 g002
Figure 3. Ranking of production flow control methods for the factor ‘number of operations in the technological process’.
Applsci 15 10300 g003
Figure 4. Overall result of the relationship between average number of parts and production flow control methods.
Applsci 15 10300 g004
Figure 5. Overall assessment of the relationship between range number of parts and production flow control methods.
Applsci 15 10300 g005
Figure 6. Overall result of the relationship between the number of shared production stations and production flow control methods.
Applsci 15 10300 g006
Figure 7. Overall result of the relationship between the average unit time of technological operations and production flow control methods.
Applsci 15 10300 g007
Figure 8. Overall result of the relationship between the unit time span of technological operations and production flow control methods.
Applsci 15 10300 g008
Figure 9. Overall result of the relationship between technological time and production flow control methods.
Applsci 15 10300 g009
Figure 10. Overall result of the relationship between the number of technological operations and production flow control methods.
Applsci 15 10300 g010
Figure 11. Overall result of the relationship between average daily demand and production flow control methods.
Applsci 15 10300 g011
Figure 12. Overall result of the relationship between average order frequency and production flow control methods.
Applsci 15 10300 g012
Table 1. Values of indicators for evaluating production flow control methods.
Production Flow Control MethodIndicatorProduct Family
Water Meter BodiesGas Cylinder ValvesCouplings ICouplings IICouplings III
push–scheduleStock [pcs.]267,970217,19557154274
Lead time [days]35.7329.218.421.3
pull, supermarket-typeStock [pcs.]144,29098,620105195315
Lead time [days]22.116.515.623.225.6
sequential pullStock [pcs.]184,900138,80089132252
Lead time [days]26.419.710.913.115.7
mixed pullStock [pcs.]120,63084,96096176290
Lead time [days]21.615.412.721.827.9
drum-buffer-ropeStock [pcs.]165,720110,70072119221
Lead time [days]24.618.27.416.918.5
Table 2. Values of PPOC factors for the analyzed product families.
Product Family
Couplings ICouplings IICouplings IIIGas Cylinder ValvesWater Meter Bodies
Number of components [pcs.]Average44621
Range41200
Shared workstationsNumber workstations33410
Unit time of technological operations [s]Average38618852814128
Range930567010,4005822
Total (technological time)501733,93067,54013765
Number of technological operations132024138
Average daily requirement [pcs.]11012040007500
Average order frequency [days]1015286065
Table 3. Matrix of relationships between PPOC factors and production flow control methods.
IndicatorsPush–SchedulePull, Supermarket-TypeSequential PullMixed PullDrum-Buffer-Rope
Number of components [pcs.]Average
Range
Shared workstations
Unit time of technological operations [s]Average
Range
Total (technological time)
Number of technological operations
Average daily requirement [pcs.]
Average order frequency [days]
⎯—no clear relationship. ↑—relationship exists, and with an increase in the value of the PPOC factor, a given production flow control method allows for better evaluation indicators than other methods. ↓—relationship exists, and with an increase in the value of the PPOC factor, a given production flow control method allows for obtaining worse evaluation indicator values than other methods.
Disclaimer/Publisher’s Note: The statements, opinions and data contained in all publications are solely those of the individual author(s) and contributor(s) and not of MDPI and/or the editor(s). MDPI and/or the editor(s) disclaim responsibility for any injury to people or property resulting from any ideas, methods, instructions or products referred to in the content.