Analysis of the Relationship Between Production Process Determinants and Production Flow Control Methods
Abstract
1. Introduction
2. Materials and Methods
2.1. Production Flow Control Methods
- Push–schedule—material flow is based on production schedules without taking into account the current demand of cooperating production stations;
- Pull, supermarket-type—material flow is based on the actual consumption of materials, parts, and products in a supermarket that serves as a stock between cooperating production cells;
- Sequential pull—flow takes place according to a fixed production sequence but with control of the quantity of parts between production cells;
- Mixed pull—material flow is carried out using the supermarket-pull and sequential-pull methods;
- Drum-buffer-rope—flow is regulated taking into account bottlenecks in the production process.
2.2. Factors for PPOC
- Number of components in finished products, including
- Average number of components for products in a product family;
- Range of the number of components in a product family—determines the range of variability in the number of components in a given product family.
- Number of technological operations in the technological process—determines the number of technological operations required to manufacture products in a product family.
- Number of production stations shared in production processes—determines how many of these production stations are used to manufacture components of products in the family, which determines the production stations where the flow of materials ‘intersects’.
- Unit time of technological operations, including
- Average unit time of technological operations (time to produce one unit of a product in a technological operation) for processes in a given product family;
- Range of unit times—determines the range of variability of these times for a product family;
- Technological process time—determines the total unit time for the execution of technological operations.
- Average daily demand for products–determines the total demand for products in the family for a period of one year in relation to one working day.
- Average frequency of product orders–determines the average frequency with which products are ordered by customers.
- Lead time—the time it takes for material to pass through the production process from the moment the raw materials are received to the shipment of finished products;
- Total in-process stocks in the production process—the sum of inventory between successive stages of the production process.
2.3. Data Preparation and Analysis
3. Results
3.1. Number of Components of Finished Products
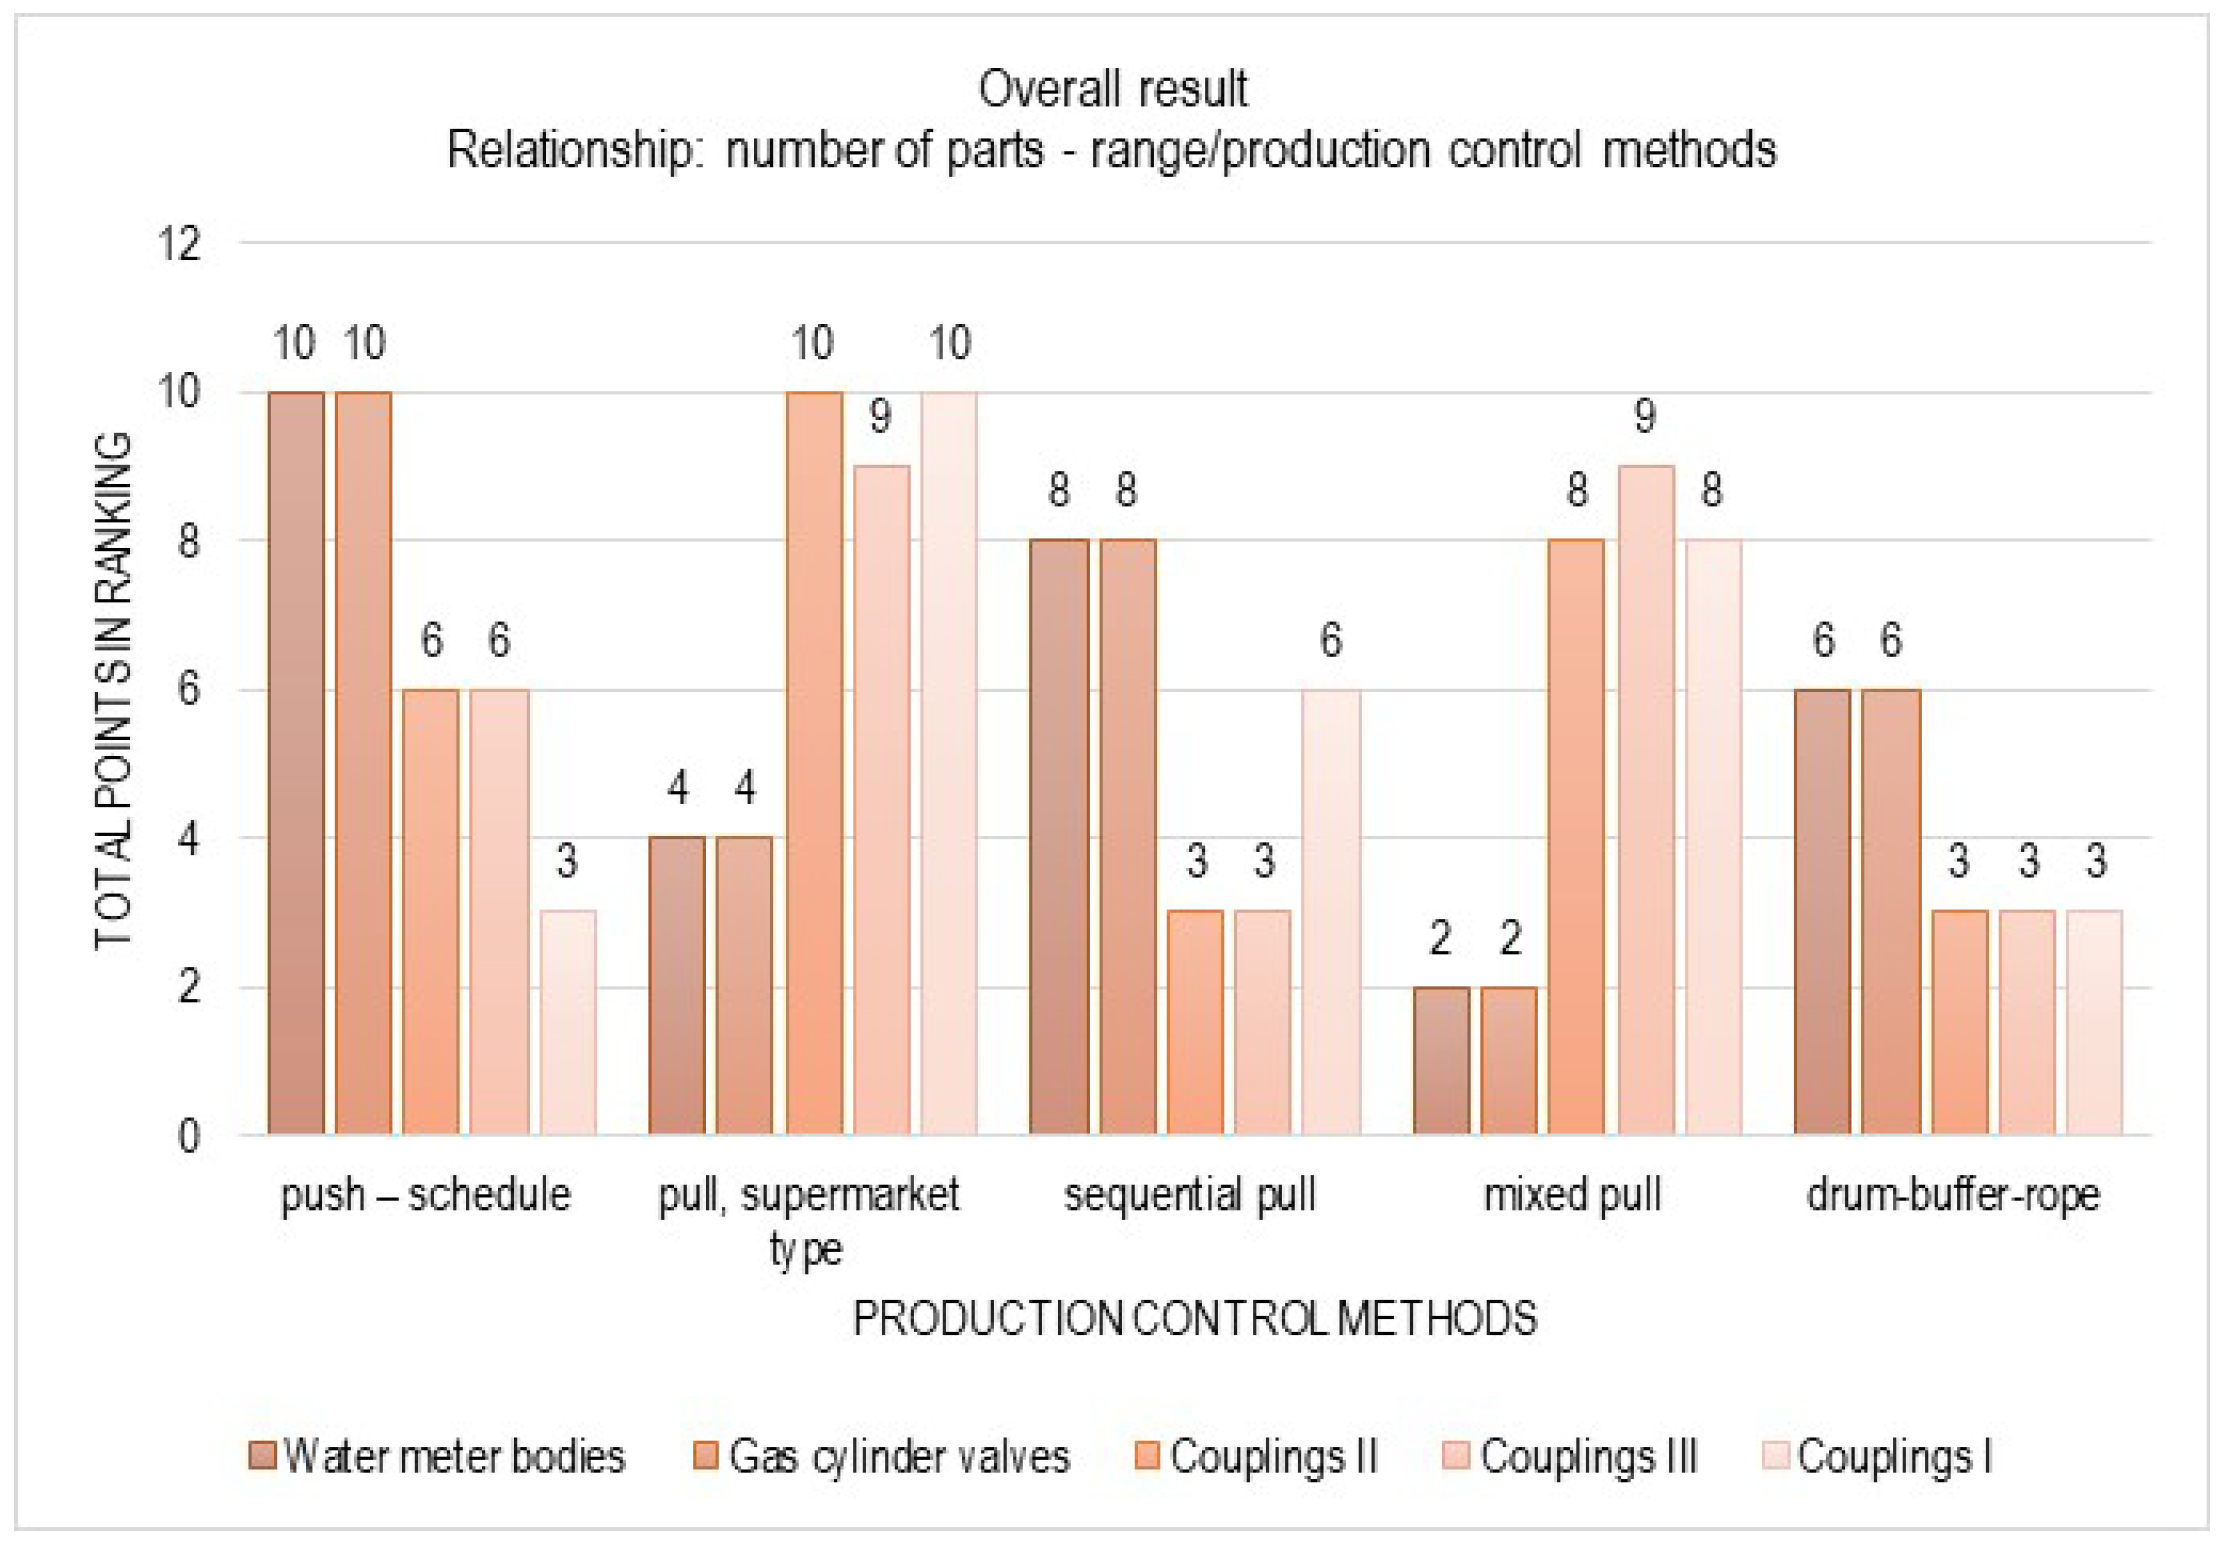
- Lower in-process stocks when using the sequential-pull and drum-buffer-rope methods.
- Increased in-process stocks when using the supermarket-pull and mixed-pull methods.
- A reduction in material transit time for the sequential-pull method.
- An increase in in-process stocks when using the supermarket- and mixed-pull methods;
- A decreasing trend in material throughput time for the push–schedule and drum-buffer-rope methods.
3.2. Number of Shared Production Stations
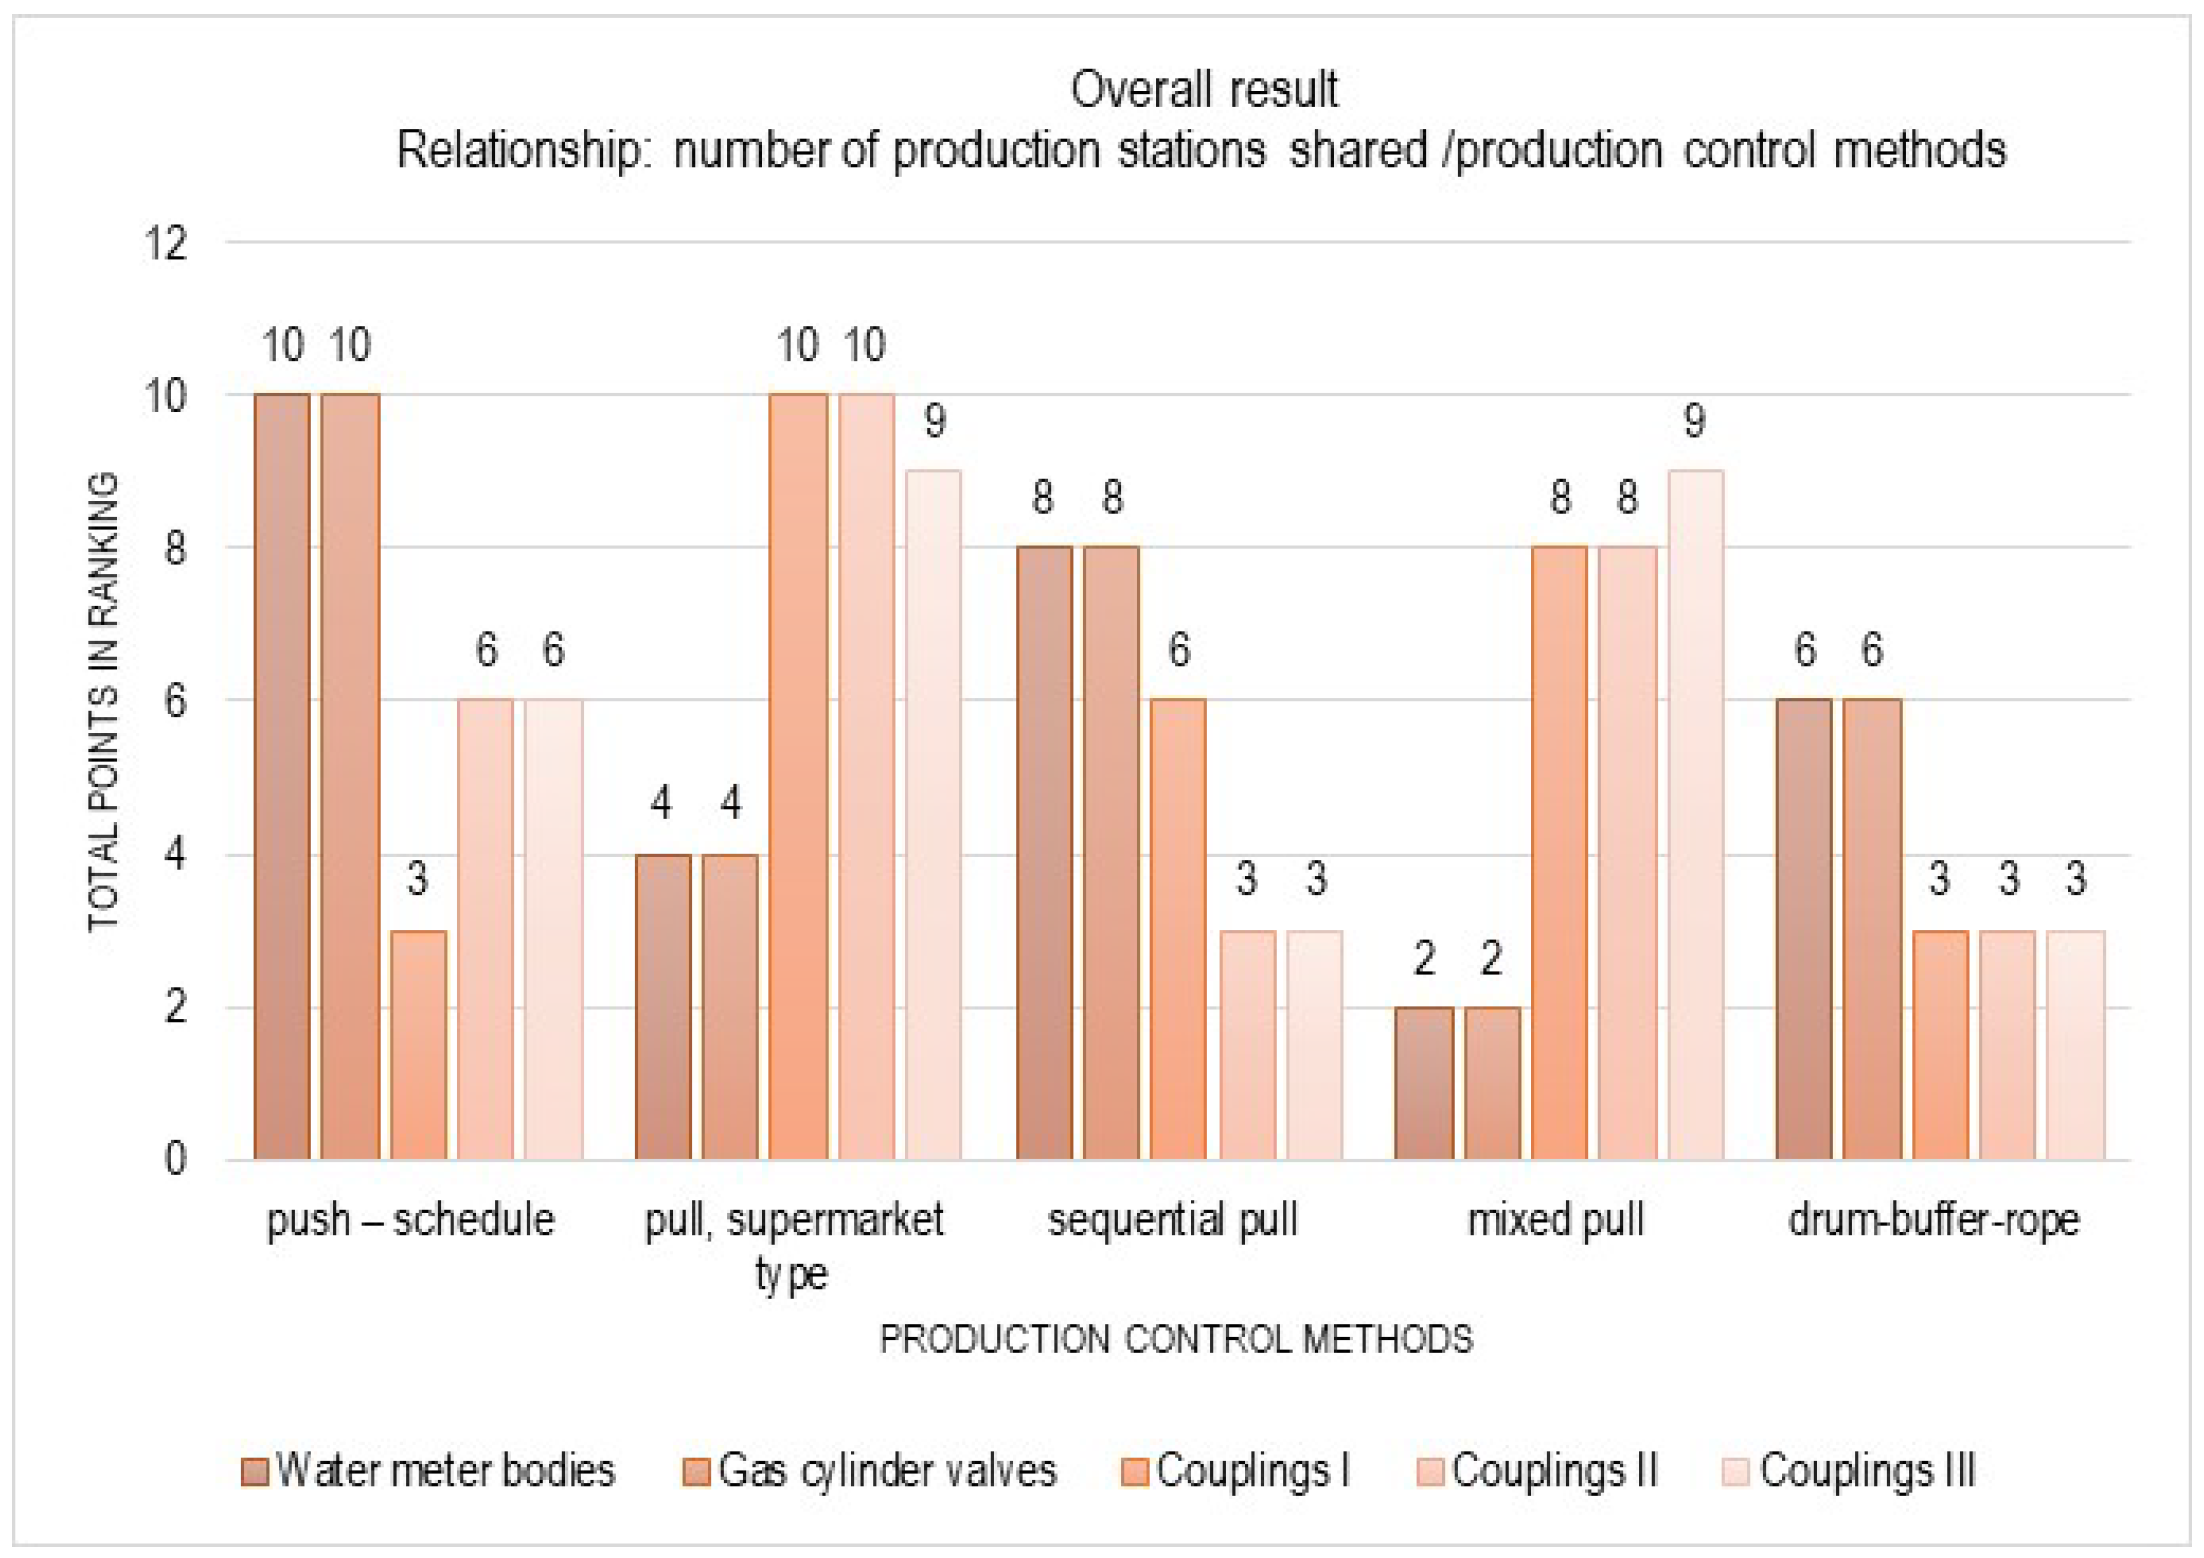
- An increase in in-process stocks when using the supermarket- and mixed-pull methods;
- A reduction in material throughput time when using the sequential-pull method.
3.3. Unit Time of Technological Operations
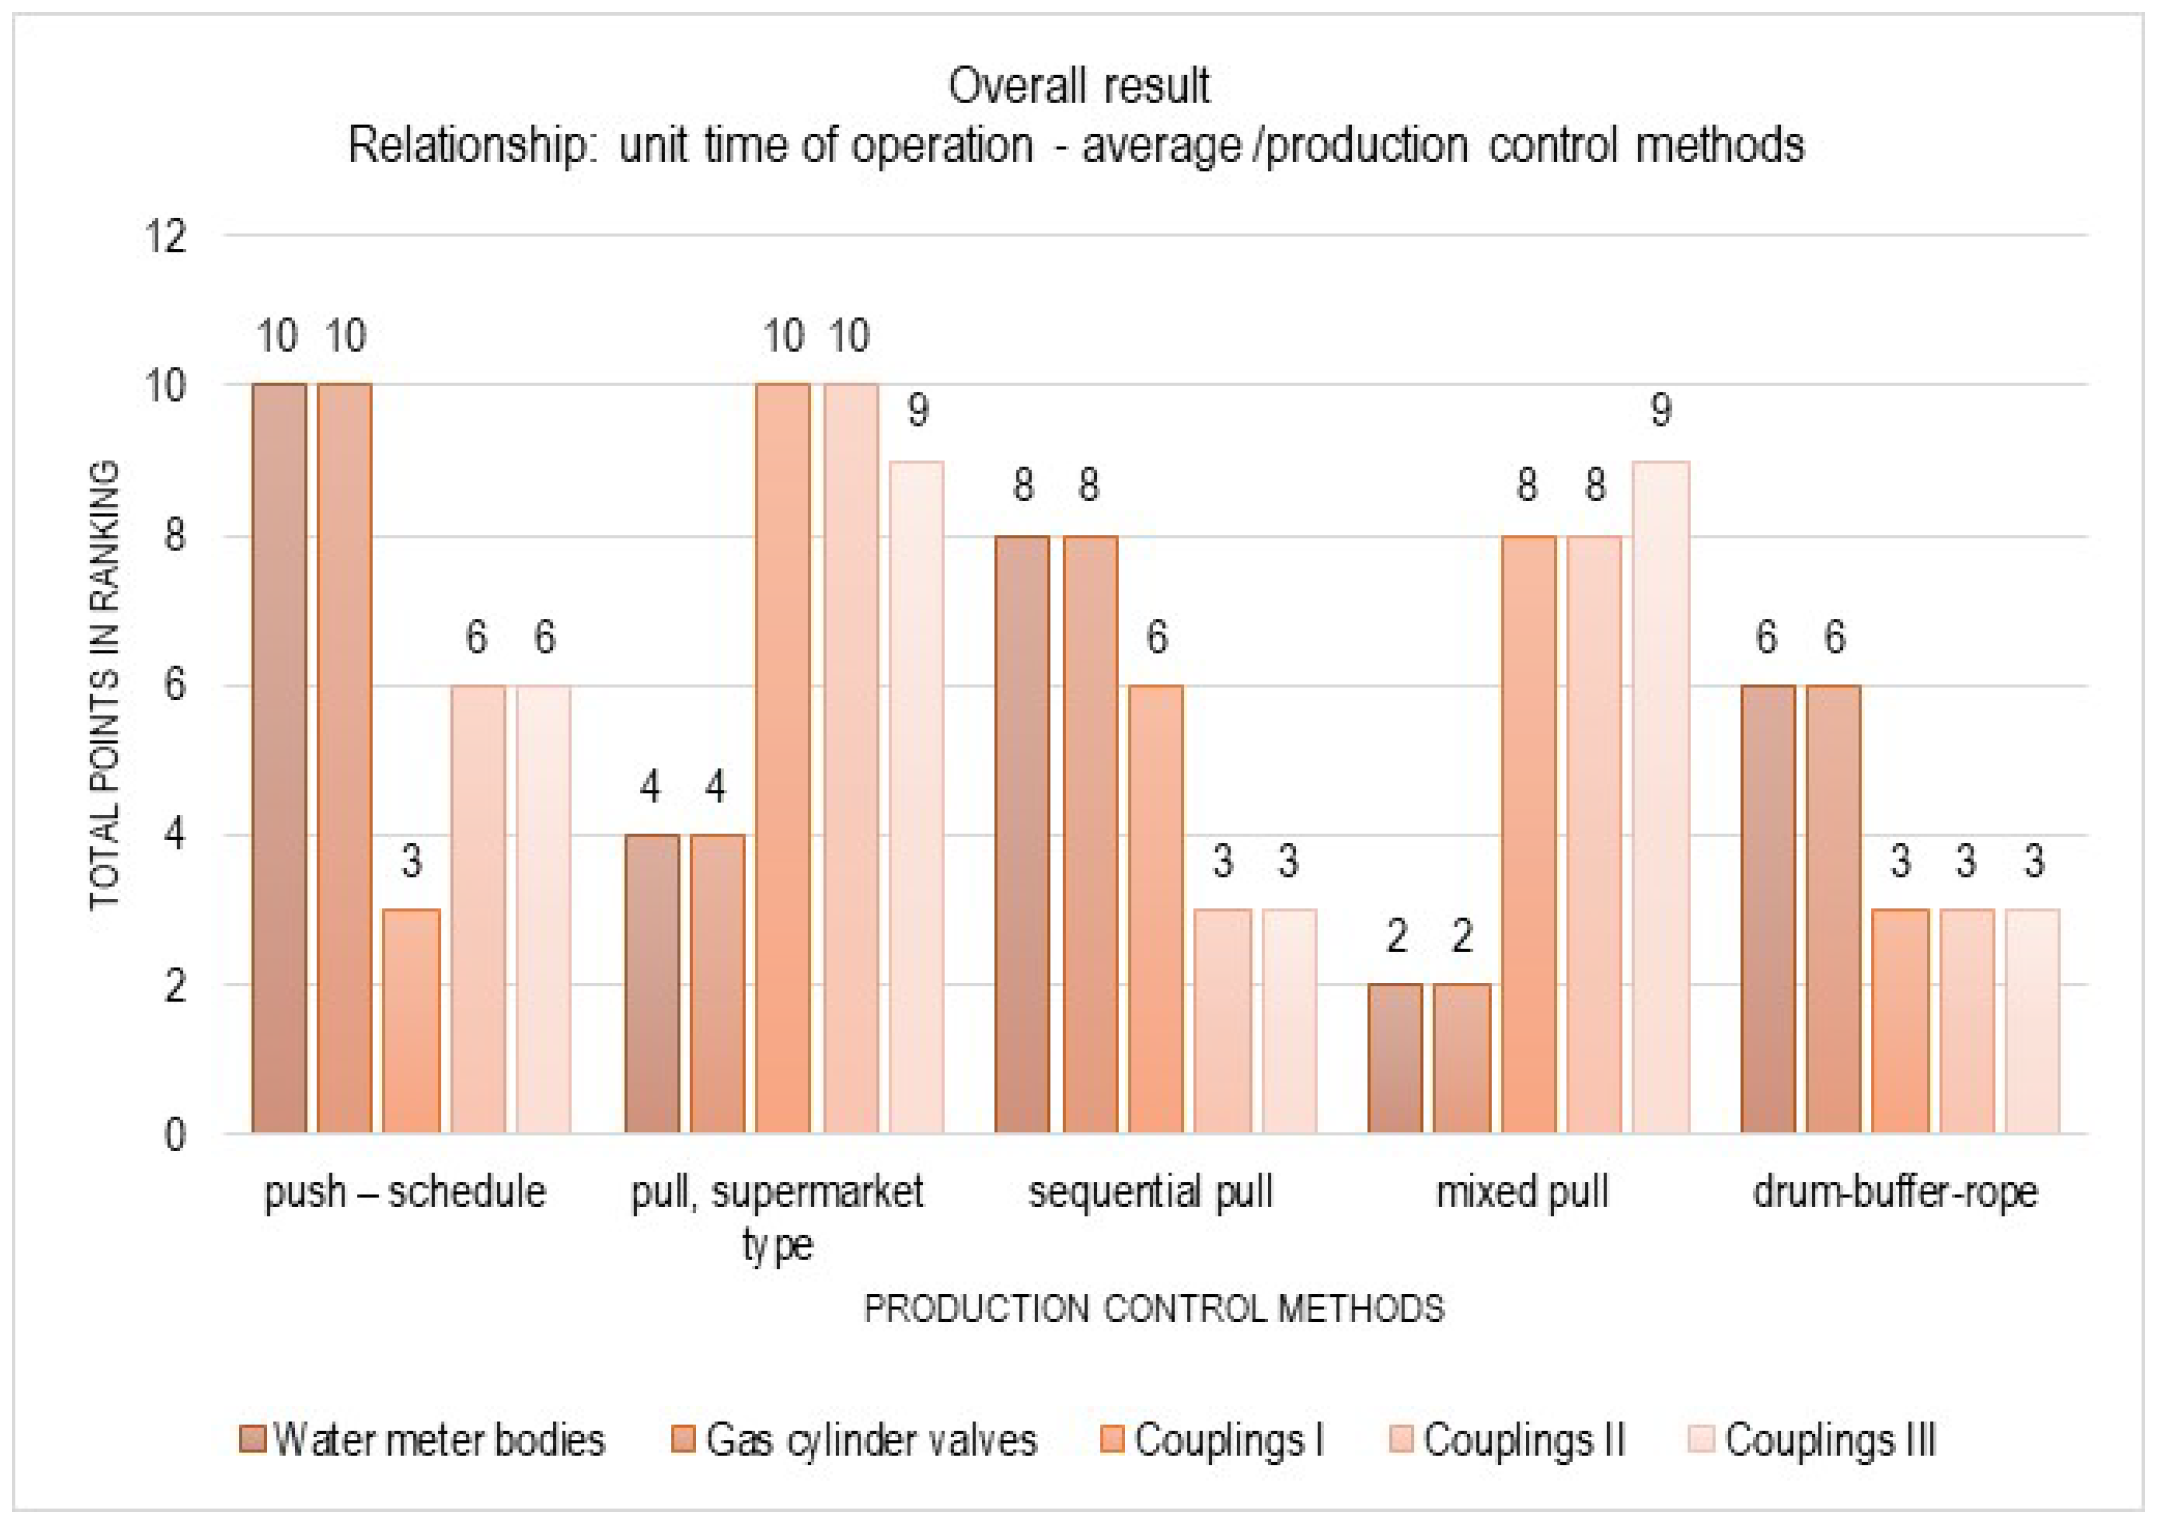
- Obtaining increasingly smaller values of in-process stocks when using the sequential-pull method and the drum-buffer-rope method;
- The increase in material flow time in the case of the mixed-pull method.
- A reduction in the value of in-process stocks when using the supermarket- and mixed-pull methods;
- Stocks in the case of sequential-pull and drum-buffer-rope methods;
- An increase in material flow time in the case of the mixed-pull method.
- The lowering of in-process stocks when using the supermarket- and mixed-pull methods;
- Inventory values when using the sequential-pull and drum-buffer-rope methods;
- The increase in material transit time when using the mixed-pull method.
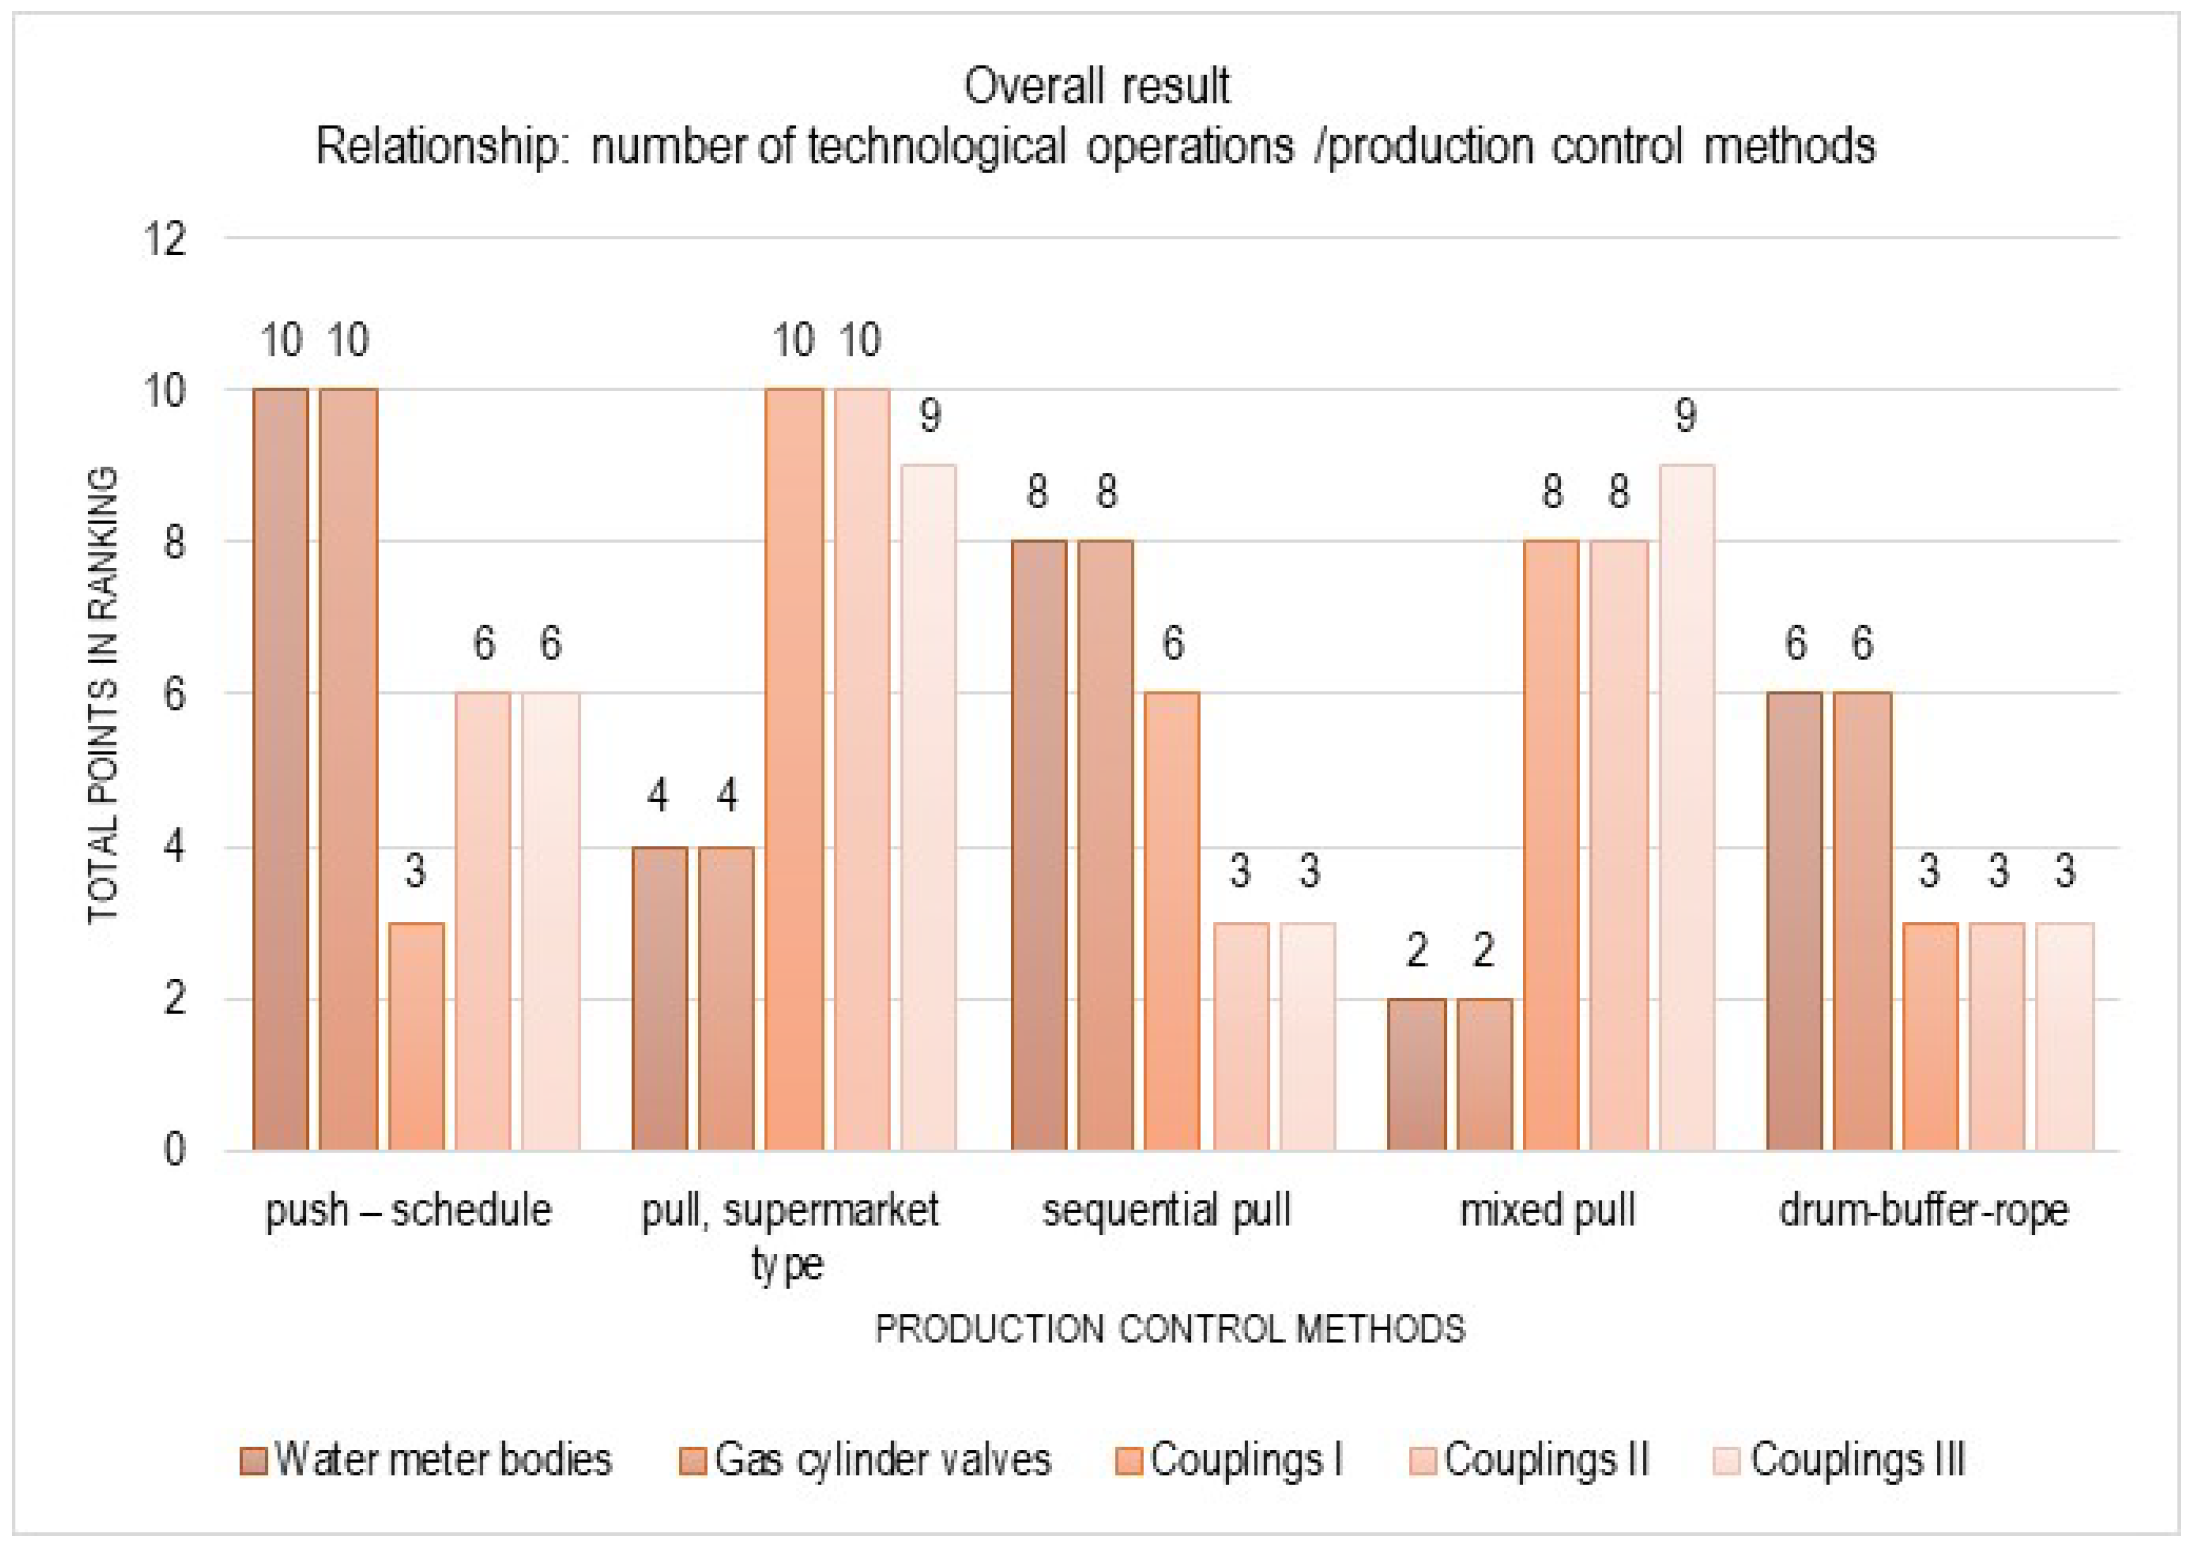
3.4. Number of Technological Operations
- Obtaining increasingly lower values of in-process stocks when using the sequential-pull and drum-buffer-rope methods;
- The increase in material flow time in the case of the mixed-pull method.
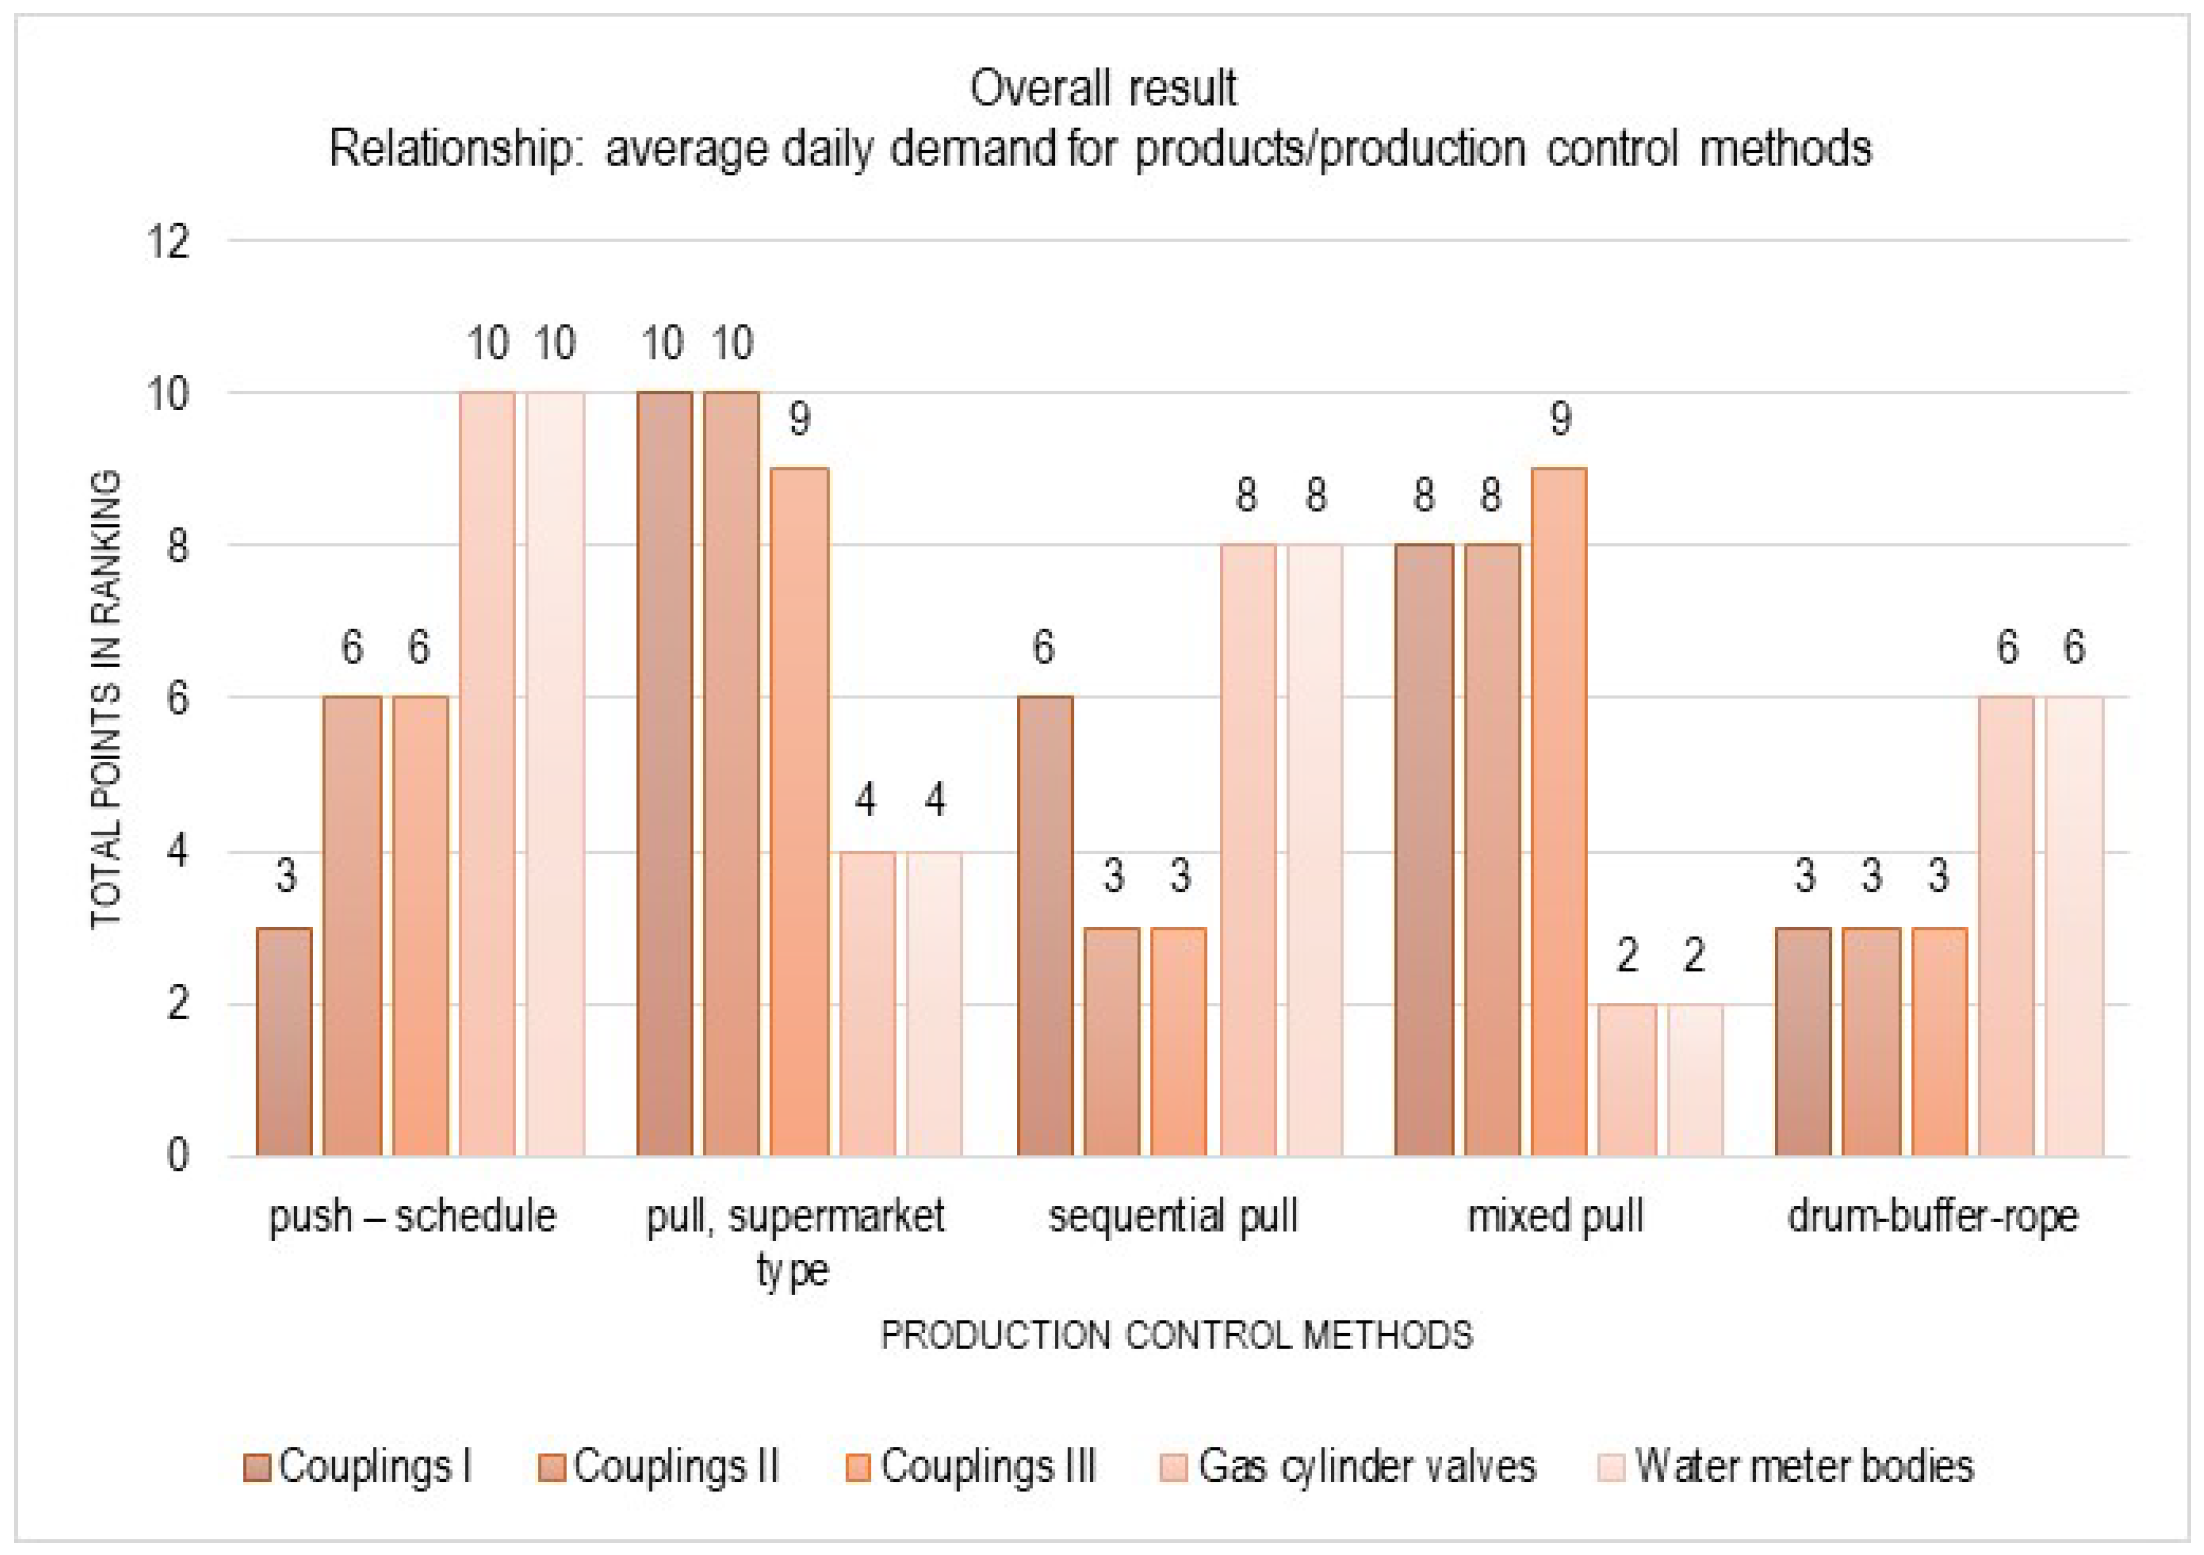
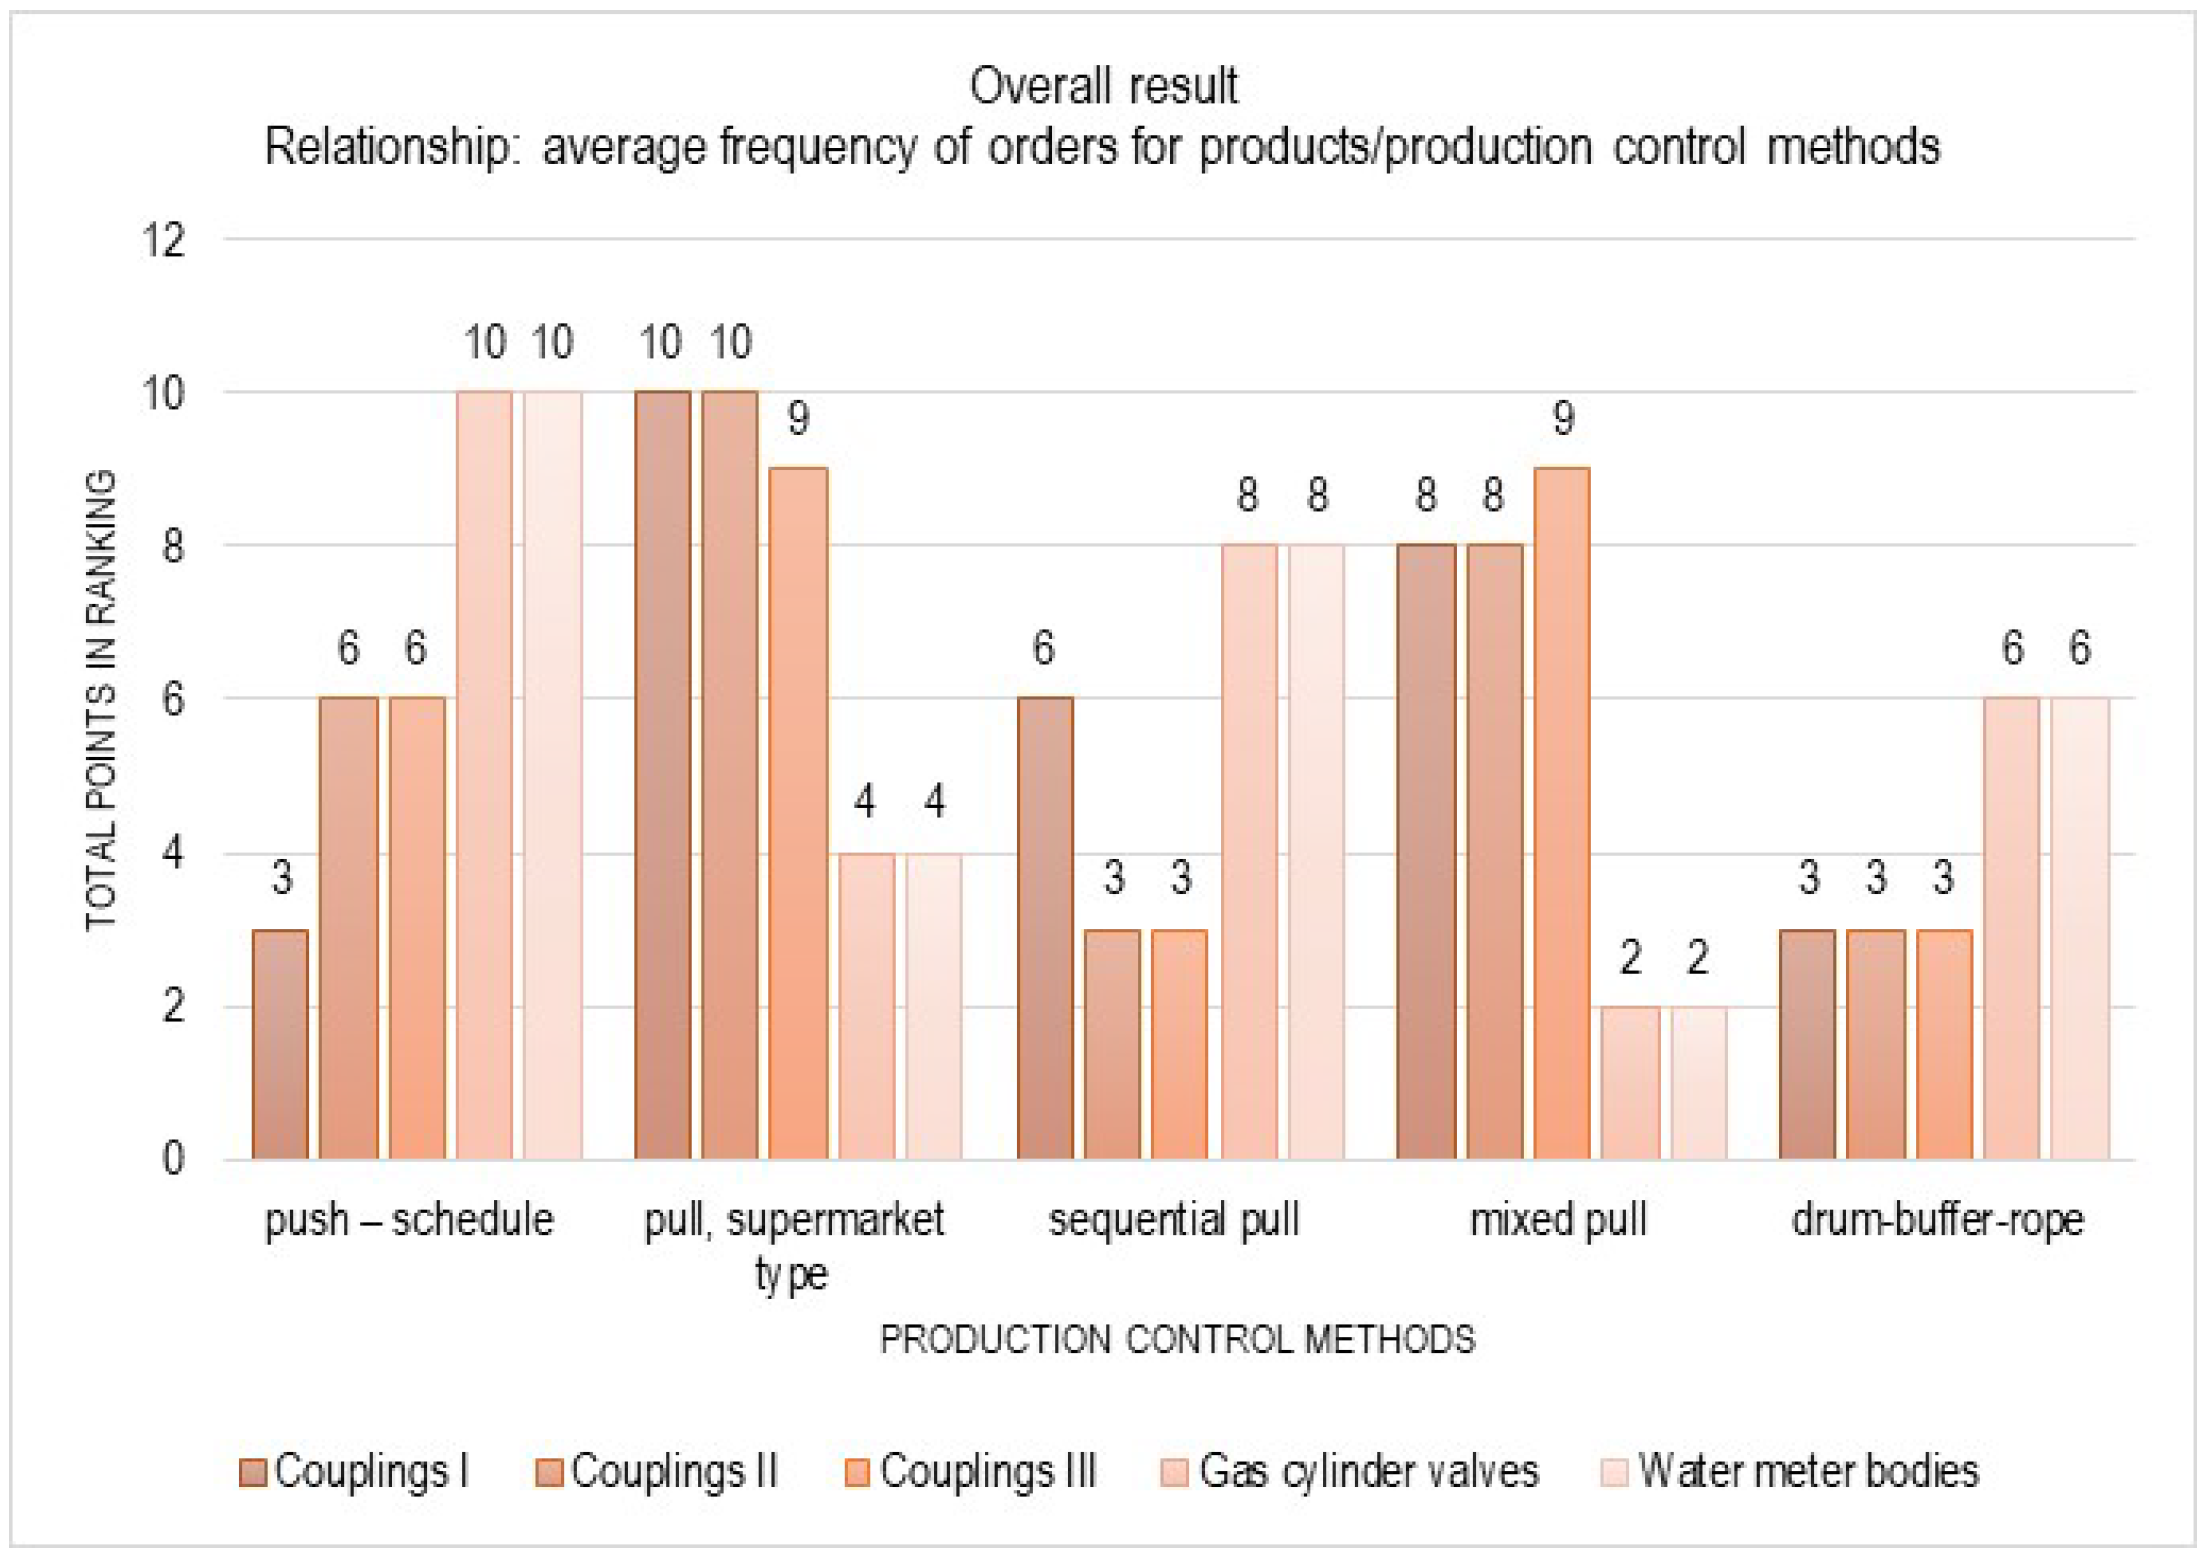
3.5. Demand for Products
- An increase in-process stocks and longer material transit times in the case of the push–schedule method;
- Shorter material flow times and lower inter-operational stocks in the case of the supermarket- and mixed-pull methods.
- An increase in in-process stocks and longer material throughput times in the case of the push–schedule method;
- Shorter material flow times and lower inter-operational stocks in the case of the supermarket- and mixed-pull methods.
4. Discussion
5. Conclusions
Funding
Institutional Review Board Statement
Informed Consent Statement
Data Availability Statement
Conflicts of Interest
References
- Thürer, M.; Fernandes, N.O.; Lödding, H.; Stevenson, M. Material Flow Control in Make-to-Stock Production Systems: An Assessment of Order Generation, Order Release and Production Authorization by Simulation; Flexible Services and Manufacturing Journal; Springer: Berlin/Heidelberg, Germany, 2024; Volume 37. [Google Scholar]
- Gómez Paredes, F.J.; Godinho Filho, M.; Thürer, M.; Jabbour, C.J.C. Factors for choosing production control systems in make-to-order shops: A systematic literature review. J. Intell. Manuf. 2022, 33, 639–674. [Google Scholar] [CrossRef]
- Karaman, A.; Altiok, T. Approximate analysis and optimization of batch ordering policies in capacitated supply chains. Eur. J. Oper. Res. 2009, 193, 222–237. [Google Scholar] [CrossRef]
- Nayera, E.; Said, E.; Ashraf, E.-D. Implementing Performance-Based Analysis in Supply Chain Management: Review and Extension Proceedings; Annual Conference—Canadian Society for Civil Engineering: Vancouver, BC, Canada, 2017. [Google Scholar]
- Theuer, H.; Pahl, M. Market survey: Material flow control systems. Product. Manag. 2015, 20, 36–45. [Google Scholar]
- Peng, Y.; Guan, Z.; Ma, L.; Li, P. A mathematical programming method for flow path design in high-mix and low-volume flow manufacturing. In Proceedings of the 2008 IEEE In-Ternational Conference on Industrial Engineering and Engineering Management, Macao, China, 8–11 December 2008. [Google Scholar]
- Pekarcikova, M.; Trebuna, P.; Kliment, M.; Dic, M. Solution of Bottlenecks in the Logistics Flow by Applying the Kanban Module in the Tecnomatix Plant Simulation Software. Sustainability 2021, 13, 7989. [Google Scholar] [CrossRef]
- Kumar, A.; Kumar, N.; Mondal, S.; Biswas, T. A Survey-Based Study to Understand Various Aspects of Kanban; Lecture Notes in Networks and Systems; Springer: Singapore, 2022; Volume 461. [Google Scholar]
- Schweizer, T. Comparing cone-partitioned plate and cone-standard plate shear rheometry of a polystyrene melt. J. Rheol. 2003, 47, 1071–1085. [Google Scholar] [CrossRef]
- Rusli, M.H.M.; Jaffar, A.; Muhamud-Kayat, S.; Ali, M.T. Selection criterion of production methods used in the kanban pull system at Malaysian auto suppliers. In Proceedings of the IEOM 2015—5th International Conference on Industrial Engineering and Operations Management, Proceeding, Dubai, United Arab Emirates, 3–5 March 2015. [Google Scholar]
- Thürer, M.; Fernandes, N.O.; Stevenson, M.; Li, C.D. Centralised vs. decentralised control decision in card-based control systems: Comparing kanban systems and COBACABANA. Int. J. Prod. Res. 2019, 57, 322–337. [Google Scholar] [CrossRef]
- Tošanović, N.; Štefanić, N. Evaluation of Pull Production Control Mechanisms by Simulation. Processes 2022, 10, 5. [Google Scholar] [CrossRef]
- Mitsuyuki, K.; Kojima, F.; Douba, H.; Arai, E. Operation Method for Multi-Types and Multi-Stages Kanban System Using Discrete Event Simulation Nippon Kikai Gakkai Ronbunshu; C Hen/Transactions of the Japan Society of Mechanical Engineers: Shinjuku, Japan, 2004; Part C. [Google Scholar]
- Grieco, A.; Caricato, P.; Margiotta, P. Beyond Kanban: POLCA-Constrained Scheduling for Job Shops. Algorithms 2025, 18, 340. [Google Scholar] [CrossRef]
- Guo, Y.-H.; Qian, X.-S. Jisuanji Jicheng Zhizao Xitong. Integrated production planning and control system based on drum-buffer-rope theory. Comput. Integr. Manuf. Syst. C. 2006, 12, 252–256. [Google Scholar]
- Krom, P.; Ahmad, R.; Mustafa, S.A.; Sin, T.C. Implementation of Kanban-Based Fifo System to Minimize Lead Time at Automated Optical Inspection Operation—A Case Study in Semiconductor Industry; Lecture Notes in Mechanical Engineering; Springer: Singapore, 2021; pp. 97–108. [Google Scholar]
- Wiesse, D.; Roser, C. Supermarkets vs. FIFO lanes: A comparison of work-in-process inventories and delivery performance. In IFIP Advances in Information and Communication Technology; Springer: Cham, Switzerland, 2016; pp. 651–658. [Google Scholar]
- Lin, Y.-H.; Shie, J.-R.; Lee, C.-E. A WIP-based dispatching rule for photolithography area in wafer fabrication factories. In Proceedings of the 36th International Conference on Computers and Industrial Engineering, ICC and IE 2006, Orlando, FL, USA, 20–23 June 2006; Scopus: Jerusalem, Israel, 2006. [Google Scholar]
- Yang, K.K. Managing a flow line with single-kanban, dual-kanban or conwip. Prod. Oper. Manag. 2000, 9, 349–366. [Google Scholar] [CrossRef]
- Seiringer, W.; Bokor, B.; Altendorfer, K. Evaluating Production Planning and Control Systems in Different Environments: A Comparative Simulation Study. In Proceedings of the Winter Simulation Conference (WSC), Orlando, FL, USA, 15–18 December 2024. [Google Scholar]
- Sirikrai, V.; Yenradee, P. Modified drum-buffer-rope scheduling mechanism for a non-identical parallel machine flow shop with processing-time variation. Int. J. Prod. Res. 2006, 44, 3509–3531. [Google Scholar] [CrossRef]
- Guo, Y.-H.; Qian, X.-S. Jisuanji Jicheng Zhizao Xitong/Shop floor control in wafer fabrication based on drum-buffer-rope theory. Comput. Integr. Manuf. Syst. C. 2006, 12, 111–116. [Google Scholar]
- Liu, X.; Shen, L.; Zhang, K. Estimating the Probability Distribution of Construction Project Completion Times Based on Drum-Buffer-Rope Theory. Appl. Sci. 2021, 11, 7150. [Google Scholar] [CrossRef]
- Yue, L.; Xu, G.; Mumtaz, J.; Chen, Y.; Zou, T. Order Releasing and Scheduling for a Multi-Item MTO Industry: An Efficient Heuristic Based on Drum Buffer Rope. Appl. Sci. 2022, 12, 1925. [Google Scholar] [CrossRef]
- Bokor, B.; Seiringer, W.; Altendorfer, K. Integrating Simulation Budget Management into Drum-Buffer-Rope: A Study on Parametrization and Reducing Computational Effort; Lecture Notes in Computer Science (including subseries Lecture Notes in Artificial Intelligence and Lecture Notes in Bioinformatics); Springer: Cham, Switzerland, 2025. [Google Scholar]
- Rabbani, M.; Tanhaie, F. A Markov chain analysis of the effectiveness of drum-buffer-rope material flow management in job shop environment. Int. J. Ind. Eng. Comput. 2015, 6, 457–468. [Google Scholar] [CrossRef]
- Georgiadis, P.; Politou, A. Dynamic Drum-Buffer-Rope approach for production planning and control in capacitated flow-shop manufacturing systems. Comput. Ind. Eng. 2013, 65, 689–703. [Google Scholar] [CrossRef]
- Ma, L.-L.; Chen, J. Modeling and simulating of time buffer control for engine remanufacturing system. In Proceedings of the 2009 International Conference on Information Engineering and Computer Science, ICIECS 2009, Wuhan, China, 19–20 December 2009. [Google Scholar]
- Khalil, R.A.; Stockton, D.J.; Fresco, J.A. Managing the effects of variability in drum-buffer-rope systems. Int. J. Ind. Syst. Eng. 2008, 3, 53–69. [Google Scholar] [CrossRef]
- Koh, S.-G.; Bulfin, R.L. Comparison of DBR with CONWIP in an unbalanced production line with three stations. Int. J. Prod. Res. 2004, 42, 391–404. [Google Scholar] [CrossRef]
- Watson, K.J.; Patti, A. A comparison of JIT and TOC buffering philosophies on system performance with unplanned machine downtime. Int. J. Prod. Res. 2008, 46, 1869–1885. [Google Scholar] [CrossRef]




| Production Flow Control Method | Indicator | Product Family | ||||
|---|---|---|---|---|---|---|
| Water Meter Bodies | Gas Cylinder Valves | Couplings I | Couplings II | Couplings III | ||
| push–schedule | Stock [pcs.] | 267,970 | 217,195 | 57 | 154 | 274 |
| Lead time [days] | 35.7 | 32 | 9.2 | 18.4 | 21.3 | |
| pull, supermarket-type | Stock [pcs.] | 144,290 | 98,620 | 105 | 195 | 315 |
| Lead time [days] | 22.1 | 16.5 | 15.6 | 23.2 | 25.6 | |
| sequential pull | Stock [pcs.] | 184,900 | 138,800 | 89 | 132 | 252 |
| Lead time [days] | 26.4 | 19.7 | 10.9 | 13.1 | 15.7 | |
| mixed pull | Stock [pcs.] | 120,630 | 84,960 | 96 | 176 | 290 |
| Lead time [days] | 21.6 | 15.4 | 12.7 | 21.8 | 27.9 | |
| drum-buffer-rope | Stock [pcs.] | 165,720 | 110,700 | 72 | 119 | 221 |
| Lead time [days] | 24.6 | 18.2 | 7.4 | 16.9 | 18.5 | |
| Product Family | ||||||
|---|---|---|---|---|---|---|
| Couplings I | Couplings II | Couplings III | Gas Cylinder Valves | Water Meter Bodies | ||
| Number of components [pcs.] | Average | 4 | 4 | 6 | 2 | 1 |
| Range | 4 | 1 | 2 | 0 | 0 | |
| Shared workstations | Number workstations | 3 | 3 | 4 | 1 | 0 |
| Unit time of technological operations [s] | Average | 386 | 1885 | 2814 | 12 | 8 |
| Range | 930 | 5670 | 10,400 | 58 | 22 | |
| Total (technological time) | 5017 | 33,930 | 67,540 | 137 | 65 | |
| Number of technological operations | 13 | 20 | 24 | 13 | 8 | |
| Average daily requirement [pcs.] | 1 | 10 | 120 | 4000 | 7500 | |
| Average order frequency [days] | 10 | 15 | 28 | 60 | 65 | |
| Indicators | Push–Schedule | Pull, Supermarket-Type | Sequential Pull | Mixed Pull | Drum-Buffer-Rope | |
|---|---|---|---|---|---|---|
| Number of components [pcs.] | Average | ⎯ | ↓ | ↑ | ↓ | ↑ |
| Range | ↑ | ↓ | ⎯ | ↓ | ↑ | |
| Shared workstations | ⎯ | ↓ | ↑ | ↓ | ↑ | |
| Unit time of technological operations [s] | Average | ⎯ | ↓ | ↑ | ↓ | ↑ |
| Range | ⎯ | ↓ | ↑ | ↓ | ↑ | |
| Total (technological time) | ⎯ | ↓ | ↑ | ↓ | ↑ | |
| Number of technological operations | ⎯ | ↓ | ↑ | ↓ | ↑ | |
| Average daily requirement [pcs.] | ↓ | ↑ | ↓ | ↑ | ↓ | |
| Average order frequency [days] | ↓ | ↑ | ↓ | ↑ | ↓ | |
Disclaimer/Publisher’s Note: The statements, opinions and data contained in all publications are solely those of the individual author(s) and contributor(s) and not of MDPI and/or the editor(s). MDPI and/or the editor(s) disclaim responsibility for any injury to people or property resulting from any ideas, methods, instructions or products referred to in the content. |
© 2025 by the author. Licensee MDPI, Basel, Switzerland. This article is an open access article distributed under the terms and conditions of the Creative Commons Attribution (CC BY) license (https://creativecommons.org/licenses/by/4.0/).
Share and Cite
Żywicki, K. Analysis of the Relationship Between Production Process Determinants and Production Flow Control Methods. Appl. Sci. 2025, 15, 10300. https://doi.org/10.3390/app151810300
Żywicki K. Analysis of the Relationship Between Production Process Determinants and Production Flow Control Methods. Applied Sciences. 2025; 15(18):10300. https://doi.org/10.3390/app151810300
Chicago/Turabian StyleŻywicki, Krzysztof. 2025. "Analysis of the Relationship Between Production Process Determinants and Production Flow Control Methods" Applied Sciences 15, no. 18: 10300. https://doi.org/10.3390/app151810300
APA StyleŻywicki, K. (2025). Analysis of the Relationship Between Production Process Determinants and Production Flow Control Methods. Applied Sciences, 15(18), 10300. https://doi.org/10.3390/app151810300


