Article

Investigation on Similitude Materials with Controlled Strength and Permeability for Physical Model Tests

1
Jiangxi Communications Investment Maintenance Technology Group Co., Ltd., Nanchang 330200, China
2
Capital Construction Department, East China Jiaotong University, Nanchang 330013, China
3
State Key Laboratory of Safety and Resilience of Civil Engineering in Mountain Area, East China Jiaotong University, Nanchang 330013, China
*
Author to whom correspondence should be addressed.
Appl. Sci. 2025, 15(18), 10278; https://doi.org/10.3390/app151810278
Submission received: 26 August 2025 / Revised: 19 September 2025 / Accepted: 19 September 2025 / Published: 22 September 2025

Abstract

To meet the demand for simulative materials exhibiting suitable hydraulic characteristics in geomechanical model tests, this research developed a type of simulative material using iron powder, quartz sand, and barite powder as aggregates, white cement as binder, and silicone oil as additive. An orthogonal experimental design L16(44) was employed to prepare 16 distinct mix proportions. Advanced statistical methods, including range analysis, residual analysis, Pearson correlation analysis, and multiple regression performed with SPSS 27.0.1, were applied to analyze the influence of four factors—aggregate-to-cement ratio (A), water–cement ratio (B), silicone oil content (C), and moisture content (D)—on physical and mechanical parameters such as density, uniaxial compressive strength, elastic modulus, angle of internal friction, and permeability coefficient. Range analysis results indicate that the aggregate-to-cement ratio serves as the primary controlling factor for density and elastic modulus; moisture content exerts the most significant effect on compressive strength and permeability; while the water–cement ratio is the dominant factor influencing the internal friction angle. Empirical formulas were established through multiple regression to quantitatively correlate mix proportions with material properties. The resulting similitude materials cover a wide range of mechanical and hydraulic parameters, satisfying the requirements of large-scale physical modeling with high similitude ratios. The proposed equations allow efficient inverse design of mixture ratios based on target properties, thereby supporting the rapid preparation of simulative materials for advanced model testing.

1. Introduction

The complex interaction between geological conditions and engineering loads in geotechnical engineering gives rise to numerous critical scientific problems demanding resolution. Challenges range from early warning of rockbursts in deep resource exploitation and understanding the instability mechanisms of large-scale slopes, to predicting ground deformation induced by underground construction. The inherent complexity and high risks associated with these practical projects impose significant demands on theoretical analysis and numerical simulation [1,2,3,4]. Physical similarity model testing serves as a crucial bridge between theoretical deduction and engineering practice. Its advantages—including strong repeatability, intuitive visualization of phenomena, and the ability to accurately capture the meso-scale evolution of rock and soil masses under multi-field coupling—make it an essential tool for revealing the mechanisms behind geotechnical hazards and optimizing engineering designs [5,6,7].
Selecting appropriate raw materials and determining their optimal mix ratios are fundamental prerequisites for the successful execution of similarity simulation experiments [8,9,10,11]. In recent years, various similarity materials have been extensively applied in model testing [12,13,14]. For instance, Diao et al. [15] utilized fine sand as aggregate and cement as the binder, developing a similarity material exhibiting swelling rock properties through a two-stage ratio testing process. Subsequently, Fu et al. [16] identified an optimal mix ratio meeting practical engineering requirements based on orthogonal experimental design. Building on this, Yang et al. [17] employed range analysis to investigate the influence of various factors on mechanical properties. Using quartz sand, ordinary Portland cement, and water to prepare conglomerate-like materials, they observed a certain degree of dispersion in the physical and mechanical indices of the same material type under different mix ratios. Tang et al. [18] conducted low-temperature oxidation experiments on ordinary coal samples and bamboo charcoal, proposing bamboo charcoal as a substitute material for similarity simulations. They found that bamboo charcoal exhibits rapid heating and oxidation characteristics similar to those of coal. Wen et al. [19] developed a mudstone-like similarity material using an orthogonal experimental design. Range analysis indicated that the aggregate content plays a major role in determining the mechanical properties, and the aggregate-to-binder ratio primarily controls the density, compressive strength, and elastic modulus. Chao X [20] developed a water-sensitive rock-like material by incorporating bentonite into a mixture of cement, gypsum, quartz sand, and barite powder to simulate the degradation mechanism of rock slopes under water–rock interactions. Shi et al. [21] developed a new hydro-coupled geological similarity material using cement, water glass, rosin, quartz sand, barite powder, and glycerol, considering hydraulic degradation and dynamic coupling. Other studies have also determined optimal mix ratios of raw materials for similarity materials used in model tests [22,23,24].
It is noteworthy that deep strata often contain groundwater, which can readily trigger geological disasters such as water and mud inrushes, landslides, and piping [25,26,27]. Consequently, in-depth research into the mechanical behavior of rock masses under groundwater influence and the distribution characteristics and evolution of their hydraulic properties (e.g., permeability) is paramount [28,29,30]. Currently, Li et al. [31] employed a hydro-mechanical coupling similarity material composed of sand, barite powder, talc powder, cement, vaseline, silicone oil, and an appropriate amount of mixing water to simulate low- and medium-strength rock masses with varying permeability. Later, Song et al. [32], using orthogonal experimental design with quartz sand and barite as aggregates, explored the relationship between the properties of hydro-mechanical coupling similarity materials and their raw constituents. They found that the elastic modulus and internal friction angle of the material were most significantly affected by the ratio of binder to aggregate. Ren et al. [33] mixed iron powder, barite powder, cement, and gypsum to develop a similarity material capable of simulating the hydraulic properties of sedimentary rocks. Based on Weibull statistical damage theory, they established a damage constitutive model describing the entire triaxial compression process of rock under the combined action of rainwater infiltration and loading. Liang et al. [34] used standard sand, bentonite, cement, and water to develop a hydro-mechanical coupling similarity material simulating rock masses with small bulk density and low-to-medium strength, revealing the damage accumulation and failure evolution during rock excavation. Based on the fluid-solid coupling similarity theory of continuous media, Li et al. [35,36,37] developed a fluid-solid coupling similarity material composed of sand, barite powder, talc powder, cement, vaseline, silicone oil, and an appropriate amount of mixing water, which can simulate low- and medium-strength rock masses with different permeabilities. Zhang et al. [38]. developed a new similarity material using iron concentrate powder, barite powder, and quartz sand as aggregates based on fluid-solid coupling theory. Through orthogonal tests and engineering application, they revealed the regulatory effects of various components on the mechanical and permeability properties of the material. Wu et al. [39] developed a new coal-rock fluid-solid coupling similarity material using quartz sand, barite powder, and talc powder as aggregates. This material exhibits low strength, adjustable water absorption, and water stability, and its feasibility and applicability were verified through simulations of underground reservoirs in coal mines. Other fluid-solid coupling similarity materials have also been developed [40,41,42,43].
Despite these advancements promoting the development of physical model testing for fluid interactions, existing research primarily focuses on qualitative descriptions of the strength and permeability variations in similarity materials [44,45]. This limitation not only hinders their direct application in engineering practice but, more fundamentally, reflects a critical scientific deficit: the absence of a predictive framework for quantitatively controlling these properties. Crucially, the lack of empirical formulas that quantitatively describe the coupled mechanical and permeability characteristics of these materials constitutes the core of the scientific problem. Therefore, deeply revealing the performance evolution of similarity materials under fluid action and establishing quantitative relationships to decouple and control strength and permeability are of significant scientific and practical importance. This study aims to address this gap by developing a systematic methodology to enable the reliable design of similitude materials for guiding physical model tests and supporting engineering applications.
Based on this, to prepare similarity materials with favorable hydraulic properties suitable for fluid (water)-related experiments, this study utilizes aggregate, binder, and admixture as raw materials. Through orthogonal experiments and range analysis, we systematically investigate the sensitivity and influence of various mix ratio factors on the mechanical strength parameters and hydraulic properties of the similarity materials. Furthermore, SPSS 27.0.1 software is employed to establish empirical formulas describing the characteristics of the similarity materials based on their mix ratios. The findings of this research provide a theoretical basis for rapidly determining mix ratios that achieve target mechanical and hydraulic properties. The research methodology can be summarized in a methodological scheme (as shown in Figure 1) that clearly outlines the variable factors, sample parameters, and resulting properties of the hardened composites.

2. Selection of Similar Raw Materials and Orthogonal Experimental Design

2.1. Raw Material Selection

Similar materials are typically composed of three components: aggregates, binders, and regulators. Aggregates and binders govern the overall performance of the material, while regulators fine-tune specific parameters.
The aggregate, forming the main skeleton of the material, comprising iron powder, barite powder, and quartz sand in this experiment. The iron powder had a particle size range of 10–44 μm; the quartz sand had a particle size range of 40–80 mesh (approximately 180–380 μm); and the barite powder had a particle size range of 200–400 mesh (approximately 38–75 μm). The iron powder was chosen for its high specific gravity and hardness, which enhance density and mechanical strength; the barite powder, with its relatively fine particle size and moderate density, contributes to improved packing density and radiation shielding capacity; while the quartz sand was included due to its excellent stability and relatively high hardness, thereby promoting durability and structural integrity, as shown in Figure 2.
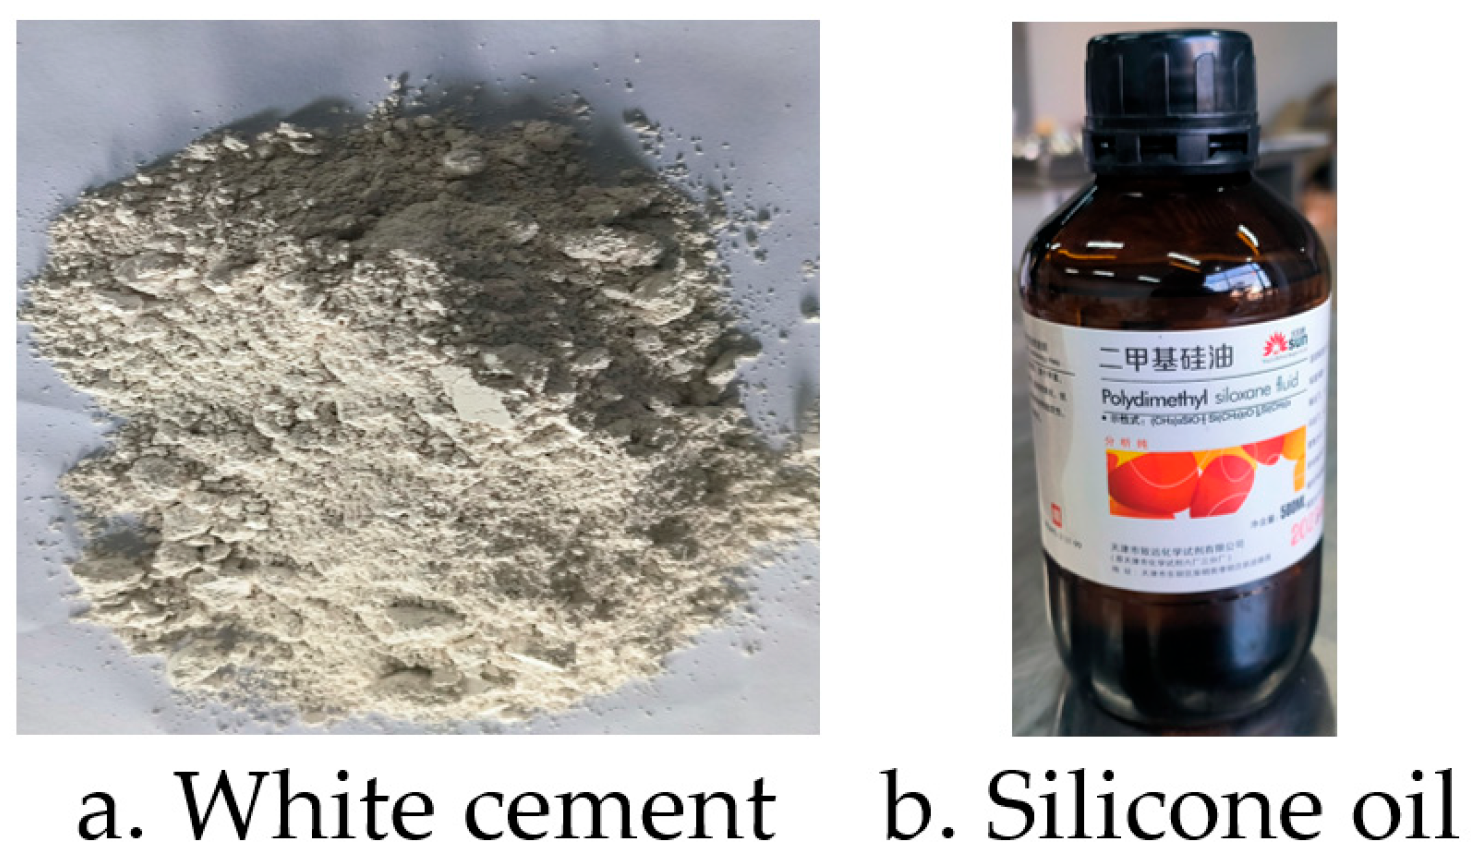
The binder serves to bond the granular materials into an integrated structure. In this study, GB 425 white cement (performance-wise similar to ASTM Type I ordinary Portland cement) was selected as the binder owing to its well-balanced properties, including tunable strength, ease of application, and reliable long-term stability. A detailed image of the cement used is presented in Figure 3a.
The regulator was used to precisely adjust the physical properties of the material to meet strength requirements. Silicone oil (with a viscosity of 1000 cSt) was chosen as the regulator in this test, primarily utilizing its functions of moisture retention and suppression of drying cracks, as shown in Figure 3b.

2.2. Orthogonal Experimental Design

Based on the material selection outlined above, this study employed quartz sand, barite powder, and iron powder as aggregates, white cement as the binder, and silicone oil as a regulator to prepare the required simulative materials using an orthogonal experimental design methodology. Four key factors were selected for analysis: Factor A is the ratio of iron powder to quartz sand to barite powder; Factor B is the water-to-cement ratio (mass ratio of water to white cement); Factor C is the silicone oil content; and Factor D is the water content. Factor A was set at four levels: 1:1:1, 2:1:1, 1:2:1, and 1:1:2. Factor B was set at four levels: 3:10, 2:5, 1:2, and 3:5. Factor C was set at four levels: 2%, 5%, 8%, and 10%. Factor D was set at four levels: 1%, 3%, 5%, and 7%. The factors and levels for the orthogonal design of the simulative materials are detailed in Table 1.
Experimental Design: To ensure that the combinations generated by the orthogonal array L16(44) effectively cover the design space, enabling us to analyze the main effects of each factor with a minimal number of experiments while avoiding physically unreasonable or invalid mixtures, a four-factor, four-level orthogonal design scheme L16(44) was selected. The material mix proportions are detailed in Table A2.

3. Specimen Fabrication and Testing Procedure

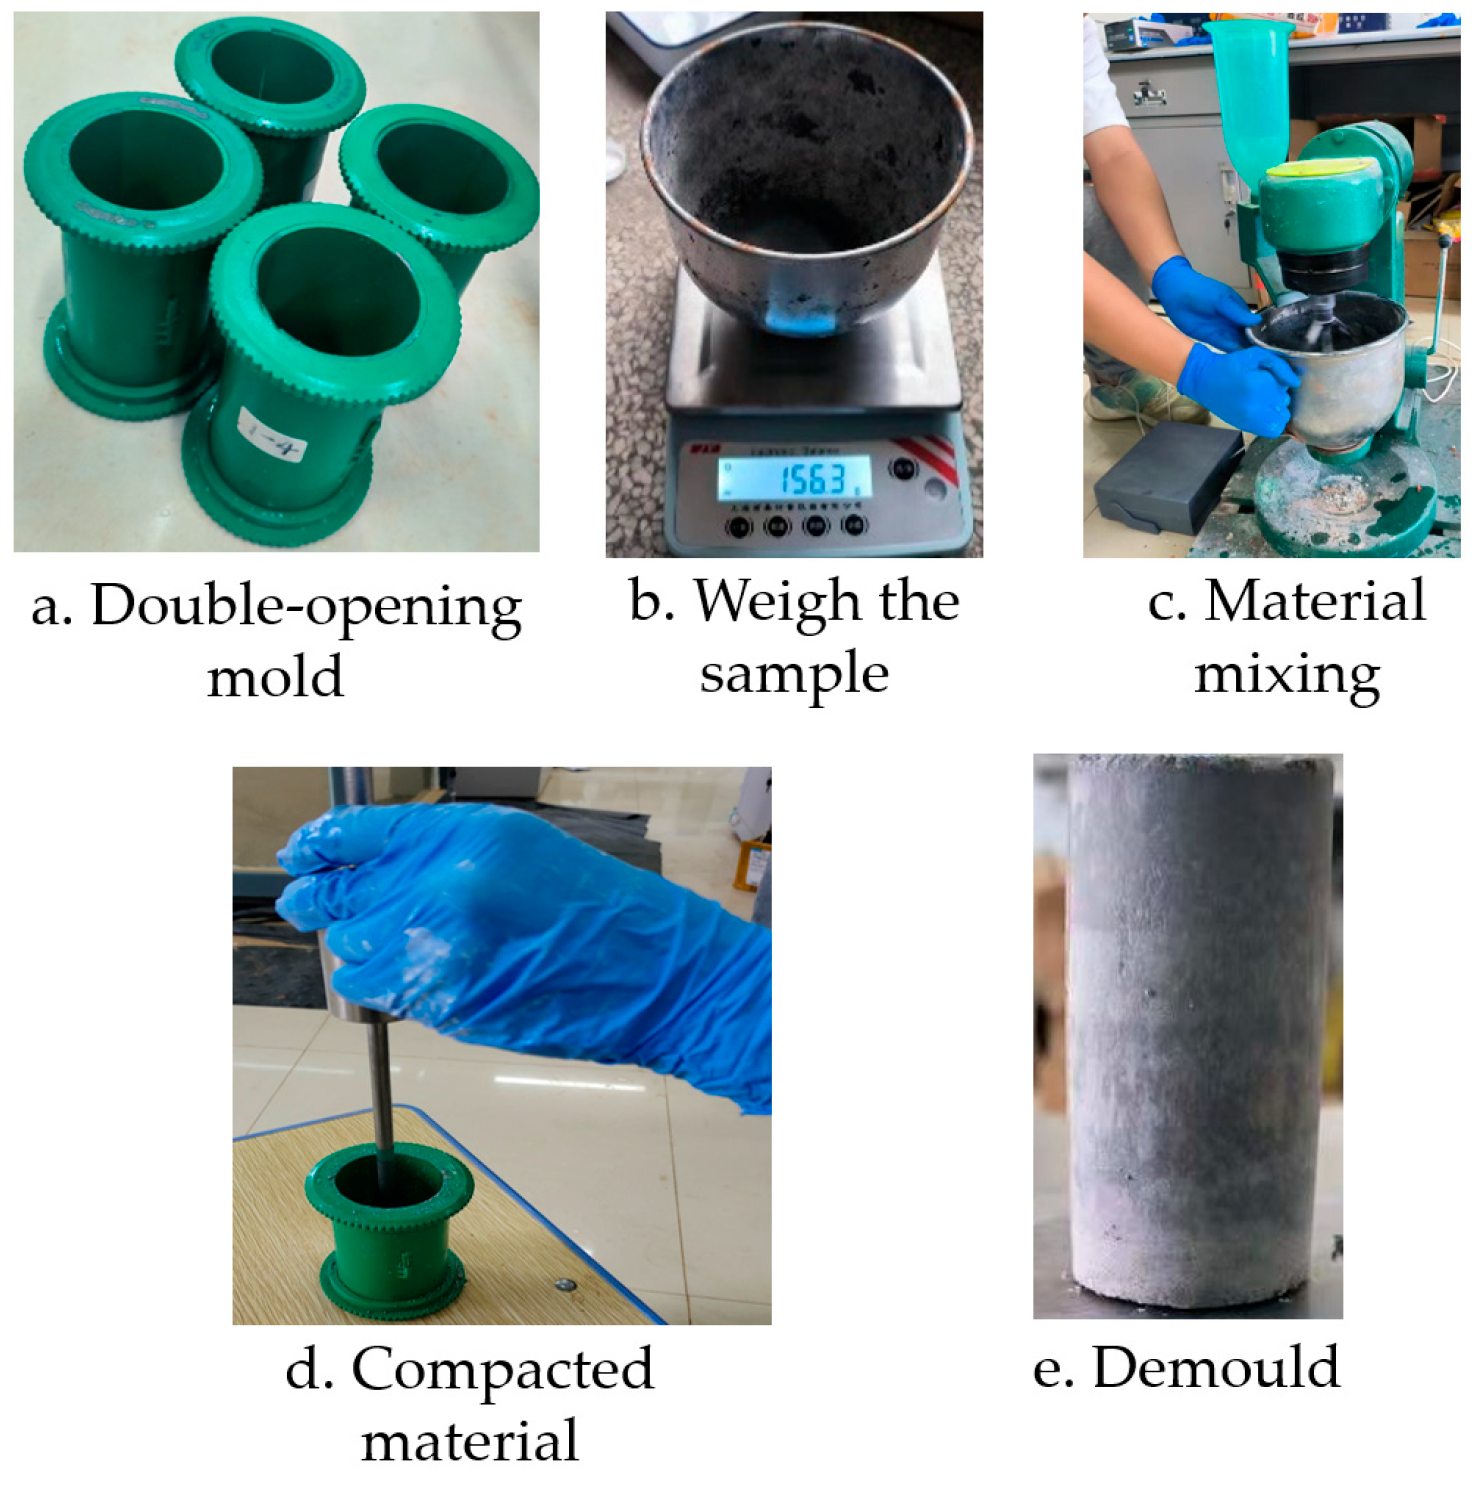
A circular steel split mold with dimensions of φ 50 mm × 100 mm was employed in the experiment. The mold features a smooth and flat interior surface, which facilitates easy demolding. The experimental procedure consisted of the following steps, as illustrated in Figure 4.
(1)
Test Preparation: Necessary tools, including a mixer, electronic balance, trowel, funnel, split mold, hammer, 500 mL beaker, and wide-mouth iron basin, were prepared. Personal protective equipment (PPE) such as gloves and masks was worn.
(2)
Raw Material Preparation: Raw materials, namely fine iron powder, quartz sand, barite powder, white cement, silicone oil, and water, were transported to the testing station.
(3)
Raw Material Mixing: Iron powder, quartz sand, and barite powder were weighed according to the specified proportions and dry-mixed until homogeneous. White cement and water were weighed, mixed into a slurry, and then poured into the aggregate mixture for thorough blending. Finally, the designated amount of silicone oil was added and mixed uniformly.
(4)
Mold Treatment: To facilitate demolding and reduce friction, the inner walls of the mold were wiped with a cloth dampened with barite powder.
(5)
Filling and Compaction: The split mold was assembled. The mixture was poured into the mold through a funnel in three separate lifts. Each lift was compacted in layers using the hammer handle.
(6)
Press Molding: The top cover of the mold was placed, and pressure was applied to densify the material.
(7)
Demolding and Marking: The mold was inverted to remove the outer frame. Subsequently, it was placed upright, and the upper edges were tapped to loosen and remove the semi-cylindrical parts, yielding the specimen. Specimens were then labeled using a marker pen.
(8)
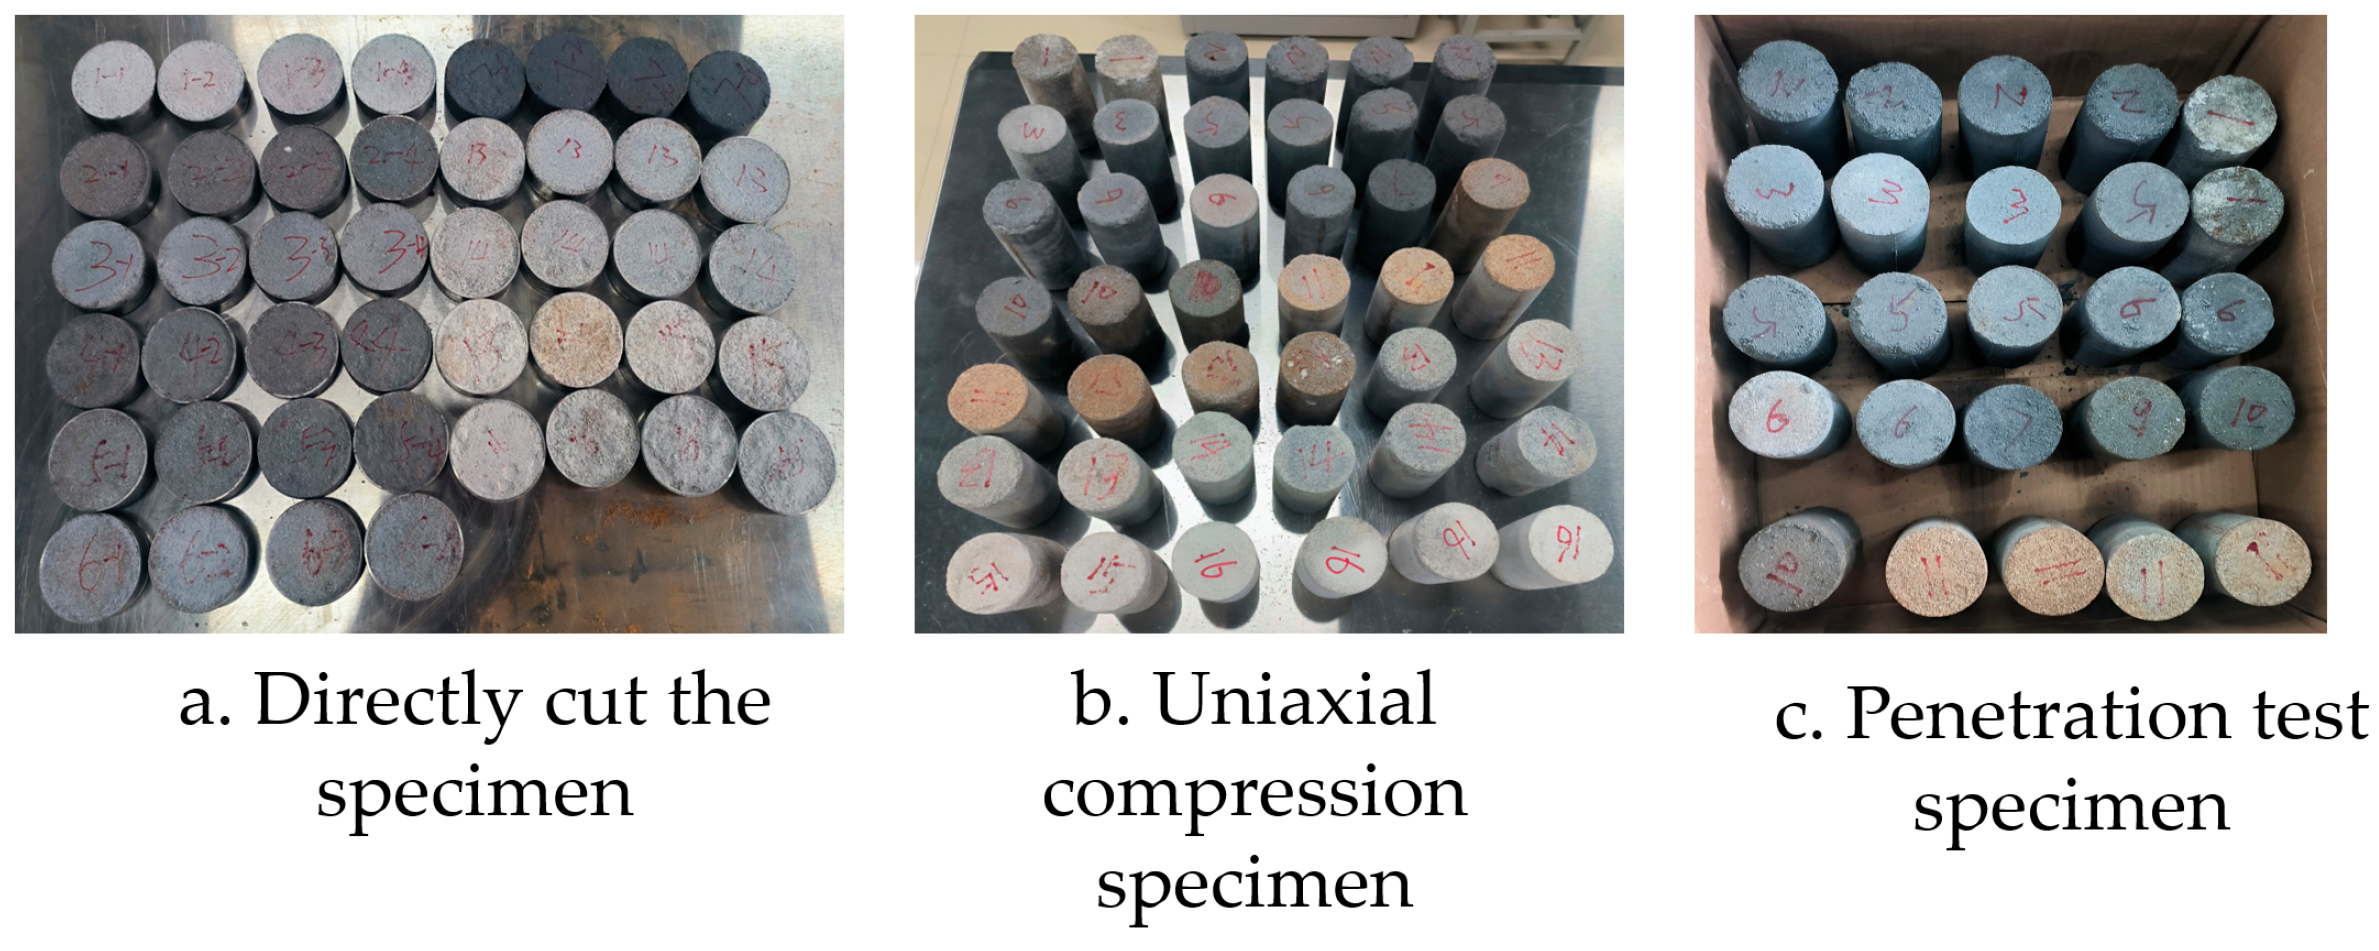
Curing: Specimens were cured at room temperature for 28 days. A total of 96 cylindrical specimens with dimensions of φ 50 mm × 100 mm and 64 disk-shaped specimens with dimensions of φ 61.8 mm × 20 mm were prepared. As shown in Figure 5.

4. Analysis of Test Results

Physical and mechanical parameters, including density, compressive strength, elastic modulus, angle of internal friction, and permeability coefficient, were determined for the 16 groups of specimens with varying mix proportions through measurements, weighing, uniaxial compression, direct shear, and permeability tests. The results are summarized in Table A3.
Analysis of the orthogonal experiment results for the simulative material mixtures reveals the following ranges for the obtained parameters: density ranged from 2.2 to 3.18 g/cm3, compressive strength from 0.07 to 7.53 MPa, elastic modulus from 6.98 to 484.51 MPa, angle of internal friction from 32.2° to 49.12°, and permeability coefficient from 1.75 × 10⁻⁶ to 140 × 10−6 m/s. Comparing these physical and mechanical parameters with those of common rocks shows that the simulative materials produced in this experiment exhibit a wide variation in mechanical properties. This range enables them to meet the requirements for the physical and mechanical characteristics of simulative materials in model tests with larger similarity ratios.

5. Sensitivity Analysis

The intuitive analysis method assesses the influence of each factor by examining its range (R). The magnitude of the range reflects the extent to which varying the levels of a factor affects the target indicator. According to orthogonal experimental theory, the mean value of the test results for each level of a factor is calculated. The range (R) for a factor is then determined by subtracting the minimum mean value from the maximum mean value across its levels. A larger range (R) value for a specific factor, when compared to those of other factors for the same output parameter, indicates that the variation caused by its different levels is more pronounced, signifying that the factor plays an important role and has a significant influence on that particular experimental outcome. The orthogonal experiment results were analyzed by calculating the mean value and range (R) for each level of the factors influencing the density, compressive strength, elastic modulus, angle of internal friction, and permeability coefficient of the simulative materials. These results are presented in Table A4.

5.1. Density

The mass (m) of each dried specimen was measured using a high-precision electronic balance. The diameter (D) and height (H) of the specimen were measured using a vernier caliper at multiple points to calculate the average volume (V). The density (ρ) was calculated using the formula: ρ = m/V.
Table A4 shows that among the various factors affecting the density of similar materials, the aggregate ratio (Factor A) has the largest range (R) of 0.49 g/cm3. The water content (Factor D), silicone oil content (Factor C), and water–cement ratio (Factor B) exhibit ranges of 0.22 g/cm3, 0.15 g/cm3, and 0.04 g/cm3, respectively, in decreasing order. This indicates that the aggregate ratio primarily controls the density of the simulated materials, while the other three factors also have significant effects. Based on the range analysis results of density, an intuitive analytical diagram was constructed to illustrate the influence of each factor on density, as shown in Figure 6. The figure reveals that the density of similar materials moderately decreases from 2.87 g/cm3 to 2.38 g/cm3 with an increase in aggregate ratio, slightly decreases from 2.71 g/cm3 to 2.52 g/cm3 with an increase in water content, and slightly increases from 2.46 g/cm3 to 2.61 g/cm3 with an increase in silicone oil content. No significant correlation was observed between density and water–cement ratio.

5.2. Compressive Strength

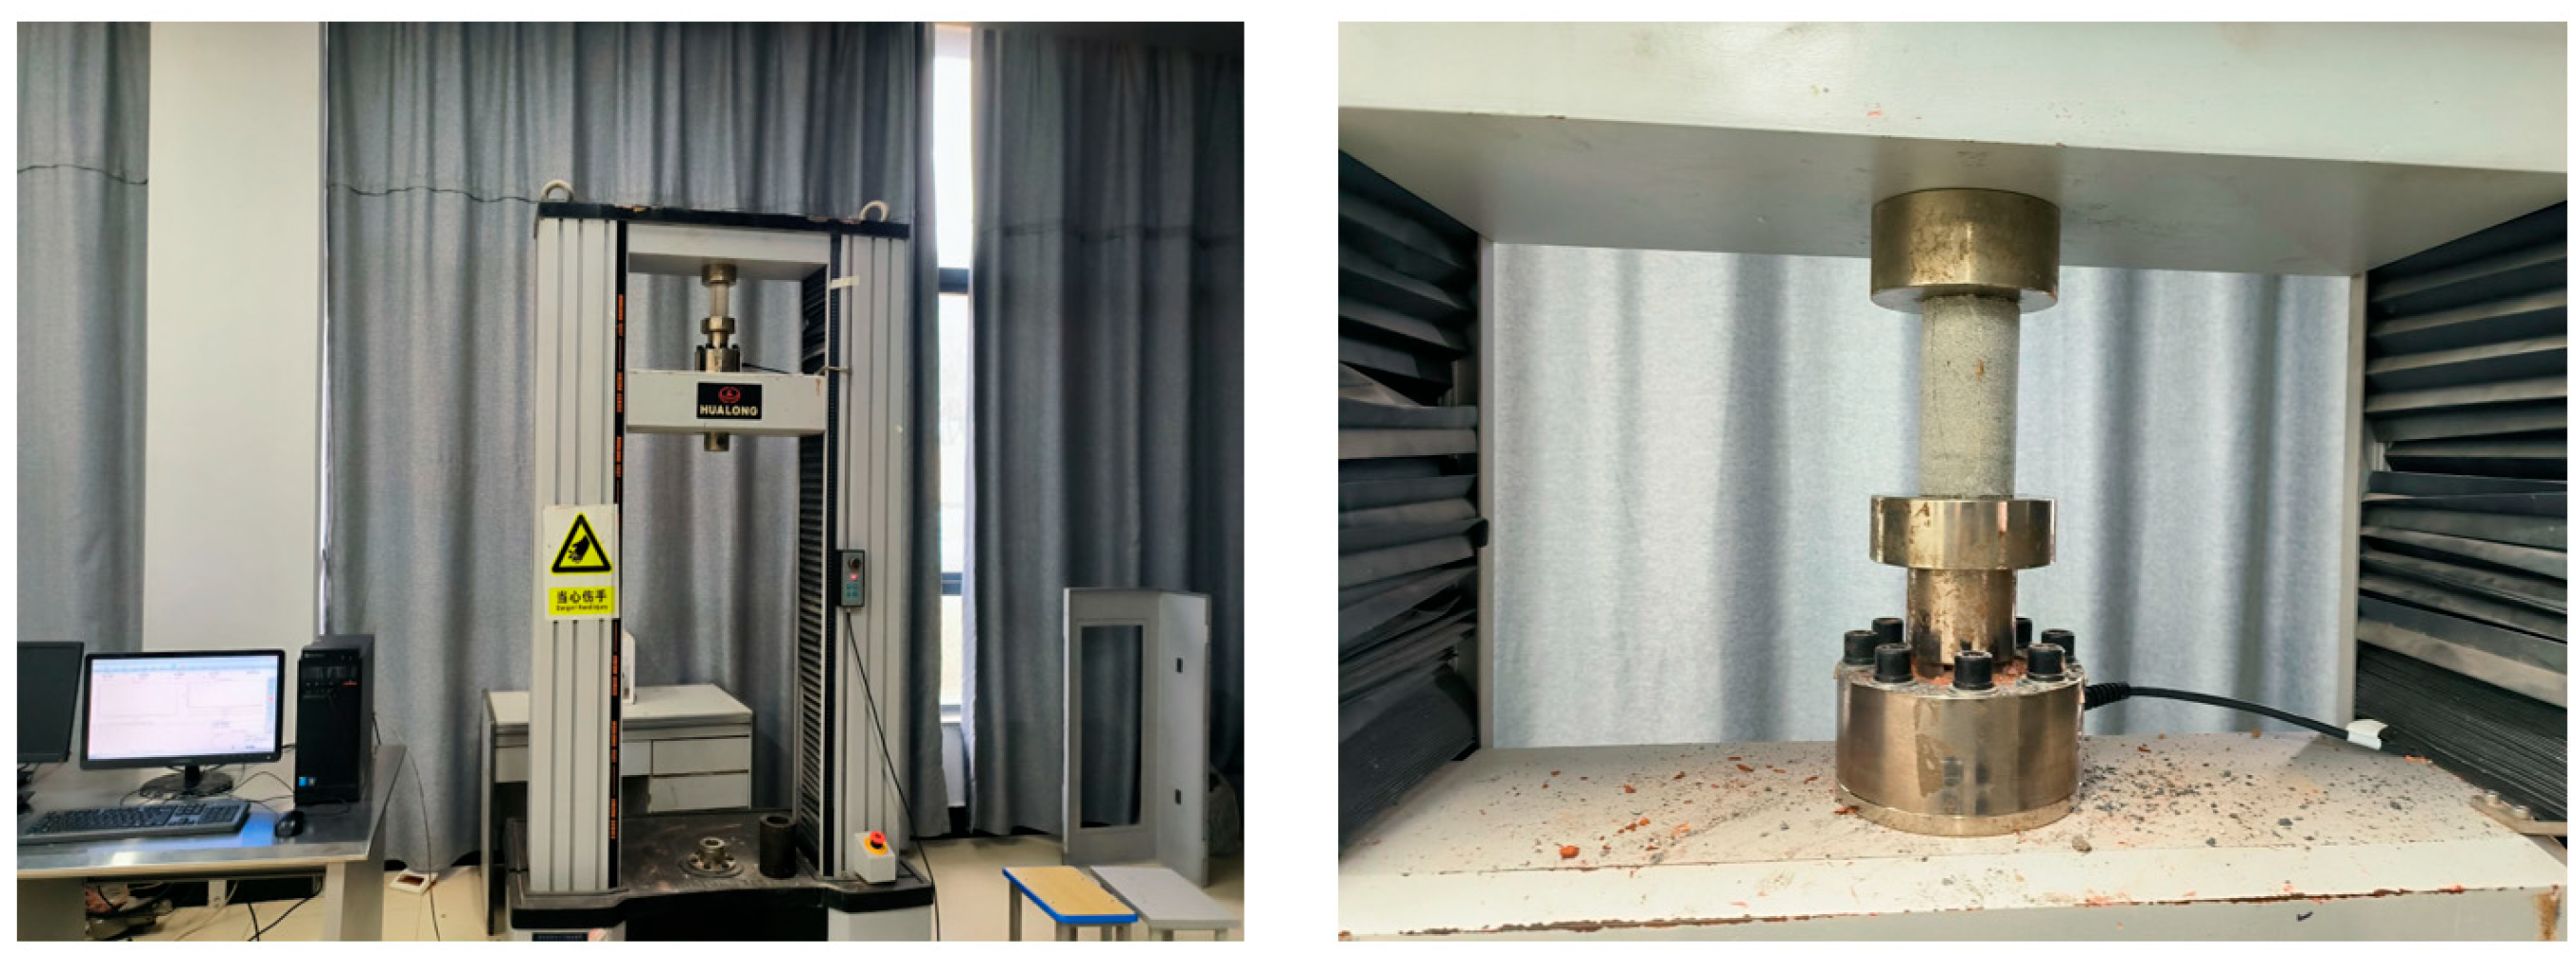
To measure the uniaxial compressive strength (UCS) and elastic modulus of the specimens. The test was conducted using a WDW-100E microcomputer-controlled electronic Universal Testing Machine (UTM) (Model: UTM-4304, Manufacturer: SUNS, Shen Zhen city, China). A cylindrical specimen (φ 50 mm × 100 mm) was placed concentrically on the lower platen of the UTM. Axial displacement-controlled loading was applied at a constant rate of 0.5 mm/min until failure occurred. The axial load and corresponding displacement were automatically recorded throughout the loading process via the built-in data acquisition system. The test setup is illustrated in Figure 7.
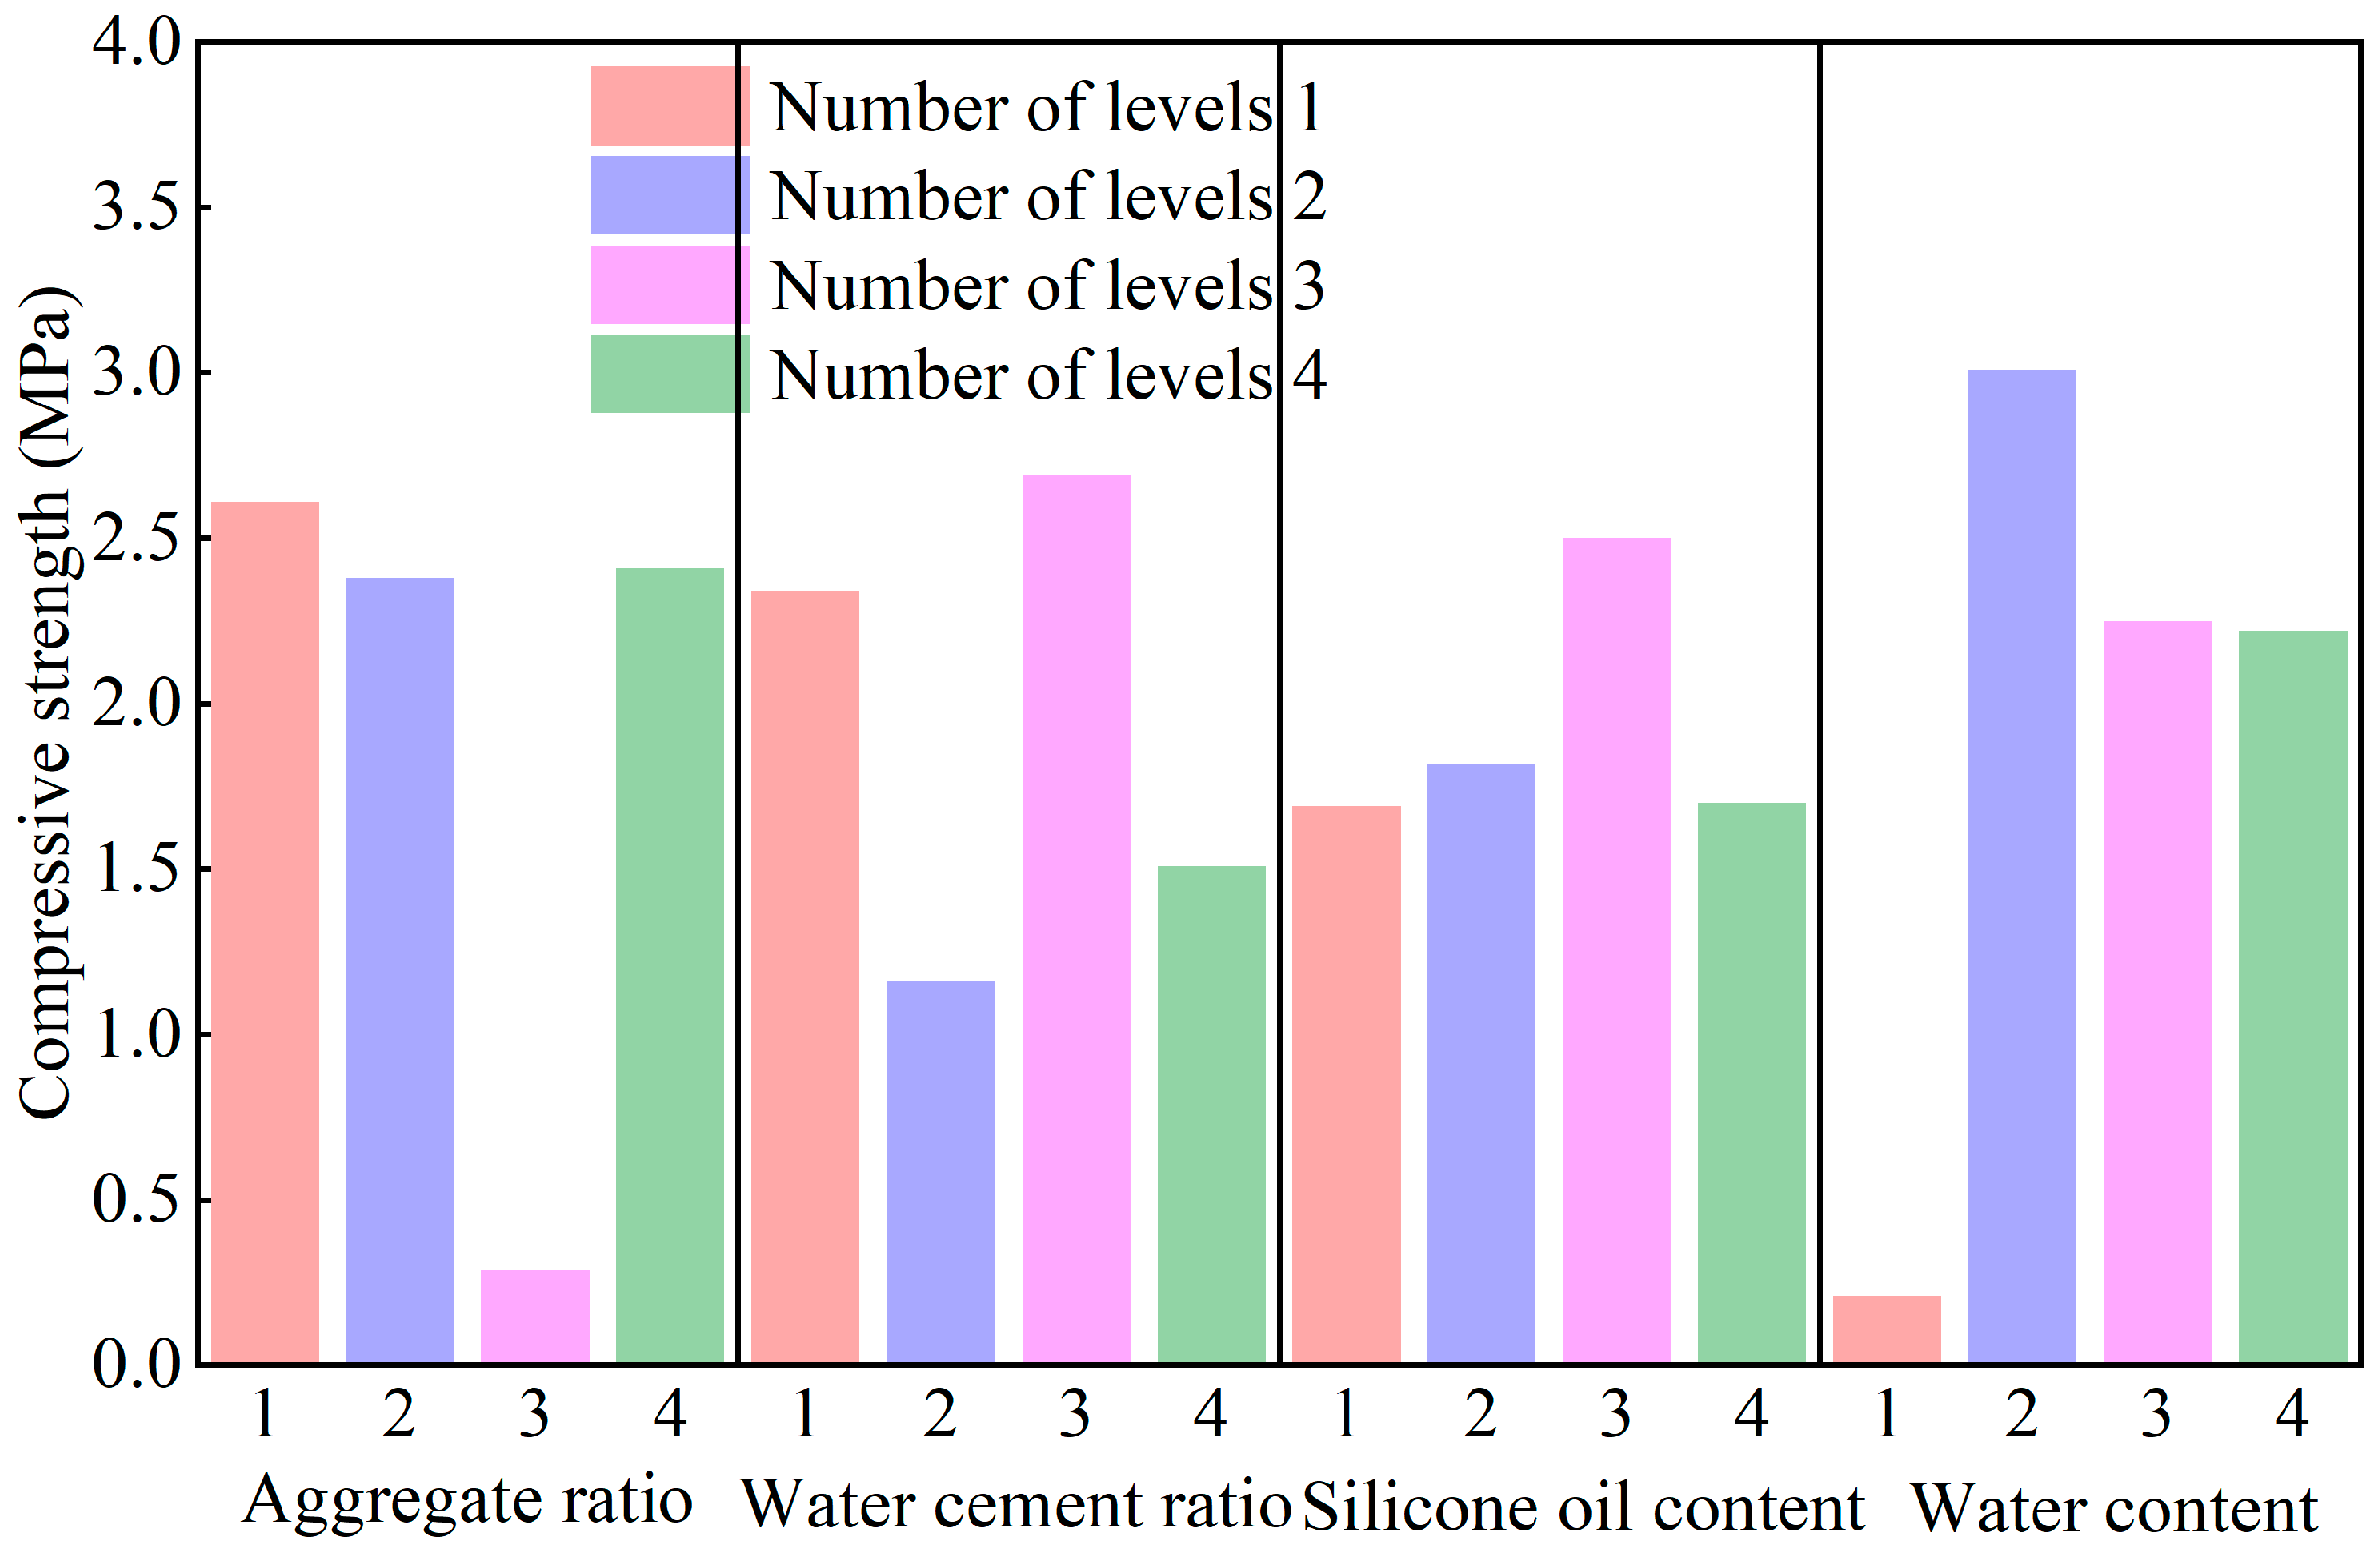
Table A4 shows that among the factors affecting the compressive strength of similar materials, the water content (Factor D) has the largest range (R) of 2.8 MPa, slightly greater than those of the aggregate ratio (Factor A) and water–cement ratio (Factor B). The silicone oil content (Factor C) has the smallest range of 0.81 MPa. This indicates that water content primarily controls the compressive strength, while the aggregate ratio and water–cement ratio also significantly affect it. The influence of silicone oil content on compressive strength is negligible. Based on the range analysis results of compressive strength, an intuitive analytical diagram was constructed to illustrate the influence of each factor, as shown in Figure 8. The figure shows that compressive strength decreases with increasing water content from 3.01 MPa to 2.22 MPa and decreases with increasing water–cement ratio from 2.34 MPa to 1.51 MPa. No significant correlation was observed between compressive strength and silicone oil content.

5.3. Elasticity Modulus

The elastic modulus was calculated from the slope of the stress–strain curve obtained with the WDW-100E UTM, as described in Section 5.2.
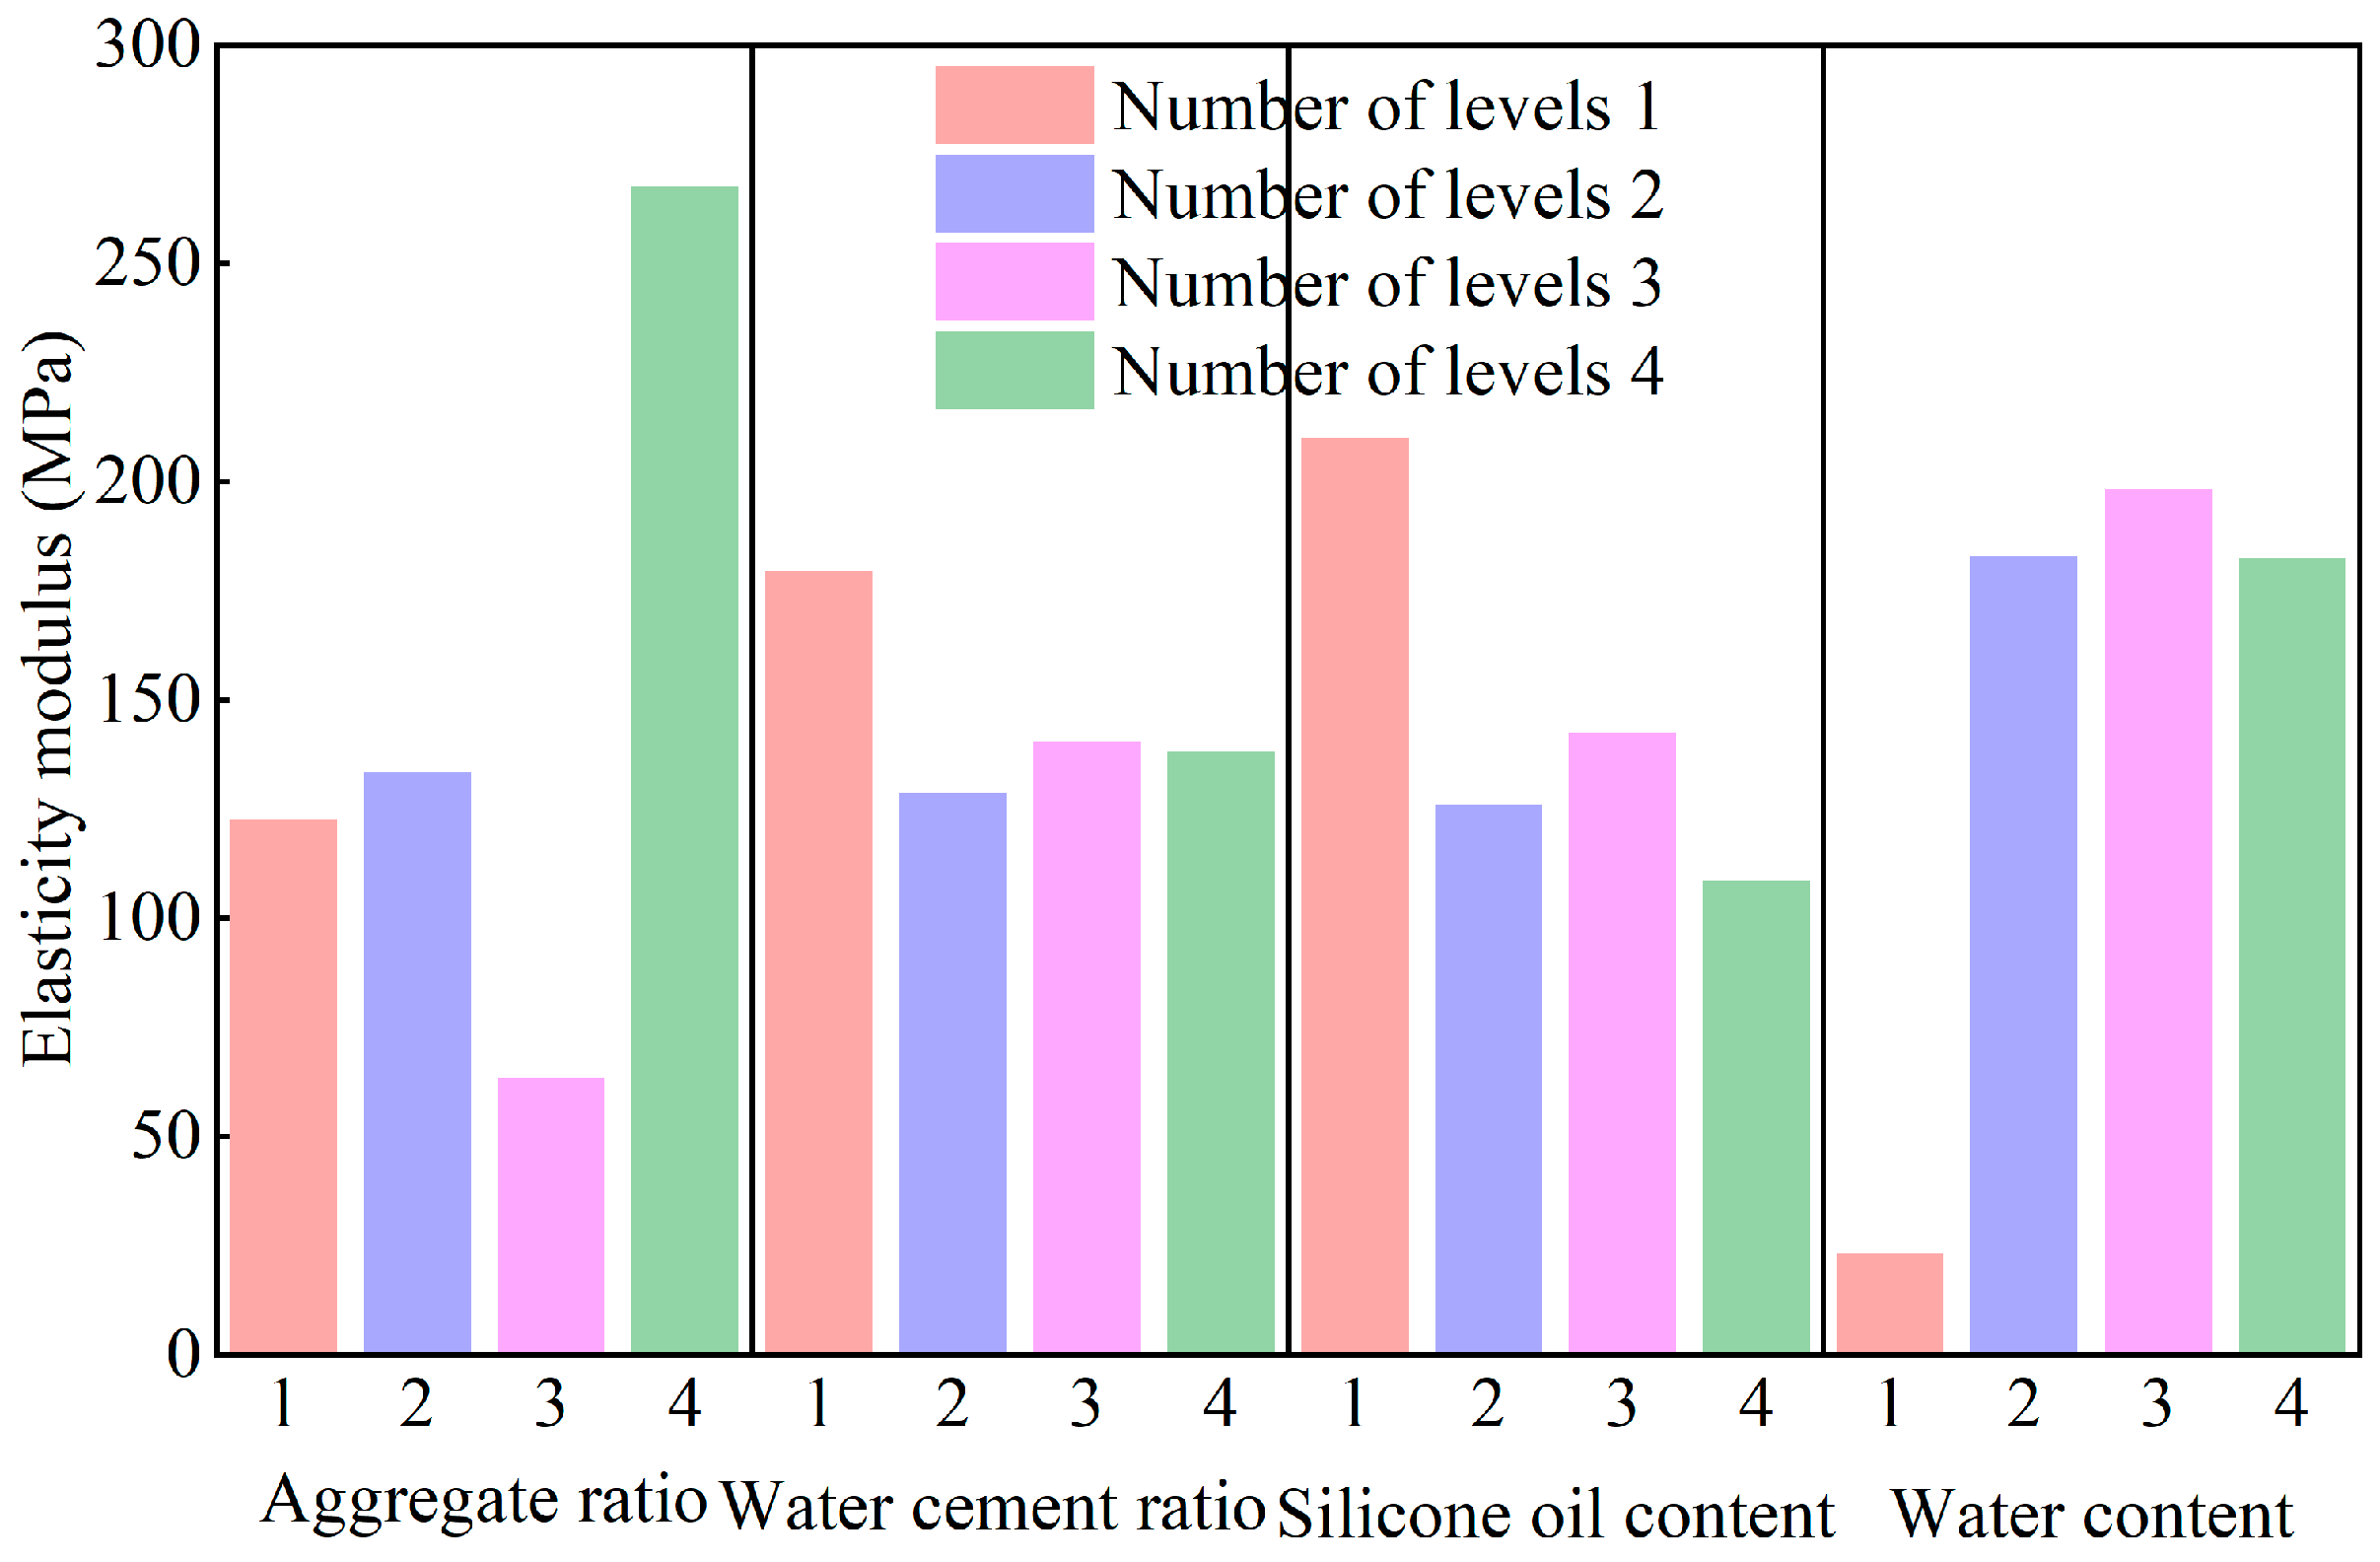
Table A4 shows that among the factors affecting the elastic modulus, the aggregate ratio (Factor A) has the largest range (R) of 204.28 MPa, greater than those of water content (Factor D) and silicone oil content (Factor C). The water–cement ratio (Factor B) has the smallest range of 50.88 MPa. This indicates that the aggregate ratio primarily controls the elastic modulus, while water content and silicone oil content also have significant effects. The influence of water–cement ratio on elastic modulus is minimal. Based on the range analysis results of elastic modulus, an intuitive analytical diagram was constructed, as shown in Figure 9. The figure reveals that the elastic modulus shows a moderate increasing trend from 122.58 MPa to 267.54 MPa with changes in aggregate ratio, an increasing trend from 23.15 MPa to 182.44 MPa with increasing water content, and a slight decreasing trend from 126.04 MPa to 108.69 MPa with increasing silicone oil content. No significant correlation was observed between elastic modulus and water–cement ratio.

5.4. Internal Friction Angle

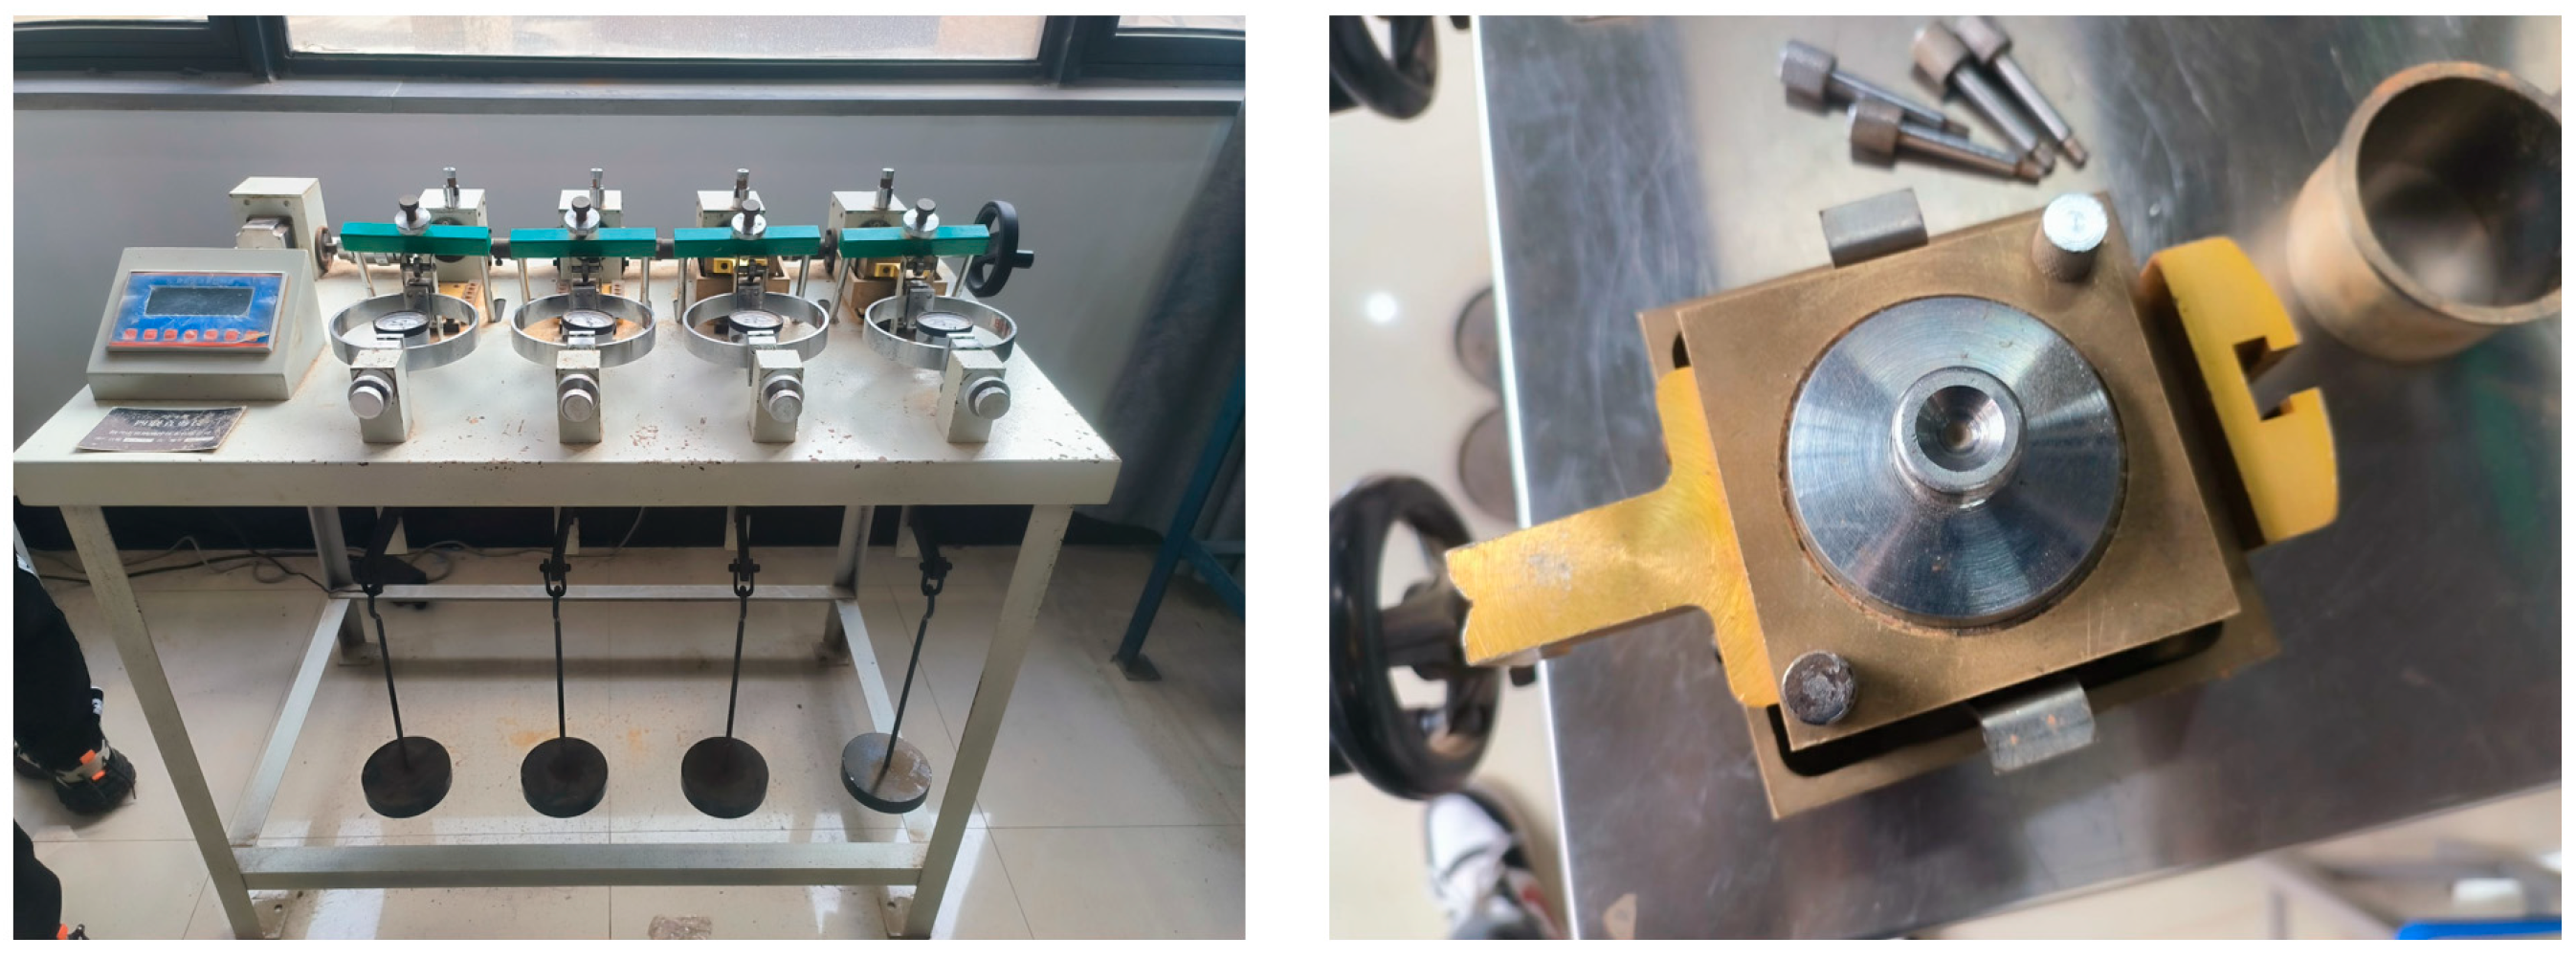
The shear strength parameters, specifically the angle of internal friction (φ), were measured using a quadruple direct shear apparatus (Model: DSA-4; Manufacturer: Geocomp Corporation, Acton, MA, USA). Disk-shaped specimens (φ 61.8 mm × 20 mm) were subjected to a constant normal stress. Shear load was then applied at a constant rate of 0.5 mm/min until failure occurred along the predetermined shear plane. The test was repeated under different normal stresses to obtain a series of shear strength values for constructing the failure envelope. The experimental setup is shown in Figure 10.
Table A4 shows that among the various factors affecting the internal friction angle, the water–cement ratio (Factor B) has the largest range (R) of 10.12°, greater than that of water content (Factor D). The aggregate ratio (Factor A) and silicone oil content (Factor C) have relatively small ranges of 3.2° and 3.26°, respectively. This indicates that the water–cement ratio primarily controls the internal friction angle, while water content also has a certain influence. Based on the range analysis results of internal friction angle, an intuitive analytical diagram was constructed, as shown in Figure 11. The figure shows that the internal friction angle increases from 35.94° to 42.46° and then decreases to 35.34° with increasing water–cement ratio, increases from 34.89° to 40.59° with increasing water content, and exhibits a moderate increasing trend with changes in aggregate ratio.

5.5. Permeability Coefficient

The permeability coefficient (k) was measured using the permeameter module of a GDS triaxial system (Model: GDSTAS-HCKSP; Manufacturer: GDS Instruments, Bath, UK). The system is equipped with a pressure/volume controller for applying confining pressure, back pressure, and monitoring water flow. Prior to testing, all specimens were fully saturated by immersion in water to eliminate air pockets and ensure accurate permeability measurements. The test configuration is presented in Figure 12.
Each specimen, wrapped in a latex membrane and internally equipped with filter paper and porous stones, was secured onto the base pedestal. The top cap and base were then sealed together. After applying the axial load, water was injected under a back pressure of 200 kPa, and a confining pressure of 1 MPa was applied. Once the confining pressure stabilized, permeability was measured under these constant stress conditions. To ensure steady-state flow conditions were achieved, all samples were pre-saturated by immersion in water prior to testing. This pre-treatment allowed the flow through the specimen to stabilize significantly before the official measurement period began. In our experimental setup, steady flow was consistently established well before the 60 s mark. The 60 s measurement window was chosen specifically to capture the flow under these stable conditions, rather than as the time required to reach steadiness. The water flow rate was recorded over a 60 s period after stabilization. The permeability coefficient (k) was calculated based on Darcy’s law: k = Q L A t × 102 p . Where Q is the volume of water collected in the cylinder after c area of the specimen; L is the length of the specimen; p is the permeability pressure (1 kPa is equivalent to a 102 mm water head); t is the duration over which water flow was measured.
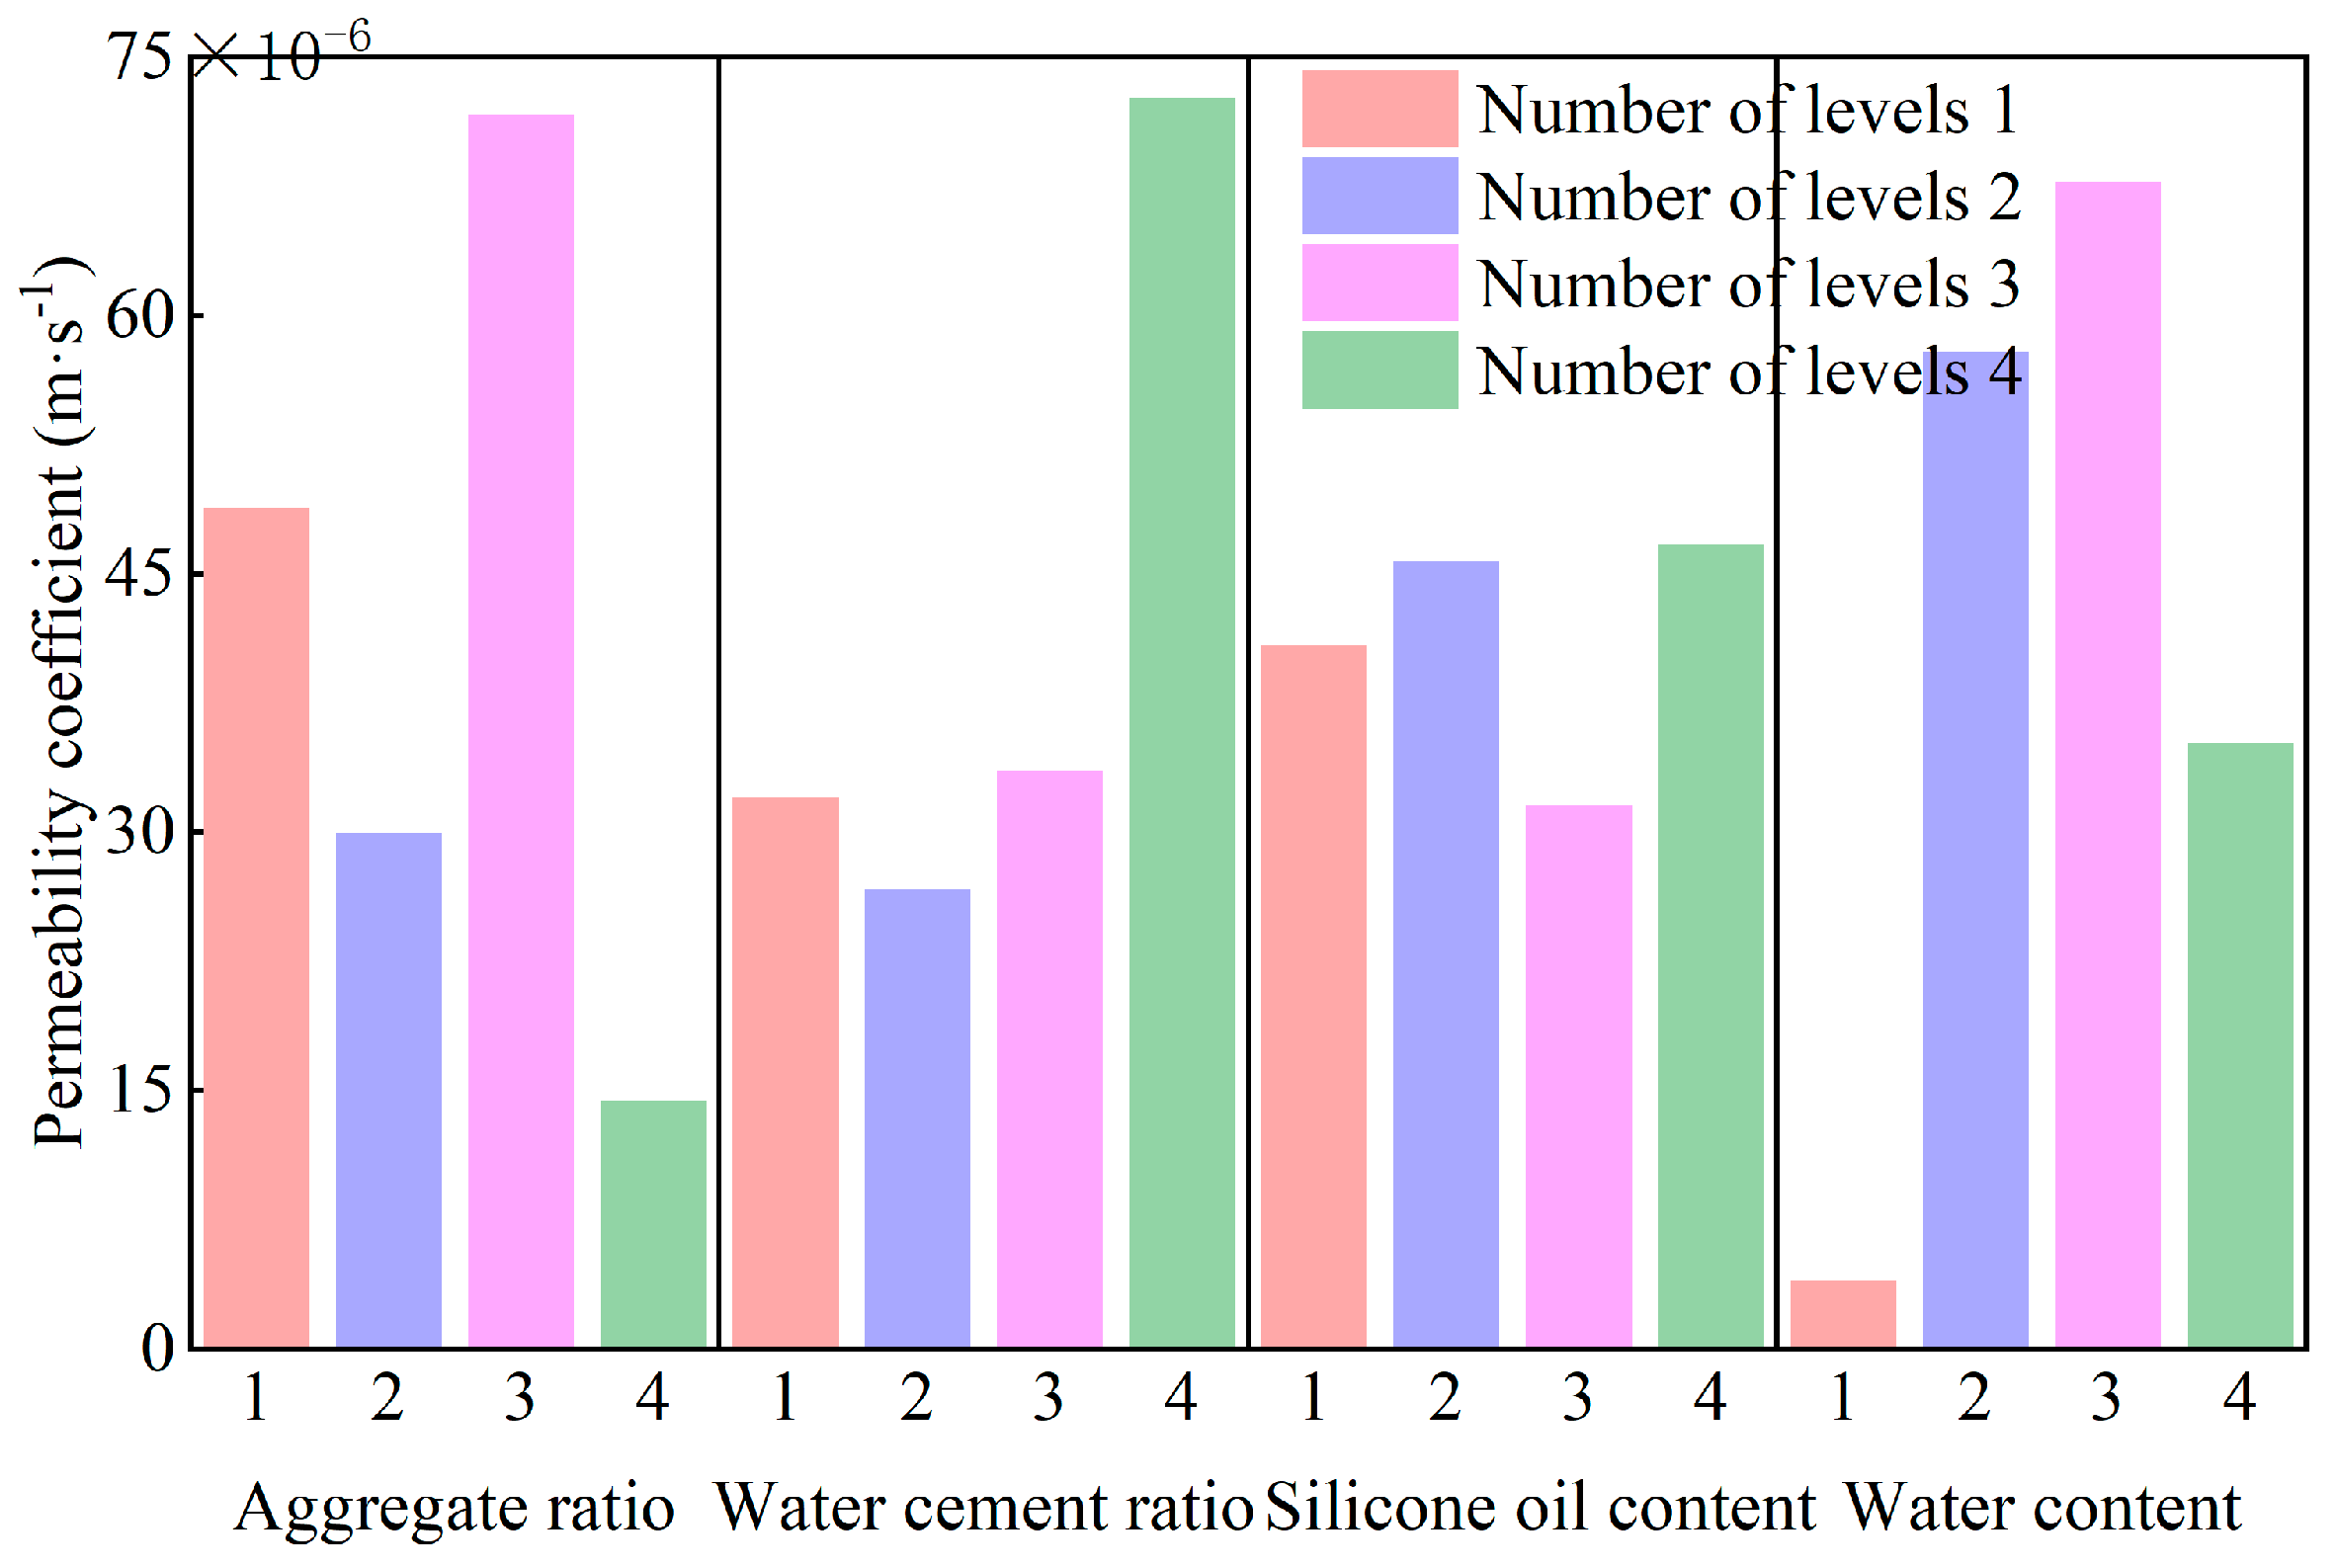
Table A4 shows that among the factors affecting the permeability coefficient of the simulated materials, the water content (Factor D) has the largest range (R) of 63.76 × 10⁻⁶ m/s, slightly greater than those of the aggregate ratio (Factor A) and water–cement ratio (Factor B). The silicone oil content (Factor C) has the smallest range of 15.12 × 10⁻⁶ m/s. This indicates that water content primarily controls the permeability coefficient, while the aggregate ratio and water–cement ratio also have certain effects. Based on the range analysis results of permeability coefficient, an intuitive analytical diagram was constructed, as shown in Figure 13. The figure reveals that the permeability coefficient increases from 3.97 × 10⁻⁶ m/s to 67.73 × 10⁻⁶ m/s and then decreases to 35.18 × 10⁻⁶ m/s with increasing water content, moderately decreases from 48.85 × 10⁻⁶ m/s to 14.39 × 10⁻⁶ m/s with changes in aggregate ratio, and moderately increases from 32 × 10−6 m/s to 72.6 × 10⁻⁶ m/s with increasing water–cement ratio. No significant correlation was observed between permeability coefficient and silicone oil content.
Furthermore, future directions will involve the integration of advanced computer vision technologies with the real-time monitoring of dynamic hydromechanical processes. Specifically, robust and efficient vision-based models could be leveraged to quantitatively track water seepage fronts and pore space evolution during permeability tests. This would enable a direct, pixel-level correlation between observed flow patterns and the measured hydraulic coefficients, moving beyond bulk measurements to provide spatially resolved data.
For this task, we propose the use of two complementary deep learning architectures:
  • DeepLab is a state-of-the-art semantic segmentation model that excels at assigning a precise label (e.g., “water,” “soil,” “air”) to every pixel in an image. Its use of atrous convolution and atrous spatial pyramid pooling (ASPP) allows for the multi-scale analysis of features, making it ideal for accurately delineating the complex and often diffuse boundaries of a advancing seepage front [46].
  • EfficientNet is a family of convolutional neural networks known for achieving superior accuracy with remarkable parameter and computational efficiency. It could be employed as a powerful backbone for feature extraction within a segmentation network (like DeepLab) or used independently for image classification tasks, such as identifying different stages of pore evolution or predicting hydraulic properties from image data alone [47]. The synergy of these models—using EfficientNet for efficient feature encoding and DeepLab for precise pixel-wise decoding—presents a powerful framework for automating the analysis of laboratory experiments and extracting unprecedented quantitative data from visual information.

6. Linear Regression Analysis

To rapidly obtain the required simulative material mix proportions, regression analysis was performed on the orthogonal experiment results using SPSS 27.0.1 software. The aggregate ratio (X1), water-to-cement ratio (X2), silicone oil content (X3), and water content (X4) were defined as independent variables. The simulative material density (Y1), compressive strength (Y2), elastic modulus (Y3), and permeability coefficient (Y4) were defined as dependent variables. Prior to linear regression analysis, the Pearson correlation coefficient was used to assess the degree of linear correlation between variables; the correlation coefficients between factors are presented in Table 2.
The Pearson correlation coefficient measures the strength of linear association between variables in the sample, ranging from −1 to 1. A larger absolute value indicates a stronger correlation. Analysis of Table 2 data reveals: Density exhibits a significant correlation with the aggregate ratio and correlations with silicone oil content and water content. Compressive strength exhibits correlations with the aggregate ratio and water content. Elastic modulus exhibits correlations with silicone oil content and water content. Permeability coefficient exhibits correlations with the aggregate ratio, water-to-cement ratio, and water content.
Based on the correlation analysis results and combined with prior experimental knowledge in simulative material testing to guide the selection of physically meaningful variables, relevant independent and dependent variables were selected for multiple linear regression analysis, yielding the following regression equations:
Y 1 = 2.233 + 0.324 X 1 + 0.018 X 3 0.028 X 4 Y 2 = 0.178 + 0.691 X 1 + 0.264 X 4 Y 3 = 114.87 10.684 X 3 + 24.65 X 4 Y 4 = 28.68 8.712 X 1 + 128.683 X 2 + 5.172 X 4
where Aggregate ratio X1∈[0, 2], Water-to-cement ratio X2∈[0.3, 0.6], Silicone oil content X3∈[2%, 10%], Water content X4∈[1%, 7%].
It should be noted that the white cement content in Equation (1) may have a limited contribution to the strength, and existing studies have also demonstrated its insignificant impact on strength under specific conditions [48].
Using Equation (1), the density, compressive strength, elastic modulus, and permeability coefficient of the simulative material can be calculated for a given mix proportion (within the specified ranges of X1, X2, X3, X4). However, in practical applications, the mix proportion is often determined based on the physical and mechanical parameters of the rock mass to be simulated and the similarity constants. Therefore, solving Equation (1) yields the following empirical relationships:
X 1 = 8.377 + 3.465 Y 1 0.178 Y 2 + 0.006 Y 3 X 2 = 1.198 + 0.599 Y 1 0.183 Y 2 + 0.001 Y 3 + 0.008 Y 4 X 3 = 59.782 20.926 Y 1 + 9.812 Y 2 0.129 Y 3 X 4 = 21.251 9.07 Y 1 + 4.253 Y 2 0.015 Y 3
Using Equation (2), when the density, compressive strength, elastic modulus, and permeability coefficient (on the order of 10−6 m/s) of the desired simulative material are known, the aggregate ratio, water-to-cement ratio, silicone oil content, and water content can be calculated. This enables the rapid determination of simulative material mix proportions, thereby improving experimental efficiency.
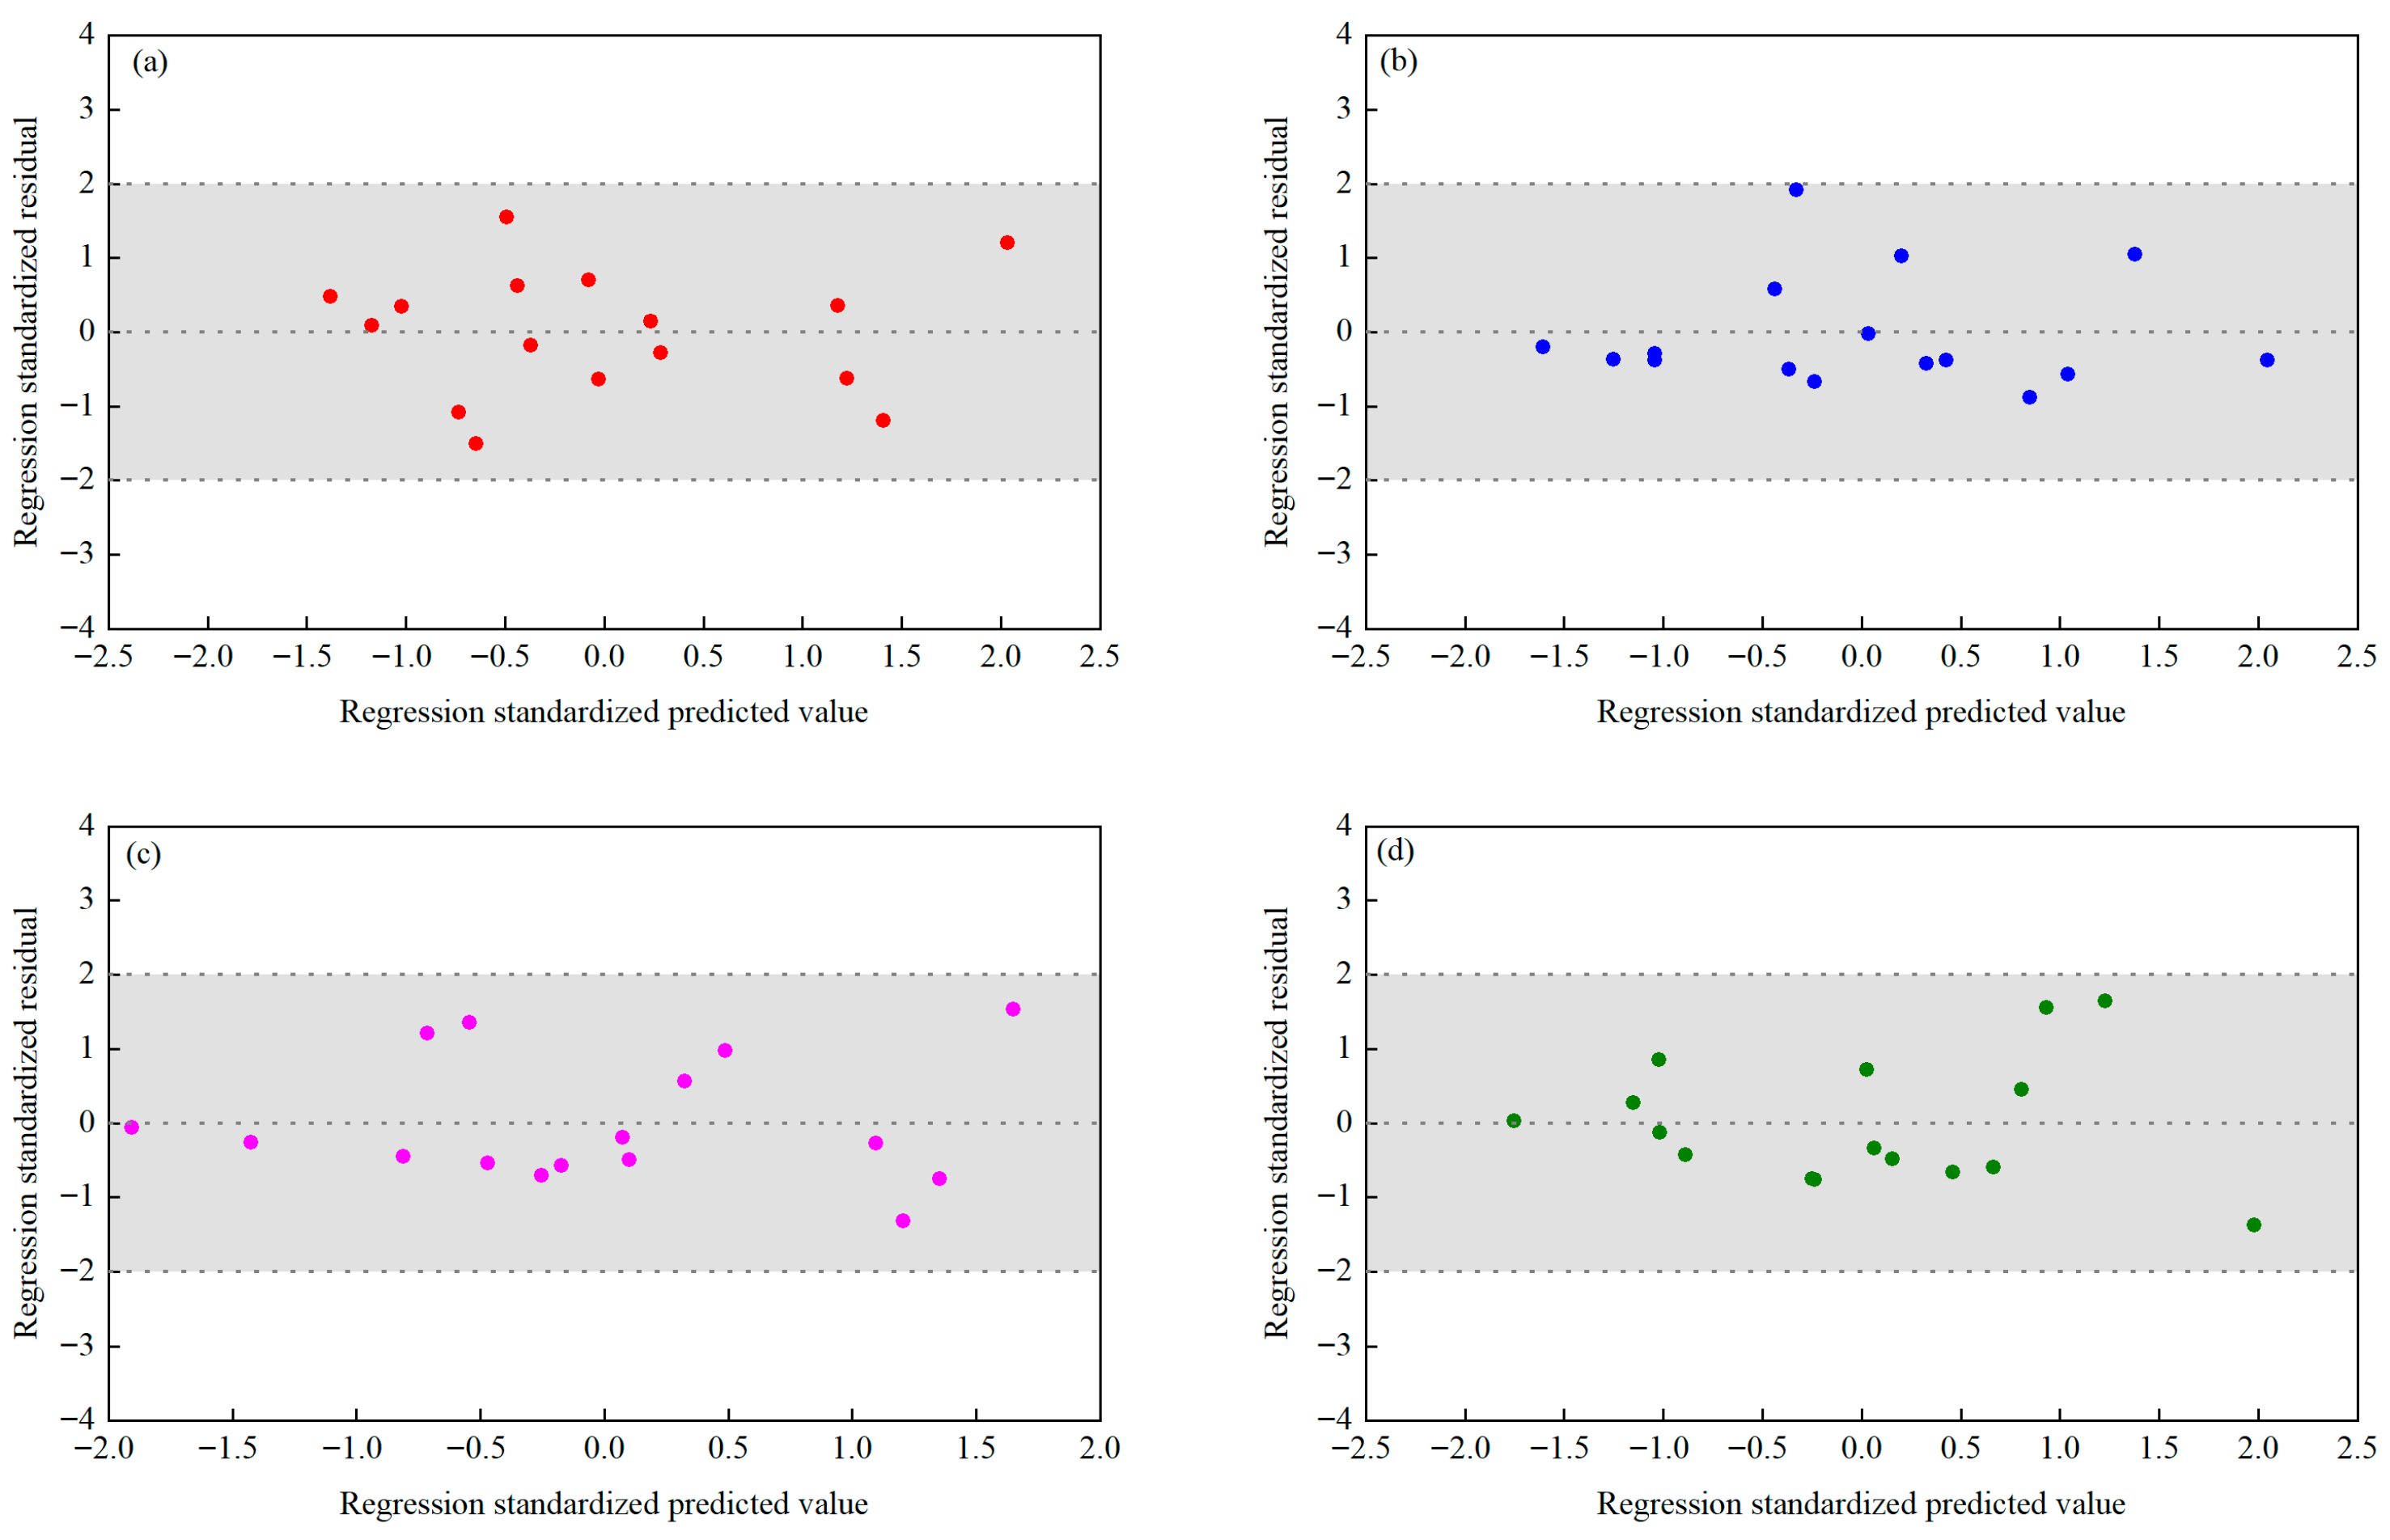
To ensure that the regression models were not overfitted, we performed a residual analysis to assess the robustness of the models, as shown in Figure 14. It can be observed that the standardized residuals of the dependent variables Y1, Y2, Y3, and Y4 are evenly distributed on both sides of the Y = 0 line and fall within the range of Y = ±2. This indicates that the data met the assumptions of linear regression analysis and that the linear relationships were robust.

7. Comparative Analysis with Existing Similarity Materials

Table 3 summarizes the key characteristics of the developed materials in comparison with those documented in other literature [49], clearly outlining their advantages, disadvantages, associated risks, and limitations.

8. Conclusions

This study systematically investigated the proportioning of similarity materials through orthogonal experiments and sensitivity analysis, yielding the following conclusions:
(1)
Density is primarily controlled by the aggregate ratio (iron powder–quartz sand–barite powder). Compressive strength and permeability coefficient are most sensitive to water content. Elastic modulus is dominated by aggregate ratio. Internal friction angle is mainly regulated by water–cement ratio.
(2)
The similarity materials achieved wide parametric coverage: density (2.20–3.18 g/cm3), compressive strength (0.07–7.53 MPa), elastic modulus (6.98–484.51 MPa), internal friction angle (32.20–49.12°), and permeability coefficient (1.75 × 10⁻⁶–140 × 10−6 m/s). This versatility supports model tests under large similarity ratios.
(3)
Multivariate linear regression (SPSS 27.0.1) established predictive equations: Forward equations calculate material properties from mix ratios. Inverse equations determine optimal mix ratios for target geomechanical/hydraulic properties. These models facilitate rapid proportioning design for engineering simulations.
(4)
The study bridges the gap in quantitative prediction of permeability-stress coupling behavior. The derived formulas enable efficient preparation of similarity materials tailored to specific rock mass simulations (e.g., low–medium strength, variable permeability), advancing reliability in physical model tests for groundwater-related hazards.
(5)
Future research will focus on two main directions. Scientifically, we plan to integrate computer vision technologies, such as DeepLab and EfficientNet models, for real-time, high-resolution monitoring of seepage fronts and pore evolution during physical tests. This will enable pixel-level analysis of fluid-solid coupling processes. For engineering practice, the derived empirical formulas will be embedded into a user-friendly mix design tool to facilitate rapid optimization of material proportions for specific field conditions, such as tunnels or slopes with varying groundwater pressures. Furthermore, large-scale model tests simulating typical engineering scenarios (e.g., water inrush in tunnels) are planned to validate the predictive models and enhance their practical applicability.

Author Contributions

Conceptualization, Y.R. and Y.Y.; methodology, Y.W.; software, Y.W., Y.Y. and Y.S; validation, Y.W; formal analysis, Y.Y.; investigation, Y.R., Y.W. and Y.Y.; resources, Y.R. and J.D.; data curation, Y.S.; writing—original draft preparation, Y.R. and Y.S.; writing—review and editing, Y.R. and Y.S.; visualization, Y.R.; supervision, Y.W. and J.D.; project administration, J.D.; funding acquisition, Y.S. All authors have read and agreed to the published version of the manuscript.

Funding

This research was funded by the Major Research and Development Program of Jiangxi Provincial Department of Transport grant number 2022Z0001; the Major Research and Development Program of Jiangxi Provincial Department of Transport grant number 2022Z0002; Ganpo Juncai Support Program-Training Program for Academic and Technical Leaders in Major Disciplines-Young Talents (Technical Category) grant number 20232BCJ23069; Training Program for Academic and Technical Leaders in Key Disciplines in Jiangxi Province, China-Leading Talent Project grant number 20225BCJ22014; Science and Technology Project of Jiangxi Provincial Department of Transportation grant number 2023C0005; Science and Technology Project of Jiangxi Provincial Department of Transportation grant number 2023C0007 And The APC was funded by Jingliang Dong.

Data Availability Statement

Data will be made available on request.

Acknowledgments

This work was supported by the Major Research and Development Program of Jiangxi Provincial Department of Transport (NO. 2022Z0001, NO. 2022Z0002), Ganpo Juncai Support Program-Training Program for Academic and Technical Leaders in Major Disciplines-Young Talents (Technical Category) (No.20232BCJ23069), Training Program for Academic and Technical Leaders in Key Disciplines in Jiangxi Province, China-Leading Talent Project (20225BCJ22014), Science and Technology Project of Jiangxi Provincial Department of Transportation (2023C0005), and Science and Technology Project of Jiangxi Provincial Department of Transportation (2023C0007).

Conflicts of Interest

Authors Yao Rong and Yang Sun were employed by the Jiangxi Communications Investment Maintenance Technology Group Co., Ltd. The remaining authors declare that the research was conducted in the absence of any commercial or financial relationships that could be construed as a potential conflict of interest. The authors declare no conflicts of interest.

Appendix A

Table A1. List of Abbreviations.
AbbreviationFull Form
Factor ARatio of iron powder to quartz sand to barite powder
Factor BWater-to-cement ratio
Factor CSilicone oil content
Factor DWater content
UTMUniversal Testing Machine
GDSGeotechnical Digital Systems
DeepLabDeepLab series
ASPPAtrous Spatial Pyramid Pooling
EfficientNetEfficient Network
SPSS 27.0.1Statistical Package for the Social Sciences
PPEPersonal protective equipment
RRange
UCSUniaxial compressive strength
EElasticity modulus
Table A2. Simulative material mix proportions.
Test NumberFactor AFactor BFactor C/%Factor D/%
11:1:13:1021
21:1:12:557
31:1:11:283
41:1:13:5105
52:1:13:1055
62:1:12:523
72:1:11:2107
82:1:13:581
91:2:13:1087
101:2:12:5101
111:2:11:225
121:2:13:553
131:1:23:10103
141:1:22:585
151:1:21:251
161:1:23:527
Table A3. Results of the orthogonal experiment on simulative material mix proportions.
Test NumberDensity
(g·cm−3)
Compressive Strength
(MPa)
Elasticity Modulus
(MPa)
Internal Friction Angle
(°)
Permeability Coefficient
(m·s−1)
12.460.4250.3935.967.90 × 106
22.671.34129.6139.8020.4 × 106
32.587.53274.9236.8627.1 × 106
42.631.1535.3932.20140 × 106
52.875.51323.6334.7030.6 × 106
62.741.33122.5833.8259.5 × 106
72.702.5780.4349.1227.5 × 106
83.180.136.9839.942.08 × 106
92.380.4335.1936.7674.5 × 106
102.640.0710.2441.874.16 × 106
112.310.44181.7140.0377.8 × 106
122.200.2025.9132.53130 × 106
132.452.99308.6936.3415.0 × 106
142.241.89251.9837.7422.5 × 106
152.550.2224.9943.831.75 × 106
162.324.55484.5136.6818.3 × 106
Table A4. Range analysis table for factors influencing simulative materials.
Influence FactorNumber of LevelsAggregate RatioWater Cement RatioSilicone Oil ContentWater Content
Density (g·cm−3)12.592.542.462.71
22.872.572.572.49
32.382.542.62.51
42.392.582.612.52
Range0.490.040.150.22
Compressive strength (MPa)12.612.341.690.21
22.381.161.823.01
30.292.692.502.25
42.411.511.702.22
Range2.321.530.812.8
Elasticity modulus (MPa)1122.58179.48209.823.15
2133.41128.6126.04183.02
363.26140.51142.47198.18
4267.54138.2108.69182.44
Range204.2850.88101.11175.03
Internal friction angle
(°)
136.235.9436.6240.4
239.438.3137.7234.89
337.842.4637.8336.17
438.6535.3439.8840.59
Range3.210.123.265.7
Permeability coefficient (m·s−1)148.85 × 10−632.00 × 10−640.88 × 10−63.97 × 10−6
229.92 × 10−626.64 × 10−645.69 × 10−657.9 × 10⁻⁶
371.62 × 10−633.54 × 10−631.55 × 10−667.73 × 10⁻⁶
414.39 × 10−672.6 × 10−646.67 × 10−635.18 × 10⁻⁶
Range57.23 × 10−645.96 × 10−615.12 × 10−663.76 × 10⁻⁶

References

  1. Sun, L.; Wang, W.-X.; Xu, J.-S. Study on Proportioning Scheme of Coal System Rocky Similar Material Based on Orthogonal Test. Materials 2023, 16, 7113. [Google Scholar] [CrossRef]
  2. Liu, S.; Liu, W. Experimental Development Process of a New Fluid–Solid Coupling Similar-Material Based on the Orthogonal Test. Processes 2018, 6, 211. [Google Scholar] [CrossRef]
  3. Lin, Z.; Jiang, Y.; Xiong, Y.; Xu, C.; Guo, Y.; Wang, C.; Fang, T. Analytical Solution for Displacement-Dependent Active Earth Pressure Considering the Stiffness of Cantilever Retaining Structure in Cohesionless Soil. Comput. Geotech. 2024, 170, 106258. [Google Scholar] [CrossRef]
  4. Yang, H.; Zhao, Z.; Li, Y. Experimental Study on Ratio of High Strength Similar Materials. Saf. Coal Mines 2018, 49, 59–62+67. [Google Scholar] [CrossRef]
  5. Yang, X.; Dong, J.; Yang, J.; Han, X. Similar Material Proportioning Tests and Mechanical Properties Based on Orthogonal Design. Materials 2023, 16, 6439. [Google Scholar] [CrossRef]
  6. Li, J.; Zou, H.; Sun, G.; Zhou, Z.; Zeng, L. Experimental Study on Similar Materials in Model Test Based on Orthogonal Design. IOP Conf. Ser. Earth Environ. Sci. 2021, 692, 042014. [Google Scholar] [CrossRef]
  7. Lin, Z.; Jiang, Y.; Xu, C.; Chi, M.; Fang, T.; Guan, L.; Feng, G.; Lin, G. Performance of Adjacent Metro Tunnels during Deep Excavation: A Case Study in Hangzhou. Transp. Geotech. 2025, 53, 101585. [Google Scholar] [CrossRef]
  8. Kong, C.; Gao, X.; Ren, S.; Gu, S.; Gu, Y. Physical Model Test of Tunnel Complex Surrounding Rock Progressive Failure Based on Strength-Reduction Similar Materials. Eng. Fail. Anal. 2023, 149, 107255. [Google Scholar] [CrossRef]
  9. Xu, Z.; Luo, Y.; Chen, J.; Su, Z.; Zhu, T.; Yuan, J. Mechanical Properties and Reasonable Proportioning of Similar Materials in Physical Model Test of Tunnel Lining Cracking. Constr. Build. Mater. 2021, 300, 123960. [Google Scholar] [CrossRef]
  10. Sun, B.; Chen, R.; Ping, Y.; Zhu, Z.; Wu, N.; He, Y. Dynamic Response of Rock-like Materials Based on SHPB Pulse Waveform Characteristics. Materials 2021, 15, 210. [Google Scholar] [CrossRef]
  11. Wang, Q.; Ye, H.; Li, N.; Ren, G.; Lei, T.; Chen, D.; Chen, W. Proportioning experiment and strength variation law of similar simulation materials for soft rock of coal measures. Exp. Technol. Manag. 2021, 38, 77–82. [Google Scholar] [CrossRef]
  12. Li, S.C.; Wang, H.P.; Zhang, Q.Y.; Li, Y. New Type Geo-Mechanical Similar Material Experiments Research and Its Application. Key Eng. Mater. 2006, 326–328, 1801–1804. [Google Scholar] [CrossRef]
  13. Qiu, J.; Lu, Y.; Lai, J.; Zhang, Y.; Yang, T.; Wang, K. Experimental Study on the Effect of Water Gushing on Loess Metro Tunnel. Environ. Earth Sci. 2020, 79, 261. [Google Scholar] [CrossRef]
  14. Liu, M.; Fan, Q.; Han, J.; Li, W. Research on Mix Proportion of Similar Materials in Limestone. HongShui Rive 2020, 39, 85–89. [Google Scholar]
  15. Diao, X.H.; Wang, K.; Fu, P.Y. Study on Proportioning of Similar Material to Swelling Rock. Appl. Mech. Mater. 2014, 501–504, 439–443. [Google Scholar] [CrossRef]
  16. Fu, H.-Y.; Qi, S.-X.; Shi, Z.-N.; Zeng, L. Mixing Ratios and Cementing Mechanism of Similar Silty Mudstone Materials for Model Tests. Adv. Civ. Eng. 2021, 2021, 2426130. [Google Scholar] [CrossRef]
  17. Yang, M.; Yang, Y.; Zhao, B. Study on the Proportion of Conglomerate Similar Materials Based on the Orthogonal Test. Shock Vib. 2021, 2021, 6657323. [Google Scholar] [CrossRef]
  18. Tang, F.; Qin, Y.; Sun, J.; Yan, L.; Chu, C.; Xu, Y. Study on Similar Simulation Experiment of Stopped Working Face Gob Spontaneous Combustion Based on Coal Similar Material. Combust. Sci. Technol. 2025, 1–23. [Google Scholar] [CrossRef]
  19. Wen, C.; Jia, S.; Fu, X.; Meng, L.; Zhao, Z. Experimental Research and Sensitivity Analysis of Mudstone Similar Materials Based on Orthogonal Desig. Adv. Mater. Sci. Eng. 2020, 2020, 2031276. [Google Scholar] [CrossRef]
  20. Xu, C.; Cui, Y.; Xue, L.; Chen, H.; Dong, J.; Zhao, H. Experimental Study on Mechanical Properties and Failure Behaviours of New Materials for Modeling Rock Bridges. J. Mater. Res. Technol. 2023, 23, 1696–1711. [Google Scholar] [CrossRef]
  21. Shi, W.; Zhang, J.; Xin, C.; Song, D.; Hu, N.; Li, B. Proportioning Test on the Similar Materials of the Rock Mass Physical Model Test Considering Seepage and Dynamic Characteristics. J. Mar. Sci. Eng. 2023, 11, 1815. [Google Scholar] [CrossRef]
  22. Nie, X.; Yin, Q.; He, M.; Wang, Q.; Jing, H.; Zheng, B.; Meng, B.; Deng, T.; Jiang, Z.; Wu, J. Shear Mechanical Properties and Fracturing Responses of Layered Rough Jointed Rock-like Materials. Int. J. Min. Met. Mater. 2024, 31, 2417–2434. [Google Scholar] [CrossRef]
  23. Wang, J.; Zhang, Y.; Wang, K.; Li, L.; Cheng, S.; Sun, S. Development of Similar Materials with Different Tension-Compression Ratios and Evaluation of TBM Excavation. Bull. Eng. Geol. Environ. 2024, 83, 190. [Google Scholar] [CrossRef]
  24. Kumar, S.; Tiwari, G.; Parameswaran, V.; Das, A. Dynamic Mechanical Behaviour of Rock-like Materials with a Flaw Under Different Orientation and Infill Conditions. Bull. Eng. Geol. Environ. 2023, 82, 345. [Google Scholar] [CrossRef]
  25. Huang, D.; Gu, D.M. Influence of Filling-Drawdown Cycles of the Three Gorges Reservoir on Deformation and Failure Behaviors of Anaclinal Rock Slopes in the Wu Gorge. Geomorphology 2017, 295, 489–506. [Google Scholar] [CrossRef]
  26. Macfarlane, D.F. Observations and Predictions of the Behaviour of Large, Slow-Moving Landslides in Schist, Clyde Dam Reservoir, New Zealand. Eng. Geol. 2009, 109, 5–15. [Google Scholar] [CrossRef]
  27. Jiao, Y.-Y.; Zhang, H.-Q.; Tang, H.-M.; Zhang, X.-L.; Adoko, A.C.; Tian, H.-N. Simulating the Process of Reservoir-Impoundment-Induced Landslide Using the Extended DDA Method. Eng. Geol. 2014, 182, 37–48. [Google Scholar] [CrossRef]
  28. Sun, W.; Zhang, S.; Guo, W.; Liu, W. Physical Simulation of High-Pressure Water Inrush Through the Floor of a Deep Mine. Mine Water Environ. 2017, 36, 542–549. [Google Scholar] [CrossRef]
  29. Liu, W.; Li, H.; Zhao, J.; Shen, J. Deformation and Stability in Coal Seam Mining Under Fluid–Solid Coupling. Geotech. Geol. Eng. 2024, 42, 4333–4348. [Google Scholar] [CrossRef]
  30. Zhai, C.; Zheng, Y.; Yu, X.; Xu, J.; Sun, Y.; Cong, Y.; Tang, W.; Li, Y.; Zhu, X.; Chen, A. Experimental study on the mechanical properties of coal-like materials for hydraulic fracturing simulation. Coal Geol. Explor. 2022, 50, 16–28. [Google Scholar] [CrossRef]
  31. Li, S.; Liu, H.; Li, L.; Zhang, Q.; Wang, K.; Wang, K. Large Scale Three-Dimensional Seepage Analysis Model Test and Numerical Simulation Research on Undersea Tunnel. Appl. Ocean Res. 2016, 59, 510–520. [Google Scholar] [CrossRef]
  32. Song, C.; Xu, X.; Wang, L. Development and Characterisation of Novel Fluid–Solid Coupled Similar Materials Under Dry–Wet Cycling Conditions. Buildings 2025, 15, 1794. [Google Scholar] [CrossRef]
  33. Ren, X.; Xu, G.; Chen, Z.; Ran, S.; Zhang, J. Development of Similar Materials for Fluid–Solid Coupling Model Testing and Application in Damage Constitutive Models. Sci. Rep. 2024, 14, 14786. [Google Scholar] [CrossRef]
  34. Liang, D.; Jiang, Z.; Zhu, S.; Sun, Q.; Qian, Z. Experimental Research on Water Inrush in Tunnel Construction. Nat. Hazards 2016, 81, 467–480. [Google Scholar] [CrossRef]
  35. Li, S.; Pan, D.; Xu, Z.; Li, L.; Lin, P.; Yuan, Y.; Gao, C.; Lu, W. A model test on catastrophic evolution process of water inrush of a concealed karst cave filled with confined water. Rock Soil Mech. 2018, 39, 3164–3173. [Google Scholar] [CrossRef]
  36. Li, S.; Gao, C.; Zhou, Z.; Li, L.; Wang, M.; Yuan, Y.; Wang, J. Analysis on the Precursor Information of Water Inrush in Karst Tunnels: A True Triaxial Model Test Study|Rock Mechanics and Rock Engineering. Rock Mech. Rock Eng. 2019, 52, 373–384. [Google Scholar] [CrossRef]
  37. Li, L.; Sun, S.; Wang, J.; Yang, W.; Song, S.; Fang, Z. Experimental Study of the Precursor Information of the Water Inrush in Shield Tunnels Due to the Proximity of a Water-Filled Cave. Int. J. Rock Mech. Min. Sci. 2020, 130, 104320. [Google Scholar] [CrossRef]
  38. Zhang, Z.; Zhang, Q.; Xiang, W.; Yin, X.; Xue, T.; Lin, H.; Cheng, L.; Guo, X. Development and application of new-style hydro-mechanical coupling similar materials in complex environment. J. Cent. South Univ. (Sci. Technol.) 2021, 52, 4168–4180. [Google Scholar] [CrossRef]
  39. Wu, B.; Li, P.; Wang, Y.; Zhang, B.; Chi, M. Mechanical properties analysis of materials for similar simulationtest of coal-water co-mining. China Coal 2022, 48, 64–73. [Google Scholar] [CrossRef]
  40. Shi, X.; Liu, B.; Qi, Y. Applicability of similar materials bonded by cement and plaster in solid-liquid coupling tests. Rock Soil Mech. 2015, 36, 2624–2630+2638. [Google Scholar] [CrossRef]
  41. Shi, X.; Liu, B.; Xiao, J. Amethod for determining the ratio of similar materials with cement and plaster as bonding agents. Rock Soil Mech. 2015, 36, 1357–1362. [Google Scholar] [CrossRef]
  42. Hu, Y.; Zhao, Y.; Yang, D. Simulation theory & method of 3D solid-liquid coupling. J. Liaoning Tech. Univ. 2007, 2, 204–206. [Google Scholar]
  43. Wei, L.; Jing, H.; Xu, B.; Wang, Y. Solid-fluid coupling analogous material test for subsea tunnel. J. Cent. South Univ. (Sci. Technol.) 2015, 46, 983–990. [Google Scholar] [CrossRef]
  44. Zan, W.; Lai, J.; Zhang, W.; Yang, Q.; Qin, Y.; Su, X. Experimental and Applied Research on Similar Materials to Granular Mixtures for Solid-Liquid Coupling Model Test of an Underwater Tunnel. Constr. Build. Mater. 2024, 416, 135170. [Google Scholar] [CrossRef]
  45. Xu, S.; Yang, K.; Xiong, W.; Li, Z.; Hao, L. Permeability and Porosity of Artificial-Similar Material for Biomimetic Geotechnical Engineering via Direct Ink Writing for Sustainability. 3D Print. Addit. Manuf. 2024, 11, 1758–1767. [Google Scholar] [CrossRef] [PubMed]
  46. Song, Z.; Zou, S.; Zhou, W.; Huang, Y.; Shao, L.; Yuan, J.; Gou, X.; Jin, W.; Wang, Z.; Chen, X.; et al. Clinically Applicable Histopathological Diagnosis System for Gastric Cancer Detection Using Deep Learning. Nat. Commun. 2020, 11, 4294. [Google Scholar] [CrossRef] [PubMed]
  47. Kabir, H.; Wu, J.; Dahal, S.; Joo, T.; Garg, N. Automated Estimation of Cementitious Sorptivity via Computer Vision. Nat. Commun. 2024, 15, 9935. [Google Scholar] [CrossRef]
  48. Zhan, X.; Gao, L.; Zhao, F.; Wang, Y.; Liu, P.; Han, S. Experimental study on the proportioning of ultra-high strength similar materials for large similarity ratio model tests. Coal Geol. Explor. 2023, 51, 109–118. [Google Scholar] [CrossRef]
  49. He, C.; Chen, J.; Ren, C.; Li, L. Similar Material Proportioning and Sensitivity Analysis for Similar Modeling Tests of Rock Contact Zones. Mater. Rep. 2025, 1–17. Available online: https://link.cnki.net/urlid/50.1078.TB.20250814.0952.002 (accessed on 25 August 2025).
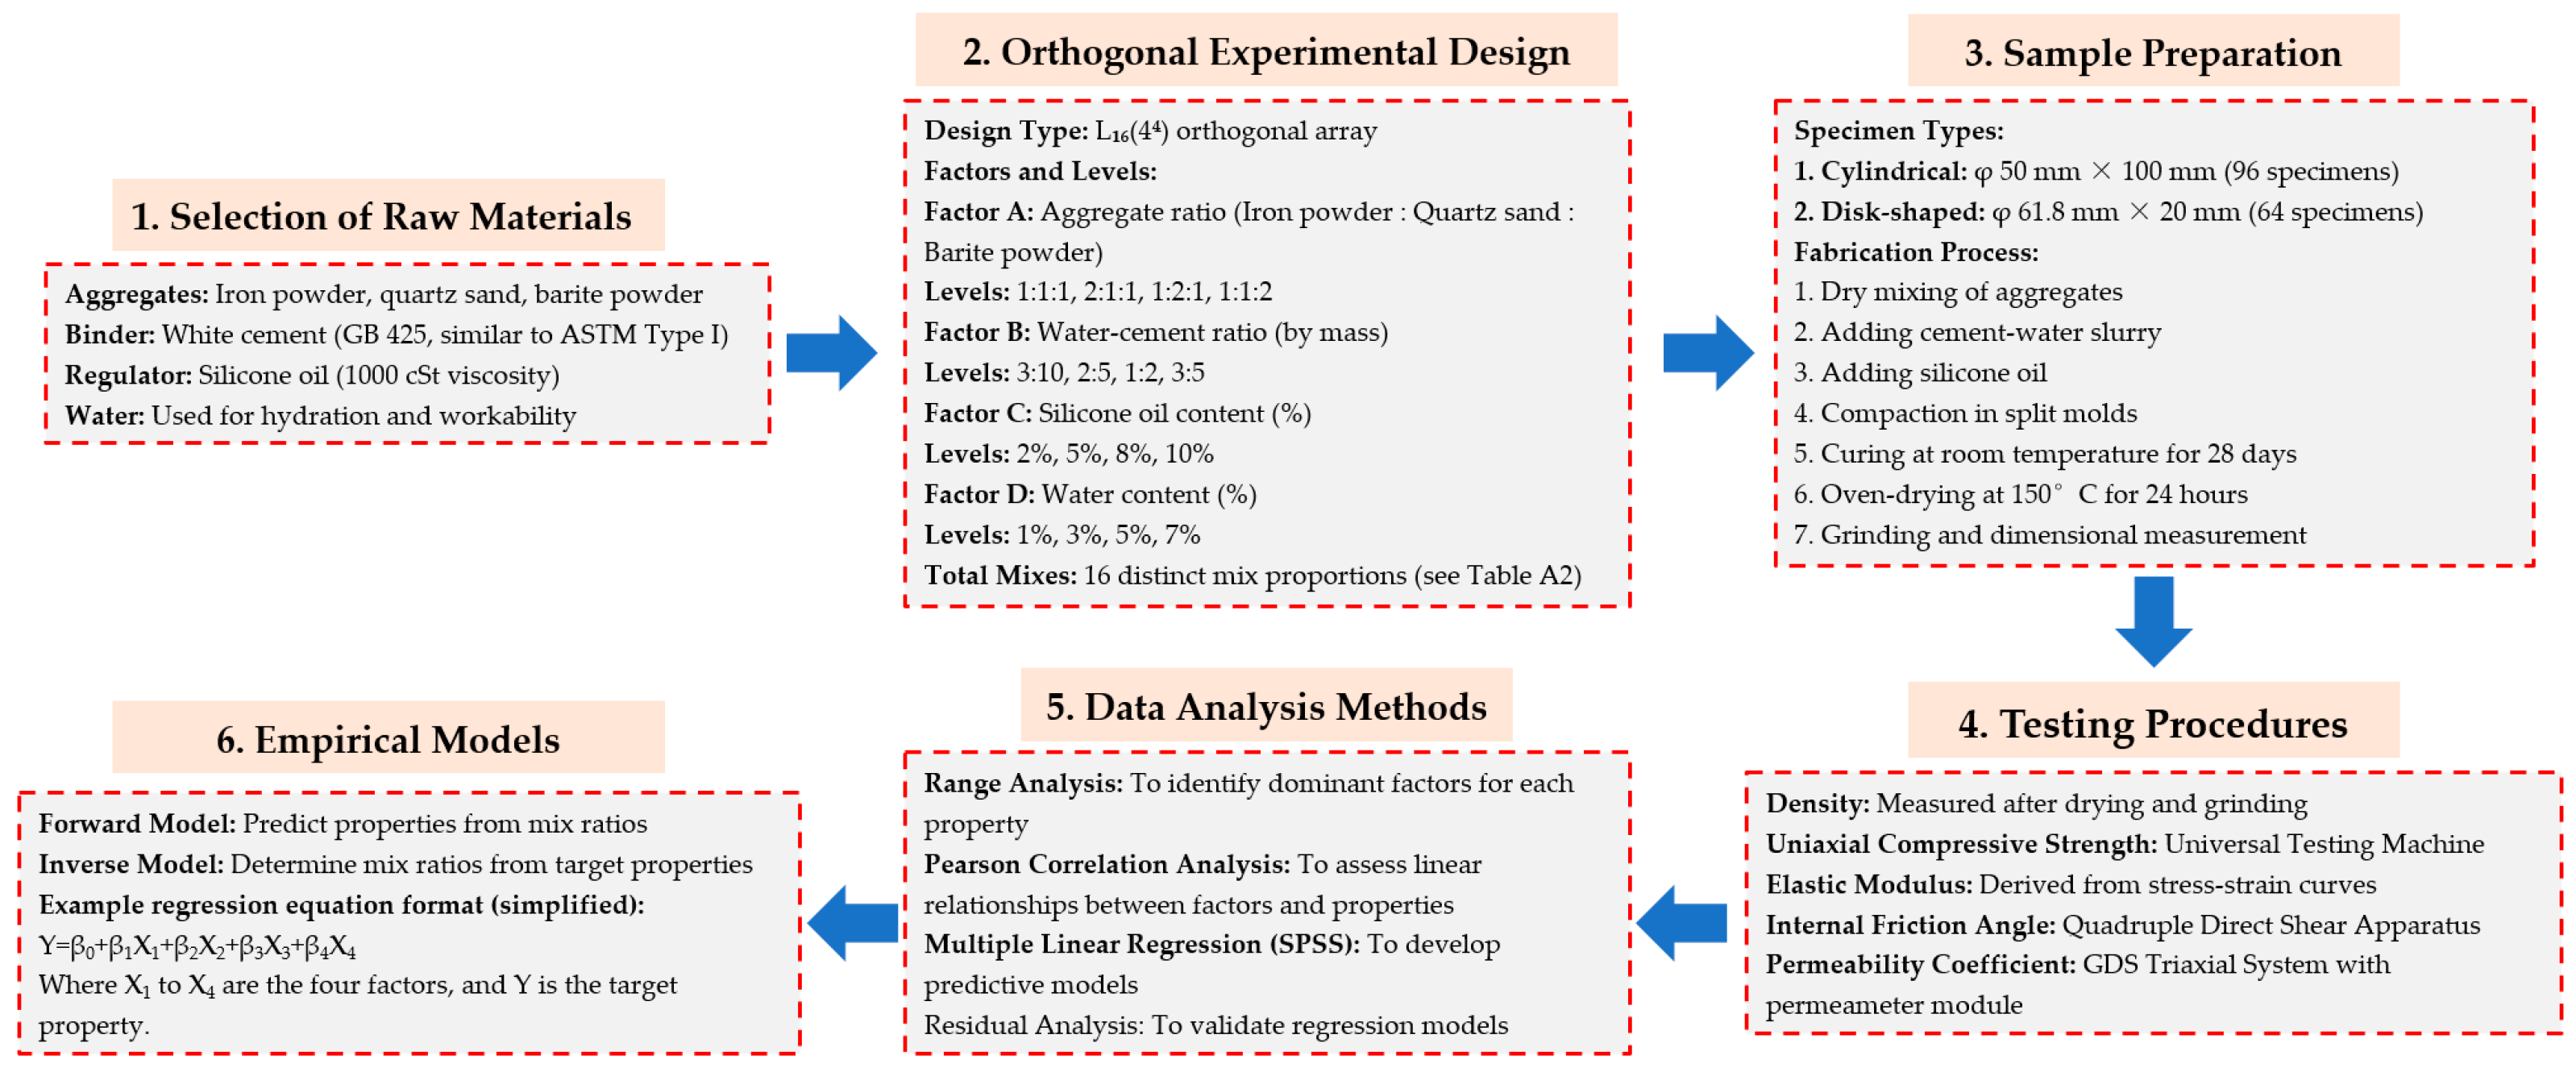
Figure 1. Methodological Scheme for Similitude Material Development.
Applsci 15 10278 g001
Figure 2. Aggregates.
Applsci 15 10278 g002
Figure 3. Binder and regulator.
Applsci 15 10278 g003
Figure 4. Testing Apparatus.
Applsci 15 10278 g004
Figure 5. Formed sample.
Applsci 15 10278 g005
Figure 6. Influence curves of factors on simulative material density.
Applsci 15 10278 g006
Figure 7. Testing machine and specimen testing.
Applsci 15 10278 g007
Figure 8. Influence curves of factors on simulative material compressive strength.
Applsci 15 10278 g008
Figure 9. Influence curves of factors on simulative material elastic modulus.
Applsci 15 10278 g009
Figure 10. Straight cutting machine and cutting box.
Applsci 15 10278 g010
Figure 11. Influence curves of factors on simulative material angle of internal friction.
Applsci 15 10278 g011
Figure 12. Penetrating specimens and penetration testing instruments.
Applsci 15 10278 g012
Figure 13. Influence curves of factors on simulative material permeability coefficient.
Applsci 15 10278 g013
Figure 14. Standardized residual plot. (a) material density (Y1); (b) compressive strength (Y2); (c) elastic modulus (Y3); (d) permeability coefficient (Y4).
Applsci 15 10278 g014
Table 1. Levels for Orthogonal Design of Simulative Materials.
LevelFactor AFactor BFactor C/%Factor D/%
11:1:13:1021
22:1:12:553
31:2:11:285
41:1:23:5107
Table 2. Pearson phase relation.
CategoryAggregate RatioWater Cement RatioSilicone Oil ContentWater Content
Density0.809 **0.0410.219 *−0.251 *
Compressive strength0.198 *−0.050.050.275 *
Elasticity modulus−0.094−0.09−0.234 *0.398 *
Permeability coefficient−0.127 *0.341 *−0.0010.274 *
Note: * indicates correlation; ** indicates significant correlation (p < 0.01).
Table 3. Comparative analysis of the developed similitude material with existing materials.
AspectMaterial CompositionPerformance RangeAdvantagesDisadvantagesRisksConsiderations
This StudyIron powder, quartz sand, barite powder, cement, silicone oil, water.ρ: 2.20–3.18 g/cm3; UCS: 0.07–7.53 MPa; E: 6.98–484.51 MPa; φ: 32.2–49.12°; k: 1.75–140 × 10−6 m/s.Wide prop. range; predictive models; permeability control.Multi-factor control; higher cost; complex prep.Oil dispersion; curing sensitivity; perm. calibration.For controlled strength; inverse design.
Literature [49]River sand, barite powder, cement, gypsum, paraffin oil, water.ρ: 1.78–2.19 g/cm3; UCS: 1.79–5.67 MPa; E: 21.4–134.6 MPa; c: 60.7–117.9 kPa; φ: 32.1–42.8°.Low cost; validated strength models; good for contact zones.Narrow range; not for hydr. Coupling.Not for fluid-solid; limited strength/perm. accuracy.Mechanical only; simple; economical.
Disclaimer/Publisher’s Note: The statements, opinions and data contained in all publications are solely those of the individual author(s) and contributor(s) and not of MDPI and/or the editor(s). MDPI and/or the editor(s) disclaim responsibility for any injury to people or property resulting from any ideas, methods, instructions or products referred to in the content.