Article

A Multimodal Deep Learning Framework for Accurate Wildfire Segmentation Using RGB and Thermal Imagery

1
College of Geomatics and Geoinformation, Guilin University of Technology, Guilin 541004, China
2
College of Environmental Science and Engineering, Guilin University of Technology, Guilin 541006, China
3
Guangxi Key Laboratory of Environmental Pollution Control Theory and Technology, Guilin University of Technology, Guilin 541006, China
4
Key Laboratory of Carbon Emission and Pollutant Collaborative Control of Education, Department of Guangxi Zhuang Autonomous Region, Guilin University of Technology, Guilin 541006, China
*
Author to whom correspondence should be addressed.
Appl. Sci. 2025, 15(18), 10268; https://doi.org/10.3390/app151810268
Submission received: 29 August 2025 / Revised: 18 September 2025 / Accepted: 19 September 2025 / Published: 21 September 2025

Abstract

Wildfires pose serious threats to ecosystems, human life, and climate stability, underscoring the urgent need for accurate monitoring. Traditional approaches based on either optical or thermal imagery often fail under challenging conditions such as lighting interference, varying data sources, or small-scale flames, as they do not account for the hierarchical nature of feature representations. To overcome these limitations, we propose a multimodal deep learning framework that integrates visible (RGB) and thermal infrared (TIR) imagery for accurate wildfire segmentation. The framework incorporates edge-guided supervision and multilevel fusion to capture fine fire boundaries while exploiting complementary information from both modalities. To assess its effectiveness, we constructed a multi-scale flame segmentation dataset and validated the method across diverse conditions, including different data sources, lighting environments, and five flame size categories ranging from small to large. Experimental results show that BFCNet achieves an IoU of 88.25% and an F1 score of 93.76%, outperforming both single-modality and existing multimodal approaches across all evaluation tasks. These results demonstrate the potential of multimodal deep learning to enhance wildfire monitoring, offering practical value for disaster management, ecological protection, and the deployment of autonomous aerial surveillance systems.

1. Introduction

With the exacerbation of global warming and the increasing frequency of human activities, the incidence of wildfires has been continuously rising, thereby posing a persistent threat to human life, the global climate, and ecosystems [1]. Wildfires typically spread rapidly and cover extensive areas, exerting impacts across broad temporal and spatial scales [2] which pose major challenges for wildfire research and prevention. Therefore, the accurate and timely identification of wildfires is of paramount importance in mitigating their destructive effects [3].
Currently, wildfire detection often relies on remote sensing techniques, which involve interpreting satellite or aerial imagery to identify fire occurrences [4]. The traditional methods for wildfire detection rely on handcrafted features extracted from optical imagery, including reflectance, brightness, and chromaticity [5,6,7,8,9,10,11]. For instance, Marbach et al. [12] detected fires by analyzing pixel intensity fluctuations caused by flame flickering. Töreyin et al. [13] employed wavelet transforms to identify the periodic behavior of flames. Celik and Demirel [14] utilized the YCbCr color space to effectively separate luminance and chrominance for wildfire detection. Prema et al. [15] extracted dynamic texture features using 2D wavelet transforms and 3D volumetric wavelet decomposition, which were then classified with an extreme learning machine to differentiate between flame and non-flame regions. However, such methods heavily rely on manually engineered features, which often lack robustness and generalizability under complex or variable conditions [16].
In recent years, convolutional neural networks (CNNs) have demonstrated strong capabilities in feature extraction and hierarchical representation, leading to significant advancements in early-stage wildfire detection tasks [17,18,19]. Depending on the type of input data, existing methods can be broadly classified into single-modality and multi-modality approaches. Single-modality methods primarily rely on optical (RGB) imagery, with a smaller subset utilizing thermal infrared (TIR) data for wildfire detection [20,21,22]. For example, Zhao et al. [23] implemented wildfire segmentation using a DCNN framework, achieving an average processing speed of 41.5 ms per image. Barmpoutis et al. [24] constructed a 360-degree optical image wildfire segmentation dataset and tested it using the DeepLab V3+ network, addressing the limited field-of-view issue in wildfire segmentation. Tsalera et al. [25] utilized a lightweight CNN with a ResNet-18 backbone to achieve 96% segmentation accuracy on devices with limited computational resources. Shirvan et al. [26] applied Residual Attention UNet (RAUNet) to segment forest fires, achieving an intersection-over-union (IoU) above 0.85. Pereira et al. [27] incorporated dropout into UNet and tested it on a large-scale active wildfire detection dataset, achieving 87.2% accuracy. Hu et al. [28] proposed GFUNet, an improved UNet for flame segmentation, capable of segmenting both fire and smoke. Fahim-Ul-Islam et al. [29] proposed an improved involution neural network (Inv-Net), which efficiently extracts features and enhances spatial correlation, achieving 98.1% wildfire monitoring accuracy. Nevertheless, single-modality images have limitations in fire detection, as pixels with flame-like colors are easily misclassified as fire, leading to false positives [30,31]. For example, RGB images offer higher resolution and are more effective in capturing detailed flame textures; however, they are susceptible to occlusions from smoke and light sources, which can hinder flame detection. In contrast, TIR images can mitigate such occlusions to some extent, but they may lead to false positives by misclassifying high-temperature objects as flames.
In fact, RGB and TIR images can complement each other’s advantages in data information representation, so some researchers have utilized these two kinds of data for semantic segmentation [32,33], and are widely used in pedestrian detection [34], image tracking [35], and automatic driving [36]. The RGB-T fusion methods can be broadly categorized into four types. The first type, exemplified by RTFNet [37], employs distinct RGB and TIR encoders to extract features, which are then fused and passed to a decoder for semantic segmentation. The second type, such as FEANet [38], applies a shared attention module to enhance features at each level, thereby improving network performance. The third type, including GMNet [39] and EGFNet [40], utilizes one or multiple modules to fuse features across different semantic levels and incorporates supervision strategies during network training. The fourth type, such as AMLNet [31] and SPNet [30], employs identical fusion modules alongside three decoders for prediction; although these methods improve performance, they substantially increase model complexity.
However, limited research has been devoted to wildfire detection based on RGB-T data. Among the few existing studies, Guo et al. [41] proposed a SkipInception module to extract features from RGB and TIR images and adopted an encoder–decoder architecture to support real-time wildfire detection. Chen et al. [42] developed a UAV-based RGB-T dataset and deep learning method for detecting fire smoke, though their dataset lacks pixel-level flame annotations. Rui et al. [31] constructed an RGB-T dataset with pixel-level labels and introduced a wildfire detection framework employing three decoders; despite fusing features only through the RFB module, the framework still involves high model complexity. Qiao et al. [43] proposed a deep learning-based ORB-SLAM feature filtering framework leveraging RGB-T data for early wildfire detection and distance estimation. These studies demonstrate the significant potential of RGB-T data for wildfire detection.
In summary, most existing RGB-T fusion models rely on various strategies to learn shared representations from both modalities, often overlooking the contribution of modality-specific features. Additionally, many fusion techniques fail to consider the hierarchical nature of feature representations, typically applying uniform fusion modules across all levels between the encoder and decoder. Therefore, to overcome these challenges, we propose an edge-guided multilevel wildfire semantic segmentation network (BFCNet) that aims to improve the accuracy, robustness, and detail representation of flame segmentation. This network enhances segmentation accuracy, robustness, and fine-grained detail. The main contributions of this work are summarized as follows:
  • We introduce a novel edge-guided multi-level semantic segmentation network (BFCNet) tailored for wildfire detection.
  • To the best of our knowledge, this is the first work to incorporate edge supervision into wildfire segmentation, significantly improving segmentation performance.
  • We design three specialized modules to effectively fuse features at different semantic levels, addressing the distinct characteristics of low, mid, and high-level representations.

2. Methods

Our network follows an encoder–decoder design: two parallel ResNet-50 backbones serve as encoders to extract multi-level features from RGB and TIR images. These features are then refined through shared convolutional layers to reduce parameters while preserving critical information. The refined features are subsequently processed by the Boundary Enhancement Module (BEM), Fusion Activation Module (FAM), and Cross-Localization Module (CLM) to achieve multi-level cross-modal fusion. Finally, the decoders reconstruct the segmentation map, integrating multi-level and cross-modal information. Figure 1 illustrates this overall architecture.

2.1. Boundary Enhancement Module (BEM)

In deep networks, low-level features are located in the first two layers of deep learning and often contain rich visual information, such as edges and textures. To exploit this information, we design a Boundary Enhancement Module (BEM) that fuses RGB and TIR to amplify salient features. The module architecture is depicted in Figure 2.
As shown in Figure 2, in the feature fusion part, the features f r g b i and f t i r i first fused by element-wise summation. Subsequently, the RGB image features and TIR image features are secondarily fused with their respective features using element-wise multiplication. Finally, the enhanced features are concatenated to produce output f f u s e i , denoted as:
f f u s e i = ( ( f r g b i f t i r i ) f r g b i ) ( ( f r g b i f t i r i ) f t i r i ) , i = 1 , 2
where denotes element-wise multiplication, denotes element-wise summation, denotes feature concatenation, and i represents the position the location of the module.
To extract rich information from f f u s e i , first, multi-scale information extraction is performed using four parallel 3 × 3 convolutions with feature concatenation, where the receptive fields of the convolution are {1, 3, 5, 7}. Then, the concatenated features are linearly combined by a 1 × 1 convolution and optimized by residual linkage. Finally, a 3 × 3 convolution is utilized to output the features f B E M i . The edge prediction module is added to the output section, followed by the application of supervision to achieve edge enhancement of the target information, denoted as:
f B E M i = c o n v 6 ( f f u s e i c o n v 5 ( c o n v 1 ( f f u s e i ) c o n v 2 ( f f u s e i ) c o n v 3 ( f f u s e i ) c o n v 4 ( f f u s e i ) ) ) , i = 1 , 2
where conv( ) represents a 2D 3 × 3 convolution.

2.2. Fusion Activation Module (FAM)

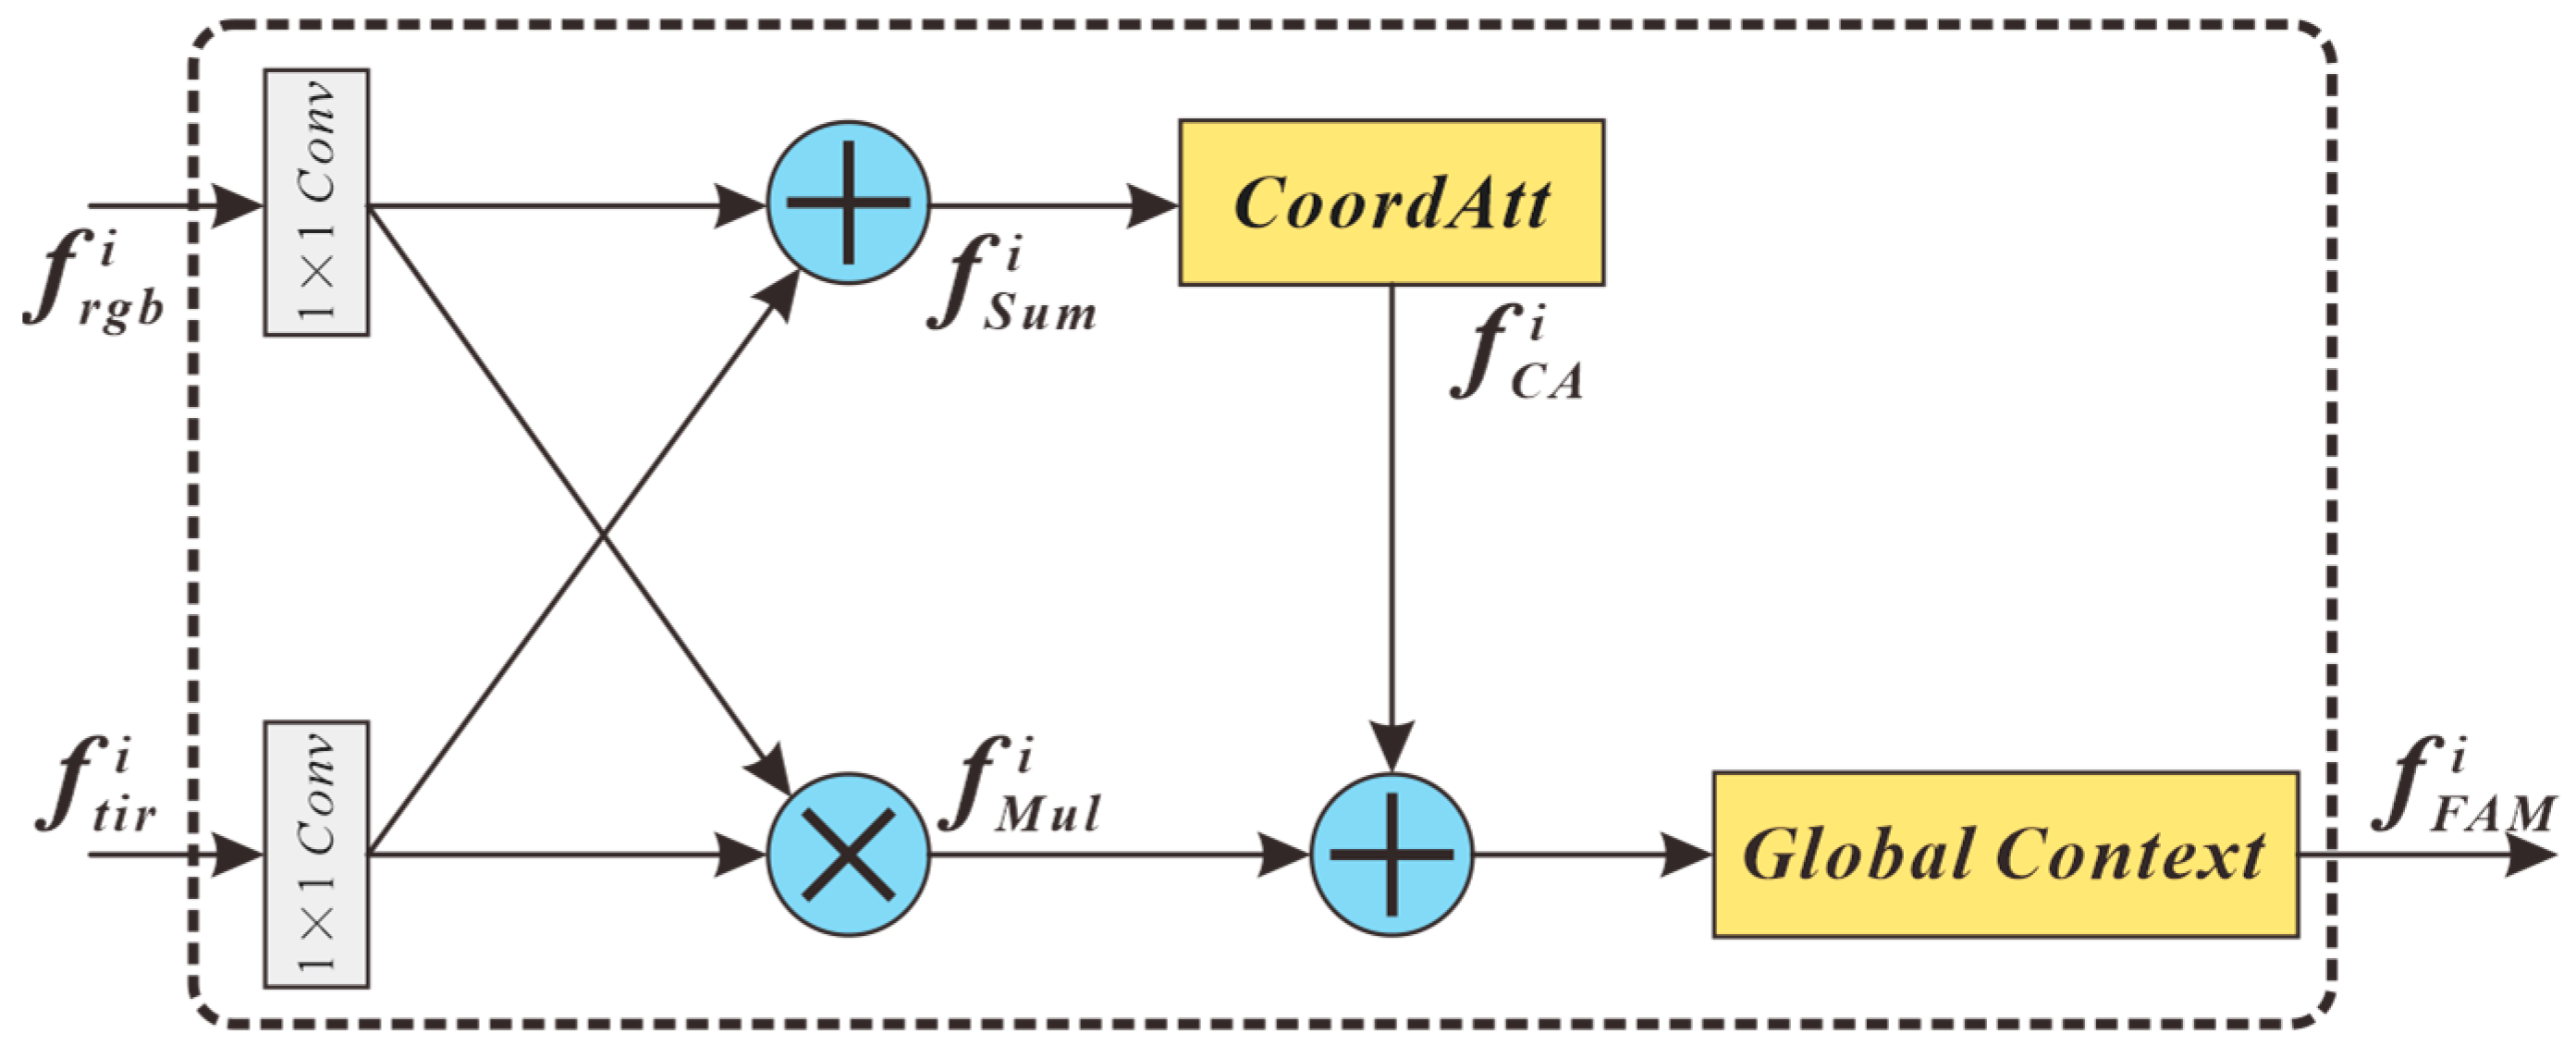
The mid-level features play a top-down role in the network, enabling hierarchical refinement of semantic context and recovery of spatial details. Therefore, we design the Fusion Activation Module (FAM) to activate target-specific regions in the mid-level stage, as shown in Figure 3.
Specifically, the input features f r g b i ,   f t i r i are first projected by two parallel 1 × 1 convolutions, which enhance the representation capability. Their element-wise multiplication and summation generate complementary feature maps, achieving an initial activation. The summed feature f s u m i is then fed into a coordinate attention module, which captures long-range dependencies along both horizontal and vertical directions with explicit coordinate encoding. This allows the network to emphasize fire-related responses while precisely preserving boundary pixels at corresponding RGB and TIR positions. The above operation can be formalized as:
f C A i = C o o r d A t t ( c o n v ( f r g b i ) c o n v ( f t i r i ) ) , i = 3 , 4
where CoordAtt( ) represents the coordinate attention module, conv( ) represents the 2D 1 × 1 convolution, and i is the position where the module is located.
Finally, the coordinate-aware features f C A i are combined with the multiplicative branch f m u l i and passed through a global context module. This secondary activation aggregates long-range semantic cues while retaining local boundary precision, leading to fine-grained fusion of mid-level features f F A M i . The step can be formalized as:
f F A M i = G C ( ( c o n v ( f r g b i ) c o n v ( f t i r i ) ) f C A i ) , i = 3 , 4
where GC( ) represents the global context module.

2.3. Cross-Localization Module (CLM)

To extract high-level features from the deep network and achieve cross-modal accurate spatial localization, inspired by the cross-attention mechanism [44], we elaborately designed the Cross-Localization Module (CLM), the structure of which is shown in Figure 4. The CLM explicitly models the correlation between RGB and TIR image spaces through two stages: cross-layer correlation and salient feature map generation. The result enables the decoder to receive a more discriminative representation of the fused features.
(1)
Cross-layer correlation
As shown in Figure 4, the RGB image features f r g b 5 C × H × W and TIR features f t i r 5 C × H × W are reshaped into f r g b 5 C × N ( N = H × W ) and f t i r 5 C × N ( N = H × W ) , and transpose f r g b 5 to ( f r g b 5 ) T N × C . A learnable weight matrix W c C × C is introduced to transform ( f r g b 5 ) T , enhancing robustness in cross-modal correlation modeling. The inter-modal correlation matrix is then computed via element-wise multiplication:
R = ( r e s h a p e ( f r g b 5 ) ) T W c ( r e s h a p e ( f t i r 5 )
where represents the element-wise multiplication and reshape( ) represents the feature dimension reshaping operation.
(2)
Salient Feature Map Generation
To fuse cross-modal features while highlighting salient regions, we use the softmax function to normalize the inter-modal correlation matrix R along the rows and columns, respectively. Then, the modal-specific weighted features f r g b R 5 C × N and f t i r R 5 C × N are computed by multiplying R with the reshaped RGB and TIR image features f r g b 5 C × N , f t i r 5 C × N , respectively, using the element-wise multiplication. After that, the features f r g b 5 and f t i r 5 are summed to obtain f F u s e 5 C × N , and reshape f F u s e 5 to f F u s e 5 C × H × W . Finally, the residual idea is utilized to sum with the original RGB and TIR features f r g b 5 ,   f t i r 5 and f F u s e 5 to complete the feature localization of the salient region, and the 3 × 3 2D convolution is utilized for feature integration to obtain the fused salient feature f C L M 5 , denoted as:
f C L M 5 = c o n v ( r e s h a p e ( f r g b c 5 f t i r c 5 ) f t i r 5 f r g b 5 )
where conv( ) represents a 2D 3 × 3 convolution.

2.4. Structure of Decoder

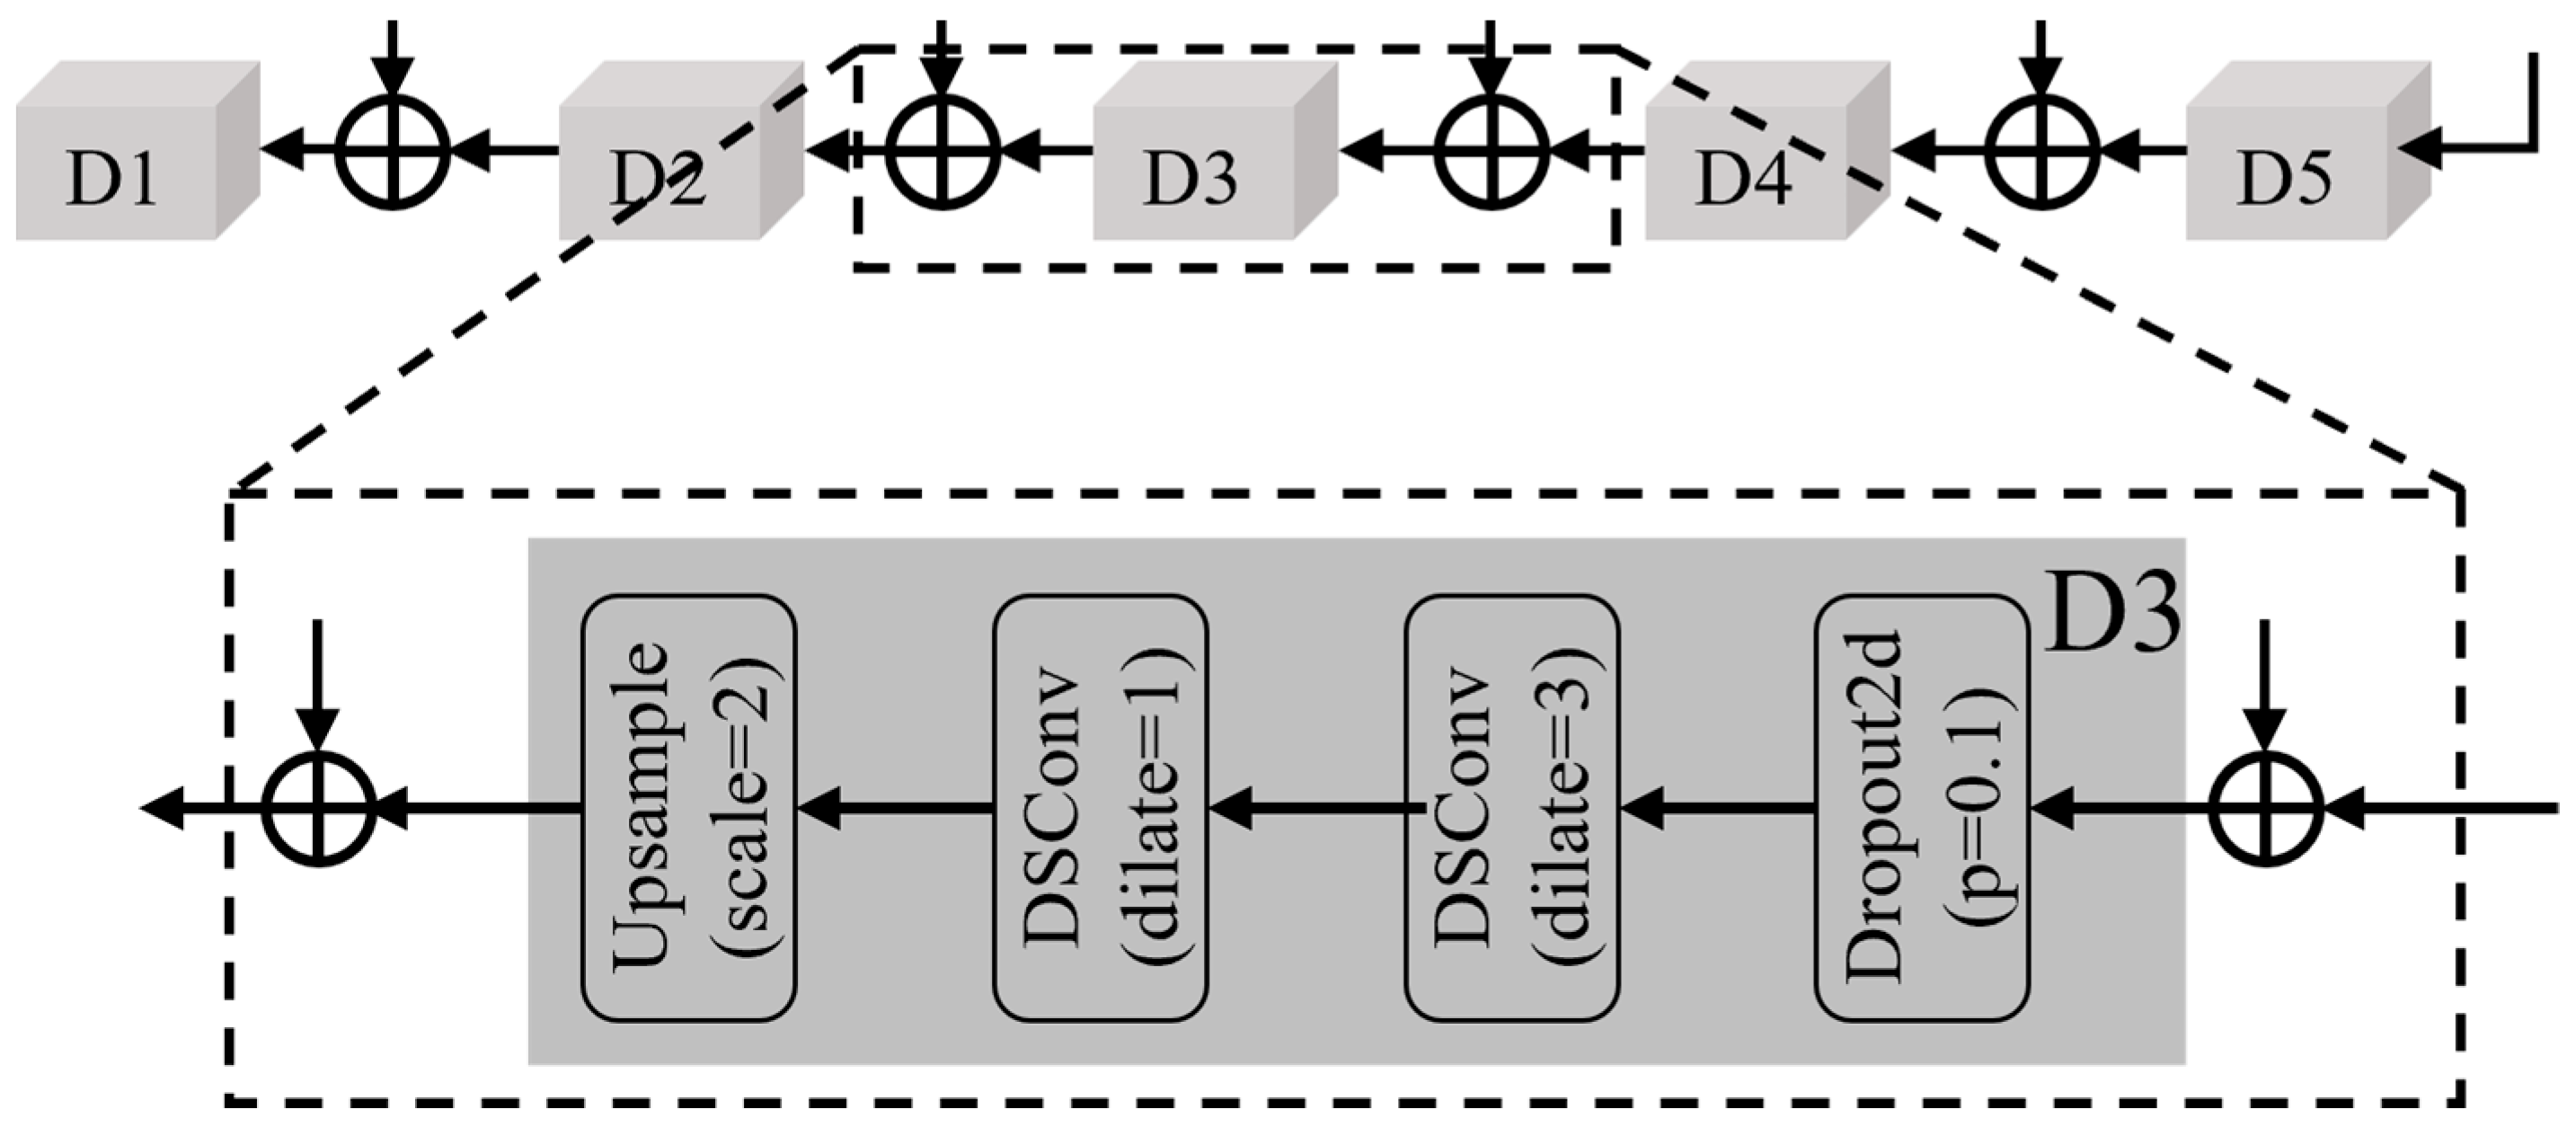
To progressively reconstruct the segmentation map, the proposed BFCNet employs five decoder blocks (D1–D5), corresponding to the five levels of fused features. Taking decoder block D3 as an example (as shown in Figure 5), each decoder block begins with a spatial Dropout layer (p = 0.1) to mitigate overfitting, followed by two depthwise separable convolution layers (DSConv). The first convolution uses a dilated 3 × 3 kernel to expand the receptive field, while the second convolution employs a standard 3 × 3 kernel to enhance feature representation. Finally, each decoder block performs 2× upsampling using bilinear interpolation to gradually restore spatial resolution.
The information flow through the decoders follows a progressive, U-Net-like structure. Specifically, the highest-level fused feature (×5) is processed by D5, and its output is added element-wise to the corresponding lower-level feature (×4) before being fed to D4. This process continues sequentially down to D1, which combines its input with the lowest-level feature (×1) and outputs the final segmentation map through a 3 × 3 convolution layer. This design enables effective integration of multi-level and multi-modal features, while preserving fine-grained spatial details necessary for accurate wildfire segmentation.

2.5. Loss Function

In our network, we use a dual supervision mechanism of semantic supervision and edge supervision. Edge supervision is to compute the loss between the edge prediction value Sedge and the edge truth value GTedge output from the Boundary Enhancement Module (BEM) by a weighted cross-entropy loss function. Semantic supervision is a combination of weighted cross-entropy loss and Lovász-Softmax loss [45] to compute the loss between the semantic predicted value Ssem and the true value GTsem. The final total loss function Ltotal is defined as the sum of the above two supervised losses with the expression:
L t o t a l = l C E ( S e d g e , G T e d g e ) + l C E ( S s e m , G T s e m ) + l L o v a s z ( S s e m , G T s e m )
where lCE represents the cross-entropy loss, lLovasz represents the Lovász-Softmax loss, Sedge and Ssem represent the predicted values of the network, and GTedge and GTsem represent the true values, respectively.

3. Experiments and Analysis

3.1. Experimental Protocol

3.1.1. Dataset

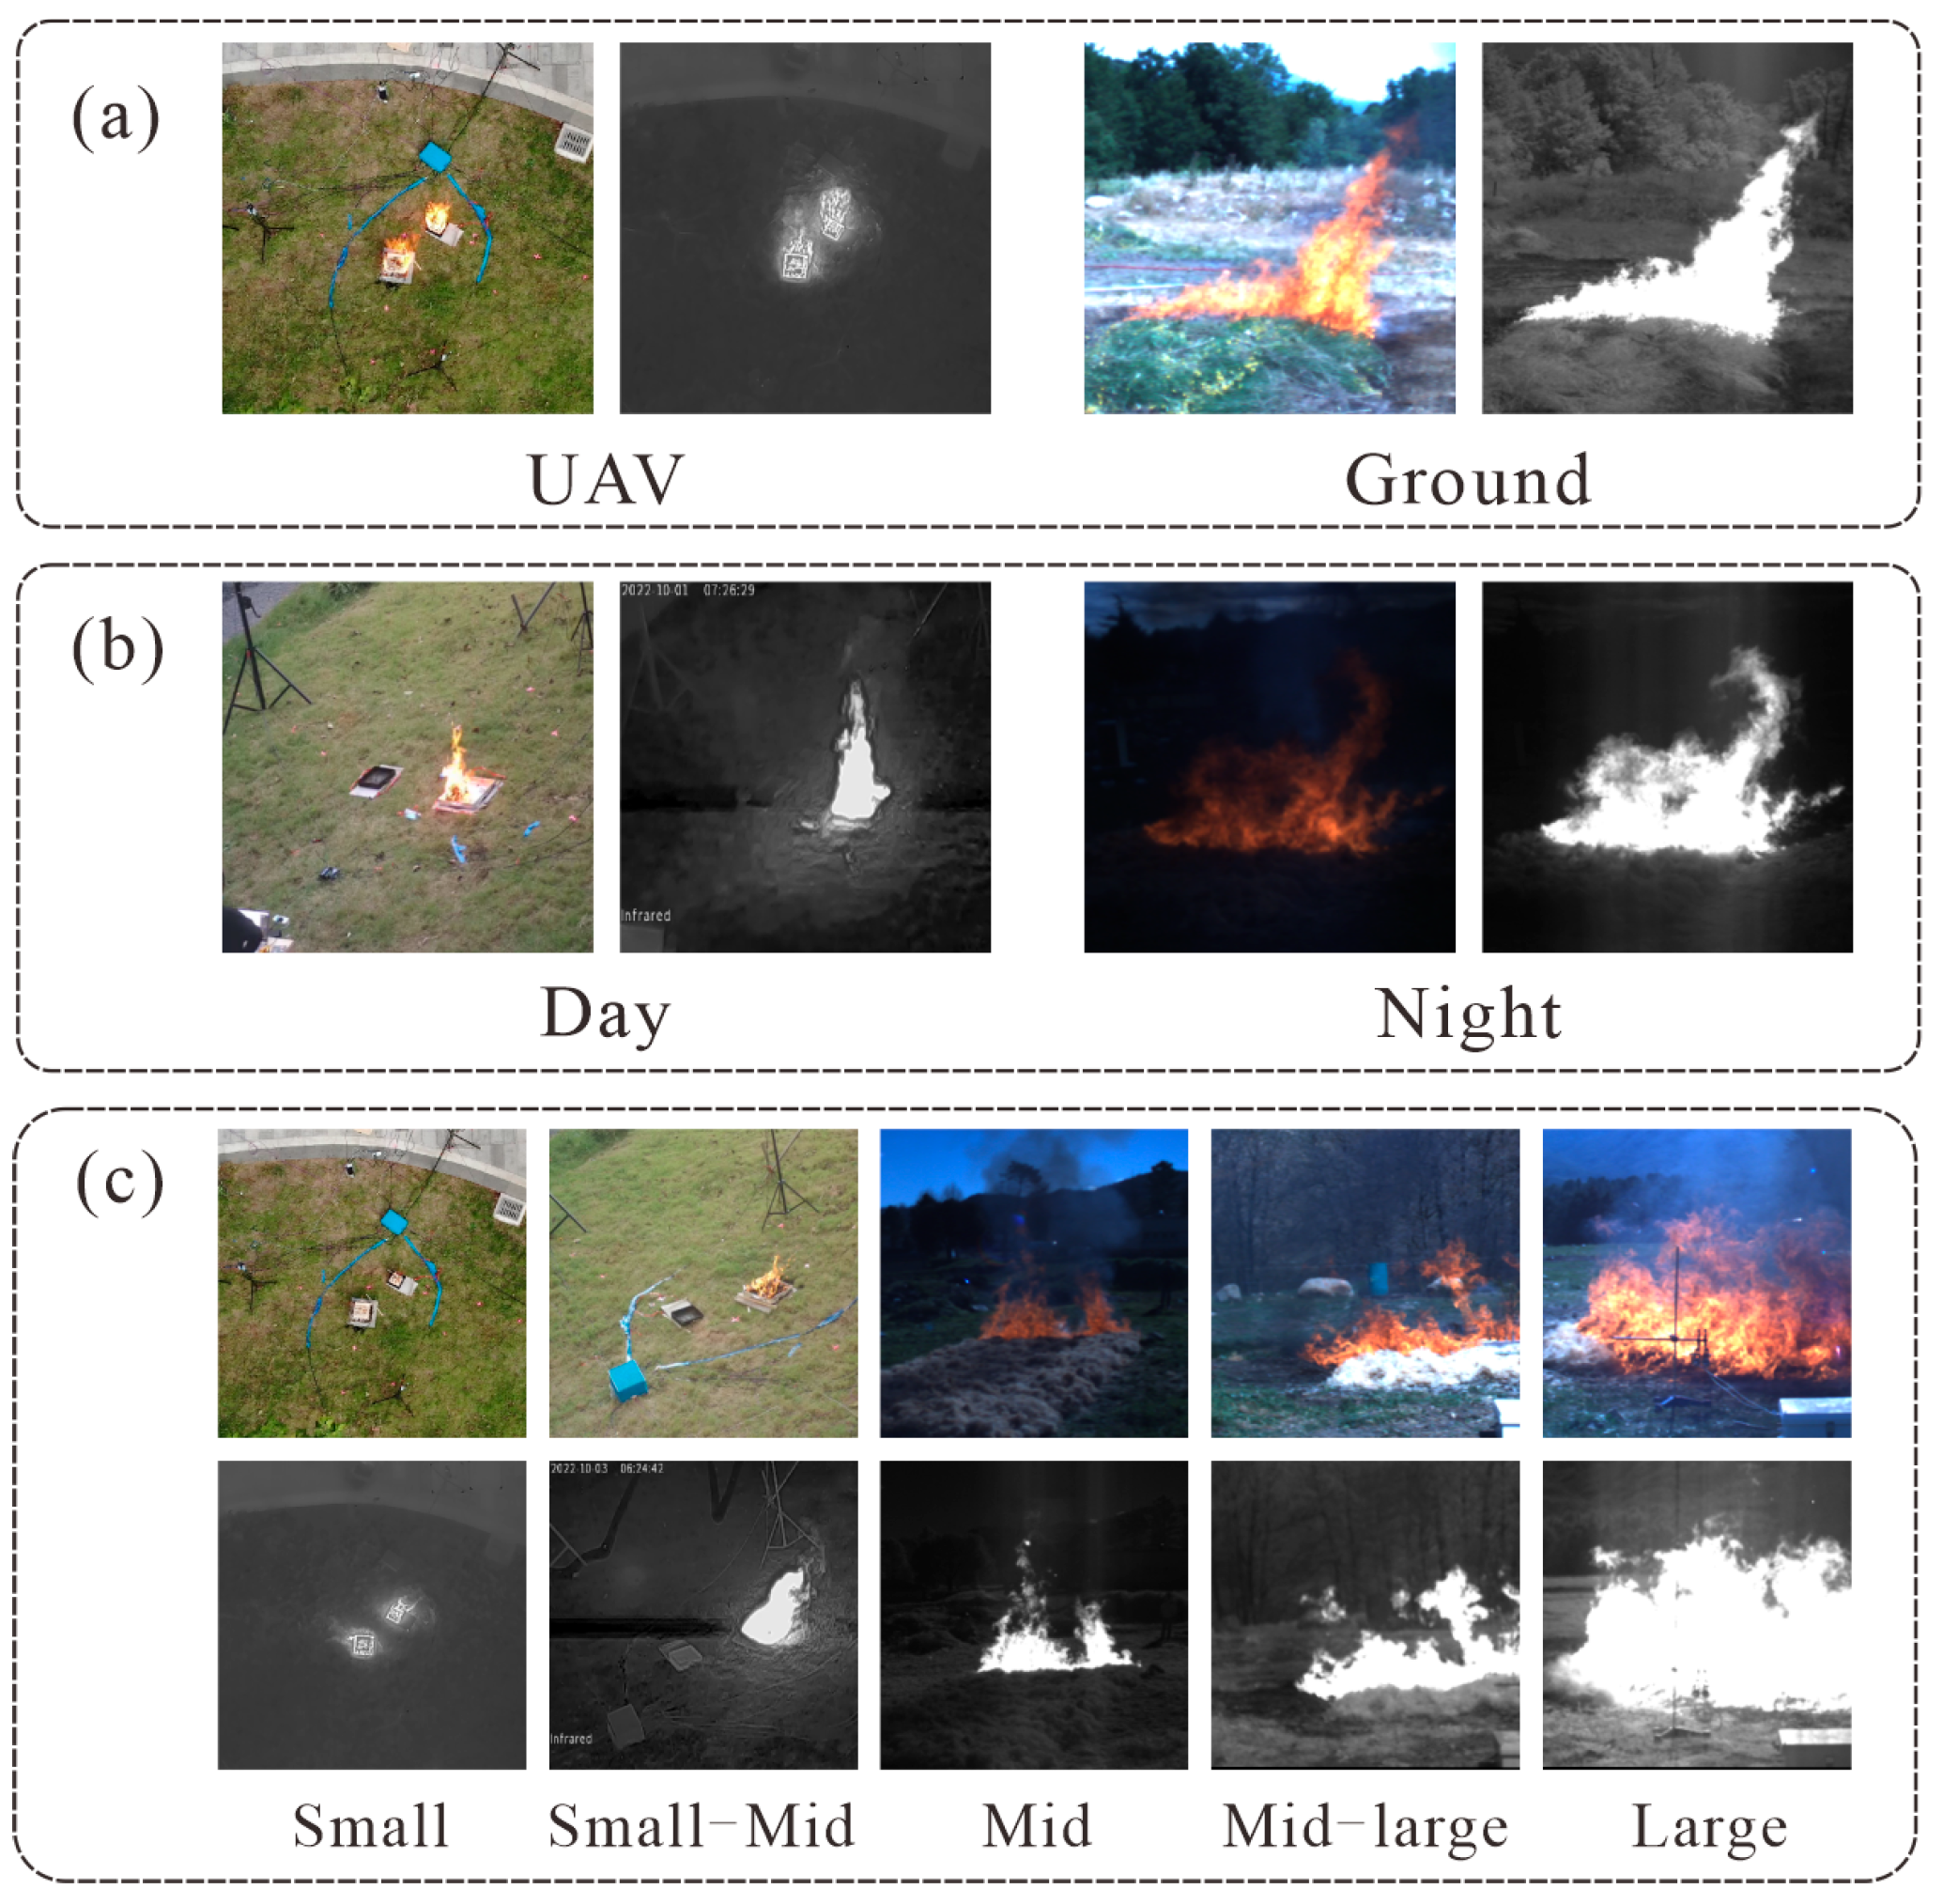
To solve the problem of sample imbalance, this paper fuses the Corsican Fire dataset [16] and the RGB-T dataset [31] constructed by Rui et al. to construct a mixed experimental data, and the dataset is shown in Figure 6. The dataset has a total of 2002 pairs of RGB images and thermal infrared data, and its size is 512 × 512. To systematically evaluate the flame recognition ability of the model, as shown in Table 1, we divided the dataset into three categories for experiments from three dimensions: image source, lighting conditions, and flame type. As shown in Table 1, the data were categorized into UAV and ground-based data based on image source, and into day-time and night-time based on lighting conditions. In addition, the data were categorized into five wildfire categories, small, small-mid, mid, mid-large, and large, based on the ratio of the flame area to the pixel level of the entire image, which corresponded to 0–1%, 1–5%, 5–10%, 10–15%, and 15–100%, respectively.

3.1.2. Evaluation Metrics

To better evaluate the performance of the model, we use two quantitative evaluation metrics: Intersection over Union (IoU) and F1 score (F1). The IoU is used as a direct measure of how well the flame segmentation region matches. And the F1 is used as a comprehensive measure of the model’s accuracy in predicting the flame and its detection ability. The formulas for the accuracy metrics are shown below:
IoU = T P T P + F P + F N
F 1 = 2 P r e c i s i o n R e c a l l P r e c i s i o n + R e c a l l
where TP represents pixels that were correctly predicted as flames, FP represents pixels that incorrectly predicted the background class as flames, FN represents pixels that incorrectly predicted the flame class as background, Precision represents the precision of the model, and Recall represents the recall of the model.

3.1.3. Experimental Details

The proposed BFCNet has been implemented using PyTorch 2.1.0+cu121 (https://pytorch.org; accessed on 20 September 2025) and trained on an NVIDIA RTX 4070 Ti GPU (NVIDIA Corporation, Santa Clara, CA, USA) with 12 GB memory. For the backbone network, we utilized ResNet-50 [46], pre-trained on ImageNet, to perform the initial feature extraction. To increase the dataset size, we employed data augmentation using the Albumentations library (v1.3.0, https://github.com/albumentations-team/albumentations; accessed on 20 September 2025), applying geometric and color transformations to the original images. As a result, the number of images in our dataset was increased to 8008. Our model was trained for 100 epochs with a batch size of 4. During training, we used the Ranger optimizer with a learning rate of 5 × 10⁻⁵ and a weight decay factor of 5 × 10⁻⁴. Additionally, an exponential decay scheme was applied to gradually reduce the learning rate.

3.2. Experimental Results and Comparison

We compare the proposed BFCNet with six multi-modal networks, RTFNet [37], EGFNet [40], LASNet [47], AMLNet [31], MDRNet [48], CAINet [49], and two single-modal networks, UNetRGB and UNetT, using the constructed mixed RGB-T dataset. Among them, UNet-RGB and UNet-T are network models using ResNet-50 as the backbone network and RGB images and TIR images as inputs, respectively. Specifically, the differences between our method and others are summarized in Table 2.
As shown in Table 2, methods such as RTFNet and MDRNet primarily focus on feature superposition or modal variance reduction during the encoding stage. In contrast, BFCNet emphasizes the combination of multi-layer progressive cross-modal fusion with edge-guided mechanisms, ensuring the fusion process incorporates not only semantic features but also spatial boundary information. Methods like EGFNet and CAINet employ complex multi-task supervision, but their edge supervision is often indirect or reliant on traditional operators. However, our BFCNet directly integrates edge supervision into the training process, enhancing edge perception capabilities, particularly suited for scenarios with blurred flame boundaries. While some strong baseline methods (e.g., AMLNet and CAINet) demonstrate competitive performance, their redundant structures and high inference costs limit practical deployment. Our BFCNet achieves a superior balance through a lighter design, unified decoder architecture, and reduced parameters, maintaining competitive performance while making it more suitable for edge computing scenarios. Thus, compared to existing methods, the BFCNet proposed core innovation lies in realizing edge-guided multi-level cross-modal fusion while balancing structural simplicity and practical applicability.
To better evaluate the proposed models, we performed three test tasks in terms of image source, lighting conditions, and flame type, respectively. Detailed descriptions are given below.

3.2.1. Experiments with Image Sources

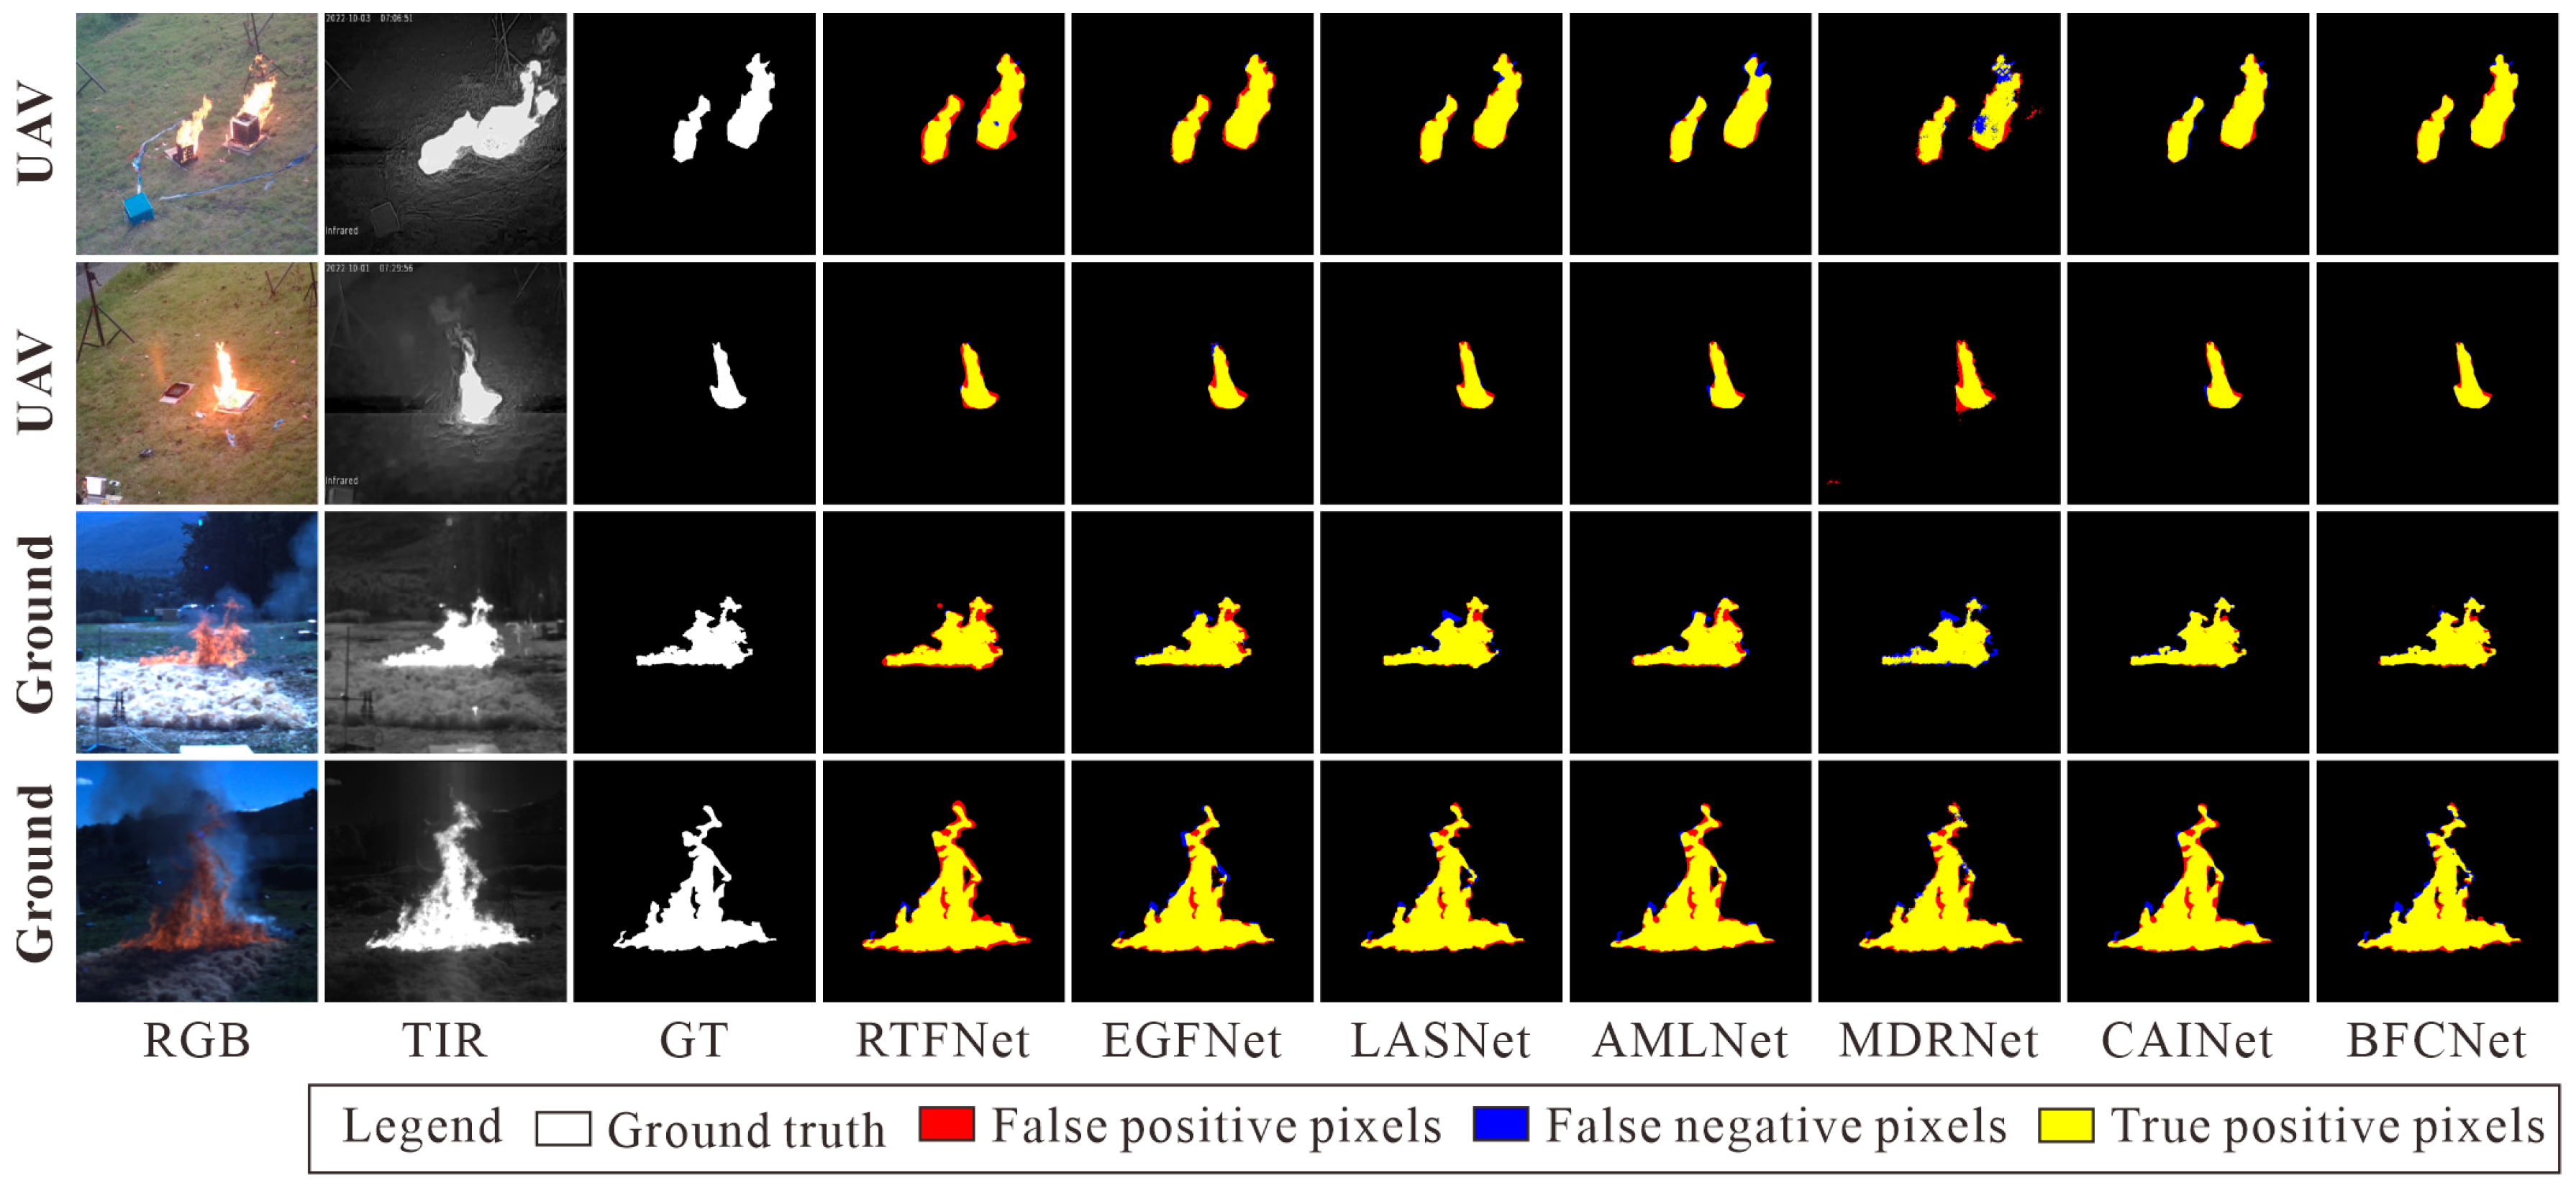
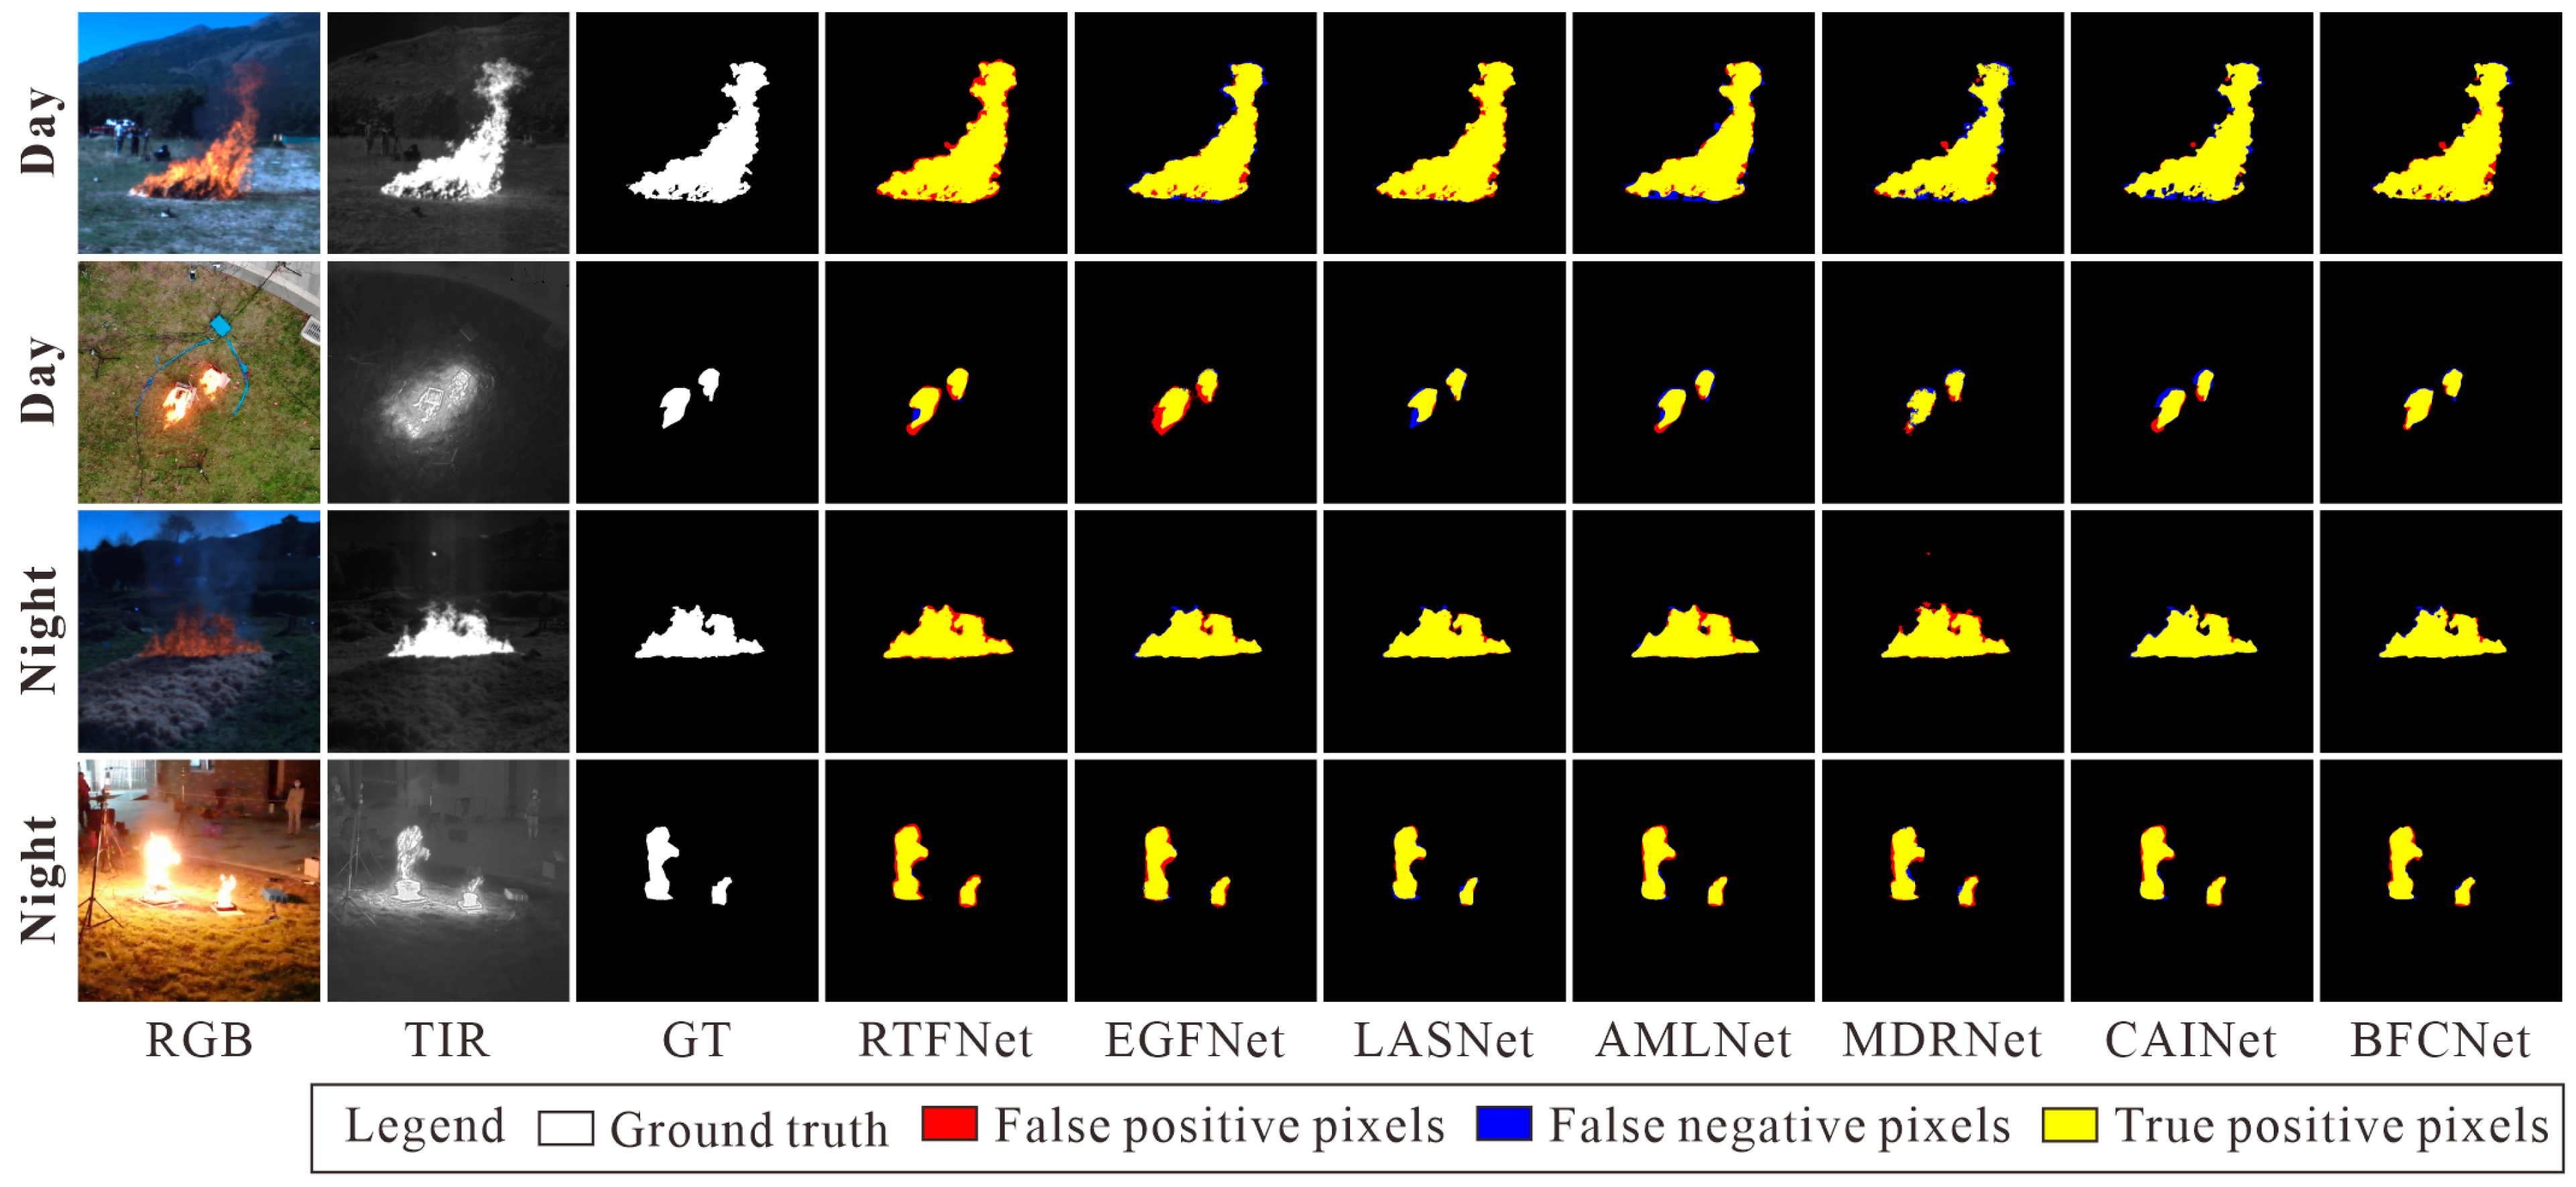
We selected two pairs of UAV data and ground data to show the results, respectively. For the UAV scene, it can be seen from Figure 7 that the BFCNet proposed in this paper can segment the flame well, and there is basically no miss-segmentation (blue-marked) region. In contrast, AMLNet and MDRNet have obvious mis-segmentation, while RTFNet and EGFNet have obvious mis-segmentation (marked in red). For the ground scene, it can be visualized that BFCNet has the best performance. From Figure 7, it can be seen that BFCNet has less mis-segmented regions compared to RTFNet, EGFNet and AMLNet. And compared to LASNet and MDRNet, BFCNet has fewer missed regions, and the segmentation accuracy is significantly better than CAINet.
To better evaluate the performance of the model, Table 3 quantitatively shows the evaluation results of our BFCNet with the comparison model in UAV and ground scenes. In both types of scenes, our BFCNet achieves the highest values in both IoU and F1 metrics. For the UAV scene, our model improves the IoU metric by 1.80% and the F1 score metric by 1.01% compared to CAINet, the model with the second highest accuracy. For the ground scene, our BFCNet achieves better results. Our model improves 1.37% on the IoU metric and 0.74% on the F1 score metric compared to CAINet. The data in Table 3 proves that the multi-modal network performs significantly better than the single-modal network. Quantitative experiments show that BFCNet has optimal performance in both types of scenes.

3.2.2. Experiments with Lighting Conditions

To further evaluate the robustness of the model under different lighting conditions, 2 pairs were selected for analysis, respectively. In the daytime scene, it is obvious from Figure 8 that for larger flames on the ground, AMLNet, MDRNet, and CAINet have miss-segmentation in the region where the flames are in contact with the ground, while our BFCNet has almost no miss-segmentation. For the small target flame in the daytime scene, as shown in the second row of Figure 8, the yellow region in the results of our method is obviously similar to the real label, which indicates the better performance of our BFCNet. In the night scene, it is clear from the third row of Figure 8 that our method gives better results. In addition, under the environment of light interference at night, benefit from the properties of thermal infrared images almost all methods achieve good results.
Further, as can be seen from the data in Table 4, our method reaches the optimal values in both IoU and F1 metrics in the daytime scene. Compared to the CAINet model, which ranks second in accuracy, our BFCNet improves the IoU metric by 1.3% and the F1 score by 0.7%. In the night scene, although CAINet performs better, there is only a slight difference in our BFCNet: the IoU metric is 0.3% lower and the F1 score is 0.16% lower. Overall, the experiments show that BFCNet maintains robust performance under different lighting conditions.

3.2.3. Experiments with Flame Type

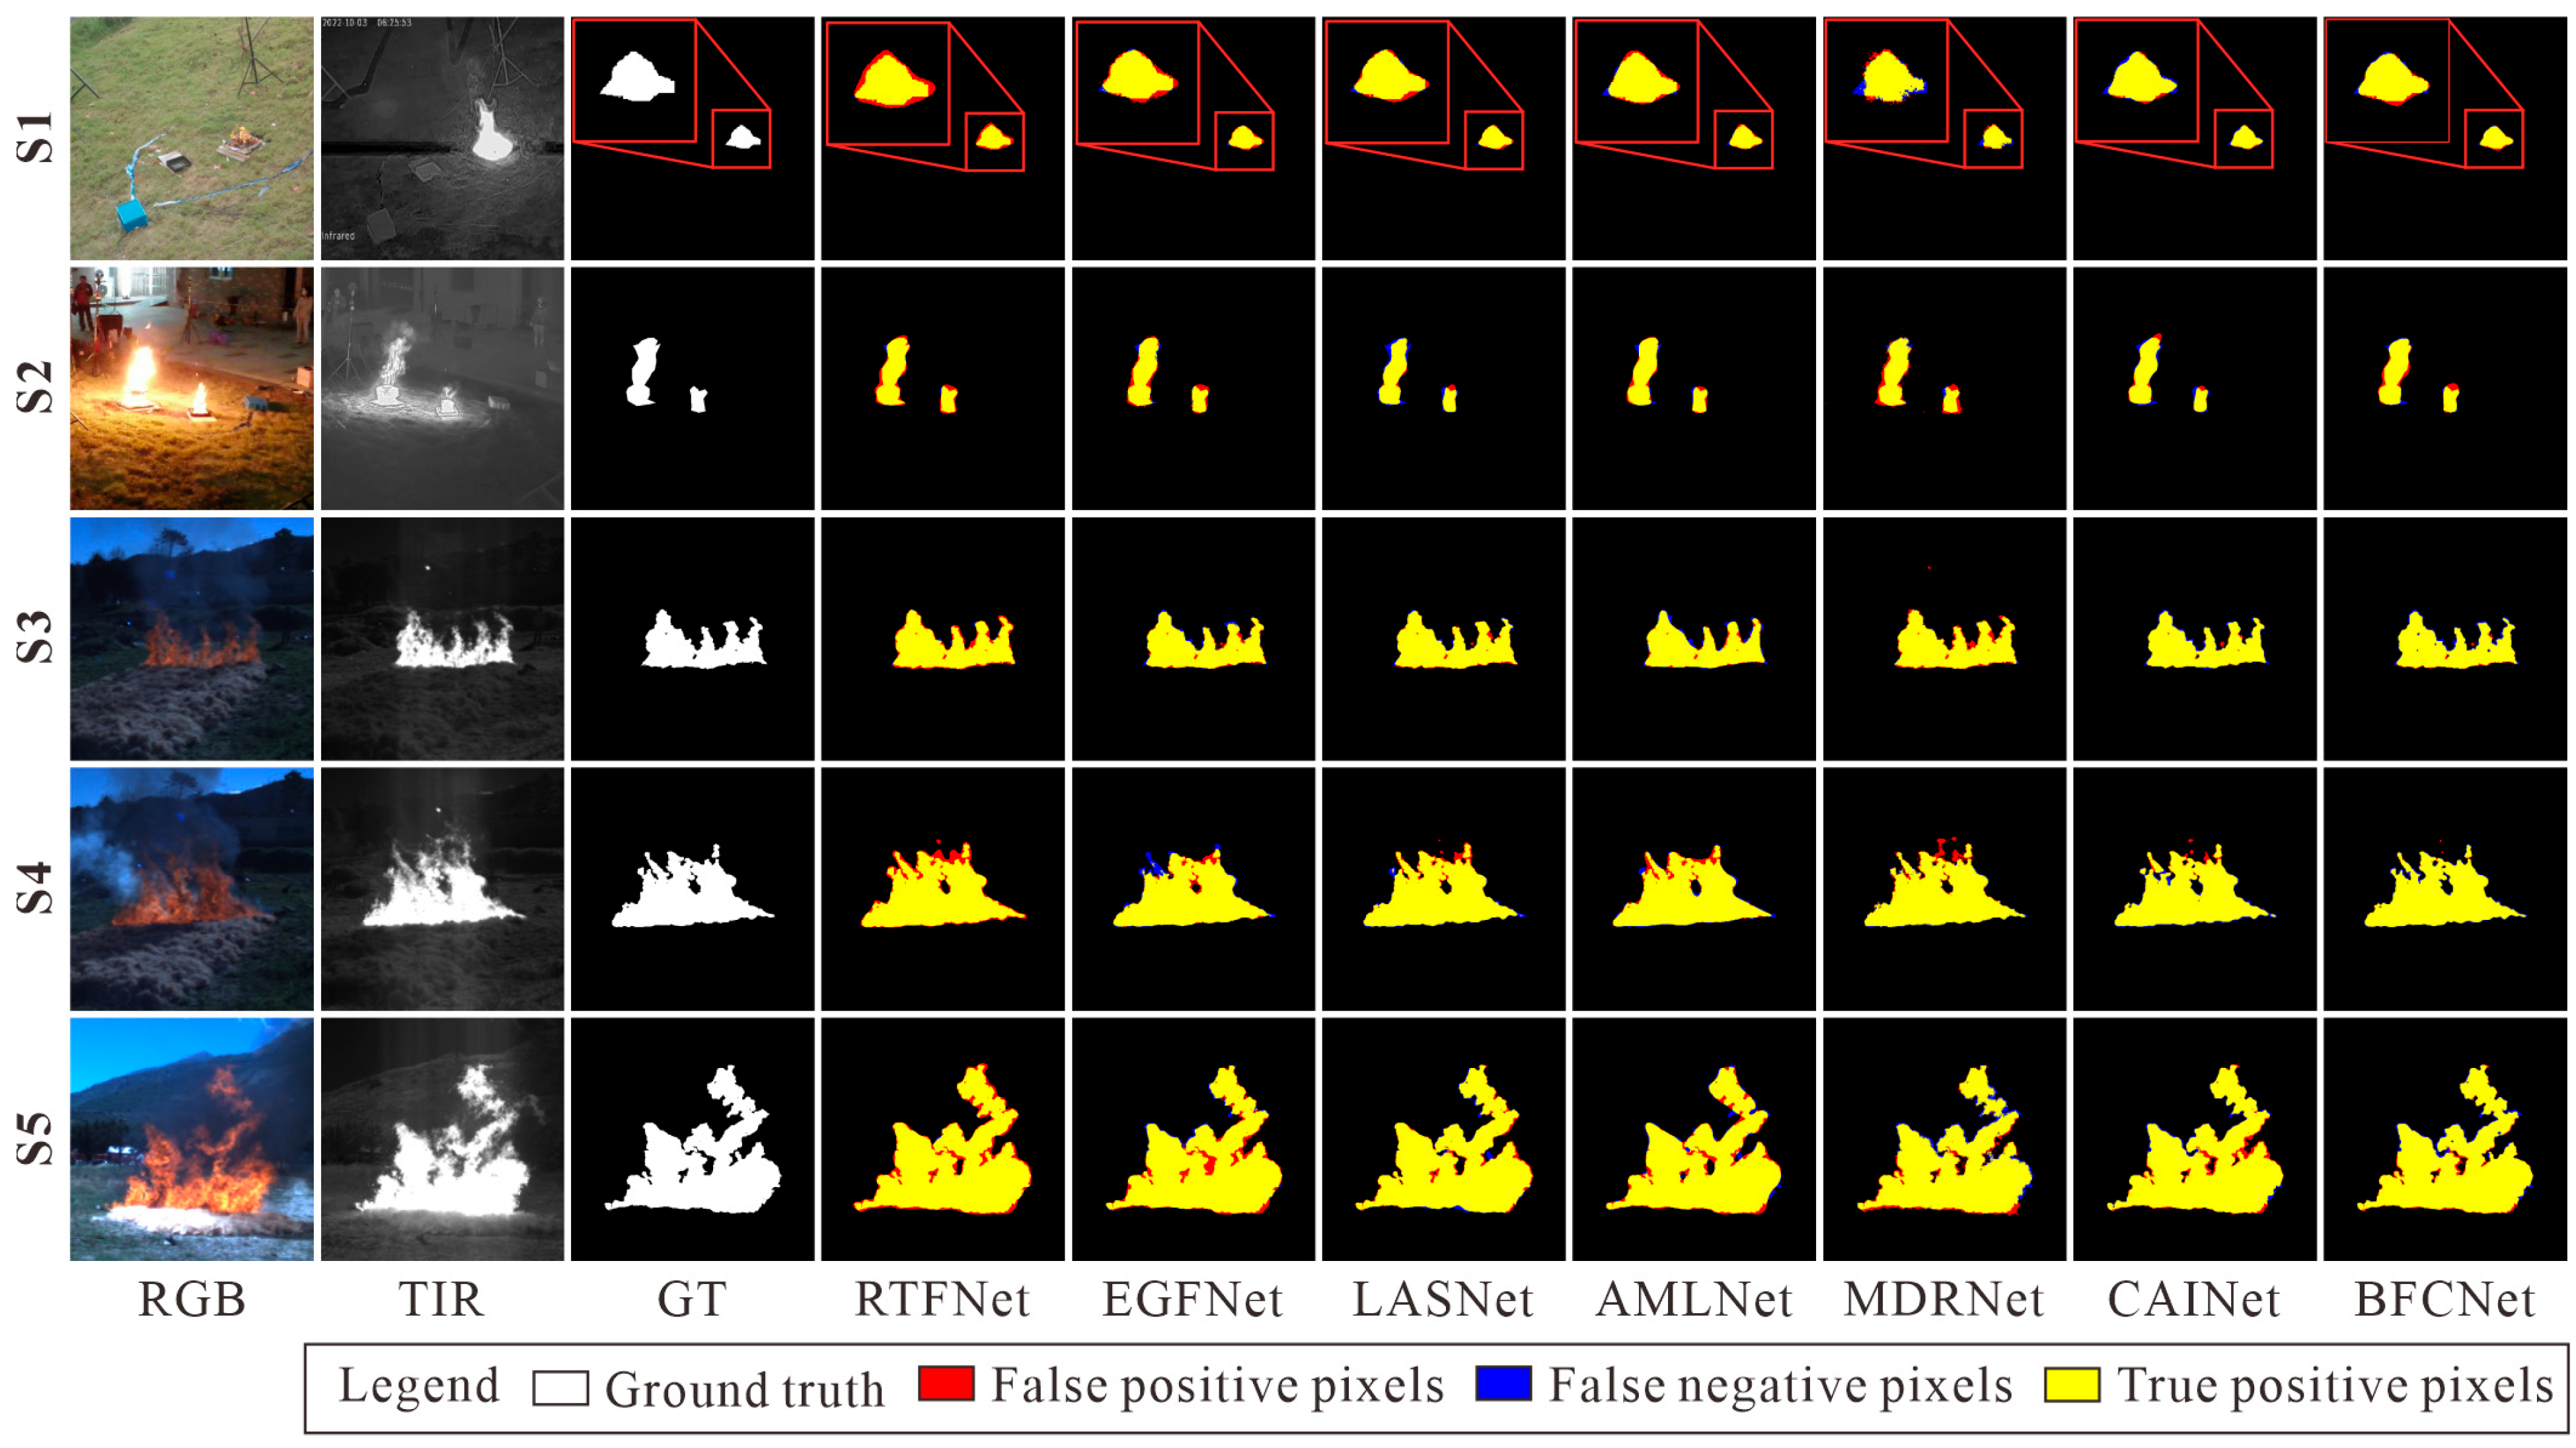
To further evaluate the segmentation ability of the model in different sizes of flames, five pairs of flame type data of different sizes are selected for evaluation in this paper. As can be seen from Figure 9, for small flames (S1) and small-mid flames (S2), the segmentation results of our BFCNet are much better, with no miss segmentation and only a small number of mis-segmented regions. For medium flames (S3) and medium-large flames (S4), all models achieve good results. However, our BFCNet has better segmentation results at the boundary, with only minor mis-segregation inside the flame, benefiting from the boundary supervision we introduced. For the large flame (S5), the BFCNet of this paper has better segmentation in the boundary region, and only the model of this paper has no mis-segmentation at the end of the flame.
Similarly, as shown in Table 5, the BFCNet proposed in this paper has the highest scores on small (S1), small-medium (S2) and large (S5) flames. And compared to the second ranked model CAINet, our method improves the IoU metrics by 1.01%, 1.54%, and 0.67%, and the F1 score metrics by 0.59%, 0.85%, and 0.34%, respectively. For medium (S3) flames, CAINet achieves the highest scores, but our BFCNet has a tiny difference with only 0.41% lower IoU metrics and 0.22% lower F1 scores. In addition, visually our BFCNet and CAINet have similar segmentation effects, and CAINet has a slight advantage in the segmentation accuracy of some internal regions of the flame. For medium-large (S4) flames, there is only a slight difference between BFCNet and CAINet, with the IoU and F1 scores differing by 0.05 and 0.03, respectively. Overall, for different flame types, BFCNet in this paper is able to achieve better results and significantly improve the segmentation accuracy at the edge of the flame.

3.3. Ablation Study

To verify the validity of the model proposed in this paper, we conducted the ablation experiments for the BEMs, FAMs, and CLMs, as well as the ablation experiments for the internal components of each module. The specific design and implementation details of the ablation experiments are described in the following.

3.3.1. Ablation of the Modules

To verify the effectiveness of each module in BFCNet, seven sets of module ablation experiments are conducted in this paper, and the results are shown in Table 6. As can be seen from No. 1 in Table 6, the segmentation accuracy of Baseline is 83.57%, which is 5.6% lower than that of our BFCNet, indicating that the three modules proposed in this paper can improve the segmentation accuracy. Secondly, we provide three variants of networks (No. 2–4) to evaluate the contribution of individual modules to the model, where the unadded modules are utilized instead of addition. As shown in Table 2, Table 3 and Table 4, all three modules obtain higher IoU values than the basic module, and a single module improves the accuracy of the network by a minimum of 2.4% and a maximum of 3.4%. Finally, as shown in Table 5, Table 6 and Table 7, we also provide three variants to evaluate the joint contribution of the three modules, which are again validated by two-by-two cooperation. The above analysis shows that our proposed modules are effective and can improve the segmentation performance of the model.

3.3.2. Ablation of the Components in Modules

To better validate the effectiveness of the parts in each module, we provided three variants for each module.
The three variants of the BEM encompass (1) removing the combination of summation features (w/o sum); (2) removal of multiplicative feature combinations (w/o mul); and (3) replacement of multi-scale feature fusion with ordinary convolution (w/o MSFE), where MSFE is multi-scale convolution. From Table 6, it can be seen that the IoU values of w/o sum and w/o mul are lower than that of the full BFCNet, which indicates that the information obtained from the RGB image and TIR image by utilizing only one combination of features (summative or multiplicative) is insufficient and results in a degradation of the model’s performance. In addition, utilizing ordinary convolution instead of multi-scale convolutional fusion also leads to a decrease in model performance.
The three variants of the FAM are (1) removal of additive feature combination (w/o sum), (2) removal of coordinate attention mechanism (w/o CA), and (3) removal of global context module (w/o GC). From Table 7, it can be found that the CA module can better fuse and understand the features at each location in both images, and the model performance is reduced after removal. For w/o GC, the global context module is located at the end of the FAM, which is responsible for the activation of the feature fine regions. The model’s performance is more affected after removing the GC module. In the FAM, since the element-wise multiplication is located at the front end of the module, the network can obtain more compact feature information, which facilitates the activation of regions. Therefore, removing the element-wise multiplication has the greatest impact on the model performance, which is reduced by 3.4%.
In the CLM, we first verified the contribution of the linear transformation layer (w/o Linear) to feature matching. As can be seen in Table 7, this component has the greatest impact on the model performance, which is 85.44% after removal. Then, the necessity of the two-way attention mechanism (w/o Att) is verified, and the experimental results show that using only a single attention is not sufficient for feature matching. Finally, the role of residual connection (w/o Residual) is verified, and the experimental results show that the use of residual connection can maintain the stability of training and prevent information loss.

3.4. Inference Time and Model Size

To further evaluate the efficiency and deployability of the proposed method, we conducted a comparative analysis of the computational complexity and parameter scale of several RGB-T segmentation models on an NVIDIA RTX 4070Ti platform, with the input image resolution set to 512 × 512.
As shown in Table 8, our BFCNet achieves superior efficiency while maintaining high segmentation accuracy, requiring only 121.79 GFLOPs and 41.52 M parameters. Compared with large-scale models such as MDRNet, our BFCNet significantly reduces computational demands. Meanwhile, in contrast to the lightest CAINet (12.16 M), our BFCNet attains better segmentation performance while keeping a relatively small model size. Overall, these results demonstrate that BFCNet achieves a favorable trade-off between accuracy and computational cost, making it more suitable for resource-constrained or real-time wildfire monitoring scenarios.

4. Discussion

In this paper, a multimodal wildfire semantic segmentation network is proposed by taking full advantage of RGB and TIR images. Our network is designed with three modules, Boundary Enhancement Module (BEM), Fusion Activation Module (FAM), and Cross-Localization Module (CLM), to deal with different layers of features. The BEM is used to extract valuable information from multimodal low-level features, and the introduction of edge supervision in the module improves the network model’s ability to perceive boundaries. The FAM is used to smooth the features, suppress the background interference and further highlight the exact region of the flame in the multimodal features. The CLM is capable of deeply fusing features from RGB and TIR images to achieve accurate spatial localization of segmented regions from multimodal high-level features. To verify the necessity of these three modules, we demonstrate in the ablation experiments in Section 3.3 that these three modules can enhance the performance of the network.
To address the challenges of small targets that are difficult to recognize and light sources that interfere with wildfire recognition in practical applications, as described in Section 3.2, our proposed BFCNet is also able to achieve good results in complex environments. For the UAV small target scene, as shown in Figure 7, the segmentation accuracy of our method is significantly better than the comparison method. For scenes with strong light interference at night, as shown in Figure 8 our method maintains strong robustness. It is obvious from the experimental results of medium-large (S4) and large (S5) in Figure 9 that our method’s boundary segmentation results are satisfactory, which is benefited from boundary supervision. However, there are missed and misidentified pixels near the edges of the compared methods. In addition, it is illustrated from Table 2, Table 3 and Table 4 that our experimental results demonstrate that the performance of using multi-modal networks is significantly better than the single-modal network performance.
These findings demonstrate the effectiveness of edge-guided multi-level feature fusion in multimodal deep learning for wildfire segmentation. The proposed framework exhibits robust practical performance when addressing real-world challenges such as small object detection, lighting variations, and complex fire scene environments. However, due to the difficulty of pixel-level annotation under smoke occlusion conditions, the current study scenario only includes limited smoke coverage, indicating an important direction for future research. Subsequent research will focus on integrating more comprehensive datasets encompassing diverse smoke scenarios with varying densities and distributions. Concurrently, advanced learning strategies such as synthetic data generation, semi-supervised labeling, or multimodal feature augmentation hold promise for overcoming recognition bottlenecks under smoke-obscured conditions. These efforts will advance the development of more robust wildfire segmentation tasks, particularly in complex real-world environments where smoke frequently obscures fire areas.

5. Conclusions

In this paper, we propose an edge-guided multi-level wildfire semantic segmentation network for accurate wildfire identification tasks. The network framework innovatively designs three modules, the Boundary Enhancement Module (BEM), Fusion Activation Module (FAM), and Cross- Localization Module (CLM), and utilizes them for deep fusion of RGB and TIR image features at different levels. Meanwhile, the edge supervision mechanism is introduced into the wildfire semantic segmentation domain for the first time, which significantly improves the network’s ability to perceive the fire boundary.
To evaluate the effectiveness of the proposed approach, we constructed a multi-scale flame segmentation dataset and conducted experiments under varying data sources, lighting conditions, and five flame size categories ranging from small to large. Experimental results demonstrate that BFCNet outperforms existing models across all tasks, achieving an IoU of 88.25% and an F1 score of 93.76% on the dataset, surpassing both single-modality and existing multimodal methods. Moreover, the multimodal design effectively integrates complementary information from RGB and TIR images, providing a significant advantage in wildfire identification accuracy. These results indicate that the proposed method offers practical significance for wildfire monitoring.

Author Contributions

Conceptualization, T.Y.; methodology, B.S.; software, Q.W.; validation, B.S.; formal analysis, H.H.; investigation, H.H. and Y.C.; resources, Q.W.; data curation, H.H.; writing—original draft, B.S. and H.H.; writing—review and editing, H.H.; visualization, H.H.; supervision, T.Y.; project administration, Y.C.; funding acquisition, T.Y. and B.S. All authors have read and agreed to the published version of the manuscript.

Funding

This research was funded by the Guangxi Science and Technology Project (grants No. Guike AB25069093) and partly by the National Natural Science Foundation of China (General Program, Grant No.21976043).

Institutional Review Board Statement

Not applicable.

Informed Consent Statement

Not applicable.

Data Availability Statement

The data presented in this study are available on request from the corresponding author. The data are not publicly available due to privacy.

Acknowledgments

The authors would like to thank Lucile Rossi and colleagues at the University of Corsica for providing the Corsica Fire dataset, and Rui at the University of Science and Technology of China for sharing the RGB-T Wildfire dataset. Without their data contributions, this study would not have been possible. We also deeply appreciate the comprehensive support provided by three research platforms of Guilin University of Technology: the Guangxi Guilin Observation and Research Station of Agricultural Water, Soil Resources and Environment, the Collaborative Innovation Center for Water Pollution Control and Water Safety in Karst Area, and the Guilin Lijiang River Ecology and Environment Observation and Research Station of Guangxi. Their excellent laboratory facilities, long-term monitoring data, and on-site technical assistance were indispensable to the successful completion of this study. Finally, we sincerely thank the anonymous reviewers for their valuable time and insightful comments on this manuscript.

Conflicts of Interest

The authors declare no conflicts of interest.

References

  1. Akhloufi, M.A.; Couturier, A.; Castro, N.A. Unmanned aerial vehicles for wildland fires: Sensing, perception, cooperation and assistance. Drones 2021, 5, 15. [Google Scholar] [CrossRef]
  2. Rajoli, H.; Khoshdel, S.; Afghah, F.; Ma, X. FlameFinder: Illuminating Obscured Fire Through Smoke with Attentive Deep Metric Learning. IEEE Trans. Geosci. Remote Sens. 2024, 62, 3440880. [Google Scholar] [CrossRef]
  3. Sun, Y.; Jiang, L.; Pan, J.; Sheng, S.; Hao, L. A satellite imagery smoke detection framework based on the Mahalanobis distance for early fire identification and positioning. Int. J. Appl. Earth Obs. Geoinf. 2023, 118, 103257. [Google Scholar] [CrossRef]
  4. Wang, M.; Yu, D.; He, W.; Yue, P.; Liang, Z. Domain-incremental learning for fire detection in space-air-ground integrated observation network. Int. J. Appl. Earth Obs. Geoinf. 2023, 118, 103279. [Google Scholar] [CrossRef]
  5. Shamsoshoara, A.; Afghah, F.; Razi, A.; Zheng, L.; Fulé, P.Z.; Blasch, E. Aerial imagery pile burn detection using deep learning: The FLAME dataset. Comput. Netw. 2021, 193, 108001. [Google Scholar] [CrossRef]
  6. Dimitropoulos, K.; Barmpoutis, P.; Grammalidis, N. Spatio-temporal flame modeling and dynamic texture analysis for automatic video-based fire detection. IEEE Trans. Circuits Syst. Video Technol. 2014, 25, 339–351. [Google Scholar] [CrossRef]
  7. Dimitropoulos, K.; Barmpoutis, P.; Grammalidis, N. Higher order linear dynamical systems for smoke detection in video surveillance applications. IEEE Trans. Circuits Syst. Video Technol. 2016, 27, 1143–1154. [Google Scholar] [CrossRef]
  8. Dimitropoulos, K.; Barmpoutis, P.; Kitsikidis, A.; Grammalidis, N. Classification of multidimensional time-evolving data using histograms of grassmannian points. IEEE Trans. Circuits Syst. Video Technol. 2016, 28, 892–905. [Google Scholar] [CrossRef]
  9. Chen, J.; He, Y.; Wang, J. Multi-feature fusion based fast video flame detection. Build. Environ. 2010, 45, 1113–1122. [Google Scholar] [CrossRef]
  10. Mueller, M.; Karasev, P.; Kolesov, I.; Tannenbaum, A. Optical flow estimation for flame detection in videos. IEEE Trans. Image Process. 2013, 22, 2786–2797. [Google Scholar] [CrossRef]
  11. Zhang, Z.; Shen, T.; Zou, J. An improved probabilistic approach for fire detection in videos. Fire Technol. 2014, 50, 745–752. [Google Scholar] [CrossRef]
  12. Marbach, G.; Loepfe, M.; Brupbacher, T. An image processing technique for fire detection in video images. Fire Saf. J. 2006, 41, 285–289. [Google Scholar] [CrossRef]
  13. Töreyin, B.U.; Dedeoğlu, Y.; Güdükbay, U.; Çetin, A.E. Computer vision based method for real-time fire and flame detection. Pattern Recognit. Lett. 2006, 27, 49–58. [Google Scholar] [CrossRef]
  14. Celik, T.; Demirel, H. Fire detection in video sequences using a generic color model. Fire Saf. J. 2009, 44, 147–158. [Google Scholar] [CrossRef]
  15. Emmy Prema, C.; Vinsley, S.S.; Suresh, S. Efficient flame detection based on static and dynamic texture analysis in forest fire detection. Fire Technol. 2018, 54, 255–288. [Google Scholar] [CrossRef]
  16. Toulouse, T.; Rossi, L.; Campana, A.; Celik, T.; Akhloufi, M.A. Computer vision for wildfire research: An evolving image dataset for processing and analysis. Fire Saf. J. 2017, 92, 188–194. [Google Scholar] [CrossRef]
  17. Schmidhuber, J. Deep learning in neural networks: An overview. Neural Netw. 2015, 61, 85–117. [Google Scholar] [CrossRef] [PubMed]
  18. Bouguettaya, A.; Zarzour, H.; Taberkit, A.M.; Kechida, A. A review on early wildfire detection from unmanned aerial vehicles using deep learning-based computer vision algorithms. Signal Process. 2022, 190, 108309. [Google Scholar] [CrossRef]
  19. Barmpoutis, P.; Papaioannou, P.; Dimitropoulos, K.; Grammalidis, N. A review on early forest fire detection systems using optical remote sensing. Sensors 2020, 20, 6442. [Google Scholar] [CrossRef]
  20. Martínez-de Dios, J.R.; Merino, L.; Ollero, A. Fire detection using autonomous aerial vehicles with infrared and visual cameras. IFAC Proc. Vol. 2005, 38, 660–665. [Google Scholar] [CrossRef]
  21. Rossi, L.; Toulouse, T.; Akhloufi, M.; Pieri, A.; Tison, Y. Estimation of spreading fire geometrical characteristics using near infrared stereovision. In Proceedings of the Three-Dimensional Image Processing (3DIP) and Applications, Burlingame, CA, USA, 12 March 2013; Volume 8650, pp. 65–72. [Google Scholar]
  22. Lu, Y.; Wu, Y.; Liu, B.; Zhang, T.; Li, B.; Chu, Q.; Yu, N. Cross-modality person reidentification with shared-specific feature transfer. In Proceedings of the IEEE/CVF Conference on Computer Vision and Pattern Recognition (CVPR), Seattle, WA, USA, 13–19 June 2020; pp. 13379–13389. [Google Scholar]
  23. Zhao, Y.; Ma, J.; Li, X.; Zhang, J. Saliency detection and deep learning-based wildfire identification in UAV imagery. Sensors 2018, 18, 712. [Google Scholar] [CrossRef]
  24. Barmpoutis, P.; Stathaki, T.; Dimitropoulos, K.; Grammalidis, N. Early fire detection based on aerial 360-degree sensors, deep convolution neural networks and exploitation of fire dynamic textures. Remote Sens. 2020, 12, 3177. [Google Scholar] [CrossRef]
  25. Tsalera, E.; Papadakis, A.; Voyiatzis, I.; Samarakou, M. CNN-based, contextualized, real-time fire detection in computational resource-constrained environments. Energy Rep. 2023, 9, 247–257. [Google Scholar] [CrossRef]
  26. Shirvani, Z.; Abdi, O.; Goodman, R.C. High-resolution semantic segmentation of woodland fires using residual attention UNet and time series of Sentinel-2. Remote Sens. 2023, 15, 1342. [Google Scholar] [CrossRef]
  27. de Almeida Pereira, G.H.; Fusioka, A.M.; Nassu, B.T.; Minetto, R. Active fire detection in Landsat-8 imagery: A large-scale dataset and a deep-learning study. ISPRS J. Photogramm. Remote Sens. 2021, 178, 171–186. [Google Scholar] [CrossRef]
  28. Hu, X.; Jiang, F.; Qin, X.; Huang, S.; Yang, X.; Meng, F. An optimized smoke segmentation method for forest and grassland fire based on the UNet framework. Fire 2024, 7, 68. [Google Scholar] [CrossRef]
  29. Fahim-Ul-Islam, M.; Tabassum, N.; Chakrabarty, A.; Aziz, S.M.; Shirmohammadi, M.; Khonsari, N.; Kwon, H.-H.; Piran, J. Wildfire Detection Powered by Involutional Neural Network and Multi-Task Learning with Dark Channel Prior Technique. IEEE J. Sel. Top. Appl. Earth Obs. Remote Sens. 2024, 17, 19095–19114. [Google Scholar] [CrossRef]
  30. Zhou, T.; Fu, H.; Chen, G.; Zhou, Y.; Fan, D.-P.; Shao, L. Specificity-preserving RGB-D saliency detection. In Proceedings of the IEEE/CVF International Conference on Computer Vision (CVPR), Nashville, TN, USA, 20–25 June 2021; pp. 4681–4691. [Google Scholar]
  31. Rui, X.; Li, Z.; Zhang, X.; Li, Z.; Song, W. A RGB-Thermal based adaptive modality learning network for day–night wildfire identification. Int. J. Appl. Earth Obs. Geoinf. 2023, 125, 103554. [Google Scholar] [CrossRef]
  32. Safder, Q.; Zhou, F.; Zheng, Z.; Xia, J.; Ma, Y.; Wu, B.; Zhu, M.; He, Y.; Jiang, L. BA_EnCaps: Dense capsule architecture for thermal scrutiny. IEEE Trans. Geosci. Remote Sens. 2022, 60, 1–11. [Google Scholar] [CrossRef]
  33. Li, H.; Chu, H.K.; Sun, Y. Improving RGB-Thermal Semantic Scene Understanding with Synthetic Data Augmentation for Autonomous Driving. IEEE Robot. Autom. Lett. 2025, 10, 4452–4459. [Google Scholar] [CrossRef]
  34. Wang, Y.; Chu, H.K.; Sun, Y. PEAFusion: Parameter-efficient Adaptation for RGB-Thermal fusion-based semantic segmentation. Inf. Fusion 2025, 120, 103030. [Google Scholar] [CrossRef]
  35. Li, X.; Chen, S.; Tian, C.; Zhou, H.; Zhang, Z. M2FNet: Mask-Guided Multi-Level Fusion for RGB-T Pedestrian Detection. IEEE Trans. Multimed. 2024, 26, 8678–8690. [Google Scholar] [CrossRef]
  36. Zhao, H.; Zhang, L. Dual-stream siamese network for RGB-T dual-modal fusion object tracking on UAV. J. Supercomput. 2025, 81, 1–22. [Google Scholar] [CrossRef]
  37. Sun, Y.; Zuo, W.; Liu, M. RTFNet: RGB-thermal fusion network for semantic segmentation of urban scenes. IEEE Robot. Autom. Lett. 2019, 4, 2576–2583. [Google Scholar] [CrossRef]
  38. Deng, F.; Feng, H.; Liang, M.; Wang, H.; Yang, Y.; Gao, Y.; Chen, J.; Hu, J.; Guo, X.; Lam, T.L. FEANet: Feature-enhanced attention network for RGB-thermal real-time semantic segmentation. In Proceedings of the 2021 IEEE/RSJ international conference on intelligent robots and systems (IROS), Prague, Czech Republic, 27 September–1 October 2021; pp. 4467–4473. [Google Scholar]
  39. Zhou, W.; Liu, J.; Lei, J.; Yu, L.; Hwang, J.-N. GMNet: Graded-feature multilabel-learning network for RGB-thermal urban scene semantic segmentation. IEEE Trans. Image Process. 2021, 30, 7790–7802. [Google Scholar] [CrossRef] [PubMed]
  40. Dong, S.; Zhou, W.; Xu, C.; Yan, W. EGFNet: Edge-aware guidance fusion network for RGB–thermal urban scene parsing. IEEE Trans. Intell. Transp. Syst. 2023, 25, 657–669. [Google Scholar] [CrossRef]
  41. Guo, S.; Hu, B.; Huang, R. Real-time flame segmentation based on rgb-thermal fusion. In Proceedings of the 2021 IEEE International Conference on Robotics and Biomimetics (ROBIO), Sanya, China, 27–31 December 2021; pp. 1435–1440. [Google Scholar]
  42. Chen, X.; Hopkins, B.; Wang, H.; O’nEill, L.; Afghah, F.; Razi, A.; Fulé, P.; Coen, J.; Rowell, E.; Watts, A. Wildland fire detection and monitoring using a drone-collected rgb/ir image dataset. IEEE Access 2022, 10, 121301–121317. [Google Scholar] [CrossRef]
  43. Qiao, L.; Li, S.; Zhang, Y.; Yan, J. Early wildfire detection and distance estimation using aerial visible-infrared images. IEEE Trans. Ind. Electron. 2024, 71, 16695–16705. [Google Scholar] [CrossRef]
  44. Lu, J.; Yang, J.; Batra, D.; Parikh, D.; Tech, V.; Georgia Institute of Technology. Hierarchical question-image co-attention for visual question answering. Adv. Neural Inf. Process. Syst. 2016, 29, 289–297. [Google Scholar]
  45. Berman, M.; Triki, A.R.; Blaschko, M.B. The lovász-softmax loss: A tractable surrogate for the optimization of the intersection-over-union measure in neural networks. In Proceedings of the IEEE Conference on Computer Vision and Pattern Recognition (CVPR), Salt Lake City, UT, USA, 18–23 June 2018; pp. 4413–4421. [Google Scholar]
  46. He, K.; Zhang, X.; Ren, S.; Sun, J. Deep residual learning for image recognition. In Proceedings of the IEEE Conference on Computer Vision and Pattern Recognition (CVPR), Las Vegas, NV, USA, 27–30 June 2016; pp. 770–778. [Google Scholar]
  47. Li, G.; Wang, Y.; Liu, Z.; Zhang, X.; Zeng, D. RGB-T semantic segmentation with location, activation, and sharpening. IEEE Trans. Circuits Syst. Video Technol. 2022, 33, 1223–1235. [Google Scholar] [CrossRef]
  48. Zhang, Q.; Zhao, S.; Luo, Y.; Zhang, D.; Huang, N.; Han, J. ABMDRNet: Adaptive-weighted bi-directional modality difference reduction network for RGB-T semantic segmentation. In Proceedings of the IEEE Conference on Computer Vision and Pattern Recognition (CVPR), Nashville, TN, USA, 20–25 June 2021; pp. 2633–2642. [Google Scholar]
  49. Lv, Y.; Liu, Z.; Li, G. Context-aware interaction network for RGB-T semantic segmentation. IEEE Trans. Multimed. 2024, 26, 6348–6360. [Google Scholar] [CrossRef]
Figure 1. Architecture of the BFCNet network.
Applsci 15 10268 g001
Figure 2. Structure of the Boundary Enhancement Module.
Applsci 15 10268 g002
Figure 3. Structure of the Fusion Activation Module.
Applsci 15 10268 g003
Figure 4. Structure of the Cross-Localization Module.
Applsci 15 10268 g004
Figure 5. Structure of the decoder.
Applsci 15 10268 g005
Figure 6. Three types of data presentation: (a) image source, (b) lighting conditions, and (c) flame size.
Applsci 15 10268 g006
Figure 7. Comparison results with other models on image source, where yellow pixels indicate correctly predicted flame areas, blue pixels indicate missed flame areas, and red pixels indicate false alarm flame areas.
Applsci 15 10268 g007
Figure 8. Comparison results with other models on lighting conditions.
Applsci 15 10268 g008
Figure 9. Comparison results with other models on flame type (S1–S5).
Applsci 15 10268 g009
Table 1. Data description of image sources, lighting conditions and flame types.
Image SourceUAVGround
Count (%)976 (48.75%)1026 (51.25%)
Lighting ConditionsDayNight
Count (%)1073 (53.6%)929 (46.4%)
Flame type (percentage)Small (S1)
(0–1%)
Small-mid (S2)
(1–5%)
Mid (S3)
(5–10%)
Mid-large (S4)
(10–15%)
Large (S5)
(15–100%)
Count (%)951 (47.5%)522 (26.1%)264 (13.2%)139 (6.9%)126 (6.3%)
Table 2. Comparison between our BFCNet and other methods.
MethodFusion StrategyFeature Utilization LevelSupervision MechanismLimitations
RTFNet [37]Element-wise addition in the encoding stageSingle fusion layerNoneSimple fusion, ignores modality differences
EGFNet [40]Edge-guided fusion + multi-task supervisionMulti-scale fusionEdge + semantic supervisionEdge extraction relies on traditional operators, lacking cross-modality interaction
LASNet [47]Independent processing of high/mid/low-level featuresHierarchical fusionMulti-level supervisionComplex modules, limited generalization, edges not emphasized
AMLNet [31]Triple-decoder structure + modality-specific/shared featuresParallel modality-specific and shared featuresThree supervision branchesLarge number of parameters, complex training, slow inference
MDRNet [48]Bidirectional modality difference reduction + channel-weighted fusionMulti-scale context modelingNoneHeavy modality conversion modules, high computational cost
CAINet [49]Context-aware interaction + auxiliary supervisionMulti-level interaction spaceMulti-task supervision Complex model structure, high inference cost
BFCNet (Ours)Edge-guided + multi-level fusionLow/mid/high levels processed separatelyEdge supervision + semantic supervisionClear structure, sufficient fusion, strong edge awareness
Table 3. Comparison results of image sources.
MethodsUAVGround
IoU F1 IoU F1
UNet-RGB63.8877.9680.3889.13
UNet-T61.9176.4876.1186.44
RTFNet69.9482.3178.4387.91
EGFNet58.4073.7473.6884.84
LASNet74.6185.4683.2690.87
AMLNet76.3986.6181.6189.88
MDRNet67.3480.4879.3188.46
CAINet76.8686.9184.9491.85
BFCNet78.2487.7986.1092.53
Note: indicates that higher values correspond to higher precision. Bold values indicate the best performance.
Table 4. Comparison results of lighting conditions.
MethodsDayNight
IoU F1 IoU F1
RTFNet78.4487.9282.4890.40
EGFNet74.0285.0779.9788.87
LASNet83.4690.9986.9693.03
AMLNet81.5889.8686.3592.68
MDRNet79.4588.5584.4491.56
CAINet85.0591.9289.8894.67
BFCNet86.1992.5889.6194.52
Note: indicates that higher values correspond to higher precision. Bold values indicate the best performance.
Table 5. Comparison results of flame type.
MethodsS1S2S3S4S5
IoU F1 IoU F1 IoU F1 IoU F1 IoU F1
UNetRGB57.0472.6471.6583.4884.7791.7685.9792.4591.3495.48
UNetT65.9679.4971.8383.6178.5687.9986.1092.5391.0795.33
RTFNet65.1978.9374.2985.2579.1988.3983.3290.9087.9793.60
EGFNet51.5568.0367.4280.5477.6487.4182.6790.5188.4493.87
LASNet70.4982.6978.2687.8085.6992.2986.1892.5892.2695.98
AMLNet73.4084.6678.1387.7283.0390.7385.2392.0390.6295.08
MDRNet63.8477.9373.5884.7882.2390.2584.6291.6790.5395.03
CAINet74.3985.3180.7089.3287.8693.5489.1294.2593.8196.81
BFCNet75.1485.8181.9490.0887.5093.3389.0794.2294.4497.14
Note: indicates that higher values correspond to higher precision. Bold values indicate the best performance.
Table 6. Results of ablation experiments on modules.
No.BaselineBEMFAMCLM IoU F1
1 83.5791.05
2 85.6192.23
3 86.3792.69
4 85.8892.40
5 86.7292.89
6 86.2892.64
7 86.97 93.03
888.2593.76
Note: indicates that higher values correspond to higher precision. ✓ denotes whether the module is used in the network. Bold values indicate the best performance.
Table 7. Results of ablation experiments on the internal components of the three modules.
AspectsModels IoU F1
BFCNet (Ours)88.2593.76
w/o sum86.7992.93
BEMw/o mul87.8893.55
w/o MSFE87.8593.53
w/o mul86.2792.63
FAMw/o CA87.5593.36
w/o GC86.7992.93
w/o Linear85.4492.15
CLMw/o Att86.5592.79
w/o Residual87.0793.09
Note: indicates that higher values correspond to higher precision. Bold values indicate the best performance.
Table 8. Comparison of Model Complexity and Size.
ModelsFLOPs (G)Params (M)
RTFNet286.82254.5
EGFNet171.5762.77
LASNet198.7493.57
AMLNet240.94123.19
MDRNet483.45210.87
CAINet123.6212.16
BFCNet121.7941.52
Note: Bold values indicate the best performance.
Disclaimer/Publisher’s Note: The statements, opinions and data contained in all publications are solely those of the individual author(s) and contributor(s) and not of MDPI and/or the editor(s). MDPI and/or the editor(s) disclaim responsibility for any injury to people or property resulting from any ideas, methods, instructions or products referred to in the content.