Abstract
Lithium–oxygen battery performance is limited by the instability of the electrolytes. Herein, it is shown that highly concentrated DMSO and DMF electrolytes improved resistance to degradation compared to lower electrolyte concentrations. Gravimetric capacities of DMSO-based electrolytes decreased modestly with increasing molar ratio up to 0.4, demonstrating the ability of highly concentrated electrolytes to perform relatively well at the higher concentrations needed to help reduce electrolyte degradation. These cells maintain their cycling lifetimes up to a molar ratio of 0.3 before a dramatic decrease is seen. Previously, DMF had been disregarded as a viable electrolyte in Li–O2 batteries due to very low gravimetric capacities at low concentrations and a very short cycle life. Here, it is demonstrated for the first time that performance in DMF greatly improves with increasing the Li salt-to-solvent molar ratio, with the capacity peaking at 0.4 for LiTFSI–DMF electrolytes matching the best performance in DMSO at low concentrations. Furthermore, increasing the LiTFSI–DMF concentration greatly improves cycling lifetimes, with cycling lifetimes almost tripling when the LiTFSI–DMF molar ratio increases from 0.1 to 0.25, ~60% larger than that achieved with DMSO. These results suggest that other electrolyte solvents previously thought unusable should be reconsidered for use in Li–O2 batteries at high concentrations.
1. Introduction
Li–O2 batteries are of great interest due to their large energy densities, ~3500 Wh/kg. However, they are only capable of cycling around 100 cycles and often fall short of even this benchmark [1,2,3,4,5,6]. Their short cycling lifetimes are caused by the large number of parasitic reactions that can take place within the cell during both discharging and charging. Many of these parasitic reactions are due to the highly reactive nature of the superoxide intermediate that forms during discharge. Due to its high degree of reactivity, superoxide participates in many undesirable side reactions, including with the electrolyte, producing various byproducts such as lithium carbonates and lithium hydroxide that build up on the carbon cathode, eventually passivating it, preventing further cycles [7,8,9]. The Li metal anode is another source of parasitic reactions with the electrolyte within the Li–O2 cell. Many electrolytes, including dimethyl sulfoxide (DMSO) are unstable in the presence of Li metal [10,11]. While many of the problems caused by the highly reducing nature of Li could be circumvented by the selection of Li-containing compounds such as in lithium-ion batteries (LIBs), this severely limits the capacities Li–O2 batteries can achieve [11]. Thus, increasing the stability of electrolytes towards reduction by the superoxide intermediate and the Li metal anode is a critical step forward in the development of Li–O2 batteries.
The main role of electrolytes in electrochemical systems is to serve as the medium for ion transport between electrodes. The performance of Li–O2 batteries therefore depends a great deal on how well ions such as Li+ and O2− diffuse through the electrolytes. Ionic conductivity is primarily dependent on two ion transport properties: ionic carrier number and ionic mobility. Increasing the Li-salt concentration increases the number of ionic charge carriers. However, as the Li-salt concentration is increased, the viscosity of these solutions increases exponentially, reducing ionic mobility [12]. Most electrolytes display a peak in their ionic conductivity at a concentration of ~1 M, a concentration thus used in most Li battery chemistries, including Li–O2 [13,14].
Electrolyte properties change with increasing salt concentration due to changes in the electrolytes’ solvation structure. At low salt concentrations (≤1 M), the solvation structure is classified as a salt-in-solvent structure. In this structure, there are enough solvent molecules to solvate all ions in a primary and secondary solvation sheath, with additional free solvent molecules that are not bound to any ions. As the salt concentration increases and the number of ions in solution grows, more solvent molecules are needed to solvate them, decreasing the number of free solvent molecules. A salt–solvate structure occurs when the number of solvent molecules equals that needed to completely solvate all ions in solution without any remaining free solvent molecules. Further increases in the salt concentration result in a solvent-in-salt structure. With the number solvent molecules being insufficient to completely solvate every ion, nanodomains form within the electrolyte [12].
The potential benefits of highly concentrated electrolytes have been known since as early as 1985, when Mckinnon and Dahn reported that the use of a saturated propylene carbonate solution of LiAsF6 prevented the countercoalition of PC into layered hosts [15]. However, research on highly concentrated electrolytes did not gain significant interest until the early 2010s. Among these subsequent studies, Yamada et al. demonstrated improved stability of acetonitrile in the presence of lithium metal by increasing the concentration of lithium bis(trifluoromethanesufonyl)imide (LiTFSI). Not only was this highly concentrated solution stable in the presence of lithium metal for more than a week, but it also allowed for the intercalation of Li+ ions into graphite, which had not been achieved before in acetonitrile electrolytes [16]. Quian et al. used highly concentrated LiTFSI–dimethoxyethane (DME) electrolytes to stably cycle Li|Li and Cu|Li cells for 6000 and 1000 cycles, respectively [17]. Finally, Suo and co-workers showed highly reversible cycling of Li metal anodes in lithium–sulfur (Li-S) batteries using concentrated 1,3-dioxolane (DOL)–dimethoxyethane (DME) (1:1 by volume) electrolytes [18].
Despite these successes, very few studies on the performance of highly concentrated electrolytes in Li–O2 cells have been reported. Tatara et al. studied the oxygen reduction reaction (ORR) in highly concentrated solutions of LiTFSI–DMSO, finding that the side reactions responsible for the degradation of DMSO were suppressed at higher LiTFSI concentrations. However, they did not test the cycling lifetimes of cells using this highly concentrated electrolyte [19]. Liu and co-workers cycled Li–O2 cells using highly concentrated LiTFSI–DMSO electrolytes, finding that these solutions are more stable towards both superoxide and the Li metal anode [20]. There have been no reports of using highly concentrated dimethyl formamide (DMF) electrolytes, probably because it has previously been shown to be unsuitable for use in Li–O2 due to its high reactivity with the Li metal anode, resulting in the formation of Li2CO3 on the carbon cathode after a few cycles [7]. Here, we demonstrate the reduction and even elimination of the formation of lithium hydroxide and lithium carbonate byproducts in DMSO- and DMF-based electrolytes, respectively, with increasing Li-salt concentrations. The performance of both DMSO and DMF electrolytes in Li–O2 cells is also presented, and we show that the use of highly concentrated electrolytes can open the door for the use of electrolyte solvents previously thought to be unsuitable for Li–O2 batteries, such as DMF.
2. Experimental
Materials and characterization techniques used in this study were similar to those previously reported [21,22]. All data points are an average of three or more samples.
2.1. Materials
LiNO3 from Alfa Aesar (Ward Hill, MA, USA, 99.98% metal basis, product no. 10985), LiTFSI (99.9%, CAS no. 90076-65-6), dimethyl sulfoxide (99.9%, product no. D139-1) and dimethyl formamide (99.8%, anhydrous, CAS no. 68-12-2) from Thermo Fisher Scientific (Pittsburgh, PA, USA) were used to make the electrolyte. Multiwalled carbon nanotubes (>95 wt%, SKU # 030103), 10–20 nm in diameter and 10–30 µm in length, were purchased from Cheaptubes.com (Grafton, VT, USA). Carbon fiber paper (porous C)–EQ–bcgdl-1400S-LD and coin cells (CR2016) were purchased from MTI Inc. (Richmond, CA, USA). Ahlstrom Munksjö (Espoo, Finland) glass microfiber filters (grade GF/D, CAT no. 1823-150) were purchased through Millipore Sigma (Burlington, MA, USA). PTFE membrane filters with 0.45 µm pore size were purchased from Simsii (Issaquah, WA, USA, product no. M045PTFE045H). Celgard 3401 separators were purchased from Celgard LLC (Charlotte, NC, USA).
2.2. Characterization
Scanning electron microscopy (SEM) using an FEI Teneo LV FEG microscope (Thermo Fisher Scientific) was used to image cathodes before and after discharge. Crystallographic structure studies were carried out using a D2 Phaser X-ray diffractometer (Bruker AXS Inc., Madison, WI, USA, Cu-Kα radiation). In cathode preparation for SEM and XRD studies of discharged cathodes, a Celgard 3401 separator (Celgard LLC) was used to prevent glass fibers from contact with the cathode. Discharged cells were disassembled in the box under an Ar atmosphere and the cathodes were washed in DMSO or DMF depending on whether a DMSO or DMF electrolyte was used in the cell. Electrolyte properties as a function of Li-salt concentration were studied by Raman spectroscopy with a LabRAM HR spectrometer (Horiba Scientific and Analytical Instruments, Piscataway, NJ, USA) using a laser excitation wavelength of 532 nm. Electrochemical impedance spectroscopy (EIS) was performed using a SI 1260 impedance-gain-phase analyzer coupled with a SI 1287 electrochemical interface (Solartron, Gastonia, NC, USA), and rheometry using an DV2T viscometer equipped with a CPA 51Z spindle head (AMETEK Brookfield, Middleboro, MA, USA). Viscosity measurements were performed at 25 °C.
2.3. Electrolyte Preparation
Electrolytes were obtained by mixing either lithium bis(trifluoromethanesulfonyl)imide (LiTFSI) or lithium nitrate (LiNO3) in either dimethyl sulfoxide (DMSO, 99.9+% Alfa Aesar) or dimethylformamide (DMF, anhydrous 99.8% Thermo Fisher Scientific). Solvents were dried over molecular sieves and degassed prior to electrolyte preparation. Electrolyte concentrations are given as salt-to-solvent molar ratios, ranging from 0.1 (~1 M) to 0.5 (~3–5 M).
2.4. MWCNT Cathode Preparation
MWCNTs were suspended in IPA and sonicated for 30 min to make a solution with a concentration of 0.33 mg/mL. The solution was then filtered over CFP from which carbon black had been removed and backed by a Simsii PTFE membrane filter with 0.45 µm pore size. The sample was then dried at 120 °C overnight. Electrodes 1.6 cm in diameter were punched out of the film and pressed between two sheets of aluminum foil at 6000 Ibs on a hydraulic press (Carver Inc., Wabash, IN, USA, Model 3851). The loading of these MWCNT cathodes was about 1.5 mg/cm2.
2.5. Cell Assembly
CR2016 coin cells were assembled under an argon atmosphere inside a glove box. Lithium metal chips (99.9%, MTI Inc.) were used as the anode, with Whatman glass microfiber filters (grade GF/D) saturated with 200 µL of electrolytes as the separator. The coin cells had nine holes 1 mm in diameter punched into the top to allow oxygen to flow into the cells during cycling. The cells were placed in home-built PVC containers built to hold a pure oxygen atmosphere at a positive pressure, as previously described [21].
2.6. Electrochemical Characterization
Oxygen was flowed through the PVC cycling containers for 10 min to ensure a pure oxygen atmosphere in the container. During cycling, the oxygen atmosphere was maintained at 5 pounds per square inch (psi). The cells were left to sit for 4 h at OCV under a positive-pressure oxygen atmosphere before cycling. The cells were cycled at a current density of 0.2 mA/cm2. Cells were discharged from OCV (~2.8–3.0 V) to 2.0 V. Due to dendrite formation during the charging of fully discharged cathodes, the depth of discharge was limited to 500 mA/g during cycle life characterization.
3. Results and Discussion
3.1. Electrolyte Solvation Structure
The carbon–sulfur symmetric and antisymmetric stretch peaks of LiTFSI–DMSO found in Raman spectra (Figure 1) can be used to monitor the fraction of bound and free DMSO molecules as a function of the LiTFSI–DMSO molar ratio. Li+ binding to the oxygen atoms in the DMSO molecule shorten the sulfur–carbon bond, and thus the corresponding peaks shift to higher wave numbers (Figure 2a). The peak at 740 cm−1 is attributed to the sulfur–nitrogen bond in LiTFSI, increasing in intensity as the LiTFSI–DMSO molar ratio increases. The fraction of bound and free DMSO molecules can be calculated from the areas of the deconvoluted peaks fit to Lorentzian functions (Figure 2b).
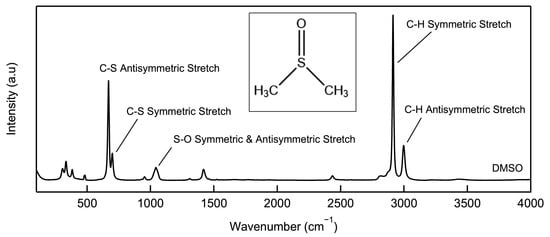
Figure 1.
Raman spectrum of DMSO from 100 to 3500 cm−1.
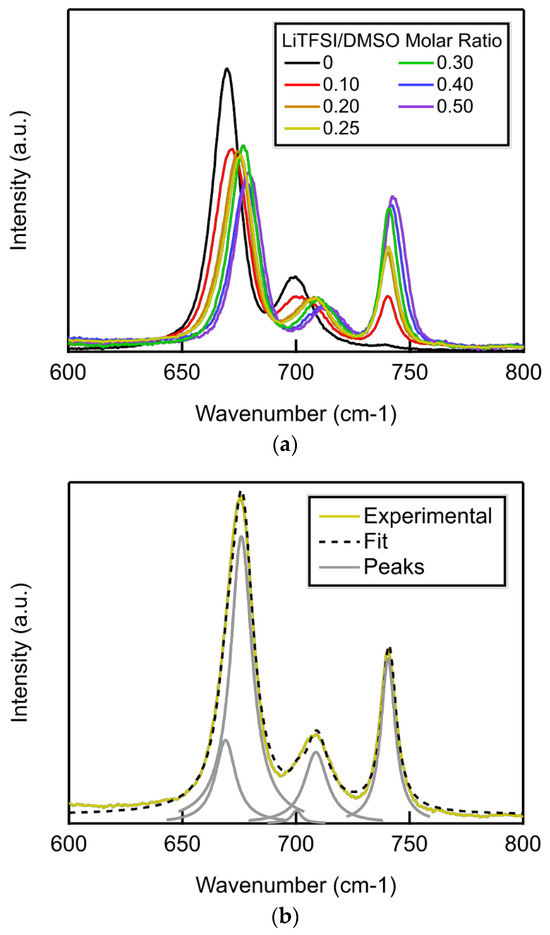
Figure 2.
(a) Raman spectra of LiTFSI–DMSO electrolytes from 600 to 800 cm−1 as a function of LiTFSI–DMSO molar ratio; (b) peak deconvolution of the Raman spectra of LiTFSI–DMSO at a molar ratio of 0.25.
The fraction of free DMSO molecules decreased linearly while the fraction of bound DMSO molecules increased linearly up to a Li-salt–solvent molar ratio of 0.25, the molar ratio at which all DMSO molecules become bound (Figure 3) [19,23,24]. The average number of solvent molecules surrounding each Li+ below a molar ratio of 0.25 can be determined from the slope of the fraction of bound solvent molecules to molar ratio, which was 3.43, close to the four solvent molecules expected to compose the Li+ primary sheath. Above a molar ratio of LiTFSI–DMSO of 0.25, the slope decreases dramatically because essentially all DMSO molecules are bound.
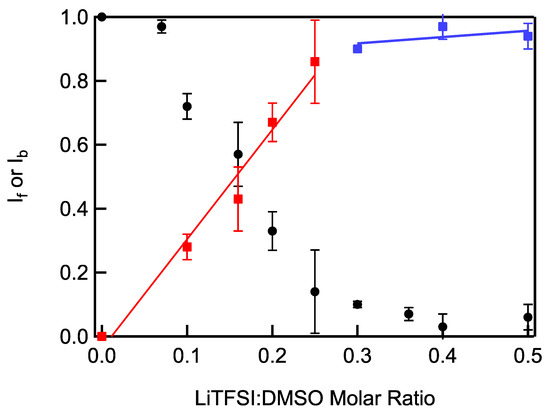
Figure 3.
Fraction of bound (red and blue squares) and free (black circles) DMSO molecules in LiTFSI–DMSO electrolytes calculated from Raman spectra as a function of LiTFSI–DMSO molar ratio. Linear least-squares fitting results for the bound fraction data are shown as red and blue lines.
The solvation number of Li+ above a molar ratio of 0.25 can be calculated from the Raman spectra of LiTFSI–DMSO using:
where Ib and If are the fraction of integrated intensities of Raman peaks corresponding to bound and free DMSO, respectively. The solvation number of DMSO molecules filling that primary sheath of Li+ was found to be close to an average 3.91 across LiTFSI–DMSO molar ratios up to 0.25 (Figure 4). This agrees reasonably well with the 3.43 value obtained from the slope of bound DMSO molecules vs. molar ratio in Figure 3. At molar ratios greater than 0.25, the average number of DMSO molecules in the Li+ primary sheath decreased with increasing LiTFSI–DMSO molar ratio, as there were no longer enough DMSO molecules to completely fill it. As a result, TFSI− anions formed contact ion pairs, in which the anions interacted directly with the Li+ in order to fill the primary sheath of Li+. At a molar ratio of 0.5, there were only two DMSO molecules on average in the primary sheath of the Li+ ions. Thus, Raman spectra were consistent with the formation of solvent-in-salt nanodomains at molar concentrations greater than 0.25.
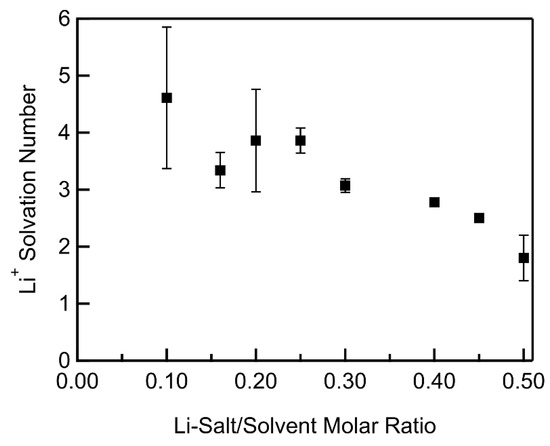
Figure 4.
Solvation number of Li+ in LiTFSI–DMSO electrolyte vs. LiTFSI–DMSO molar ratio.
3.2. Concentrated Electrolyte Characterization
Electrolyte viscosities increased exponentially with increasing Li-salt concentration. The rate of exponential increase depended primarily on the solvent and very little on the choice of Li salt. DMSO-based electrolytes reached viscosities in the order of 370 cP at molar ratios between 0.45 and 0.5 (Figure 5). DMF-based electrolytes, on the other hand, only reached viscosities between 70 and 90 cP at molar ratios of 0.45 and 0.5, respectively. This large difference in viscosities can be attributed largely to the low viscosity of DMF (0.79 cP), ~2.5 times less than that of DMSO (1.99 cP).
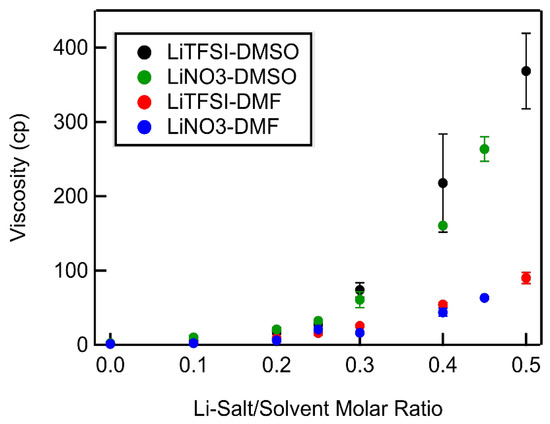
Figure 5.
Electrolyte viscosity vs. Li salt–solvent molar ratio for all Li salt–solvent systems.
Ionic conductivities were extracted by fitting the EIS spectra obtained with symmetrical cells to a Randall’s circuit. All electrolyte systems studied were found to show peak ionic conductivities at a molar ratio of 0.1 (Figure 6). As the molar ratio increased, the ionic conductivities decreased in both DMSO- and DMF-based electrolytes, although to different degrees. The ionic conductivities of DMSO-based electrolytes decreased an order of magnitude from a molar ratio of 0.1 to 0.5. While the ionic conductivities of DMF-based electrolytes also decreased with increasing molar ratio, the decrease was less than an order of magnitude: their ionic conductivity at a molar ratio of 0.5 was one fifth of the value measured at a molar ratio of 0.1. This difference in concentration dependence of the ionic conductivities of DMSO- and DMF-based electrolytes was as expected, as viscosity is inversely proportional to ionic conductivity and DMF-based electrolytes possess much lower viscosities at high Li-salt concentrations than those of DMSO. The less dramatic decrease in the ionic conductivity of DMF-based electrolytes should help maintain favorable Li–O2 reaction kinetics at high concentrations. In this higher concentration range, the number of solvent molecules was less than needed to fill the primary sheath of Li+ (see above), implying anionic participation in solvation. TFSI− is significantly larger than NO3− and would be expected to decrease the mobility of the Li+ through the electrolytes to a greater degree, thus having a lower ionic conductivity, as observed.
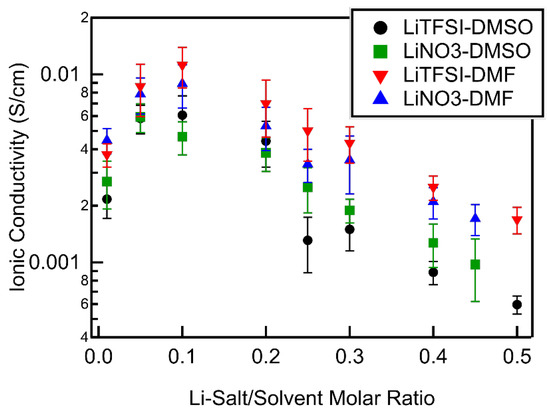
Figure 6.
Electrolyte ionic conductivity as a function of Li salt–solvent molar ratio for all Li salt–solvent systems.
3.3. Electrolyte Degradation
MWCNT cathodes were discharged in electrolytes of increasing concentration and the reaction products examined by XRD. To protect the product, Li2O2, from water in the atmosphere during data collection, cathodes were covered with just enough mineral oil to completely coat the cathode. In LiTFSI–DMSO electrolytes at 0.1 molar ratio of LiTFSI–DMSO, both LiOH and Li2O2 peaks were present, with LiOH the major product. The LiOH peaks disappeared as the LiTFSI–DMSO molar ratio increased to 0.25, with Li2O2 becoming the only detectable product (Figure 7). The absence of LiOH indicates the elimination of DMSO degradation during discharge.
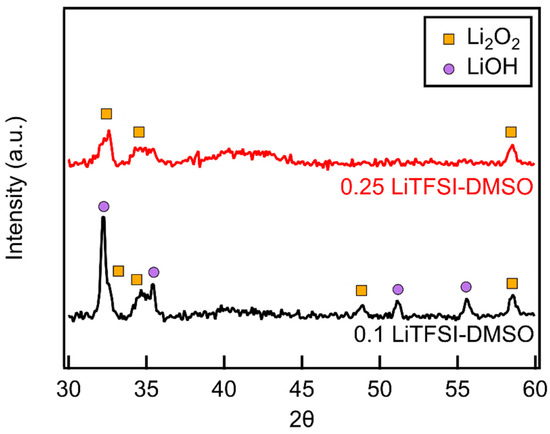
Figure 7.
XRD diffractograms of MWCNT cathodes discharged in LiTFSI–DMSO at molar ratios of 0.1 and 0.25.
In the case of LiTFSI–DMF electrolytes, only Li2CO3 and LiOH were present at a molar ratio of 0.1 (Figure 8). The absence of Li2O2 on the cathode is indicative of the high instability of the DMF at this concentration. As the LiTFSI–DMF molar ratio increases, first to 0.25 and then to 0.4, Li2CO3 peaks can still be seen in the XRD diffractogram. LiOH is no longer present and large Li2O2 peaks are observed, indicating that Li2O2 has become the dominant discharge product. The appearance of Li2O2 as the dominant species and the decrease in the quantity of decomposition products demonstrates that the degradation of DMF has been reduced, but not completely eliminated.
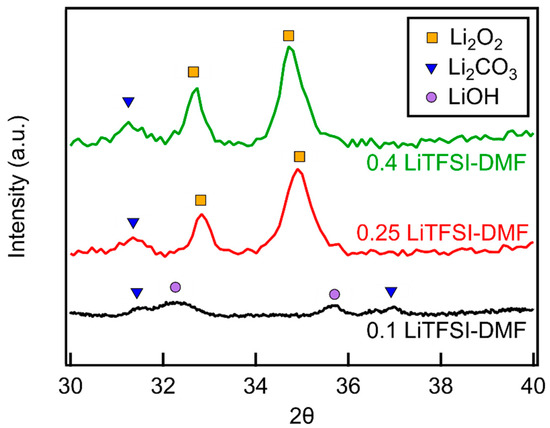
Figure 8.
XRD diffractograms of MWCNT cathodes discharged in LiTFSI–DMF as a function of LiTFSI–DMF molar ratio.
Toroidal particles of ~1–2 µm in diameter formed on the surface of MWCNT cathodes during discharge in LiTFSI–DMSO electrolytes at a molar ratio of 0.1 (Figure 9a). The size of the Li2O2 particles that formed decreased as the LiTFSI–DMSO molar ratio increased, growing to only ~500 nm in diameter at a molar ratio of 0.4 (Figure 9c). This decrease can be attributed to the reduction in ionic mobility at higher concentrations. At these concentrations, superoxide is unable to diffuse away from the MWCNT cathode as rapidly as it does at lower Li-salt concentrations. These slower diffusion rates increase the local concentration of Li2O2 and thus the number of seeds formed, resulting in smaller particles.
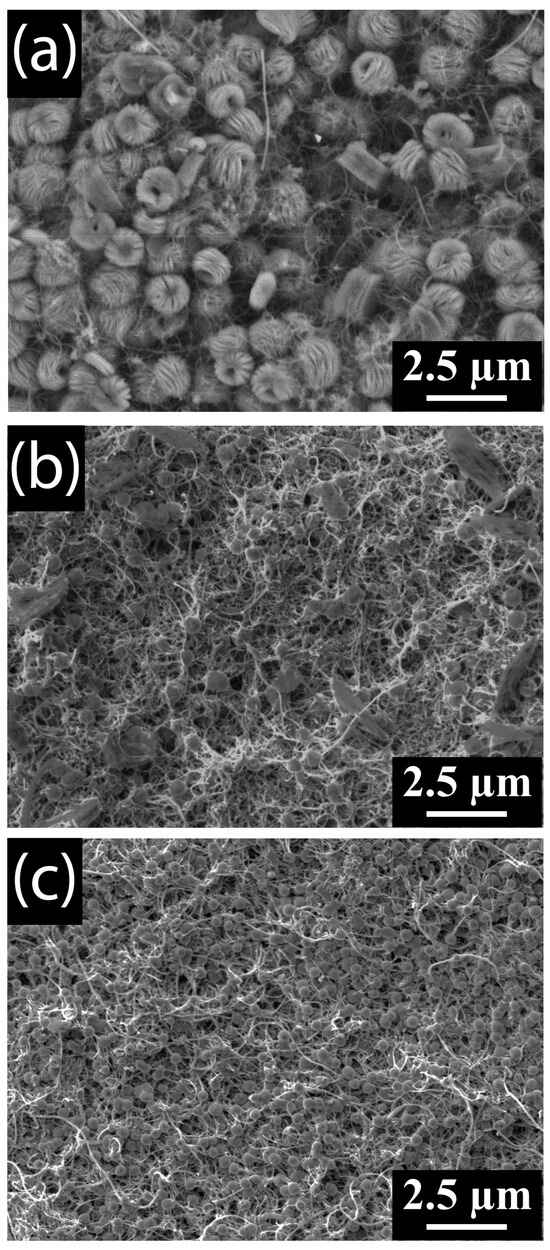
Figure 9.
SEM images of MWCNT cathodes discharged in (a) 0.1, (b) 0.25, and (c) 0.4 LiTFSI–DMSO electrolytes.
In contrast to the toroid formation in DMSO electrolytes, a film of product is seen coating the MWCNTs (Figure 10a) following discharge in 0.1-molar-ratio LiTFSI–DMF electrolyte. As the LiTFSI–DMF molar ratio increases to 0.25 the coverage of the thin film coating the MWCNTs decreases, and although Li2O2 peroxide is shown to be the dominant species at this molar ratio, few toroidal L2O2 particles are seen covering the MWCNTs (Figure 10b). Further increase in molar ratio to 0.4 results in toroidal Li2O2 particles forming on the surface of the MWCNTs (Figure 10c). Despite the growth of Li2O2 particles, there are still areas of the MWCNT cathode coated by a film, as is seen at lower molar ratios. This film is most likely the Li2CO3 detected by XRD. The formation of Li2O2 particles at higher concentrations is probably due to the increase in electrolyte stability with increasing Li-salt concentration, slowing the decomposition rate to less than the toroid nucleation and growth rates.
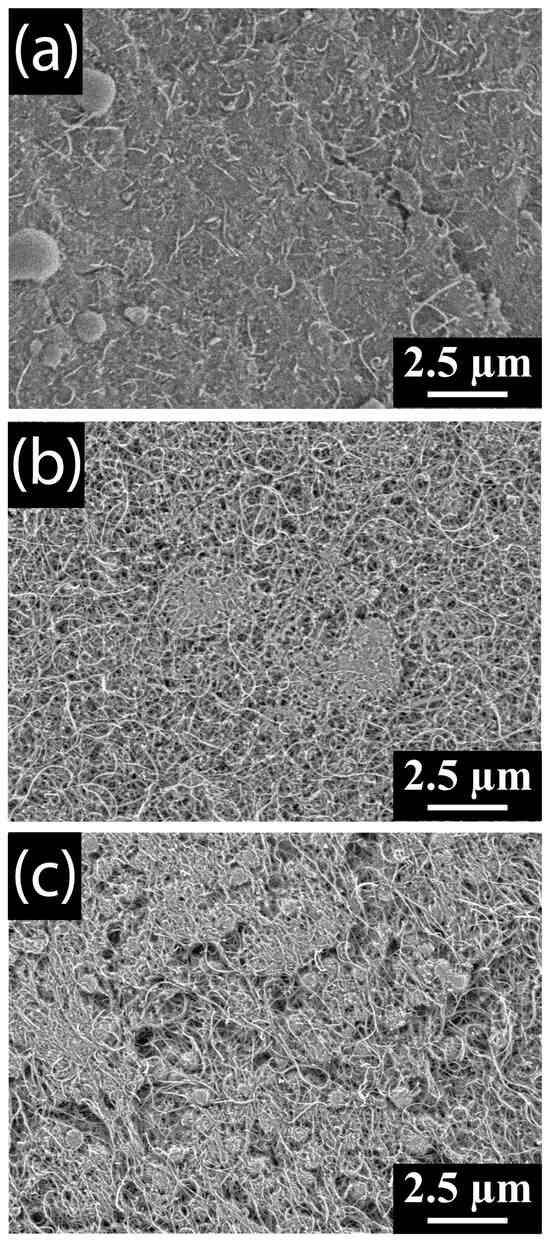
Figure 10.
SEM images of MWCNT cathodes discharged in (a) 0.1, (b) 0.25, and (c) 0.4 LiTFSI–DMF electrolytes.
3.4. Concentrated Electrolyte Performance
In DMSO-based electrolytes, the full depth of discharge capacity was found to decrease linearly with increasing Li-salt concentrations up to a molar ratio of 0.4 and 0.3 for LiTFSI–DMSO and LiNO3–DMSO electrolytes, respectively (Figure 11). This decrease in capacity could be caused by the decreased ionic mobility with increasing molar ratio, meaning that reactants such as LiO2 are unable to diffuse as far away from the carbon cathode surface. This shifts the reaction equilibrium:
to the left, towards the formation of a Li2O2 film on the MWCNT cathode, passivating its surface [25]. Pore blocking may also play a role in the decrease in gravimetric capacities. As the molar ratio increases, the size of the Li2O2 particles decreases, and as shown in Figure 9c, the result is Li2O2 particles packing closer together, decreasing the porosity of the cathode, and blocking the pathways reactants are able to traverse, resulting in limited discharge capacities.
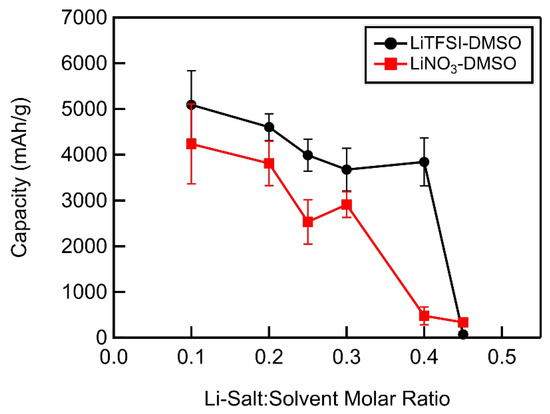
Figure 11.
Full depth of discharge capacity as a function of Li salt–solvent molar ratio of DMSO-based electrolytes.
Increases in molar ratio beyond 0.4 in the case of LiTFSI and 0.3 in the case of LiNO3 in DMSO resulted in a dramatic decrease in the full depth of discharge capacity, with capacities ~100 mAh/g for each at a molar ratio of 0.45. At this concentration, the diffusion of reactants away from the carbon surface is likely so slow that all available reaction sites quickly become passivated, severely limiting the discharge capacity of the cell, although additional study would be needed to test this hypothesis. LiTFSI–DMSO electrolyte solutions displayed larger capacities at all Li-salt concentrations up to a molar ratio of 0.45. The higher discharge capacities obtained when using LiTFSI over LiNO3 below a molar ratio 0.25 may be due to their higher ionic conductivities. Above a molar ratio of 0.25, however, LiNO3-–DMSO electrolytes possessed modestly higher ionic conductivities. At this higher concentration range, the number of solvent molecules was less than needed to fill the primary sheath of Li+ (see above), implying anionic participation in solvation. TFSI− is significantly larger than NO3− and would be expected to decrease the mobility of the Li+ through the electrolyte to a greater degree, thus having a lower ionic conductivity, as observed. However, NO3− has a larger donor number (~22) than TFSI− (~11) [26], and thus more strongly binds Li+ [25], consequently increasing the lifetime of highly reactive superoxide by slowing LiO2 formation, thereby increasing solvent degradation and reducing capacity below that obtained in LiTFSI–DMSO electrolytes [26].
In DMF-based electrolytes, unlike in DMSO-based electrolytes, the full depth of discharge capacity increased with increasing Li-salt concentration up to a molar ratio of 0.4 in LiTFSI–DMF electrolytes and 0.45 in LiNO3–DMF electrolytes (Figure 12). The discharge capacity dropped dramatically with further concentration increases in LiTFSI–DMF electrolytes. In the case of LiNO3–DMF electrolytes, the LiNO3 salt precipitated at molar ratios above 0.45, and attempts to discharge cells above this concentration were unsuccessful. This trend of increasing discharge capacity with increasing Li-salt concentration is counter to what was seen in DMSO-based electrolytes. As shown in the XRD of MWCNT cathodes discharged in 0.1 LiTFSI–DMF (Figure 8), the major discharge products are Li2CO3 and LiOH, which result from the degradation of DMF. These discharge products form a film coating the MWCNT cathode (Figure 10a), quickly passivating the surface, resulting in relatively low discharge capacities. As the LiTFSI–DMF molar ratio increases, the stability of the DMF increases and Li2O2 starts to form. Consequently, an increase in the discharge capacity is observed up to a molar ratio of 0.4. Beyond this molar ratio, the discharge capacity dramatically decreases. This sudden reduction in discharge capacity can be attributed to the decrease in the ability of reactants to diffuse away from the MWCNT cathode, resulting in the formation of a thin film and subsequent passivation of the reaction sites on the MWCNT cathodes, as was the case in LiTFSI–DMSO electrolytes. In DMF-based electrolytes, just as in DMSO-based electrolytes, the LiTFSI electrolytes performed better up to a molar ratio of 0.45, in part due to their slightly higher ionic conductivities. At a molar ratio of 0.45, LiNO3–DMF electrolytes performed significantly better than LiTFSI–DMF electrolytes. The larger donor number of the NO3− inhibited LiO2 formation in solution, having a negative impact on capacity at low-to-intermediate concentrations due to reduced binding of superoxide and consequent increased solvent degradation. However, at very high concentrations, the additional diffusion time allowed by this inhibition is beneficial in limiting the passivation of the cathode by LiO2 formation on or near its surface, resulting in higher capacity.
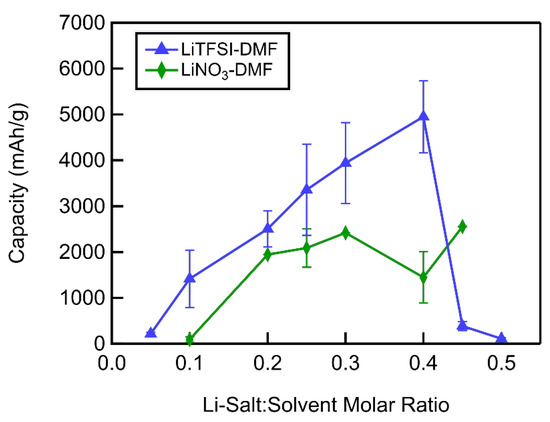
Figure 12.
Full depth of discharge capacity as a function of Li salt–solvent molar ratio of DMF-based electrolytes.
The cycling lifetimes of LiTFSI–DMSO electrolytes (Figure 13 and Figure S1) were found to follow a trend similar to the full depth of discharge capacities. Cycling lifetimes were found to be constant as the LiTFSI–DMSO molar ratio increased from 0.1 to 0.25, in contrast to a previous report of cycle life enhancement over the same concentration range [20]. Increasing the molar ratio to 0.3 slightly decreased the cycle life slightly, with a further increase to a molar ratio of 0.4 resulting in a precipitous decline. In the case of LiTFSI–DMF electrolytes, increasing the molar ratio from 0.1 to 0.25 resulted in a very large increase in the cycling lifetime (Figure 14 and Figure S2). Increasing the LiTFSI–DMF molar ratio from 0.25 to 0.3 decreased the lifetime modestly (~24%), and then sharply with further increase to 0.4. The low cycling lifetime observed in 0.1 LiTFSI–DMF electrolytes is due to the rapid degradation of DMF, passivating the MWCNT cathode. As demonstrated by the XRD results presented above, increasing the LiTFSI–DMF molar ratio to 0.25 greatly improves the stability of the DMF and as a result improves cycling lifetimes in DMF electrolytes with increasing LiTFSI concentration. The decrease in cycling lifetimes in both DMSO and DMF electrolytes at high molar ratios (>0.3) may be due to parasitic reactions between the superoxide intermediate and the carbon cathode. At higher concentrations, ions such as superoxide are less mobile and unable to diffuse as far away from the carbon cathode. With higher concentrations of superoxide near the carbon cathode surface, the probability of reactions between the superoxide and the carbon greatly increases. This reaction results in the formation of Li2CO3 which passivates the carbon cathode and does not decompose upon charging, resulting in the buildup of Li2CO3 on the cathode over the course of a few cycles [27].
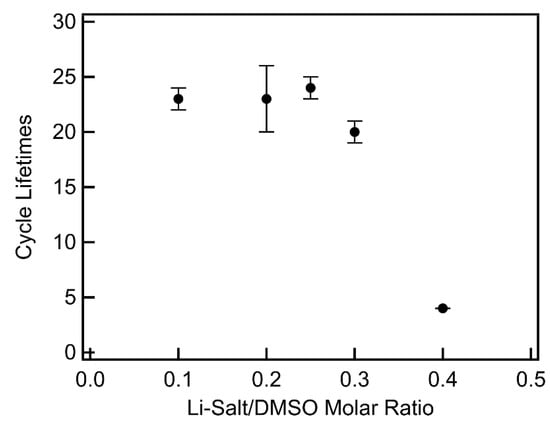
Figure 13.
Limited depth of discharge cycling as a function of Li salt–solvent molar ratio of LiTFSI–DMSO electrolytes.
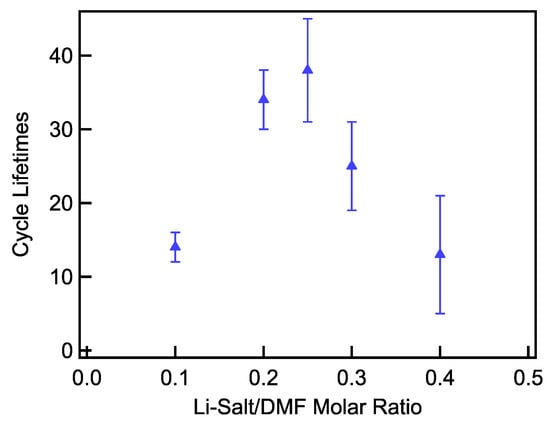
Figure 14.
Limited depth of discharge cycling as a function of Li salt–solvent molar ratio of LiTFSI–DMF electrolytes.
4. Conclusions
Highly concentrated DMSO and DMF electrolytes showed improved resistance to degradation compared to lower electrolyte concentrations. At low concentrations, DMSO and DMF electrolytes showed significant formation of LiOH and Li2CO3, respectively. As the molar ratio of LiTFSI increased in LiTFSI–DMSO electrolytes to 0.25, Li2O2 became the dominant product. In the case of LiTFSI–DMF electrolytes, while Li2O2 became the dominant product at a molar ratio of 0.25, the formation of Li2CO3 was not completely prevented, even upon further increasing the molar ratio to 0.4. Gravimetric capacities of DMSO-based electrolytes decreased modestly up to a molar ratio of 0.4 in the case of LiTFSI and 0.3 in the case of LiNO3 compared to lower concentrations, demonstrating the ability of highly concentrated electrolytes to perform relatively well at the higher concentrations needed to help reduce electrolyte degradation. DMF-based electrolytes, however, showed an improvement in gravimetric capacity with increasing the Li salt-to-solvent molar ratio, with the capacity peaking at 0.4 for LiTFSI–DMF electrolytes and 0.3 for LiNO3–DMF electrolytes. The cycling lifetimes showed similar trends to the discharge capacity for LiTFSI–DMSO electrolytes, maintaining their cycling lifetimes up to a molar ratio of 0.3 before a dramatic decrease was seen. LiTFSI–DMF at a molar ratio of 0.1 displayed short cycling lifetimes, averaging 14 cycles. DMF has previously been disregarded as a viable electrolyte in Li–O2 batteries due to low capacity and short cycle life [7]. However, increasing the LiTFSI–DMF greatly improved cycling lifetimes, with cycling lifetimes almost tripling when the LiTFSI–DMF molar ratio increased from 0.1 to 0.25. This result suggests that other electrolyte solvents previously thought unusable should be reconsidered for use in Li–O2 batteries.
Supplementary Materials
The following supporting information can be downloaded at https://www.mdpi.com/article/10.3390/app151810233/s1. Figure S1: Charge–discharge curves for limited depth of discharge cycling of 0.25-molar ratio LiTFSI–DMSO electrolytes; Figure S2: Charge–discharge curves for limited depth of discharge cycling of 0.25-molar-ratio LiTFSI–DMF electrolytes.
Author Contributions
Conceptualization M.J.W. and M.D.W.; methodology, M.J.W. and M.D.W.; investigation, M.D.W. and S.C.; resources M.J.W.; writing—original draft preparation, M.J.W. and M.D.W.; writing—review and editing, M.J.W.; supervision, M.J.W. and M.D.W.; project administration, M.J.W.; funding acquisition, M.J.W. All authors have read and agreed to the published version of the manuscript.
Funding
This research was funded by the National Reconnaissance Office contract number NRO000-14-C-0335.
Data Availability Statement
The original contributions presented in this study are included in the article/Supplementary Material. Further inquiries can be directed to the corresponding author.
Conflicts of Interest
The authors declare no conflict of interest.
Correction Statement
This article has been republished with a minor correction to the Data Availability Statement. This change does not affect the scientific content of the article.
References
- Tripachev, O.V.; Panchenko, N.V.; Korchagin, O.V.; Radina, M.V.; Dolgopolov, S.V.; Grafov, O.Y.; Bogdanovskaya, V.A. A Novel Pt/MoS2/CNT Composite Catalyst for the Positive Electrode of a Li-O2 Battery. J. Electroanal. Chem. 2021, 897, 115554. [Google Scholar] [CrossRef]
- Fujigaya, T.; Kanamori, R.; Hirata, S.; Morita, J.; Matsumoto, M.; Eguchi, M.; Jang, I.-C.; Ishihara, T.; Nakashima, N. Effect of Nitrogen-Containing Polymer Wrapped around Carbon Nanotubes for Li–O2 Battery Cathode. Polym. J. 2019, 51, 921–927. [Google Scholar] [CrossRef]
- Kim, H.; Lee, H.; Kim, M.; Bae, Y.; Baek, W.; Park, K.; Park, S.; Kim, T.; Kwon, H.; Choi, W.; et al. Flexible Free-Standing Air Electrode with Bimodal Pore Architecture for Long-Cycling Li-O2 Batteries. Carbon 2017, 117, 454–461. [Google Scholar] [CrossRef]
- Lee, H.; Lee, D.J.; Kim, M.; Kim, H.; Cho, Y.S.; Kwon, H.J.; Lee, H.C.; Park, C.R.; Im, D. High-Energy Density Li–O2 Battery with a Polymer Electrolyte-Coated CNT Electrode via the Layer-by-Layer Method. Acs Appl. Mater. Inter. 2020, 12, 17385–17395. [Google Scholar] [CrossRef]
- Algethami, N.; Alkhammash, H.I.; Sultana, F.; Mushtaq, M.; Zaman, A.; Ali, A.; Althubeiti, K.; Yang, Q. Preparation of RuO2/CNTs by Atomic Layer Deposition and Its Application as Binder Free Cathode for Polymer Based Li-O2 Battery. Int. J. Electrochem. Sci. 2022, 17, 220967. [Google Scholar] [CrossRef]
- Levchenko, S.; Marangon, V.; Bellani, S.; Pasquale, L.; Bonaccorso, F.; Pellegrini, V.; Hassoun, J. Influence of Ion Diffusion on the Lithium–Oxygen Electrochemical Process and Battery Application Using Carbon Nanotubes–Graphene Substrate. ACS Appl. Mater. Interfaces 2023, 15, 39218–39233. [Google Scholar] [CrossRef]
- Chen, Y.; Freunberger, S.A.; Peng, Z.; Bardé, F.; Bruce, P.G. Li–O2 Battery with a Dimethylformamide Electrolyte. J. Am. Chem. Soc. 2012, 134, 7952–7957. [Google Scholar] [CrossRef]
- Sharon, D.; Afri, M.; Noked, M.; Garsuch, A.; Frimer, A.A.; Aurbach, D. Oxidation of Dimethyl Sulfoxide Solutions by Electrochemical Reduction of Oxygen. J. Phys. Chem. Lett. 2013, 4, 3115–3119. [Google Scholar] [CrossRef]
- Freunberger, S.A.; Chen, Y.; Peng, Z.; Griffin, J.M.; Hardwick, L.J.; Bardé, F.; Novák, P.; Bruce, P.G. Reactions in the Rechargeable Lithium–O2 Battery with Alkyl Carbonate Electrolytes. J. Am. Chem. Soc. 2011, 133, 8040–8047. [Google Scholar] [CrossRef]
- Guo, H.; Luo, W.; Chen, J.; Chou, S.; Liu, H.; Wang, J. Review of Electrolytes in Nonaqueous Lithium-Oxygen Batteries. Adv. Sustain. Syst. 2018, 2, 1700183. [Google Scholar] [CrossRef]
- Yao, X.; Dong, Q.; Cheng, Q.; Wang, D. Why Do Lithium–Oxygen Batteries Fail: Parasitic Chemical Reactions and Their Synergistic Effect. Angew. Chem. Int. Ed. 2016, 55, 11344–11353. [Google Scholar] [CrossRef]
- Borodin, O.; Self, J.; Persson, K.A.; Wang, C.; Xu, K. Uncharted Waters: Super-Concentrated Electrolytes. Joule 2020, 4, 69–100. [Google Scholar] [CrossRef]
- Li, M.; Wang, C.; Chen, Z.; Xu, K.; Lu, J. New Concepts in Electrolytes. Chem. Rev. 2020, 120, 6783–6819. [Google Scholar] [CrossRef] [PubMed]
- Yamada, Y.; Yamada, A. Review—Superconcentrated Electrolytes for Lithium Batteries. J. Electrochem. Soc. 2015, 162, A2406–A2423. [Google Scholar] [CrossRef]
- McKinnon, W.R.; Dahn, J.R. How to Reduce the Cointercalation of Propylene Carbonate in Li x ZrS2 and Other Layered Compounds. J. Electrochem. Soc. 1985, 132, 364–366. [Google Scholar] [CrossRef]
- Yamada, Y.; Furukawa, K.; Sodeyama, K.; Kikuchi, K.; Yaegashi, M.; Tateyama, Y.; Yamada, A. Unusual Stability of Acetonitrile-Based Superconcentrated Electrolytes for Fast-Charging Lithium-Ion Batteries. J. Am. Chem. Soc. 2014, 136, 5039–5046. [Google Scholar] [CrossRef] [PubMed]
- Qian, J.; Henderson, W.A.; Xu, W.; Bhattacharya, P.; Engelhard, M.; Borodin, O.; Zhang, J.-G. High Rate and Stable Cycling of Lithium Metal Anode. Nat. Commun. 2015, 6, 6362. [Google Scholar] [CrossRef]
- Suo, L.; Hu, Y.-S.; Li, H.; Armand, M.; Chen, L. A New Class of Solvent-in-Salt Electrolyte for High-Energy Rechargeable Metallic Lithium Batteries. Nat. Commun. 2013, 4, 1481. [Google Scholar] [CrossRef]
- Tatara, R.; Kwabi, D.G.; Batcho, T.P.; Tulodziecki, M.; Watanabe, K.; Kwon, H.-M.; Thomas, M.L.; Ueno, K.; Thompson, C.V.; Dokko, K.; et al. Oxygen Reduction Reaction in Highly Concentrated Electrolyte Solutions of Lithium Bis(Trifluoromethanesulfonyl)Amide/Dimethyl Sulfoxide. J. Phys. Chem. C 2017, 121, 9162–9172. [Google Scholar] [CrossRef]
- Liu, B.; Xu, W.; Yan, P.; Kim, S.T.; Engelhard, M.H.; Sun, X.; Mei, D.; Cho, J.; Wang, C.; Zhang, J. Stabilization of Li Metal Anode in DMSO-Based Electrolytes via Optimization of Salt–Solvent Coordination for Li–O2 Batteries. Adv. Energy Mater. 2017, 7, 1602605. [Google Scholar] [CrossRef]
- Womble, M.D.; McKenzie, K.R.; Wagner, M.J. Thick Film Formation on Li-O2 Cathodes—Breaking the True Capacity Barrier. Sci. Rep. 2025, 15, 5868. [Google Scholar] [CrossRef] [PubMed]
- Womble, M.D.; Adebayo, C.; Cascio, S.; Wagner, M.J. Synergistic Enhancement of Li-O2 Battery Capacity and Cycle Life Using Carbon Nanochain/Multiwall Carbon Nanotube Composites. Materials 2025, 18, 3897. [Google Scholar] [CrossRef] [PubMed]
- Yamada, Y.; Takazawa, Y.; Miyazaki, K.; Abe, T. Electrochemical Lithium Intercalation into Graphite in Dimethyl Sulfoxide-Based Electrolytes: Effect of Solvation Structure of Lithium Ion. J. Phys. Chem. C 2010, 114, 11680–11685. [Google Scholar] [CrossRef]
- Alía, J.M.; Edwards, H.G.M. Ion Solvation and Ion Association in Lithium Trifluoromethanesulfonate Solutions in Three Aprotic Solvents. An FT-Raman Spectroscopic Study. Vib. Spectrosc. 2000, 24, 185–200. [Google Scholar] [CrossRef]
- Mahne, N.; Fontaine, O.; Thotiyl, M.O.; Wilkening, M.; Freunberger, S.A. Mechanism and Performance of Lithium–Oxygen Batteries—A Perspective. Chem. Sci. 2017, 8, 6716–6729. [Google Scholar] [CrossRef]
- Burke, C.M.; Pande, V.; Khetan, A.; Viswanathan, V.; McCloskey, B.D. Enhancing Electrochemical Intermediate Solvation through Electrolyte Anion Selection to Increase Nonaqueous Li–O2 Battery Capacity. Proc. Natl. Acad. Sci. USA 2015, 112, 9293–9298. [Google Scholar] [CrossRef]
- Itkis, D.M.; Semenenko, D.A.; Kataev, E.Y.; Belova, A.I.; Neudachina, V.S.; Sirotina, A.P.; Hävecker, M.; Teschner, D.; Knop-Gericke, A.; Dudin, P.; et al. Reactivity of Carbon in Lithium–Oxygen Battery Positive Electrodes. Nano Lett. 2013, 13, 4697–4701. [Google Scholar] [CrossRef] [PubMed]
Disclaimer/Publisher’s Note: The statements, opinions and data contained in all publications are solely those of the individual author(s) and contributor(s) and not of MDPI and/or the editor(s). MDPI and/or the editor(s) disclaim responsibility for any injury to people or property resulting from any ideas, methods, instructions or products referred to in the content. |
© 2025 by the authors. Licensee MDPI, Basel, Switzerland. This article is an open access article distributed under the terms and conditions of the Creative Commons Attribution (CC BY) license (https://creativecommons.org/licenses/by/4.0/).