Article

First-Principles Investigation of Structural, Electronic, and Optical Transitions in FexZr1−xO2 Solid Solutions

1
Laboratory of Physical Chemistry of Materials (LPCM), Faculty of Sciences, University of Amar Telidji, Laghouat 03000, Algeria
2
Laboratoire de Physique des Matériaux, Université Amar Telidji de Laghouat, BP 37G, Laghouat 03000, Algeria
*
Author to whom correspondence should be addressed.
Appl. Sci. 2025, 15(18), 10224; https://doi.org/10.3390/app151810224
Submission received: 23 July 2025 / Revised: 23 August 2025 / Accepted: 25 August 2025 / Published: 19 September 2025
(This article belongs to the Section Materials Science and Engineering)

Abstract

Featured Application

This work provides new insights into the bandgap engineering of transition metal-doped oxides, offering potential applications in photovoltaics, transparent conductors, plasmonic devices, and electrocatalysis.

Abstract

First-principles density-functional theory (PBE, Quantum ESPRESSO) was employed to quantify how Fe substitution modulates the structural, elastic, electronic, and optical behaviour of cubic fluorite FexZr1−xO2 (x = 0.00–1.00). The fluorite FeO2 end member was treated as a hypothetical ambient-pressure limit to trace trends across the solid solution (experimental FeO2 being stabilized in the high-pressure pyrite phase). Mechanical stability was verified via the cubic Born criteria, and composition-dependent stiffness and anisotropy were assessed through Voigt–Reuss–Hill moduli, Pugh ratio, and elastic indices. A strong band-gap narrowing was found—from 3.41 eV (x = 0) to ≈0.02 eV (x = 0.50)—which was accompanied by a visible–NIR red-shift, large absorption (α ≈ 105 cm−1 at higher x), and enhanced refractive index and permittivity; metallic-like response was indicated at high Fe content. Spin-polarized calculations converged to zero total and absolute magnetization, indicating a non-magnetic ground state at 0 K within PBE. The effect of oxygen vacancies (V0)—expected under Fe3+ charge compensation—was explicitly considered: V0 is anticipated to influence lattice metrics, elastic moduli (B, G, G/B), and sub-gap optical activity, potentially modifying stability and optical figures of merit. Stoichiometric (formal Fe4+) predictions were distinguished from V0-rich scenarios. Absolute band gaps may be underestimated at the PBE level.

1. Introduction

Metal oxide materials have attracted considerable attention due to their diverse functional properties and wide range of technological applications in catalysis, sensors, transparent conductors, fuel cells, and photovoltaic devices [1,2,3]. Among these, zirconium dioxide (ZrO2) stands out as a versatile and stable oxide material, renowned for its high melting point (~2700 °C), low thermal conductivity, excellent chemical stability, and exceptional mechanical strength [4,5]. ZrO2 exhibits polymorphism, primarily existing in monoclinic (P21/c), tetragonal (P42/nmc), and cubic fluorite-type ( F m 3 ¯ m ) crystal structures, with the cubic fluorite phase being particularly desirable in high-temperature applications and ionic conductivity systems due to its oxygen vacancy stabilization capabilities [6]. The metastable tetragonal and cubic phases can be stabilized at room temperature through doping with aliovalent cations (e.g., Y3+, Ca2+, Mg2+), enhancing its ionic conductivity for solid oxide fuel cell (SOFC) electrolytes and thermal barrier coatings [7].
Recent studies have explored the potential of transition metal doping in ZrO2 to enhance its electronic, magnetic, catalytic, and optical behaviour [8,9,10]. Among various dopants, iron (Fe) has been of particular interest due to its ability to introduce localized 3d states in the electronic structure, modify optical absorption characteristics, and improve charge carrier transport [11]. Fe-doped ZrO2 systems have been experimentally and theoretically investigated for applications in photocatalysis (e.g., dye degradation, water splitting), solid oxide fuel cells (SOFCs), and spintronic devices due to their mixed ionic–electronic conductivity and possible room-temperature ferromagnetism [12]. The incorporation of Fe into ZrO2 is also known to influence the structural stability and mechanical properties of the host lattice, often inducing lattice distortion and altering phase stability due to differences in ionic radii (Fe2+: 0.78 Å, Fe3+: 0.64 Å vs. Zr4+: 0.84 Å) [13]
Furthermore, the development of Fe-containing mixed oxides, such as FeO2, has opened new pathways for engineering materials with tailored properties. Recent high-pressure studies have revealed that FeO2 adopts a pyrite-type structure ( P a 3 ¯ ) under extreme conditions, exhibiting unique electronic and magnetic properties [14,15]. The Fe3+/Fe2+ redox behaviour in such oxides plays a crucial role in catalytic processes, including the oxygen evolution reaction (OER) and Fenton chemistry [16,17,18]. In ZrO2-based systems, Fe doping can facilitate bandgap tuning (from ~5 eV in pure ZrO2 to ~2–3 eV in Fe-doped ZrO2), dielectric enhancement, and optical activity extension into the visible spectrum, which are essential for photovoltaic and optoelectronic applications [18,19]. However, a comprehensive understanding of how Fe substitution affects the structural, electronic, elastic, and optical properties of ZrO2 in its fluorite configuration remains underdeveloped, particularly at varying doping concentrations.
In this context, the present work aims to systematically investigate the effect of Fe concentration on the structural, electronic, elastic, and optical properties of FexZr1−xO2 (x = 0.0, 0.25, 0.5, 0.75, 1.0) using first-principles density-functional theory (DFT). The study not only provides valuable insights into the fundamental behaviour of Fe-doped ZrO2 systems but also evaluates their potential suitability in photovoltaic and photonic devices. The results offer a deeper understanding of property trends with compositional variation and present new directions for the design of multifunctional oxide materials.

2. Materials and Methods

All calculations in this study were performed based on first-principles DFT using the Quantum ESPRESSO simulation package [20,21]. The initial crystal structure was adopted from the Materials Project database (mp-1565), corresponding to the fluorite-type ZrO2 structure. A full structural relaxation was carried out for each composition using the Broyden–Fletcher–Goldfarb–Shanno (BFGS) optimization algorithm [22], allowing both the lattice parameters and atomic positions to relax simultaneously.
The exchange–correlation energy was treated within the Perdew–Burke–Ernzerhof (PBE) form of the generalized gradient approximation (GGA) [23]. Ultrasoft pseudopotentials (USPP) from the PSLibrary 1.0.0 were employed for all calculations, except for the optical properties, which were computed using norm-conserving pseudopotentials (NCPP) to ensure compatibility with the epsilon.x utility. A plane-wave energy cutoff (ecutwfc) of 60 Ry (~816 eV) and a charge density cutoff (ecutrho) of 600 Ry (~8160 eV) were applied to ensure convergence accuracy.
Atomic forces ere converged to below 0.001 eV/Å, with a stress threshold of 0.05 GPa, while the maximum Hellmann–Feynman force per atom was constrained below 0.0001 eV/Å. The Brillouin-zone integrations were carried out using a Monkhorst–Pack grid [24] of 8 × 8 × 8 k-points for all self-consistent field (SCF) and structural relaxation steps.
The elastic properties were computed using the Thermo_pw module of Quantum ESPRESSO, based on finite strain theory. A total of nine different deformation steps were applied to derive the full elastic tensor components for each composition.
The electronic band structures were computed along high-symmetry paths in the Brillouin zone. For the pure structures (x = 0.0 and x = 1.0), the path Γ—X—U|K—Γ—L—W—X was adopted, while for the doped compositions (x = 0.25 and x = 0.75), the path Γ—X—M—Γ—R—X|R—M was used. The x = 0.50 composition followed the path Γ—X—M—Γ—Z—R—A—Z|X—R|M—A to accommodate the altered symmetry of the supercell. A Methfessel–Paxton smearing scheme was applied to improve electronic convergence.
In addition to the standard PBE-GGA calculations described above, we carried out DFT+U (GGA+U) computations using the same Quantum ESPRESSO framework and parameters. A Hubbard on-site correction (U ≈ 4 eV) was applied to the Fe 3d orbitals to better capture the localized electron behavior and address the known bandgap underestimation of GGA. All other settings (pseudopotentials, energy cutoffs, k-point mesh, etc.) were identical to the PBE calculations. This GGA+U scheme was used to recompute the electronic structure for each composition, as discussed in Section 3.3.
The optical properties were calculated using the epsilon.x module of Quantum ESPRESSO. The complex dielectric function was obtained within the random phase approximation (RPA), and all frequency-dependent optical constants such as refractive index, extinction coefficient, absorption coefficient, reflectivity, and energy loss function were subsequently derived from the dielectric data. A conventional cell containing four ZrO2 units was used as the basis for doping simulations. Although spin-polarized calculations were also tested, they did not result in significant changes in total energy or electronic structure and were not retained in the final results.

3. Results and Discussion

3.1. Structural Properties and Chemical Stability

The structural properties and chemical stability of FexZr1−xO2 compounds were systematically investigated using first-principles DFT calculations. All compounds were considered in the cubic fluorite-type crystal structure (space group F m 3 ¯ m , No. 225). Structural optimizations were performed by fully relaxing both atomic positions and lattice parameters until the ground-state configurations were reached.
Figure 1 illustrates the crystallographic representation of the fluorite-type FexZr1−xO2 structure, showing both the conventional cell and the primitive cell. The optimized lattice parameters, and formation energies of the two end-member compounds (ZrO2 and FeO2) are summarized in Table 1, alongside comparative values from previous experimental and theoretical studies. For ZrO2, the calculated lattice constant is 5.12 Å, which is in excellent agreement with experimental data and prior theoretical works, including values of 5.071 Å, 5.12 Å, 5.132 Å, and 5.133 Å [25]. This consistency validates the accuracy and reliability of the computational parameters employed in this study.
In FeO2, the computed lattice parameter for the cubic fluorite model is a = 4.60a = 4.60a = 4.60 Å. Experimentally, however, FeO2 stabilizes under high pressure (≈70–140 GPa) in the pyrite-type (Py) structure rather than fluorite. The pyrite structure is cubic (space group P a 3 ¯ ), analogous to FeS2: Fe is octahedrally coordinated (FeO6), and the oxygen sublattice forms O–O dimers (peroxide units). This denser topology, together with the applied pressure, yields smaller lattice parameters than those expected for an ambient-pressure fluorite phase. Our study therefore uses hypothetical fluorite-FeO2 at 0 GPa as an end member to explore continuous solid solutions with ZrO2. The difference between our values and literature reports for pyrite-FeO2 primarily reflects (i) the distinct crystal phase and pressure conditions and (ii) routine computational-methodology differences (choice of exchange–correlation functional, pseudopotentials, etc.) [33].
In terms of chemical stability, the calculated formation energy (Ef) provides key insight. The formation energies were determined based on the following relation [34]:
E f F e x Z r 1 x O 2 = E F e x Z r 1 x O 2 4 x E b u l k F e 4 1 x E b u l k Z r 8 E b u l k O 4
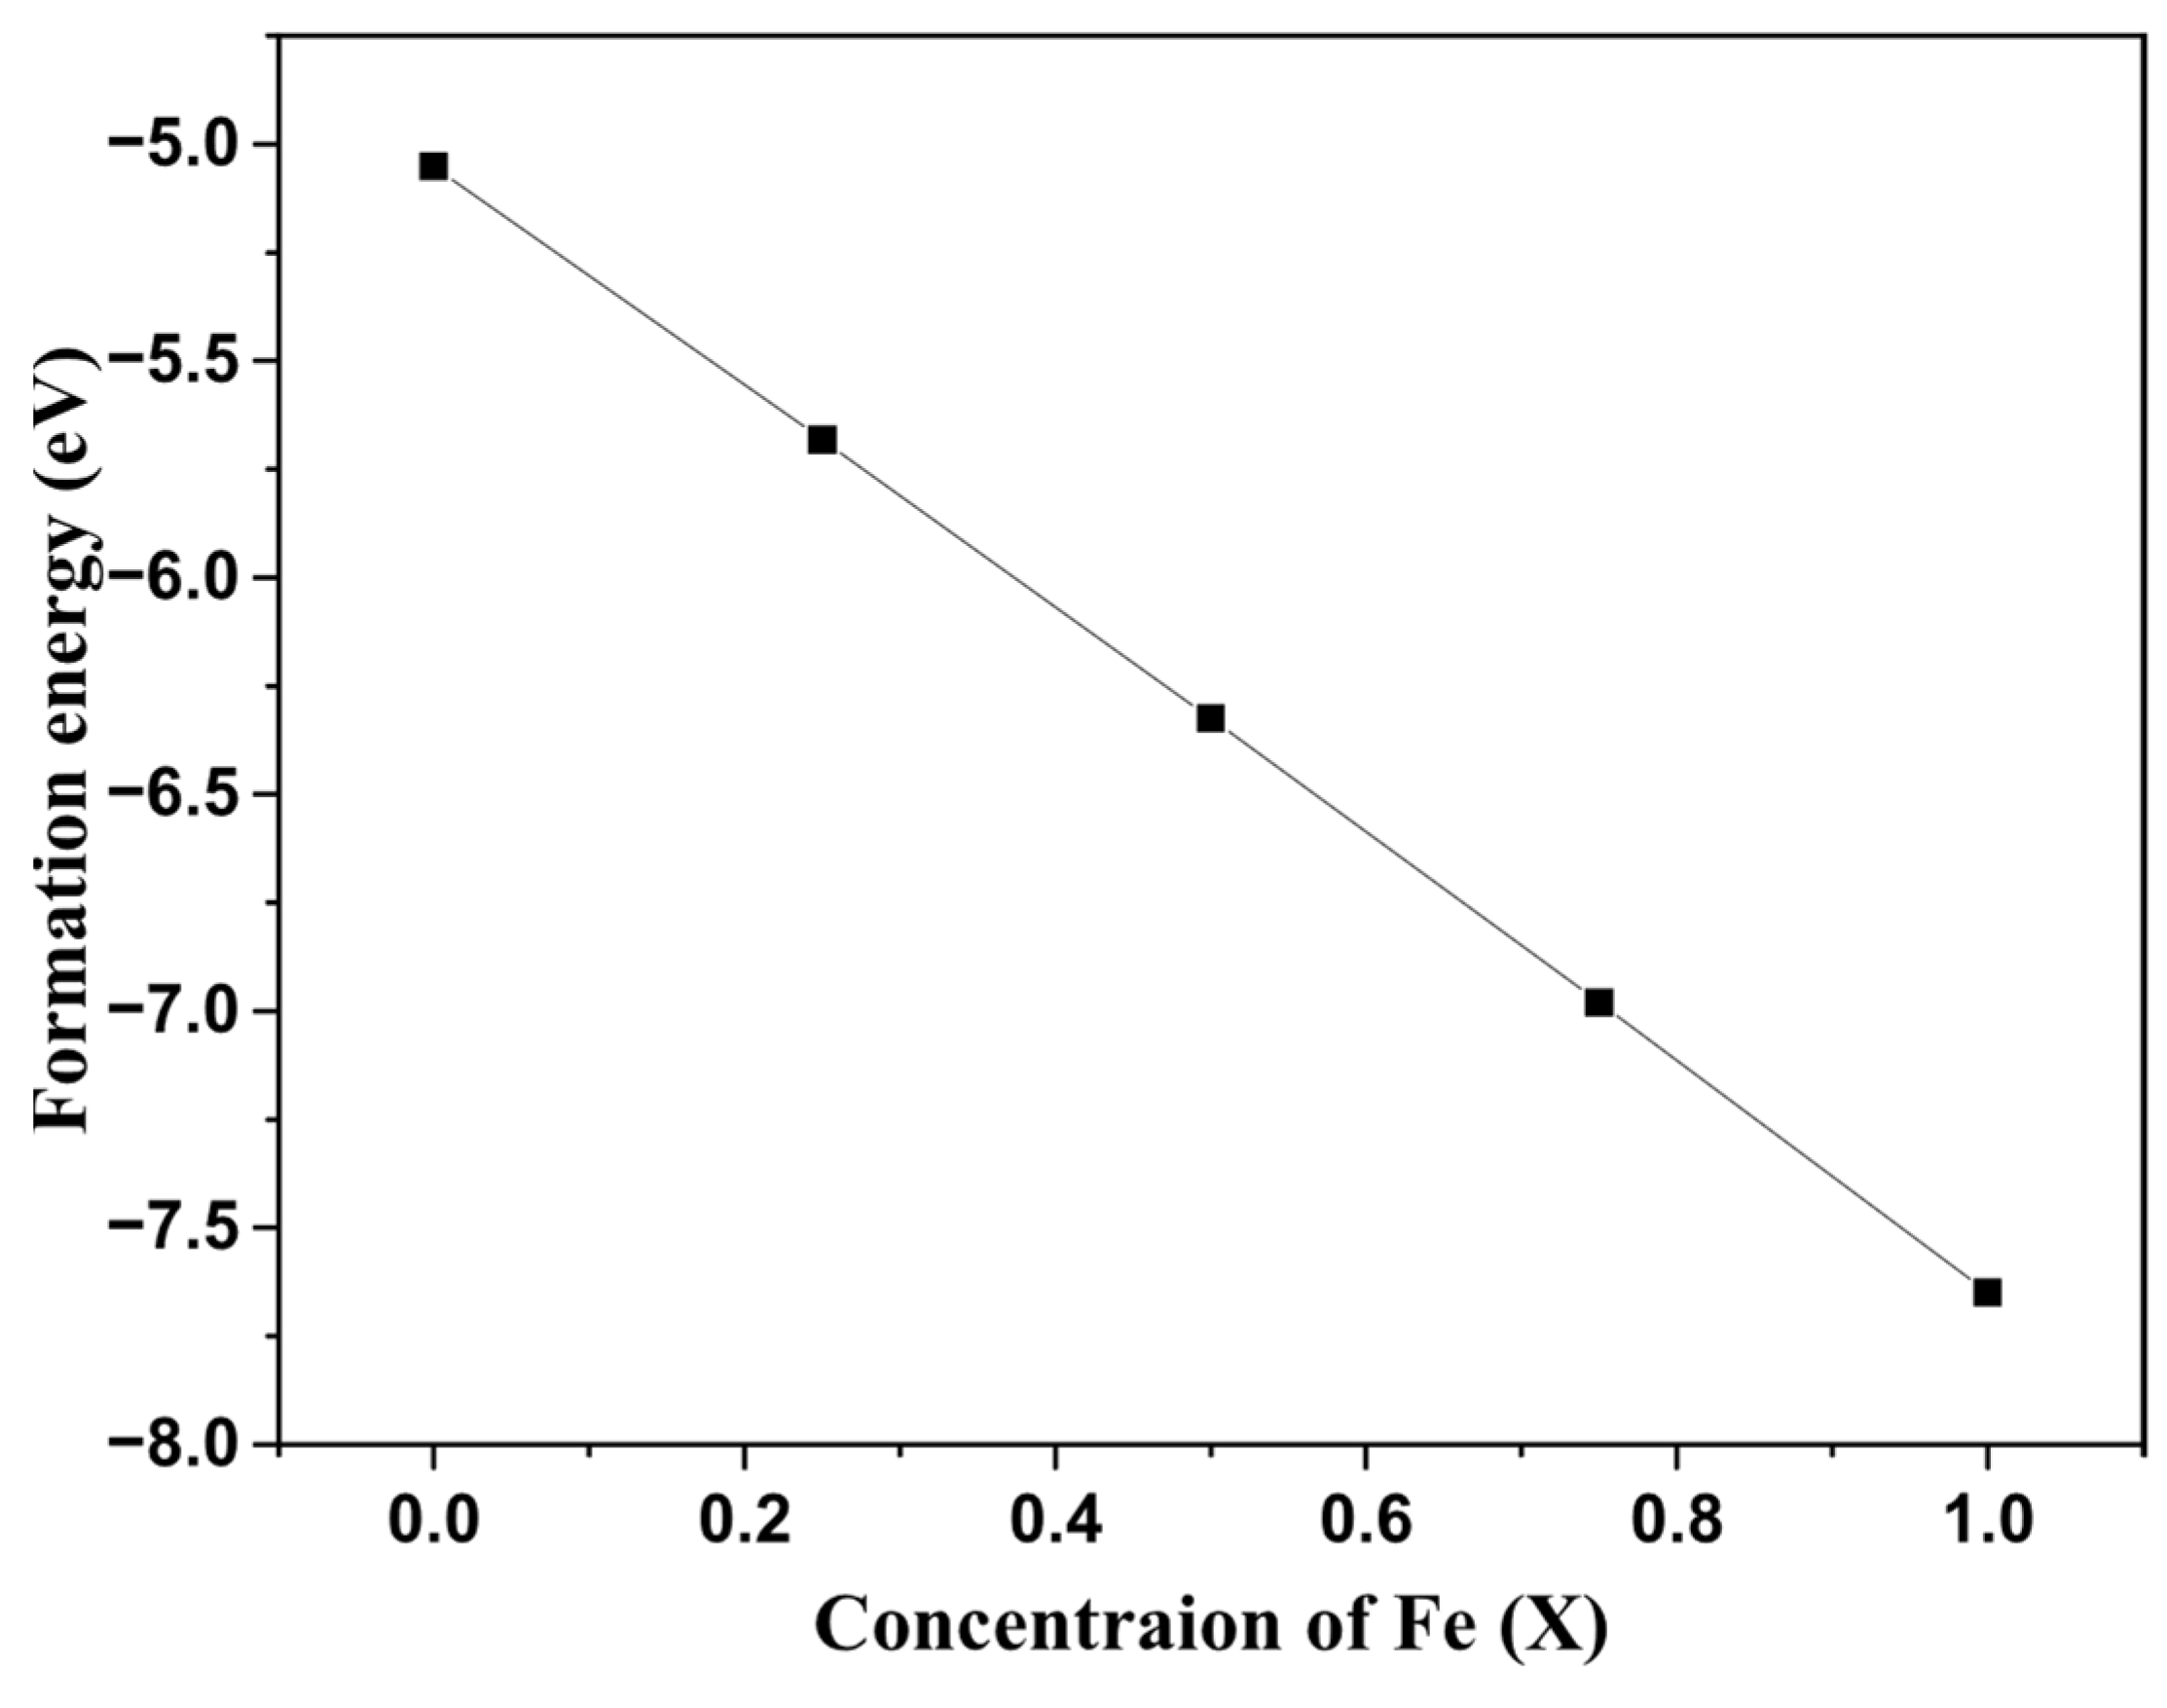
where E represents the total energy per formula unit of the respective compound or elemental reference. Here ‘chemical stability’ refers strictly to negative formation enthalpy with respect to the elements; it does not imply phase stability versus all competing oxides nor dynamic stability. The results show a more negative formation energy for FeO2 (−7.65 eV) compared to ZrO2 (−5.06 eV), indicating that the Fe-rich compound is chemically more stable under the given conditions. This trend can be attributed to the stronger Fe–O bonding compared to Zr–O bonding in the fluorite framework.
The results show a more negative formation energy for FeO2 (−7.65 eV) compared to ZrO2 (−5.06 eV), indicating that the Fe-rich compound is chemically more stable under the given conditions. This enhanced stability can be linked to the stronger Fe–O bonding compared to Zr–O bonding in the fluorite framework, as well as the effect of Fe substitution on increasing the surface area of the system, which, although moderate, facilitates improved chemical reactivity and stabilization [35]. Figure 2 illustrates the variation in formation energy (Ef) as a function of Fe concentration (x), showing a systematic decrease with higher Fe content. The minimum formation energy is reached at x = 1, highlighting a strong thermodynamic driving force for Fe incorporation into the ZrO2 matrix. These results confirm that Fe doping is chemically favorable, promoting the formation and stabilization of FexZr1−xO2 solid solutions across the studied composition range.

3.2. Mechanical Behavior and Stability

Elastic properties are fundamental parameters that characterize the response of materials to external mechanical stresses. They provide crucial insights into the stiffness, compressibility, ductility, and overall mechanical integrity of a crystal. These properties are strongly linked to the nature of atomic bonding and crystal symmetry. In particular, the elastic constants (Cij) represent the stiffness coefficients associated with different directional deformations in the crystal lattice. Moreover, the bulk modulus (B), shear modulus (G), Young’s modulus (E), and Poisson’s ratio (ν) offer a macroscopic perspective on how materials respond to uniform compression, shear, tensile forces, and volumetric strain, respectively. Evaluating these properties across various Fe concentrations in FexZr1−xO2 reveals the influence of Fe substitution on mechanical behavior and stability.
From the calculated elastic constants, it is evident that all compositions satisfy the Born mechanical stability criteria, confirming the mechanical stability of FexZr1−xO2 for all doping levels. For tetragonal systems, the conditions [36] such as C 11 > 0 , C 33 > 0 , C 44 > 0 , C 66 > 0 , C 11 > C 12 , and C 11 + C 33 2 C 13 > 0 are fulfilled, ensuring structural robustness under small deformations. The detailed elastic constants and verification of these stability criteria are provided in Table S1 (Supporting Information).
Analysing the trends in Cij values from Table 2, we observe a general decline in the principal stiffness coefficients (C11, C22, C33) with increasing Fe content. This reduction reflects a progressive softening of the crystal lattice due to the weaker Fe–O bonding compared to the stronger Zr–O interactions in undoped ZrO2. The off-diagonal elastic constants, such as C12 and C13, remain relatively stable or slightly increase, indicating modest variations in directional coupling within the crystal. Meanwhile, the shear elastic constants (C44 and C66) show a marked decrease, especially at higher Fe concentrations, implying a reduced resistance to shear deformation and enhanced ductility. For more details on elastic moduli about FexZr1−xO2 see Table S2.
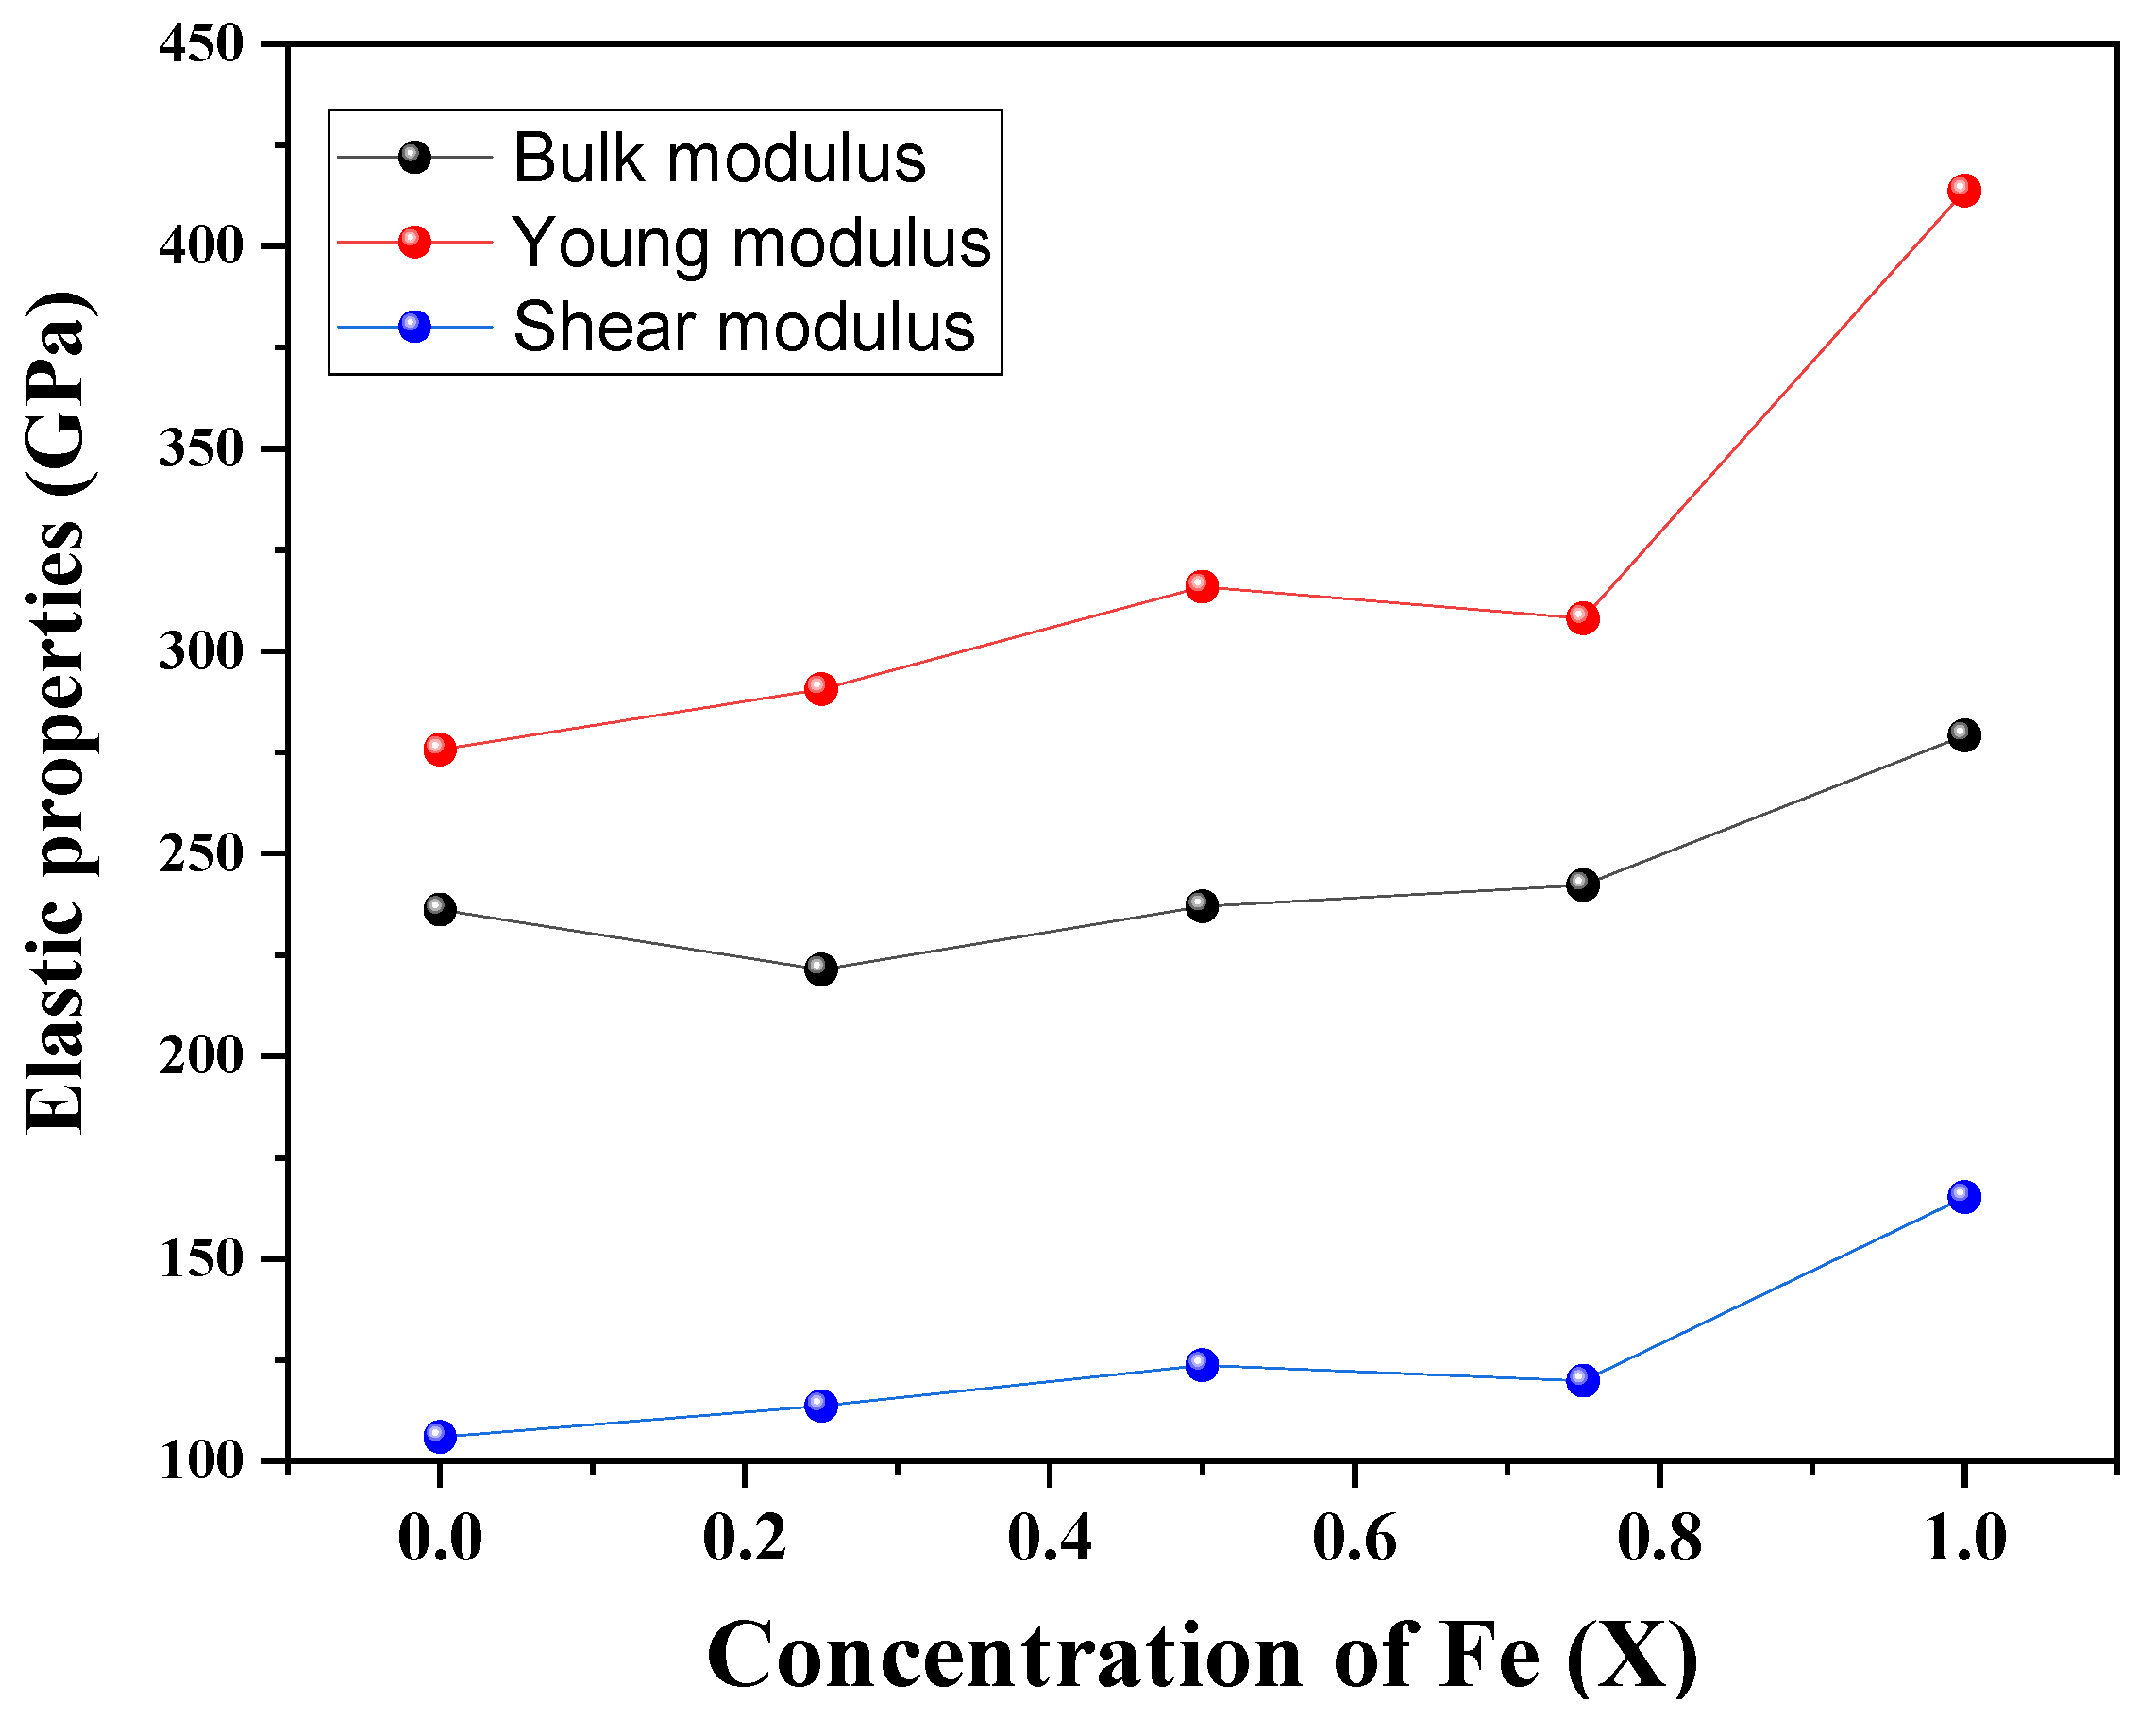
This behaviour is mirrored in the calculated moduli. The bulk modulus (B) consistently decreases with Fe incorporation, indicating enhanced compressibility of the material. Similarly, the shear modulus (G) and Young’s modulus (E) decline with doping, confirming a softening effect and reduced stiffness of the lattice Figure 3. These findings highlight that Fe-doping promotes mechanical pliability in the ZrO2 host lattice. Furthermore, the Poisson’s ratio (ν) increases slightly with Fe content, which typically correlates with increased ductility and a shift from brittle to more ductile mechanical character.

3.3. Electronic Properties

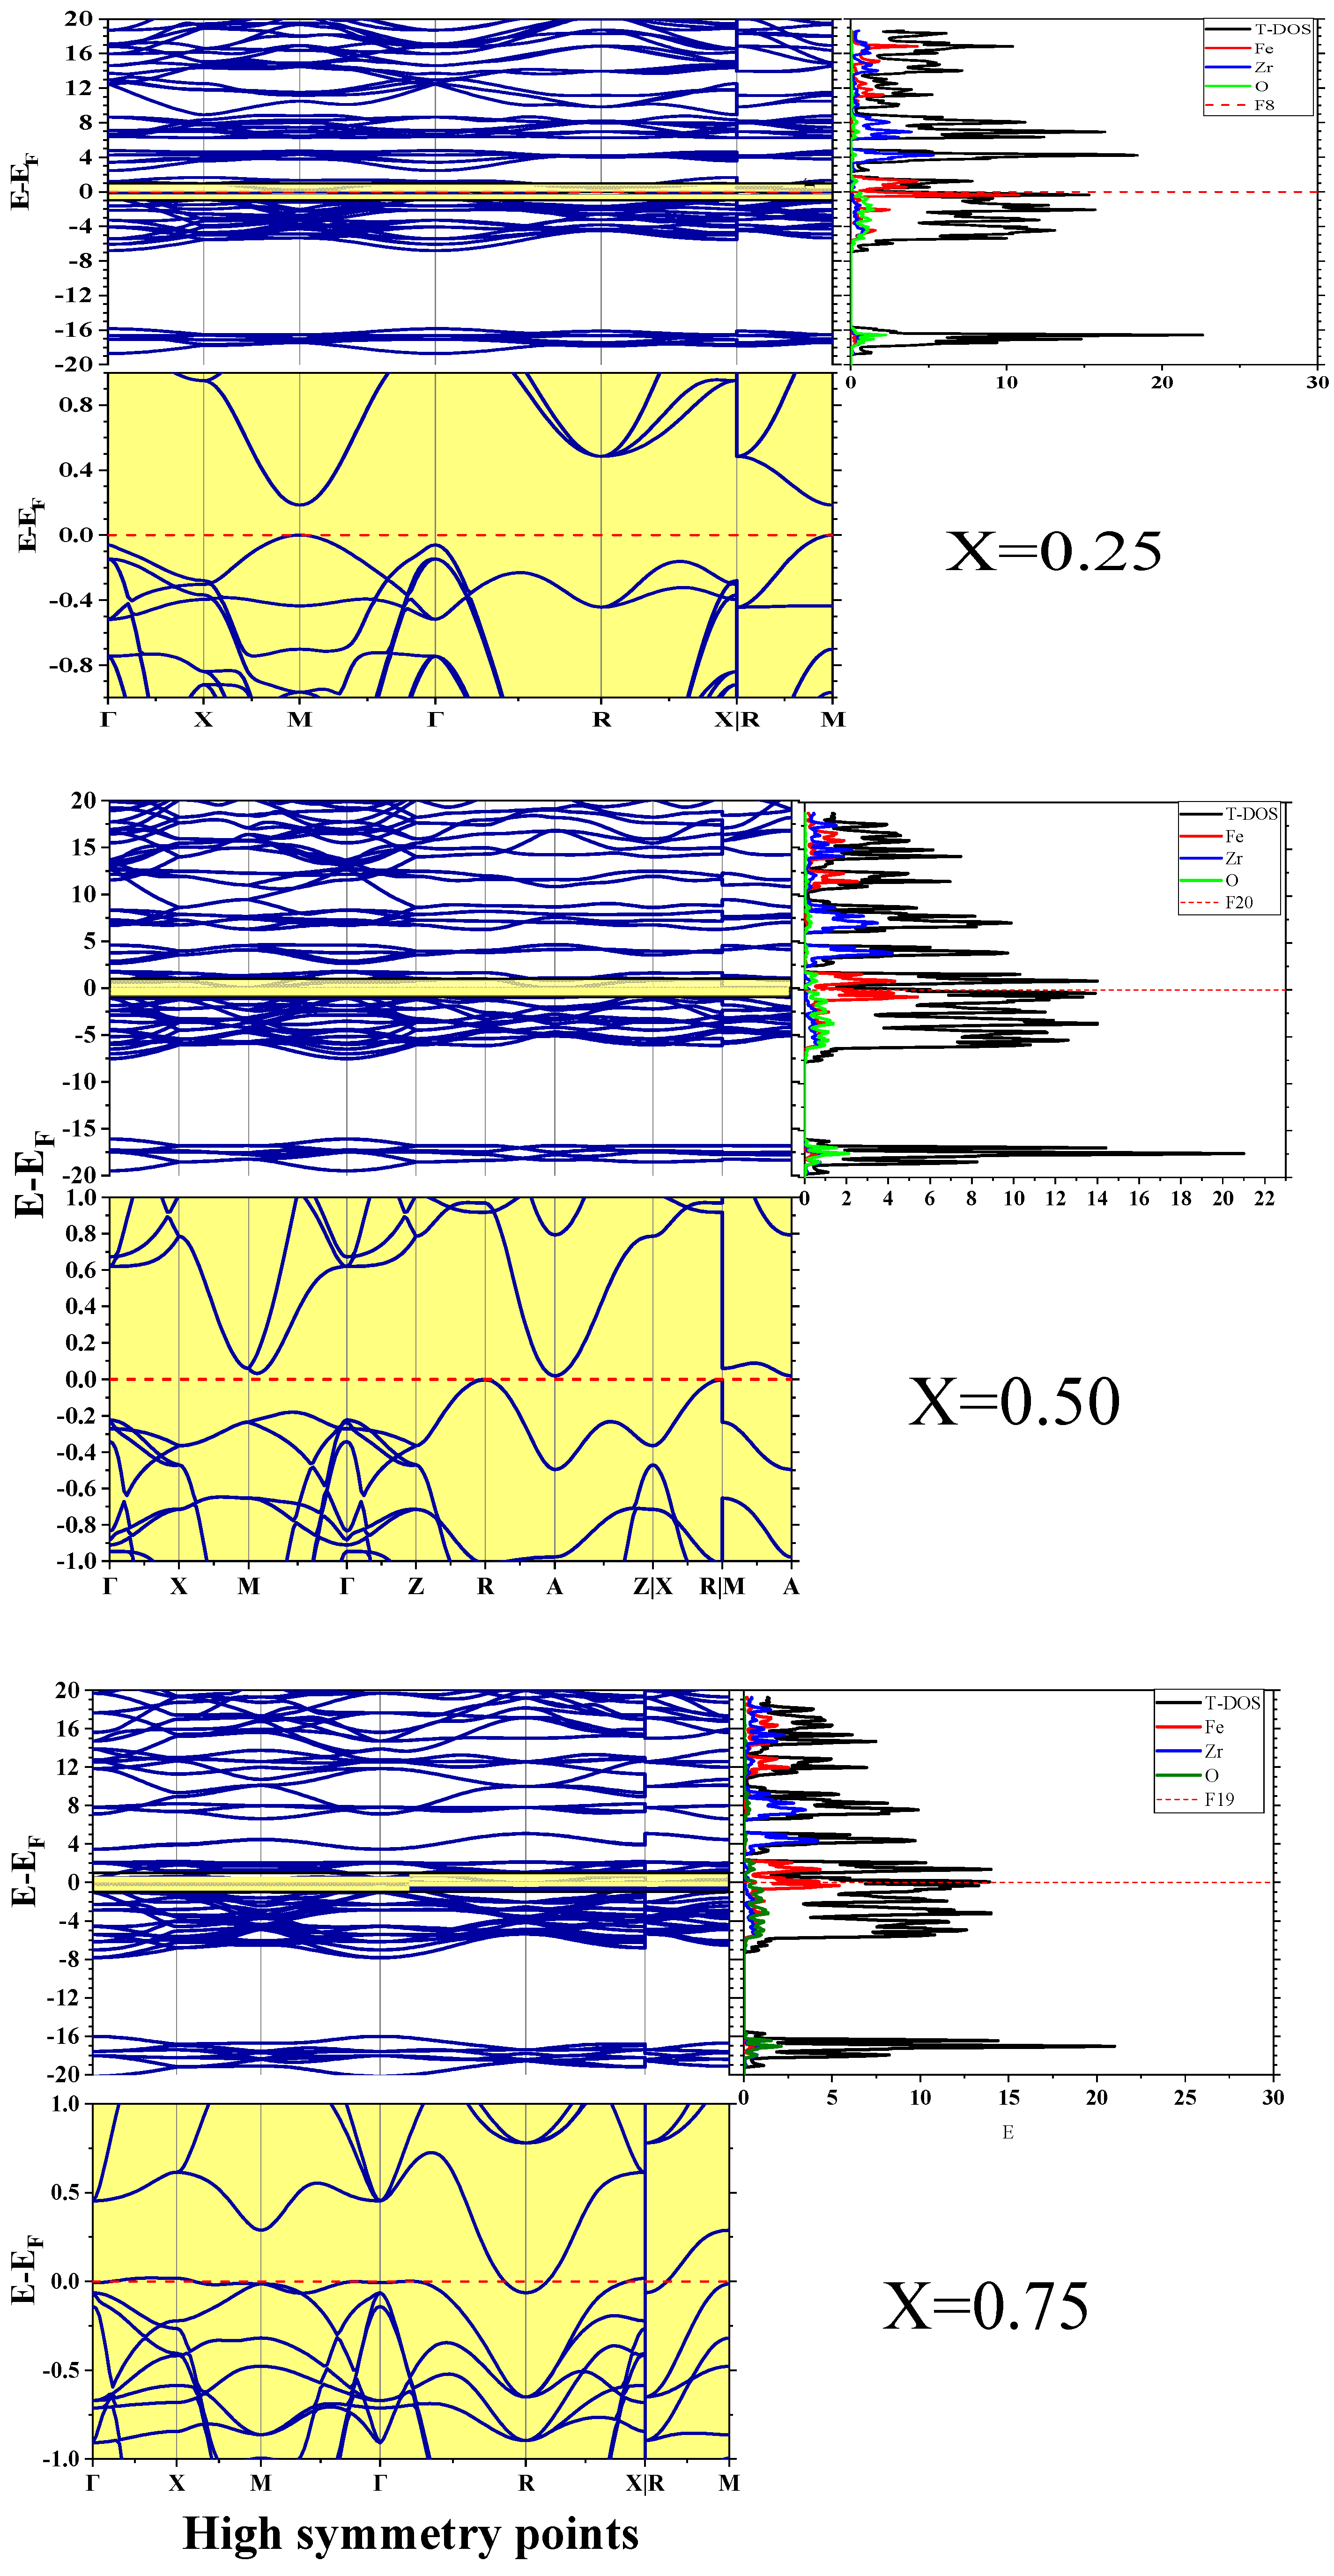
To elucidate the effect of Fe doping on the electronic behaviour of FexZr1−xO2, we systematically computed the band structure and total density of states (TDOS) for different Fe concentrations (x = 0.00, 0.25, 0.50, 0.75, 1.00) using DFT. These calculations reveal how Fe incorporation significantly alters the bandgap characteristics, modifies the electronic state distribution, and drives a transition from insulating to metallic behaviour as illustrated in Table 3. Additionally, bandgap calculations were repeated using a PBE+U scheme for all compositions (see Table 3). The GGA+U results supplement the PBE findings, demonstrating qualitatively improved behaviour (e.g., finite gaps in Fe-rich compositions) without altering the overall trend of decreasing bandgap with increasing Fe content.
Figure 4, Figure 5 and Figure 6 present the calculated band structures and TDOS for FexZr1−xO2. The pure ZrO2 compound (x = 0.00) exhibits a direct bandgap of 3.41 eV at the Γ-point, consistent with previous experimental reports (3.2–5.1 eV) and theoretical predictions (3.4–4.9 eV using GGA) for cubic and tetragonal ZrO2 [3,40]. This confirms its classification as a wide-bandgap semiconductor, suitable for UV-optoelectronic and insulating applications. Upon Fe doping, a progressive narrowing of the bandgap is observed. For x = 0.25, the bandgap reduces drastically to 0.184 eV, with a transition to a direct M–M gap. At x = 0.50, the bandgap becomes indirect (R–A transition) and reduces further to 0.018 eV, indicating near-metallic behaviour. By x = 0.75, a negative bandgap of −0.062 eV (X–R Overlap) is obtained, signifying a transition to a semi-metallic state with band overlap (see Figure 4). This behaviour is consistent with other Fe-doped oxides, such as Fe:TiO2 and Fe-doped CeO2, where Fe 3d states introduce mid-gap defect levels that effectively reduce the bandgap and enhance visible-light absorption [41].
With the inclusion of Hubbard U, the electronic structure is qualitatively altered for the Fe-rich compositions. PBE+U calculations (applying U on Fe 3d) open up bandgaps that PBE had underestimated. For example, at x = 0.75 (Zr0.25Fe0.75O2), PBE predicted a slight band overlap (a negative gap), whereas GGA+U yields a small but finite bandgap of about 0.03 eV (Table 3), restoring a semiconducting state. Likewise, the FeO2 end member (x = 1.0) shows an increased bandgap of ~0.30 eV under GGA+U, compared to the 0.25 eV gap from PBE. In general, applying the Hubbard correction shifts all bandgap values upward (see Table 3) and ensures that even the Fe-rich solid solutions remain semiconductors rather than metallic. This adjustment brings our bandgap results into better agreement with higher-level methods and experimental expectations—in particular, the GGA+U bandgaps follow the same decreasing trend with x but do not collapse to zero, in line with hybrid-functional predictions and literature reports for Fe-doped zirconia. The band-structure and DOS plots from the GGA+U calculations for x = 0.25, 0.50, 0.75, and 1.00 are provided in the Supplementary Information (Figures S1–S4), illustrating the opened gaps and the upward shift in conduction band minimum due to the Hubbard U. We emphasize that these DFT+U results complement the PBE data—they highlight the impact of electron correlation on the band structure without changing the overall conclusions of bandgap evolution in FexZr1−xO2.
The TDOS analysis supports this interpretation, showing a substantial contribution from Fe 3d states near the Fermi level (E_F). This results in a high density of electronic states at E_F, promoting metallic conductivity for x ≥ 0.25. The increased DOS near the Fermi level implies higher carrier densities, which are desirable for transparent conductive oxide (TCO) applications but may also lead to free-carrier absorption, potentially limiting photovoltaic efficiency at higher doping levels. The emergence of a negative bandgap at x = 0.75 is particularly significant. This indicates that the conduction band minimum has overlapped with the valence band maximum, transitioning the material into a semi-metallic regime. Such behaviour is not merely a theoretical artifact but has practical implications. Semi-metals with negative bandgaps are valuable for various advanced technological applications, including:
  • Transparent Conductive Oxides (TCOs): High electrical conductivity combined with partial optical transparency makes Fe-rich ZrO2 compounds suitable for transparent electrodes in solar cells, LEDs, and display technologies.
  • Plasmonic Devices: Semi-metals can support surface plasmon resonances in the near-infrared region, enabling biosensors, metamaterials, and photonic devices.
  • Thermoelectric Applications: Coexistence of electron and hole pockets can enhance thermoelectric performance by increasing electrical conductivity while maintaining Seebeck coefficient contributions.
  • Electrocatalysis: The metallic nature of Fe0.75Zr0.25O2 may facilitate fast electron transfer reactions, improving performance in oxygen evolution reactions (OER) or hydrogen evolution reactions (HER).
Similar metallic transitions have been reported in Fe-doped ZrO2 under high-pressure conditions and in Fe-doped SrTiO3, where Fe 3d states hybridize with host electronic states, leading to band overlap and gap closure [42,43]. These findings highlight that Fe doping provides a tuneable pathway for engineering ZrO2-based materials, enabling a transition from a wide-bandgap insulator to a semi-metallic conductor. This versatility opens new avenues for applications in photovoltaic absorbers, transparent conductors, plasmonic systems, and electrocatalytic devices, depending on the Fe concentration.

3.4. Optical Properties

The optical behavior of the studied material system as a function of compositional variation (x = 0.00, 0.25, 0.5, 0.75, 1.00) was thoroughly investigated through first-principles calculations. Key optical constants such as the refractive index (n), extinction coefficient (k), reflectivity (R), and energy loss function (ELF) were extracted from the complex dielectric function. These parameters provide vital insight into the electronic transition mechanisms, photon-material interactions, and the suitability of the material for optoelectronic and photonic applications.
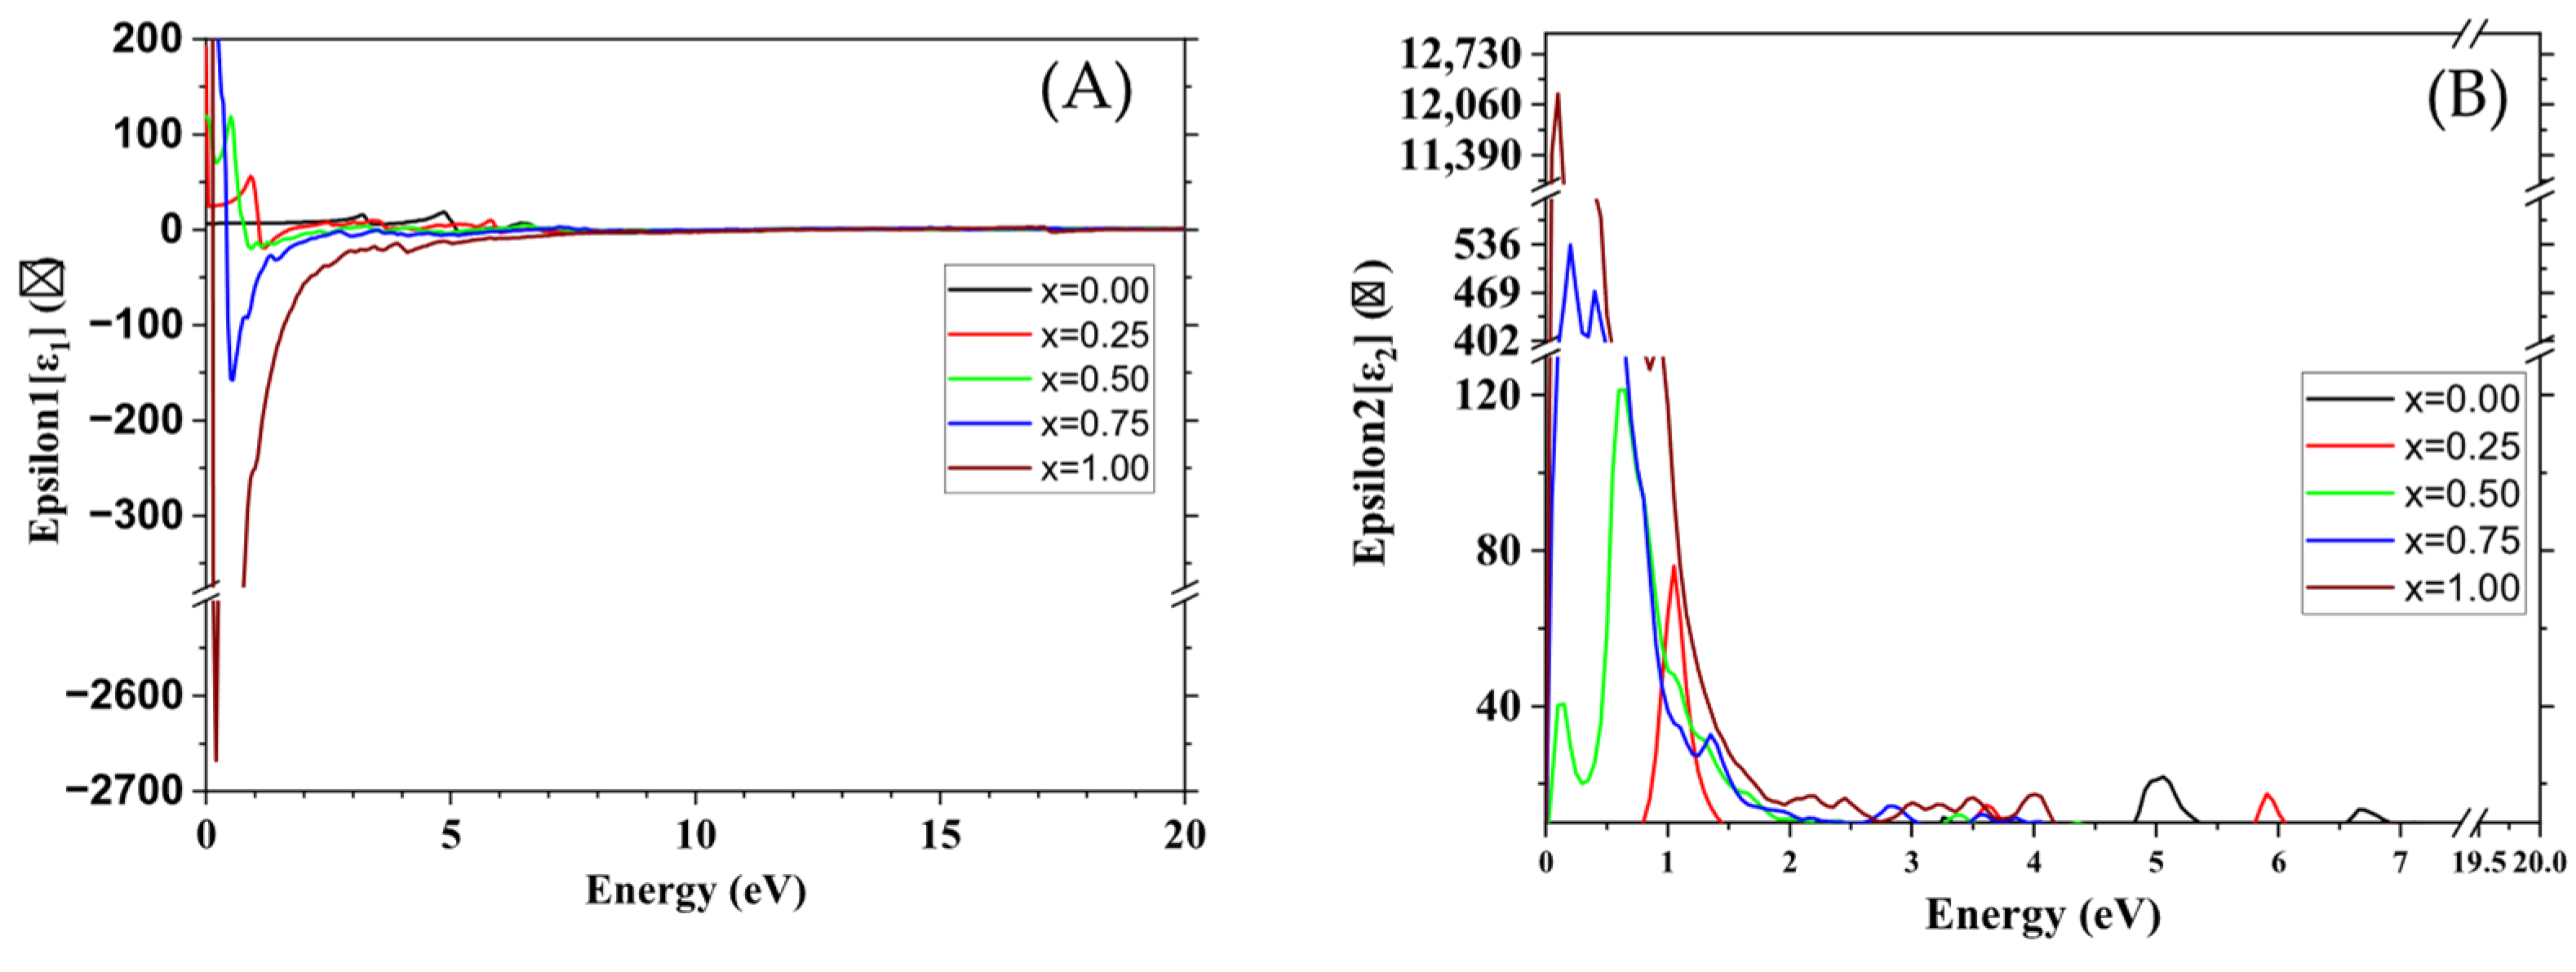
The optical properties of FexZr1−xO2 were analyzed by computing the complex dielectric function ε ω = ε 1 ω + i ε 2 ω , which provides fundamental insight into the interaction of electromagnetic radiation with the material. The real part of the dielectric function, ε1(ω) (Figure 7A), describes the dispersive response, while the imaginary part, ε2(ω) (Figure 7B), represents the absorptive behavior due to electronic transitions.
The ε1(ω) spectrum provides critical insight into the material’s polarization response under an external electromagnetic field and determines the dispersive (non-absorptive) optical behaviour. At low photon energies (infrared to visible range), ε1(0), also known as the static dielectric constant, exhibits significant variation with Fe doping content. The ZrO2 compound (x = 0.00) exhibits a moderate static dielectric constant ε1(0) = 6.67, consistent with previous studies on wide bandgap oxides [44,45]. For instance, Harrop and Wanklyn (1967) reported a dielectric constant of 22 ± 3 for single-crystal zirconia [46], while Sanesi et al. (1971) measured a value of 13.5 for monoclinic zirconia [47]. Additional literature values for comparison with our findings are summarized in Table 4. These findings align with the moderate ε1(0) observed in our study. As the Fe concentration increases, a clear trend of enhancement in the static dielectric constant is observed for x = 0.25 and 0.50, reflecting enhanced polarizability of the medium due to Fe-induced states within the bandgap.
As the Fe concentration increases, a clear trend of enhancement in the static dielectric constant is observed for x = 0.25 and 0.50, reflecting enhanced polarizability of the medium due to Fe-induced states within the bandgap. Importantly, Fe doping is also known to increase the density of oxygen vacancies, which act as donor-like defects that introduce localized states within the bandgap [48]. These vacancy-induced states contribute to additional sub-bandgap absorption, enhancing ε2(ω) in the visible range and thereby improving the light-harvesting efficiency of the material.
At higher Fe doping levels (x = 0.75 and 1.00), ε1(ω) becomes significantly negative in the low-energy range, indicating a metallic-like response. This transition aligns with the previously observed bandgap closing, confirming the shift from semiconducting to semi-metallic behaviour. In this regime, the combined effects of Fe 3d states and oxygen vacancy levels produce strong free-carrier contributions, leading to plasmonic or reflective modes. While such a response is unfavourable for photovoltaic applications due to increased reflection and reduced light absorption, it may be useful in plasmonic devices where strong light–matter interactions are desired.
Table 4. Optical properties of ZrO2 and FeO2 (this work vs. literature).
Optical Proprieties ZrO2FeO2
Absorption coefficient (Cm−1)This studyNear-zero>105
Other studiesNear-zero [49]About 105 [38]
Dielectric constant  ε This study6.67
Other studies5.85 [44]Not meaningful for a metal
Refractive index (visible)This study2.6/
Other studies2.15–2.20 [50]/
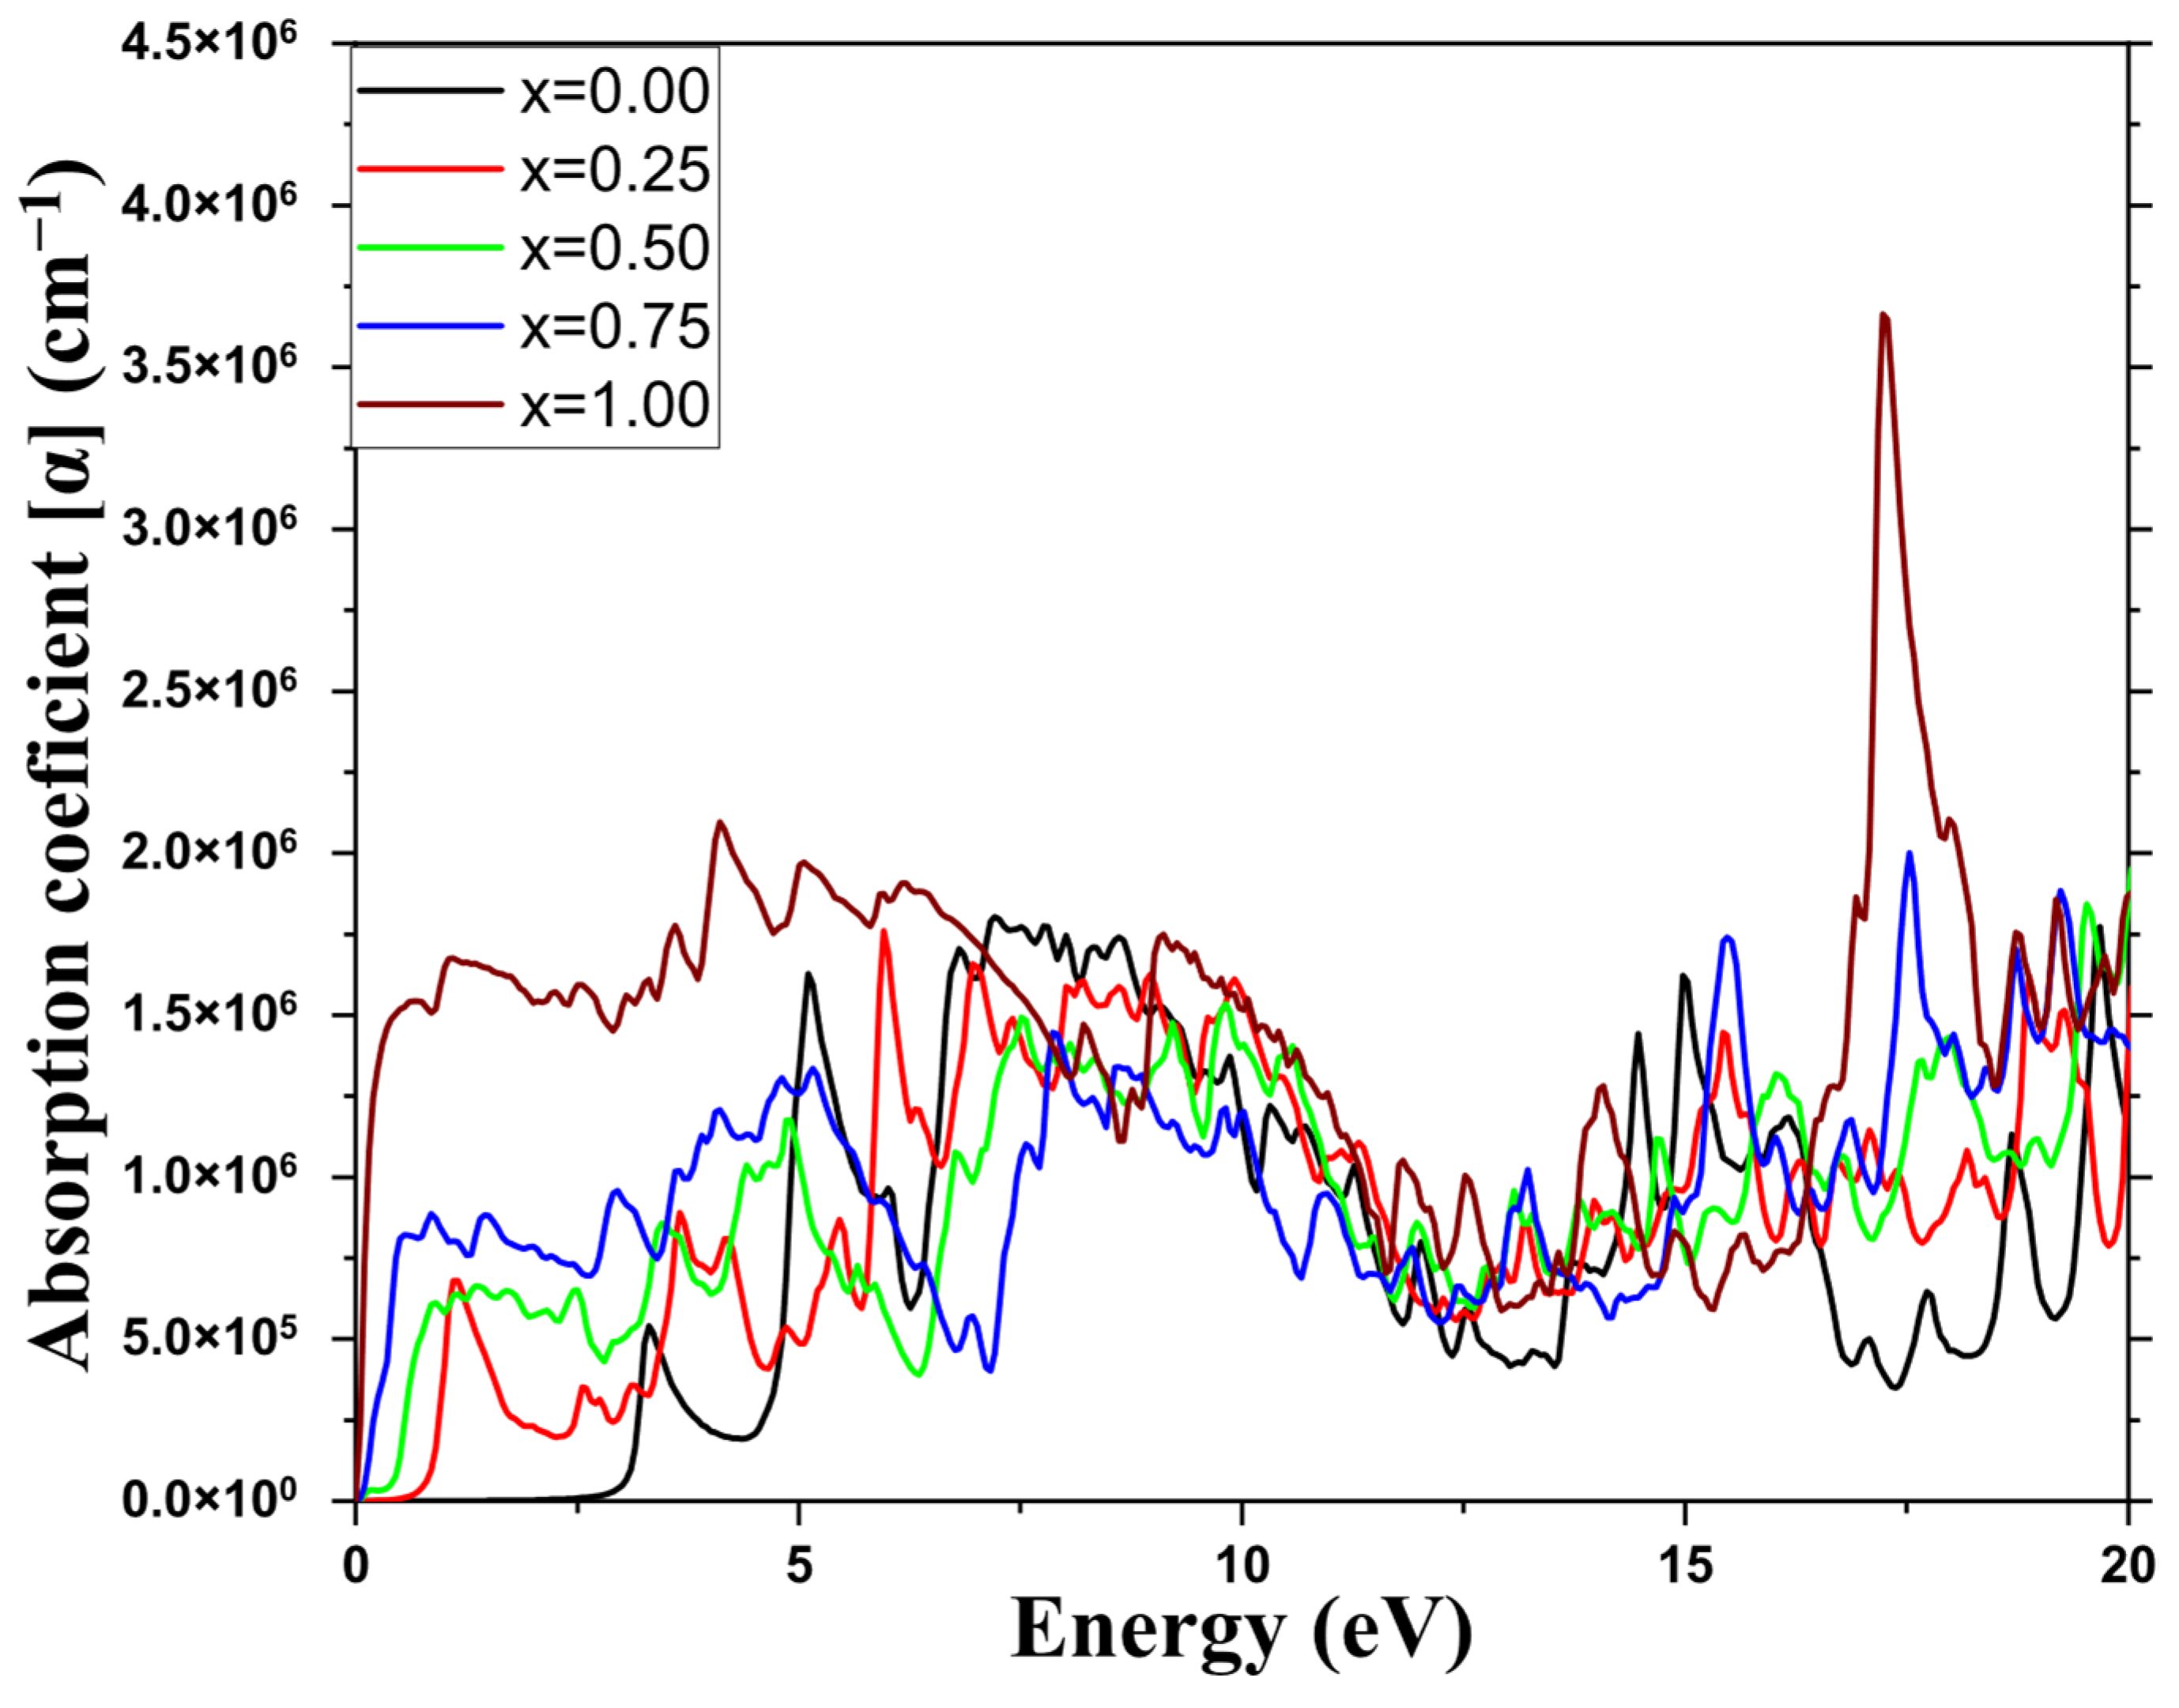
Figure 8 presents the energy-dependent absorption coefficient α(ω) of FexZr1−xO2 for different Fe doping concentrations (x = 0.00, 0.25, 0.50, 0.75, 1.00). The absorption coefficient is a fundamental optical property that quantifies the ability of a material to absorb photons at different energies, and it directly reflects the optical bandgap and interband electronic transitions. The absorption coefficient is calculated using the dielectric function components as follows:
α ω = 2 ω c ε 1 2 ω + ε 2 2 ω ε 1 ω 1 / 2
where ω is the photon angular frequency, c is the speed of light in vacuum, ε 1 and ε 2 are the real and imaginary parts of the dielectric function, respectively.
For undoped ZrO2 (x = 0.00), the absorption coefficient starts to rise sharply around 3.4 eV, consistent with the electronic bandgap. The absorption remains significant across the UV range, reflecting the material’s intrinsic wide-bandgap nature.
As Fe concentration increases, a significant redshift in the absorption edge is observed, most notably at x = 0.25 and 0.50, where optical transitions begin at much lower energies (<1 eV). This is in perfect agreement with the narrowing of the bandgap derived from band-structure and ε2(ω) results. This behaviour enhances the absorption in the visible and near-infrared (NIR) regions, which is critical for photovoltaic and optoelectronic applications.
High absorption coefficient materials are essential for achieving thin-film photovoltaic devices, where light needs to be strongly absorbed in minimal thickness. In general, values above 105 cm−1 in the visible range are considered excellent for absorbers [19,51]. Therefore, Fe-doped ZrO2 (x = 0.25–0.50) exhibits favourable optical absorption characteristics that make it a promising material for solar energy harvesting. The results clearly highlight the synergistic effect of Fe doping on both the electronic structure and optical absorption, enabling tuneable properties suitable for designing efficient photovoltaic and optoelectronic devices.
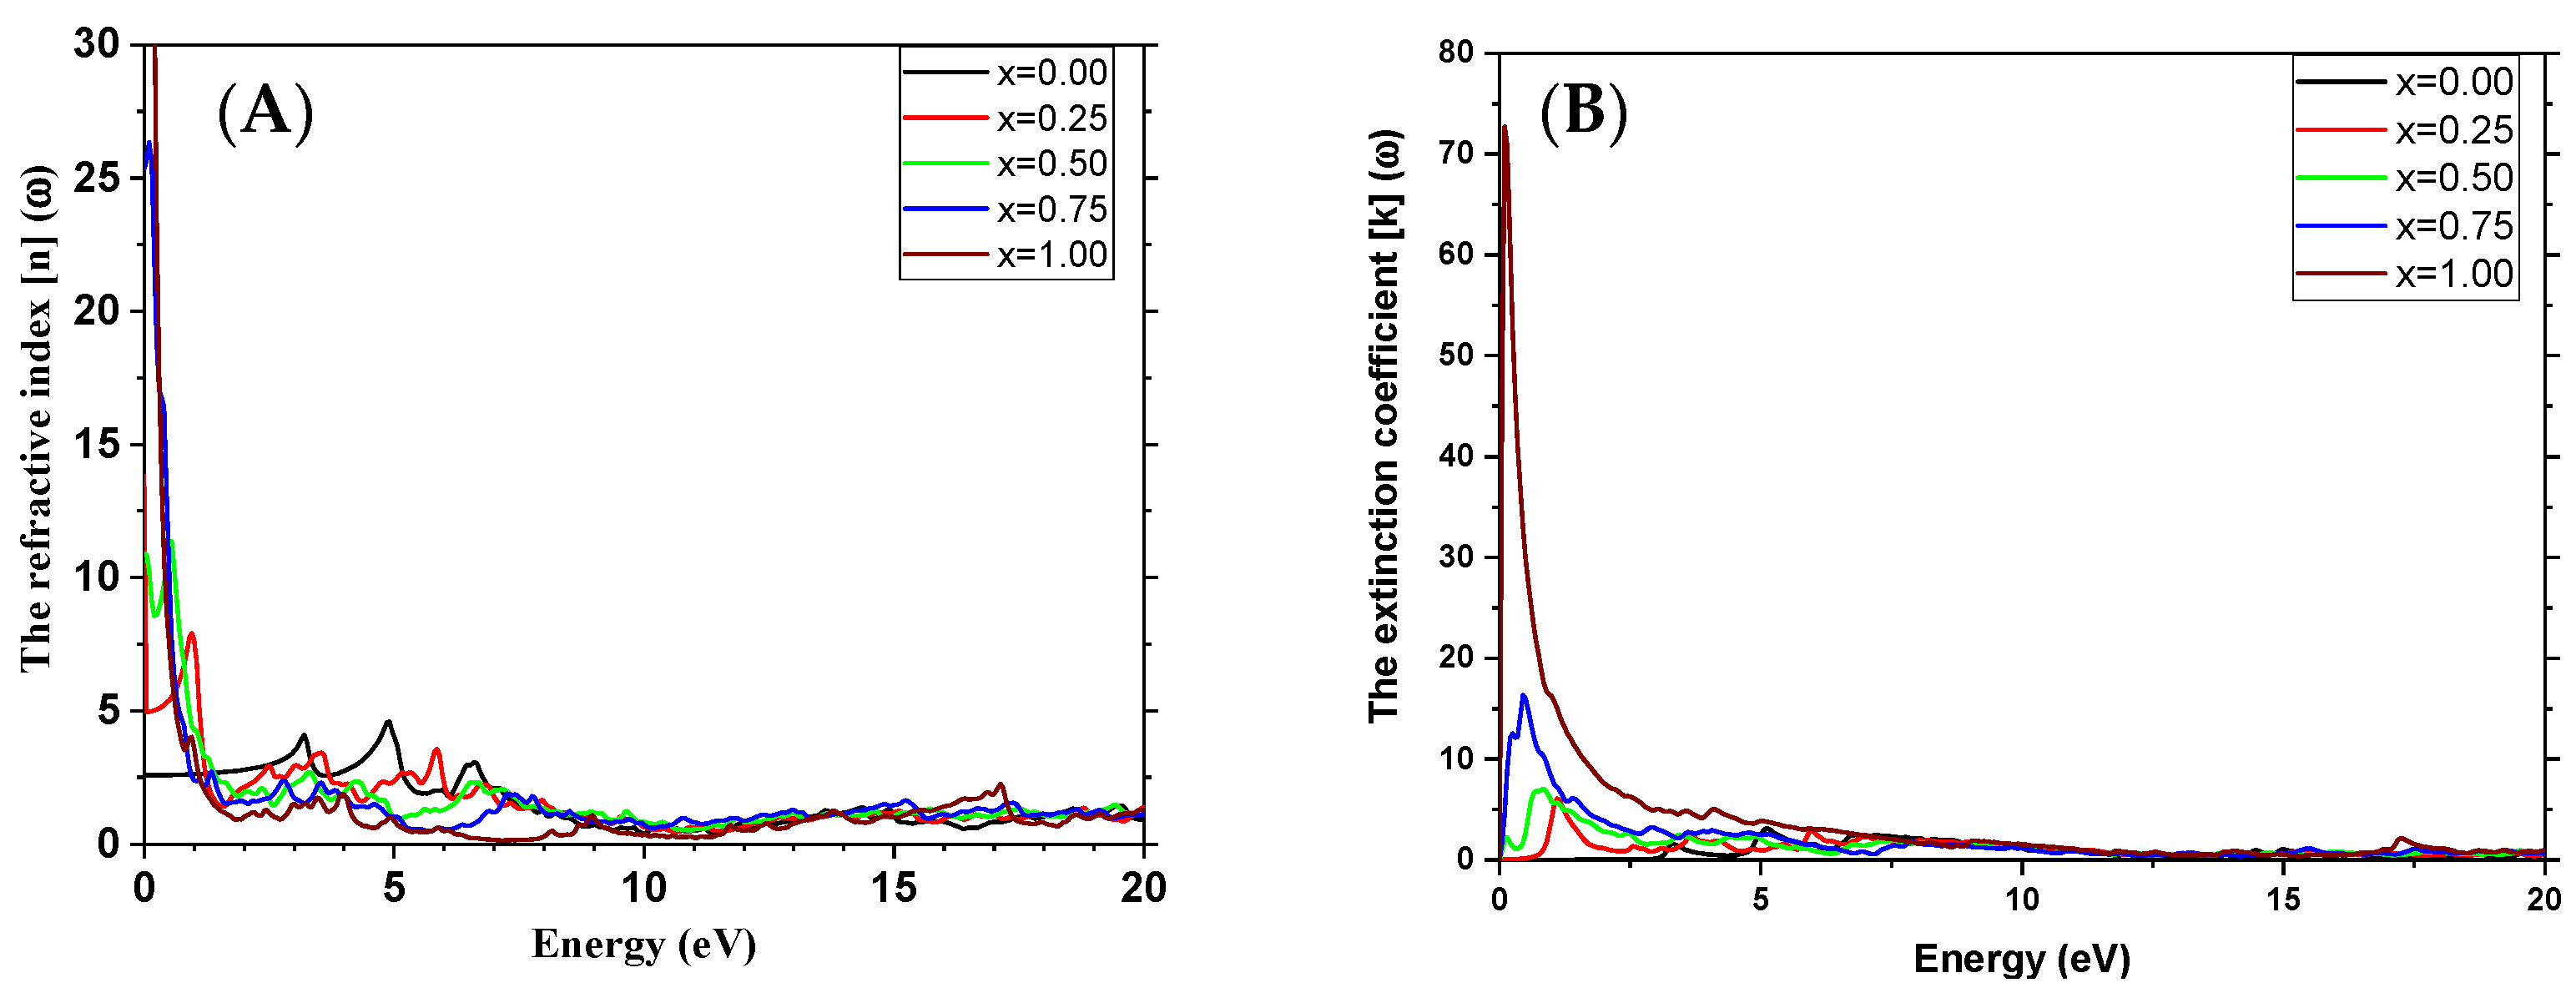
The refractive index (n) and extinction coefficient (k) (Figure 9) were derived from the dielectric function as:
n ω = ε ω + ε 1 ω 2 ,
    k ω = ε ω ε 1 ω 2
The extinction coefficient k(ω), which quantifies optical absorption due to electronic transitions, exhibits distinct trends across different Fe concentrations in FexZr1−xO2. A sharp peak is observed in the low-energy range (0–2 eV), particularly for x = 1.00, where k reaches approximately 72, indicating strong absorption in the infrared and visible spectrum. This pronounced absorption suggests the presence of Fe-induced electronic states that contribute to intrabank transitions or localized defect levels within the band structure. As the photon energy increases, k(ω) rapidly decreases for all compositions, signifying a reduction in absorption at higher energies, particularly in the UV range. This trend aligns with the behaviour observed in the imaginary part of the dielectric function ε2(ω) and the absorption coefficient α(ω), confirming that optical losses diminish beyond the visible regime. The impact of Fe doping is evident, as Fe-rich compounds (x = 0.75 and x = 1.00) consistently exhibit higher k values across the spectrum, emphasizing enhanced optical losses due to Fe-associated states. Despite this, Fe incorporation effectively enhances low-energy absorption, making it a potential strategy for tailoring the material’s properties for photonic and photovoltaic applications requiring near-infrared (NIR) absorption.
The refractive index n(ω) of FexZr1−xO2 exhibits a strong dependence on Fe concentration, with high initial values at low energies (E → 0), particularly for x = 0.75 and 1.00, reaching n ≈ 25–29. This indicates strong light–matter interaction and increased polarizability, likely due to Fe 3d orbital contributions. As energy increases, n(ω) decreases sharply between 0–4 eV, following typical dispersion behaviour, before stabilizing at higher energies. The overall trend shows that higher Fe content enhances optical density, consistent with the behaviour of the real part of the dielectric function ε1(ω). The combination of high refractive index and strong absorption (k, ε2) makes Fe-doped ZrO2 a promising material for photocatalysis, infrared detection, solar energy absorption, and optical coatings. However, the increased optical losses at high Fe content must be optimized for specific applications.
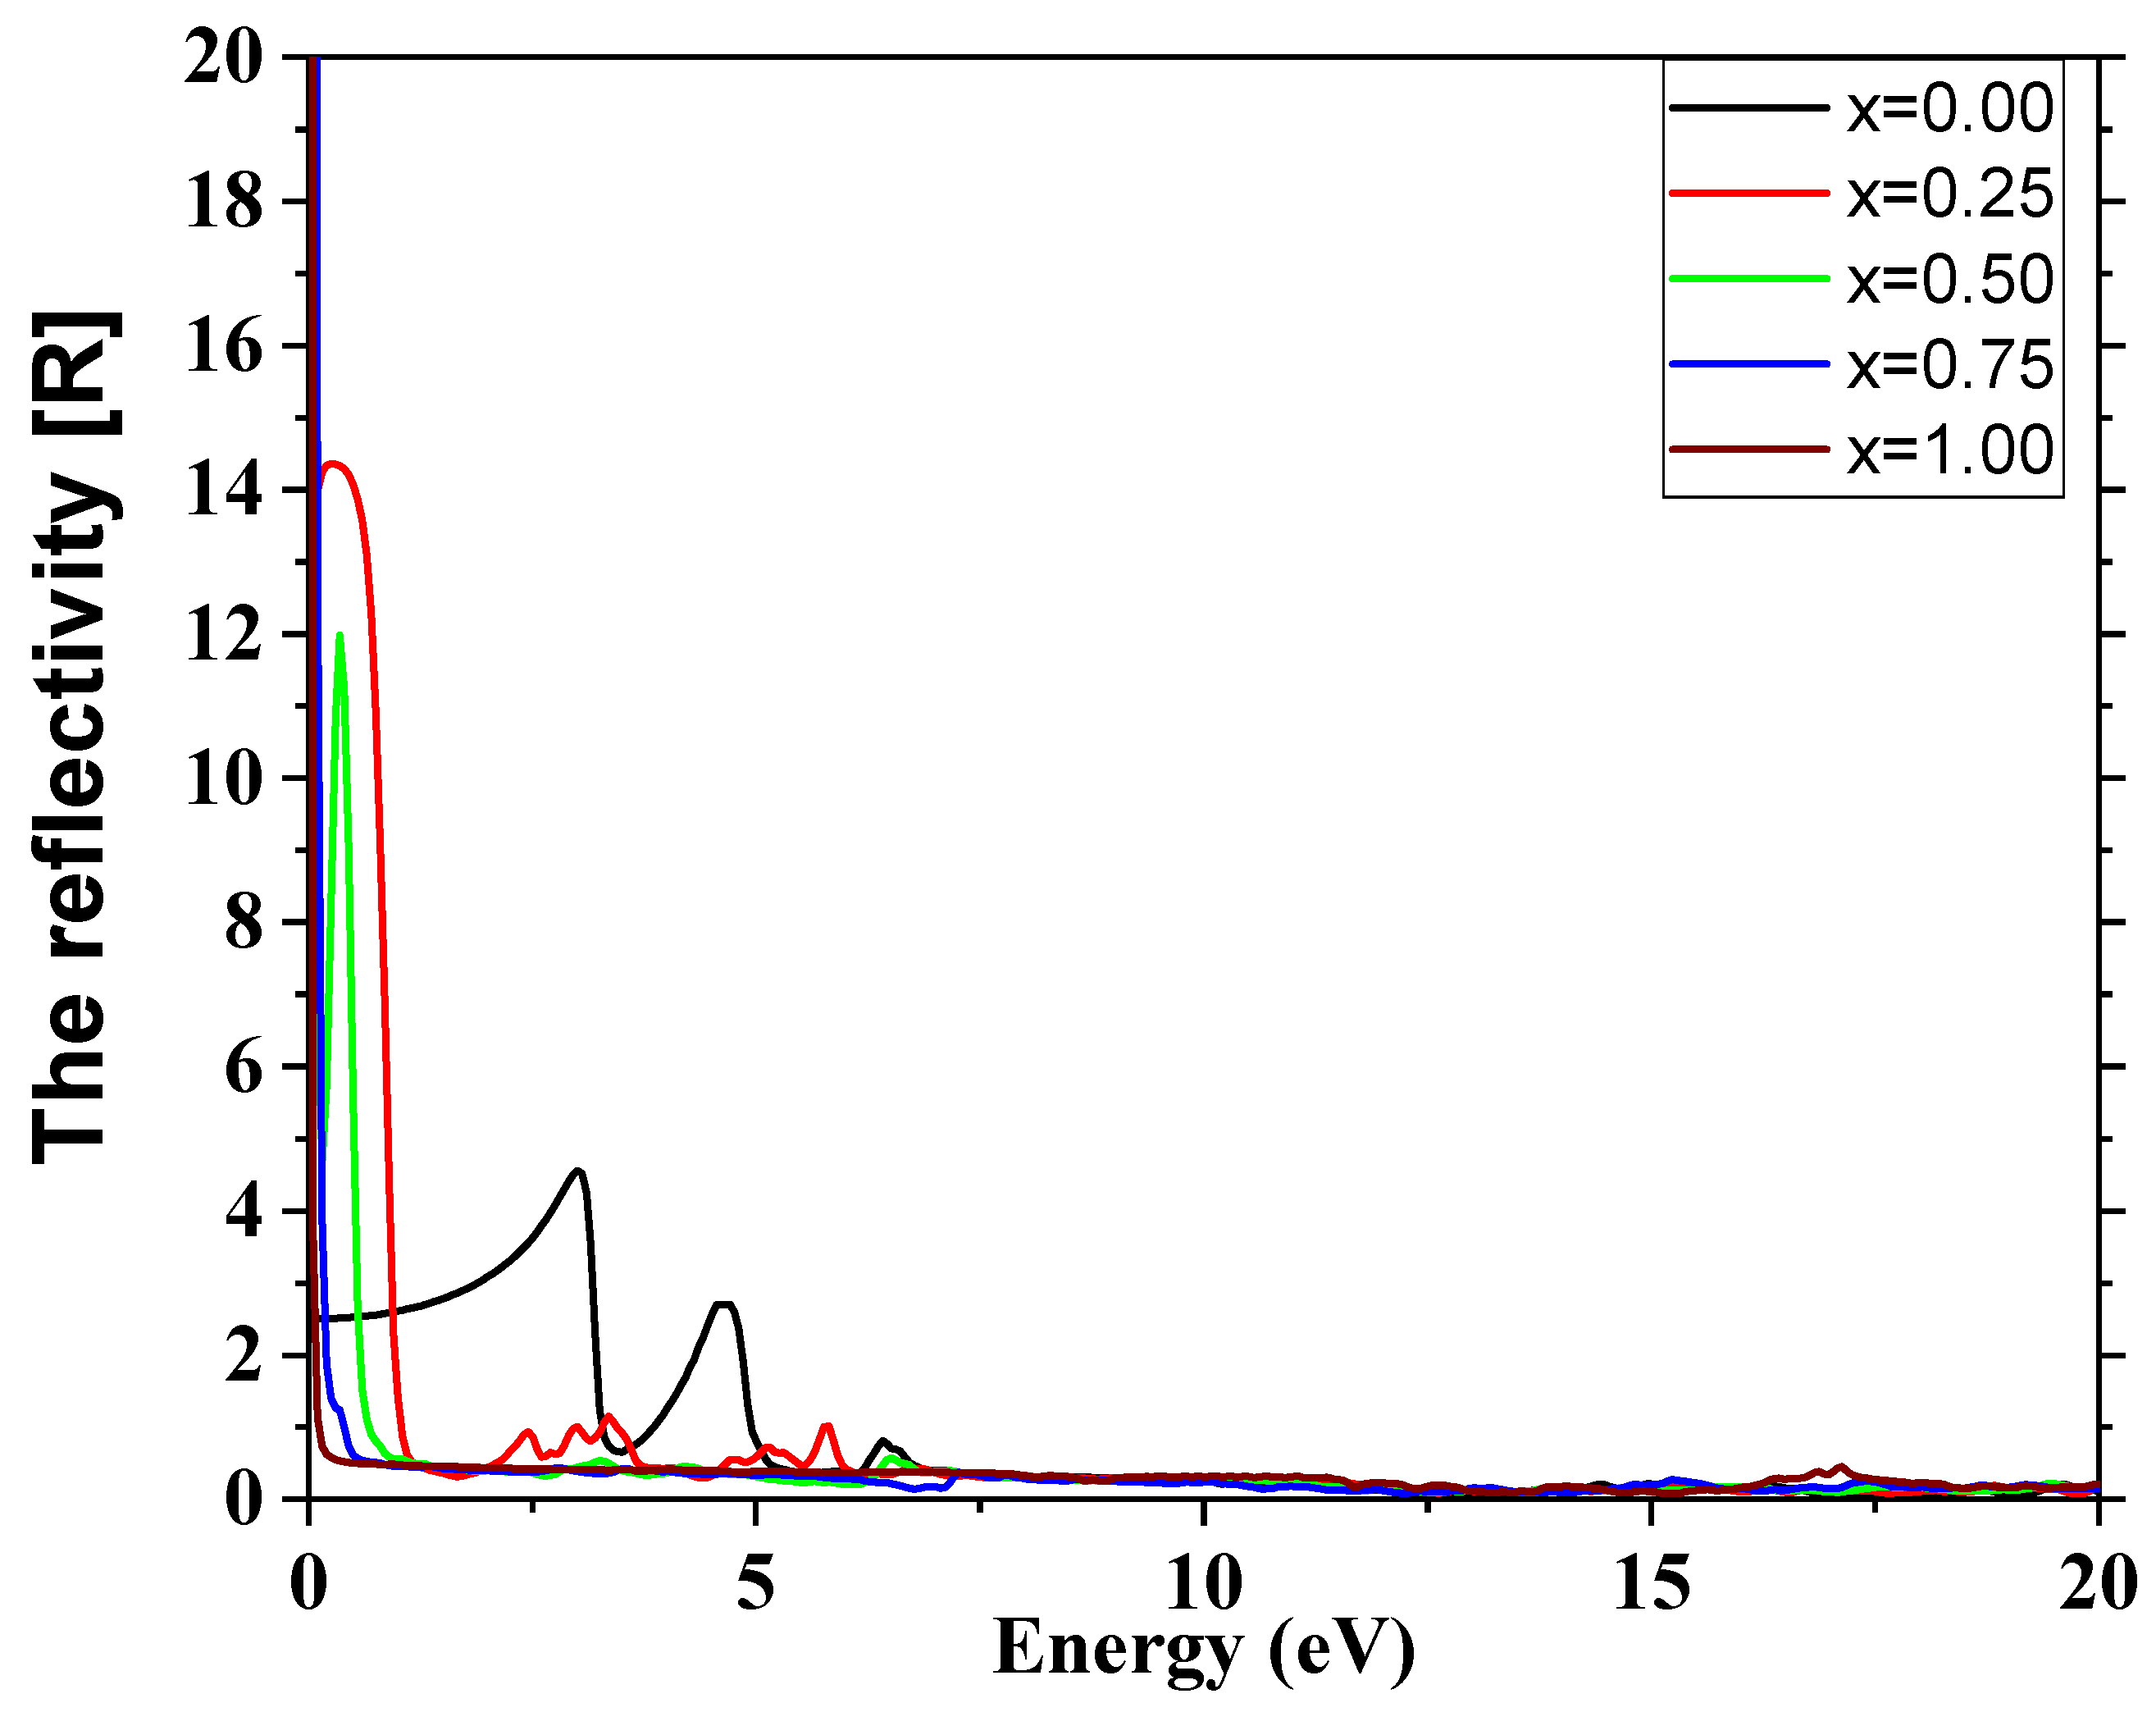
The reflectivity (R) spectra revealed prominent reflection peaks at low energies, especially for x = 0.00 and x = 0.25, indicating dominant free carrier-induced reflection in the infrared region (Figure 10). These peaks rapidly diminish with increasing photon energy, and reflectivity values become relatively constant in the higher energy range. The low reflectivity in the visible and UV range is advantageous for photovoltaic and anti-reflective coating applications. This trend is in good agreement with reflectivity values reported for similar perovskite systems, where reflection is high near zero energy but falls off with increasing photon energy.
The energy loss function (ELF), which characterizes the energy dissipation of fast electrons within the material, exhibited sharp peaks between 10–15 eV (Figure 11). These peaks correspond to plasmon resonance frequencies and signify the plasma oscillation energy of free electrons. Notably, ELF peaks varied in position and intensity with composition, reflecting changes in electronic density and bonding character. The presence of pronounced plasmon peaks at relatively high energies is consistent with other perovskites, where plasma energies typically lie in the 10–15 eV range. The highest ELF intensities for x = 0.00 and x = 0.25 suggest strong collective oscillation responses at these compositions, which may be relevant in high-frequency photonic applications.

4. Conclusions

In this study, a comprehensive first-principles investigation was carried out to examine the effect of Fe substitution on the structural, electronic, elastic, and optical properties of FexZr1−xO2 (x = 0.0, 0.25, 0.50, 0.75, 1.0) compounds adopting the fluorite crystal structure. The results demonstrate that Fe incorporation into the ZrO2 lattice leads to significant modifications in the material’s fundamental properties, making it a promising candidate for various functional applications. From the structural analysis, a systematic contraction in lattice parameters with increasing Fe content was observed, consistent with Vegard’s law and attributed to the smaller ionic radius of Fe compared to Zr. The formation energy calculations confirmed that all compositions are chemically favourable, with enhanced chemical stability achieved at higher Fe concentrations. Electronic structure analysis revealed that Fe doping effectively narrows the bandgap, with a transition from wide-gap semiconducting behaviour in pure ZrO2 (direct bandgap of 3.4 eV) to low-gap or nearly metallic behaviour in intermediate compositions. This tuneable bandgap opens the possibility of optimizing the material for visible-light absorption and photovoltaic applications. Total and partial density of states analysis confirmed the influence of Fe 3d orbitals in modifying the valence and conduction band edges. The optical response, derived from the complex dielectric function, demonstrated enhanced light absorption in the visible and near-infrared regions for Fe-rich compositions. Key optical constants—including absorption coefficient, refractive index, extinction coefficient, reflectivity, and energy loss function—were evaluated. The materials exhibit high absorption coefficients (>105 cm−1) in the visible region, low reflectivity at higher photon energies, and strong dielectric screening, confirming their viability for solar energy conversion, photodetectors, optical coatings, and plasmonic devices. Elastic property analysis indicated that all compositions fulfil the mechanical stability criteria. However, increasing Fe content results in a gradual softening of the material, as evidenced by reduced bulk, shear, and Young’s moduli. This behaviour suggests increased mechanical flexibility, which can be advantageous in strain-tolerant photovoltaic devices and mechanically adaptive optoelectronic systems.

Supplementary Materials

The following supporting information can be downloaded at: https://www.mdpi.com/article/10.3390/app151810224/s1, Figure S1: DFT+U electronic band structure and density of states for Fe0.25Zr0.75O2 (x = 0.25); Figure S2: DFT+U electronic band structure and DOS for Fe0.50Zr0.50O2 (x = 0.50); Figure S3: DFT+U electronic band structure and DOS for Fe0.75Zr0.25O2 (x = 0.75); Figure S4: DFT+U electronic band structure and DOS for FeO2 (x = 1.00); Table S1: Single-crystal elastic constants Cij (GPa) for F e x Z r 1 x O 2 (fluorite, 0 K, DFT); Table S2: Derived polycrystalline properties (Voigt–Reuss–Hill averages) and anisotropy indices for FexZr1−xO2 (fluorite, 0 K, DFT).

Author Contributions

D.N. Conceptualization, Formal analysis, investigation,—original draft, visualization, A.H. supervising, validation. M.E.S. and A.B. Formal analysis, investigation, writing. All authors have read and agreed to the published version of the manuscript.

Funding

This research received no external funding.

Institutional Review Board Statement

Not applicable.

Informed Consent Statement

Not applicable.

Data Availability Statement

All data included in the manuscript.

Conflicts of Interest

The authors declare no conflicts of interest.

Abbreviations

The following abbreviations are used in this manuscript:
BFGSBroyden–Fletcher–Goldfarb–Shanno
DFTDensity-functional theory
DOSdensity of states
ELFenergy loss function
GGAgeneralized gradient approximation
NCPPnorm-conserving pseudopotentials
NIRnear-infrared
OERoxygen evolution reaction
PBEPerdew–Burke–Ernzerhof
RPArandom phase approximation
SCFself-consistent field
SOFCsolid oxide fuel cell
TCOtransparent conductive oxide
TDOStotal density of states
USPPUltrasoft pseudopotentials

References

  1. Belkhanchi, H.; Ziat, Y.; Hammi, M.; Laghlimi, C.; Moutcine, A.; Benyounes, A.; Kzaiber, F. Nitrogen doped carbon nanotubes grafted TiO2 rutile nanofilms: Promising material for dye sensitized solar cell application. Optik 2021, 229, 166234. [Google Scholar] [CrossRef]
  2. Belkhanchi, H.; Ziat, Y.; Hammi, M.; Laghlimi, C.; Moutcine, A.; Benyounes, A.; Kzaiber, F. Synthesis of N-CNT/TiO2 composites thin films: Surface analysis and optoelectronic properties. E3S Web Conf. 2020, 183, 05002. [Google Scholar] [CrossRef]
  3. Garvie, R.C. The Occurrence of Metastable Tetragonal Zirconia as a Crystallite Size Effect; ACS Publication: Washington, DC, USA, 2002. [Google Scholar] [CrossRef]
  4. Shukla, S.; Seal, S. Mechanisms of room temperature metastable tetragonal phase stabilisation in zirconia. Int. Mater. Rev. 2005, 50, 45–64. [Google Scholar] [CrossRef]
  5. Garvie, R.C.; Hannink, R.H.; Pascoe, R.T. Ceramic Steel? In Sintering Key Papers; Sōmiya, S., Moriyoshi, Y., Eds.; Springer: Dordrecht, The Netherlands, 1990; pp. 253–257. [Google Scholar] [CrossRef]
  6. Mori, M.; Abe, T.; Itoh, H.; Yamamoto, O.; Takeda, Y.; Kawahara, T. Cubic-stabilized zirconia and alumina composites as electrolytes in planar type solid oxide fuel cells. Solid State Ion. 1994, 74, 157–164. [Google Scholar] [CrossRef]
  7. Ziat, Y.; Belkhanchi, H.; Zarhri, Z. DFT Analysis of Structural, Electrical, and Optical Properties of S, Si, and F-Doped GeO2 Rutile: Implications for UV-Transparent Conductors and Photodetection. Sol. Energy Sustain. Dev. J. 2025, 14, 74–89. [Google Scholar] [CrossRef]
  8. Shabalin, I.L.; Roach, D.L.; Shabalin, L.I. Oxidation of titanium carbide–graphite hetero-modulus ceramics with low carbon content: II. Physico-chemical interpretation of the ridge effect. J. Eur. Ceram. Soc. 2008, 28, 3177–3188. [Google Scholar] [CrossRef]
  9. Safari, E.; Rahemi, N.; Kahforoushan, D.; Allahyari, S. Copper adsorptive removal from aqueous solution by orange peel residue carbon nanoparticles synthesized by combustion method using response surface methodology. J. Environ. Chem. Eng. 2019, 7, 102847. [Google Scholar] [CrossRef]
  10. Zhang, J.; Ye, J.; Chen, H.; Qu, Y.; Deng, Q.; Lin, Z. One-pot synthesis of echinus-like Fe-doped SnO2 with enhanced photocatalytic activity under simulated sunlight. J. Alloys Compd. 2017, 695, 3318–3323. [Google Scholar] [CrossRef]
  11. Velardi, L.; Valentini, A.; Cicala, G. Highly efficient and stable ultraviolet photocathode based on nanodiamond particles. Appl. Phys. Lett. 2016, 108, 083503. [Google Scholar] [CrossRef]
  12. Ahmed, W.; Iqbal, J.; Aisida, S.O.; Badshah, A.; Ahmad, I.; Alamgir, K.; Gul, I.H. Structural, magnetic and dielectric characteristics of optically tuned Fe doped ZrO2 nanoparticles with visible light driven photocatalytic activity. Mater. Chem. Phys. 2020, 251, 122999. [Google Scholar] [CrossRef]
  13. Cheng, Q.; Yang, W.; Chen, Q.; Zhu, J.; Li, D.; Fu, L.; Zhou, L. Fe-doped zirconia nanoparticles with highly negative conduction band potential for enhancing visible light photocatalytic performance. Appl. Surf. Sci. 2020, 530, 147291. [Google Scholar] [CrossRef]
  14. Cui, H.; Heath, G.; Remo, T.; Ravikumar, D.; Silverman, T.; Deceglie, M.; Kempe, M.; Engel-Cox, J. Technoeconomic analysis of high-value, crystalline silicon photovoltaic module recycling processes. Sol. Energy Mater. Sol. Cells 2022, 238, 111592. [Google Scholar] [CrossRef]
  15. Aamlid, S.S.; Kim, M.; González-Rivas, M.U.; Oudah, M.; Takagi, H.; Hallas, A.M. Effect of high pressure synthesis conditions on the formation of high entropy oxides. Appl. Phys. Lett. 2024, 125, 021901. [Google Scholar] [CrossRef]
  16. El Mragui, A.; Logvina, Y.; Pinto da Silva, L.; Zegaoui, O.; Esteves da Silva, J.C.G. Synthesis of Fe- and Co-Doped TiO2 with Improved Photocatalytic Activity Under Visible Irradiation Toward Carbamazepine Degradation. Materials 2019, 12, 3874. [Google Scholar] [CrossRef]
  17. Feng, C.; Faheem, M.B.; Fu, J.; Xiao, Y.; Li, C.; Li, Y. Fe-Based Electrocatalysts for Oxygen Evolution Reaction: Progress and Perspectives. ACS Catal. 2020, 10, 4019–4047. [Google Scholar] [CrossRef]
  18. Lai, C.; Shi, X.; Li, L.; Cheng, M.; Liu, X.; Liu, S.; Li, B.; Yi, H.; Qin, L.; Zhang, M.; et al. Enhancing iron redox cycling for promoting heterogeneous Fenton performance: A review. Sci. Total Environ. 2021, 775, 145850. [Google Scholar] [CrossRef] [PubMed]
  19. Sarhani, M.E.; Belkhir, M.L.; Begagra, A. Study of Photo-Conversion Performance of Carbon-Based Perovskite Solar Cells. Phys. Status Solidi B 2025, 2500069. [Google Scholar] [CrossRef]
  20. Giannozzi, P.; Andreussi, O.; Brumme, T.; Bunau, O.; Buongiorno Nardelli, M.; Calandra, M.; Car, R.; Cavazzoni, C.; Ceresoli, D.; Cococcioni, M.; et al. Advanced capabilities for materials modelling with Quantum ESPRESSO. J. Phys. Condens. Matter 2017, 29, 465901. [Google Scholar] [CrossRef]
  21. Giannozzi, P.; Baroni, S.; Bonini, N.; Calandra, M.; Car, R.; Cavazzoni, C.; Ceresoli, D.; Chiarotti, G.L.; Cococcioni, M.; Dabo, I.; et al. QUANTUM ESPRESSO: A modular and open-source software project for quantum simulations of materials. J. Phys. Condens. Matter 2009, 21, 395502. [Google Scholar] [CrossRef]
  22. Pfrommer, B.G.; Côté, M.; Louie, S.G.; Cohen, M.L. Relaxation of Crystals with the Quasi-Newton Method. J. Comput. Phys. 1997, 131, 233–240. [Google Scholar] [CrossRef]
  23. Perdew, J.P.; Burke, K.; Ernzerhof, M. Generalized Gradient Approximation Made Simple. Phys. Rev. Lett. 1996, 77, 3865–3868. [Google Scholar] [CrossRef]
  24. Choudhary, K.; Tavazza, F. Convergence and machine learning predictions of Monkhorst-Pack k-points and plane-wave cut-off in high-throughput DFT calculations. Comput. Mater. Sci. 2019, 161, 300–308. [Google Scholar] [CrossRef]
  25. Zhang, Y.; Ji, V.; Xu, K.-W. The detailed orbital-decomposed electronic structures of tetragonal ZrO2. Phys. B Condens. Matter 2013, 411, 126–130. [Google Scholar] [CrossRef]
  26. Hu, Q.; Liu, J. Deep mantle hydrogen in the pyrite-type FeO2–FeO2H system. Geosci. Front. 2021, 12, 975–981. [Google Scholar] [CrossRef]
  27. Boulard, E.; Guyot, F.; Menguy, N.; Corgne, A.; Auzende, A.-L.; Perrillat, J.-P.; Fiquet, G. CO2-induced destabilization of pyrite-structured FeO2Hx in the lower mantle. Natl. Sci. Rev. 2018, 5, 870–877. [Google Scholar] [CrossRef]
  28. Lu, C.; Amsler, M.; Chen, C. Unraveling the structure and bonding evolution of the newly discovered iron oxide FeO2. Phys. Rev. B 2018, 98, 054102. [Google Scholar] [CrossRef]
  29. Howard, C.J.; Hill, R.J.; Reichert, B.E. Structures of ZrO2 polymorphs at room temperature by high-resolution neutron powder diffraction. Acta Crystallogr. B 1988, 44, 116–120. [Google Scholar] [CrossRef]
  30. Zhao, X.; Vanderbilt, D. Phonons and lattice dielectric properties of zirconia. Phys. Rev. B 2002, 65, 075105. [Google Scholar] [CrossRef]
  31. Salikhodzha, Z.M.; Bairbayeva, G.B.; Kassymkhanova, R.N.; Konuhova, M.; Zhangylyssov, K.B.; Popova, E.; Popov, A.I. Density Functional Theory Study of Pressure-Dependent Structural and Electronic Properties of Cubic Zirconium Dioxide. Ceramics 2025, 8, 41. [Google Scholar] [CrossRef]
  32. Yang, Y.-L.; Fan, X.-L.; Liu, C.; Ran, R.-X. First principles study of structural and electronic properties of cubic phase of ZrO2 and HfO2. Phys. B Condens. Matter 2014, 434, 7–13. [Google Scholar] [CrossRef]
  33. Zhang, S.; Li, K.; Ma, Y.; Guo, F.; Jiang, C.; Liang, Z.; Bu, Y.; Zhang, J. Density Functional Studies on the Atomistic Structure and Properties of Iron Oxides: A Parametric Study. Materials 2022, 15, 8316. [Google Scholar] [CrossRef]
  34. Hadbi, M.; Demmouche, K.; Eddine Mellah, D.; Coutinho, J. Theoretical insights into off-stoichiometric Zr(x)Ti(1−x)IrSb half-Heusler alloys: A first principle calculations. J. Phys. Condens. Matter Inst. Phys. J. 2024, 37, 045702. [Google Scholar] [CrossRef]
  35. Doufar, N.; Benamira, M.; Lahmar, H.; Trari, M.; Avramova, I.; Caldes, M.T. Structural and photochemical properties of Fe-doped ZrO2 and their application as photocatalysts with TiO2 for chromate reduction. J. Photochem. Photobiol. Chem. 2020, 386, 112105. [Google Scholar] [CrossRef]
  36. Sarhani, M.E.; Dahame, T.; Belkhir, M.L.; Bentria, B.; Begagra, A. AB-INITIO study of electronic, mechanical, optical and thermoelectric properties of KGeCl3 for photovoltaic application. Heliyon 2023, 9, e19808. [Google Scholar] [CrossRef] [PubMed]
  37. Mayr-Schmölzer, W.; Planer, J.; Redinger, J.; Grüneis, A.; Mittendorfer, F. Many-electron calculations of the phase stability of ZrO2 polymorphs. Phys. Rev. Res. 2020, 2, 043361. [Google Scholar] [CrossRef]
  38. Choudhary, K.; Zhang, Q.; Reid, A.C.E.; Chowdhury, S.; Van Nguyen, N.; Trautt, Z.; Newrock, M.W.; Congo, F.Y.; Tavazza, F. Computational screening of high-performance optoelectronic materials using OptB88vdW and TB-mBJ formalisms. Sci. Data 2018, 5, 180082. [Google Scholar] [CrossRef] [PubMed]
  39. Jang, B.G.; Kim, D.Y.; Shim, J.H. Metal-insulator transition and the role of electron correlation in FeO2. Phys. Rev. B 2017, 95, 075144. [Google Scholar] [CrossRef]
  40. Yashima, M.; Kakihana, M.; Yoshimura, M. Metastable-stable phase diagrams in the zirconia-containing systems utilized in solid-oxide fuel cell application. Solid State Ion. 1996, 86–88, 1131–1149. [Google Scholar] [CrossRef]
  41. Di Valentin, C.; Pacchioni, G.; Selloni, A. Reduced and n-Type Doped TiO2: Nature of Ti3+ Species. J. Phys. Chem. C 2009, 113, 20543–20552. [Google Scholar] [CrossRef]
  42. Sathupun, K.; Kotmool, K.; Tsuppayakorn-aek, P.; Pluengphon, P.; Majumdar, A.; Bovornratanaraks, T. Fe-doped effects on phase transition and electronic structure of CeO2 under compressed conditions from ab initio calculations. Appl. Phys. A 2021, 127, 784. [Google Scholar] [CrossRef]
  43. Szade, J.; Kajewski, D.; Kubacki, J.; Szot, K.; Koehl, A.; Lenser, C.; Dittmann, R. Impact of Fe doping on the electronic structure of SrTiO3 thin films determined by resonant photoemission. arXiv 2015, arXiv:1509.08006. [Google Scholar] [CrossRef]
  44. Nazir, M.A.; Mahmood, T.; Zafar, A.A.; Akhtar, N.; Hussain, T.; Saeed, M.A.; Aleem, F.; Saeed, A.; Raza, J.; Cao, C. Electronic, optical and elastic properties of cubic zirconia (c-ZrO2) under pressure: A DFT study. Phys. B Condens. Matter 2021, 604, 412462. [Google Scholar] [CrossRef]
  45. Kilic, U.; Traouli, Y.; Hilfiker, M.; Bryant, K.; Schoeche, S.; Feder, R.; Argyropoulos, C.; Schubert, E.; Schubert, M. Nanocolumnar Metamaterial Platforms: Scaling Rules for Structural Parameters Revealed from Optical Anisotropy. Adv. Opt. Mater. 2024, 12, 2302767. [Google Scholar] [CrossRef]
  46. Harrop, P.J.; Wanklyn, J.N. The dielectric constant of zirconia. Br. J. Appl. Phys. 1967, 18, 739. [Google Scholar] [CrossRef]
  47. Sanesi, M.; Cremante, G.; Pizzini, S.; Wagner, V. On the Dielectric Constant of Zirconia and Lime-zirconia. Z. Für Naturforschung A 1971, 26, 159–164. [Google Scholar] [CrossRef]
  48. Elouafi, A.; Moubah, R.; Tizliouine, A.; Derkaoui, S.; Omari, L.H.; Lassri, H. Effects of Ru doping and of oxygen vacancies on the optical properties in α-Fe2O3 powders. Appl. Phys. A 2020, 126, 228. [Google Scholar] [CrossRef]
  49. Polyanskiy, M.N. Refractiveindex.info database of optical constants. Sci. Data 2024, 11, 94. [Google Scholar] [CrossRef]
  50. Wood, D.L.; Nassau, K. Refractive index of cubic zirconia stabilized with yttria. Appl. Opt. 1982, 21, 2978–2981. [Google Scholar] [CrossRef]
  51. YU, P.; Cardona, M. Fundamentals of Semiconductors: Physics and Materials Properties; Springer Science & Business Media: Berlin/Heidelberg, Germany, 2010. [Google Scholar]
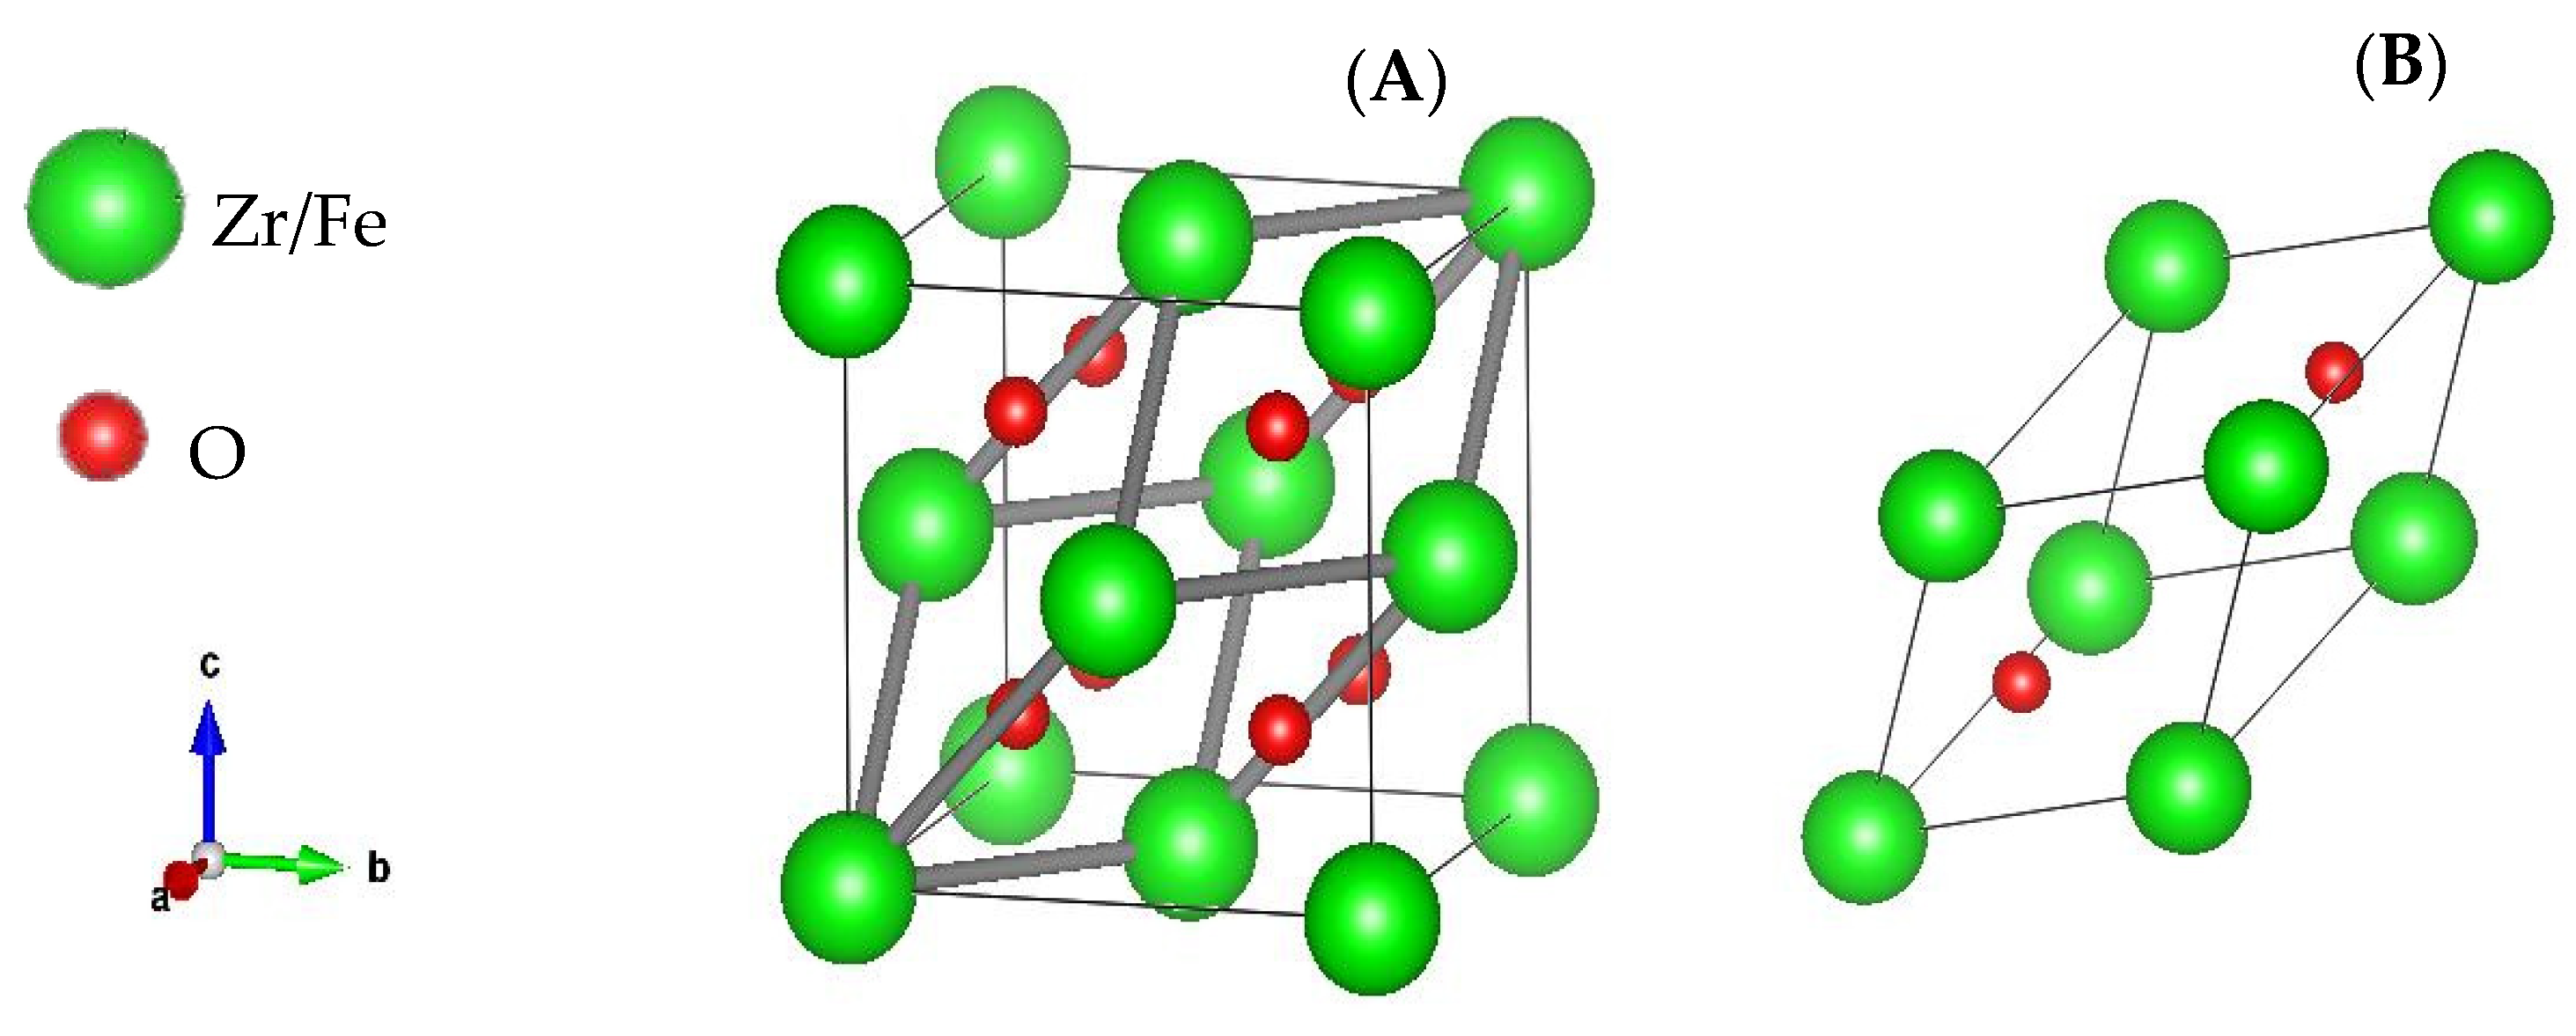
Figure 1. Crystallographic representation of the cubic fluorite FexZr1−xO2 structure (space group F m 3 ¯ m ) (A) conventional cell (B) primitive cell.
Applsci 15 10224 g001
Figure 2. Variation of formation energy (Ef) as a function of Fe content (x) in FexZr1−xO2 compounds.
Applsci 15 10224 g002
Figure 3. Variation in elastic properties vs. concentration. Bulk (B), Young’s (E), and shear (G) moduli increase with increasing Fe content (x).
Applsci 15 10224 g003
Figure 4. The electronic band-structure Energy vs. high-symmetry points and Density of states vs. Energy for ZrO2.
Applsci 15 10224 g004
Figure 5. Electronic band-structure and density of states for different Fe concentration in FexZr1−xO2 compounds, the yellow area (E-EF in [−1, +1]) are zoomed and replotted bellow the main figures.
Applsci 15 10224 g005
Figure 6. The electronic band-structure Energy vs. high-symmetry points and Density of states vs. Energy for FeO2.
Applsci 15 10224 g006
Figure 7. (A) real and (B) imaginary parts of dielectric function as function of energy for FexZr1−xO2.
Applsci 15 10224 g007
Figure 8. Absorption coefficient α(ω) of FexZr1−xO2.
Applsci 15 10224 g008
Figure 9. (A) The refractive index (n) and (B) extinction coefficient (k).
Applsci 15 10224 g009
Figure 10. Reflectivity index vs. energy in electron volts.
Applsci 15 10224 g010
Figure 11. The energy loss function vs. energy.
Applsci 15 10224 g011
Table 1. Comparison of lattice parameters, and formation energy of ZrO2 and FeO2 fluorite-type structures.
Lattice Parameter (Å)Formation Energy (eV)
FeO24.6−7.65
Py-FeO24.55exp [26] 4.36exp [27] 4.36DFT+U [28] -
ZrO25.12−5.06
ZrO25.07exp [29] 5.09exp [30] 5.11hf [31] 5.15PBE [32]-
Exp: experimental data, hf: DFT hybrid functional, Py: pyrite type, DFT+U: PBE+U.
Table 2. Elastic Tensor Components (GPa) for FexZr1−xO2.
xC11C12C13C22C33C44C66
0.00520.7793.9093.90520.77520.7763.5963.59
0.25482.3690.9090.90482.36482.3677.6177.61
0.50475.86113.55107.22475.86525.9786.89102.08
0.75519.96103.26103.26519.96519.9681.2581.25
1.00623.45107.07107.07623.45623.45121.58121.58
Table 3. Bandgap energy in electron volte for each Fe concentration x in FexZr1−x compounds calculated using PBE+U approximation.
X ContentPBEPBE+UOther Studies
0.003.41-3.31 1, 3.37 *2 3.86 **2
0.250.1840.275
0.500.0180.275
0.75−0.0620.025
1.000.2520.30Metal 3 Metal 4
1 [31] PBE; 2 [37] * PBE ** SCAN; 3 [38] OptB88vdW and TB-mBJ formalisms; 4 [39] Dynamic mean-field theory (DMFT).
Disclaimer/Publisher’s Note: The statements, opinions and data contained in all publications are solely those of the individual author(s) and contributor(s) and not of MDPI and/or the editor(s). MDPI and/or the editor(s) disclaim responsibility for any injury to people or property resulting from any ideas, methods, instructions or products referred to in the content.