Article

Benchmarking Overlapped Subarrays in Direct Radiating Arrays for GEO Broadband Satellite Communication Systems

1
Thales Alenia Space, 31100 Toulouse, France
2
School of Engineering and Physical Sciences, Heriot-Watt University, Edinburgh Campus, Edinburgh EH14 4AS, UK
3
European Space Agency, 2200 AG Noordwijk, The Netherlands
*
Author to whom correspondence should be addressed.
Appl. Sci. 2025, 15(18), 10216; https://doi.org/10.3390/app151810216
Submission received: 16 July 2025 / Revised: 29 August 2025 / Accepted: 4 September 2025 / Published: 19 September 2025
(This article belongs to the Special Issue Antennas for Next-Generation Electromagnetic Applications)

Abstract

Direct radiating arrays (DRAs) present favorable solutions for high-throughput flexible coverage in geostationary (GEO) broadband satellite missions. The ultimate constraint in these architectures is the high number of digitally controlled antenna ports, which renders fully digital architectures impractical for the immediate future. Instead, hybrid analog–digital DRAs are being considered as a promising trade-off in terms of performance/flexibility and digital processing demands. These architectures commonly involve subarrays with analog beamforming, which form broad (regional) beams, which are then digitally beamformed at a second level to produce a multitude of narrow beams used for broadband connectivity. Due to the large size of the subarrays, these architectures are subject to undesired grating lobes that can lead to interference and reduce the gain of the main beam, thereby compromising overall performance. Partial mitigation of the grating lobes is attainable by subarray overlapping. This paper presents a comparative assessment of three different hybrid analog–digital DRA architectures in terms of the coverage characteristics and discusses their practical implementation. It is demonstrated that improved performance can be achieved by subarray overlapping with some additional analog hardware complexity but otherwise maintaining the number of digitally controlled antenna ports.

1. Introduction

The transition from broadcast to broadband satellite communications calls for new technologies in order to deliver very high-throughput and flexible coverage. Recent technology developments in active RF wide-bandgap semiconductor devices have enabled the development of solid-state amplifiers (SSPAs) with high power output and efficiency. Meanwhile, emerging digital transparent processors (DTPs) will be able to handle more than a hundred antenna ports, each at a few GHz bandwidth. In combination, these developments create opportunities for new payload active antenna architectures in broadband satellite missions with capabilities to deliver high throughput with flexible beam generation.
Direct radiating arrays (DRAs) with full digital beamforming offer optimum characteristics for broadband satellite missions in terms of directing the satellite capacity to areas of maximum traffic demand, enabling frequency reuse and ultimately maximizing the satellite throughput [1]. DRAs with analog beamforming have been widely used for lower frequencies and low Earth orbit applications [2,3]. However, broadband missions in geostationary (GEO) orbit call for a drastic increase in the antenna aperture dimensions to produce sufficiently narrow and high-gain beams required to close the link budget and enable frequency reuse. Whilst the reduced field-of-view requirements of GEO orbits compared to LEO/MEO enable increasing the size of the primary radiating elements (see also the discussion in Section 2) their total number drastically increases to reach the required size for the overall radiating aperture [4,5]. The increase in the number of antenna ports, each necessitating processing across more than 1 GHz bandwidth at the Ka-band, results in computational demands that surpass the capabilities of existing or near-future technology. Consequently, considerable focus has been directed towards techniques aimed at minimizing the number of control points.
A reduction in the number of control points can be obtained by reducing the field of view, an approach implemented in emerging GEO broadband missions based on array-fed reflector (AFR) antenna architectures [6]. These antennas associate a reduced number of radiating elements with a collimating reflector in a defocused configuration [7,8]. AFR architectures are an efficient solution for generating a large number of high-gain beams, enabling frequency reuse and flexible sharing of RF power between them. Moreover, by virtue of digital beamforming at the feed array, it is possible to spatially reconfigure the coverage achieved by the generated beams. When compared to DRAs, however, the reflector optics pose some constraints in the coverage. This is due to optical aberrations leading to degradation of the beam definition when the coverage is steered away from the original design. Whilst mechanical reconfiguration of the optics may partially mitigate aberrations and extend the capabilities of high-performance coverage from AFRs, these solutions can still not achieve the flexibility of digital DRAs.
A promising solution for overcoming the limitations of AFRs and DRAs within the remit of the existing or foreseeable technology base is the use of a hybrid digital–analog beamformer in an otherwise DRA architecture [9,10]. Recognizing that the ultimate barrier rests in the number of digitally processed antenna ports, hybrid beamformed DRAs introduce a cascade of digital beamforming (DBFNs) and analog beamforming networks (ABFNs), such that the number of ports to be processed by the DTP reduces from several thousands to several dozens. The hybrid beamforming configuration is schematically illustrated in Figure 1. With reference to this figure, the ABFN blocks correspond to (largely) identical subarrays. By virtue of the ABFN, broad beams, in the remaining also referred to as “regional beams”, can be generated. The ABFN therefore has control over the shape and steering of the corresponding regional beams [11]. At the DBFN level, these subarrays are then seen as “radiating elements”, which are digitally beamformed to produce directive spot beams within the associated regional beams. Flexible coverage is then achieved by steering the position of the regional beams and, within these, then steering the position of the spot beams. This type of solution is therefore favourable for multibeam generation.
In [12,13,14], the authors applied hybrid beamforming schemes for an LEO constellation, tackling multiple-input–multiple-output (MIMO) problems. Each subarray in [12] is controlled by an RF chain, which favors filter bank multi-carrier (FBMC) applications. In [13], compatibility with different payload systems is discussed (NGSO and LEO/VLEO). This problem is commonly tackled for LEO satellite systems, favorable to the constellation implementation. As highlighted in the literature, hybrid beamforming antenna architectures are enablers for advanced 5G and 6G MIMO communication systems. For GEO, the problem is similar, although it requires different subarray dimensions.
Despite the advantages brought by the hybrid beamforming DRA scheme, the insufficient spacing between the centers of the subarrays leads to grating lobes associated with the spot beams generated by the DBFN. As RF power is directed to other unwanted directions, grating lobes are problematic because they reduce the gain of the spot beam. Moreover, grating lobes limit the capability of frequency reuse as they can give rise to unwanted interference. Grating lobe mitigation strategies reported in the literature, such as sparse [15] or polyomino arrays [16], have proven to be efficient, but it is difficult to make them compatible with the hybrid architecture of Figure 1. Moreover, these solutions require bespoke development and arrangement of several different radiating elements, which is challenging from an industrial perspective. Instead, DRA architectures relying on overlapped subarrays [17,18,19] have recently attracted increased interest as they enable partial mitigation of the grating lobes in regular antenna architectures compatible with the scheme presented in Figure 1. In these architectures, some [19] or all [18] of the radiating elements contribute to more than one subarray. In these techniques, the grating lobes are attenuated totally or at least reduced depending on the scanning direction. However, they still exist in the system, especially when scanning far from nadir.
In recent years, considerable research has been conducted on subarray partitioning [20,21,22,23], especially in the radar community. These systems conveniently place the nulls to fully mitigate the grating lobes by smartly positioning the subarrays or using an adaptive tapering [24,25,26,27,28]. These studies, however, overlook the processor’s capabilities required on-board a satellite in the case of multiple beam generation. The recent literature on on-board satellite HAD DRAs has demonstrated that simpler architectures of the same nature with periodic overlap [17,18] are effective in only partially mitigating grating lobes while otherwise presenting a more favorable configuration for practical implementation.
Considering these developments, the aim of this paper is to present a detailed analysis of hybrid beamformed DRAs for GEO broadband missions. To the best of the authors’ knowledge, two families of architectures have been considered on-board satellites corresponding to the approaches of [18] (the authors’ technique) and [19], respectively. They are both benchmarked against the starting (non-overlapped) configuration illustrated in Figure 1. This paper is organized as follows: In Section 2 the architectures are defined in terms of hardware and beamforming networks. In the first subsection of Section 3, the pattern characteristics are provided to show the impact of both overlapping strategies on grating lobe mitigation. The phase and amplitude are also detailed as the cause of gain improvement and grating lobe mitigation. Then, the scanning performances are discussed. The limiting factors are also detailed. This part provides the optimal regional beams within which the spot beam lattice can be defined with a limited interference ratio. Finally, it can be proven that there is a more favorable architecture that enables a broader regional area to be reached when one regional beam is generated.

2. Materials and Methods

2.1. Overview of Hybrid DRA Configurations for GEO Broadband Communications

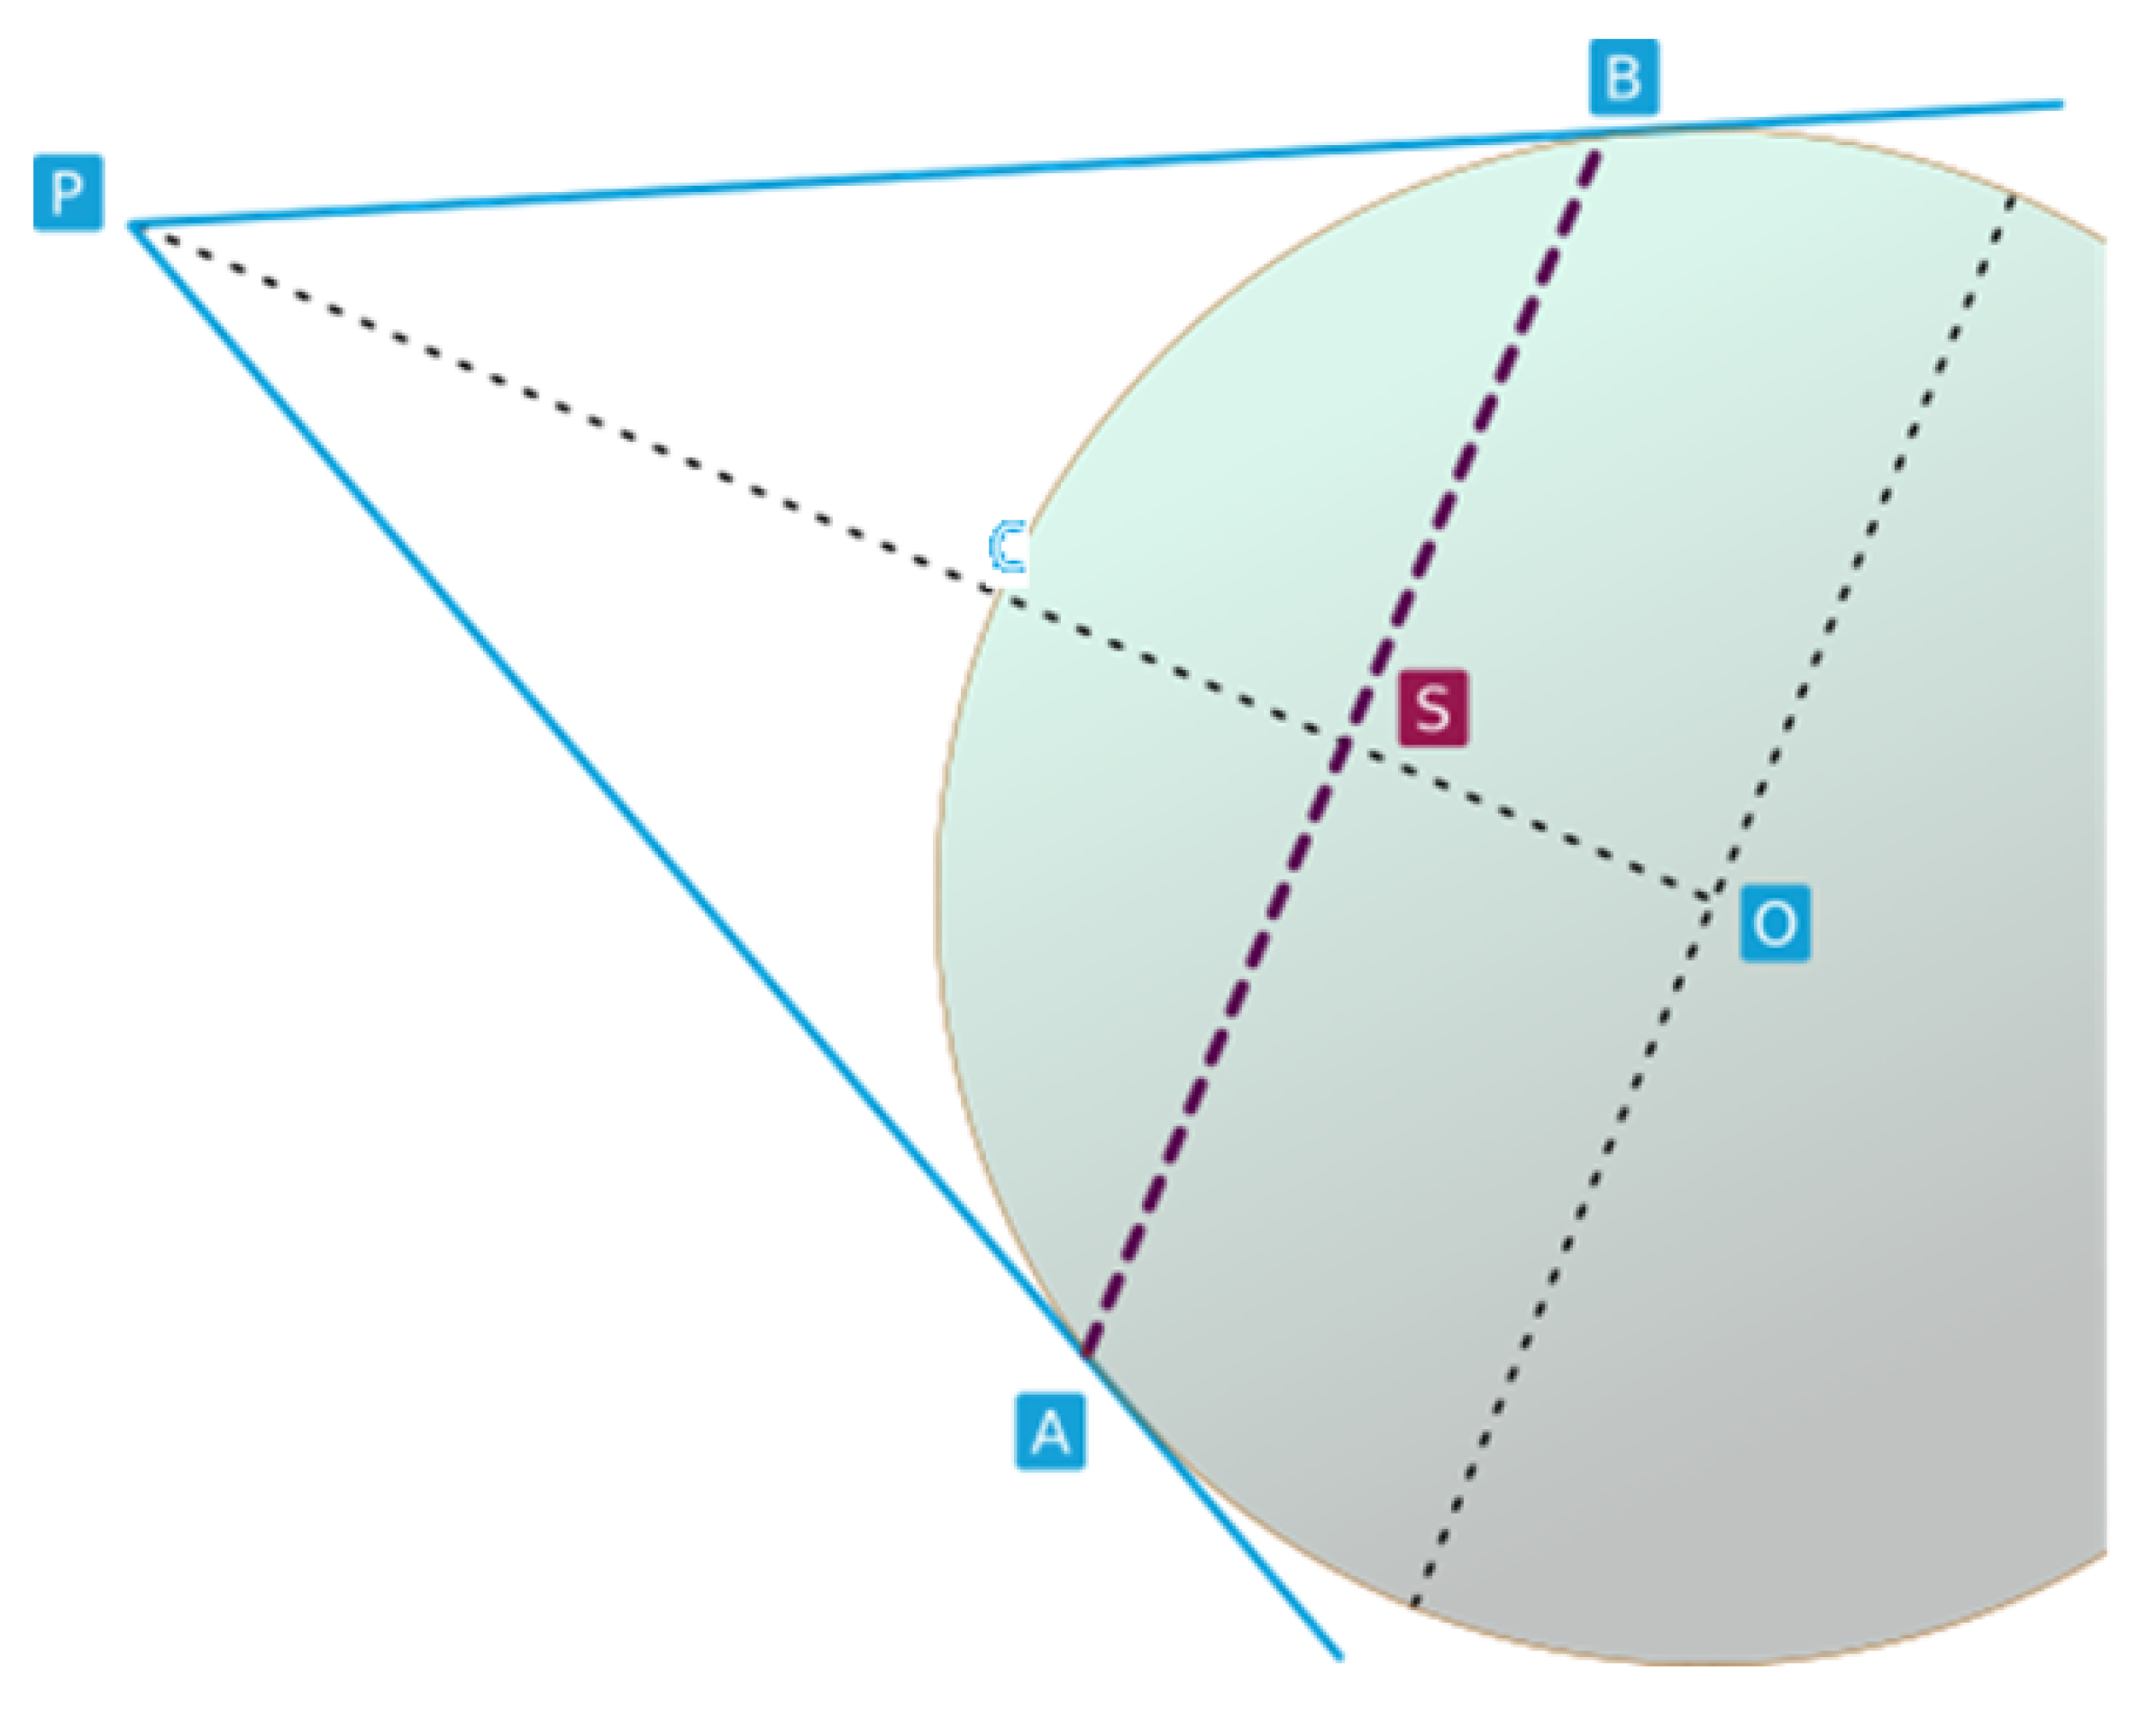
Fully digital DRAs for GEO missions afford larger radiating elements when compared to MEO or LEO missions. In principle, larger radiating elements offer increased directivity and therefore are preferred for satellite communication systems. However, in order to avoid interference linked with the grating lobes of the primary radiating elements, it is commonly required that these lobes are kept outside the field of view of the Earth as seen from the satellite. With reference to Figure 2, OA corresponds to the radius of the Earth, approximately 6371 km. The satellite orbit is marked by CP, which refers to the altitude of the satellite above the Earth’s equator; for a GEO orbit this is approximately 35,786 km. Simple geometrical considerations reveal that the angle subtending the Earth’s field of view from a GEO orbit is therefore obtained as in (1). In other words, ( A P O ) = 8.9 °.
tan ( A P O ) = O A O P = 6371 ( 35 , 786 + 6371 ) = 6371 42 , 157 = 0.1511
The most stringent scenario in terms of keeping the grating lobes associated with the periodicity of the primary radiating elements outside the Earth’s field of view involves a primary beam pointing towards the end of coverage, or at about 8.9°. For this pointing angle, an array with radiating elements of about 3.2 λ , where λ is the wavelength, will ensure that grating lobes are at 8.9 ° or less, i.e., outside the field of view of the Earth. This dimension therefore defines the maximum acceptable size of a DRA radiating element for a GEO orbit. When compared with, e.g., an LEO orbit at 400 km, the corresponding (APO) angle is approximately 70° and the associated radiating element size is 0.5 λ .
The above analysis indicates an opportunity to reduce the number of primary radiating elements for GEO arrays when compared to antennas providing coverage from lower Earth orbits. Assuming a target directivity of 60 dBi and an aperture efficiency of 100%, the required edge of a square aperture exceeds 266 λ . Achieving this aperture size with radiating elements of size 3.2 λ calls for approximately 6900 elements. If each of these elements is operating across the full 3GHz of the Ka downlink band and operates in dual polarization, the DTP should then be capable of 3 × 6900 × 2 = 41,400 GHz. Even the latest digital processing technologies call for at least several Watts per GHz for the digital processing. On this basis it is evident that a fully digital DRA would be prohibitive from both power (>100 kW) and mass (>8000 kg) budget perspectives. More realistic values associated with emerging DTP payloads suggest the range of a few hundreds of GHz processing across the array, corresponding to a DBFN with a number of radiating elements in the range of 100.
In consideration of the above, a baseline hybrid analog–digital beamformed DRA is defined, as illustrated in Figure 1. It comprises 12 by 12 subarrays, each of 8 by 8 radiating elements. The total radiating aperture comprises 9216 radiating elements, each with size of 3.2 λ in accordance with the grating lobe requirements. The number of radiating elements is chosen higher than needed as this number enables a fair comparison between HAD architectures in the following.
It is worth noting that the 8 . 9 coverage is achieved using a set of regional beams generated by the HAD DRA. The configuration described above—specifically the gain target and radiating element size—is similarly applied in fully digital DRAs to prevent grating lobes from appearing inside the field of view when the analog (regional) beam is scanned toward the edge of the coverage area.
The antenna functions in the downlink Ka-band, i.e., operating at 20 GHz. As shown in Figure 1, this reference architecture exploits a cascade of ABFNs and DBFNs. Each radiating element belongs to a single subarray, which is associated with an analog beamformer. Subarrays are then digitally beamformed. From these observations, the radiation pattern can be translated as a combination of the weights at ABFN and DBFN levels.
The expression of the total array factor A t o t can be decomposed into two steps following the hybrid scheme. First, the subarray factor F is identified (2). F is equal across all subarrays, representing similar ABFN devices used. All array factors are expressed in the ( u = sin θ sin ϕ , v = sin θ cos ϕ ) coordinate system, where ( θ , ϕ ) are the elevation and azimuth angles, respectively.
F ( u , v ) = i , j n x n y W A i j e j 2 π λ ( x i ( u u A B F N ) + y j ( v v A B F N ) )
In the equation, the number of radiating elements within a subarray is ( n x , n y ) . W A B F N C n x × n y is the matrix of complex amplitude weights at the ABFN. The element position within a single subarray is represented by ( x R n x , y R n y ) .The phase ( u A B F N , v A B F N ) corresponds to the desired scanning direction of the regional ABFN subarray beam.
Next, G is the array factor at the DBFN level in (3). The number of subarrays is ( N s u b x , N s u b y ) . The matrix of complex amplitude weights at the DBFN W D B F N C N s u b x × N s u b y is associated with the lattice of all subarrays. The phase u D B F N corresponds to the desired scanning direction of the narrow DBFN beam. The array factor at the DBFN also uses the position of the subarray centres ( X s u b x R N s u b x , Y s u b k ) R N s u b y in the formulation.
G ( u , v ) = l , k N s u b x , N s u b y W D l k e j 2 π λ X s u b l ( u u D B F N ) + Y s u b k ( v v D B F N )
The final expression of the spot beam is given in (4) by the combination of array factors from the ABFN and DBFN A ( u , v ) = E ( u , v ) F ( u , v ) G ( u , v ) . In the formulation, ( x R E R n x N s u b x , y R E R n y N s u b y ) are the positions of the radiating elements within the full architecture. For this example n x = n y = 8 and N s u b x = N s u b y = 12 . The electric field for an elementary radiating element corresponds to E for a cosine element. The total scanning phase for the narrow beam is u 0 = u D B F N + u A B F N , considering the sum of initial phases from the ABFN and DBFN to achieve the overall steering. Here, it is included in the total weight matrix W T .
A ( u , v ) = E ( u , v ) k , l n x N s u b x , n y N s u b y W T l k e j 2 π λ ( x R E l u + y R E k v )
The total complex weight matrix W T C n x N s u b x × n y N s u b y from (1) provides the final excitation at each radiating element. This matrix can be obtained by multiplying the weights associated with the ABFN and DBFN, as defined in (5).
W T = W D B F N 11 W A B F N 11 W D B F N 11 W A B F N 1 n y W D B F N 1 N s u b y W A B F N 1 n y W D B F N 11 W A B F N n x 1 W D B F N 11 W A B F N n x n y W D B F N 1 N s u b y W A B F N n x n y W D B F N i 1 W A B F N 11 W D B F N i 1 W A B F N 1 n y W D B F N i N s u b y W A B F N 1 n y W D B F N i 1 W A B F N n x 1 W D B F N i 1 W A B F N n x n y W D B F N i N s u b y W A B F N n x n y W D B F N N s u b x 1 W A B F N 11 W D B F N N s u b x 1 W A B F N 1 n y W D B F N N s u b x N s u b y W A B F N 1 n y W D B F N N s u b x 1 W A B F N n x 1 W D B F N N s u b x 1 W A B F N n x n y W D B F N N s u b x N s u b y W A B F N n x n y
As shown, each subarray is drawn with a representation of its phase and amplitude at the ABFN in W T . The matrix of complex ABFN weights corresponds to both amplitude and phase weights, denoted W A B F N = W A e j 2 π λ ( u A B F N + v A B F N ) . Similarly, the DBFN applies weights given by W D B F N = W D e j 2 π λ ( u D B F N + v D B F N ) . Every element within a subarray W A B F N i j , i [ 1 , n x ] , j [ 1 , n y ] is assigned a unique weight, allowing for individual tapering and steering. The input signal coming from each subarray is in turn combined by multiplying by the DBFN weights. Each ABFN patch behaves like a single large radiating element. Therefore, each subarray is multiplied by a fixed DBFN weight W D B F N k l , k [ 1 , N s u b x ] , l [ 1 , N s u b y ] , as depicted in W T . In practice, this means that each W A B F N C n x × n y is scaled by a different DBFN coefficient. In terms of signal characteristics, the amplitude at each radiating element results from the product of the ABFN and DBFN amplitudes, while the total phase is the sum of their respective phase contributions. Once the combination of the ABFN and DBFN weights is conducted as per Equation (5), power normalization is performed to ensure that the total power per amplifier does not exceed a given value. It is achieved at both the ABFN and DBFN levels. It is noted that the mutual coupling between radiating elements of size 3.2 λ can be ignored.

2.2. Existing Hybrid Beamformed Overlapped DRAs for On-Board Satellite Communications

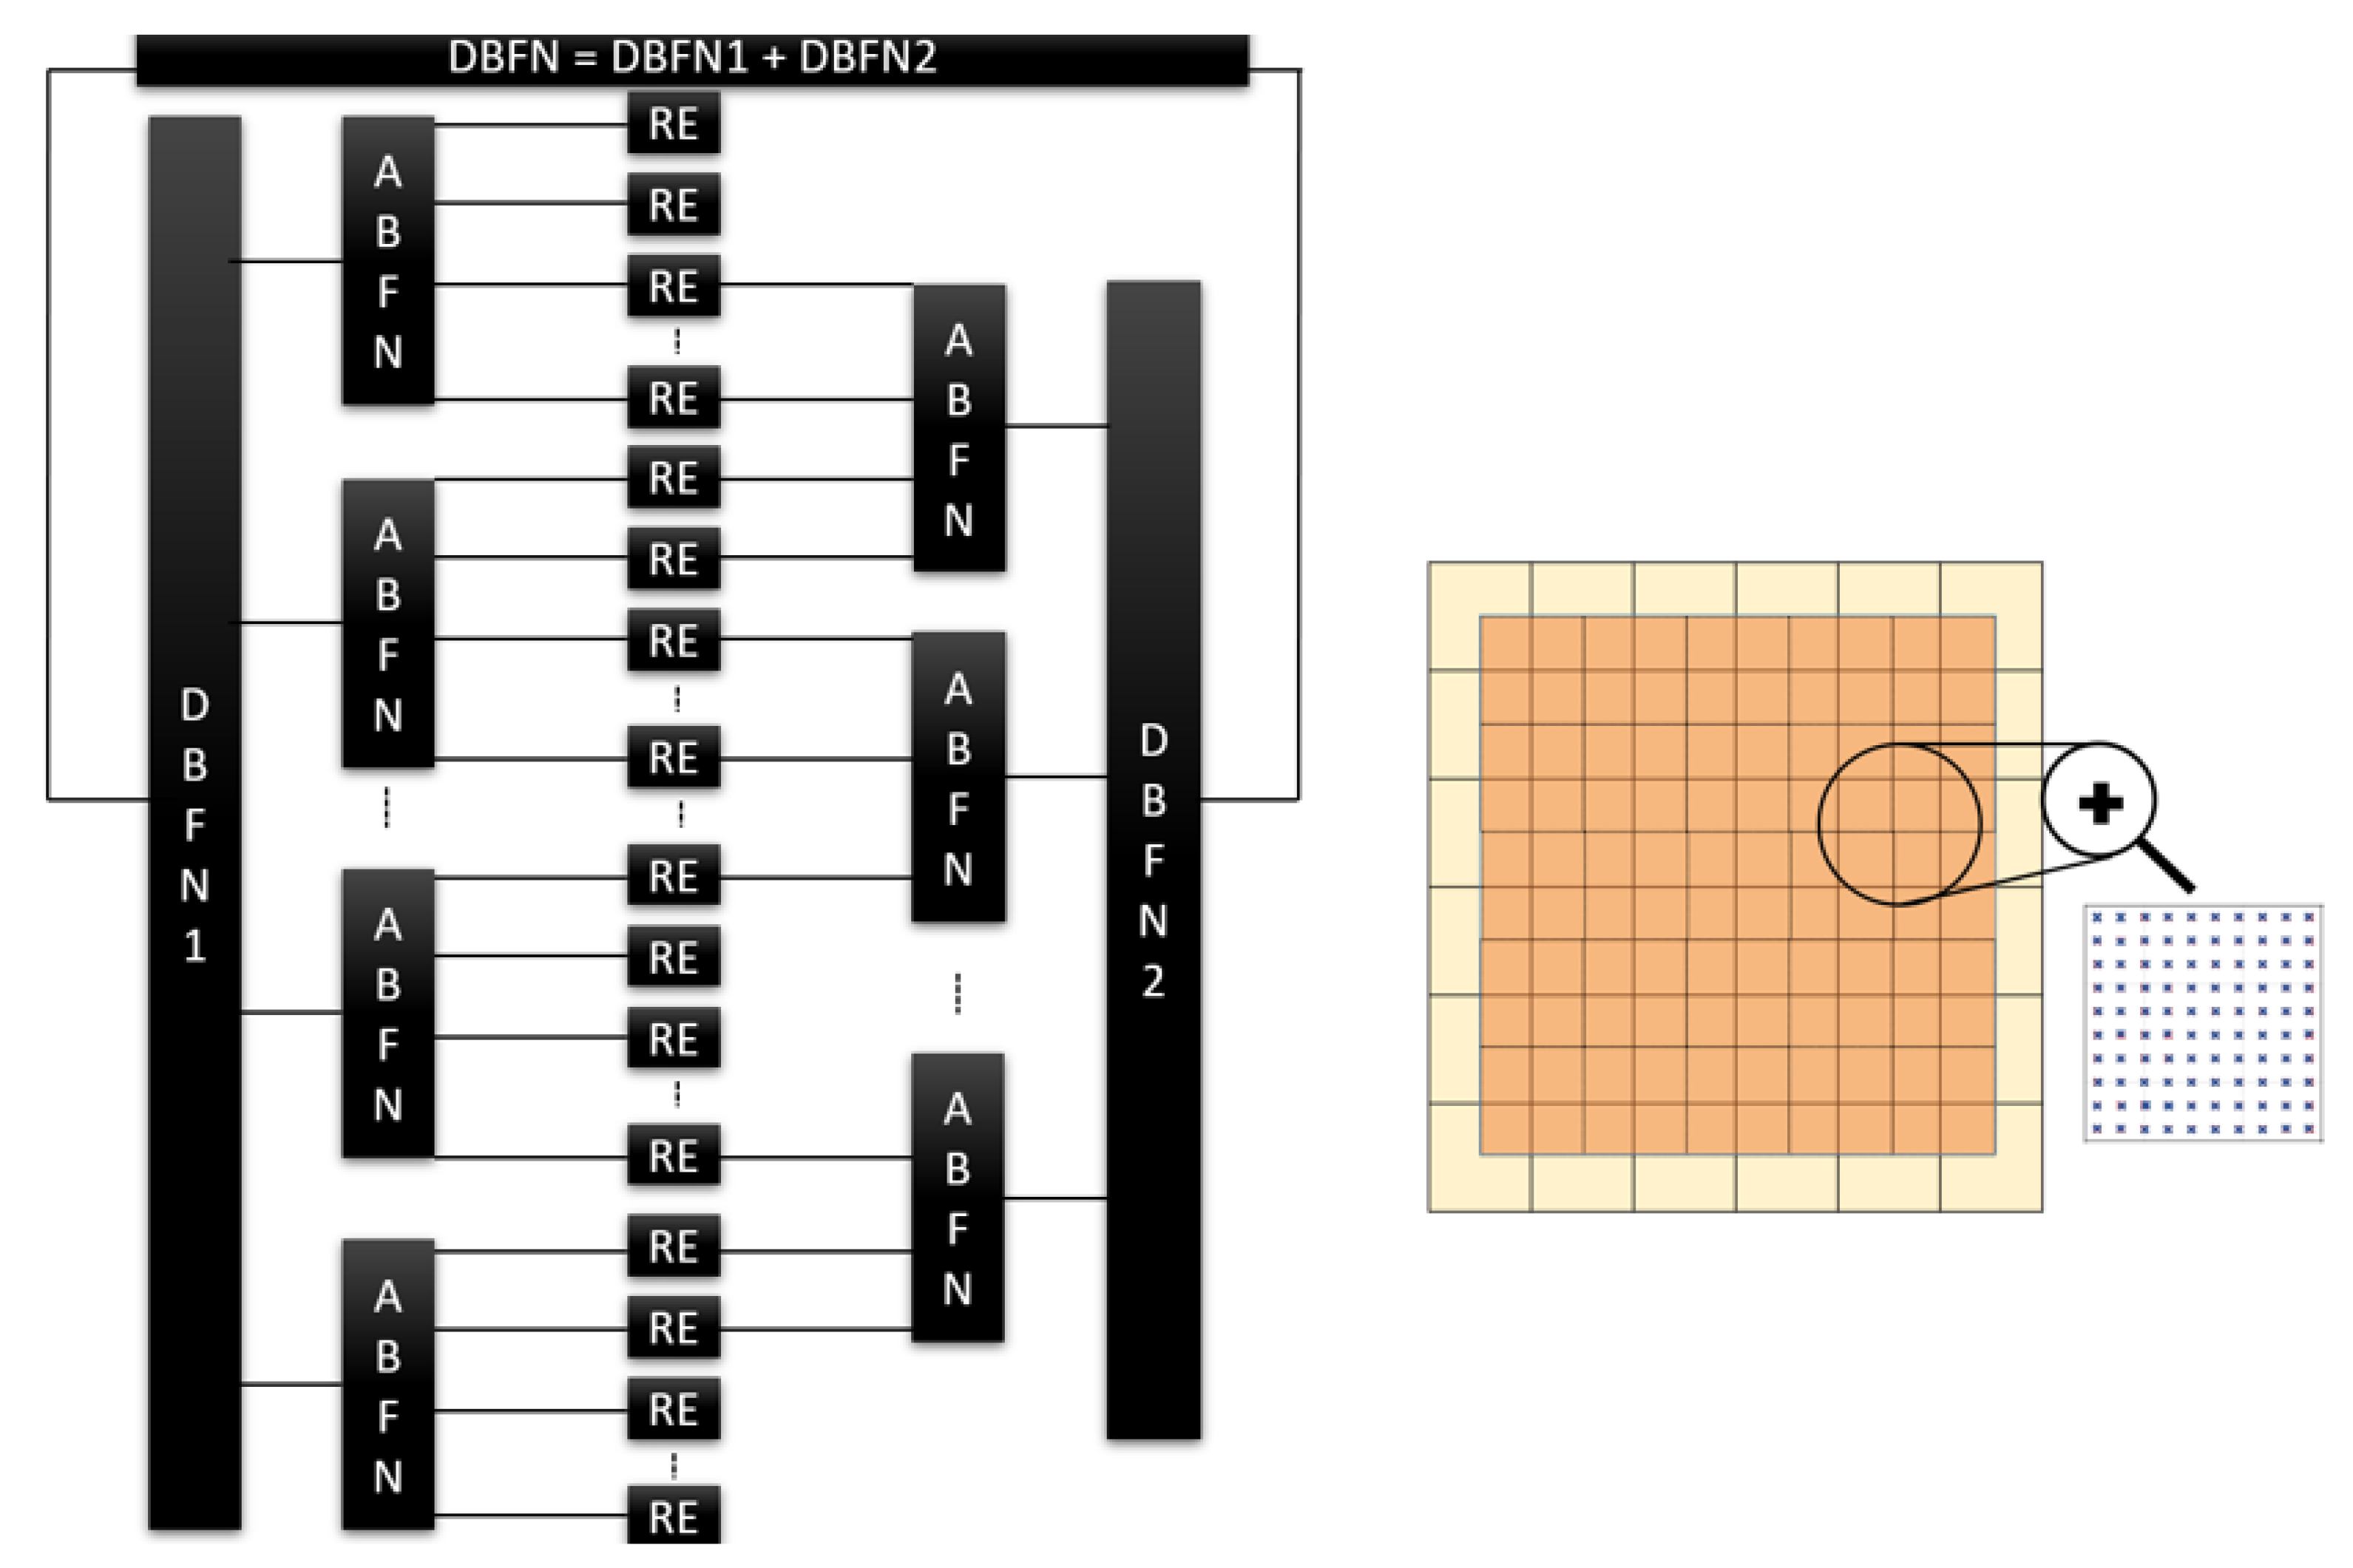
The reference hybrid beamformed architecture, which is next referred to as “NO” for no overlap, is used as a background to introduce the two overlapping architectures. The first one, referred to as OA for “overlapped arrays”, is the case where subarrays are overlapped thanks to a shift in another layer of subarray tiles by half the size of a subarray in the Cartesian domain [18]. The beamforming scheme for the strategy is introduced in Figure 3.
As illustrated in the figure, all radiating elements are now excited by the superimposed signals generated by two ABFNs, with the exception of those located at the array periphery, which are connected to a single ABFN. Each ABFN is virtually associated with a distinct DBFN, denoted as DBFN 1 and DBFN 2 . The first DBFN corresponds to the original array configuration, while the second is linked to an overlapping array that is spatially shifted by half the subarray size in both Cartesian directions. Notably, the overlapping array is slightly smaller, comprising one fewer row and column of subarrays compared to the original.
Each subarray contains a single feed located at its center. Relative to the reference architecture, the number of digital control ports increases by the number of subarrays introduced in the overlapping layer. In the subsequent analysis, the peripheral frame of radiating elements—those fed by only one ABFN—is excluded. As a result, only the radiating elements excited by two subarrays are retained. This configuration offers the advantage of uniform power distribution across all amplifiers, as each radiating element is driven by two subarrays, enabling equal power division. Consequently, the hardware implementation is simplified, allowing for the use of identical amplifier units throughout the array. Additionally, this arrangement yields more regular radiation patterns, which is beneficial for generating beam sets with reduced inter-beam interference.
From a digital complexity standpoint, the initial array comprises 13 × 13 subarrays, each consisting of 8 × 8 radiating elements (REs), while the overlapping layer includes 12 × 12 subarrays of the same size. Each digital port from the DTP is connected to a single subarray, resulting in a total of 169 + 144 = 313 digital ports. After removing the peripheral frame, the effective radiating aperture consists of 9216 REs, consistent with the NO configuration.
In contrast to the formulation in (5), the contribution from the overlapping subarray layer must be incorporated. Each element of the beamforming matrix becomes a sum of digital contributions from both DBFNs, expressed as W DBFN = W DBFN 1 + W DBFN 2 . Given the equal power division between the two layers, the contributions from DBFN 1 and DBFN 2 are balanced for each radiating element.
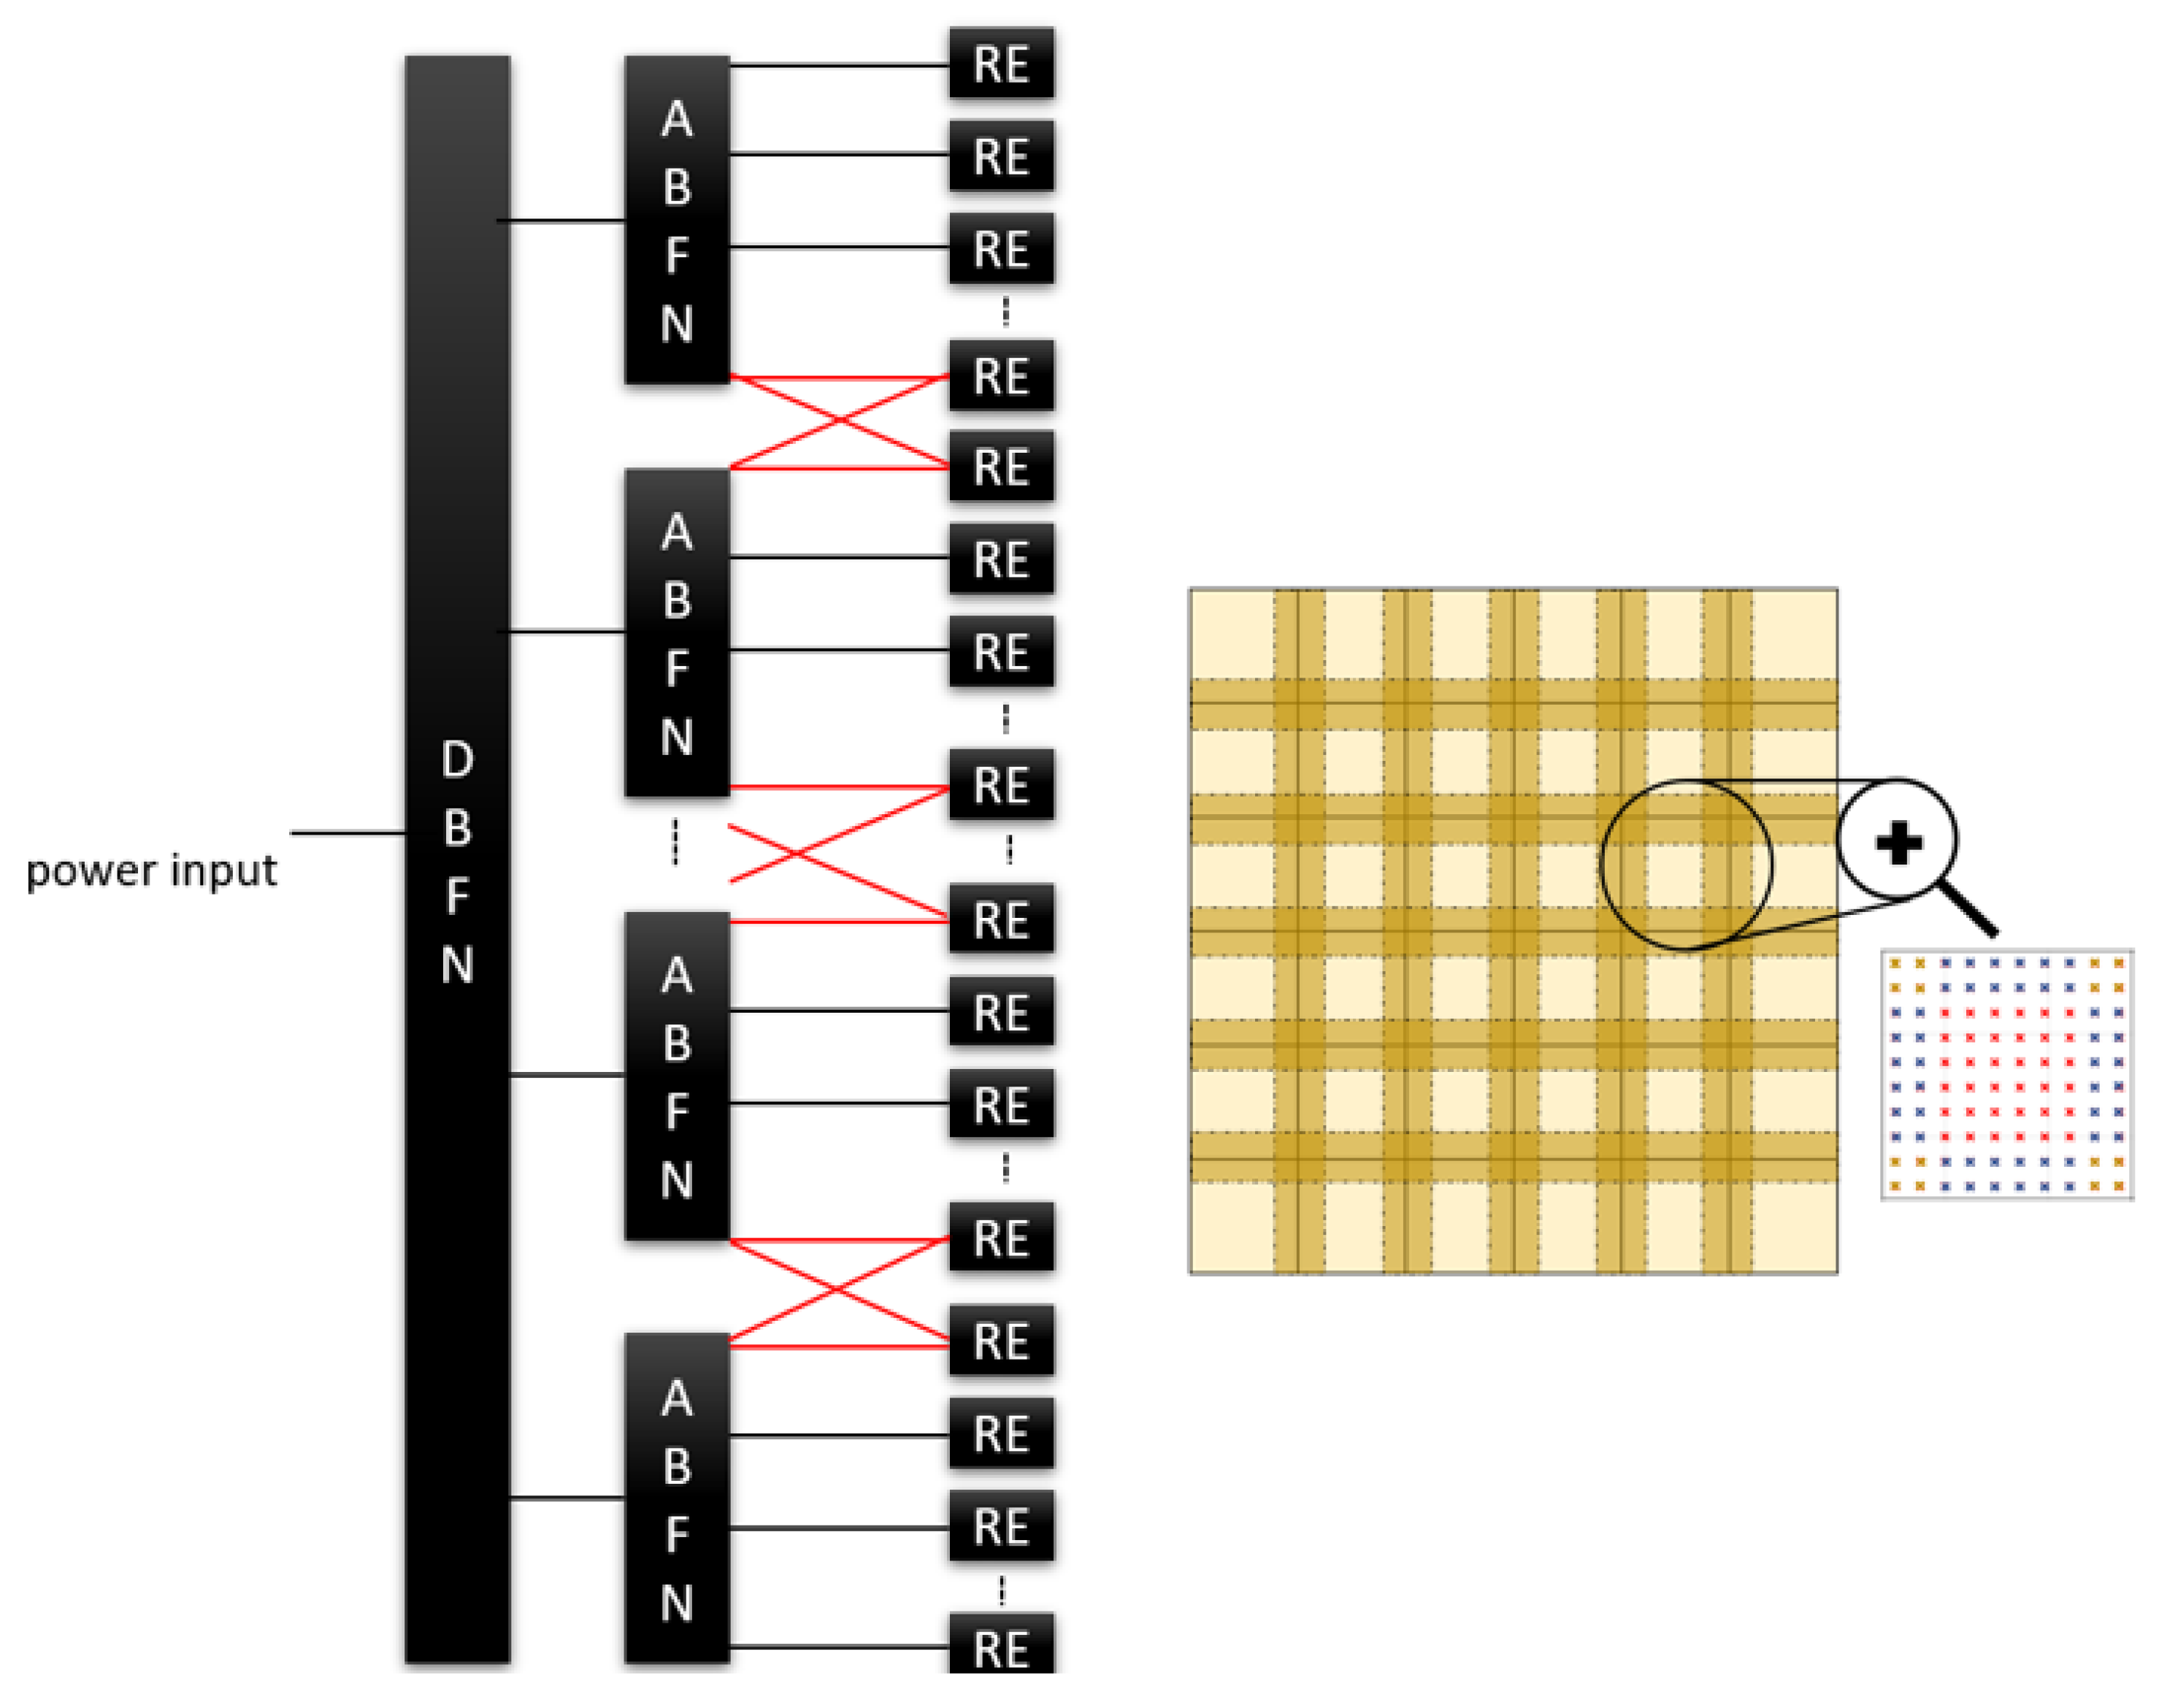
The second overlapping methodology, illustrated in Figure 4, is referred to as OS, denoting “oversized subarrays.” In this approach, the dimensions of the original subarray tiles are extended by adding additional radiating elements along all four Cartesian directions, while maintaining the original lattice configuration. As a result, each subarray overlaps with its neighboring subarrays, creating shared radiating elements [19]. These overlapping elements are excited by the superposition of signals from the contributing subarrays. As shown in Figure 4, the central radiating elements remain non-overlapped. At the edges of the subarrays, the overlapping elements (highlighted in blue) are shared between two subarrays, while those located at the corners (yellow) are shared among four subarrays. This configuration necessitates the summation of different ABFN weights for the overlapping elements. Notably, the DBFN remains identical between the NO and OS configurations, as seen by comparing Figure 1 and Figure 4.
However, the non-uniform number of subarrays connected to each radiating element results in a non-homogeneous power distribution at the amplifier level. This introduces additional hardware complexity, requiring three distinct types of devices within the architecture.
In the presented OS configuration, the radiating aperture comprises 9216 radiating elements (REs). Each subarray is extended by two REs in each Cartesian direction. Consequently, the architecture consists of 12 × 12 subarrays, with central subarrays sized at ( 8 + 2 + 2 ) × ( 8 + 2 + 2 ) REs, corner subarrays at ( 8 + 2 ) × ( 8 + 2 ) REs, and edge subarrays at ( 8 + 2 + 2 ) × ( 8 + 2 ) REs. As discussed in [19] optimal performance for this overlapping technique is achieved with a 1:3 overlap ratio—where one-third of the subarray is overlapped on each side, leaving a central third non-overlapped. This condition is met when the original subarray size (prior to extension) is divisible by four. In this example, each OS subarray is 12 × 12 , with four REs overlapped, four non-overlapped, and four overlapped again along each direction. This constraint is driven by manufacturing considerations.

3. Results

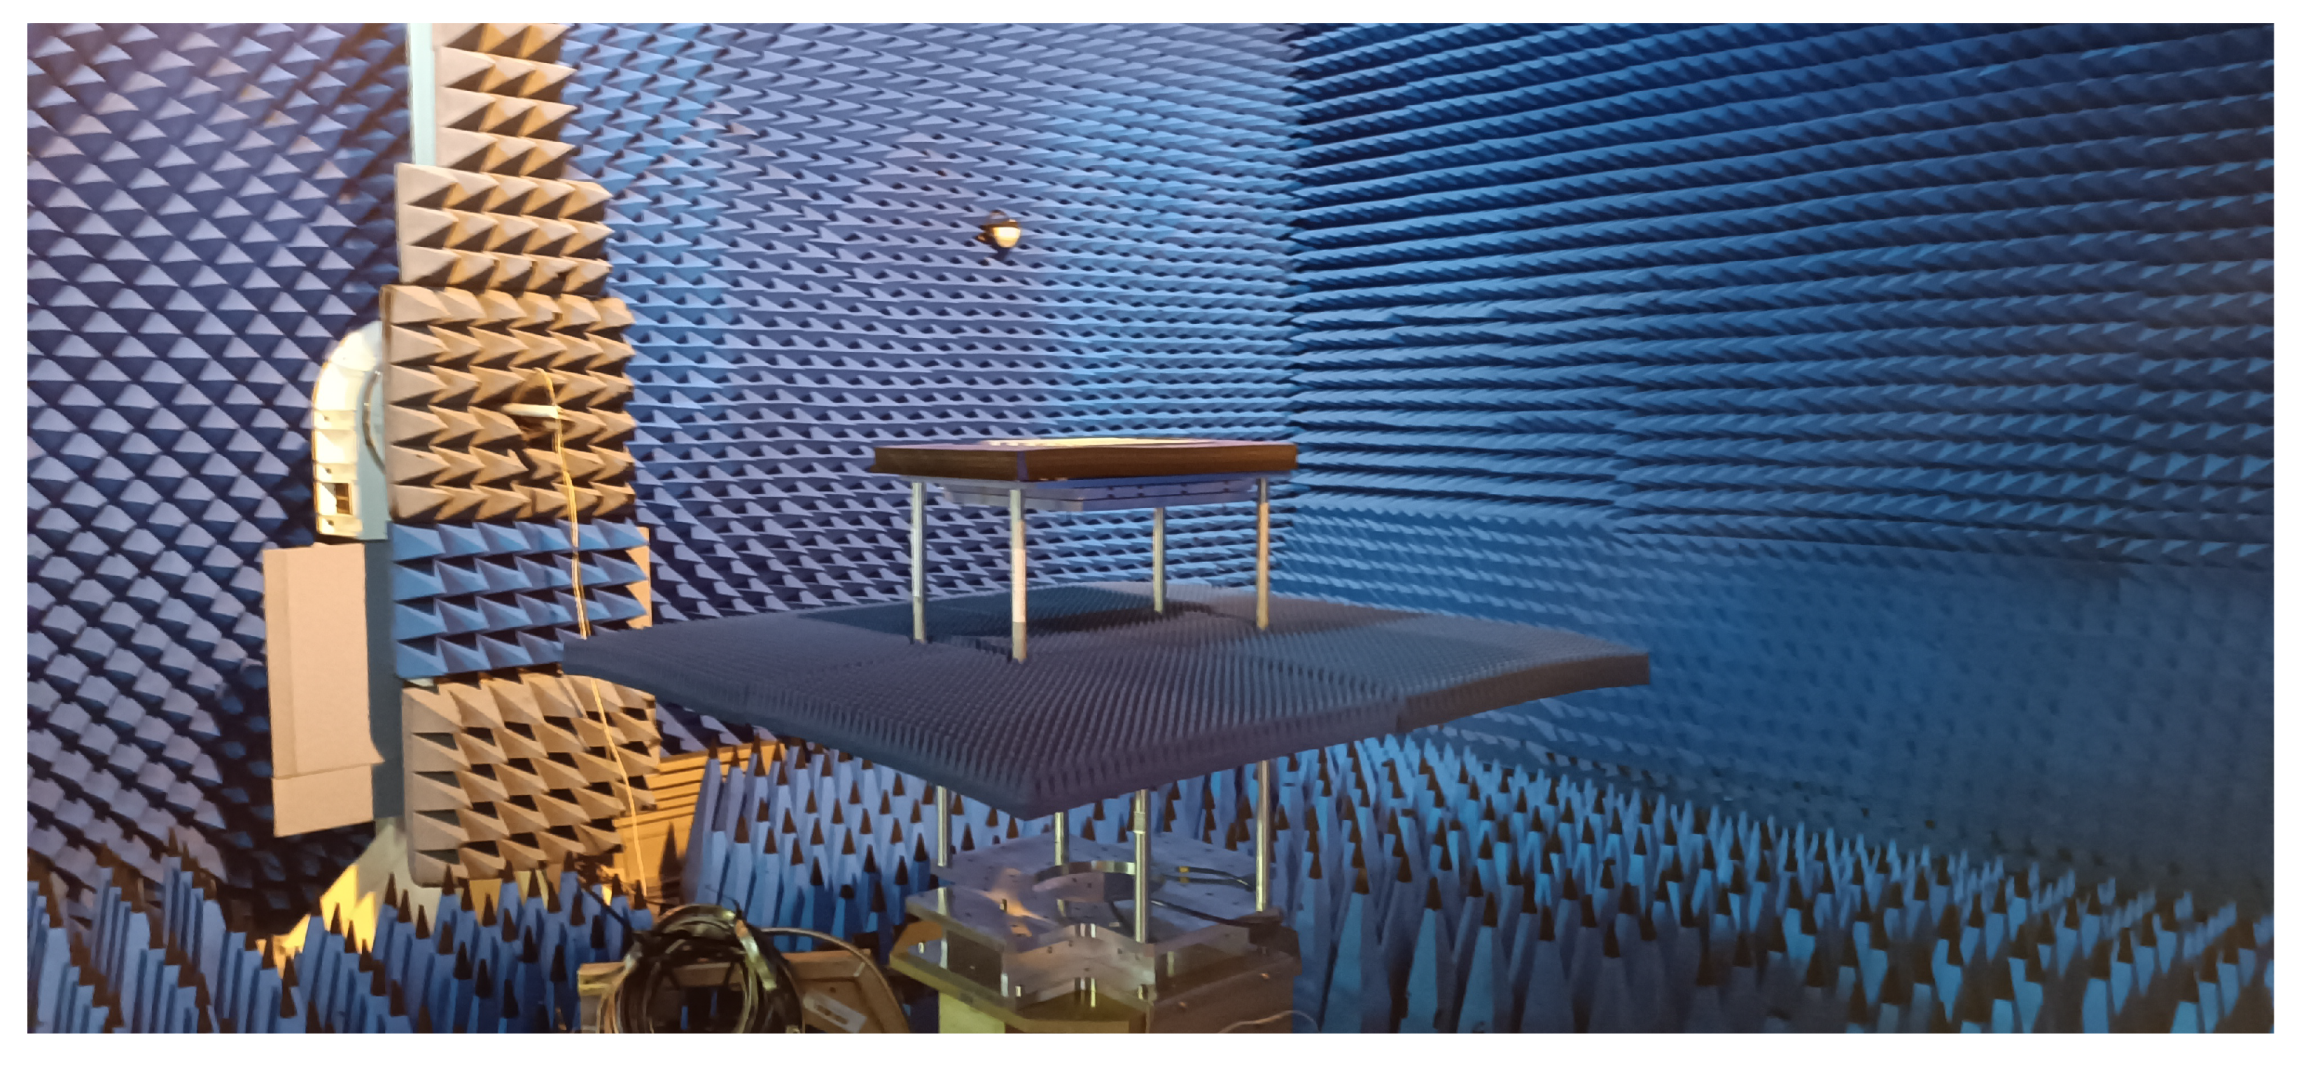
In this section, characteristics from the overlapped HAD DRAs are compared. Although this analysis is performed theoretically, note that the OA architecture has been implemented and measured. Simulation results presented in this paper and performed with MATLAB 2021a are in line with practical implementation. In Appendix A, pictures of the built panel are presented for the reader’s curiosity. Note that the simulated radiation patterns were consistent with the measured results.

3.1. Antenna Characteristics

3.1.1. Radiation Patterns

We next study the radiation pattern characteristics associated with the three antenna architectures (NO, OA, and OS). This study focuses on scanning a spot beam (produced by the entire array and the combination of ABFNs and DBFNs) within a regional beam (produced by each subarray and the associated ABFN). As depicted previously in Figure 1, a set of regional beams is needed to achieve the full Earth coverage. Scanning at the DBFN inside a broad ABFN beam therefore provides some sub-coverage characteristics.
To conduct this study, the impact of ABFN tapering must be considered. Tapering reduces side lobes and suppresses grating lobes in the spot beam, enhancing gain stability during scanning. However, this comes at the cost of reduced main beam gain, particularly at broadside. Therefore, ABFN tapering involves a trade-off between scan loss and peak gain. An optimal taper minimizes scan loss while preserving high gain at the spot beam level.
In the remaining, the optimal tapering for the ABFNs are selected. The best compromise (obtained through exhaustive simulations) is a 6 dB taper for NO and OA configurations and a Taylor taper with a −32 dB side lobe level for the OS.
Figure 5 shows the pattern produced by the three architectures for a spot beam in the same position. Several observations can be made:
  • The NO and OS architectures produce grating lobes at the same positions.
  • The grating lobes of the OA architecture largely overlap with the even grating lobes of the NO architecture. However, at the odd grating lobe position of the NO (and OS) architecture(s) the OA architecture produces a null. This is due to the grating lobe suppression. At the even grating lobe level, which also includes the main lobe as the 0th-order one, the gain is increased by 0.5 dB compared to the NO configuration.
  • The grating lobes of the OS architecture are overall at lower levels. This is a known feature for this class of architectures [19].
  • For overlapped architecture scanned with a fixed non-adaptive taper at the ABFN, the grating lobes cannot be totally suppressed. Although a null could be enforced at the grating lobe position along a given scanning direction, the multibeam generation context prevents nulling control for every single beam. Indeed, such an operation is implemented on-board the DTP and is unaffordable for thousands of beams generated simultaneously. In this frame, a reduction in or partial suppression of the grating lobes is targeted.
Figure 5. Simulated radiation patterns of the different architectures considered for a scan at 0.5° along θ and a cut along ϕ = 0°. In black, radiation pattern of the reference NO. In blue, OA. In red, OS.
Applsci 15 10216 g005
The OA strategy leads to inherent suppression of a subset of the original grating lobes associated with the spot beams. This can be seen since the original lattice of subarrays in the NO configuration is a square grid but the shift by half the size of a subarray in the OA configuration implies the creation of an isosceles lattice, which is twice as close than in the NO configuration along one direction. This ensures that the grating lobes along one direction are twice as far apart. The grating lobe position remains unchanged along the other orthogonal direction. Effectively every other grating lobe is suppressed, marking a shift from a square lattice of grating lobes for the NO architecture to a triangular lattice for the OA one.
For OS (corresponding to the state-of-the-art overlapped architecture), the width of the regional beam associated with the subarray is narrower than in the NO (and OA) configurations. This is because the subarray size is increased. At the same time, the lattice associated with the subarrays and the DBFN level in OS is the same as in NO. Consequently, the grating lobe position is the same as in the NO architecture. However as discussed in [19], the magnitude of the grating lobe is reduced by about 5 dB. The gain at the main lobe is increased by 0.5 dB compared to the NO configuration. In terms of side lobes, their level is also overall drastically reduced for the OS case. The position of the subarray null is responsible for the grating lobe mitigation. Indeed, the subarray pattern modulates the level of the grating lobes. Here, the first-order grating lobe at 1 . 85 is situated inside a secondary lobe of the subarray pattern. When the main beam is steered further to broadside, the grating lobe is equally displaced. When close to the subarray pattern first null, the grating lobe is totally attenuated. However, when the narrow beam is scanned at the edge of the subarray pattern main lobe, the grating lobe appears inside the same lobe. It is therefore not mitigated anymore. The attenuation of grating lobes with the OS technique depends on the scanning direction and ranges from no attenuation to total suppression. These observations are in line with [17,18,19].
In conclusion, both OA and OS bring advantages in terms of partial grating lobe mitigation and, in the case of OS, overall side lobe suppression. Note that the mitigation in the presented scanning case is 5 dB for OS at all grating lobe levels (corresponding to the state-of-the-art technique [17,18,19]) and changes depending on the scanning direction. For OA, the odd grating lobes are totally suppressed and the even ones are increased by 0.5 dB. A more quantitative comparison is performed in Section 3 where the three antennas are resized to produce an equivalent radiating aperture and similar requirements for DBFN processing. The next subsection provides some more insight on the radiation characteristics described above.

3.1.2. Amplitude and Phase Distribution

Since the far field of a DRA is obtained as the Fourier transform of the radiating aperture, it is insightful to study their radiation pattern characteristics in light of the amplitude and phase distribution across the array. Although there is a strong interaction between the two, the phase distribution is strongly linked with the grating lobe generation while the amplitude distribution can be critical when it comes to aperture efficiency. We first study the phase distribution across the three architectures and then move to the amplitude distribution.
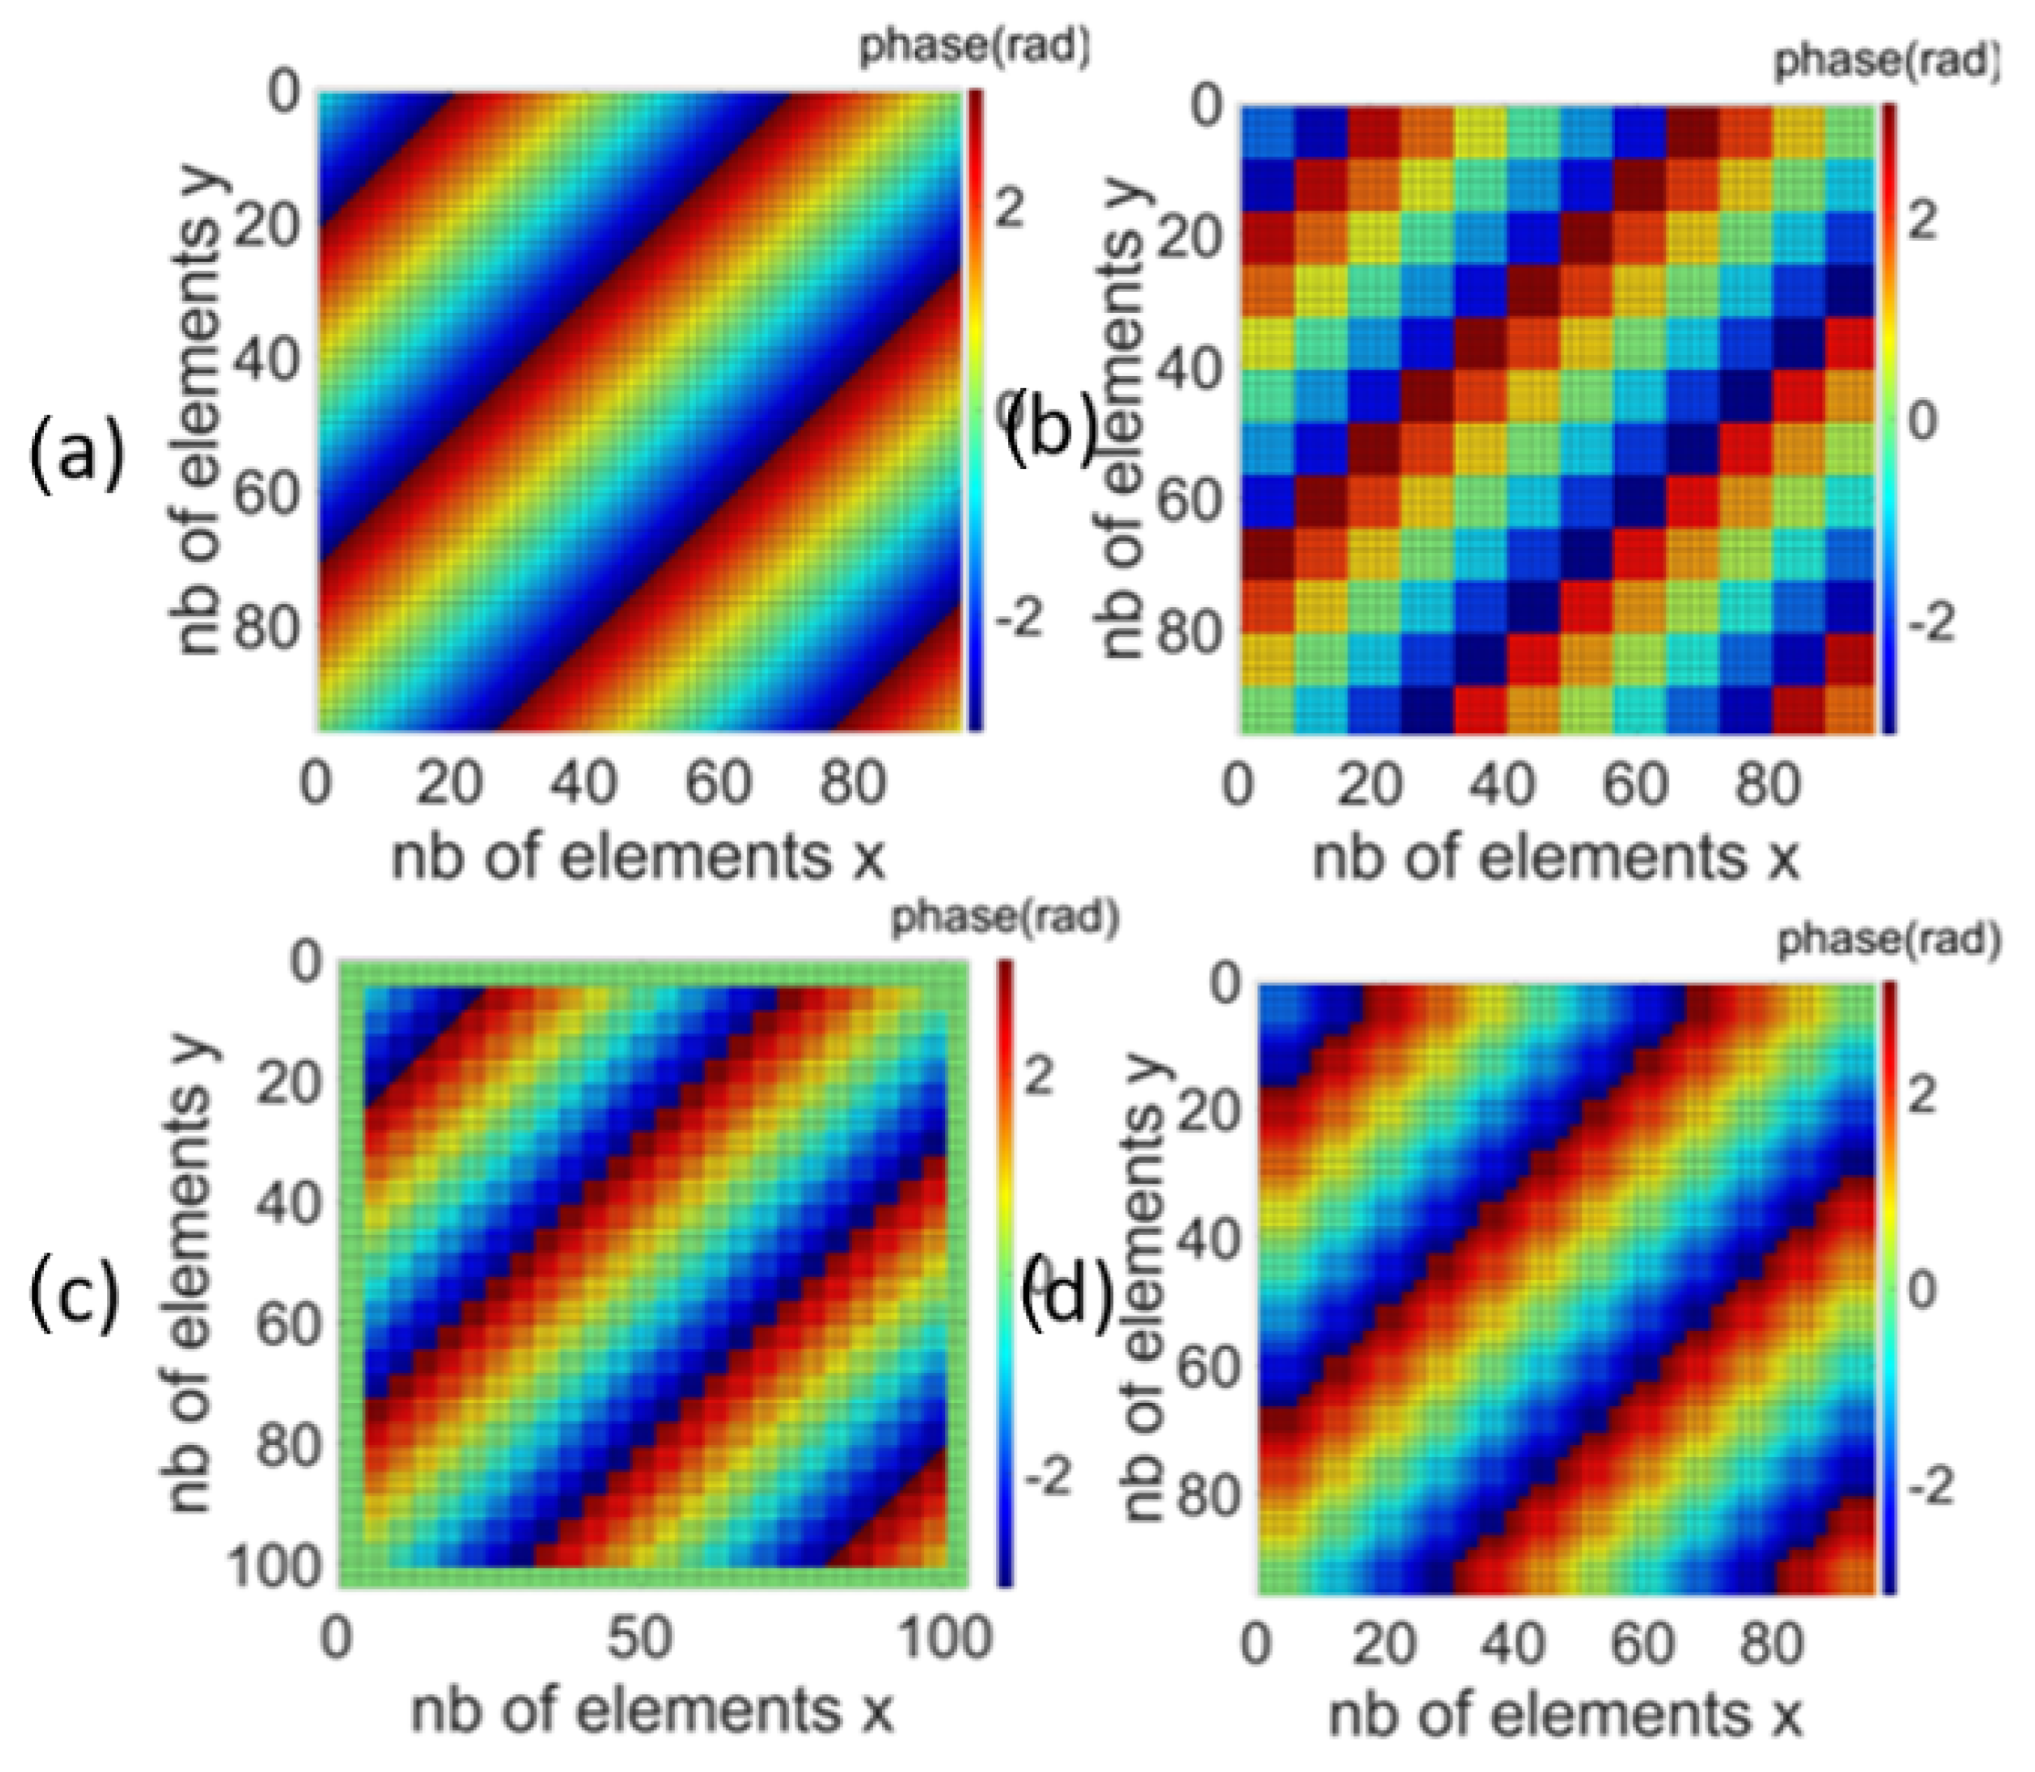
For a very ideal case of a fully digital DRA architecture, there is no grating lobe while scanning the beam as long as there is a smooth phase variation across the aperture. In practice the phase is quantized by the size of the radiating elements, but otherwise there are no other major constraints since each element is fed by a digital port controlling its phase. The steering of the beam is performed such that the fully digital case is considered without grating lobes. Indeed, within the field of view, the architecture with 3.2 λ radiating elements does not bring such interference. This can be referred to as the ideal case, as defined in Figure 6a.
When introducing the hybrid beamforming scheme NO, subarrays are seen as large radiating elements at the digital level, therefore implying a coarse quantization of the phase (one phase per subarray). The phase is less smooth and more significant grating lobes are observed. In the case presented in Figure 6b, the NO architecture is composed of 12 × 12 subarrays. While scanning along the diagonal ϕ = 45 ° at θ = 0.5 °, a quantization per subarray occurs along the azimuth and elevation axes. Then, the total quantization is 12 × 12 = 144 steps for the phase.
For the OS case, Figure 6d, a drastic reduction in phase quantization is observed. Because subarrays are overlapped at 1:3, it is observed that for one subarray at the center of the architecture along one direction, there are three steps. Equalizing these steps is performed by the 1:3 overlap, and therefore geometrically justifies the optimal parameterization in terms of grating lobe mitigation. At the edges, there are two steps since the subarray is not overlapped along all the directions. The quantization can be explained by the following: when subarrays are extended, radiating elements at the edge of the subarrays are fed by several subarrays that are not in phase coherence. While scanning along the diagonal ϕ = 45 °, the total quantization is ( 12 × 3 + 2 × 2 ) × ( 12 × 3 + 2 × 2 ) = 1156 phase steps.
The expression of the phase quantization related to the array factor of the OS technique is given in (6), from (4). As depicted, there is the summation of three terms as the modeling involves the contribution coming from three subarrays along each direction. Position-dependent feeding is translated by δ functions, which is equal to 1 when the input condition is verified and 0 otherwise. The first element of the sum represents the subarray contribution on the left/top, the second that of the inner subarray, and the last term that of the right one/bottom one. Note that the shift between neighbour subarrays is achieved with a shift of n x d x λ 3 , n y d y λ 3 .
A O S ( u , v ) = E ( u , v ) l , k n x N s u b x , n y N s u b y [ W T l k e j 2 π λ ( x R E l ( u u 0 ) + y R E k ( v v 0 ) ) ( δ ( k [ N s u b x ] < N s u b x 3 , l [ N s u b y ] < N s u b y 3 ) 1 K e j 2 π 3 λ ( n x d x λ ( u u A B F N ) + n y d y λ ( v v A B F N ) ) + 1 K + δ ( k [ N s u b x ] > N s u b x 3 , l [ N s u b y ] > N s u b y 3 ) 1 K e j 2 π 3 λ ( n x d x λ ( u u A B F N ) + n y d y λ ( v v A B F N ) ) ) ]
where K represents the number of subarrays contributing to a radiating element: either one, two, or four. The phase u A B F N denotes the initial scanning of the subarray pattern at the ABFN. As observed, the three terms are not in phase coherence.
The grating lobe reduction occurs for the sum of these contributions, becoming lower than the non-overlapped expression.
The final expression emphasizes the tapering created with the phase offsets. Here, however, the grating lobe attenuation depends on the scanning direction within the subarray broad beam, as deduced by the presence of the initial phase from the ABFN in the equation. As observed, the attenuation is present for all grating lobes until u points situated at the edges of the subarray pattern, where the phases from the edges of the subarrays become equivalent (i.e., close to π and π ) and cancel the quantization.
In the OA configuration, illustrated in Figure 6c, each subarray within a layer undergoes a single phase quantization. However, the two layers are not phase-coherent, which enables the effective suppression of odd grating lobes. This lack of coherence is reflected in the phase quantization process, where the number of phase steps per subarray is effectively doubled along a given direction. Consequently, along the 45° direction, the total number of phase quantization steps amounts to ( 12 × 2 ) × ( 12 × 2 ) = 576 . A summary of the phase quantization values for the different configurations is provided in Table 1.
Mathematically, the relationship between phase quantization and grating lobe mitigation for OA can be expressed as (7). As depicted, the demonstration of grating lobe mitigation is performed at the DBFN level. It is known that, for OA, the additional ABFN devices connected to one radiating element are all shifted by half the size of a subarray along the two Cartesian directions. Therefore, this is translated in the equation by the sum of two terms. The first one represents the inner ABFN devices from the non-overlapped subarrays, and the second is the shifted ones. The exact translation is mathematically equal to ( n x d x λ 2 , n y d y λ 2 ) , as represented.
A O A ( u , v ) = E ( u , v ) l , k N s u b x , N s u b y [ W D l k F ( u , v ) e j 2 π λ X s u b l ( u u D B F N ) + Y s u b k ( v v D B F N ) e ± j 2 π λ n x d x λ 2 ( u u D B F N ) + n y d y λ 2 ( v v D B F N ) 1 + e ± j 2 π 2 λ ( n x d x λ ( u u D B F N ) + n y d y λ ( v v D B F N ) ) ]
The grating lobe position is related to the size of the subarray in (8).
2 π n x d x λ λ ( u p u D B F N ) = 0 [ 2 π ] u p = u D B F N + p n x d x with p = 1 , 2 n u
Symmetrically we can have the formula along the other axis in (9).
2 π n y d y λ λ ( v q v D B F N ) = 0 [ 2 π ] v q = v D B F N + q n y d y with q = 1 , 2 n v
When evaluating the radiation pattern at this specific position, it can be shown for OA that the phase opposition creates a cosine thanks to the Euler formula in (10).
A O A ( u p , v q ) = 2 E ( u p , v q ) l , k N s u b x , N s u b y [ W D B F N l k F ( u p , v q ) e j 2 π λ X s u b l ( u p u D B F N ) + Y s u b k ( v q v D B F N ) e ± j π 2 ( p + q ) cos π 2 ( d x n x ( u D B F N + p n x d x u D B F N ) ± d y n y ( v D B F N + q n y d y v D B F N ) ) ] A O A ( u p , v q ) = 2 E ( u p , v q ) l , k N s u b x , N s u b y [ W D B F N l k F ( u p , v q ) e j 2 π λ X s u b l ( u p u D B F N ) + Y s u b k ( v q v D B F N ) e ± j π 2 ( p + q ) cos π 2 ( p + q ) ]
The parity of the cosine function implies that odd p ± q orders are multiples of π 2 . It therefore generates a perfect null instead of a grating lobe. For an even p ± q grating lobe, there is a factor 2 that comes from the Euler formula related to the phase opposition between ABFNs. Hence, the even grating lobe levels are increased. For OA, it is therefore demonstrated how the phase opposition completely mitigates the odd grating lobes.
These results align with the previously discussed grating lobe characteristics. The architecture that achieves the most effective grating lobe suppression also exhibits the highest phase quantization resolution. In particular, the OS configuration demonstrates a significant improvement in phase quantization, leading to superior grating lobe mitigation. Meanwhile, as previously noted, the OA configuration inherently suppresses odd grating lobes due to the structure of its subarray lattice.
It is noted that the digital complexity is higher for OA compared to NO and OS. The fair comparison is investigated in the regional coverage area subsection.
In terms of aperture efficiency, optimal performance for a coherent aperture is achieved when the power distribution across the array is uniform. In the reference hybrid beamforming configuration (NO), this condition is met by applying a uniform taper at both the ABFN and DBFN levels. However, in the OA and OS architectures, individual radiating elements are excited by multiple subarrays, which, in the case of scanned beams, are not phase-coherent. This lack of coherence introduces amplitude variations across the aperture, disrupting the uniformity of the power distribution.
As a result, it is no longer necessary to impose a uniform taper at the subarray level to achieve an overall uniform taper in the overlapped architectures. The inherent signal superposition from multiple subarrays naturally contributes to a more uniform amplitude distribution across the aperture, albeit through a different mechanism than in the NO configuration.
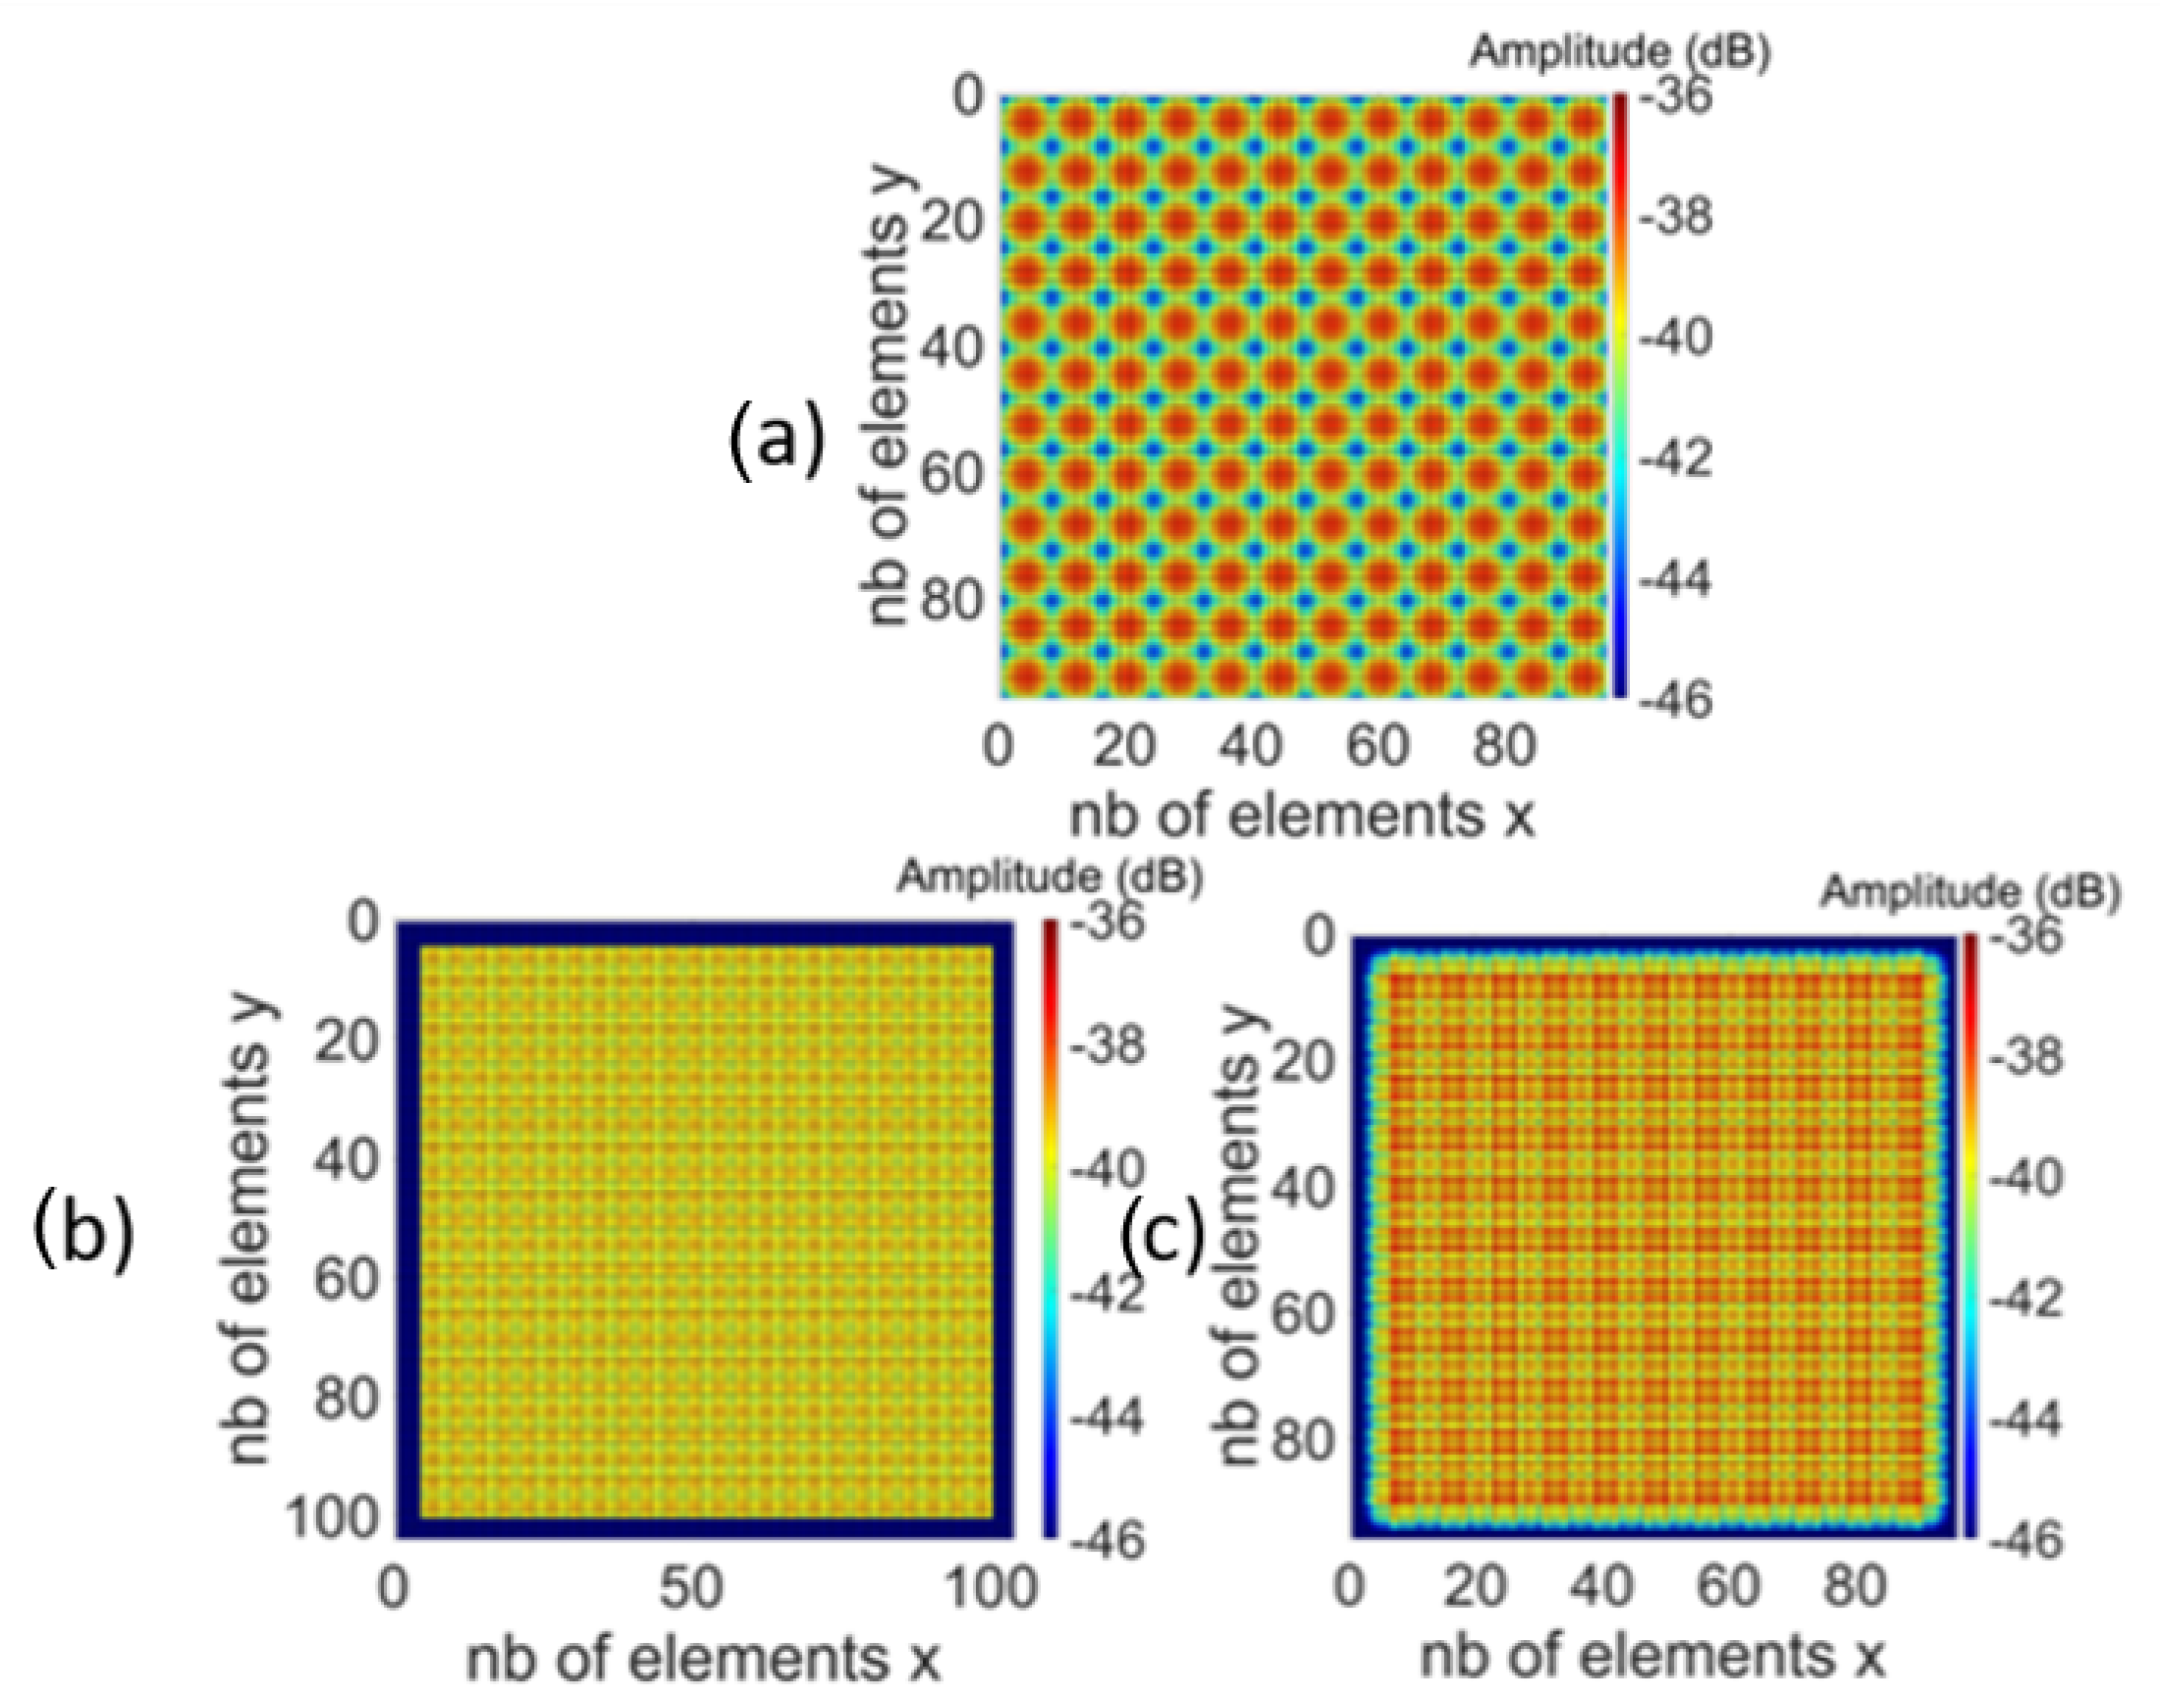
Figure 7 presents the amplitude distribution for a broadside (nadir) beam across the three antenna configurations under study. At broadside, all radiating elements are in phase, and thus the configuration with the most uniform power distribution yields the highest gain. In the OS configuration (Figure 7c), the amplitude variation reaches 2.4 dB, while the OA architecture (Figure 7b) exhibits a lower variation of 1.1 dB. The improved uniformity in the OA configuration explains the observed gain enhancement at the main beam, as shown in Figure 5, despite the presence of more pronounced grating lobes, as indicated by the phase analysis.
Further discussion on aperture efficiency under beam scanning conditions is provided in the following subsections.

3.2. Regional Coverage Area

The objective of this subsection is to define an optimal regional coverage area for every architecture within which spot beams can be generated. For a telecommunication application an objective is the generation of multiple regional beams simultaneously to maximize coverage. Moreover, frequency reuse at each regional beam is desired [18]. In terms of the digital processor, generating several regional beams multiplies the digital complexity associated with a single regional beam by the corresponding number of beams. Therefore, each regional beam should be as broad as possible. Optimum regional coverage seeks to satisfy the following two requirements:
  • The scan loss within the coverage is limited; i.e., a high gain is maintained for all spot beams within one of the regional coverages.
  • The interference within the area is low; i.e., there are no high-level grating lobes within the regional area.
In order to benchmark the three antenna architectures in terms of these characteristics, we re-design the three antennas so that they have a similar number of digital controls and the same radiating aperture such that the digital complexity is equal. The updated NO, OA, and OS antennas are described in Table 2.
For OS, it is noted that the number of REs per subarray is given for a subarray in the middle of the architecture. Otherwise, the size is slightly smaller at the edges for OS because the subarray is extended only along some directions. All architectures are defined with optimal characteristics. For OS, the chosen overlap is 1:3. For OS, the radiating elements at the edge of the aperture (fed by one subarray) are truncated. These settings guarantee a comparison between NO, OS, and OA configurations with, respectively, 144, 144, and 145 digital controls (DCs). Furthermore, the ABFN tapers are chosen such that the ratio between the gain degradation and the scanning performances is well-balanced. OA is used with a 6 dB taper while a strong Taylor taper is required for OS. The one applied corresponds to −32 dB SLL. For NO, a 6 dB tapering is applied as it has a low impact on the scanning performances. These optimum values have been obtained following exhaustive simulations. A uniform DBFN taper is applied for all architectures.

3.2.1. Scanning Performance

First, scan losses are studied for one regional beam fixed at nadir. A reference gain G ref = 61.76 dB is set for this radiating aperture, corresponding to a uniform power across the radiating elements in phase (beam pointing at nadir). The spot beam is steered along azimuth ϕ for successive increasing elevation angles θ at the DBFN level.
The scan loss threshold is defined based on a 3 dB reduction relative to the reference gain, G ref . This specific threshold is selected to meet telecommunication system requirements. In the context of GEO satellite communications, the free-space path loss is relatively low, allowing for a 3 dB gain reduction without significantly impacting link performance. As such, maintaining the gain within this threshold ensures comparable performance between nadir and broadside beam directions.
Once the scan loss threshold is reached, the main beam is steered to a new azimuth angle, ϕ , incremented by 1 , and the process is repeated iteratively to cover the full azimuthal range. For each azimuth angle ϕ , the corresponding elevation angle θ lim is defined as the maximum elevation at which the gain remains within 3 dB of the reference value, G ref .
The resulting values of θ lim across all azimuth directions ϕ are presented in Figure 8 for the NO, OA, and OS configurations. This boundary defines the “scanning range” of each architecture. It is important to note that the A and B axes in the figure correspond to the Earth-projected directions of azimuth angles ϕ = 0 and ϕ = 90 , respectively.
As shown, the three curves have different geometries. The OA configuration has the best scanning performance along the principal axes ϕ = 0 ° + k π 2 , k Z and the worst along the diagonal ϕ = 45 ° + k π 2 , k Z . Compared to NO, OA exhibits a lower scanning range along the diagonal directions. This behavior is attributed to the suppression of the odd-order subset of grating lobes. Along the principal axes, the first-order grating lobe is entirely eliminated, thereby reducing power leakage into undesired directions. Along the diagonal, however, the radiated power is redirected into the even first-order grating lobe. Due to power conservation, this lobe exhibits a higher directivity compared to the corresponding case in the NO configuration. This phenomenon is further examined through simulations and analytical modeling in the following subsection.
In the OS configuration, the scanning range is higher than NO along all azimuthal directions. As already detailed, the grating lobes are all reduced compared to a non-overlapped configuration, which implies less power leakage to interfering lobes.
Compared to the NO configuration, both overlapping techniques demonstrate a notable improvement in scanning surface coverage. Specifically, the OA architecture achieves a 31.4% increase, while the OS configuration yields a 38.0% enhancement. Consequently, OS emerges as the most effective strategy for improving scanning performance, offering a 6.6% gain area over OA. When considering the primary objective—maintaining scan loss within acceptable limits across the regional coverage area—the OS configuration delivers the best performance, while maintaining a comparable level of digital complexity.
Note that the scanning range exhibits similar behaviors when steering the regional beam at broadside, except for a slight distortion of the scanning range shape along the scanning direction. Nevertheless, the areas remain equal to the ones observed at nadir.
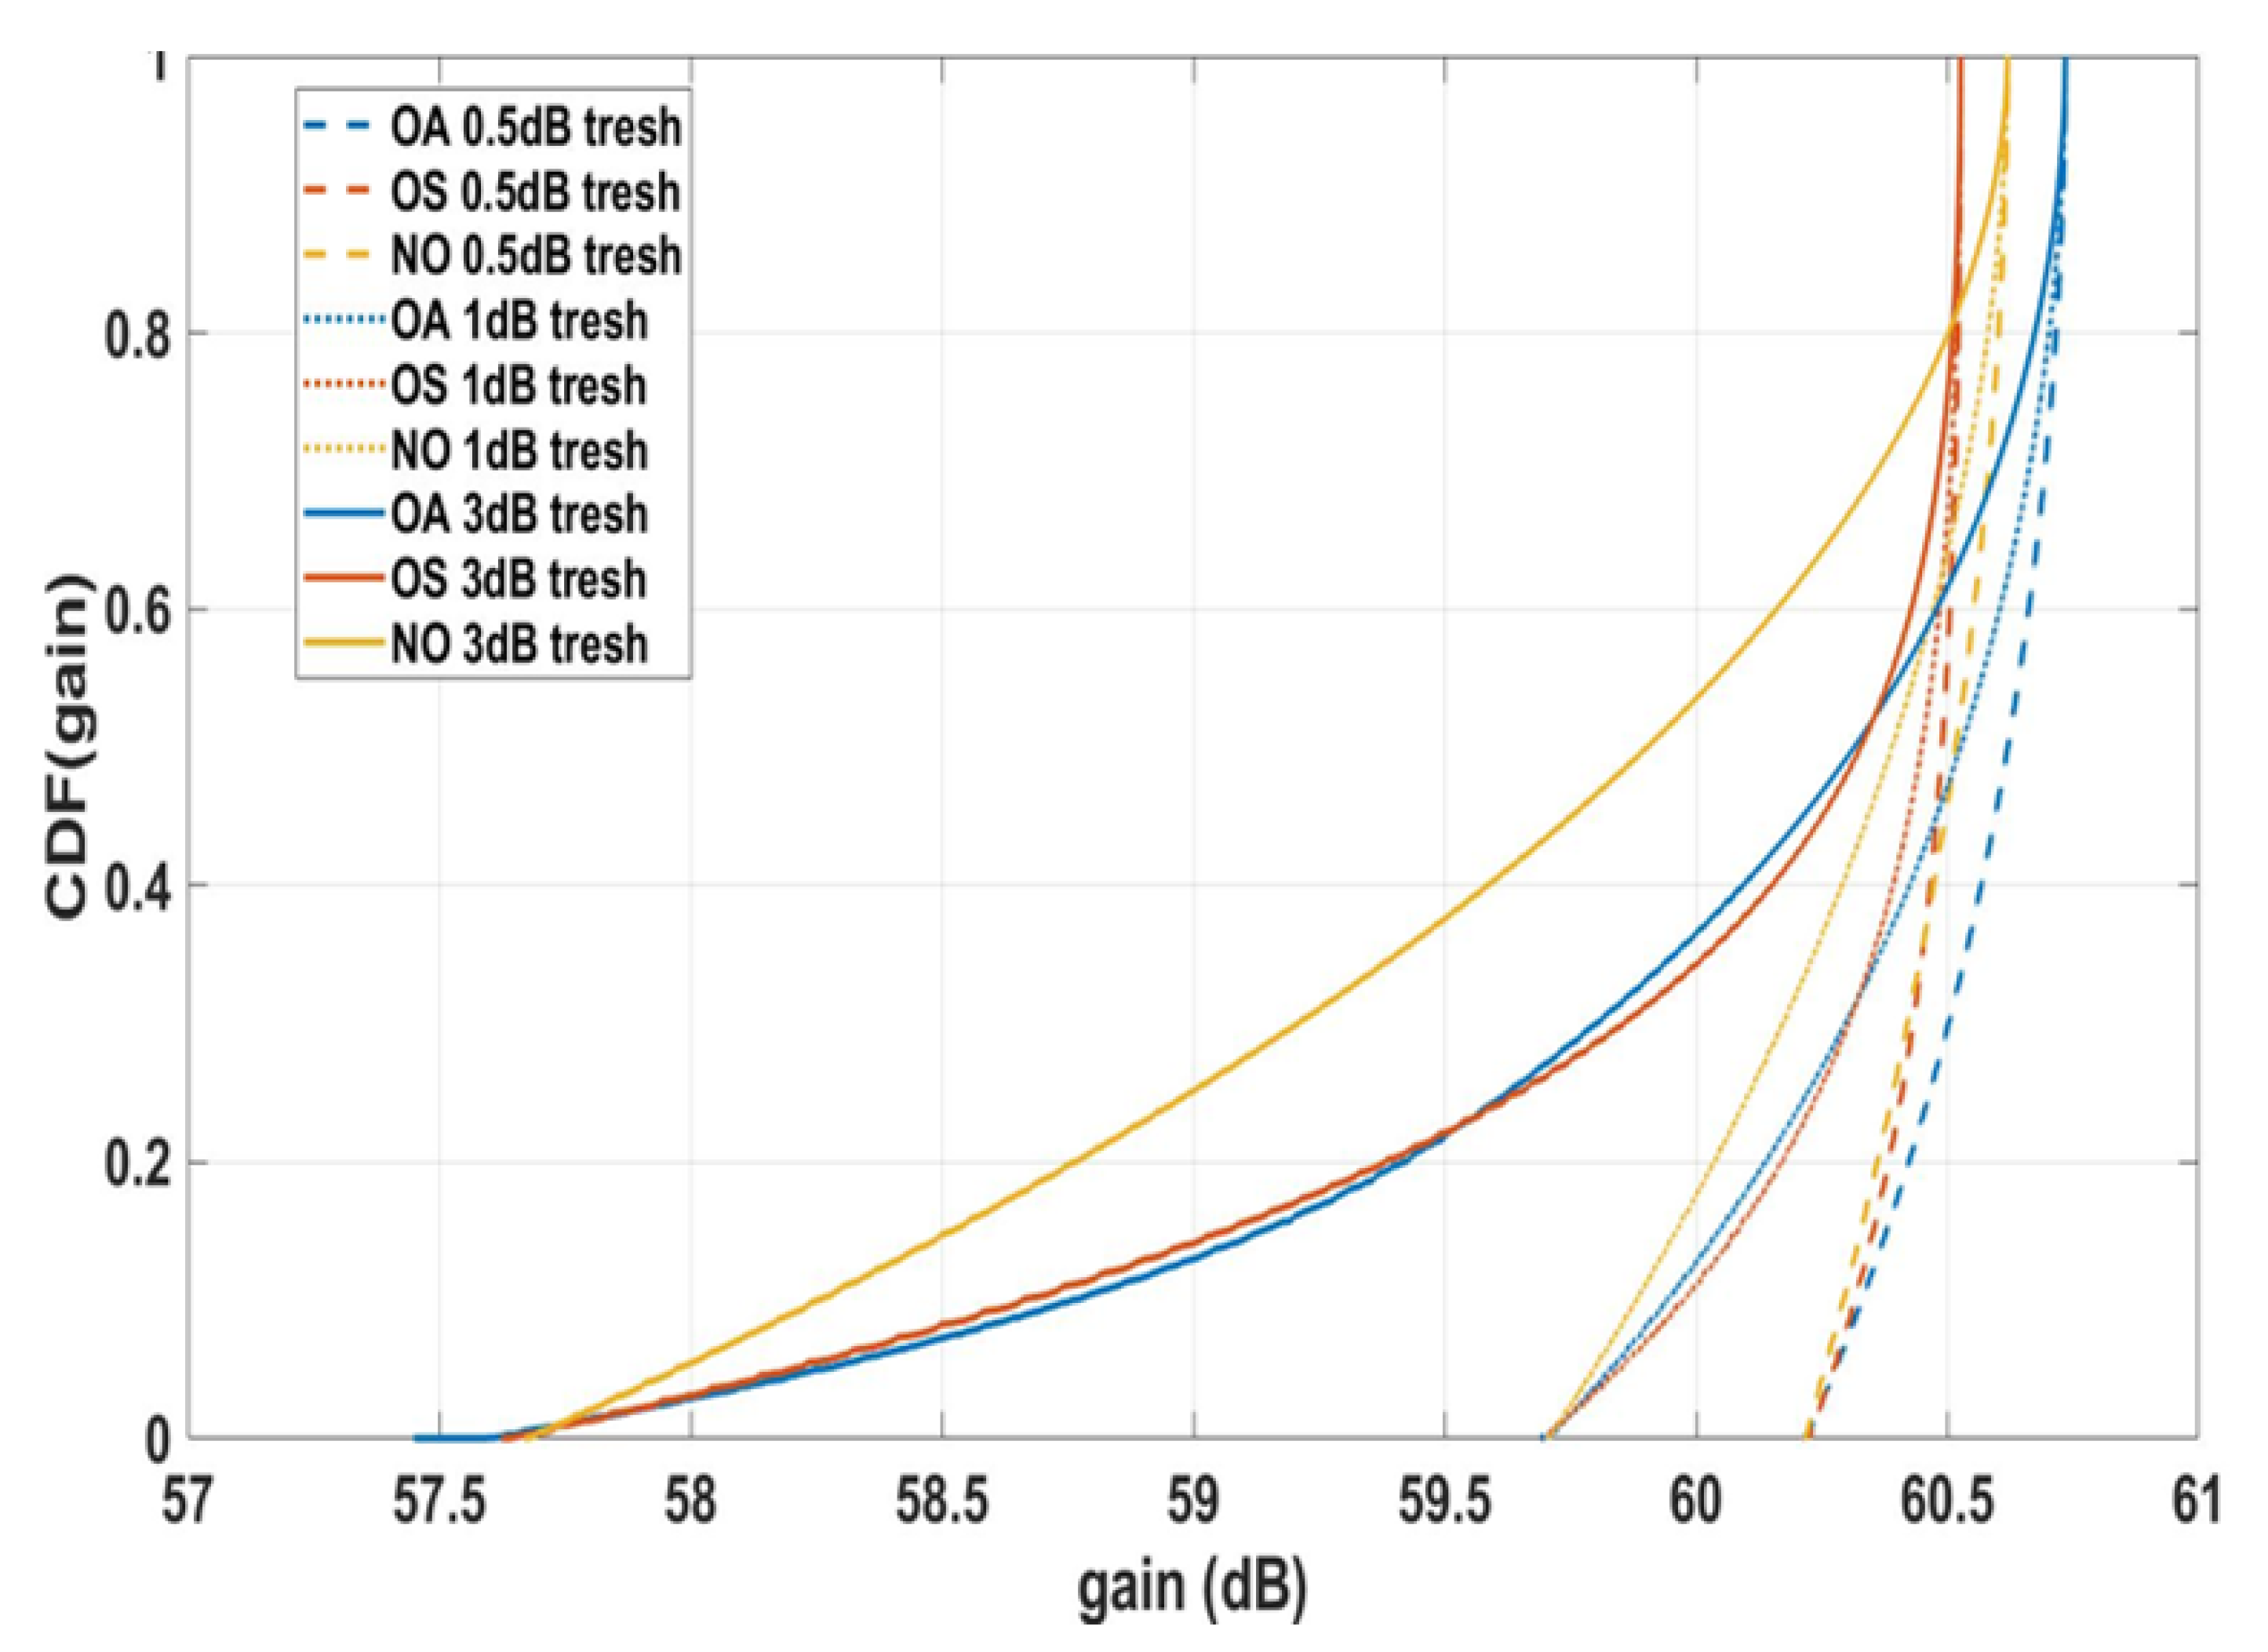
Next, the gain characteristics within each coverage region are investigated. The cumulative distribution function of the gain within the respective scanning range areas is given in Figure 9. Different thresholds, G ref 0.5 dB, G ref 1 dB, and G ref 3 dB, are considered to have an impact on the gain decrease behavior. The function is a collection of all the main beam gain values sorted inside the main regional area previously defined. This issues the achievable radiating aperture for every architecture inside a given coverage with the same constraints.
The gain at nadir is the best for OA, which is higher than NO by 0.11 dB, passing from 60.62 to 60.73 dB. For the 0.5 dB threshold, the gain is always better than the two other cases. When increasing the threshold to G r e f 3 dB, 30.0% of the gain values for OS are higher than OA. On the other hand, the worst gain at nadir is shown for OS with 60.52 dB. Compared to NO with a 6 dB taper, a 0.10 dB drop is observed. Despite this observation, the gain decrease is slow, until significantly dropping. An enhancement of 0.30 dB compared to NO for the 3 dB threshold is observed as an average improvement for OS. For OA, this improvement is 0.36 dB, and thus it brings the best gain performance within the coverage. If compared to a non-overlapped architecture comprising an isosceles lattice of subarrays twice smaller, the added value of the OA configuration is related to the scan loss. Indeed, the gain is maintained thanks to the contribution of power coming from two layers of tiles. Because the two layers are not in phase coherence, the power switches from one layer to the other while scanning. This effect occurs only because of the contribution of two subarrays per RE. The improvement in the gain is a consequence of the overlapping technique and therefore brings an added value in terms of scanning performance.
This improvement is correlated with the phase quantization for OS. Indeed, as already discussed, the OS strategy improves the number of phase steps by a factor of 3. When moving closer to nadir, the improvement is proportional to the ratio between the number of phase steps for OS and that for NO. When scanning further, however, it has been shown that the grating lobes are no longer attenuated. This attenuation depends on the size of the inner subarray. Hence, the improvement brought by OS compared to NO as shown in the experiment is reliable.
For OA, contrary to OS, the grating lobe improvement is independent on the scanning direction. Therefore, the odd grating lobes remain fully removed and the even ones equally increased. As depicted in Figure 8, the improvement in terms of scanning surface is maintained when scanning further to nadir compared to OS where the improvement drastically decreases.
As a conclusion, in terms of scanning performance, OS enables scanning further, and OA has the best gain within the defined area. The overlapping strategies are all efficient by guaranteeing a broader regional beam and hence lowering the digital complexity of the hybrid beamforming scheme over a full Earth coverage. Furthermore, the gain is also improved inside the regional areas defined by the scan loss, therefore initiating a step further towards high-throughput requirements.

3.2.2. Grating Lobes

So far, the properties of both overlapped arrays have been studied in the context of the scanning performance they produce and the gain they can reach. It is necessary for a regional area to have a low scan loss within it. Nevertheless, the main consequence of hybrid beamforming is the introduction of grating lobes, initiating interference over the Earth field of view. The objective of the regional beam coverage definition is to avoid the presence of grating lobes inside each regional beam. The next objective is to define a coverage with a minimum interference ratio. To guarantee this, the coverage needs to avoid the presence of grating lobes within the area. In this configuration, grating lobes can be processed thanks to beam hopping between neighbour ABFN beams. The position of the grating lobes can be theoretically set for a non-overlapped array and then deduced for the overlapped cases. The array factor theory from [29] is adapted with the use of subarrays and states the position of interfering lobes at ( u 0 + p n x d x , p = 1 u p , v 0 + q ( n y d y ) , q = 1 v q ) in the ( u = cos ϕ sin θ , v = sin θ sin ϕ ) coordinate system. Such a formulation implies that the grating lobe position depends on the size of a subarray.
For OS, extending the subarray keeps the grating lobe lattice unchanged as the position of the subarray feeds remains the same. Knowing the size of the inner subarray in the OS case, it is possible to state that the distance between the main lobe and the interfering grating lobe is 2.24 ° along the azimuth direction ϕ = 0 ° and 3.17 ° along the diagonal ϕ = 45 °. For OA, the first-order grating lobes are mitigated along the axis and not along the diagonal. The first grating lobe along ϕ = 0 ° is therefore situated 2.98 ° away from the main lobe while the ϕ = 45 ° one is 2.11 ° away.
The lattice of grating lobes for the overlapped subarray architectures is investigated in Figure 10. Two directions are studied: ϕ = 0 °, where OS has proven to give the least scanning improvement and OA the best one, and the diagonal ϕ = 45 ° along which the contrary is observed. Both cases are studied while scanning at their respective 3 dB limit along the aforementioned directions. The frame plot is limited such that grating lobes close to or inside the regional beams are shown. A high-level one is identified as a grating lobe that is less than 20 dB lower than the main lobe. Note that the grating lobe lattice can also be observed along any azimuth directions. For brevity, the investigation is limited to the two critical directions observed in Figure 8.
In terms of grating lobe count, for the azimuth angle ϕ = 0 , the OS configuration exhibits a single grating lobe, whereas the OA configuration presents two. Although the grating lobes in the OA case are slightly closer to the main beam, their amplitude is lower. This behavior is a consequence of power conservation: when the scan loss reaches 3 dB, approximately half of the power is diverted from the main beam. In the OS configuration, this results in a single grating lobe with an amplitude nearly equal to that of the main lobe. In contrast, the OA configuration distributes this power between two grating lobes, each with a lower amplitude.
Moreover, the grating lobes generated in the OA configuration are located outside the main lobe of the area beam. As the beam approaches the edge of the coverage area during scanning, power is progressively transferred into these side lobes, rather than remaining concentrated within the main beam.
Along the diagonal direction ( ϕ = 45 ), the OA configuration exhibits a single grating lobe with significant gain. This is a direct consequence of the overlapping methodology, which enhances the levels of all even-order grating lobes. Combined with the suppression of odd-order grating lobes, this behavior also contributes to the characteristic shape of the scanning range.
Nevertheless, it is important to note that the resulting grating lobes remain outside the defined scanning coverage area. As a result, they do not introduce interference within the intended coverage region.
For the OS configuration, three grating lobes are observed along the diagonal direction ( ϕ = 45 ), each exhibiting a lower amplitude than those in the OA configuration. The reduction in diagonal grating lobe levels, enabled by the overlapping strategy, justifies the more square-shaped scanning range observed in this case. However, it is important to note that a portion of these grating lobes lie within the regional coverage area, introducing potential interference.
This limitation constrains the effective coverage of the OS configuration. Specifically, when the beam is steered toward the edge of the subarray pattern, the grating lobe and the main lobe are no longer separated by a null in the subarray response. As a result, complete grating lobe suppression becomes unachievable. Consequently, the maximum achievable coverage for the OS configuration is ultimately limited by the position of the grating lobes, rather than by the scan loss threshold.
The results in terms of scanning performance versus digital complexity are summed up in Table 3.
To define a regional coverage without interference for OS, the idea is to truncate the scan loss area such that the interfering lobes are situated outside the coverage. This implies withdrawing half of the beamwidth on each side of the defined area, hence preventing beams from being generated at grating lobe positions. Then, instead of scanning at θ = 1.12 ° along the axis, the maximum range is 0.95 °, considering a half beamwidth of 0.172 °. Along the diagonal, it is reduced to θ = 1.22 °. The shape is kept as it enables a larger area to be covered. Compared to NO, where the grating lobes are also outside the scanning range area, it still implies an improvement of 27.6%. However, a reduction of 3.8% occurs compared to OA.

4. Discussion

Ultimately, the optimal regional coverages in terms of scanning performances and interference mitigation have been defined for all architectures. For the OA strategy, the limitation is due to scan loss in order to define a regional coverage. For OS, the main issue is the partial mitigation of the grating lobes that prevents benefiting from a larger scanning area. As a result, even if both strategies guarantee a favorable improvement in the regional coverage as compared to non-overlapped strategies implying periodic HAD DRAs, OA has the largest range for defining beams with the highest gain. This architecture is therefore more practical for regional beam implementation.
Table 4 is given to sum up the hardware versus performance trade-off for the overlapping strategies compared to the non-overlapped technique. The advantages and drawbacks are also shown. As depicted, the number of connections required for OA makes the system more complicated to build than it seems. However, it is uniformly two connections per RE. For OS, building the panel is trickier, as elements in the corner are connected to four REs, while one and two connections appear at the centre and at the edges of the subarray, respectively. This requires not only different types of amplifiers but also power dividers. It also raises the uncertainty likelihood associated with the different devices. The thickness and hence the weight is increased, which can potentially cause troubles when deploying the antennas. Considering the improvement brought by overlapping, it is worth noting that there is a compromise between increasing the regional area and keeping a simple hardware scheme.
For OS, another drawback is the scanning dependence of the grating lobe mitigation. The grating lobes are not attenuated close to the edge of the subarray pattern. For OA, all odd grating lobes are fully suppressed independently of the scanning direction, which is more convenient for predicting interference areas for satellite communications. However, given that this mitigation is led by a phase-tapering effect, it is worth noting that overlapping is a questionable technique. If the cost of the antenna is raised, one should expect a proportional improvement in terms of performance. Hence, the choice of overlapping for periodic antenna architectures strongly depends on the cost and choice of the hardware devices. Note that new technological developments could also lead to lower device costs and make overlapping more beneficial.
This study has provided an overview of fully periodic HAD DRAs incorporating overlapping techniques. However, future investigations may need to consider non-periodic HAD DRA architectures. Introducing sparsity into an otherwise periodic HAD DRA is theoretically feasible, but it would significantly increase mechanical complexity. In particular, the mechanical deployment of large, sparse HAD DRAs presents substantial challenges, especially in achieving optimal partitioning.
One potential compromise could involve a semi-periodic architecture—for example, periodic clusters of overlapped subarrays arranged within a sparse configuration. While the implementation of such a system remains technically demanding, it opens the possibility of optimizing subarray partitioning based on contextual constraints specific to GEO broadband communication systems and multibeam generation requirements. To the best of the authors’ knowledge, this topic with so many constraints has not been addressed yet.
Up to this point, the analysis has focused on the generation of a single beam at a time. However, for multibeam applications, an additional challenge arises concerning the optimal layout that can be achieved with this class of antennas. A key advantage of periodic HAD DRAs is their ability to produce a periodic null lattice in the radiation pattern associated with narrow beams. This property was previously investigated by the authors in [30].
One of the main conclusions from that study is that the maximum number of simultaneously generated beams is fundamentally limited by the angular distance between the main beam and its first null. In the case of periodic HAD DRAs, this relationship is straightforward, as the nulls are well-defined and regularly spaced. This predictable structure allows for beam placement strategies that inherently minimize inter-beam interference, thereby reducing or even eliminating the need for digital precoding.
This observation is particularly significant, as it enables a reduction in onboard digital complexity, easing the computational burden on signal processing units and making the architecture more scalable for multibeam satellite communication systems.
If future studies consider semi-periodic HAD DRA architectures with alternative partitioning strategies, the resulting beam layouts may exhibit nulls that are less well-defined compared to the fully periodic case. This lack of regularity implies that inter-beam interference is no longer inherently suppressed and would require digital precoding to be effectively mitigated.
In scenarios where no precoding is applied, a degradation in system throughput is expected relative to periodic HAD DRAs due to increased interference between beams. However, if precoding is employed, spatial sparsity techniques could be leveraged to optimize performance. However, note that the digital complexity associated with processing units on-board the satellite could bring potential limitations to such use (especially for thousands of beams generated simultaneously).

5. Conclusions

A comparative benchmark has been conducted between two regular hybrid beamformed direct radiating array architectures employing overlapping techniques. These two approaches offer distinct mechanisms for mitigating interfering grating lobes. The first technique involves extending subarrays along all four Cartesian directions, which enables partial isolation of the main beam from adjacent grating lobes. The second technique introduces an additional layer of tiles, offset by half the subarray size along the principal Cartesian axes. This shift transforms the grating lobe lattice into a triangular configuration due to the relative displacement between the inner array and the overlapping layer.
The extended subarray architecture entails increased hardware complexity, as it requires additional interconnections, resulting in significant power variation across the radiating elements. In contrast, the shifted-layer approach introduces greater digital control complexity, as more tiles must be managed by the on-board processor. Despite these differences, both architectures demonstrate strong scanning performance. For telecommunication applications, they maintain high gain across an extended regional beam coverage.
It has been shown that the performance of the extended subarray technique is ultimately constrained by the partial mitigation of grating lobes at the boresight. Conversely, in the shifted-layer configuration, scan loss becomes the primary limiting factor. Therefore, the latter approach is more suitable for broadening regional beam coverage while minimizing digital complexity at the processor level, particularly in scenarios requiring full Earth coverage.
For future work, a comprehensive benchmark should be conducted under varying traffic demand conditions to identify the optimal architecture for interference mitigation—not only at the level of a single regional beam but across the entire lattice of regional beams. In such cases, the extended subarray technique may offer superior performance when regional beams are closely spaced.

6. Patents

The OA architecture in this paper is included in a patent from Thales Alenia Space, France, in October 2021.

Author Contributions

Conceptualization, H.L. and G.G.; methodology, M.P., H.L., G.G. and G.T.; software, M.P.; validation, H.L., G.G., G.T., J.M. and P.A.; formal analysis, M.P.; investigation, M.P.; resources, H.L., G.G. and M.P.; data curation, M.P.; writing—original draft preparation, M.P.; writing—review and editing, H.L., G.G., J.M., G.T. and P.A.; visualization, M.P. and J.M.; supervision, H.L., G.G., J.M., G.T. and P.A.; project administration, H.L. and G.T.; funding acquisition, H.L., G.G. and J.M. All authors have read and agreed to the published version of the manuscript.

Funding

This work is supported in part by the European Space Agency under Grant 4000135641/21/ NL/GLC.

Institutional Review Board Statement

Not applicable.

Informed Consent Statement

Not applicable.

Acknowledgments

The authors have reviewed and edited the output and take full responsibility for the content of this publication.

Conflicts of Interest

Author Dr. Margaux Pellet and Mr. Hervé Legay were employed by Thales Alenia Space, the remaining authors declare that the research was conducted in the absence of any commercial or financial relationships that could be construed as a potential conflict of interest.

Abbreviations

The following abbreviations are used in this manuscript:
RFRadio Frequency
LEOLow Earth Orbit
MEOMedium Earth Orbit
GEOGeostationary Orbit
DRAsDirect Radiating Arrays
DBFNDigital Beamforming Network
ABFNAnalogue Beamforming Network
HBFNHybrid Beamforming Network
HADHybrid Analog–Digital
AFRArray-Fed Reflector
SSPASolid-State Power Amplifier
DTPDigital Transparent Processor
FFTFast Fourier Transform
FOVField Of View
RERadiating Element
OSOversized Subarrays
OAOverlapped Arrays
NONon-Overlapped Arrays
SL(L)Side Lobe (Levels)
GLGrating Lobe

Appendix A. Measurement Set-Up

Figure A1. Measurement set-up for the OA strategy, courtesy of Thales Alenia Space, France.
Applsci 15 10216 g0a1

References

  1. Maral, G.; Bousquet, M.; Zhili, S. Satellite Communications Systems: Systems, Techniques and Technology; John Wiley & Sons: Hoboken, NJ, USA, 2020. [Google Scholar]
  2. Schuss, J.J.; Upton, J.; Myers, B.; Sikina, T.; Rohwer, A.; Makridakas, P.; Francois, R.; Wardle, L.; Smith, R. The IRIDIUM main mission antenna concept. IEEE Trans. Antennas Propag. 1999, 47, 416–424. [Google Scholar] [CrossRef]
  3. Metzen, P.L. Globalstar satellite phased array antennas. In Proceedings of the 2000 IEEE International Conference on Phased Array Systems and Technology, Dana Point, CA, USA, 21–25 May 2000. [Google Scholar]
  4. Cailloce, Y.; Caille, G.; Albert, I.; Lopez, J.M. A Ka-band direct radiating array providing multiple beams for a satellite multimedia mission. In Proceedings of the 2000 IEEE International Conference on Phased Array Systems and Technology, Dana Point, CA, USA, 21–25 May 2000. [Google Scholar]
  5. Dawkins, A.W.J.; Gulloch, W.J.; Morris, D.J.; Patel, H.K.; Thaker, R.C.; Stirland, S.S. Development of a Direct Radiating Arrays for Future Ku Band TELECOM Applications. In Proceedings of the Second European Conference on Antennas and Propagation, EuCAP 2007, Edinburgh, UK, 11–16 November 2007. [Google Scholar]
  6. Baldominos, A.; Mengali, A.; Fonseca, N.J.; Goussetis, G. Evaluation of array fed reflector architectures for broadband satellite missions. In Proceedings of the 2021 International Symposium on Antennas and Propagation, ISAP 2021, Taipei, Taiwan, 19–22 October 2021. [Google Scholar]
  7. Imaz-Lueje, B.; Prado, D.R.; Arrebola, M.; Pino, M.R. Reflectarray antennas: A smart solution for new generation satellite mega-constellations in space communications. Sci. Rep. 2020, 10, 2155. [Google Scholar] [CrossRef] [PubMed]
  8. Martinez-de-Rioja, D.; Martinez-de-Rioja, E.; Rodriguez-Vaqueiro, Y.; Encinar, J.A.; Pino, A. Multibeam reflectarrays in Ka-band for efficient antenna farms onboard broadband communication satellites. Sensors 2020, 21, 207. [Google Scholar] [CrossRef] [PubMed]
  9. Kaifas, T.N. State of the Art and Innovations needed for Direct Radiating Arrays to place Very High Throughput Satellite Communications into Technology Reach. In Proceedings of the IEEE 5th International Conference on Communications, Information, Electronic and Energy Systems (CIEES), Veliko Tarnovo, Bulgaria, 20–22 November 2024; pp. 1–6. [Google Scholar]
  10. Angeletti, P.; Toso, G.; Petrolati, D. A Reconfigurable Multibeam Antenna System. European Patent EP 3 654 544 A1, 13 November 2018. [Google Scholar]
  11. Stirland, S.J.; Craig, A.D. Phased arrays for satellite communications: Recent developments at Astrium LTD. In Proceedings of the IET Second European Conference on Antennas and Propagation (EuCAP), Edinburgh, UK, 11–16 November 2007; pp. 1–5. [Google Scholar]
  12. Palacios, J.; González-Prelcic, N.; Mosquera, C.; Shimizu, T.; Wang, C.H. A hybrid beamforming design for massive MIMO LEO satellite communications. Front. Space Technol. 2021, 2, 696464. [Google Scholar] [CrossRef]
  13. De Gaudenzi, R.; Angeletti, P.; Petrolati, D.; Re, E. Future technologies for very high throughput satellite systems. Wiley Int. J. Satell. Commun. Netw. 2020, 38, 141–161. [Google Scholar] [CrossRef]
  14. Alhaj, N.A.; Jamlos, M.F.; Manap, S.A.; Abdelsalam, S.; Bakhit, A.A.; Mamat, R.; Gismalla, M.S.M.; Hamdan, M. Integration of hybrid networks, AI, ultra massive-MIMO, THz frequency, and FBMC modulation toward 6G requirements: A review. IEEE Access 2023, 12, 483–513. [Google Scholar] [CrossRef]
  15. Toso, G.; Mangenot, C.; Roederer, A.G. Sparse and thinned arrays for multiple beam satellite applications. In Proceedings of the IET Second European Conference on Antennas and Propagation (EuCAP), Edinburgh, UK, 11–16 November 2007; pp. 1–4. [Google Scholar]
  16. Mailloux, R.J.; Santarelli, S.G.; Roberts, T.M.; Luu, D. Irregular Polyomino-Shaped Subarrays for Space-Based Active Arrays. Int. J. Antennas Propag. 2009, 2009, 956524. [Google Scholar] [CrossRef]
  17. Angeletti, P.; Toso, G.; Petrolati, D. Beam-Forming Network for an Array Antenna and Array Antenna Comprising the Same. U.S. Patent 9,374,145, 26 November 2012. [Google Scholar]
  18. Pellet, M.; Goussetis, G.; Legay, H.; Mota, J.; Cortazar, B.; Toso, G. A new antenna array architecture with hybrid beamforming for broadband satellite communications. In Proceedings of the IEEE 17th European Conference on Antennas and Propagation (EuCAP), Florence, Italy, 26–31 March 2023. [Google Scholar]
  19. Tugend, V.; Thain, A. Hybrid beamforming with reduced grating lobes for satellite applications. In Proceedings of the IEEE 12th European Conference on Antennas and Propagation (EuCAP), London, UK, 9–13 April 2018; pp. 1–5. [Google Scholar]
  20. Li, X.; Wang, B. Coherence optimised subarray partition for hybrid MIMO phased array radar. IET Microwaves Antennas Propag. 2021, 15, 1441–1457. [Google Scholar] [CrossRef]
  21. Alieldin, A.; Huang, Y.; Saad, W.M. Optimum partitioning of a phased-MIMO radar array antenna. IEEE Antennas Wirel. Propag. Lett. 2017, 16, 2287–2290. [Google Scholar] [CrossRef]
  22. Herd, J.S.; Duffy, S.M.; Steyskal, H. Design considerations and results for an overlapped subarray radar antenna. In Proceedings of the IEEE Aerospace Conference, Big Sky, MT, USA, 5–12 March 2005; pp. 1087–1092. [Google Scholar]
  23. Wang, H.; Fang, D.; Chow, Y.L. Grating lobe reduction in a phased array of limited scanning. IEEE Trans. Antennas Propag. 2008, 56, 1581–1586. [Google Scholar] [CrossRef]
  24. Lopez, P.; Rodriguez, J.A.; Ares, F.; Moreno, E. Subarray weighting for the difference patterns of monopulse antennas: Joint optimization of subarray configurations and weights. IEEE Trans. Antennas Propag. 2001, 49, 1606–1608. [Google Scholar] [CrossRef]
  25. Haupt, R. Reducing grating lobes due to subarray amplitude tapering. IEEE Trans. Antennas Propag. 2003, 33, 846–850. [Google Scholar]
  26. Ye, X.; Yu, Z.; Xiao, D. Grating lobe suppression for wideband large-spacing beam scanning array using subarray null adjustable method. IEEE Antennas Wirel. Propag. Lett. 2022, 22, 347–351. [Google Scholar] [CrossRef]
  27. Coleman, J.O. Nonseparable Nth-band filters as overlapping-subarray tapers. In Proceedings of the IEEE RadarCon (RADAR), Kansas City, MO, USA, 23–27 May 2011; pp. 141–146. [Google Scholar]
  28. Griesbach, J.D. Optimal taper design for overlapped subarray formation. In Proceedings of the IEEE Fortieth Asilomar Conference on Signals, Systems and Computers, Pacific Grove, CA, USA, 29 October–1 November 2006; pp. 2247–2251. [Google Scholar]
  29. Mailloux, R.J. Phased Array Antenna Handbook; Artech House: New York, NY, USA, 2017. [Google Scholar]
  30. Pellet, M.; Goussetis, G.; Mota, J.; Legay, H.; Vidal, F. Multibeam coverage optimization for broadband satellites with hybrid beamforming direct radiating arrays. In Proceedings of the IEEE International Symposium on Antennas and Propagation and USNC-URSI Radio Science Meeting, Portland, OR, USA, 23–28 July 2023; pp. 1541–1542. [Google Scholar]
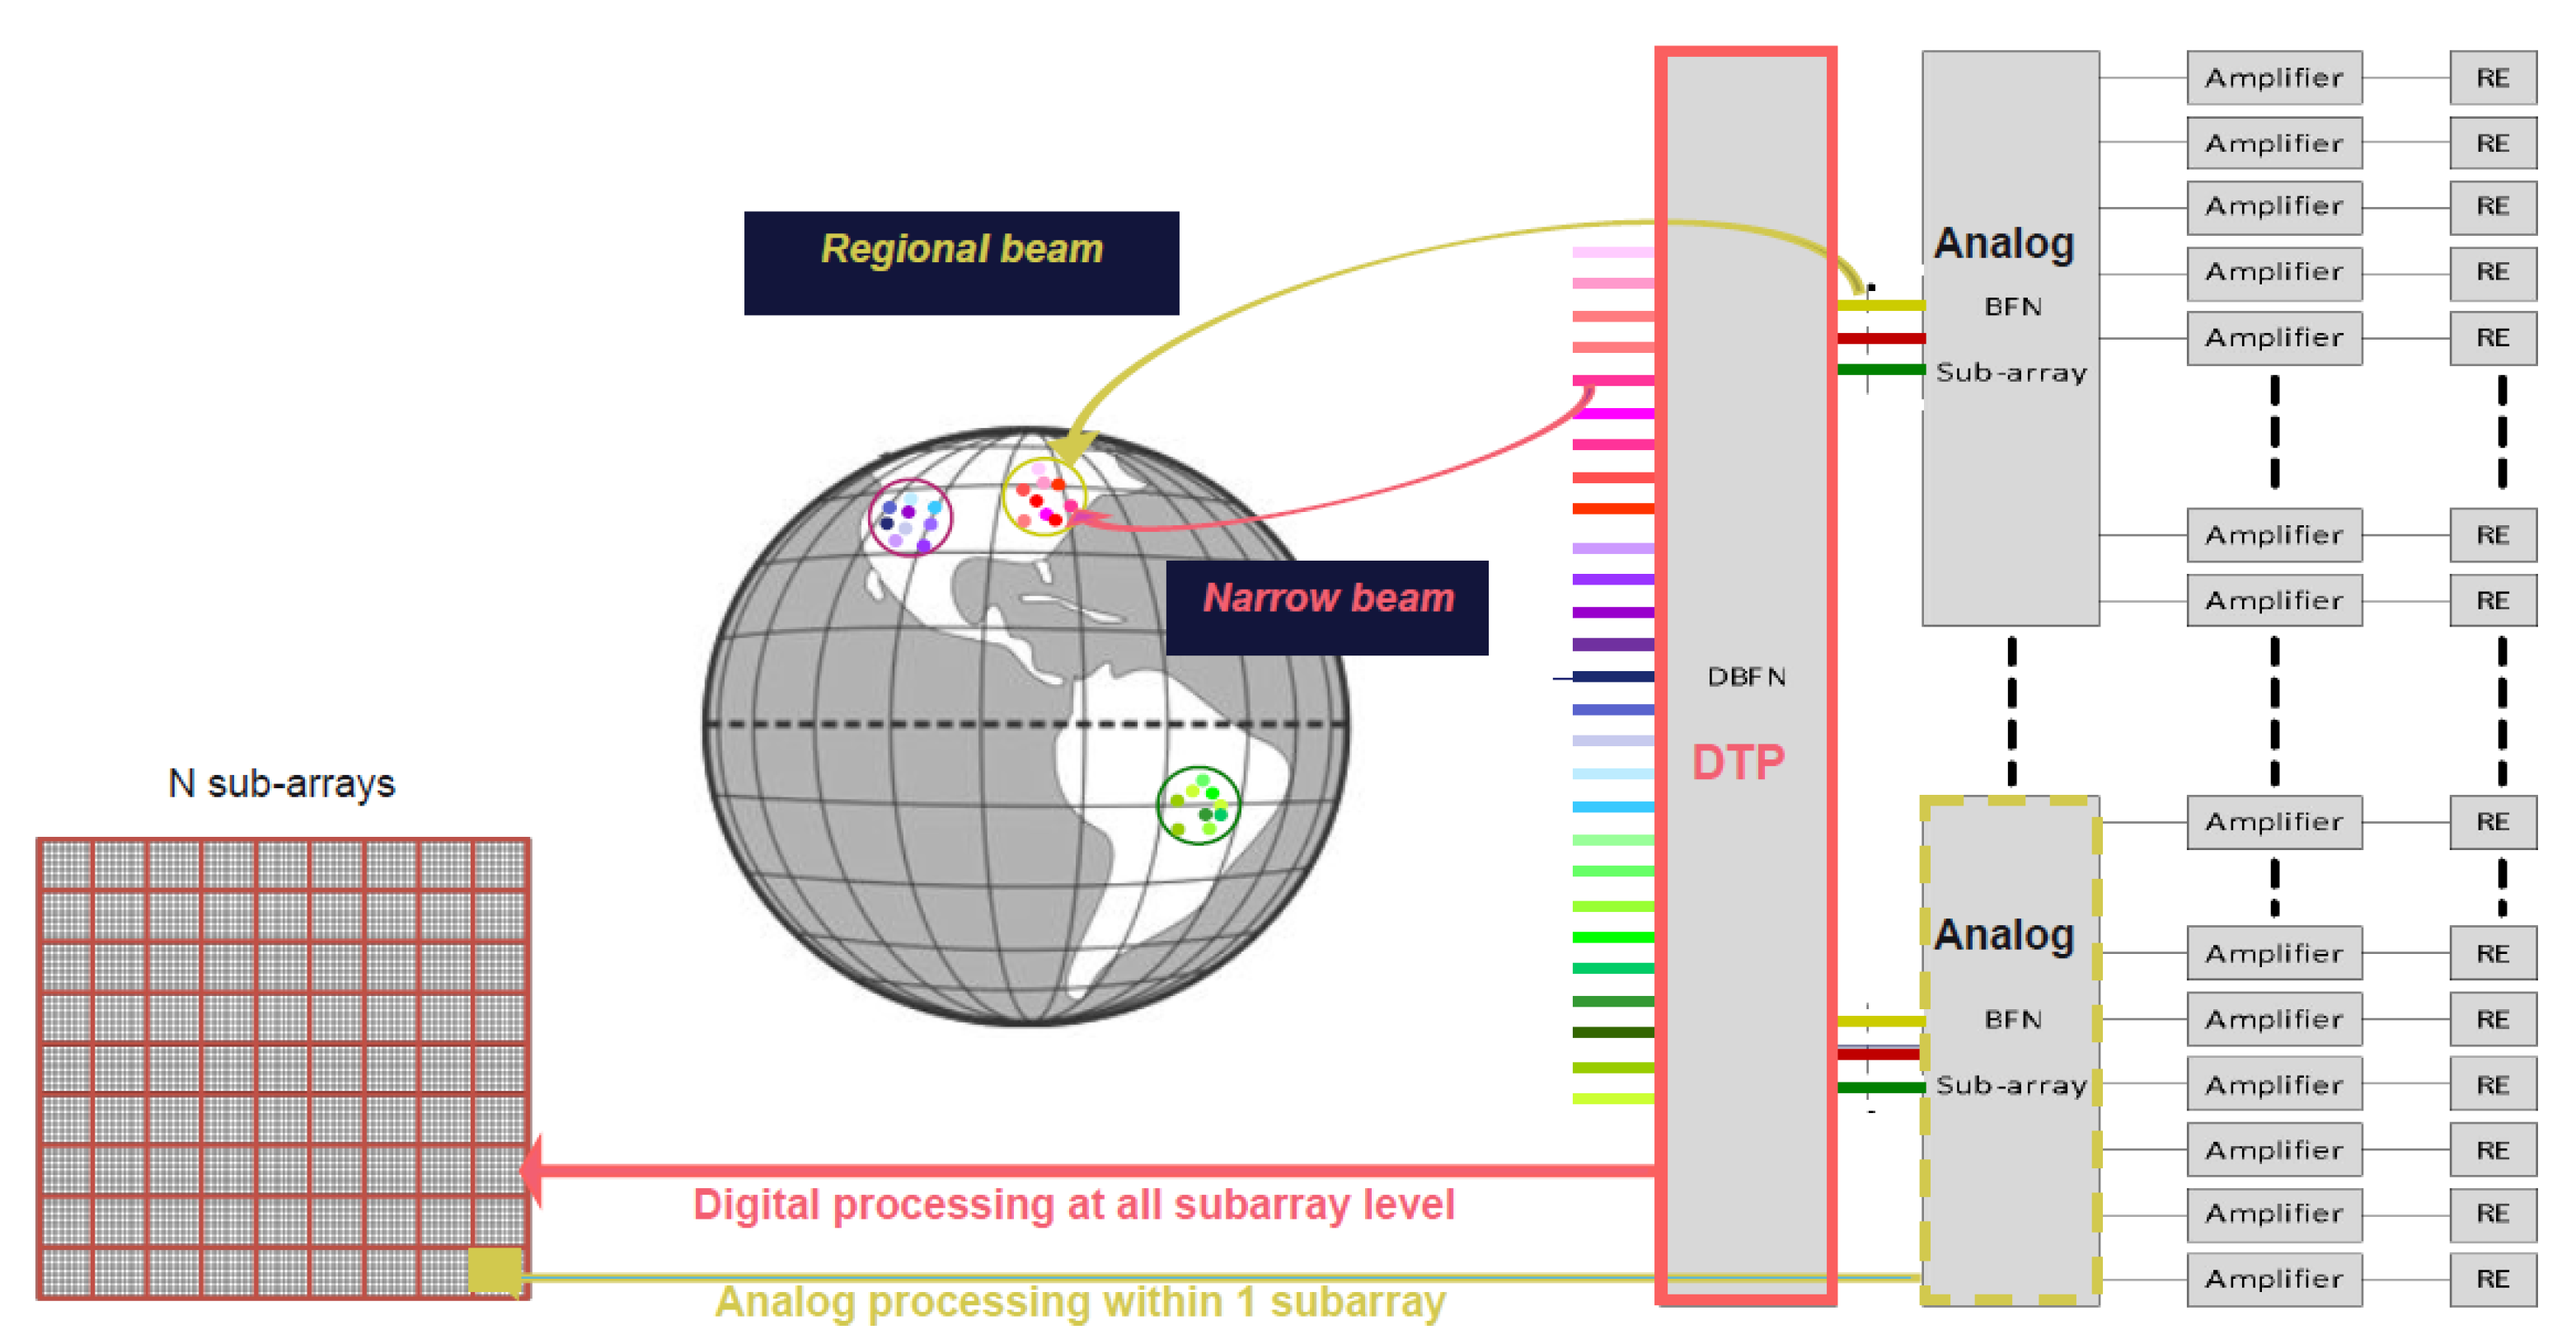
Figure 1. Classical hybrid analog–digital beamforming scheme. DBFN/ABFN stands for Digital/Analog Beamforming Network and associated beam generation.
Applsci 15 10216 g001
Figure 2. Earth field-of-view definition.
Applsci 15 10216 g002
Figure 3. Overlapped subarray hybrid analog–digital beamforming scheme with a shift of half the size of a subarray along 2-D (OA).
Applsci 15 10216 g003
Figure 4. Overlapped subarray hybrid analog–digital beamforming scheme with an extension of the subarrays over the adjacent subarrays along 2-D (OS).
Applsci 15 10216 g004
Figure 6. Phase distribution across the radiating elements for a scan at θ = 0.5° along ϕ = 45° for all overlapping methodologies. (a) Corresponds to the fully digital architecture, (b) is the hybrid beamformed DRA (NO), (c) is OA, and (d) is OS.
Applsci 15 10216 g006
Figure 7. Amplitude distribution across the radiating elements at nadir for all overlapping methodologies. (a) Is the NO configuration with a 6 dB taper at the ABFN, (b) is a 6 dB taper for OA at the ABFN, and (c) is a −32 SLL Taylor taper for OS at the ABFN.
Applsci 15 10216 g007
Figure 8. Scanning range for which the gain loss is less than 3 dB, applied to OS, NO, and OA.
Applsci 15 10216 g008
Figure 9. Cumulative distribution function of the gain within the scanning range area for all architectures. Scanning range area defined for G ref 0.5 dB, G ref 1 dB, and G ref 3 dB.
Applsci 15 10216 g009
Figure 10. Two-directional radiation patterns of OA and OS for scans along ϕ = 0 ° and ϕ = 45 ° at the values θ l i m imposed by the respective 3 dB scan losses.
Applsci 15 10216 g010
Table 1. Number of phase steps at radiating element level for NO, OS, and OA.
ArchitectureNumber of SubarraysPhase Steps
NO144144
OA313576
OS1441156
Table 2. Compared architectures and associated digital controls (DCs).
ArchitectureTotal Radiating ApertureNumber of SubarraysNumber of REs per SubarrayDigital Controls
NO9216 12 × 12 = 144 8 × 8 144
OS9216 12 × 12 = 144 ( 2 + 8 + 2 ) × ( 2 + 8 + 2 ) 144
OA9216 8 × 8 + 9 × 9 = 145 12 × 12 145
Table 3. Performance benchmark of the architectures.
ArchitectureNumber of REDigital ControlsGL LevelGain ImprovementScanning Improvement
NO9216144ref+0ref
OS9216144−inf to 0+0.35 dB28%
OA9216145−inf for odd GL, +0.5 dB for even GL+0.5 dB31%
Table 4. Compared architectures and associated trade-offs.
ArchitectureScanning ImprovementHardware Cost and Manufacturing Trade-Offs
NOrefref
OS28%3 types of power dividers, connecting each element carefully depending on its position
OA31%thicker array, more connections across the overlapped and non-overlapped devices
Disclaimer/Publisher’s Note: The statements, opinions and data contained in all publications are solely those of the individual author(s) and contributor(s) and not of MDPI and/or the editor(s). MDPI and/or the editor(s) disclaim responsibility for any injury to people or property resulting from any ideas, methods, instructions or products referred to in the content.