Article

Analysis of Failure States of Transportation Vehicles Using the Ishikawa Diagram: A Case Study

Department of Environmental and Forestry Machinery, Faculty of Technology, Technical University in Zvolen, Študentská 26, 960 01 Zvolen, Slovakia
*
Author to whom correspondence should be addressed.
Appl. Sci. 2025, 15(18), 10221; https://doi.org/10.3390/app151810221
Submission received: 21 August 2025 / Revised: 17 September 2025 / Accepted: 18 September 2025 / Published: 19 September 2025

Abstract

Featured Application

It is appropriate to use the Ishikawa diagram to analyze the failure states of vehicles. The Ishikawa diagram is designed to assess the failure states of operators. It is important for equipment operators to be able to focus on individual elements of the work process and positively influence the operating time of vehicles.

Abstract

This study focuses on analyzing transportation vehicles using Ishikawa diagrams to understand random events (fault conditions) in the operation of monitored transportation vehicles. Creation of a universal system for monitoring and evaluating the operating parameters of trucks used for wood transportation and wood material with self-service maintenance. Currently, the priority of all companies is to minimize costs and maximize profits, which can be achieved through a properly set maintenance system and proper care for transportation vehicles. The article presents only partial results of the entire research. Data for the study of the operational reliability of IVECO, SCANIA, and TATRA vehicles were obtained from real operating conditions of two companies engaged in the timber cutting and transportation process. The mentioned vehicle brands were chosen due to their use in the Slovak forest economy and management. Using Ishikawa diagrams for individual design groups of monitored transportation vehicles, operators were provided with a proposal on how to influence operational reliability. The study’s results, based on the real needs of the companies mentioned, can serve as a valuable analysis for the operation of the transport vehicles in use.

1. Introduction

Nowadays, machines and equipment are mainly used to facilitate human work in almost all sectors of the industry [1,2]. The company called The Forests of the Slovak Republic is one of the leading European companies with a long-standing tradition. The task of Slovak forestry and forest management is to ensure the development of our forests so that they fulfill ecological, social, and economic functions. There are many companies in Slovakia whose primary activity is the processing and transport of wood. They are subcontractors of the company The Forests of the Slovak Republic, the main managing company in the field of forest management in the Slovak Republic. Regarding the optimization of economic results, it is important to focus on the transport of wood and wood materials, both for export and transportation by motor vehicles [3]. Machines began to be more productive, but on the other hand, they also began to break down. Human work began to be increasingly shifted from manual production to maintenance [4]. The most cost-effective maintenance policy for this example is predictive maintenance. It is up to maintenance professionals to adopt and apply these models and methods to improve the maintenance efficiency of industrial production equipment [5,6,7,8]. The science of reliability has numerous potential applications in communication and medicine, particularly in the context of global development, especially in science and technology [9,10,11].
Reliability is the probability of a system performing a particular job for a specific period under the working conditions for which it is designed. It can be evaluated to determine the type and size of production and improve it through engineering designs based on design for maintainability [12,13,14,15]. The regular analysis of machining equipment reliability also reduces production maintenance costs. Traditional reliability analysis methods use many similar device failure time information to determine their overall characteristics, which are based on experimental data from a lot of samples, and the result is only an average value under the current conditions. Various techniques are employed for failure analysis, which aim to reveal the causes of failures, reduce their occurrences, or ultimately prevent them [16]. Test results are often needed for decision-making (in terms of quality), by providing a means of assessing reliability (e.g., maintenance) as well as the planning and selection process. Adequate testing leads to reliable results and very good quality [17,18].
By critically evaluating current theories and studies to identify specific research gaps, advocating for the methodologies used, adding more references and specific statements to the literature review, clearly articulating the research objectives and hypotheses, and conducting more thorough productivity analysis, implementing these approaches would improve research. Implementing these approaches can ensure that research contributes more meaningfully and in a way that is both scientifically and practically useful to the field of operations management. When operational failures happen, the root cause of the failure must be found to ensure the failure cannot happen again by implementing actions that prevent its reoccurrence [19]. Most organizations use different tools for various purposes related to controlling and ensuring the longest possible operation to minimize costs and maximize profit. One of such tools is the Ishikawa diagram.

Ishikawa Diagram

Cause and effect analysis represented by a diagram has many names, such as Ishikawa diagram, 4-M diagram, “fishbone”, etc. The consequence of the failure or production problem is plotted on the main horizontal axis. The primary causes of the failure are plotted on the diagonal lines [20]. These arrows point directly to the horizontal arrow.
The Ishikawa diagram is defined as a graphic representation that schematically illustrates the relations between a specific result and its causes [21,22].
The studied effect or negative problem is “the fish head”, and the potential causes and sub-causes define the “fish bone structure”. Therefore, the diagram clearly reveals the relations between a problem identified in a product or equipment and its potential causes.
The Ishikawa diagram is a simple graphical instrument to understand the causes that produce operational defects and is used to analyze the relation between a problem and all possible causes. The application areas of Ishikawa diagrams are continuously expanding. Many specialized activities define different patterns of Ishikawa diagrams [23].

2. Materials and Methods

The most commonly used types of vehicle brands in the operating conditions of Slovak, which were manufactured in the countries of the European Union, forestry were used for the research. The mentioned types of vehicles were used for the same tasks, i.e., handling and transporting wood.

2.1. Researched Subject Material and Case Study Methods

The researched material (the subject of the case study) can be defined as follows:
  • Subject of investigation: IVECO, SCANIA, and TATRA road transportation vehicles in real operating conditions.
  • Characteristics of the subject of investigation (observed equipment) are in accordance with STN 01 0606 [24]—Reliability in technology. Procedure for selecting the nomenclature of standardized reliability indicators (Table 1).
Data for the study of the operational reliability of IVECO, SCANIA, and TATRA transport vehicles were obtained from real operating conditions of two companies engaged in logging and transport in the monitored period of three years. Three types of vehicles with approximately the same mileage and number of operating hours were selected from each type. Operational repairs and maintenance of towing vehicles of both companies were carried out in authorized service centers by specialists. A device passport was drawn up for each examined vehicle. The operation of the vehicles took place at the same place and at the same time.

2.2. Design Groups of Monitored Transport Vehicles

The examined transportation vehicles of the monitored towing vehicle manufacturers IVECO, SCANIA, and TATRA were divided into the following design groups for the purposes of collecting data from operations and for the purposes of subsequent analysis and evaluation:
  • Cabin, controls, instrumentation (on-board computer/control unit, tachograph, outside thermometer);
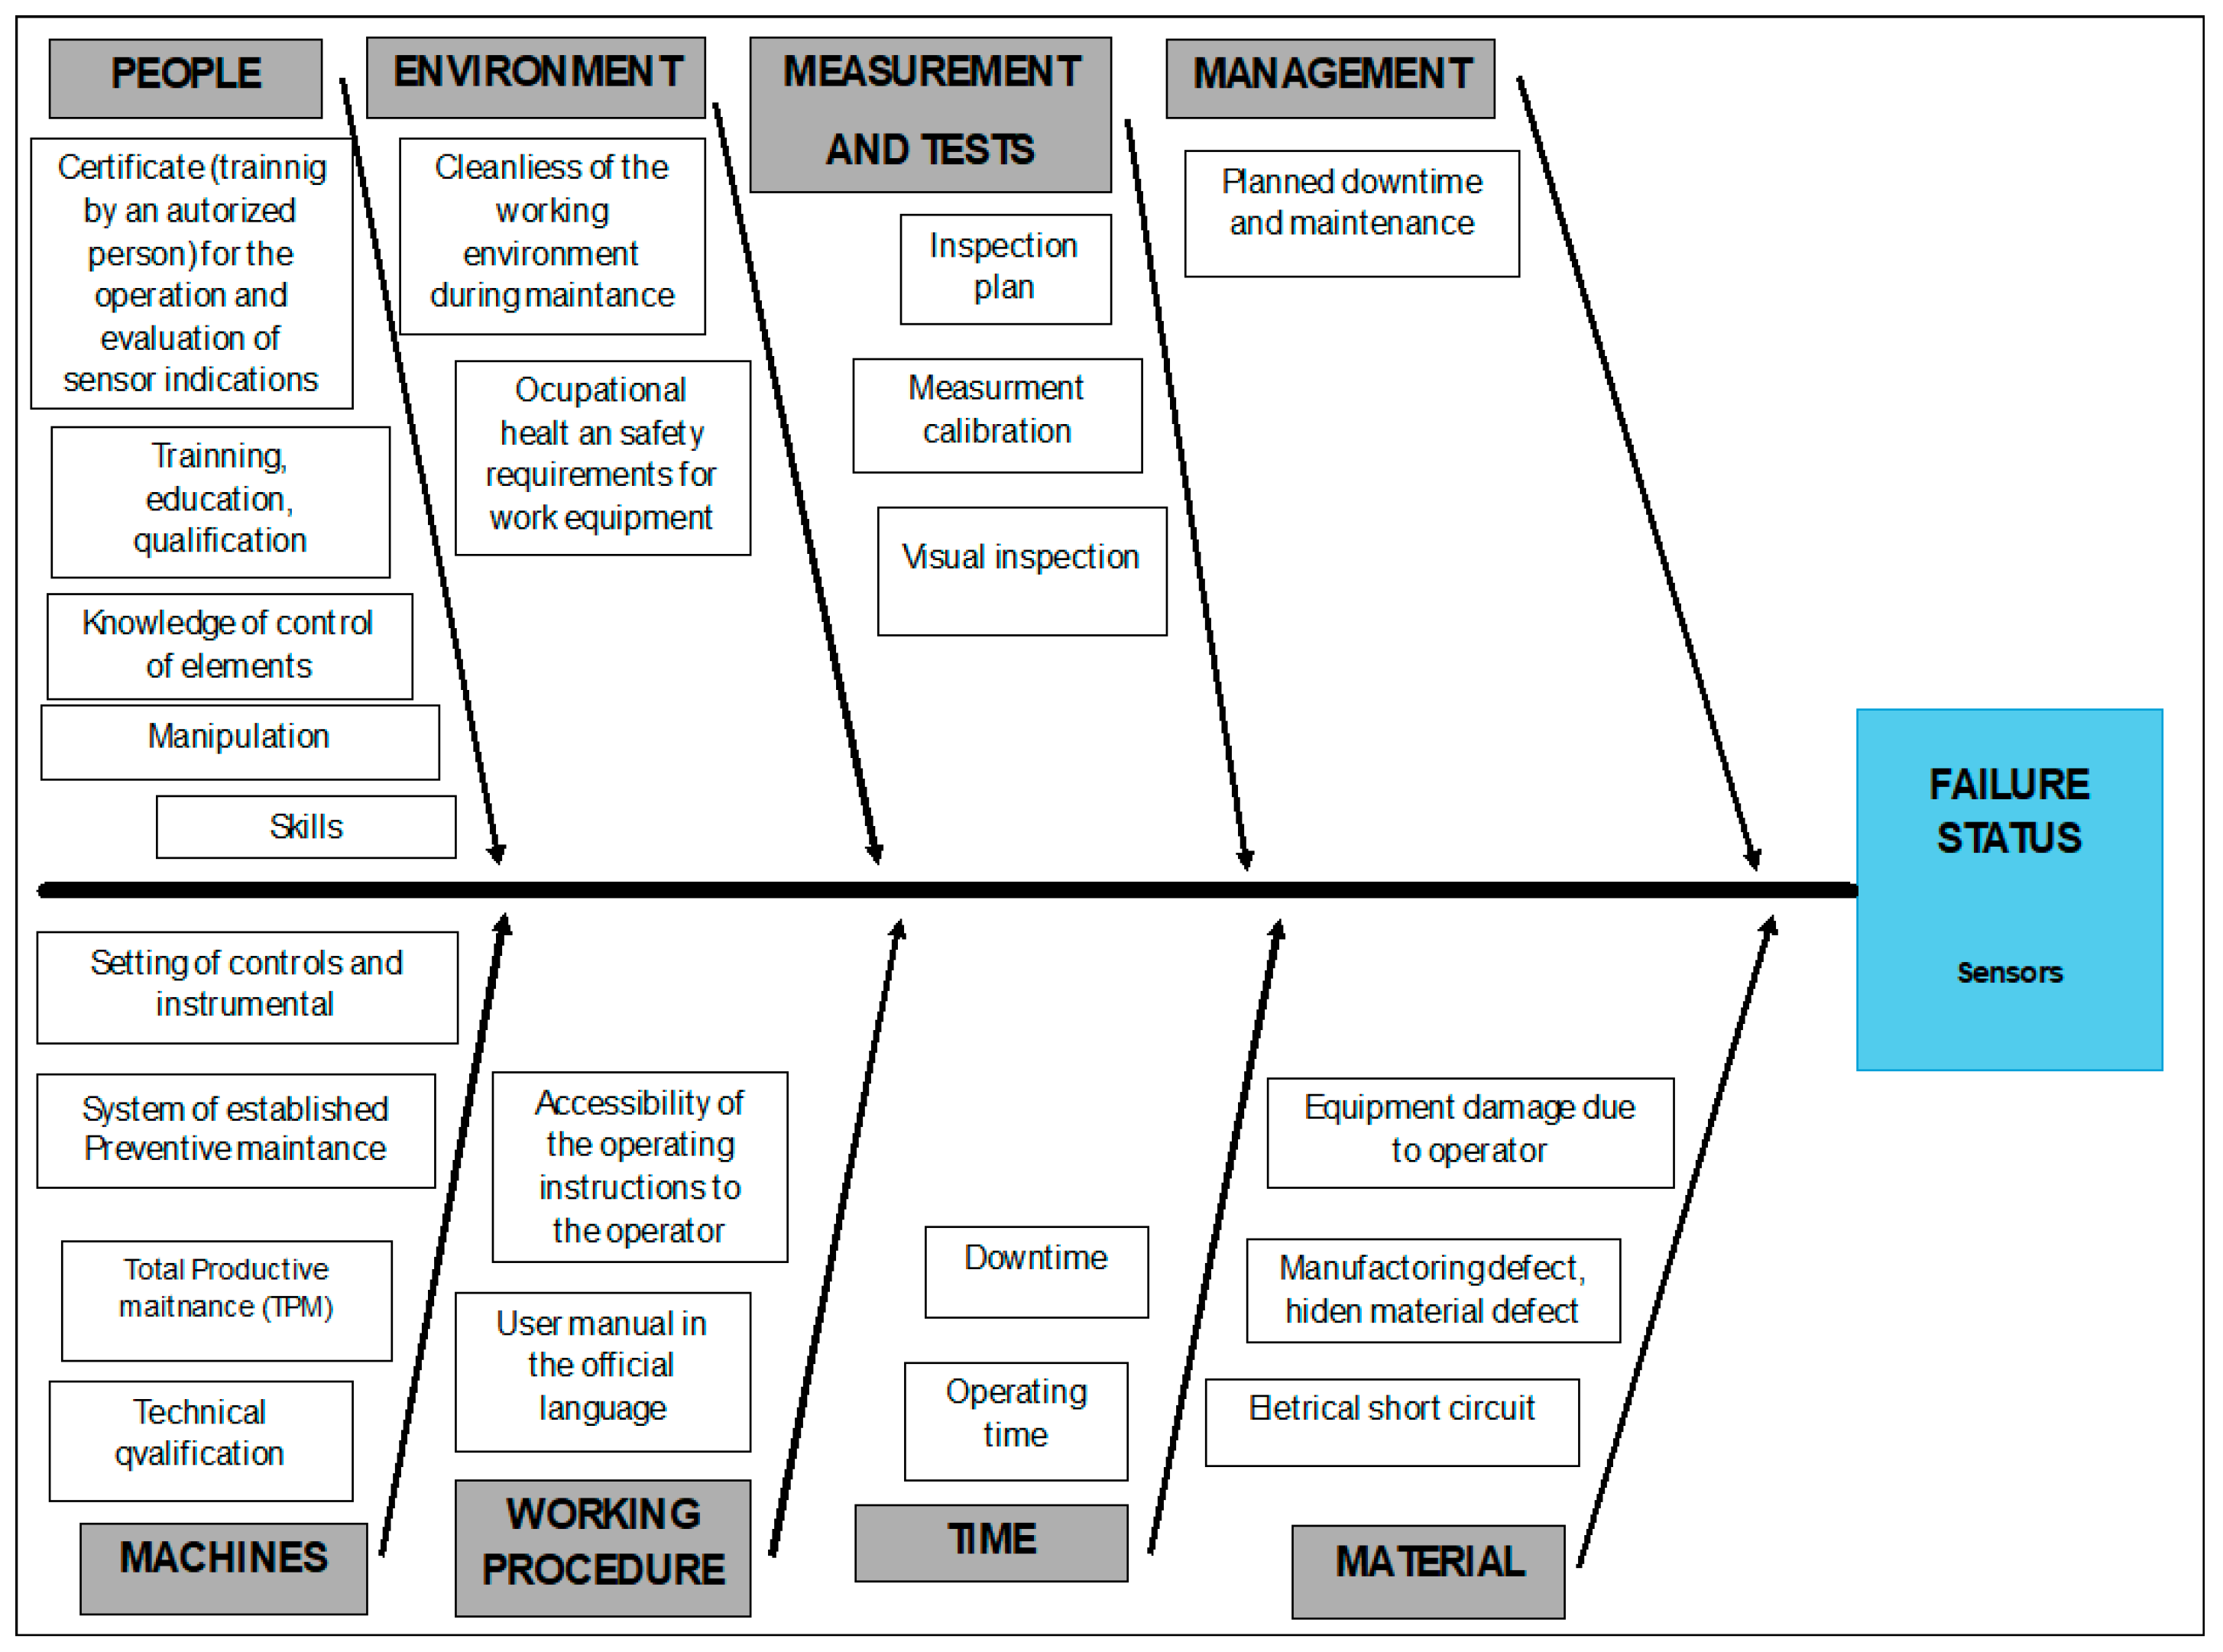
  • Sensors—electrical (safety) equipment of the vehicle;
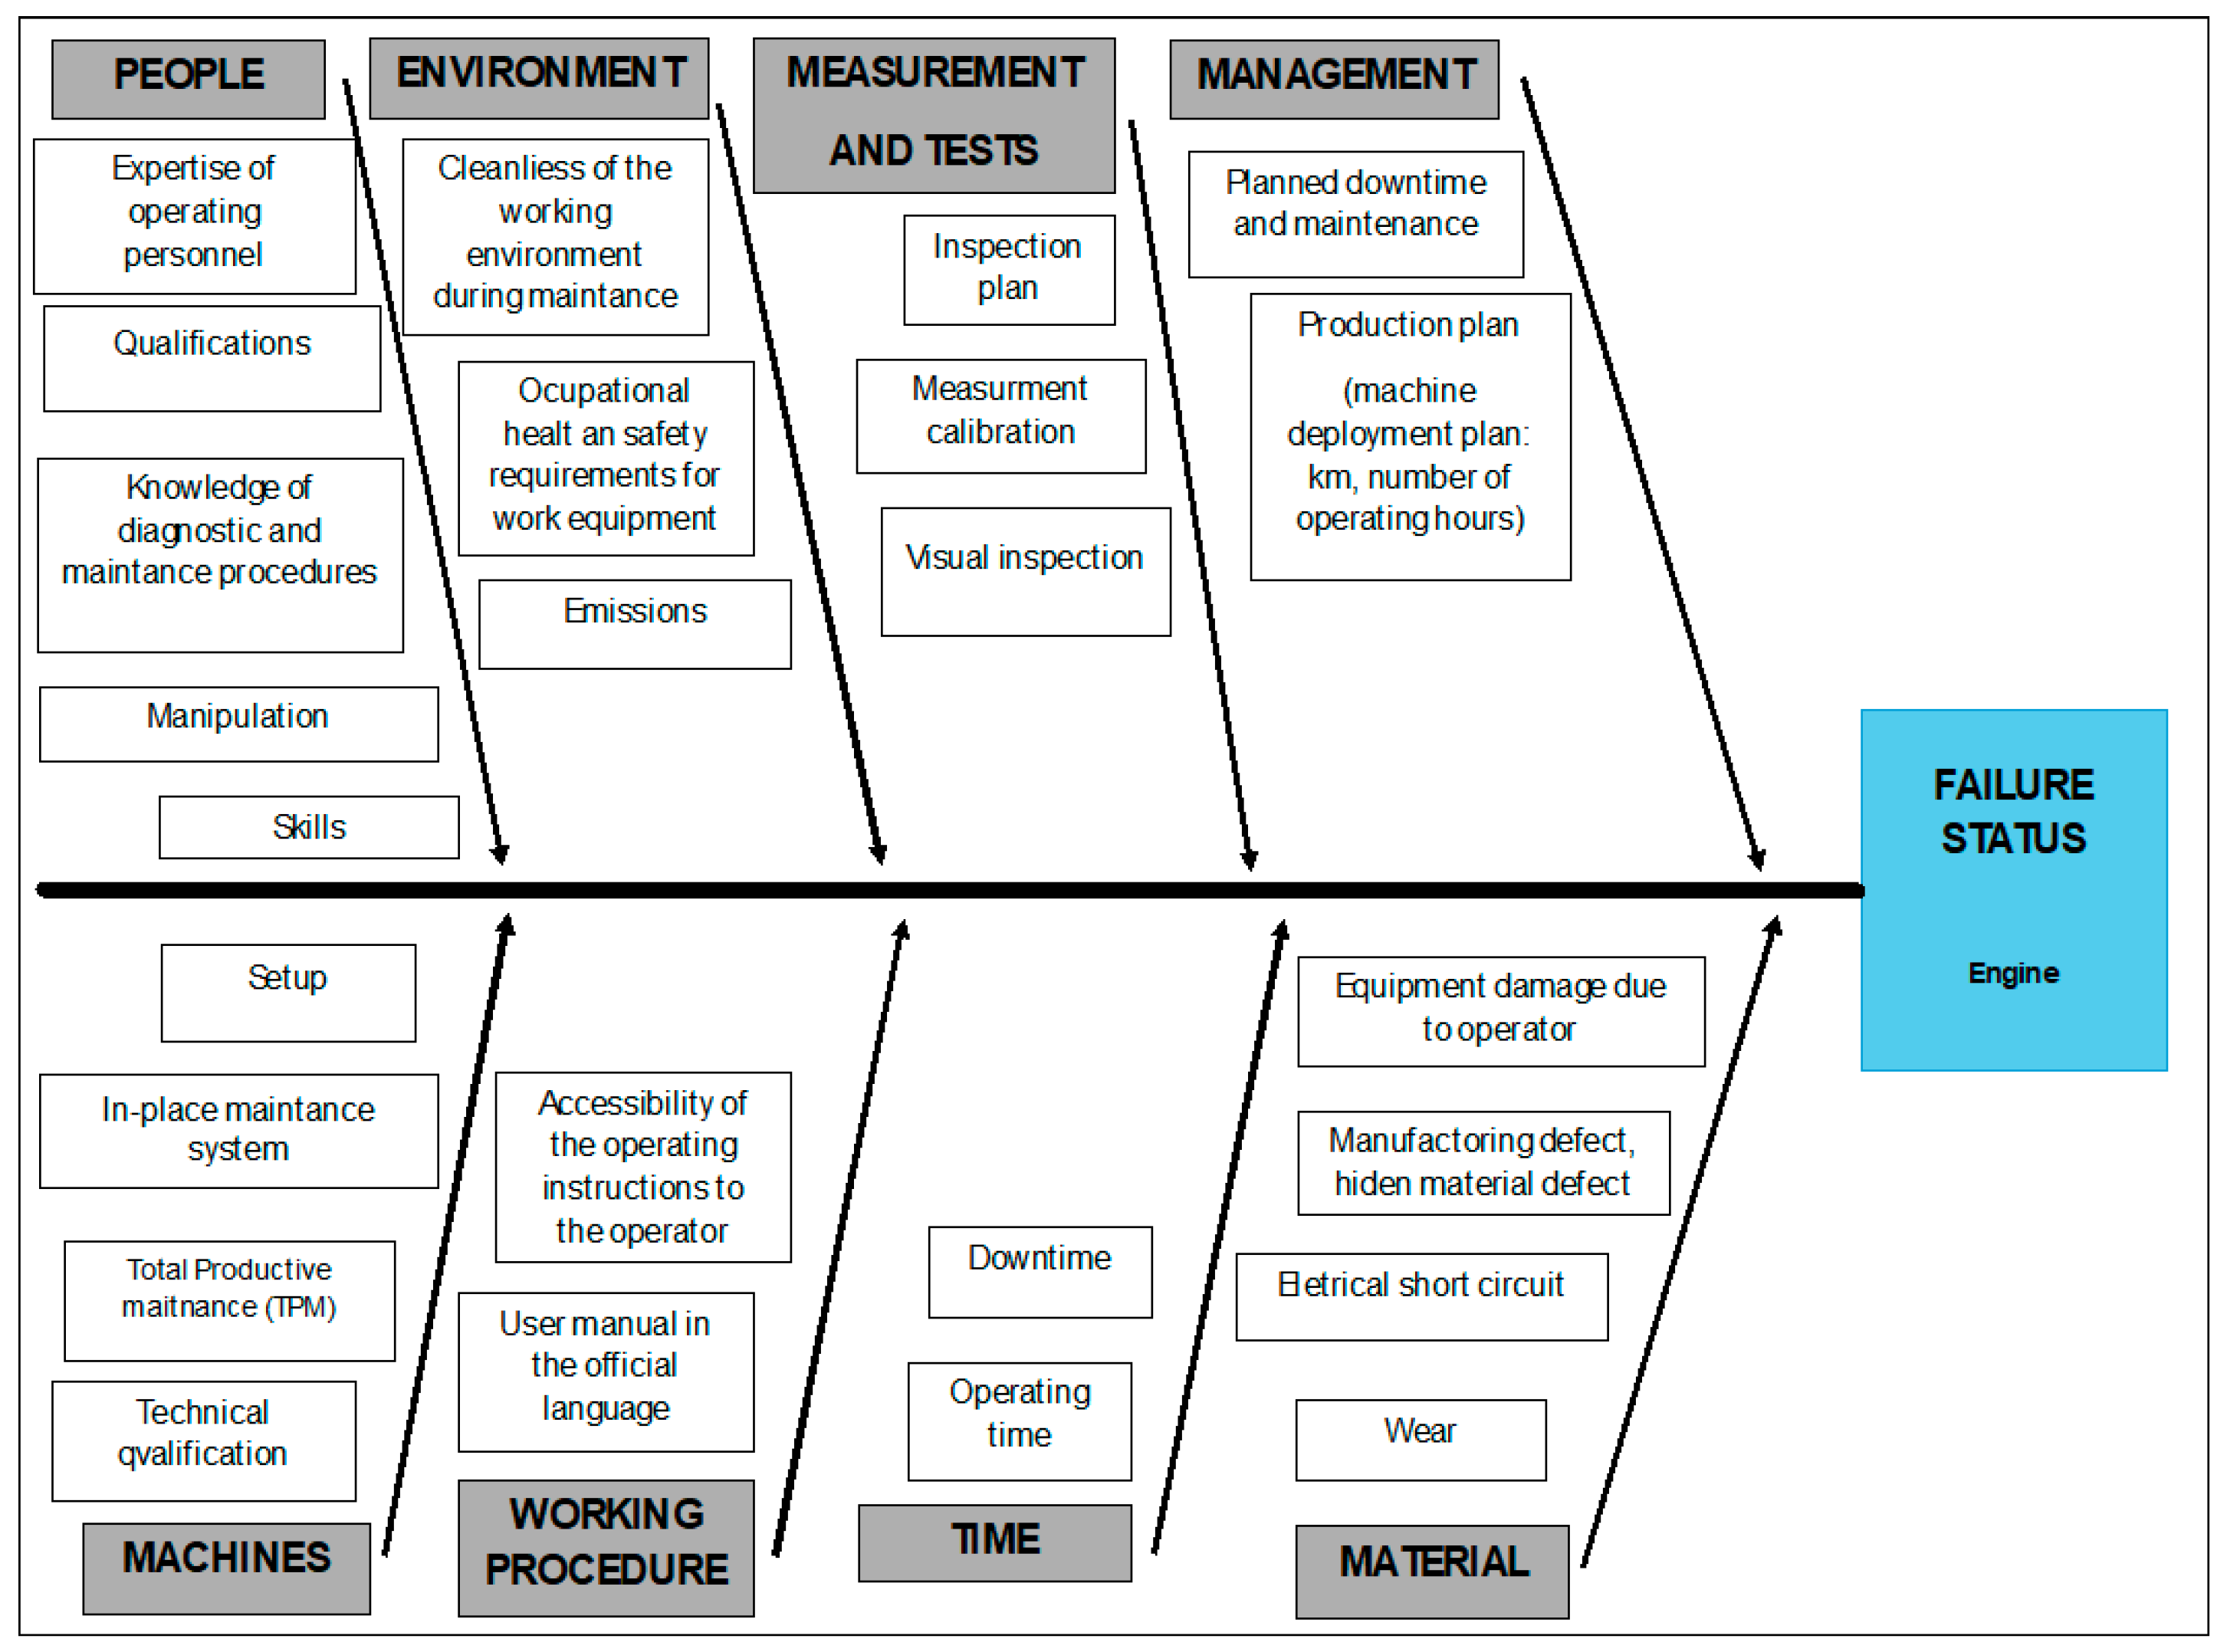
  • Engine (fuel system with tank, block, and lower engine cover, cylinders, pistons, pins, connecting rods, bearings, shaft, flywheel, distribution);
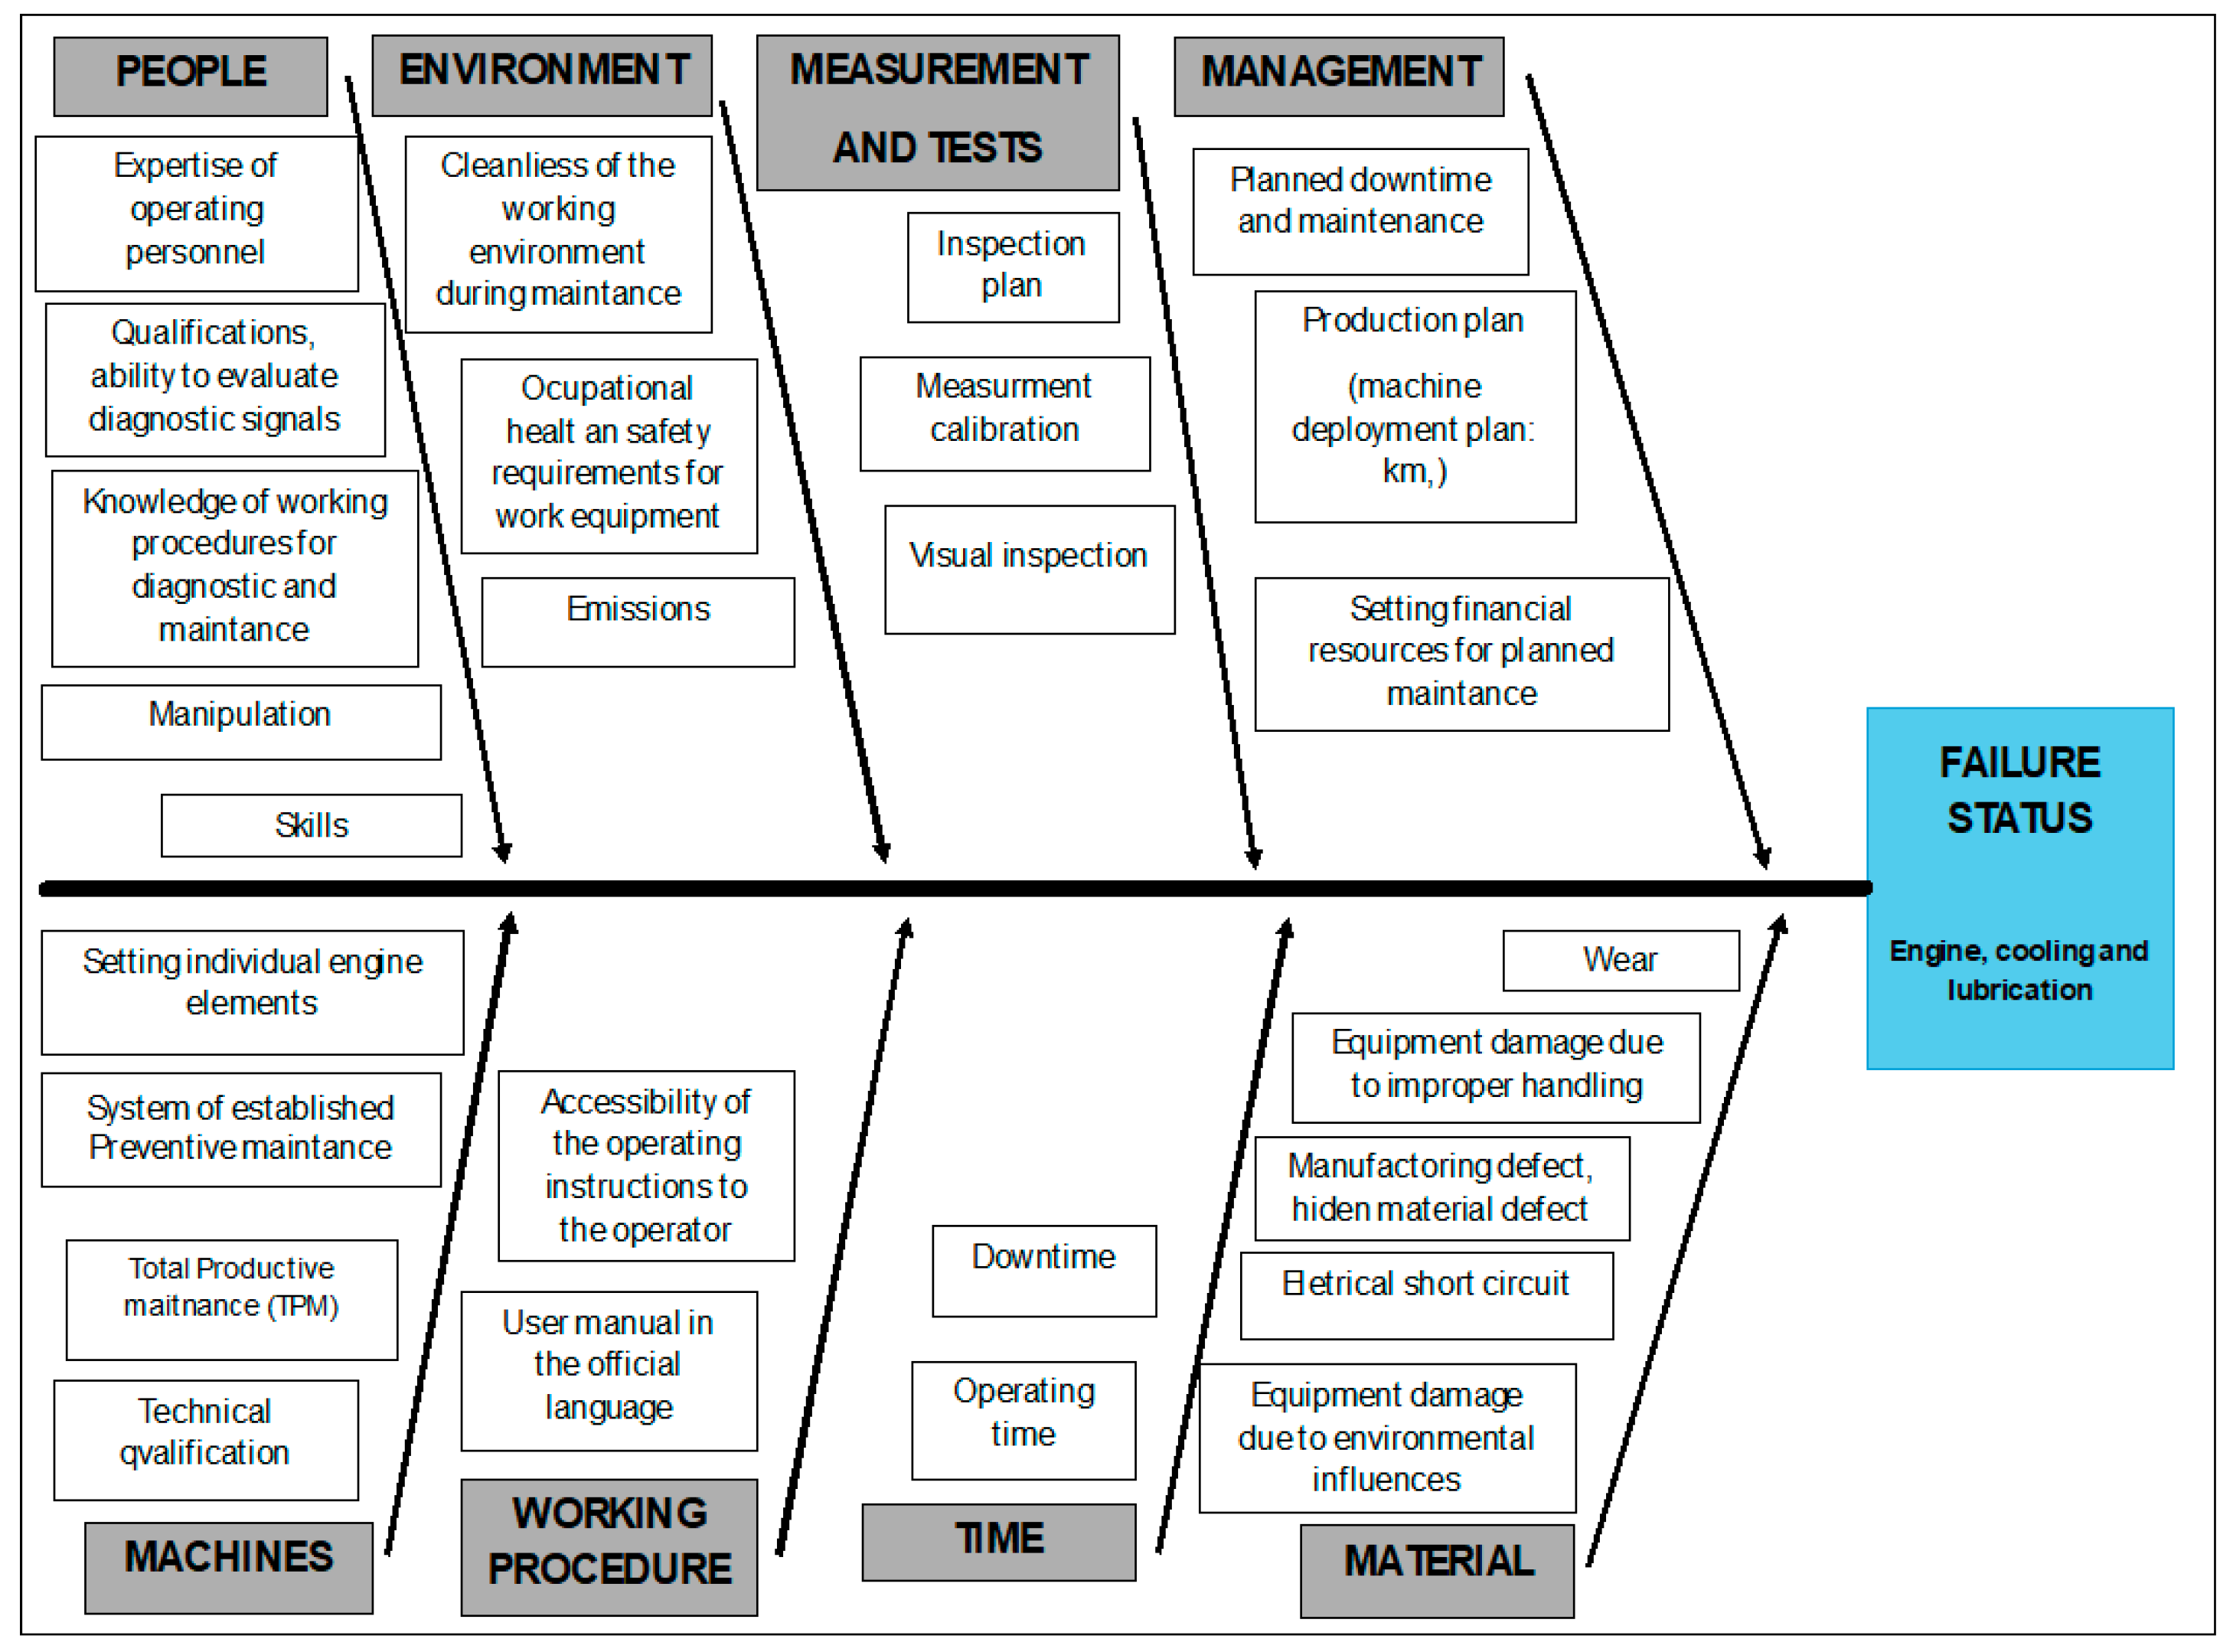
  • Engine and its cooling and lubrication;
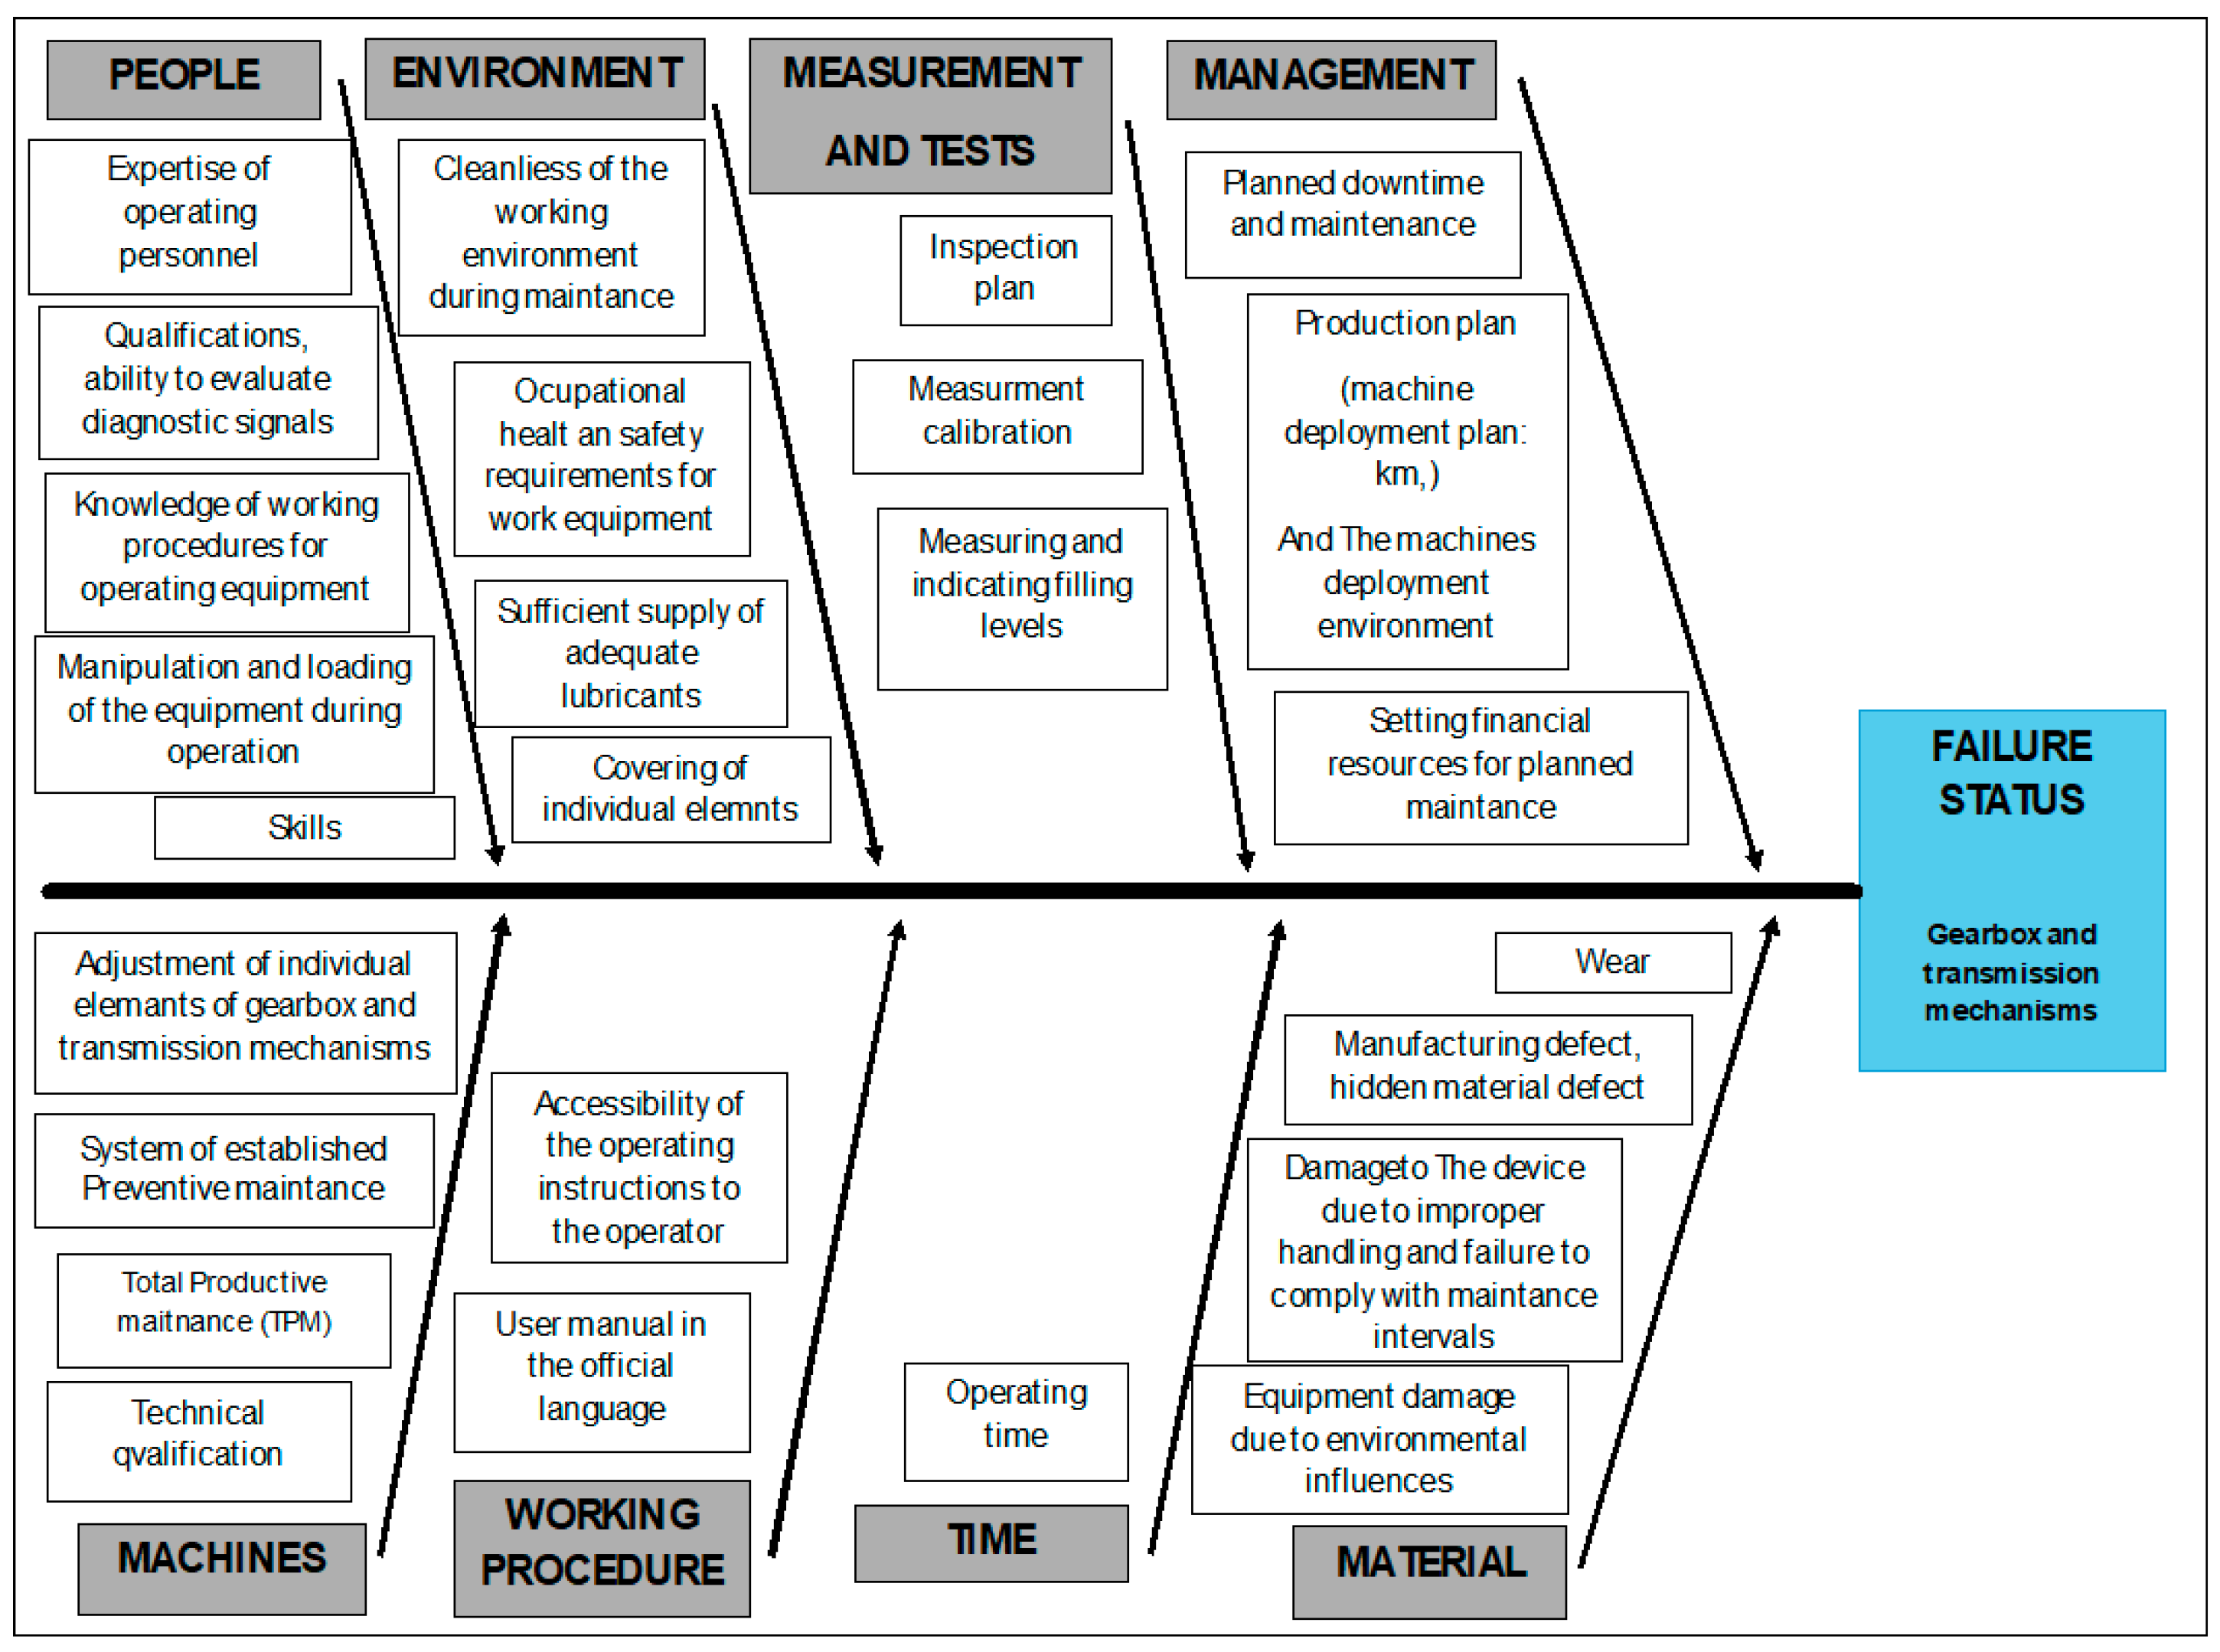
  • Transmissions and transmission mechanisms (gearboxes, clutches, shafts, joints, final drives, differentials, distribution);
  • Chassis (body, frame, shock absorbers, suspension, wheels, tires, axles, steering, brakes);
  • Machine hydraulic system;
  • Hydraulic crane with log grab;
  • Trailer/semi-trailer;
  • Crossbars.
The above division into design groups was processed according to the basic technical specification, which is specified in the design and manufacture of various types of vehicles.

2.3. Procedure for Using the Ishikawa Diagram

Creating an Ishikawa diagram, also known as a cause-and-effect diagram or fishbone diagram, is a systematic process that helps teams effectively identify various potential causes of a problem and analyze them.
Methodological procedure for using the Ishikawa diagram in a dissertation:
  • Problem definition
The fault state for individual structural groups of the monitored transportation vehicles is clearly defined in the axis of the Ishikawa diagram.
2.
Drawing the backbone of the diagram and Identification of the main categories of causes
The structure of the Ishikawa diagram (spine and ribs of the fishbone) is drawn. Only those structures are plotted for which findings were made that affect the failure state of the respective structural group of the monitored transport vehicles.
3.
Brainstorming and discussion
The Ishikawa diagram is completed by asking the question “why?” for each cause of the failure state of the respective structural group of the monitored transport vehicle. Seven specialists in the field of maintenance and operation of transportation vehicles participated in the aforementioned discussion.
4.
Revision and analysis of the diagram
After adding all the causes, the diagram was reviewed to ensure that all information was accurate and complete. The relationships between the causes that have the greatest impact on the problem were analyzed.
5.
Identification of root causes and action plan
After completing and defining the findings for the respective failure state, measures are actually defined to eliminate the main causes of the failure states of the respective structural group of the monitored transport vehicle.
The Ishikawa diagrams for individually designed vehicle groups were drawn based on experience and brainstorming of all specialists participating in the study. A consensus was reached after discussing every issue.

3. Results

Since it has been confirmed that the division into machine structural groups does not depend on the manufacturer of the equipment (i.e., it is not important whether the manufacturer of the monitored equipment is TATRA, SCANIA, or IVECO), the Ishikawa diagram is created for the structural groups of the transportation vehicle as such. The requirements that must be met or examined in the event of a malfunction of the given equipment are defined.
The Ishikawa diagram is developed to evaluate malfunctions in transportation vehicle operators. It is important for equipment operators to be able to focus on individual elements of the work process and positively influence the operating time of the transportation vehicles. The Ishikawa diagram is a tool that can help prevent malfunctions in the monitored transportation vehicles. In this form, it is a preventive tool for the operator, which, when used correctly, can ensure an increase in the service life of the entire transportation vehicle. The Ishikawa diagram has the shape of a fishbone, where each “bone” represents a category of potential causes of the problem. At the head of the “fish” there is an effect or problem that is being analyzed. The main categories of causes are branched off from the main line, and smaller bones extend from these branches, which represent the detailed causes of the problem. Usually, there are 5 typical categories of causes, namely material, methods, tools, measurement, and environment. We have added more categories for the needs of the given analysis, which resulted from the factual situation. time, work procedure, and people. The processed Ishikawa diagram for individual design groups of transport vehicles is processed in Figure 1, Figure 2, Figure 3, Figure 4, Figure 5, Figure 6, Figure 7, Figure 8, Figure 9 and Figure 10.
Figure 1 shows the results of the Ishikawa diagram for the cabin, controls, and instrumentation (on-board computer/control unit, tachograph, outside thermometer).
Figure 2 shows the results of the Ishikawa diagram for sensors, including vehicle electrical and safety devices.
Figure 3 shows the results of the Ishikawa diagram for an engine (fuel system with tank, engine block and bottom cover, cylinders, pistons, pins, connecting rods, bearings, shaft, flywheel, timing belts).
Figure 4 shows the results of the Ishikawa diagram for the engine, including its cooling and lubrication.
Figure 5 shows the results of the Ishikawa diagram for transmissions and transmission mechanisms (gearboxes, clutches, shafts, joints, transfer cases, differentials, distributions).
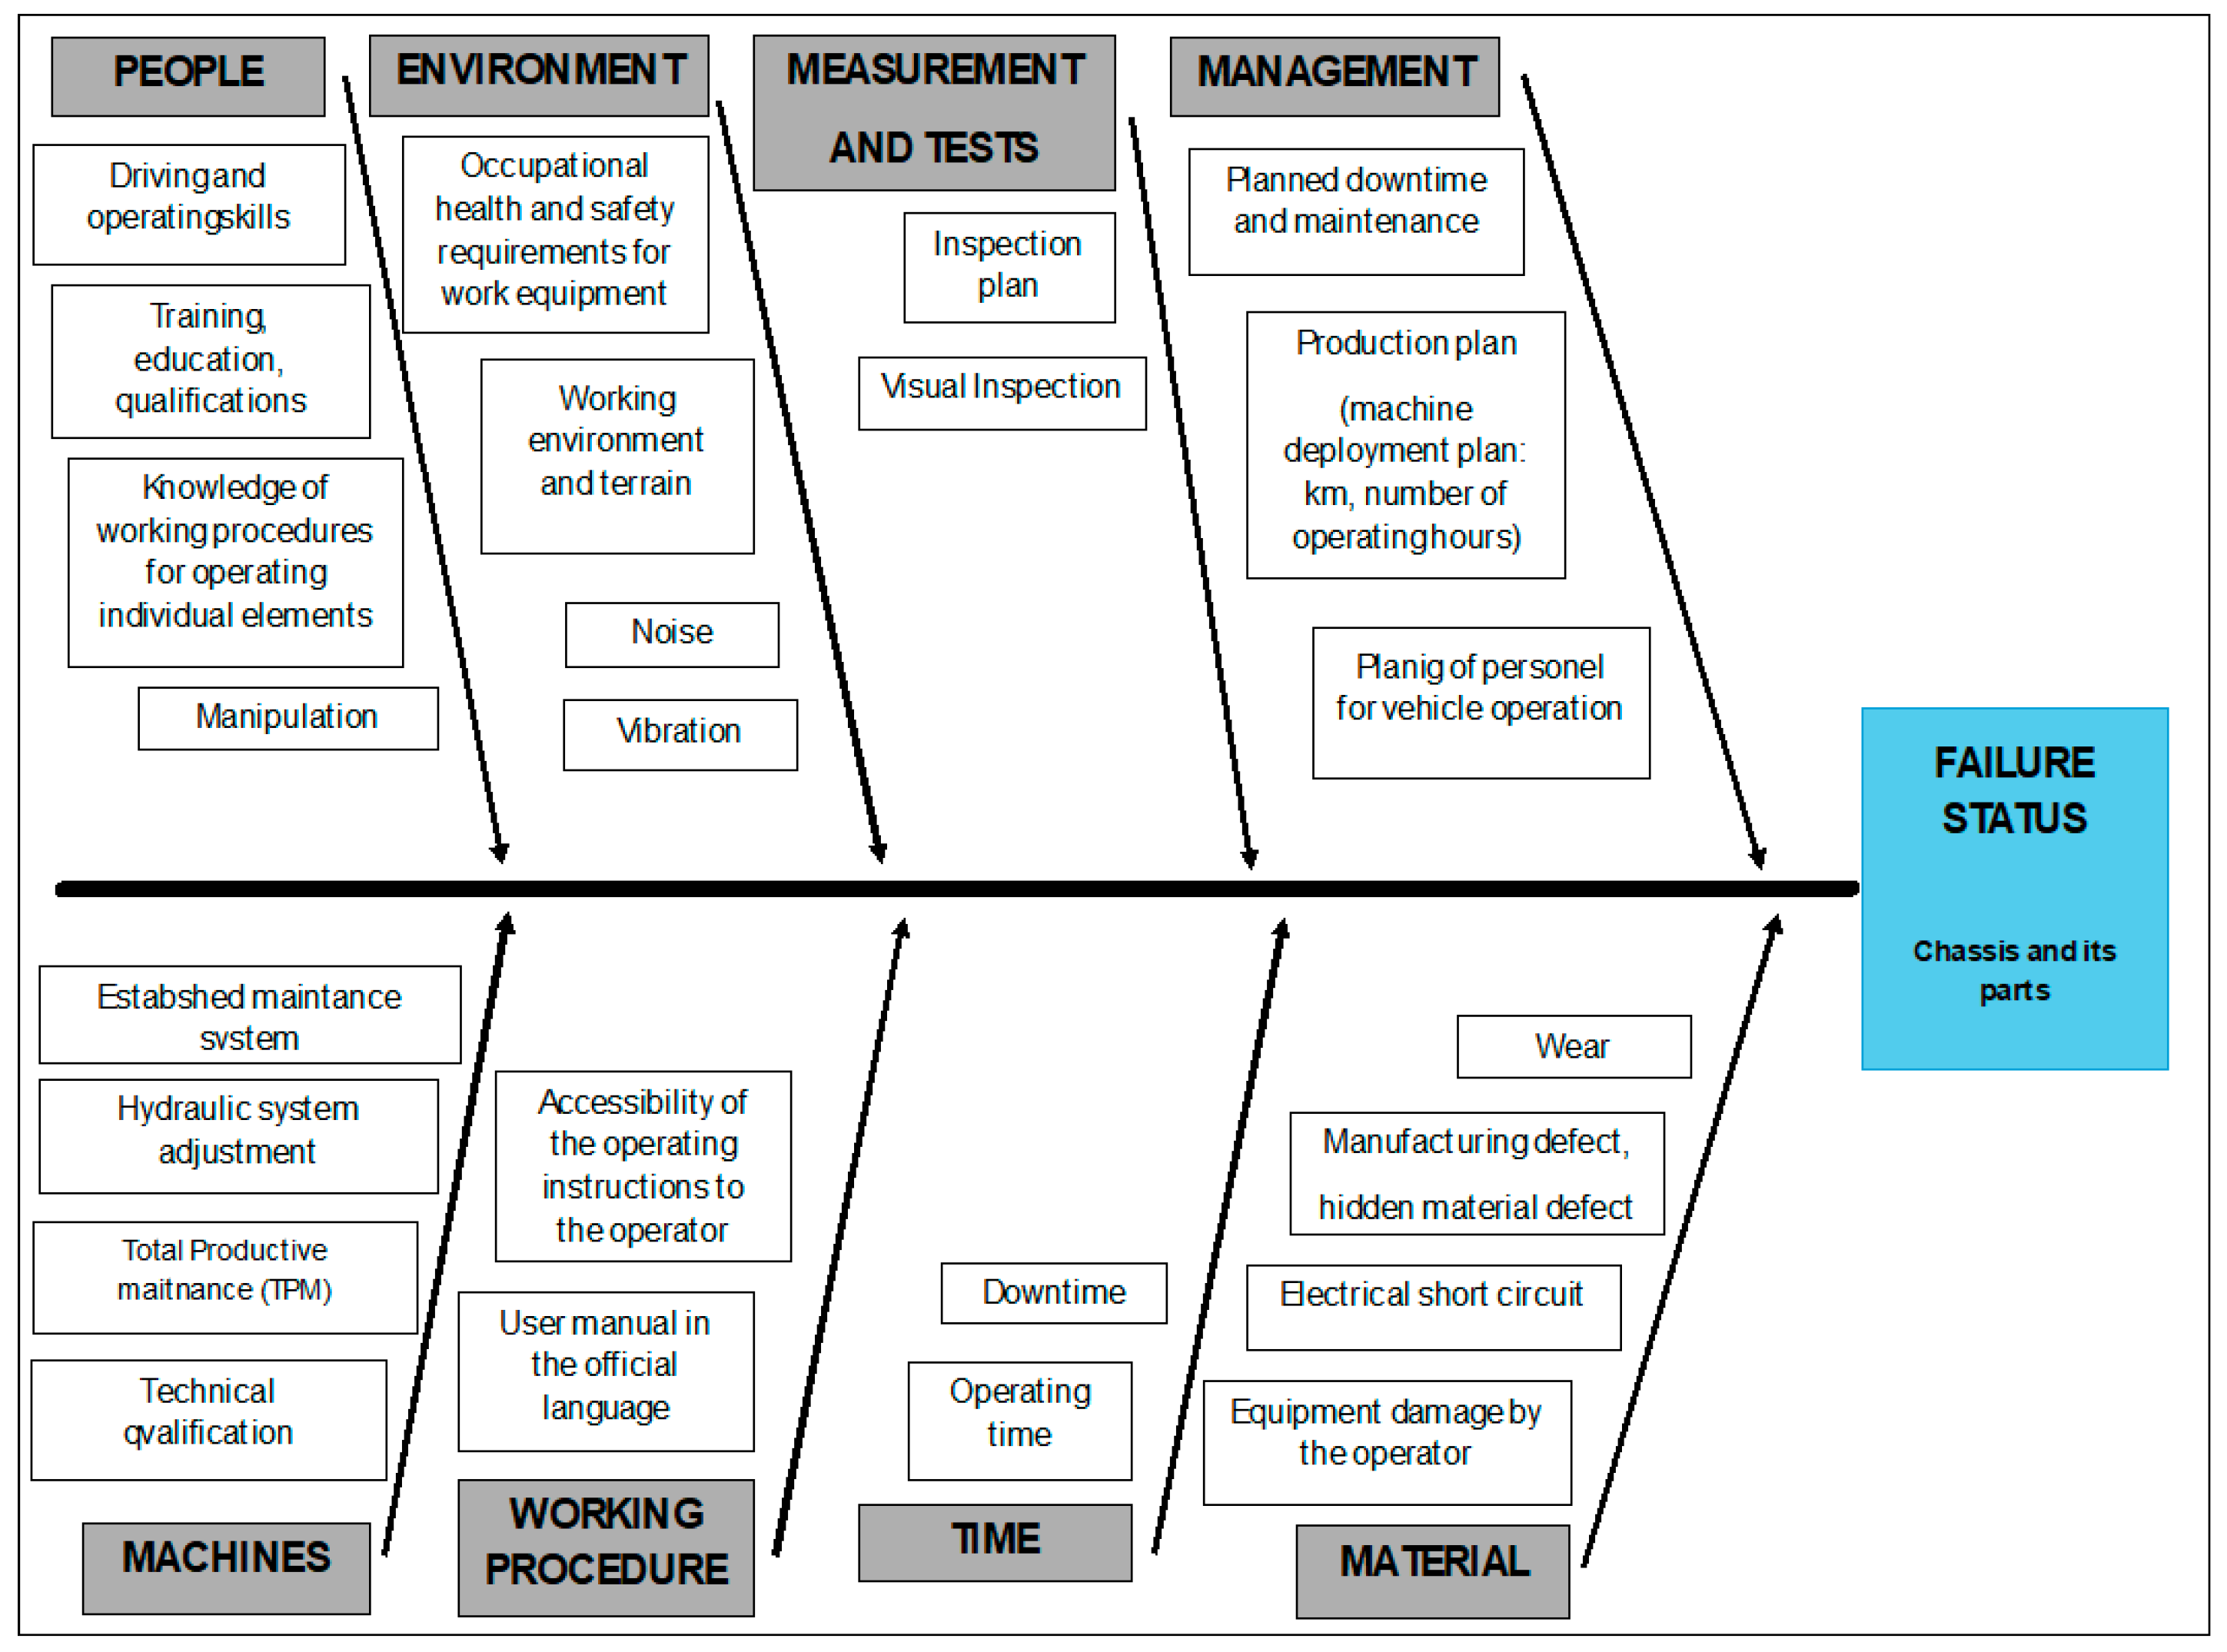
Figure 6 shows the results of the Ishikawa diagram for chassis (body, frame, shock absorbers, suspension, wheels, tires, axles, steering, brakes).
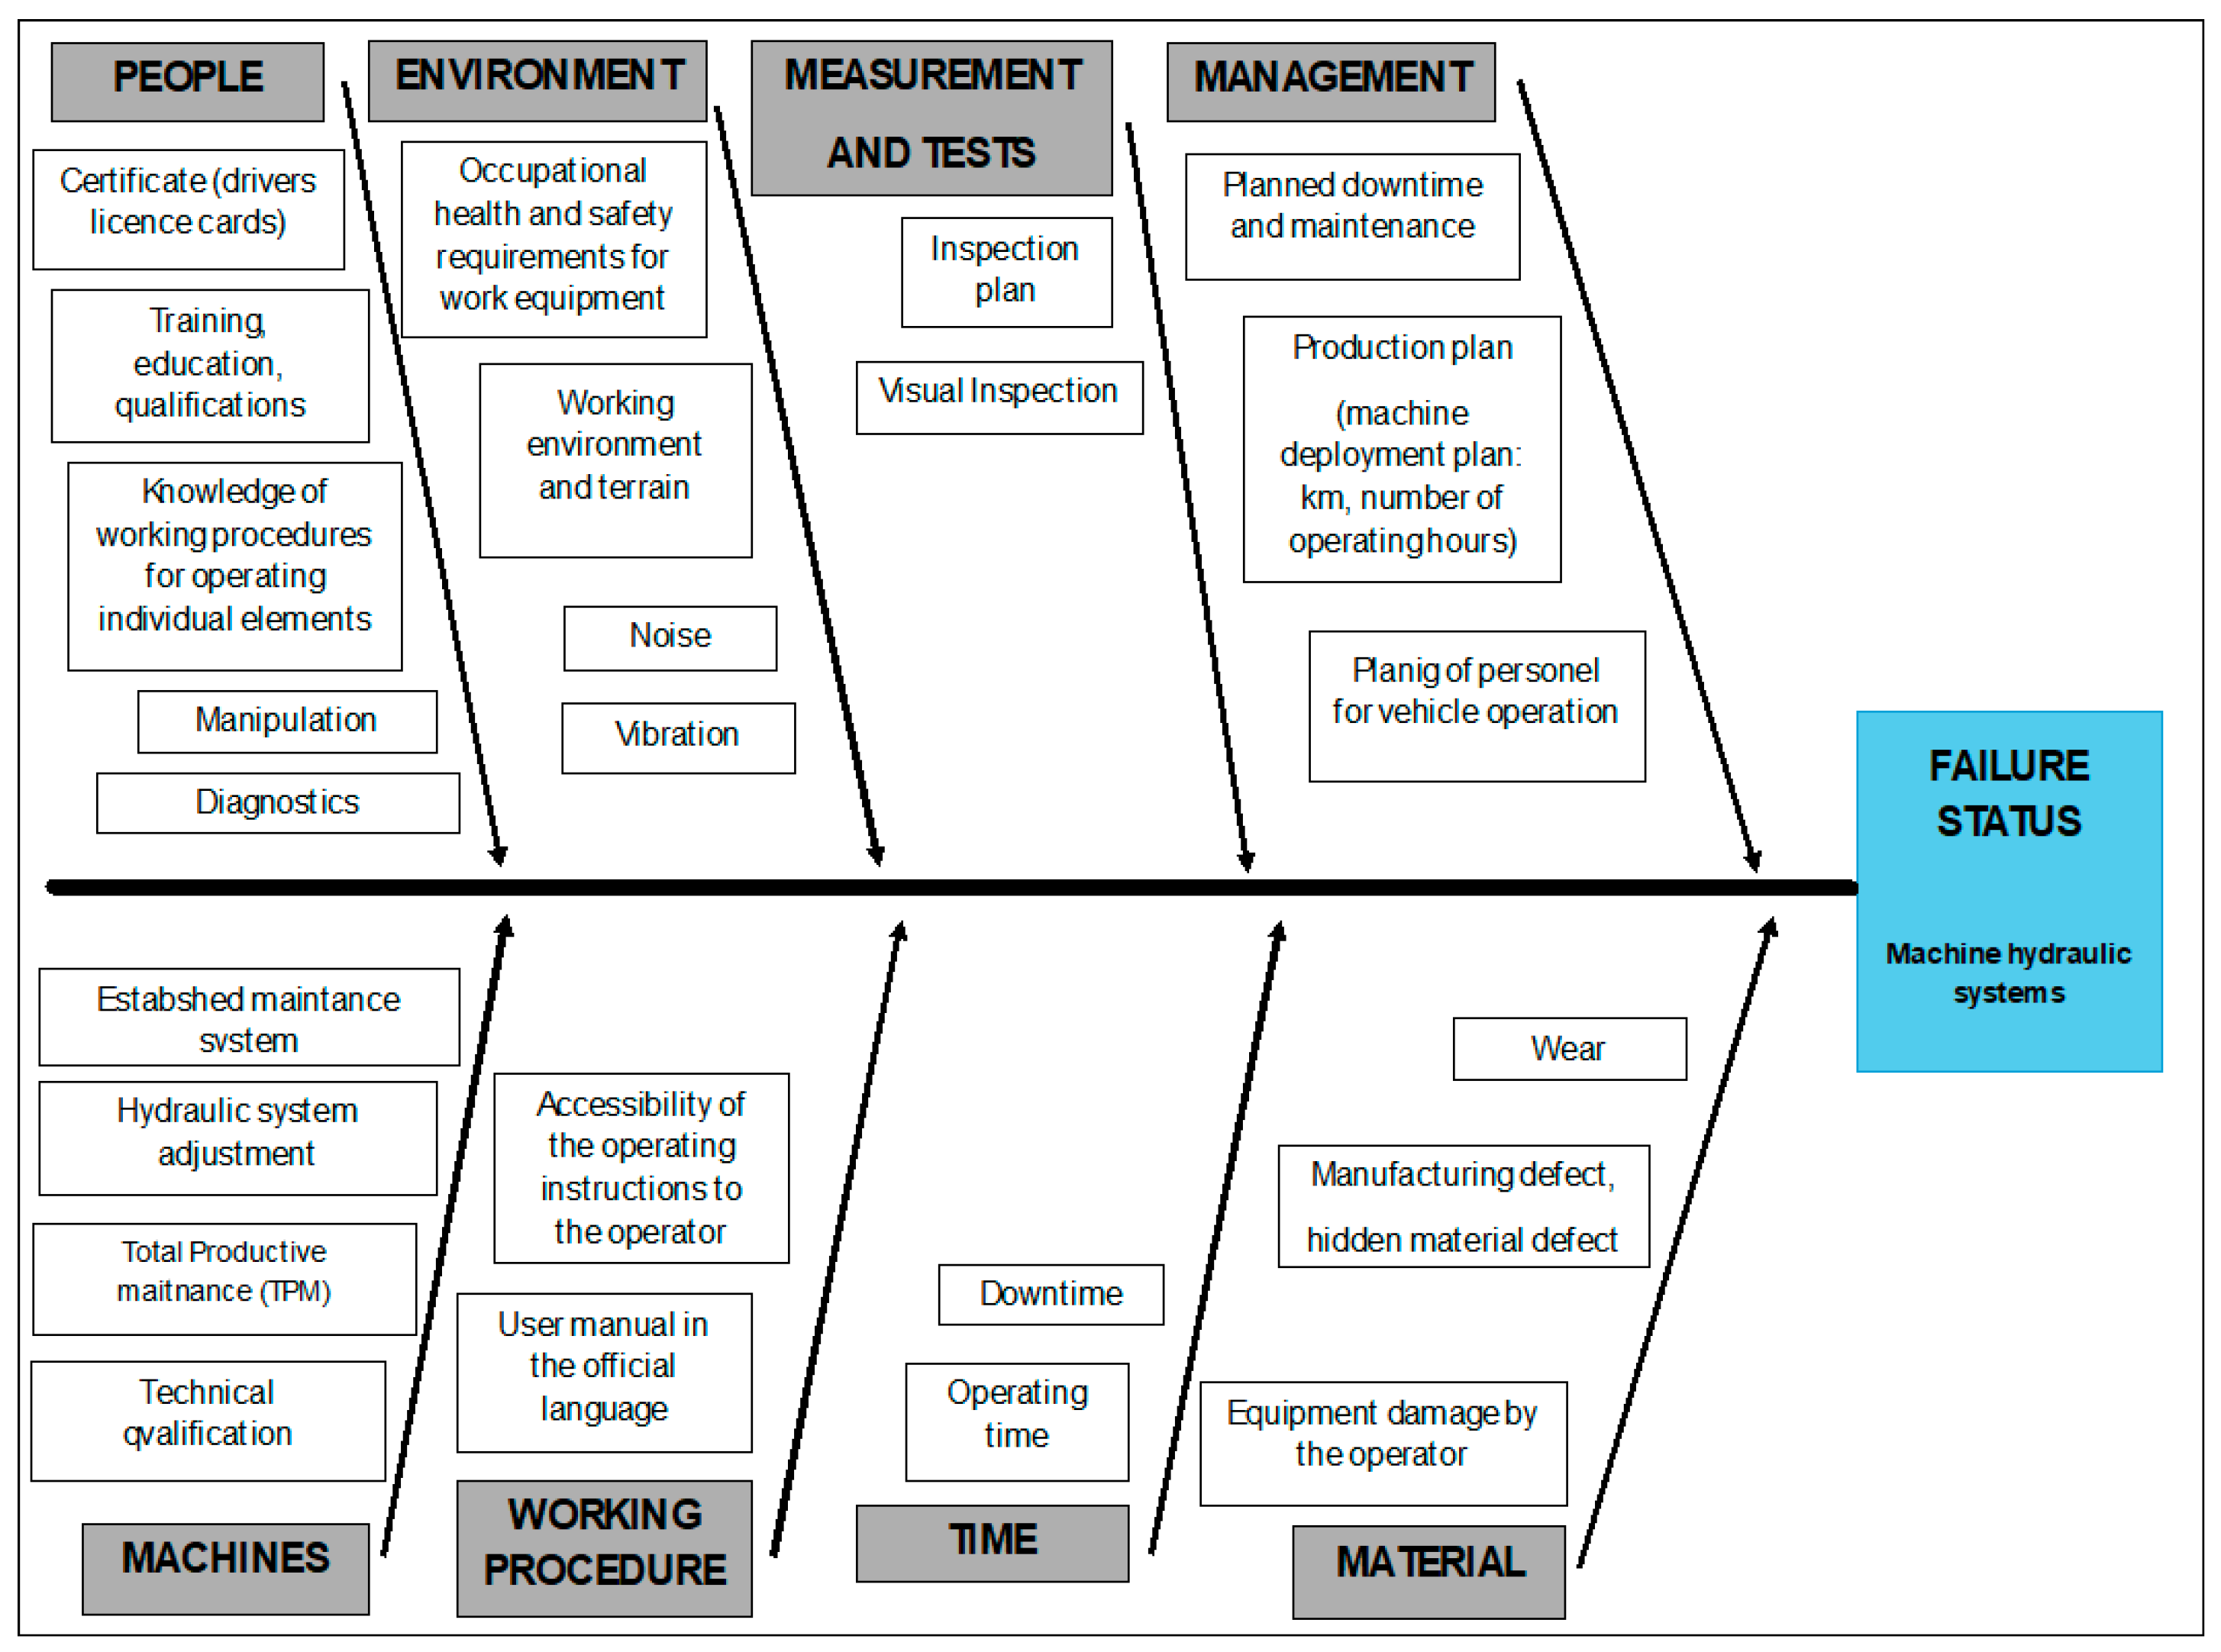
Figure 7 shows the results of the Ishikawa diagram for a machine’s hydraulic system.
Figure 8 shows the results of the Ishikawa diagram for a trailer/semi-trailer.
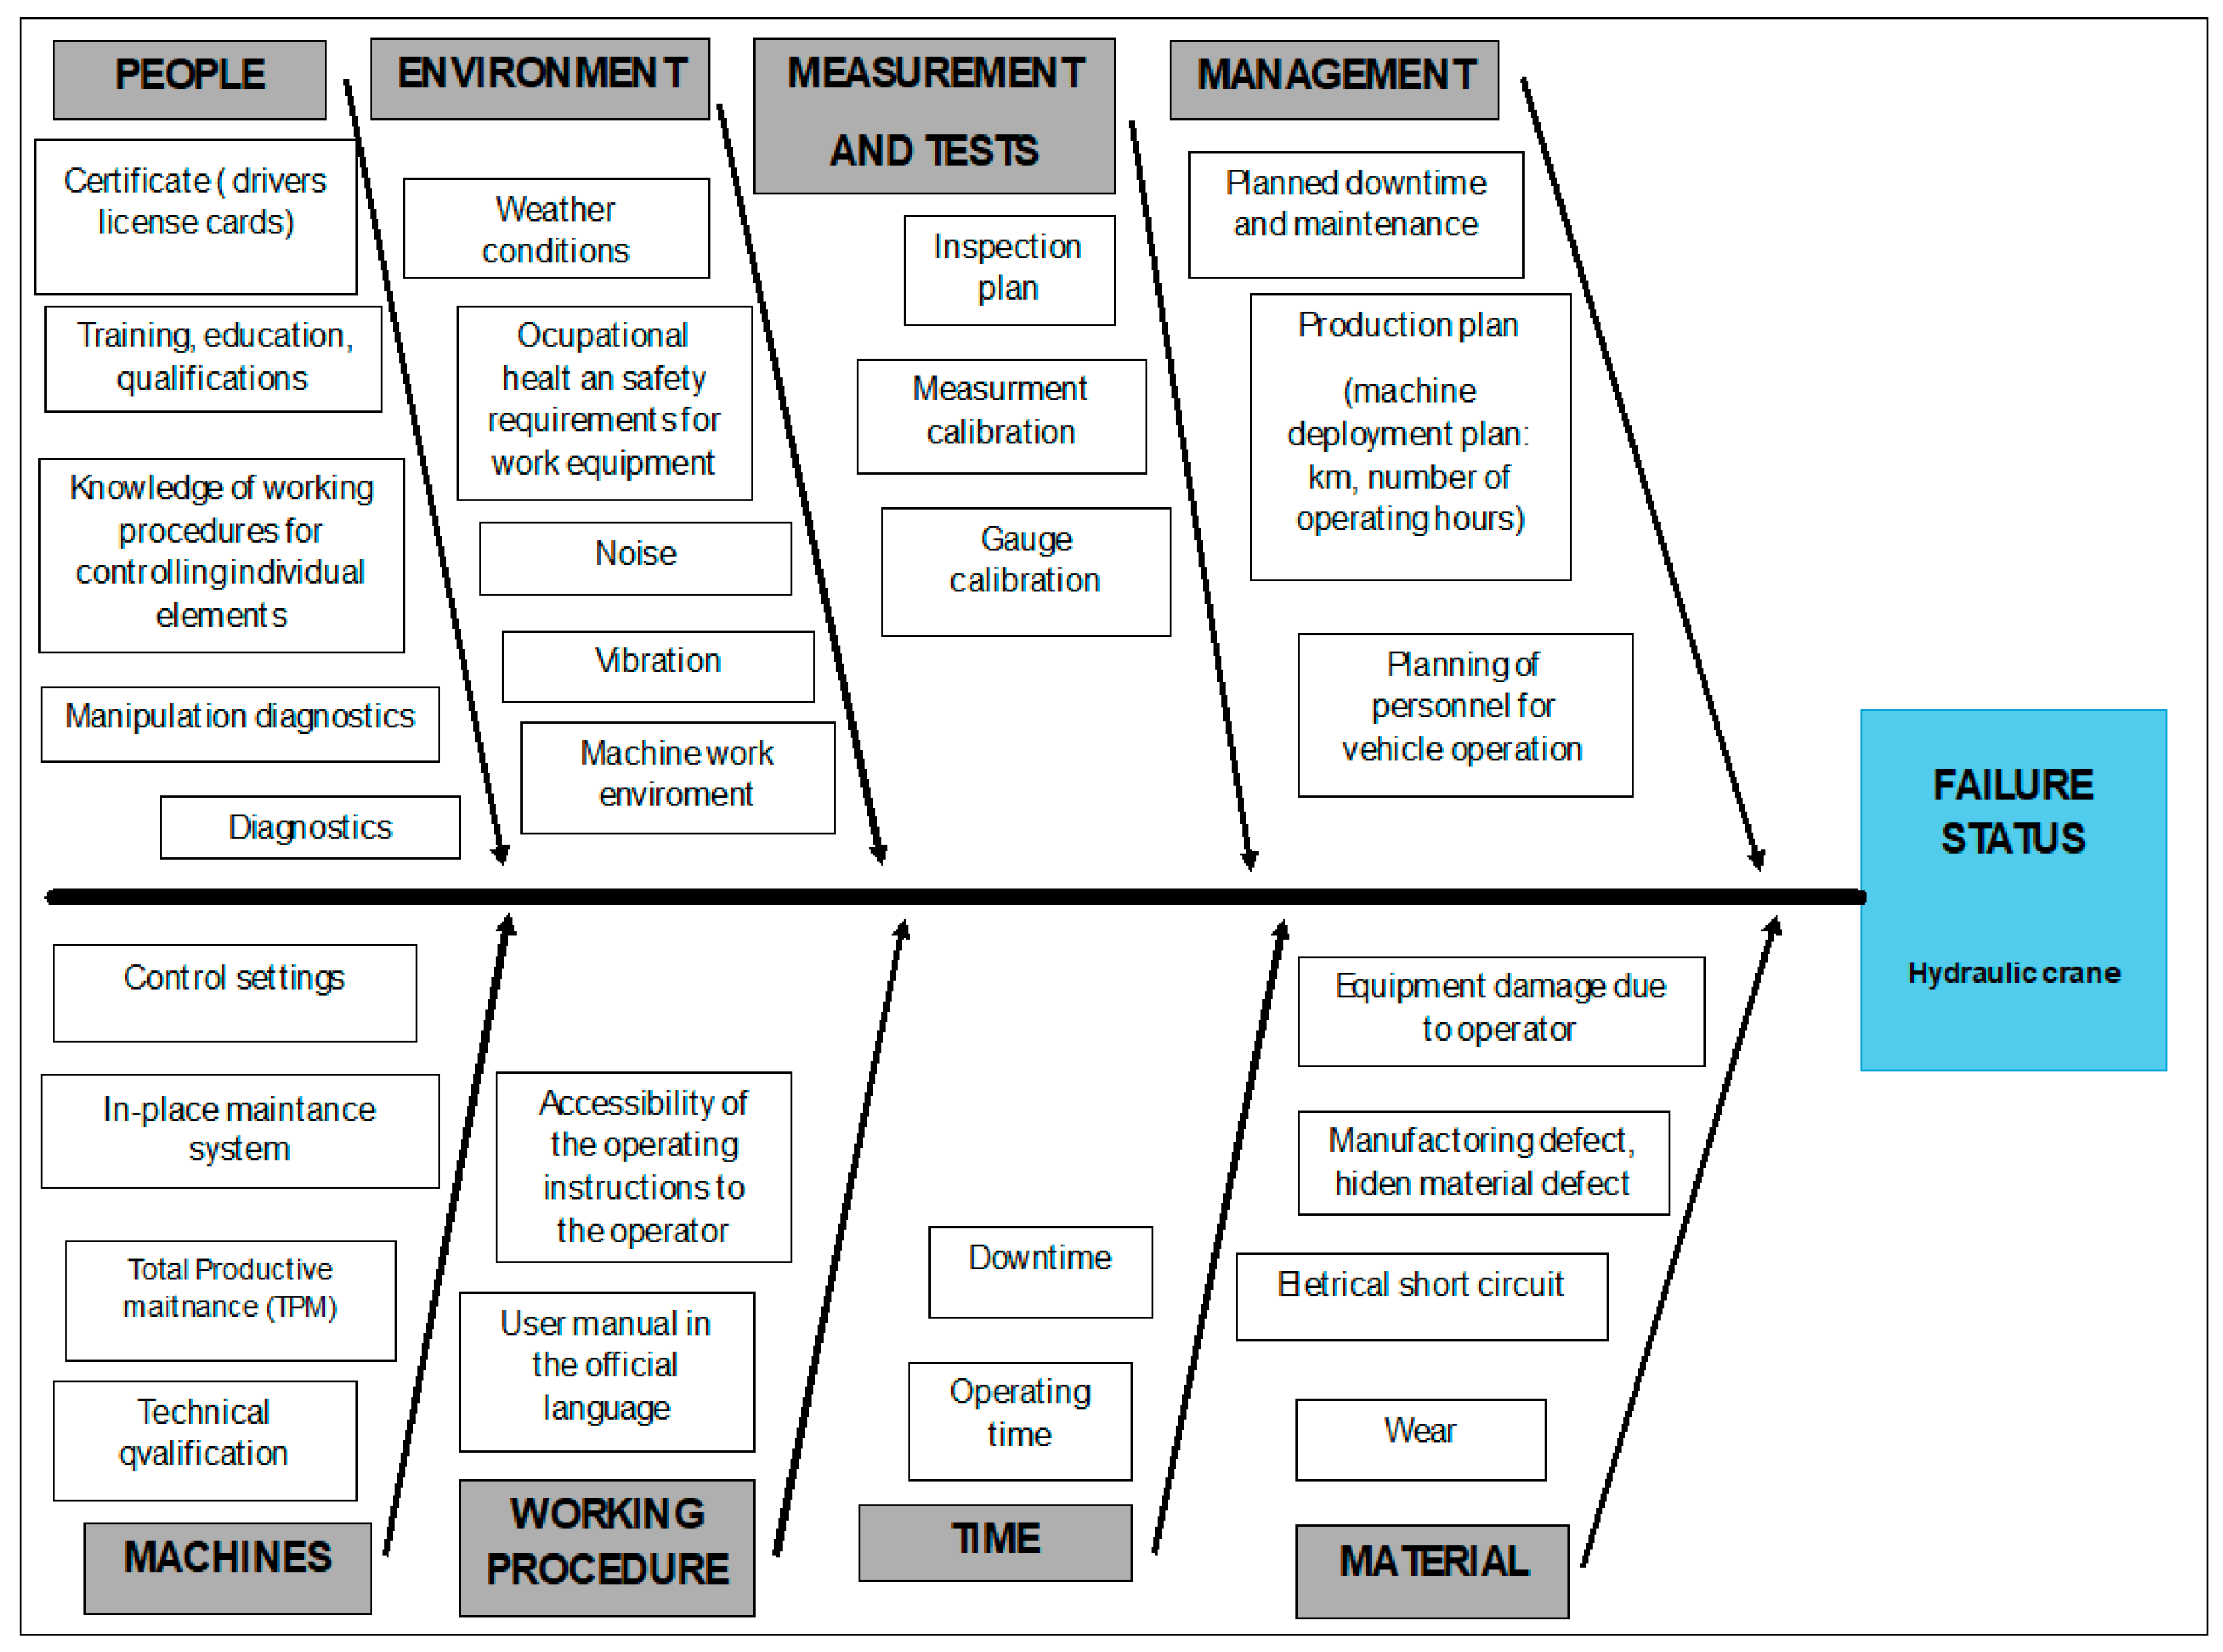
Figure 9 shows the results of the Ishikawa diagram for the hydraulic log grab crane.
Figure 10 shows the results of the Ishikawa diagram for the stanchion curtain and stanchions.
By using Ishikawa diagrams for individual construction groups of the monitored transport vehicles, operators were provided with a proposal on how to influence the operational reliability (e.g., time between failures) of the monitored transport vehicles.
Ishikawa diagram was used as a simple graphical instrument to understand the causes that could produce operational defects and was used to analyze the relation between a problem and all possible causes. That was the reason why it was not important for this case study which vehicle brand the failure state occurred in. During the investigation, we focused on the reasons why possible failure states occurred and identified the primary causes of their occurrence.
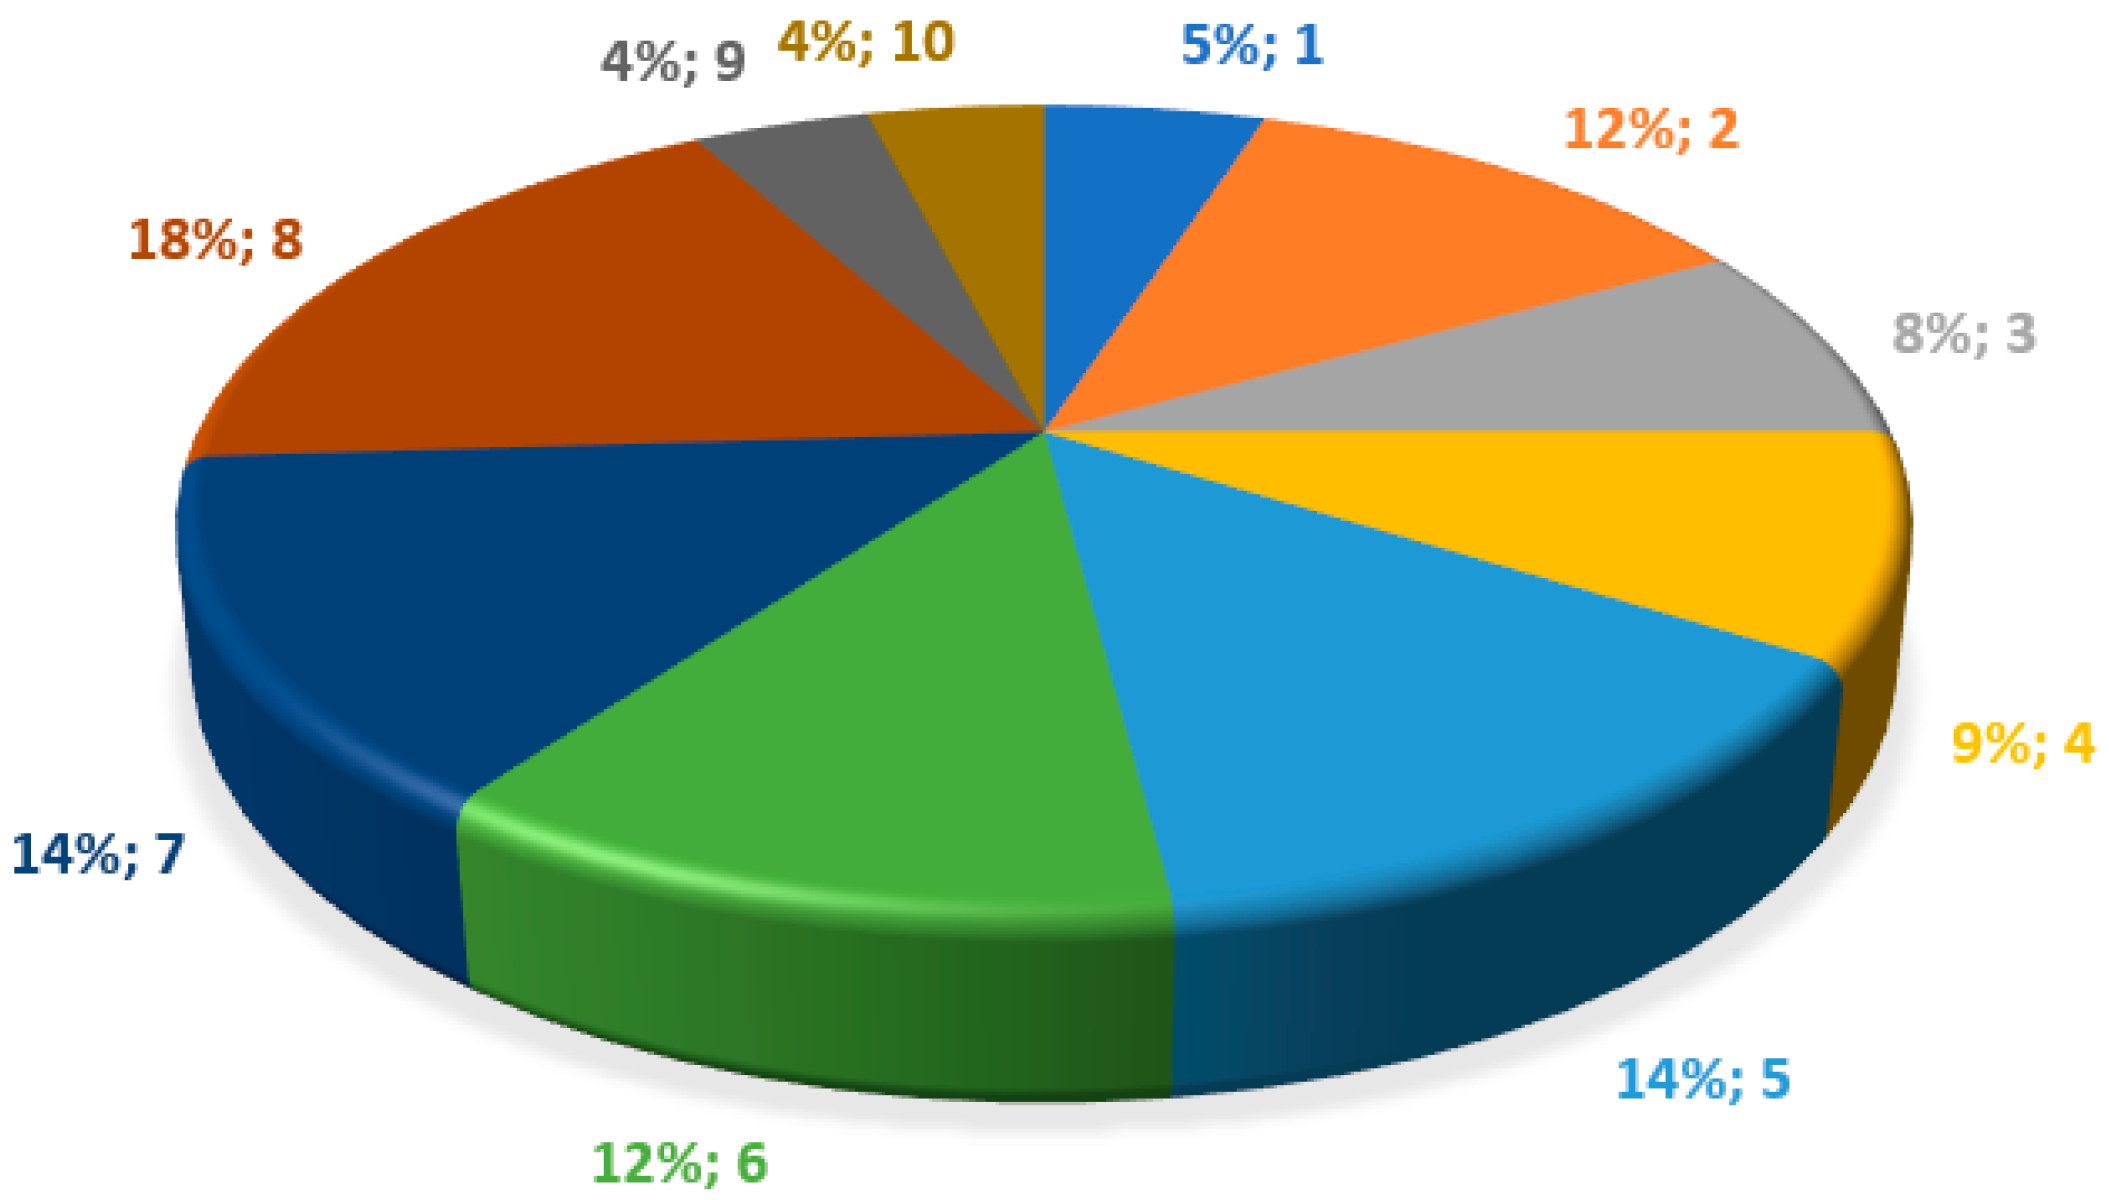
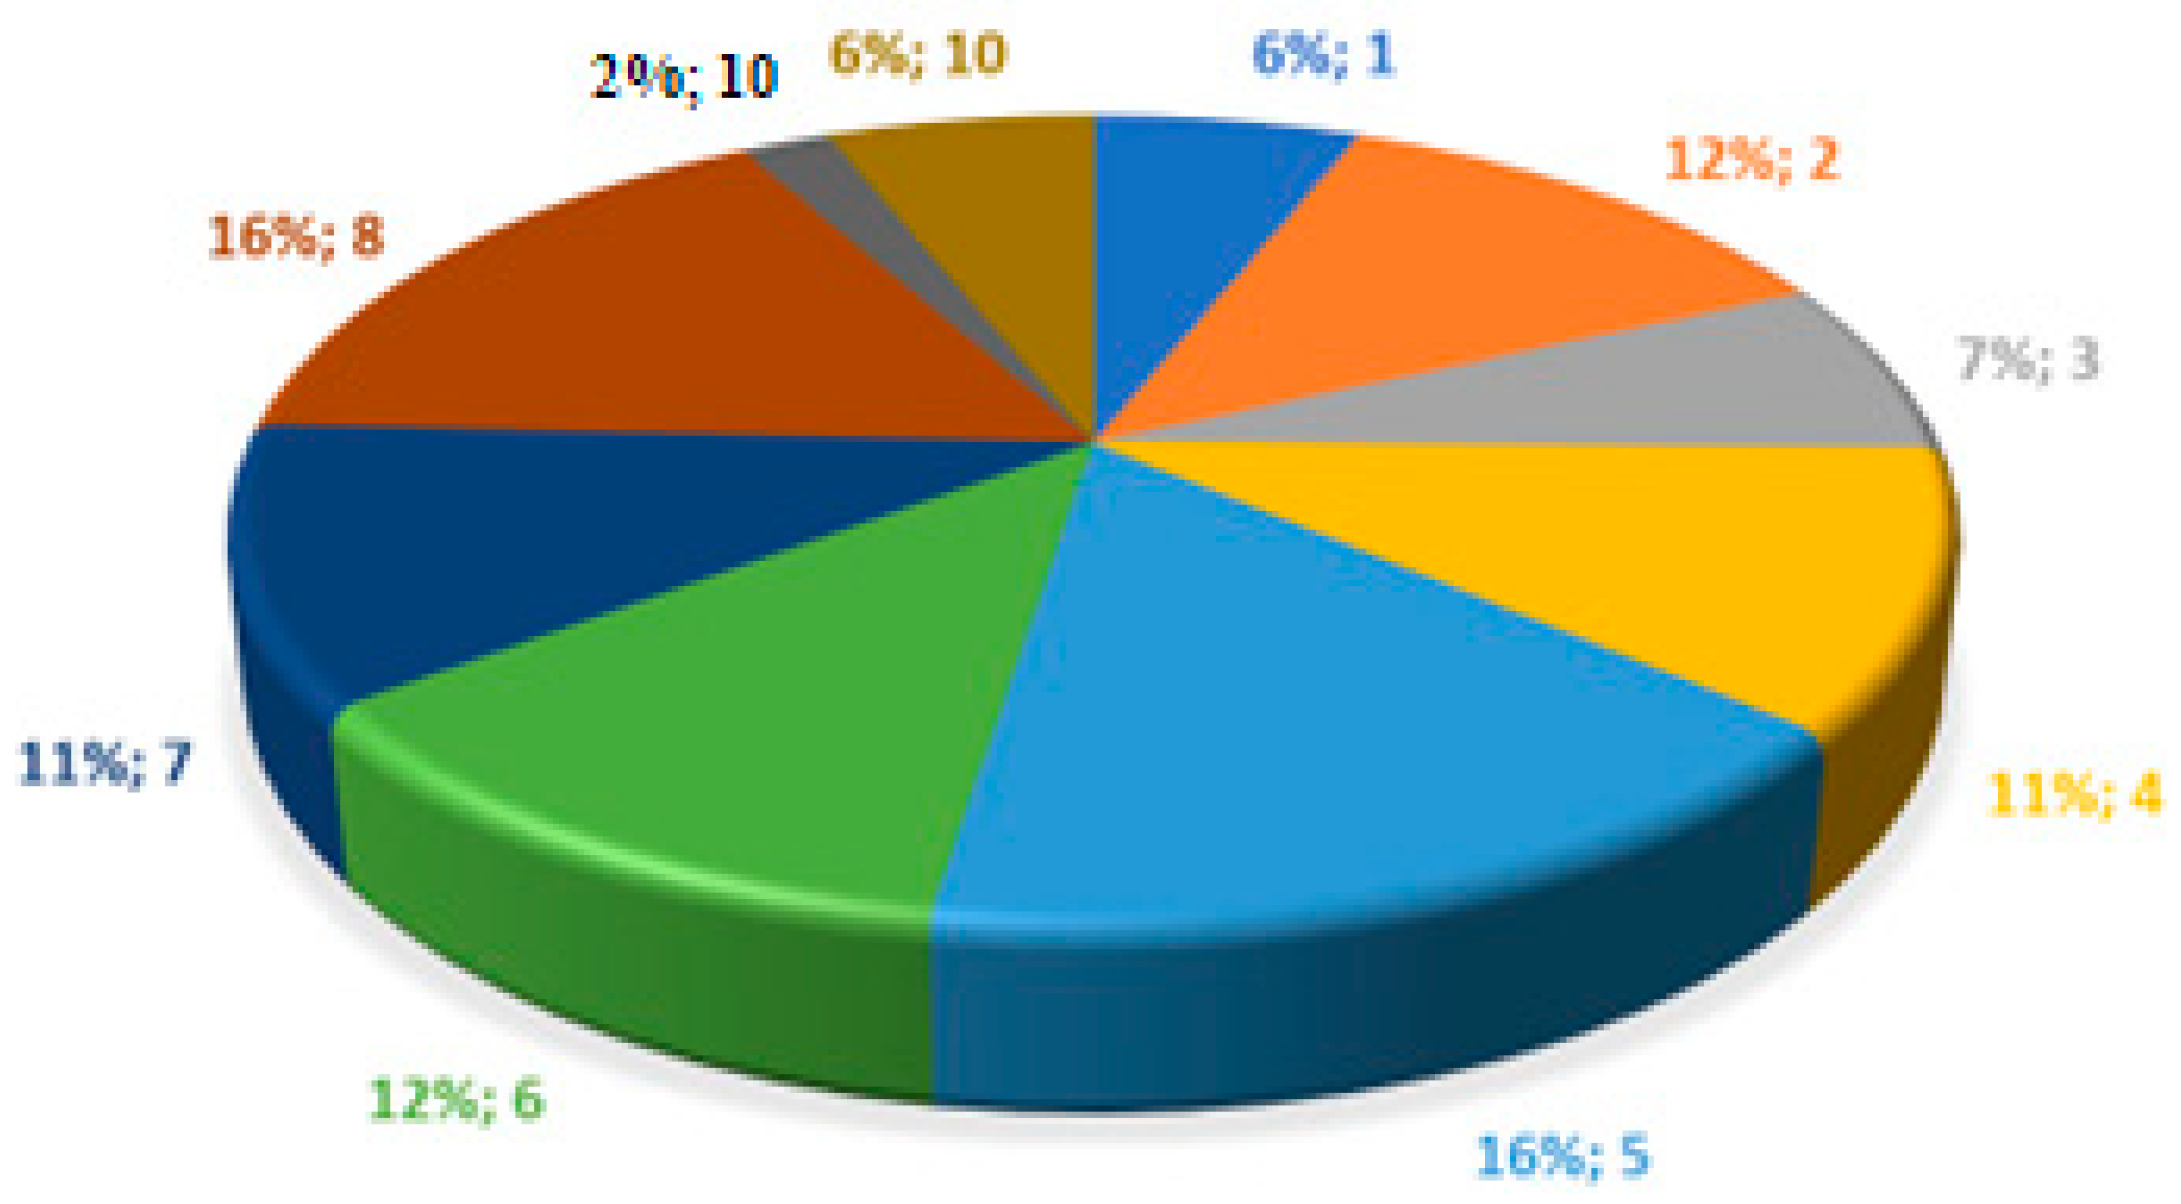
The share of failure states of the construction groups of the transport vehicles in the total failure rate of transport vehicles. Based on the documented and analyzed failure states of individual construction groups of transport vehicles, a percentage evaluation of the occurrence of failure states of individual construction groups of monitored equipment according to producers TATRA (Figure 11), SCANIA (Figure 12), and IVECO (Figure 13) is created. Due to the confirmed statement that the division into construction groups of the machine does not depend on the producer of the transport vehicle, a percentage evaluation of failure states was also created for all monitored transport vehicles (Figure 14).
Legend to Figure 11 and Figure 12: 1. Cab, controls, equipment (on-board computer/control unit, tachograph, external thermometer), 2. Sensors—electrical (safety) devices of the vehicle, 3. Engine (fuel system with tank, engine block and lower cover, cylinders, pistons, pins, connecting rods, bearings, shaft, flywheel, distributions), 4. Engine, its cooling, and lubrication, 5. Transmissions and transmission mechanisms (transmissions, couplings, shafts, joints, gearboxes, differentials, gear system), 6. Undercarriage (body, frame, shock absorbers, suspension, wheels, tires, axles, steering, brakes), 7. Hydraulic system of the machine, 8. Hydraulic crane with a log grab, 9. Trailer/semi-trailer, 10. Crossbars.
Legend to Figure 13 and Figure 14: 1. Cab, controls, equipment (on-board computer/control unit, tachograph, external thermometer), 2. Sensors—electrical (safety) devices of the vehicle, 3. Engine (fuel system with tank, engine block and lower cover, cylinders, pistons, pins, connecting rods, bearings, shaft, flywheel, distributions), 4. Engine, its cooling, and lubrication, 5. Transmissions and transmission mechanisms (transmissions, couplings, shafts, joints, gearboxes, differentials, gear system), 6. Undercarriage (body, frame, shock absorbers, suspension, wheels, tires, axles, steering, brakes), 7. Hydraulic system of the machine, 8. Hydraulic crane with a log grab, 9. Trailer/semi-trailer, 10. Crossbars.
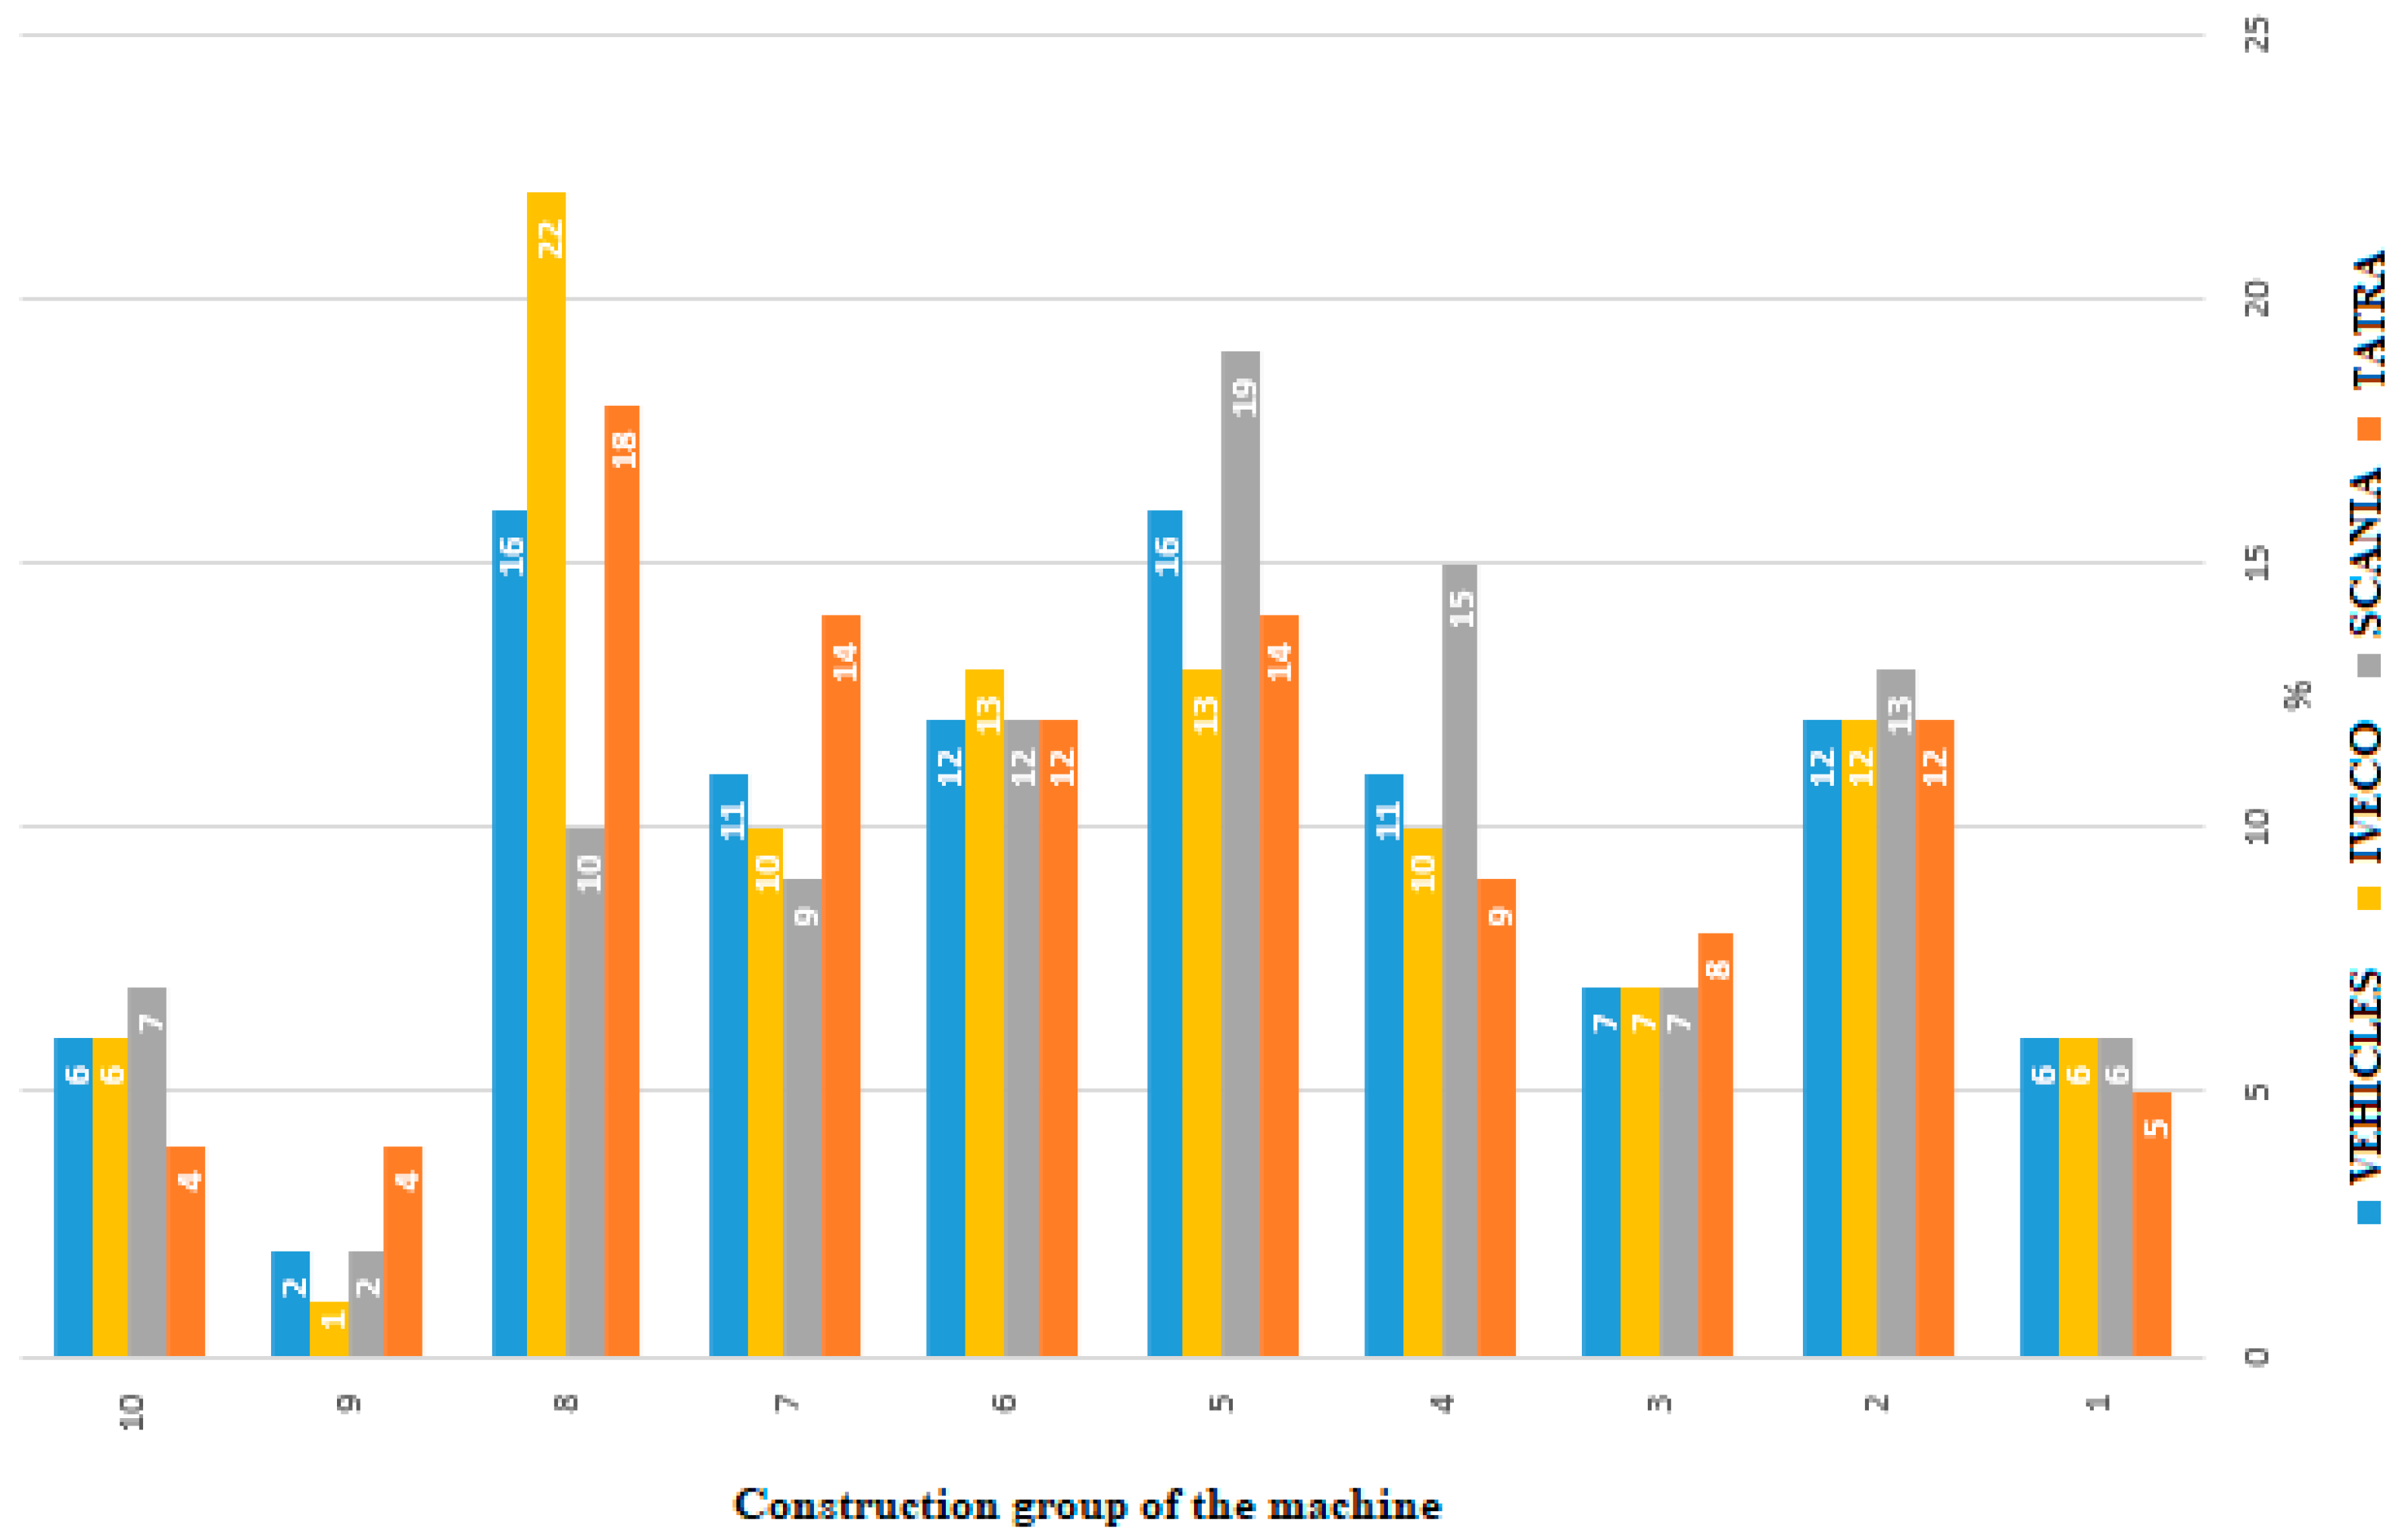
After comparing the percentage of occurrence of failure states of individual construction groups, a visible pattern is observed based on analysis of the observed producers (TATRA, IVECO, SCANIA). The highest occurrence of failure states was observed in construction groups of the engine and its cooling and lubrication, transmission and transmission mechanisms, and undercarriage.
Due to the loading and operating conditions of all three vehicle brands, the highest occurrence of failure states occurred in the construction group of hydraulic cranes with a log grab, and the lowest occurrence of failure states was observed in the construction group of trailers/semi-trailers.
For a more illustrative comparison of the obtained results, the percentage of failure states of individual construction groups is also shown in Figure 15.
Legend to Figure 15: 1. Cab, controls, equipment (on-board computer/control unit, tachograph, external thermometer), 2. Sensors—electrical (safety) devices of the vehicle, 3. Engine (fuel system with tank, engine block and lower cover, cylinders, pistons, pins, connecting rods, bearings, shaft, flywheel, distributions), 4. Engine, its cooling, and lubrication, 5. Transmissions and transmission mechanisms (transmissions, couplings, shafts, joints, gearboxes, differentials, gear system), 6. Undercarriage (body, frame, shock absorbers, suspension, wheels, tires, axles, steering, brakes), 7. Hydraulic system of the machine, 8. Hydraulic crane with a log grab, 9. Trailer/semi-trailer, 10. Crossbars.
Reliability prediction deals with the evaluation of a design prior to the actual construction of the system. It is a tool to determine as early as possible whether the equipment will be reliable enough or whether it needs further improvement to function successfully for the company [25,26].
As for the monitored transportation vehicles, it is difficult to say which of the manufacturers is the most suitable for use in the operating conditions of Slovak forestry. Each monitored transportation vehicle has its advantages and disadvantages when deployed in real conditions. If operators were to focus on the costs incurred for operating these transportation vehicles, they would spend the lowest amount of money on transportation vehicles manufactured by IVECO, followed by TATRA, and the most money on the operation of SCANIA vehicles. If the parameter for the choice of use and operation was the number of replaced parts, the smallest number of replaced parts was for transportation vehicles manufactured by IVECO, then SCANIA, and the highest number of replaced parts during the monitored period was for transportation vehicles manufactured by TATRA. If operators were to compare the number of repairs for the monitored transportation vehicles, the smallest number of repairs would be for transportation vehicles manufactured by IVECO, followed by TATRA, and the largest number of repairs would be for transportation vehicles manufactured by SCANIA.

4. Conclusions

The research presented in this study is specific in that the issue of solutions for evaluating failure states in transport vehicle operators has not been addressed in the near future. The data presented in the study are relevant for the period of three years back, which brings new knowledge on the given issue.
The results presented in the article are based on real operating values of the monitored transportation vehicles and research into the operating conditions of two Slovak companies involved in the mining and transportation process. The analyses and results represent input data for practice to improve the maintenance system and operability of the monitored transportation vehicles. Currently, operating transportation vehicles requires more than a driver’s license of the relevant group and a driver’s card. Currently, a well-trained vehicle operator can extend the operation and service life of individual structural groups of the monitored transportation vehicle.
The Ishikawa diagram is developed to evaluate failure states in transportation vehicle operators. It is important for equipment operators to be able to focus on individual elements of the work process and positively influence the operational time of transportation vehicles [27].
If we were to investigate failure states and their causes in service providers or manufacturers of the equipment, the FMEA or FTA methods would probably be more suitable for the given research. It is also required to define further methods for another study or research.
The Ishikawa diagram is a tool that can help prevent failure states of monitored transportation vehicles. In this form, it is a preventive tool for the operator, which, when used correctly, can ensure an increase in the service life of the entire transportation vehicle.
The results of the study can help Slovak companies improve their maintenance approach and save the money that can be used for forest management.

Author Contributions

Conceptualization, J.K. (Ján Kováč) and T.K.; methodology, J.K. (Ján Kováč) V.M., and J.K. (Jozef Krilek); software, T.K.; validation, J.K. (Ján Kováč), T.K., and J.K. (Ján Kováč); formal analysis, T.K. and J.K. (Ján Kováč); investigation, T.K. and J.K. (Jozef Krilek); resources, V.M.; data curation, T.K. and J.K. (Ján Kováč); writing—original draft preparation, T.K. and J.K. (Ján Kováč); writing—review and editing, J.K. (Jozef Krilek) and J.K. (Ján Kováč) and T.K.; visualization, J.K. (Ján Kováč) and T.K.; supervision, V.M., J.K. (Ján Kováč), and J.K. (Jozef Krilek); project administration, J.K. (Ján Kováč) and T.K. All authors have read and agreed to the published version of the manuscript.

Funding

This publication is the result of the project implementation—KEGA 007TU Z-4/2023 Innovation and Educational Support of Subjects in the Field of Technical Diagnostics of Agricultural and Forestry Technology with an Orientation to Practice.

Data Availability Statement

The data presented in this study are available upon request from the corresponding author for legal reasons.

Acknowledgments

For the preparation and assistance in the conception and editing of the article, we thank all collaborators and investigators of the KEGA 007TU Z-4/2023 project.

Conflicts of Interest

The authors declare no conflicts of interest.

References

  1. Kováč, J. Technika a Mechanizácia v Lesníctve; (Vysokoškolská Učebnica) 1. vyd; Technická Univerzita vo Zvolene: Zvolen, Slovakia, 2017; 345p, ISBN 978-80-228-3021-8. [Google Scholar]
  2. Kováčová, K.; Marko, J. Metóda RCM a jej Implementácia pri Údržbe a Prevádzke LKT. In COYOUS 2008: Konference Mladých Vědeckých Pracovníků, 2.4.2008; Česká Zemědělská Univerzita v Praze: Praha, Czech Republic, 2008; pp. 126–134. ISBN 978-80-213-1778-9. [Google Scholar]
  3. Kováč, J. Teória Mobilných Strojov: Riešené Úlohy a Príklady, 1st ed.; Elektronické Dokumenty (listy, články, Monografie); TU vo Zvolene: Zvolen, Slovakia, 2013; 175p, ISBN 978-80-228-2589-4. [Google Scholar]
  4. Hermann, M.; Pentek, T.; Otto, B. Design Principles for Industrie 4.0 Scenarios. In Proceedings of the 49th Hawaii International Conference on System Sciences, Koloa, HI, USA, 5–8 January 2016; pp. 3928–3937. [Google Scholar]
  5. Migdalski, J.; Bartoszewicz, J.; Bobrowski, D.; Ciechanowicz, K.; Dwilinski, L.; Jazwinski, J.; Kalinowska, H.; Kilinski, A. Probabilistic Methods in Reliability. In Reliability Handbook: Mathematical Basics; Migdalski, J., Ed.; Wema: Warsaw, Poland, 1982; p. 68. [Google Scholar]
  6. Neruda, J.; Simanov, V.; Klvač, R.; Skoupý, A.; Kadlec, J.; Zemánek, T.; Nevrkla, P. Technika a Technologie v Lesnictví—Díl První; Mendelova Univerzita v Brně: Brno, Czech Republic, 2013; 364p, ISBN 978-80-7375-839-4. [Google Scholar]
  7. Dal’skii, A.M. Tekhnologicheskoe Obespechenie Nadezhnosti Vysokotochnykh Detalei Mashin; Mashinostroenie: Moskva, Rusko, 1975. [Google Scholar]
  8. Samoilenko, D.; Marčenko, A.; Cho, H.M. Zlepšenie krútiacich a výkonových charakteristík dieselového motora typu V použitím novej konštrukcie turbodúchadla s variabilnou geometriou (VGT). J. Mech. Sci. Technol. 2017, 31, 5021–5027. [Google Scholar] [CrossRef]
  9. Al-Duais, F.S.; Mohamed, A.; Jawa, T.M.; Sayed-Ahmed, N. Optimal Periods of Conducting Preventive Maintenance to Reduce Expected Downtime and Its Impact on Improving Reliability. Comput. Intell. Neurosci. 2022, 2022, 7105526. [Google Scholar] [CrossRef] [PubMed]
  10. Basri, E.I.; Razak, I.H.A.; Ab-Samat, H.; Kamaruddin, S. Preventive maintenance (PM) planning: A review. J. Qual. Maint. Eng. 2017, 23, 114–143. [Google Scholar] [CrossRef]
  11. Sgarbossa, F.; Zennaro, I.; Florian, E.; Calzavara, M. Age replacement policy in the case of no data: The effect of Weibull parameter estimation. Int. J. Prod. Res. 2020, 58, 5851–5869. [Google Scholar] [CrossRef]
  12. Gao, W.; Ji, H.; Wang, Y.; Yang, T. A nonlinear preventive maintenance model with an environmental factor-based Weibull distribution. IOP Conf. Ser. Mater. Sci. Eng. 2019, 521, 012009. [Google Scholar] [CrossRef]
  13. Zhu, L.; Shan, M.; Hwang, B.G. Overview of design for maintainability in building and construction research. J. Perform. Constr. Facil. 2018, 32, 04017116. [Google Scholar] [CrossRef]
  14. Chew, Y.L.M.; Asmone, A.; Conejos, S. Design for Maintainability: Benchmarks for Quality Buildings; World Scientific Publishing: Singapore, 2018; ISBN 978-981-323-059-0. [Google Scholar] [CrossRef]
  15. Khalek, I.A.; Chalhoub, J.; Ayer, S.K. Indicators of effective design for maintainability in conceptual design. In AEI 2019: Integrated Building Solutions—The National Agenda; American Society of Civil Engineers: Reston, VA, USA, 2019; pp. 309–315. [Google Scholar]
  16. Stejskal, T. Modely Vzniku Porúch vo Výrobných a Robotických Systémoch. Acta Mech. Slovaca 2008, 12, 601–606. [Google Scholar]
  17. Moubray, J. Reliability-Focused Maintenance; Butterworth-Heinemann Oxford: Oxford, UK, 1997. [Google Scholar]
  18. Drożyner, P.A.; Mikołajczak, P. Údržba vozidiel, strojov a zariadení z hľadiska požiadaviek ISO9001. Udržiavať. Reliab. Reliab. 2007, 4, 55–598. [Google Scholar]
  19. Biban, L.K.; Dhounchak, D.; Shakti. 8D Methodology: From Concept to Application Across Manufacturing Indus tries. Int. J. Sci. Res. Sci. Eng. Technol. 2017, 3, 558–563. [Google Scholar]
  20. Müller, M. Maintenance Success Control (Key Figures and Controlling in Maintenance); Eksploatacja i Niezawodność–Maintenance and Reliability. No. 4/2007; Polish Maintenance Society: Warsaw, Poland, 2007. [Google Scholar]
  21. American Society for Quality, Fishbone Diagram. Available online: https://asq.org/quality-resources/fishbone (accessed on 2 June 2025).
  22. Ishikawa, K.; Loftus, J.H. (Eds.) Introduction to Quality Control; 3A Corporation: Tokyo, Japan, 1990. [Google Scholar]
  23. Dai, W.; Sun, J.; Chi, Y.; Lu, Z.; Xu, D.; Jiang, N. Review of Machining Equipment Reliability Analysis Methods based on Condition Monitoring Technology. Appl. Sci. 2019, 9, 2786. [Google Scholar] [CrossRef]
  24. STN 01 0606:1980; Spoľahlivosť v Technike, Postup voľby Nomenklatúry Normovaných Ukazovateľov Spoľahlivosti. UNMS SR: Bratislava, Slovakia, 1980.
  25. Pacaiova, H.; Izarikova, G. Base Principles and Practices for Implementation of Total Productive Maintenance in Automotive Industry. Qual. Innov. Prosper. 2019, 23, 45–59. [Google Scholar] [CrossRef]
  26. Manshin, Y.P.; Manshina, E.Y. Problems of Parts Reliability in the Design of Mechanical System. State Tech. Univ. Ser. Mech. Eng. 2019, 5, 56. [Google Scholar] [CrossRef]
  27. Paraschivescu, A.O. Managementul Calitatii; Tehnopress Publishing: Iasi, Romania, 2006; pp. 155–156. [Google Scholar]
Figure 1. Ishikawa diagram for the cabin, controls, instrumentation (on-board computer/control unit, tachograph, outside thermometer).
Applsci 15 10221 g001
Figure 2. Ishikawa diagram for sensors—vehicle electrical and safety devices.
Applsci 15 10221 g002
Figure 3. Ishikawa diagram for an engine (fuel system with tank, engine block and bottom cover, cylinders, pistons, pins, connecting rods, bearings, shaft, flywheel, timing belts).
Applsci 15 10221 g003
Figure 4. Ishikawa diagram for the engine, its cooling, and lubrication.
Applsci 15 10221 g004
Figure 5. Ishikawa diagram for transmissions and transmission mechanisms (gearboxes, clutches, shafts, joints, transfer cases, differentials, distributions).
Applsci 15 10221 g005
Figure 6. Ishikawa diagram for chassis (body, frame, shock absorbers, suspension, wheels, tires, axles, steering, brakes).
Applsci 15 10221 g006
Figure 7. Ishikawa diagram for hydraulic systems of machines.
Applsci 15 10221 g007
Figure 8. Ishikawa diagram for a trailer/semi-trailer hydraulic log grab crane.
Applsci 15 10221 g008
Figure 9. Ishikawa diagram for hydraulic log grab crane.
Applsci 15 10221 g009
Figure 10. Ishikawa diagram for stanchion curtain, stanchions.
Applsci 15 10221 g010
Figure 11. The percentage of occurrence of a failure state of individual construction groups—producer TATRA.
Applsci 15 10221 g011
Figure 12. The percentage of occurrence of a failure condition of individual construction groups—producer SCANIA.
Applsci 15 10221 g012
Figure 13. The percentage of occurrence of a failure state of individual construction groups—producer IVECO.
Applsci 15 10221 g013
Figure 14. The percentage of occurrence of a failure state of individual construction groups.
Applsci 15 10221 g014
Figure 15. The percentage of occurrence of a failure state of individual construction groups.
Applsci 15 10221 g015
Table 1. Characteristics of the subject of research.
VehicleProduct ClassOperational
Regime
Reliability
Group
Limitation of Usage Time
IVECOCode 3:
Refurbished products
General:
The periods of activity and waiting alternate randomly. The regularity of the alternation cannot be determined either because of the operating conditions or because the operating conditions vary for different specimens of the same type of product
II:
Material damage from unfulfilled task or downtime, equal to the value of the product
Planned:
The use of most objects of a given type is interrupted (the object is decommissioned, comes in for repair, or is written off) at a certain operating time or after a specified period of time has passed following the task’s completion.
Forced:
The use of all objects of a given type is interrupted in connection with a failure of the object or if the assessment of the technical condition indicates that a failure will soon occur, or that the object has reached a limit state, or everything indicates that the object is not fulfilling certain tasks.
SCANIACode 3: Refurbished productsGeneral:
The periods of activity and waiting alternate randomly. The regularity of the alternation cannot be determined either because of the operating conditions or because the operating conditions vary for different specimens of the same type of product
II:
Material damage from unfulfilled task or downtime, equal to the value of the product
Planned:
The use of most objects of the given type is interrupted (the object is decommissioned or comes for repair or is written off) at a certain operating time or after a certain period of time has passed after the task has been completed.
Forced:
The use of all objects of a given type is interrupted in connection with a failure of the object or if the assessment of the technical condition indicates that a failure will soon occur, or that the object has reached a limit state, or everything indicates that the object is not fulfilling certain tasks.
TATRACode 3: Refurbished productsGeneral:
the periods of activity and waiting alternate randomly. The regularity of the alternation cannot be determined either because of the operating conditions or because the operating conditions vary for different specimens of the same type of product
II:
Material damage from unfulfilled task or downtime, equal to the value of the product
Planned:
The use of most objects of a given type is interrupted (the object is decommissioned or comes for repair or is written off) at a certain operating time or after a certain period of time has passed after the task has been completed.
Forced:
The use of all objects of a given type is interrupted in connection with a failure of the object or if the assessment of the technical condition indicates that a failure will soon occur, or that the object has reached a limit state, or everything indicates that the object is not fulfilling certain tasks.
Trailers, semi-trailersCode 3: Refurbished productsCyclical:
Periods of activity and waiting alternate with constant cyclicality
III:
Material damage from unfulfilled task or downtime, equal to the value of the product
Planned:
The use of most objects of a given type is interrupted (the object is decommissioned or comes for repair or is written off) at a certain operating time or after a certain period of time has passed after the task has been completed.
Forced:
The use of all objects of a given type is interrupted in connection with a failure of the object or if the assessment of the technical condition indicates that a failure will soon occur, or that the object has reached a limit state, or everything indicates that the object is not fulfilling certain tasks.
Disclaimer/Publisher’s Note: The statements, opinions and data contained in all publications are solely those of the individual author(s) and contributor(s) and not of MDPI and/or the editor(s). MDPI and/or the editor(s) disclaim responsibility for any injury to people or property resulting from any ideas, methods, instructions or products referred to in the content.