Abstract
This study addresses the task of simultaneous age estimation and gender classification from facial images using convolutional neural networks (CNNs). The objective was to develop a unified model capable of handling both regression and classification tasks effectively. Four models with varying architectures, loss functions, and preprocessing strategies were implemented and evaluated. The best-performing model achieved over 90% accuracy in gender classification and a mean absolute error (MAE) below four years for age estimation. Performance analysis showed variation across age groups, with reduced accuracy for elderly individuals due to dataset imbalance and improved predictions for younger and middle-aged adults. To assess generalization, the model was also tested on external images, maintaining strong performance, particularly in gender classification. Challenges such as overfitting and face misdetection were addressed through preprocessing adjustments and model tuning. Beyond empirical results, this work consolidates a unified, reproducible protocol for joint age estimation and gender classification on a widely used face database. We standardize preprocessing, implement a consistent image-level split with a published seed, and define task-appropriate metrics. All training details are documented to provide a baseline, enhanced by a qualitative error analysis, enabling consistent reporting and facilitating future extensions. This approach demonstrates the effectiveness of CNNs for age and gender prediction and highlights their potential integration into recommendation systems that personalize content based on demographic attributes.
1. Introduction
In recent years, the rapid development of artificial intelligence techniques has enabled the design and training of increasingly advanced learning models, both in supervised and unsupervised settings. The basis of model learning is the recognition of patterns and dependencies within input data. These models, trained on large datasets with similar characteristics, are capable of identifying and internalizing distinctive features. In the case of facial images, such features may include the eyes, nose, wrinkles, or jawline contours. The deeper the model architecture, the more complex and abstract the features it can extract and analyze. Artificial intelligence often attempts to emulate human learning mechanisms. However, unlike humans, AI systems require vast amounts of training data and significant computational resources to achieve satisfactory results.
One of the interesting application areas of machine learning is the recognition of age and gender based on facial images. Age estimation, in particular, is a challenging task due to the fact that a person’s apparent age may differ significantly from their biological age. Factors such as lifestyle, access to healthcare, sun exposure, and genetic predispositions all affect how age is perceived, making even human judgments prone to errors. In contrast, recognizing a person’s biological gender is generally easier, except in the case of infants and very young children. For a computational model, gender recognition is a binary classification problem and thus inherently simpler than age estimation, which often involves regression. The potential applications of age and gender recognition systems are wide, ranging from entertainment and marketing to forensic identification and access control in security systems.
We present our main findings: on UTKFace, the reference model achieves age MAE = 3.82, gender accuracy = 93.5%, and total loss = 3.99 under a single, fully specified protocol. We refrain from cross-paper rankings and report within-protocol results only. To ensure full reproducibility and like-for-like comparison, Section 3.7 specifies all evaluation choices (preprocessing, the published-seed split, metrics, and training settings), with a reproducibility checklist.
This work does not seek architectural novelty. Instead, we provide a well-founded baseline under a single, fully specified evaluation protocol for the face dataset. By standardizing preprocessing, identity safe splitting, and metrics, and documenting training details, we enable reproducible comparisons and provide a reliable reference for future improvements. We complement this with transparent reporting and qualitative error analysis to inform practical deployments in real-world applications.
2. Related Work
Among the most common approaches in the literature are convolutional neural networks (CNNs), which automatically learn relevant representations from image data. For example, Levi and Hassner [1] applied CNNs to the classification of age (in eight five-year intervals) and gender (male/female) using the Adience benchmark dataset. Their proposed architecture consists of three convolutional layers followed by two fully connected layers. The model achieved an accuracy of 86.8% for gender classification and 50.7% for exact age group prediction (or 84.7% when allowing one-off errors in age grouping).
A different approach was taken by Ranjan et al. [2], who focused on age estimation using regression with CNNs. They used the ChaLearn LAP dataset from ICCV 2015 [3] and proposed a hierarchical architecture that includes additional submodels dedicated to extreme age groups. The input images were preprocessed by scaling, conversion to grayscale, and alignment based on eye and nose positions. The network utilized PReLU activation functions and dropout layers with decreasing intensity across layers.
In parallel, Smith and Chen [4] explored transfer learning with VGG-based models pretrained on ImageNet and VGGFace. Their hierarchical framework first predicted gender and subsequently estimated age separately for male and female subsets. This setup improved performance over single-stream models, achieving ≈98.6% gender accuracy and an age MAE of 4.1 on MORPH-II, demonstrating the benefits of multi-stage pipelines.
In addition to deep learning-based approaches, geometry-based methods have also been proposed. For instance, Tin [5] used anthropometric feature extraction, such as the distances between the eyes, nose, and mouth, combined with principal component analysis (PCA) for age and gender classification. These geometry-based approaches rely on modeling the proportions of the face and comparing them with statistical facial templates for different age groups.
Another significant contribution is the work of Zhang et al. [6], who presented a hierarchical hybrid model that incorporates facial aging features. Their method included texture extraction using center-symmetric local binary patterns (CS-LBP), wrinkle analysis using Canny edge detection, and classification through the k-nearest neighbors (KNN) algorithm. By combining age group classification with numerical regression, they achieved a low mean absolute error (MAE = 4.89), demonstrating the effectiveness of their hybrid strategy.
More recent studies have emphasized that progress in facial age/gender prediction is often confounded by heterogeneous evaluation protocols. For example, systematic critiques show that cross-paper gains may arise from differences in alignment, facial coverage, input resolution, backbone choice, pretraining data, or unpublished/undocumented splits rather than intrinsically better methods, strengthening the case for standardized protocols and transparent reporting.
Paplham and Franc [7] provide a systematic critique showing that cross-paper gains frequently stem from differences in alignment, facial coverage, image resolution, backbone choice, pretraining data, or unpublished splits rather than genuinely better methods. They define a proper protocol, run a unified benchmark, and show that method-to-method differences shrink once the protocol is controlled.
This directly supports our decision to emphasize standardization and transparent reporting over architectural novelty.
Complementary to this, Shin et al. [8] framed age estimation explicitly as an ordinal regression task, thereby modeling age as an ordered variable rather than a categorical bin. Their evaluation across MORPH II, FG-NET, UTKFace, and CLAP2015 established the state-of-the-art MAE results (e.g., MAE = 2.00 on MORPH II), but they did not address gender prediction. This highlights the diversity of formulations—classification, regression, and ordinal regression—used in age modeling.
On UTKFace specifically, recent CNN-based studies illustrate why direct number-to-number comparisons can be misleading. Dey et al.low [9] report gender accuracy ≈96.3% and age accuracy ≈81.96% when the age task is framed as classification into bins-a setup that is not directly comparable to our age regression objective.
Beyond UTKFace, contemporary architectures focus on design patterns rather than single-task state-of-the-art claims. Bekhouche et al. [10] propose a multi-stage DNN (benchmarked on MORPH2, CACD, AFAD) and compare against modern backbones such as EfficientNet and MobileNetV3-useful as a blueprint for compact, deployable models and training practices. Kim et al. [11] show that knowledge distillation can substantially reduce model complexity while preserving (and often improving) accuracy: on UTKFace, MobileNetV3-Large after distillation attains MAE = 5.00, gender accuracy = 96.23%, and Cumulative Score at 5 = 62.05%, with reductions of 84.94% in parameters and 96.79% in GFLOPs relative to the VOLO-D1 teacher. The authors also report gains in a cross-demographic scenario (IMDB-Clean - Asian data), underscoring KD as a practical extension for our baseline in Future Work. A. Swaminathan et al. [12] tackled gender categorization using face embeddings: feature vectors from a pretrained FaceNet model-typically used for recognition rather than demographic prediction-were fed to standard machine-learning classifiers. Using k-nearest neighbors (KNN) on UTKFace, they reported 97% gender accuracy.
The analysis of these different approaches has provided a deeper understanding of the strategies used for age and gender recognition, including differences in model architectures (CNN, ASM, PCA), input data formats (RGB, grayscale, normalized), and methodological frameworks (classification vs. regression). Key preprocessing techniques and strategies for addressing data imbalance were also identified. Based on the literature review and comparative results, this study adopts a CNN-based approach, which is the most extensively documented and empirically effective method found in current research.
As summarized in Table 1, state-of-the-art results range from MAE ≈ 2.0 on MORPH-II [8] to ≈5.0 on UTKFace with lightweight distilled models [11], while gender classification typically exceeds 95% accuracy across datasets, with Adience benchmarks reaching 98.2% [13].

Table 1.
Reference results on age estimation and gender classification.
3. Implementation of the Proposed Solution
Based on the literature review and theoretical analysis, a convolutional neural network was selected as the model capable of simultaneously performing two tasks: gender classification and age regression. This dual-task approach allows for the effective use of common facial features relevant to both predictive tasks. The following section provides a comprehensive overview of the implementation process. It discusses the adopted methods, technical assumptions, and programming solutions used to achieve the research objectives, with a particular focus on the model architecture, data preprocessing pipeline, training procedure, and evaluation of the network’s performance.
3.1. Motivation and Research Gap
Age estimation and gender recognition from faces are widely studied, yet results on common datasets remain difficult to compare because studies adopt heterogeneous evaluation protocols: different split policies (often without explicit identity control), input resolutions and preprocessing, task formulations for age (classification into bins vs. regression), and metric choices. For UTKFace, in particular, a unified, fully specified baseline for the joint task (age regression + gender classification), with a published split and complete training details, is missing. This paper addresses that gap by providing a transparent, reproducible protocol and a documented reference baseline that others can cite and extend under identical conditions.
3.2. Dataset Selection and Analysis
The UTKFace dataset was selected for training the convolutional neural network model [15]. This dataset contains nearly 24,000 facial images and was chosen due to its well-structured organization and the inclusion of essential metadata, namely, age and gender labels assigned to each image. An additional advantage is that the images are already pre-cropped and aligned, minimizing the need for extensive preprocessing. All images are standardized to a resolution of 200 × 200 pixels.
Before training, the dataset was manually reviewed and cleaned. Approximately 150 incorrect or invalid images were removed, as their inclusion could have negatively impacted the model’s learning process. Figure 1a shows examples of removed images, which included mislabeled files, improper cropping, cartoon-like drawings, or images that were excessively blurred. After this curation step, the dataset contained 23,556 valid images.
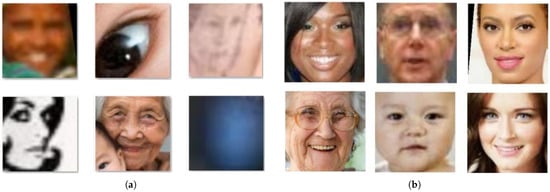
Figure 1.
Sample images from the dataset: (a) removed from the final dataset; (b) examples used in the final dataset.
To better understand the dataset’s structure, several visualizations were created. Figure 2 illustrates the overall age distribution of individuals, while Figure 3 shows the distribution of gender across different age groups. Additionally, Figure 4 presents age distribution separately for males and females in the dataset used in this study. The shapes of the distributions reveal differences in both central tendency and dispersion between the two genders. The age distribution for males exhibits a wider range, extending to approximately 90 years. Its density indicates the presence of several peaks, suggesting multiple dominant age clusters, particularly in adulthood and older age groups. The median age for males appears to be significantly higher than that of females. In contrast, the age distribution for females is more concentrated, with most individuals grouped around younger and middle-aged categories. The maximum observed age is lower than in the male group, and the distribution is less uniform, which may indicate overrepresentation in specific age intervals. This characteristic suggests that the model may demonstrate lower precision when estimating the age of elderly female individuals.
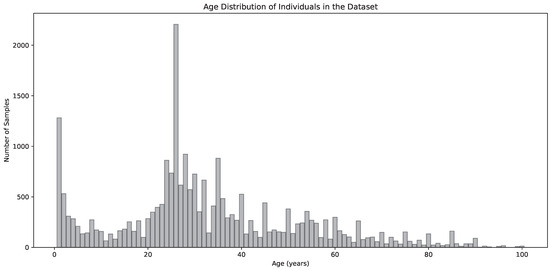
Figure 2.
Age distribution of individuals in the dataset.
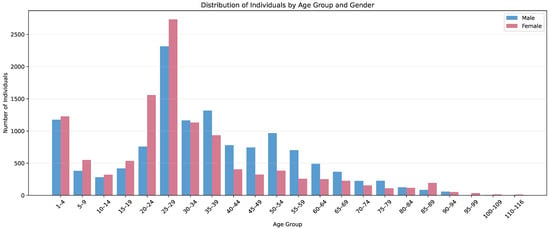
Figure 3.
Distribution of the number of individuals of each gender within specific age groups.
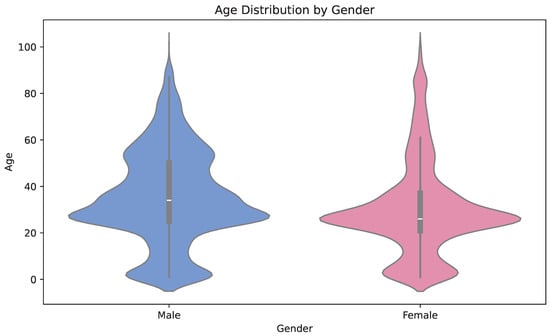
Figure 4.
Age distribution by gender.
The analysis of these visualizations reveals that the most frequent age group in the dataset is 25–29 years, with age 26 being the most common. A noticeable decrease in frequency begins around the 60–64 age group. The overall gender distribution is relatively balanced, with a minor discrepancy of a few percentage points. However, within individual age groups, the number of individuals of one gender can be up to twice that of the other, particularly in the oldest age groups, where women are significantly overrepresented.
When compared with the global population pyramids [16], the dataset demonstrates a similar trend: younger age groups are more populous, while the number of individuals decreases progressively with age. The gender ratio also remains close to 50% for both genders. Considering that the dataset includes individuals from various ethnic backgrounds across the world, it may be regarded as a reasonably reliable reflection of the global demographic structure. Figure 1b displays sample images from the dataset. As shown, the images differ in lighting conditions, color saturation, and sharpness. Subjects also display different facial expressions and head orientations. All these factors may influence the model’s ability to accurately learn and predict age and gender.
3.3. Preprocessing of Facial Images
To prepare the dataset for training the convolutional neural network model, several preprocessing steps were performed. These included reading the file structure, parsing age and gender labels from filenames, tensorizing face crops into normalized grayscale arrays, and standardizing shapes and data types. In the initial stage, age and gender information were extracted directly from the filenames and stored in dedicated auxiliary lists, such as image paths, age labels, and gender labels. This process resulted in a complete mapping between each image path and its corresponding labels.
Next, all images were converted to grayscale, reducing the number of color channels, which decreased the overall data size. To improve processing efficiency, each image was resized to 144 × 144 pixels. The resulting pixel matrices were then stored in a list, representing the extracted visual features for model training.
The vectors representing age, gender, and image features were converted into arrays, which improves memory and computational efficiency. The image data were then reshaped into a four-dimensional array with the dimensions (number of samples, height, width, channels). To facilitate the neural network’s learning process, pixel intensity values were normalized to the range [0.0, 1.0]. Figure 5 presents sample preprocessed images along with their corresponding age and gender labels.
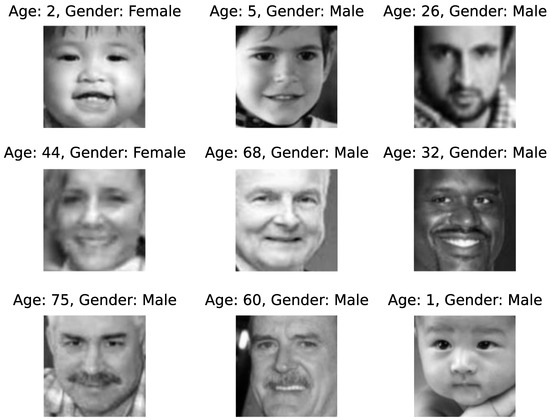
Figure 5.
Sample images from the dataset after preprocessing.
To preserve a fixed, reproducible baseline, we disable data augmentation, and future extensions will assess light geometric and photometric transforms under the same protocol.
3.4. Construction of the Convolutional Neural Network
As mentioned in the previous sections, several convolutional neural network (CNN) models were trained, each with a slightly modified architecture compared with the previous one. This iterative approach was intended to identify the configuration yielding the best predictive performance.
The overall structure of the first model developed for the dual-task learning of age estimation and gender classification is presented in Figure 6. The model processes grayscale facial images of resolution 144 × 144 pixels and consists of a shared convolutional base, followed by two task-specific output branches.
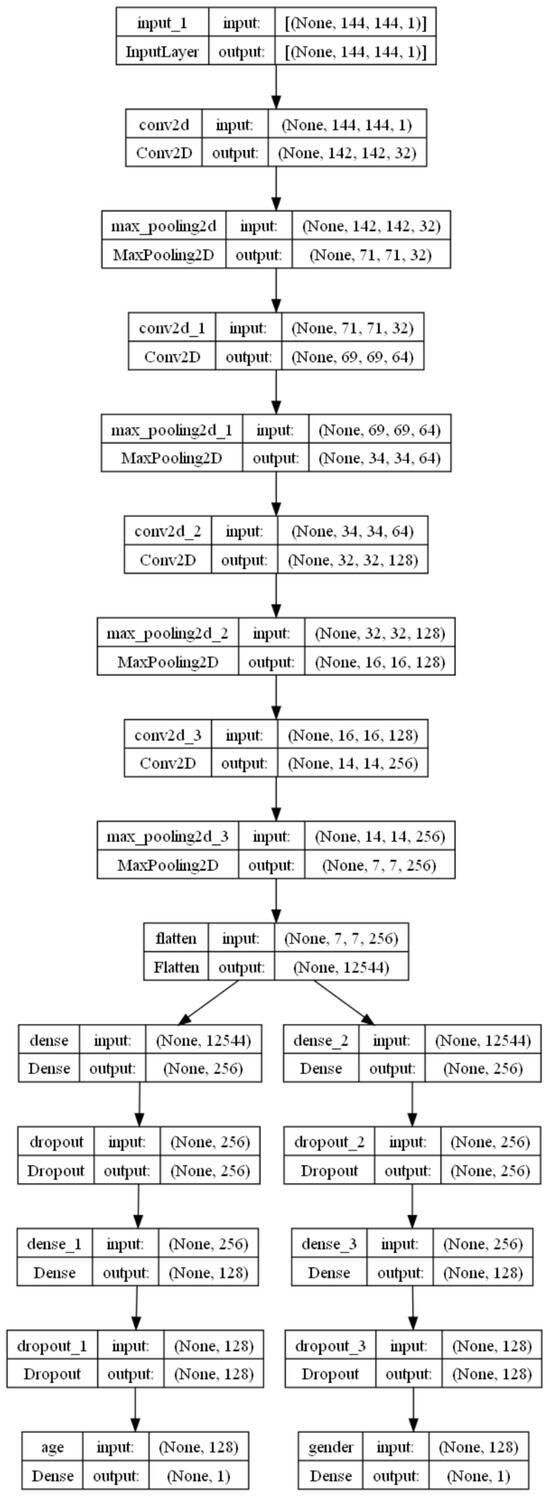
Figure 6.
Architecture of the model designed for age and gender prediction.
The model follows a sequential structure, meaning all layers are added one after another, starting from the input layer and ending with the output layer. The construction begins with the input layer, where the image dimensions are defined. Following the input, four convolutional layers are added sequentially, each followed by a max-pooling layer. The number of filters doubles with each convolutional layer, starting with 32 filters in the first layer and reaching 256 in the fourth. All convolutional layers use the ReLU activation function and a kernel size of 3 × 3. Max-pooling layers apply a pooling size of 2 × 2 with a stride of 2.
After the last convolutional block, a flattening layer follows the final convolutional layer, converting the multidimensional output into a one-dimensional vector. According to the model assumptions described in the previous section, the architecture is designed to perform two tasks simultaneously: age estimation and gender classification. To achieve this dual-task learning, the architecture splits into two separate branches after the flattening layer, one for each task.
Each branch consists of three fully connected (Dense) layers. The first two layers are preceded by dropout layers to prevent overfitting. Dropout rates are set to 0.35 and 0.25 for the first and second dense layers, respectively, meaning that 35% and 25% of neuron connections are randomly deactivated during training. Both branches share the same dense architecture: 256 neurons in the first dense layer, 128 in the second, and 1 neuron in the output layer.
Each output layer returns a single value. The age estimation branch uses ReLU activation function to produce a non-negative continuous output. The gender classification branch uses a sigmoid activation function, appropriate for binary classification tasks (male vs. female).
The model is finalized by specifying its inputs and outputs and compiling it with appropriate training parameters. The Adam optimizer (Adaptive Moment Estimation) was selected due to its efficiency, low memory footprint, and effectiveness in training deep learning models on large datasets [17].
The model utilizes mean absolute error (MAE) as the loss function for age regression and binary cross-entropy for gender classification. Corresponding evaluation metrics are MAE for the regression task and classification accuracy for the binary task.
The input layer receives images in the shape of (144, 144, 1), representing a single grayscale channel. The feature extraction component consists of four convolutional blocks, each comprising a 3 × 3 convolutional layer with ReLU activation followed by a 2 × 2 max-pooling operation with a stride of 2. The number of convolutional filters increases from 32 to 256 across these blocks, enabling the model to learn hierarchical features of increasing complexity. The final pooling layer, the resulting feature map of shape (7, 7, 256) is then flattened into a vector of length 12,544. This vector serves as the input to two parallel branches, each corresponding to two prediction tasks. The age estimation branch includes two fully connected layers with 256 and 128 neurons, interleaved with dropout layers (dropout rates of 0.35 and 0.25). The final output layer is a single neuron with ReLU activation, providing a non-negative continuous estimate of age.
The gender classification branch mirrors this structure, also utilizing two dense layers with 256 and 128 neurons and the same dropout configuration. Its output layer is a single neuron with sigmoid activation, returning a probability score for gender classification.
This multi-output architecture allows the model to learn a shared internal representation of facial features while simultaneously optimizing for two complementary tasks. The use of dropout in the dense layers serves as a regularization technique, helping to reduce overfitting and improve generalization. The architectural design balances depth and computational efficiency, making it suitable for training on moderate-sized datasets.
3.5. Training Process
Before initiating the actual training process, the prepared dataset was divided into a training set and a validation set. This division was performed randomly but in a controlled manner to ensure repeatability of experiments and to allow for meaningful comparisons between different model configurations. The validation set accounted for 25% of the total dataset. The training process involved repeatedly presenting the model with batches of 32 samples, which helped optimize the learning procedure while maintaining computational efficiency. The training was conducted over 30 complete cycles (epochs), during which the model iteratively adjusted its parameters based on the training data while continuously evaluating its performance on the validation set. After the training phase was completed, the final model was saved to a file, making it available for future use. This includes both final testing and practical applications such as predicting age and gender from previously unseen facial images.
During the training of the first model, it was observed that the first epoch took significantly longer to complete compared with the subsequent ones. This is a typical behavior, as the initial epoch includes tasks such as model compilation and the initialization of internal computational structures. Throughout the training process, the system calculates the loss values, the Mean Absolute Error (MAE), and the prediction accuracy separately for both the training and validation datasets in each epoch. This approach enables continuous monitoring of the model’s learning progress and provides insights into its ability to generalize beyond the training data.
Throughout the 30 training epochs, a steady improvement was observed in both the age prediction and gender classification tasks. Several trends emerged from the training logs:
- In the initial epochs, particularly after epoch 1, the age MAE dropped from approximately 15.7 to 11.8, while the gender classification accuracy increased from 54% to over 76%. This indicates that the model quickly learns basic patterns in the data.
- As training progressed, the age MAE on the training data continued to decrease, reaching approximately 4.5 by the final epoch. On the validation set, the MAE stabilized around 6.5, suggesting reasonable generalization. However, the gap between training and validation performance indicates a mild degree of overfitting.
- The gender classification branch maintained strong performance through training. By epoch 30, classification accuracy reached 93% on the training set and 89% on the validation set. The model generalizes well in this branch, and the accompanying decrease in gender MAE confirms this stability.
Figure 7, Figure 8 and Figure 9 illustrate the training history of the convolutional neural network for the first model. The plots present the evolution of the loss function, Mean Absolute Error (MAE), and classification accuracy over successive training epochs, separately for the training and validation datasets. For the training set, all metrics indicate steady improvement, reflecting effective model learning. However, for the validation set, the MAE and loss values initially decrease but then stabilize or slightly increase in later epochs. This behavior may indicate the onset of overfitting—a situation where the model can no longer generalize beyond the training data. In the subsequent models, specific strategies were implemented to address this issue, as discussed in the following sections. Figure 7 presents the Mean Absolute Error (MAE) for the age regression task during training of the first model. A consistent decrease in error is observed for the training data. For the validation data, the error initially declines, stabilizes around epochs 10–15, and then gradually increases, indicating potential overfitting.
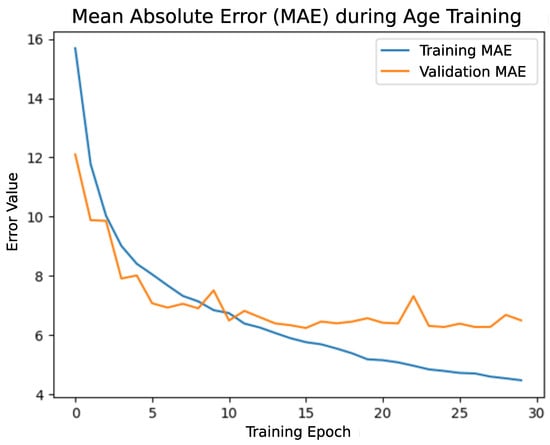
Figure 7.
Training history of the first model—MAE for age.
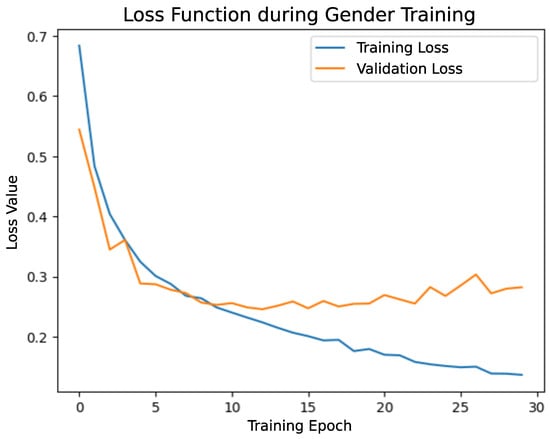
Figure 8.
Training history of the first model—loss function for gender.
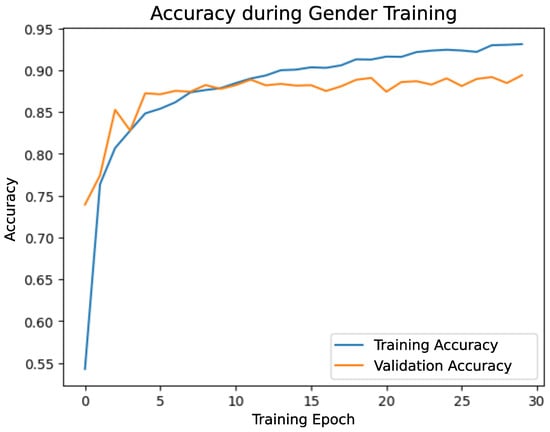
Figure 9.
Training history of the first model—accuracy for gender.
Figure 8 shows the loss function for the gender classification task during training of the first model. While the training loss continuously decreases, the validation loss remains stable before rising in later epochs, a typical sign of overfitting.
In Figure 9, the classification accuracy for gender prediction is shown. Accuracy improves rapidly for both training and validation datasets in the early epochs. After epoch 10, training accuracy continues to improve, while validation accuracy flattens, further confirming signs of overfitting.
The selected plots were chosen because they provide critical insight into the model’s learning behavior and performance over time. They allow for a visual assessment of how well the network learns from the training data and whether it generalizes effectively to unseen data. Specifically, the Mean Absolute Error (MAE) for the age regression task, the loss function values, and the gender classification accuracy represent key performance indicators for this dual-output architecture. Monitoring these metrics throughout the training process allows for the identification of learning trends, such as overfitting, and helps assess the overall effectiveness and reliability of the model’s training.
The divergence between training and validation error in the age prediction task underscores the greater complexity involved in learning a continuous regression target compared with a binary classification problem. This observation suggests the potential benefit of further regularization, data augmentation, or architecture adjustments to improve generalization.
Overall, the results demonstrate that the model achieved high accuracy in gender classification, indicating a strong ability to learn discriminative features for this task. In contrast, while age prediction shows clear progress, it may require further optimization to achieve higher robustness across unseen data.
3.6. Model Improvements
In addition to the first model, three alternative models were trained, each incorporating modifications to the network architecture or training parameters in order to achieve better performance. The first model serves as the baseline reference.
The second model introduces an additional fifth convolutional layer. The number of filters in the final convolutional layer was doubled to 512. The dropout rate was increased to 0.4 for the first two dense layers, and the pooling size was enlarged to 3 × 3. Additionally, the number of training epochs was increased to 40 epochs, and the batch size was raised to 64. This model was designed to investigate whether a deeper and more computationally intensive architecture leads to better predictive results.
The third model implements protection against overfitting. The key enhancement is the use of an early stopping mechanism, which stops training after a specified number of consecutive epochs with no improvement in a monitored parameter, in this case, the validation loss. Another important feature is the ability to store and restore the model weights that achieved the best validation performance, rather than those from the final epoch. Additionally, in this version, the pooling size was also reduced back to 2 × 2 to prevent excessive loss of spatial information.
The fourth model, the final trained model, evaluates the impact of input image resolution on model performance. Unlike the previous models, which used resized inputs of 166 × 166 pixels, model 4 retains the original image resolution of 200 × 200 pixels. This required modifying the input tensor shape during the preprocessing stage. In addition to this change, the number of convolutional layers was reduced back to four (while retaining the increased filter count introduced in model 2), the dropout rate in the second dense layers of both network branches was decreased to 0.3, and the patience value for early stopping was reduced to 5.
Figure 10, Figure 11 and Figure 12 present the training history of the third model, which introduced early stopping to mitigate overfitting.
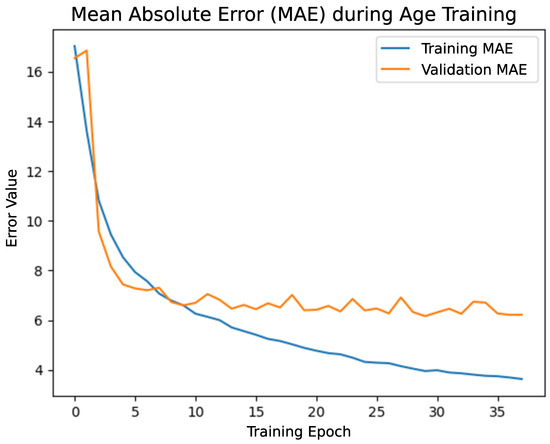
Figure 10.
Training history of the first model—MAE for age.
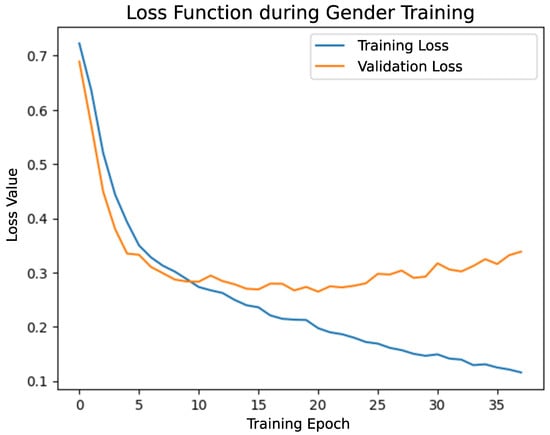
Figure 11.
Training history of the first model—loss function for gender.
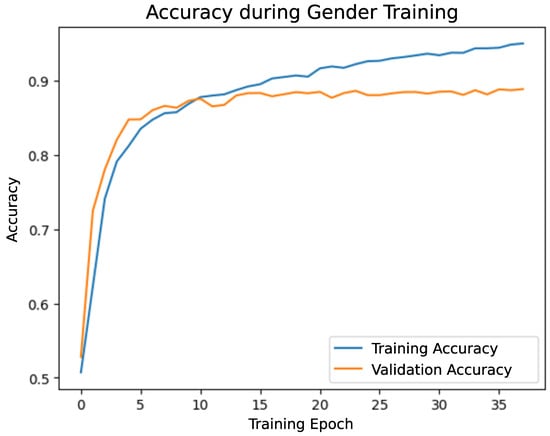
Figure 12.
Training history of the first model—accuracy for gender.
The graphs include the Mean Absolute Error (MAE) for age prediction, the loss function for gender classification, and classification accuracy for gender. Figure 10 illustrates the Mean Absolute Error (MAE) for the age regression task during the training of the third model. A consistent decline in MAE is observed for the training set. For the validation set, the MAE plateaus after epoch 10 and remains relatively stable, suggesting that the model has learned as much as it can from the data.
Loss function values for the gender classification task during training of the third model are shown in Figure 11. While the training loss continues to decrease, the validation loss reaches a minimum and then slightly increases, a typical indicator of overfitting, which is effectively managed here through early stopping. Figure 12 shows the accuracy of gender classification. The training accuracy steadily improves, while the validation accuracy stabilizes around epoch 15–20. This consistency across epochs confirms that the model generalizes reasonably well and benefits from the applied regularization strategy.
It should be noted that the training process did not reach the full 40 epochs. The early stopping mechanism was triggered at epoch 38, indicating that no improvement in the monitored validation loss had occurred for 8 consecutive epochs. As a result, the best weights from epoch 30 were saved and restored for final evaluation.
3.7. Protocol and Reproducibility
To ensure comparability and reproducibility, we standardized all evaluation choices: input resolution, normalization, optimizer, learning-rate schedule, batch size, number of epochs, early-stopping criterion, and random seeds. All experiments were run in Python (https://www.python.org/) with TensorFlow/Keras, which facilitates replication on comparable platforms. Model 3 was selected as the most balanced based on validation metrics: Total Loss Function = 3.99, Age MAE = 3.82, and Gender Accuracy = 93.5. Below we summarize the complete configuration, library versions, and model-selection criteria for model 3.
- Data split: The dataset is split into training (75%) and validation/test (25%) sets using train_test_spliit with random_state=36. The held-out portion was split into validation (used for early stopping) and test (used once for final evaluation).
- Input resolution: 144 × 144 pixels, grayscale.
- Normalization: Images normalized to by dividing pixel values by 255.0.
- Data augmentations: None applied during training or evaluation.
- Optimizer: Adam with default parameters ( = (0.9, 0.999) and default learning rate 0.001).
- Learning-rate schedule: Default Adam learning rate 0.001.
- Batch size: 64.
- Number of epochs: 40.
- Early-stopping criterion: Training stops if the validation loss (val_loss) does not improve for 8 epochs, starting from epoch 10, with the best weights restored restore_best_weights=True.
- Random seeds: 36 (used in train_test_split for dataset splitting).
To justify selecting model 3, we performed an internal comparison of four CNN variants trained under a similar protocol. Table 2 lists key hyperparameters and validation metrics. Model 3 achieved the lowest age MAE (3.82) and the lowest total loss (3.99) while maintaining high gender accuracy (93.5%), and was, therefore, chosen as a balanced reference model for subsequent analyses. We treat this as an internal ablation; test-set results are reported only for the selected model to mitigate selection bias.

Table 2.
Comparison of four CNN variants under a similar protocol.
Because prior UTKFace studies adopt heterogeneous splits, preprocessing, input sizes, and age formulations, we refrain from cross-paper rankings and report within-protocol results only, under our published-seed image-level split and fixed settings. Our goal is to standardize the evaluation protocol and provide a reproducible reference against which future methods can be compared like-for-like.
In summary, the provided checklist and internal comparisons make the experimental pipeline transparent and reproducible on comparable software stacks. We release the split indices and training configurations to enable exact reruns. For future work, we will extend the baseline with data augmentation and more advanced learning-rate schedules, as well as statistical significance testing, uncertainty estimation, and cross-dataset evaluation, while preserving the same checklist structure to ensure comparability.
4. Results and Discussion
The following section presents the results of experimental studies conducted for each model, along with detailed analyses of their performance and conclusions drawn from the tests. It also describes the challenges encountered during the implementation and operation of the program, as well as the solutions applied. Additionally, prediction results are included and discussed for both images originating from the dataset and those obtained from external sources. Practical value of a standardized baseline. Under one protocol, we observe consistent trends across CNN backbones and identify recurrent failure modes (e.g., pose, occlusion, illumination). These findings are actionable for follow-up work and provide a stable reference for reporting incremental advances, ablations, and deployment-oriented refinements.
4.1. Model Comparison: Evaluation of Trained Models
To determine which model provides the best performance, each trained model was individually evaluated according to predefined assessment criteria. The evaluation was conducted using the validation dataset, where each model predicted both age and gender for all contained images. The results achieved by the first model—including Mean Absolute Error (MAE), classification accuracy, and overall loss function value—are summarized in Table 3.

Table 3.
Performance comparison of individual models.
Based on the results, several key observations can be made:
- The first model achieved the highest accuracy in gender classification, making it the best option for tasks involving only gender prediction.
- The third model produced the lowest Mean Absolute Error (MAE) for age estimation, indicating that it performs best in age prediction tasks.
- The third model also obtained the lowest overall loss value, suggesting that it is the most balanced model for combined age and gender prediction.
Considering that the first model served as the baseline architecture, and each subsequent model introduced specific structural modifications, several conclusions can be drawn regarding the effectiveness of these changes:
- The second model demonstrated that expanding the convolutional architecture, by increasing the number of layers and filters, has a positive effect on performance, as indicated by its lower overall loss compared with the first model. However, this improvement comes at the cost of significantly higher computational requirements.
- The third model provides evidence that preventing overfitting can substantially improve predictive performance, especially for age estimation. By applying regularization techniques such as early stopping and weight checkpointing, the model achieved a notable reduction in both the loss and MAE, making it the best overall performer among the evaluated models.
- The fourth model delivered the weakest results across all evaluation metrics. This suggests that reducing the input images to a smaller resolution around 166 × 166 pixels, as conducted in the first three models, does not degrade performance. On the contrary, it appears to benefit the training process by decreasing model complexity and computational load, thereby enabling faster training and more efficient resource usage.
In summary, the third model achieved the best overall performance and has, therefore, been selected as the final model for further testing and experimental evaluation.
4.2. Age Group Analysis
To gain a broader perspective on the model’s performance, the validation dataset was divided into 12 distinct age groups. For each of these age groups, a separate evaluation of the third model was conducted in order to identify variations in predictive performance across different age ranges. This process involved creating individual subsets containing the age, gender, and image features of individuals within each age interval. These subsets were subsequently used for evaluation, enabling a more detailed analysis of how the model’s prediction accuracy changes with age.
The evaluation results presented in Table 4 reveal varying model performance across different age groups. The lowest gender prediction accuracy is observed in children, particularly in the 1–4 and 5–9 age ranges, where accuracy scores reach only 72.2% and 86.9%, respectively. This may be attributed to the difficulty of distinguishing gender-related features in young children, where such characteristics are less pronounced than in adults.

Table 4.
Evaluation of Model 3 across different age groups.
Figure 13 and Figure 14 complement Table 4 by visualizing per-age-group performance. Bars are annotated with the number of test images (n) to make class imbalance explicit. Performance degrades toward the distribution tails (70–79 and older), while gender accuracy peaks in mid-age groups (≈40–59) and drops for the youngest and oldest bins. Results for 90–99 and 100+ should be interpreted with caution due to the limited number of samples.
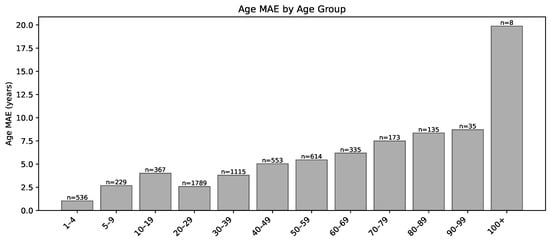
Figure 13.
Age MAE by age group on the UTKFace test set. Exact values in Table 4.
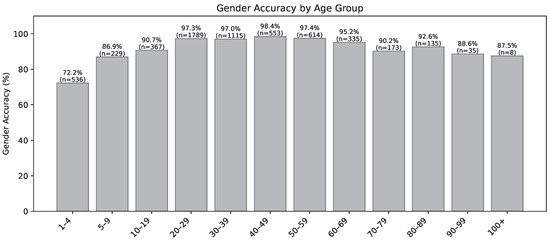
Figure 14.
Gender accuracy by age group on the UTKFace test set. Exact values in Table 4.
The highest gender classification accuracy (≥95%) is observed in the 20 to 69 age range. In this group, physical features typically associated with gender are more prominent and, therefore, easier for the neural network to recognize. Among older individuals (70+), prediction accuracy gradually decreases, which could be due to increased variability in physical appearance with age, as well as a smaller number of examples from these groups in the dataset. In addition, for adults, factors such as makeup, facial hair, or accessories like glasses may introduce stylistic variance, further influencing prediction outcomes.
For age estimation, the opposite trend is observed—the model achieves the lowest Mean Absolute Error (MAE) in the youngest age group (1–4 years), where age estimation is most accurate. As age increases, MAE steadily grows, reaching its peak in the senior groups. In particular, for the 90–99 and 100+ age groups, MAE exceeds 8 and 19 years, respectively, indicating very low prediction precision. This may be due to the natural convergence of physical features in older individuals and insufficient representation of these age groups in the validation dataset.
4.3. Identification of Best and Worst Age Prediction Cases
To evaluate the model’s performance on individual cases, the Mean Absolute Error (MAE) was programmatically calculated for each age prediction made by the third model on the validation dataset. Based on these results, two separate lists were created: one containing the samples with the lowest prediction errors (best results), and the other with the highest errors (worst results).
Figure 15 presents a collection of facial images for which the model achieved the most accurate age predictions, characterized by the lowest MAE values. Figure 16 shows images with the least accurate age predictions, where the model’s estimation significantly deviated from the actual age.
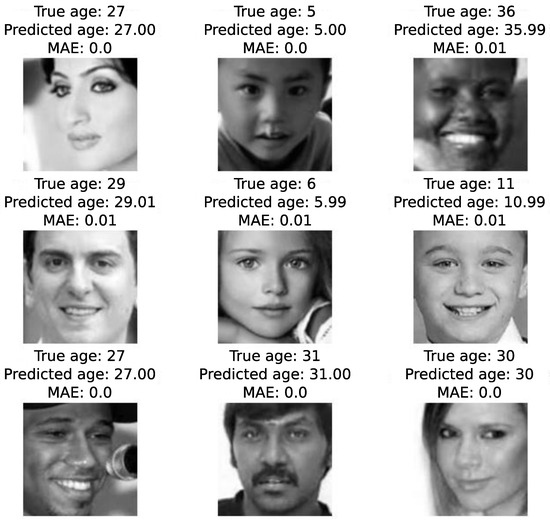
Figure 15.
Images with the lowest MAE.
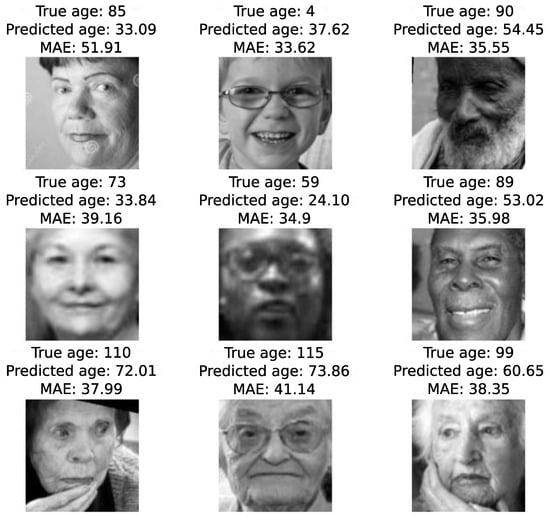
Figure 16.
Images with the highest MAE.
The worst age prediction results (Figure 16) are predominantly associated with elderly individuals. This observation aligns with the earlier analysis of age group performance, where the highest MAE values were also found among the oldest age groups. One major contributing factor is the relatively small number of validation samples for individuals over 70, which limits the model’s ability to generalize effectively for this age range (see also Figure 2 for dataset distribution).
Additionally, age estimation becomes inherently more challenging for older adults due to the greater variability in aging appearance. Individuals age at different rates depending on biological, lifestyle, and environmental factors. As a result, the model may frequently misclassify the age of elderly individuals who look significantly younger or older than their chronological age. Some of the most extreme prediction errors exceed 50 years.
On the other hand, the best prediction results (Figure 15) primarily involve young and middle-aged individuals, most of them under the age of 40. This is likely due to a larger number of training and validation examples in these age ranges, which improves the model’s learning. Moreover, in younger individuals, visual age cues are more consistently aligned with their actual age, making predictions more reliable and resulting in smaller absolute errors—some even as low as zero. These findings highlight the importance of balanced dataset distribution across age groups and point to inherent limitations in modeling human aging from facial features alone, especially in the elderly population.
Figure 17 presents example images with correctly predicted gender, while Figure 18 shows cases where gender was misclassified. Based on Figure 18, which displays incorrect gender predictions, a noticeable number of images depict very young children. This observation aligns with real-life experience, where determining the gender of toddlers is often more difficult than for individuals in other age groups. Although the sample size presented in these figures is relatively small, the observations are consistent with the results summarized in Table 4.
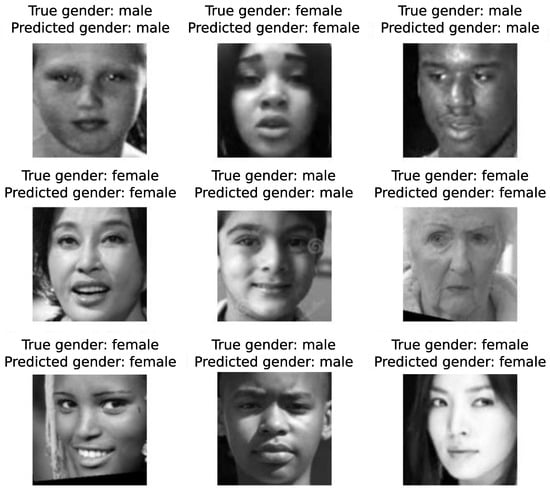
Figure 17.
Example images with correctly predicted gender.
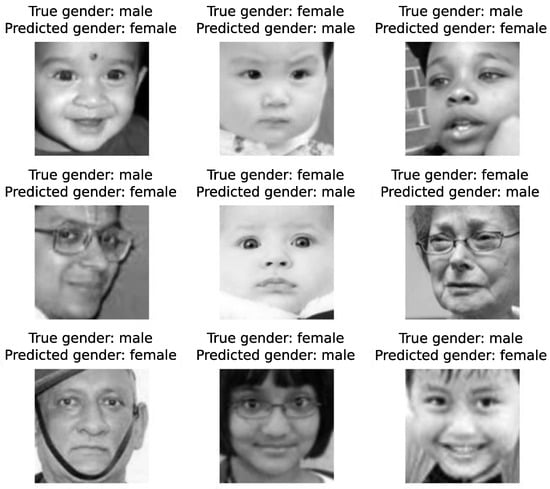
Figure 18.
Example images with incorrectly predicted gender.
4.4. Sample Predictions of Age and Gender
Figure 19, Figure 20, Figure 21 and Figure 22 present randomly selected examples of age and gender predictions generated by the third model on images from the validation dataset. Each image is annotated with the actual and predicted age and gender.
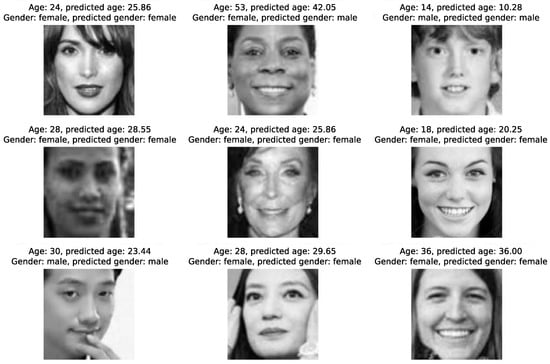
Figure 19.
Sample predictions of age and gender, part 1.
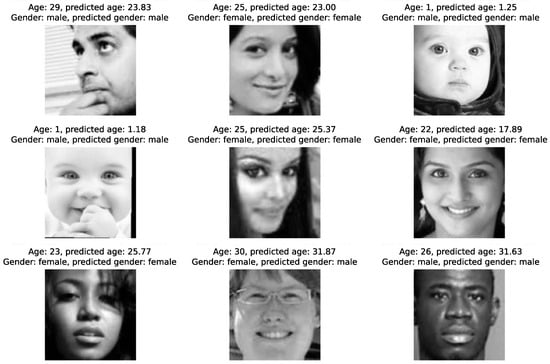
Figure 20.
Sample predictions of age and gender, part 2.
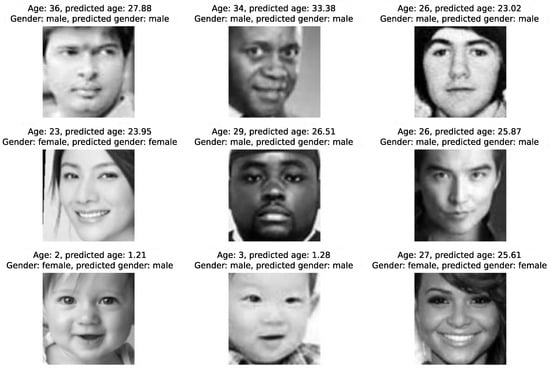
Figure 21.
Sample predictions of age and gender, part 3.
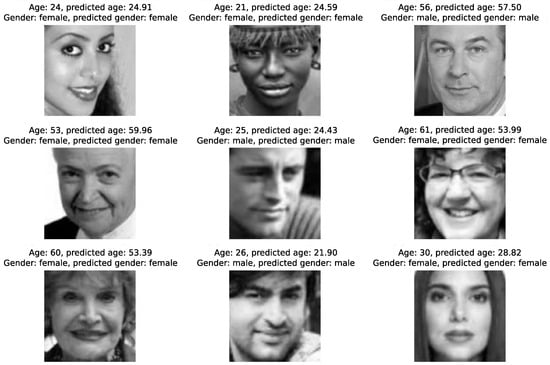
Figure 22.
Sample predictions of age and gender, part 4.
The model performs well in typical cases. In many examples (Figure 19), both age and gender are predicted correctly with minimal error. This confirms the effectiveness of the model in situations where facial features are clearly defined and typical for a given age group and gender.
A large number of misclassifications involve children. Several misclassified examples (especially in Figure 20 and Figure 21) include young children. This aligns with previous observations—the model often misclassifies the gender of toddlers and inaccurately predicts their age. This is understandable, as gender-specific facial features are less pronounced at an early age, and facial expressions can be misleading.
Apparent age differs from actual age. In some cases, individuals appear significantly younger or older than their actual age due to facial expression, makeup, hairstyle, or lighting. As seen in Figure 22, the model can incorrectly estimate age when the appearance deviates from expected age-related characteristics, even though gender prediction remains accurate.
Styling, facial expression, and image quality can mislead the model. Factors such as makeup, facial hair, glasses, hairstyle, smiling, or image sharpness can significantly affect the model’s performance. Some incorrect predictions in gender or age appear to result from ambiguous visual cues caused by these elements.
Limited representation of underrepresented groups. Despite the random selection, most of the presented images depict young or middle-aged individuals. This likely reflects the age distribution in the validation dataset and highlights the need for dataset balancing to improve model generalization.
4.5. Conclusions on Age and Gender Prediction for Images Outside the Dataset
To assess the model’s behavior in less controlled scenarios, predictions were generated for a selection of public figure photographs not included in the original dataset. These images differ from the training and validation data in various ways, such as resolution, lighting conditions, facial expressions, and styling, and were not preprocessed in the same standardized manner (e.g., cropping, alignment). Figure 23 presents the predictions made by the third model for these external samples, along with true age and gender annotations.
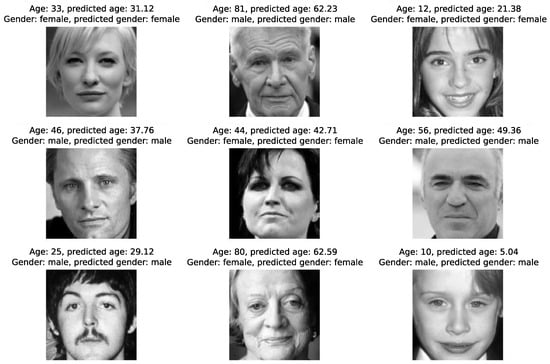
Figure 23.
Age and gender prediction for images outside the dataset.
The results show that the model is capable of making reasonably accurate predictions of both age and gender, even when operating on data from outside the original distribution. In all presented cases, gender was predicted correctly. Age prediction errors varied but remained within an acceptable range for most images.
Several patterns can be observed from the selected examples. The model tends to perform best for middle-aged adults, where predicted ages are closest to ground truth values. However, in the case of older individuals, the model frequently underestimates age by several to over ten years—as seen, for example, in the prediction of age 62.23 for an 81-year-old subject. Similarly, for very young individuals, the model may predict values that are either significantly lower or higher than the true age: for example, estimating a 10-year-old as 5.04 years old.
These discrepancies likely stem from the model’s limited exposure to images with diverse characteristics and lower representation of extreme age groups in the training data. Despite this, the model shows a moderate level of robustness and some capacity to generalize beyond the training distribution.
The results suggest that augmenting the dataset with a wider variety of real-world images—differing in lighting, background, pose, and image quality—could further enhance the model’s performance and reliability in practical applications.
4.6. Incorrect Face Detection by the Classifier
During the implementation of the system for predicting age and gender from external images, a frontal face classifier was used to detect faces within the photographs. Its primary role was to locate the face and return the coordinates of a bounding box, which could then be used to crop the image around the detected region.
However, in some cases, the classifier incorrectly identified the facial region—frequently focusing on the neck instead of the actual face. This mislocalization resulted in improper or poorly framed image crops, which adversely impacted the prediction outcomes. To address this issue, the affected images were manually cropped to ensure that the face was correctly centered within the frame before being passed to the model for inference.
4.7. Comparative Perspective
As summarized in Table 1, our system achieves an MAE of 3.82 for age prediction and 93.5% accuracy for gender classification on UTKFace. These results position our approach as competitive with recent literature: the MAE is lower than in Akgül’s FINet/INFINet architectures (≈4.3–5.7) [14] and comparable to Paplham and Franc’s unified benchmark (3.87–4.38) [7], while gender accuracy is slightly below the strongest UTKFace results (96–97% in [9,12]). Importantly, our setup emphasizes reproducibility through fixed preprocessing, standardized splits, and published seeds, directly addressing the methodological inconsistencies noted by Paplham and Franc. In contrast to many prior works that rely on heavy pretrained backbones, we deliberately restrict the scope to compact CNN variants to establish a transparent baseline.
The proposed solution prioritizes transparency and reproducibility over architectural novelty. By standardizing the protocol, it establishes a reliable baseline that can be expanded with statistical analysis, cross-dataset evaluation, and compact multitask extensions, serving as a benchmark for fair comparison with future methods.
4.8. Limitations
This study provides a reproducible baseline on UTKFace, but several constraints apply. UTKFace lacks subject identifiers, so our seeded image-level split cannot guarantee identity-disjoint partitions; some age/gender/ethnicity labels may be noisy, and the demographic distribution is imperfectly balanced. To preserve a fixed, reproducible protocol, we standardize preprocessing to 144 × 144 grayscale, disable data augmentation, use a fixed learning rate (Adam) with early stopping, and report within-protocol results on our published split. The modeling scope covers four compact CNN variants; we do not include heavyweight or pretrained backbones (e.g., Transformers) nor a full factorial ablation. Generalization is assessed only on UTKFace, with a qualitative external-images check, cross-dataset transfer, and robustness to alignment/occlusion are not quantified. Inputs are single-face crops; handling multi-face scenes would require a preceding face-detection stage with quality gating, which is outside the scope.
4.9. Future Work
This project opens several promising directions for further research. A key area for improvement involves constructing a more balanced and diverse facial image dataset, ensuring equal representation across all age groups. Ideally, such a dataset would contain multiple images of the same individuals captured at different life stages and under varying emotional expressions and head poses. This would allow more accurate modeling of the aging process and increase the network’s learning capacity.
Further improvements in prediction performance could be achieved by experimenting with different network architectures, activation functions, and loss metrics. Reformulating the age prediction task from regression to classification into age brackets may increase model robustness in uncertain or ambiguous cases. Moreover, exploring multi-task learning approaches that jointly predict age and emotion could be a valuable direction, given that both attributes significantly affect facial appearance.
From a practical perspective, it is crucial to strike a balance between model accuracy and computational efficiency. Working with large-scale datasets can be time- and resource-intensive. Consequently, future work may focus on developing lightweight and optimized models that are well-suited for real-time applications on mobile devices, embedded systems, or adaptive technologies such as smart cameras and personalized recommendation systems.
5. Conclusions
This paper explored the development of a convolutional neural network model (CNN) capable of simultaneously performing age prediction and gender classification based on facial images. Four different models were implemented and evaluated, each varying in network architecture, activation functions, optimization strategies, and data preprocessing techniques. The best performing model, the third model, achieved a gender classification accuracy exceeding 90% and a Mean Absolute Error (MAE) of less than 4 years for age prediction (see Table 3), indicating that the training process was successful and the results are satisfactory.
The analysis demonstrated that the model’s performance is strongly influenced by the structure and quality of the training dataset. In particular, the model showed reduced accuracy when predicting the age of elderly individuals, likely due to their underrepresentation in the dataset. In contrast, the model performed well for predicting gender among adults and age for younger individuals, a trend confirmed by the MAE distributions across different age groups (Figure 15 and Figure 16). These observations are consistent with existing research, which highlights improved performance for well-represented demographic groups. A comparison between different preprocessing pipelines (e.g., third model vs. fourth model) revealed that even small changes in how the data are prepared can significantly impact model performance. Models trained on well-cropped and standardized images consistently outperformed others.
Another key element of the project was testing the model’s generalization capabilities using facial images outside the dataset (Figure 23). Although such images differ in resolution, lighting, and composition, the model was able to correctly classify gender in all cases and provided reasonably accurate age estimates. These results indicate that the network possesses a certain level of robustness and could potentially be used in practical applications, such as personalized content recommendation systems that adapt to the user’s estimated age.
Our focus is on establishing a transparent, reproducible baseline rather than architectural novelty. Going forward, we will strengthen this foundation with statistical significance testing and uncertainty estimation, cross-dataset generalization, and lightweight multi-task or ordinal-age refinements: all under the same protocol to enable direct comparison. Although we do not include head-to-head re-implementations of recent methods in this paper, we plan to evaluate representative regression baselines and distilled teacher-student models using our released split and configurations to provide strict, like-for-like benchmarks. This strategy will allow our work to serve as a reliable reference point in the field, bridging the gap between standardized baselines and cutting-edge performance reports.
Author Contributions
Conceptualization, M.K. and S.P.; methodology, M.K. and S.P.; software, M.K. and S.P.; validation, M.K. and S.P.; formal analysis, M.K. and S.P.; investigation, M.K. and S.P.; resources, M.K. and S.P.; data curation, M.K. and S.P.; writing—original draft preparation, M.K. and S.P.; writing—review and editing, M.K. and S.P.; visualization, M.K. and S.P.; supervision, M.K.; project administration, M.K. All authors have read and agreed to the published version of the manuscript.
Funding
This research received no external funding.
Institutional Review Board Statement
Not applicable.
Informed Consent Statement
Not applicable.
Data Availability Statement
The raw data supporting the conclusions of this article will be made available by the authors on request.
Conflicts of Interest
The authors declare no conflicts of interest.
References
- Levi, G.; Hassncer, T. Age and gender classification using convolutional neural networks. In Proceedings of the 2015 IEEE Conference on Computer Vision and Pattern Recognition Workshops (CVPRW), Boston, MA, USA, 7–12 June 2015; pp. 34–42. [Google Scholar] [CrossRef]
- Ranjan, R.; Zhou, S.; Chen, J.C.; Kumar, A.; Alavi, A.; Patel, V.M.; Chellappa, R. Unconstrained Age Estimation with Deep Convolutional Neural Networks. In Proceedings of the 2015 IEEE International Conference on Computer Vision Workshop (ICCVW), Santiago, Chile, 7–13 December 2015; pp. 351–359. [Google Scholar] [CrossRef]
- Escalera, S.; Fabian, J.; Pardo, P.; Baro, X.; Gonzalez, J.; Escalante, H.J.; Misevic, D.; Steiner, U.; Guyon, I. Chalearn 2015 apparent age and cultural event recognition: Datasets and results. In Proceedings of the 2015 IEEE International Conference on Computer Vision Workshop (ICCVW), Santiago, Chile, 7–13 December 2015; pp. 243–251. [Google Scholar] [CrossRef]
- Smith, P.; Chen, C. Transfer Learning with Deep CNNs for Gender Recognition and Age Estimation. In Proceedings of the 2018 IEEE International Conference on Big Data (Big Data), Seattle, WA, USA, 10–13 December 2018; pp. 2564–2571. [Google Scholar] [CrossRef]
- Tin, H.H.K.; Htake, H. Gender and Age Estimation Based on Facial Images. Int. J. Acta Tecjnica Napoc. Electron. Telecommun. 2011, 52, 37–40. [Google Scholar]
- Chen, Y.W.; Lai, D.H.; Qi, H.; Wang, J.L.; Du, J.X. A new method to estimate ages of facial image for large database. Multimed. Tools Appl. 2015, 75, 2877–2895. [Google Scholar] [CrossRef]
- Paplhám, J.; Franc, V. A Call to Reflect on Evaluation Practices for Age Estimation: Comparative Analysis of the State-of-the-Art and a Unified Benchmark. In Proceedings of the 2024 IEEE/CVF Conference on Computer Vision and Pattern Recognition (CVPR), Seattle, WA, USA, 16–22 June 2024; pp. 1196–1205. [Google Scholar] [CrossRef]
- Shin, N.H.; Lee, S.H.; Kim, C.S. Moving Window Regression: A Novel Approach to Ordinal Regression. In Proceedings of the 2022 IEEE/CVF Conference on Computer Vision and Pattern Recognition (CVPR), New Orleans, LA, USA, 18–24 June 2022; pp. 18739–18748. [Google Scholar] [CrossRef]
- Dey, P.; Mahmud, T.; Chowdhury, M.S.; Hossain, M.S.; Andersson, K. Human Age and Gender Prediction from Facial Images Using Deep Learning Methods. Procedia Comput. Sci. 2024, 238, 314–321. [Google Scholar] [CrossRef]
- Bekhouche, S.E.; Benlamoudi, A.; Dornaika, F.; Telli, H.; Bounab, Y. Facial Age Estimation Using Multi-Stage Deep Neural Networks. Electronics 2024, 13, 3259. [Google Scholar] [CrossRef]
- Kim, S.; Park, Y.; Lee, E.C. Knowledge Distillation for Enhanced Age and Gender Prediction Accuracy. Mathematics 2024, 12, 2647. [Google Scholar] [CrossRef]
- Swaminathan, A.; Chaba, M.; Sharma, D.K.; Chaba, Y. Gender Classification using Facial Embeddings: A Novel Approach. Procedia Comput. Sci. 2020, 167, 2634–2642. [Google Scholar] [CrossRef]
- Alghaili, M.; Li, Z.; Ali, H.A. Deep feature learning for gender classification with covered/camouflaged faces. IET Image Process. 2020, 14, 3957–3964. [Google Scholar] [CrossRef]
- Akgül, I. Deep convolutional neural networks for age and gender estimation using an imbalanced dataset of human face images. Neural Comput. Appl. 2024, 36, 21839–21858. [Google Scholar] [CrossRef]
- Zhang, Z.; Liu, Q. UTKFace: A Large-Scale Face Dataset for Age, Gender, and Ethnicity Prediction. 2017. Available online: https://susanqq.github.io/UTKFace/ (accessed on 31 July 2025).
- PopulationPyramid.net. Population Pyramids of the World from 1950 to 2100. 2024. Available online: https://www.populationpyramid.net/world/2024 (accessed on 31 July 2025).
- Kingma, D.P.; Ba, J. Adam: A Method for Stochastic Optimization. In Proceedings of the 3rd International Conference on Learning Representations, ICLR 2015, San Diego, CA, USA, 7–9 May 2015. Conference Track Proceedings. [Google Scholar]
Disclaimer/Publisher’s Note: The statements, opinions and data contained in all publications are solely those of the individual author(s) and contributor(s) and not of MDPI and/or the editor(s). MDPI and/or the editor(s) disclaim responsibility for any injury to people or property resulting from any ideas, methods, instructions or products referred to in the content. |
© 2025 by the authors. Licensee MDPI, Basel, Switzerland. This article is an open access article distributed under the terms and conditions of the Creative Commons Attribution (CC BY) license (https://creativecommons.org/licenses/by/4.0/).