Article

Impact Energy Absorption Behavior of Unequal Strength Liquid Storage Structures Under Drop Hammer Impact

College of Naval Architecture and Ocean Engineering, Naval University of Engineering, Wuhan 430033, China
*
Author to whom correspondence should be addressed.
Appl. Sci. 2025, 15(18), 10211; https://doi.org/10.3390/app151810211
Submission received: 29 August 2025 / Revised: 14 September 2025 / Accepted: 16 September 2025 / Published: 19 September 2025

Abstract

To enhance the impact resistance and protective performance of ship double-bottom liquid tanks, a liquid storage structure with unequal panel strength was designed. Drop hammer impact experiments and finite element simulations were carried out under ten different working conditions. Based on the experimental and numerical findings, the failure morphology, dynamic response, energy absorption characteristics, and protection mechanisms of the structure were systematically analyzed. By quantifying the plastic limit ratio between the front and rear wall panels, the relationship between strength matching and energy dissipation was revealed. The findings demonstrate that reducing the strength of the rear wall panel promotes large-deflection plastic deformation, which facilitates directional energy dissipation and reduces both the deformation and energy absorption of the bottom panel. Furthermore, the strength matching between the front and rear panels causes asymmetry in the dynamic response during impact. Increasing the plastic limit ratio enhances the protective capability of the structure, providing a valuable reference for the design of unequal-strength double-bottom liquid tanks in ships.

1. Introduction

Grounding [1], stranding [2], and collision [3] under extreme loading conditions pose significant threats to ship safety. These accidental events generate instantaneous and concentrated impact forces that can lead to severe structural damage. The ship’s double bottom [4], composed of the inner and outer bottom plates as well as longitudinal and transverse structural members, forms a closed, double-layered support system. When subjected to impact, this structure experiences complex failure modes, including bending, stretching, buckling, compressive deformation [5], tearing, and failure [6]. Installing liquid tanks in the double bottom [7] not only facilitates liquid storage but also enhances anti-sinking capabilities and stability [8]. Owing to the high fluidity of liquid media, these tanks are capable of absorbing the pressure potential energy of impact loads [5], transforming it into dispersive kinetic energy and generating a cushioning [9] that improves structural protection.
In traditional liquid tank systems, external impact loads are transmitted through the liquid medium to the non-contact panel. This tends to reduce deformation in the contact panel but increases it in the non-contact panel [10], potentially causing damage to adjacent compartments. To mitigate this issue, numerous studies have proposed using local strength reduction [11] as a strategy to guide energy dissipation toward the weaker parts of the structure. This method enables directional energy release and reduces the load on critical protective zones. Several engineering innovations support this approach. For example, the DDG-1000 incorporates a double-shell protective design and sacrificial outer shell venting system to alleviate internal pressures [12]. Zhao [12] demonstrated that thinner plates facilitate venting, thereby reducing quasi-static pressure and specific impulse. Similarly, Chen [13] developed plastic liquid-filled tubes to transform blast shock waves into hydraulic energy. Shen [14] found that varying and external plate thicknesses enhances the crashworthiness of column structures. Fu et al. [15] showed that reinforced concrete columns with unequal wall thicknesses exhibit improved post-peak ductility. Other contributions include Kong et al. [16], who verified that explosion relief holes reduce stress concentration at corners, and Li [17], who conducted numerical studies on blast dynamics in RC box-type structures showing that increasing venting area lowers impulse exponentially. Zhao [18] conducted drop hammer tests on concave cell liquid storage systems, revealing superior buffering effects over cubic designs. Zhou [19] enhanced energy absorbers by incorporating gradient-thickness thin-walled geometries. Wang et al. [20] introduced a three-dimensional negative Poisson’s ratio structure with good energy-absorbing performance. Despite these advances, limited research exists on unequal-strength liquid storage structures for shipping double-bottom tanks under low-velocity impact. The protective mechanisms and dynamic response of such systems remain underexplored.
To address this gap, the present study proposes a novel unequal-strength liquid storage model. By adjusting the thickness of the front and rear wall panels, the plastic limit strength of the system is varied, enabling controlled deformation. The rear wall panel is designed as a sacrificial low-strength component, while the bottom panel is the target protection layer. Under a constant total mass condition, drop hammer experiments were conducted to simulate grounding-related impact scenarios. Finite element simulations were also developed to evaluate the failure modes, dynamic responses, and energy absorption characteristics of the structure. The outcomes provide a framework for optimizing the design for optimizing protection in double-bottom liquid tanks using unequal-strength strategies.

2. Experiment and Numerical Analysis

2.1. Experimental Design

2.1.1. Structural Design

In this study, a double-bottom liquid storage structure with an unequal-strength wall plate was designed. The upper wall panel corresponds to the outer bottom plate of the ship’s double-bottom configuration, the side wall panels present the ribs and longitudinal girders, and the lower wall plate corresponds to the inner bottom plate. By reducing the thickness of the rear wall panel, it functions as a low-strength sacrificial component, whereas the lower wall panel is designated as the target protective component. The dimensions of the frame and wall plates are illustrated in Figure 1. The frame was welded to ensure high rigidity and to minimize deformation during impact. The wall panels were bolted onto the frame, with a sealing rubber gasket placed in between to ensure tightness. Bolt spacing was set at 60 mm for the upper wall plane and 50 mm for the lower wall panel. Both the frame and wall planes were fabricated using Q235 steel (Wuhan Guanglianfa Laser Electromechanical Equipment Co., Ltd., Wuhan, China), with a yield strength of 235 MPa and an elastic modulus of 210 GPa. A water-tightness test was conducted prior to the impact experiment to confirm that no leakage or seepage was present.
The plastic limit strength, denoted as ps, was used to characterize the load-bearing capacity of the wall panels. Based on geometric parameters and plate thickness, the four-edge fixed limit load method was used to calculate ps, as expressed in the following equations:
p s = 48 M s b 2 3 + β 2 β 2
M s = σ s h 2 4
β = b a
where Ms is the plastic limit bending moment per unit length, h denotes the thickness of the plate, b represents the short side length of the panel, and a corresponds to the long side length.
According to the experimental hypothesis, the lower wall panel serves as the primary protective surface, while the rear wall panel acts as the sacrificial surface. By adjusting the thicknesses of the front and rear wall panels and calculating their corresponding plastic limit strengths, an unequal-strength liquid storage structure was configured. The total mass of the wall panels was kept constant to ensure comparable conditions across all test cases. Ten representative configurations were evaluated, as listed in Table 1.

2.1.2. Experimental Setup

The experimental apparatus is illustrated in Figure 2. The STLS-10000 drop hammer test platform (Shangtai Instruments, Jinan, China) was employed, utilizing a 120 kg steel drop hammer guided by a lead screw mechanism. The hammer had a radius of 5 cm and was dropped from height of 4.7 m. The impact velocity of the drop hammer is determined to be 9 m·s−1 through high-speed photography calibration. The structure is filled with water medium, and the temperature is 25 °C. To avoid the effects of secondary impacts due to rebound, an anti-rebound mechanism was incorporated into the impact platform. The structure consisted of an upper section functioning as a liquid storage chamber and a lower section comprising a supporting frame. The entire assembly was secured to the base using bolts to ensure structural stability during the impact event. An HL-C235 laser displacement sensor (Beijing Yingshida Technology Co., Ltd., Beijing, China) was installed behind the rear wall panel to capture real-time deformation data during impact. The sampling frequency was 50 kHz. In addition, a high-speed camera system was employed to record the dynamic response process of the structure. Following the experiment, a 3D scanning system was used to measure the final deformation profiles of all wall panels.

2.2. Numerical Analysis Model and Validation

2.2.1. Numerical Analysis Model

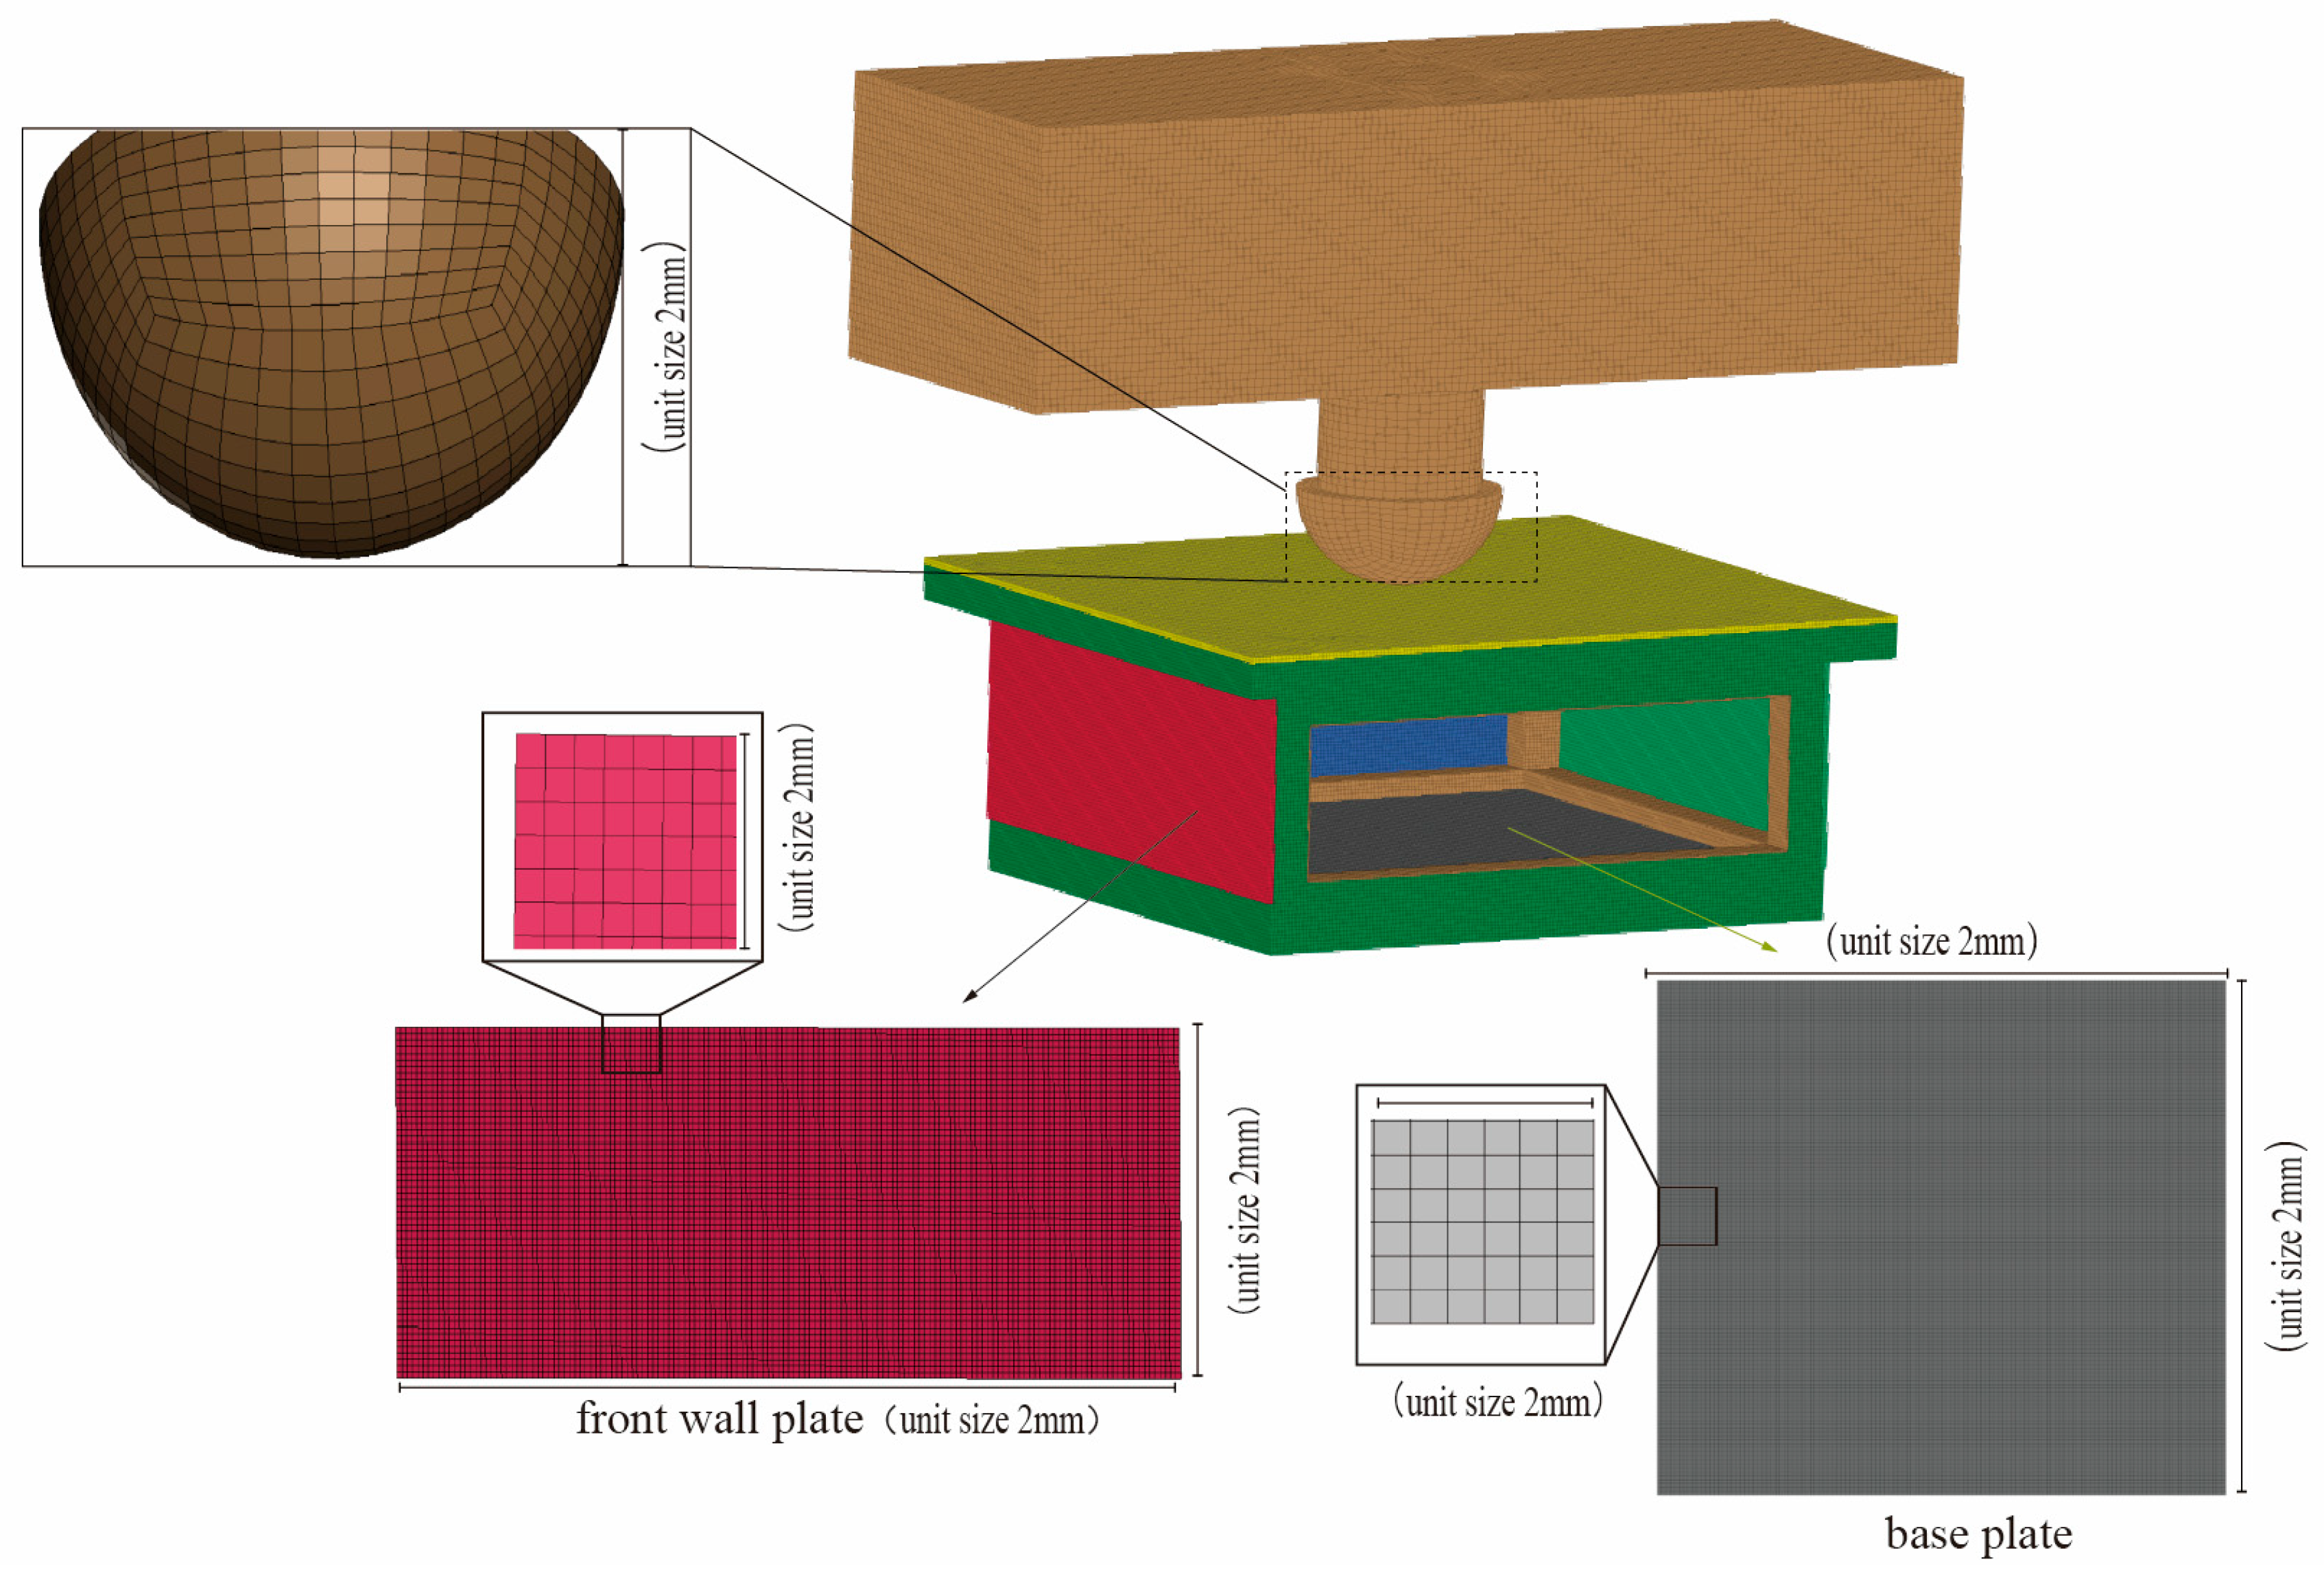
A finite element model was developed in LS-Dyna 4.10 using the adaptive Arbitrary Lagrangian–Eulerian (ALE) algorithm to simulate the fluid–structure interaction between the liquid storage structure and surrounding water and air. As shown in Figure 3, the drop hammer, frame, and wall panels were modeled using Lagrangian meshes. Specifically, the drop hammer and frame consist of hexahedral solid elements, while the wall panels adopt Hughes–Liu shell elements. The water and air were modeled with Eulerian meshes. The fixing bolts remained tight before and after the test; therefore, the edges of each wall panel can be approximated as fixed supports. The mesh size was set to 2 mm × 2 mm for the wall panels and for the frame 2 mm. To improve computational efficiency, the mesh size of Lagrangian elements for non-cellular wall panels was increased. The drop hammer mesh was generated by sweeping from the top surface elements. The water domain was initialized using the *INITIAL_VOLUME_FRACTION_GEOMETRY keyword, which defines the distribution of water and air regions within the Euler at the initial state [21].
Both the water and air were defined using the Null equation of state [17], with their properties primarily governed by density parameters. The density of water was set to 1000 kg·m−3, while the density of air was 1.28 kg·m−3.
The interaction pressure between the water and the wall panels was described using the Grüneisen equation of state [17]:
P w = ρ 0 c 2 μ v 1 + 1 γ 0 2 μ v α 2 μ v 2 1 S 1 1 μ v S 2 μ v 2 μ v + 1 S 3 μ v 3 μ v + 1 2 2 + γ 0 + α μ v B w
where PW represents the pressure between the water and the wall panel, and EW denotes the initial internal energy within the water–wall interface. The term μv corresponds to the relative volume, while c, S1, S2, S3, γ0, and α are material-specific coefficients used in the Grüneisen equation of state. The parameter values used for the water and wall panel models are summarized in Table 2 and Table 3, respectively.
The air medium was modeled using the ideal gas law [17]:
P A = C 0 + C 1 μ + C 2 μ 2 + C 3 μ 3 + ( C 4 + C 4 μ + C 6 μ 2 ) E A
where PA denotes the air pressure, EA represents a characteristic internal energy parameter of the air, and C0, C1, C2, C 3, C4, C5, and C6 are the coefficients associated with the equation of state. These parameters define the thermodynamic behavior of the air in the finite element model, as detailed in Table 4.
The structural components, including wall panels, drop hammer, and frame, were defined using the Johnson–Cook elastoplastic model. The corresponding material parameters are shown in Table 5.

2.2.2. Numerical Model Validation

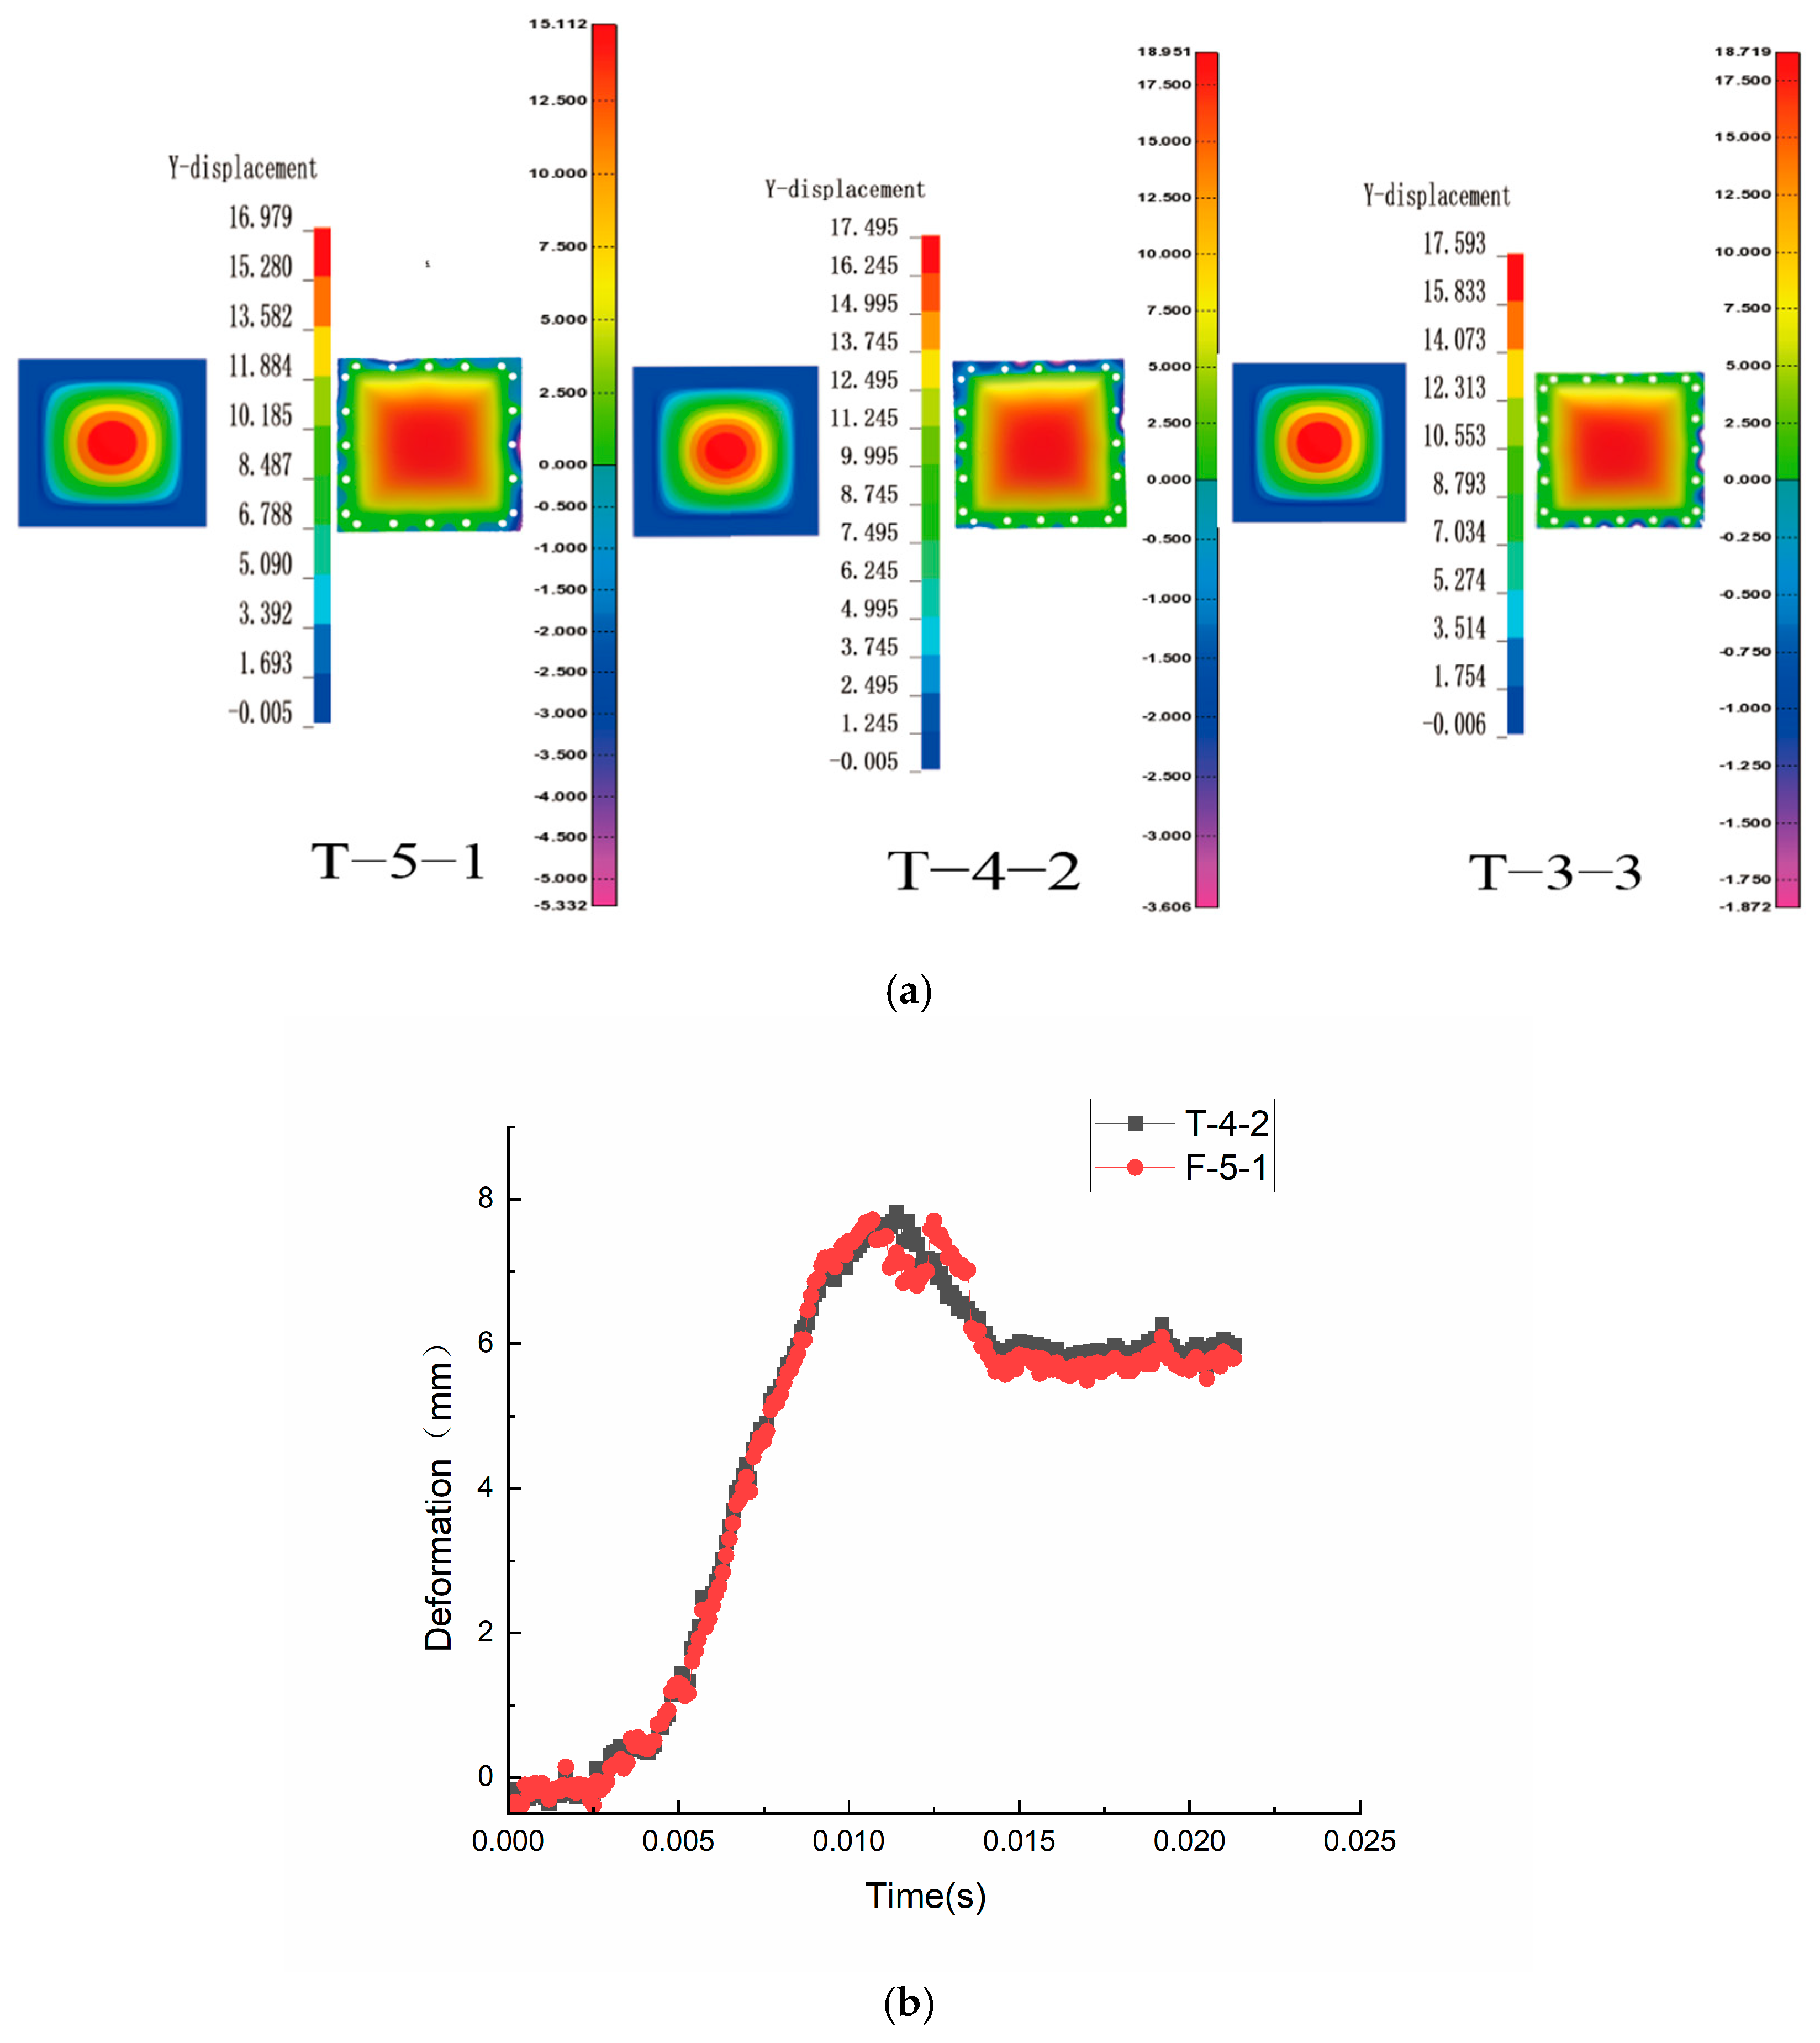
Numerical simulations were conducted for three test conditions. Figure 4 presents a comparison between the 3D scan results and the simulation output for the lower wall panel. The deformation patterns observed in the experiments and simulations showed good consistency.
The ultimate deflection values obtained from the simulations and 3D scans are listed in Table 6. The relative errors for the T-3-3, T-4-2, and T-5-1 configurations were 7.1%, 6.5%, and 5.7%. The root mean square error of the displacement–time curves between T-4-2 and F-5-1 is 0.275 mm, and the peak error is 0.535 mm, indicating strong agreement between experimental and numerical results.
To ensure the accuracy and stability of the numerical model, a mesh sensitivity analysis was performed [22]. Using T-3-3 as a case study, the simulation was first conducted with a 4 mm mesh size for both the frame and wall panels. The calculated maximum deformation of the lower wall panel was 15.2 mm, resulting in a 19% deviation from the experimental measurement. This deviation was attributed to the coarse mesh underestimating local stiffness gradients, thereby restricting plastic deformation and localized denting. The mesh size was then reduced to 1 mm, improving fidelity but significantly increasing the number of elements and the computational cost. Hardware limitations led to frequent delays and simulation crashes. As a trade-off, a mesh size of 2 mm was selected, balancing accuracy and computational efficiency.

3. Structural Failure and Dynamic Response Analysis

3.1. Failure Morphology

During the experiment, the impact load from the drop hammer was transmitted to the structural frame through the upper plate. Due to the substantial thickness and mass of the steel frame, as well as its rigid connection design, the overall stiffness of the frame was significantly greater than that of the surrounding functional panels. As a result, the frame exhibited the mechanical behavior of a nearly rigid body, with negligible visible deformation, thus serving primarily as a load-transmitting component rather than one for energy dissipation.
In contrast, the functional plates, including the side walls, lower plate, and upper plate, acted as the primary energy-dissipating components of the structure. By intentionally differentiating the stiffness of these each plates, particularly through local stiffness reduction, the impact energy was directed toward predefined deformable zones. This guided energy dissipation was achieved through plastic flow, bending deformation, and local denting, producing distinct failure morphologies. Therefore, analyzing the failure patterns of each plate is essential to understanding the energy dissipation pathways and clarifying the protective mechanisms of the unequal-strength liquid-holding structure.

3.1.1. Failure Morphology of Fore and Aft Plates

In structural impact resistance studies, the design of sacrificial wall plates plays a critical role in enhancing the overall protective performance of the structure [23]. In this configuration, the rear wall plate was designed as a low-strength sacrificial component, with its primary function being the direct release of impact energy through large-deflection plastic deformation. This mechanism effectively reduces the transmission of load to the target protective area. Under the constraint of equal total structural mass, the front wall plate was assigned a higher thickness to function as a strong protective component.
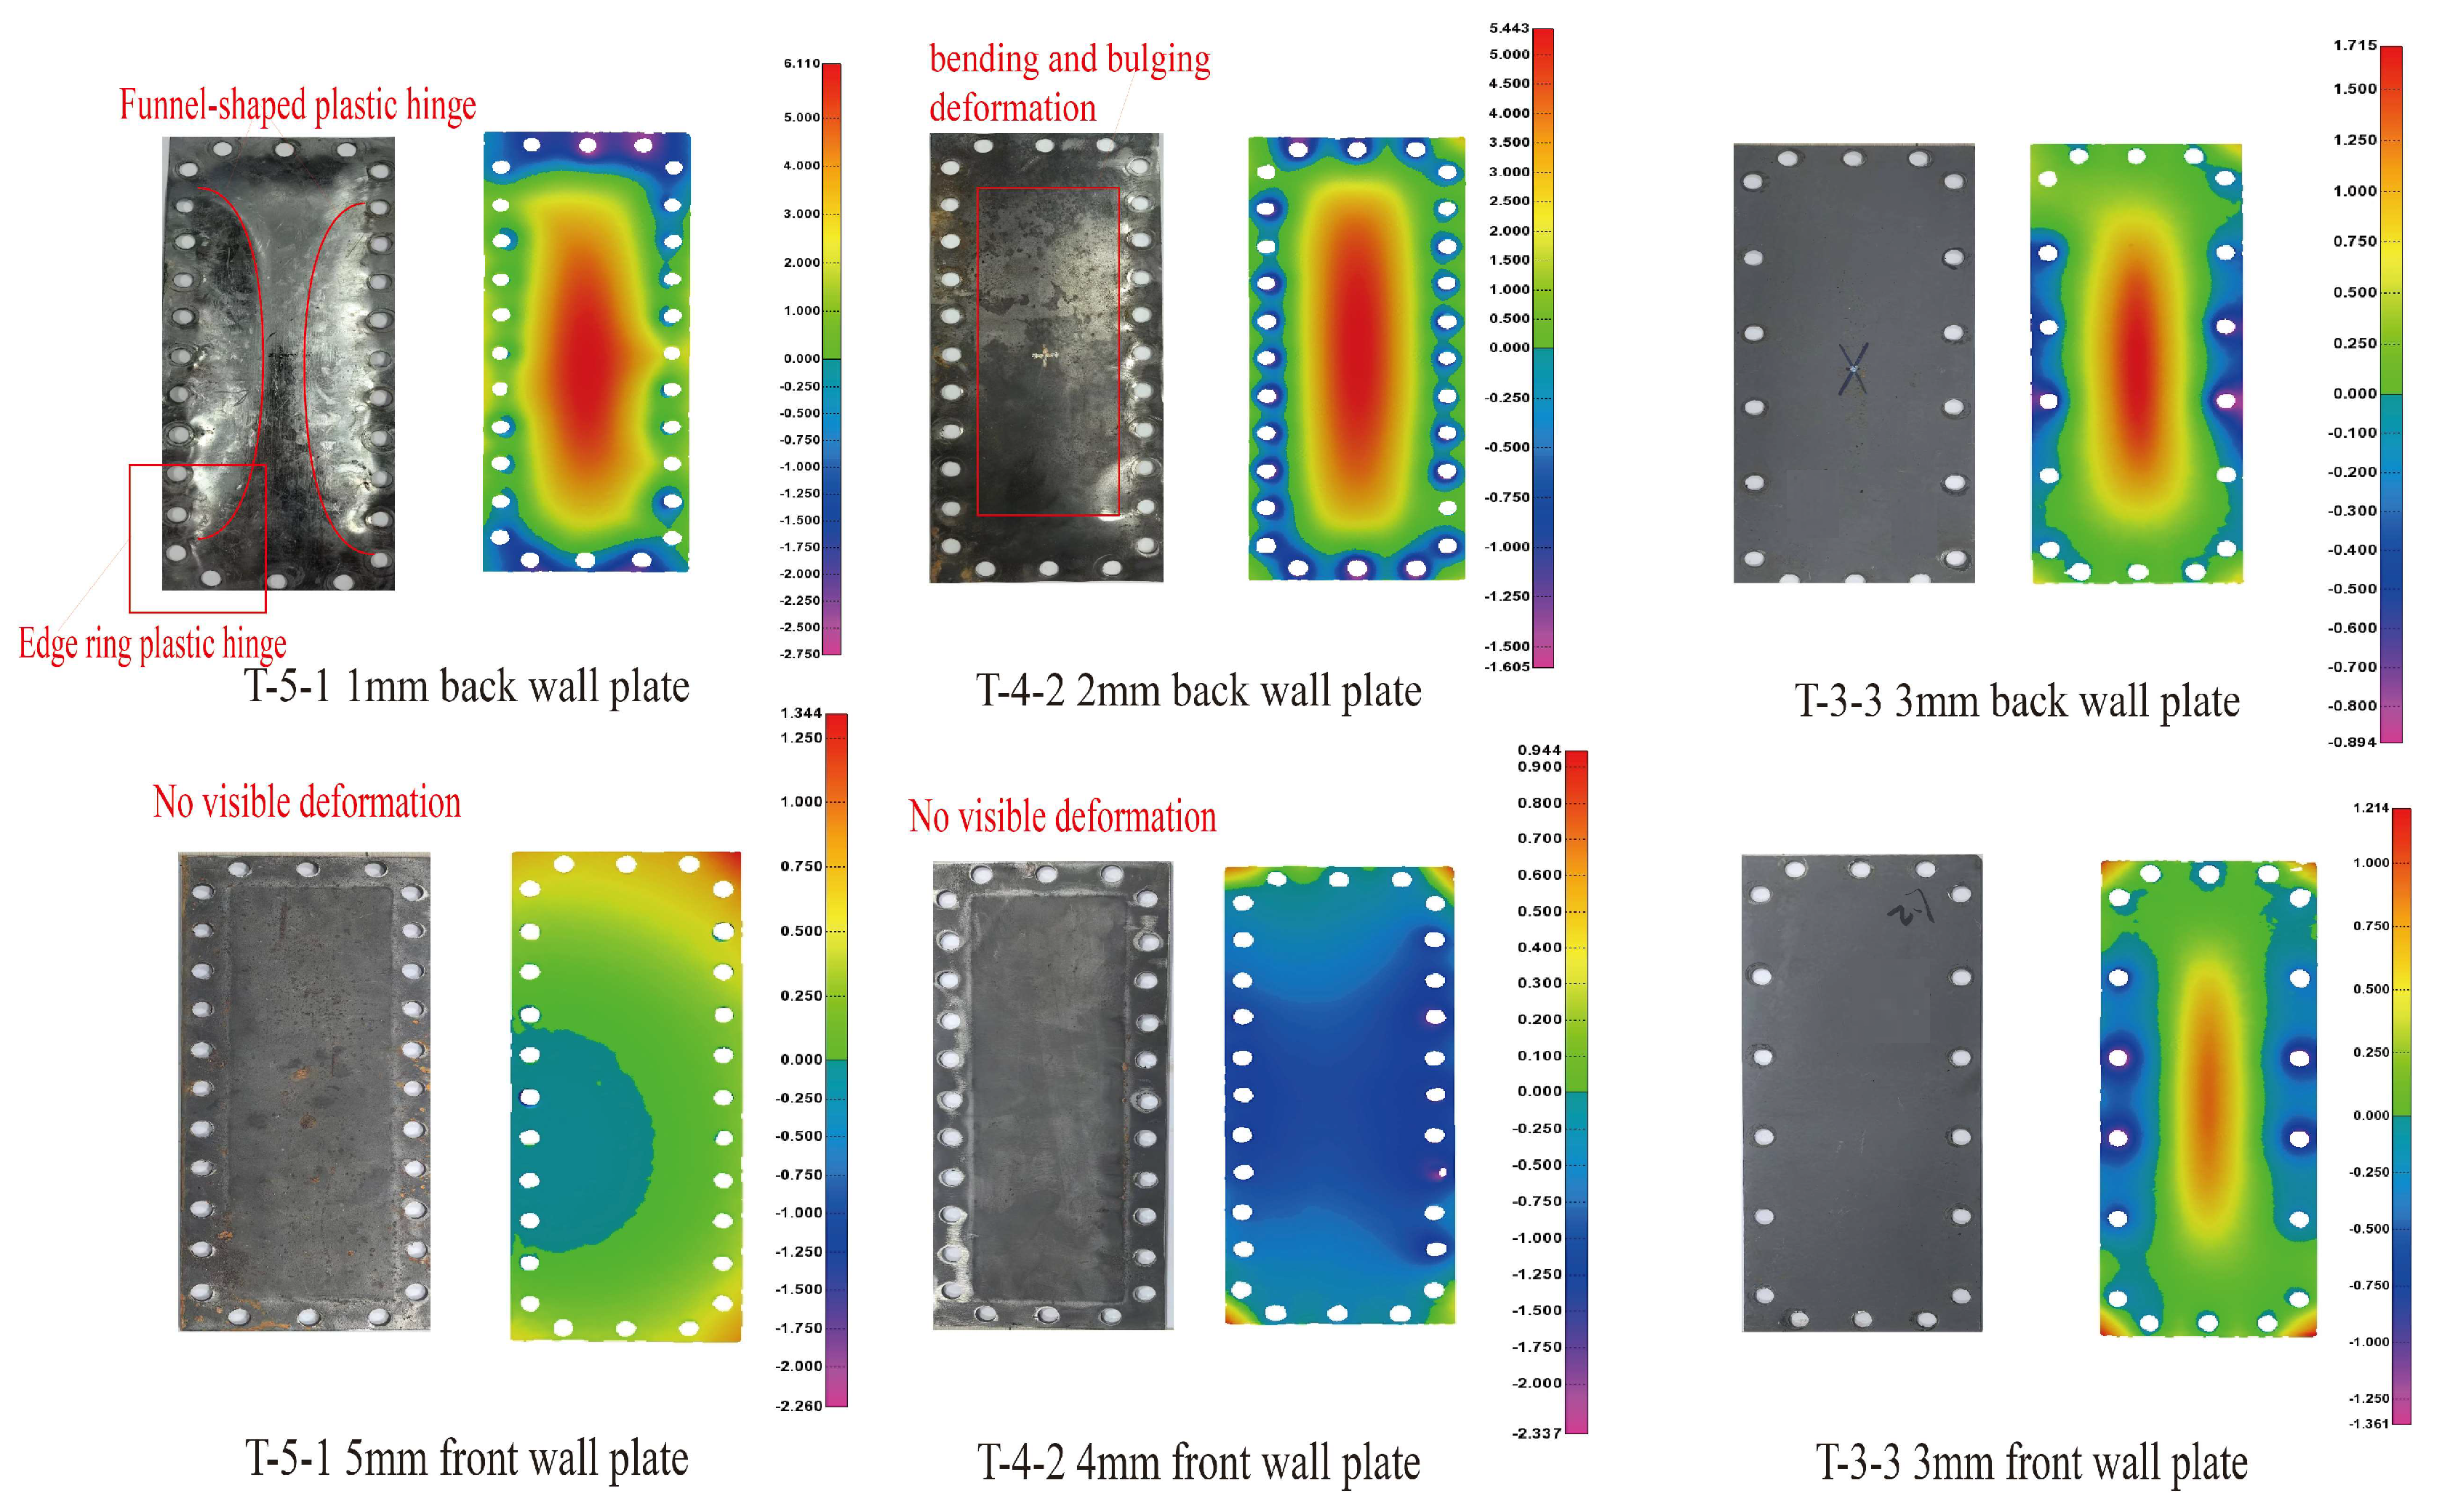
Based on the experimental setup, three working conditions were analyzed. The rear wall plate thicknesses were set to 3 mm, 2 mm, and 1 mm, while the front wall plate thicknesses were 3 mm, 4 mm, and 5 mm, respectively. Figure 5 and Figure 6 illustrate the deformation characteristics of the front and rear wall plates and the displacement curves of the rear wall panel measured by the laser displacement sensor under these three conditions. It should be noted that due to splashing of the fluid medium during impact, the sensor data exhibited minor fluctuations and signal jumps.
In test condition T-3-3, the rear wall panel primarily exhibited elastic deformation. The pressure from the fluid medium, induced by the drop hammer, caused a brief bending response in the panel. However, the stress level did not exceed the plastic limit strength of the material. Upon unloading, the panel returned to its original shape, leaving only minor residual deflection. In contrast, the rear wall panels in T-4-2 and T-5-1 entered the plastic deformation regime. In T-5-1, where the rear wall panel was only 1 mm thick, typical bulging plastic deformation was observed. Prolonged pressure from the fluid medium induced extensive plastic flow in the central region of the wall panel, forming an outward convex bulge. As loading increased, stress concentration developed along the constrained edges. When the material at the edge reached its plastic limit, deformation began there and propagated circumferentially, creating an “annular peripheral plastic hinge”. Once the stress at the central region surpassed the yield threshold, localized deformation initiated and expanded diagonally, eventually forming two inward “funnel-shaped plastic hinges”. The 2 mm-thick rear wall panel in T-4-2 exhibits a bending bulge plastic deformation pattern, with a deformation degree between that of T-3-3 and T-5-1. According to the displacement curves of the rear wall panel in Figure 6, the deflection distributions under all three conditions exhibit a “centrally symmetric feature”: the wall panel center is the zone of peak deflection, which gradually decreases toward the edges.
As shown in Figure 6, the maximum deflection of T-3-3 is about 3.2 mm and recovers to 0 mm within 7 ms after impact, highlighting the transient and fully reversible behavior of elastic deformation. The maximum deflection of T-4-2 is about 7.9 mm with a residual deflection of about 5.9 mm, and the deflection attenuation rate is relatively slow. T-5-1 reaches a maximum deflection of 11.2 mm with a residual of about 9.1 mm. Due to the thinness and rapid response characteristics of the plate, the peak appears earlier than in T-4-2. The thinner web plate more easily reaches the yield limit under impact loads, absorbing energy through large-area plastic flow.
Regarding the failure morphology of the front web plate, both the front and rear web plates of T-3-3 are 3 mm thick, resulting in uniformly matched stiffness and similar failure response under impact loads. The pressure wave generated by the drop hammer produces symmetric loading on the front and rear web plates, causing the front plate to undergo bending deformation. Upon unloading, the plate rebounds through the elastic deformation range. In T-4-2 and T-5-1, the front web plate thicknesses are increased to 4 mm and 5 mm, respectively, which significantly enhances stiffness and strength, thereby creating a “strong front, weak rear” stiffness gradient. During impact, the increased load-bearing capacity of the front web plate effectively resists the pressure wave transmitted by the water medium, and the resulting deformation remains confined to a narrow elastic range. High-speed recordings and 3D scanning reveal that almost no visible deformation occurs in the front web plate, confirming its effective structural protection.

3.1.2. Failure Morphology of Bottom Plate

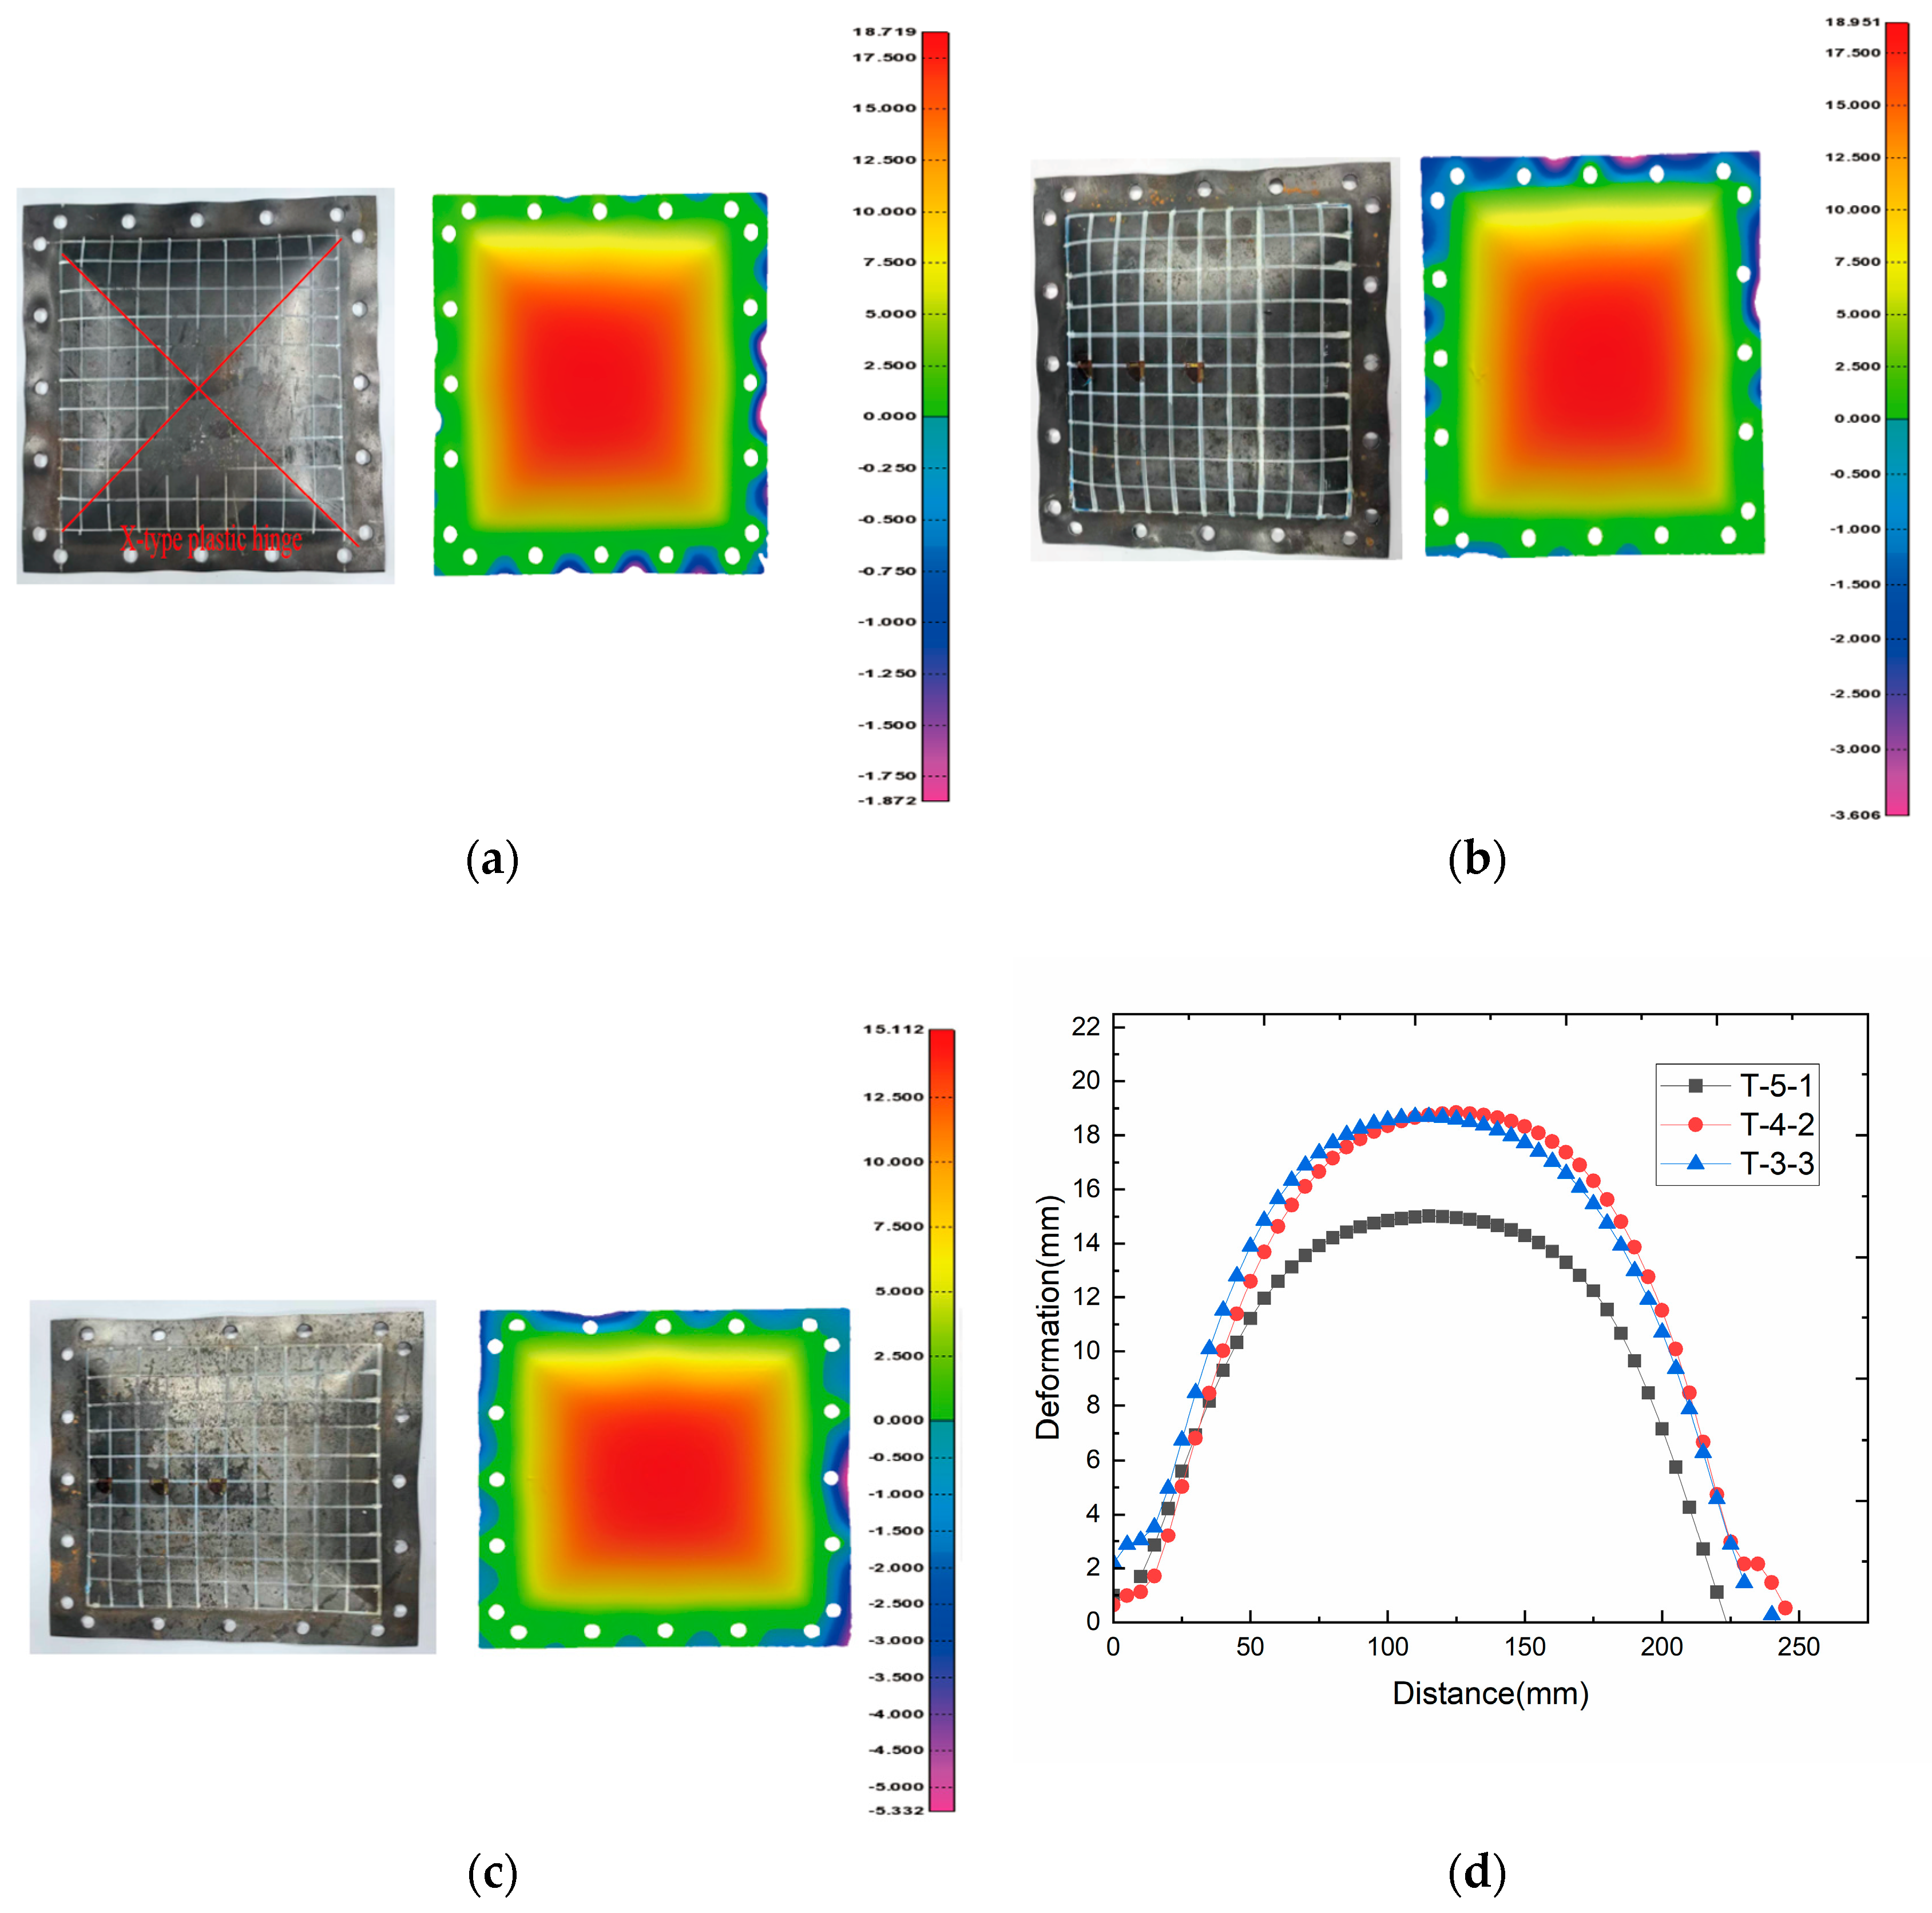
In this study, the lower wall panel of the structure is identified as the target protective wall, and its degree of deformation directly reflects the protective performance of the system [24]. Figure 7 shows the deformation and failure characteristics of the lower wall panel under three experimental conditions. Overall, the panel exhibits a bending deformation mode, with the deflection distribution consistently displaying a symmetric pattern characterized by “lower around, higher in the middle”. As the load increases, the lower wall panel undergoes an elastic phase, followed by plastic flow and finally unloading. Due to the concentration of the bending moment at the central region, a plastic hinge forms first in this zone. As loading continues, the hinge extends diagonally, forming a cross-shaped plastic hinge. In T-3-3, where the rear wall panel provides limited protection, the lower wall panel bears most of the pressure transmitted by the water medium. As a result, it experiences elastic–plastic bending deformation and significant residual bending, with a maximum central deflection of 18.951 mm. In T-4-2, due to the relatively small difference in thickness between the front and rear wall panels, the sacrificial wall panel cannot fully dissipate the impact energy. Consequently, the damage characteristics of the lower wall panel remain similar to those of an equal-strength structure, with a failure mode close to that of T-3-3 and a peak deflection of 18.719 mm. In contrast, in T-5-1, the rear wall panel undergoes large-deflection plastic deformation, which enables it to release the pressure potential energy of the water medium. As a result, the amount of energy transmitted to the lower wall panel is reduced, and the maximum central deflection decreases to 15.112 mm, representing a 19.2% reduction compared to T-3-3.
According to the displacement curves of the center section of maximum deflection shown in Figure 7d, T-5-1 exhibits the smallest deflection peak, while the peak values in T-4-2 and T-3-3 are comparatively close. The initial energy dissipation by the rear web plate shifts the pressure distribution in the water medium, displacing the peak pressure further toward the rear and reducing the load applied to the lower wall panel. A comparative analysis reveals that the deflection of the lower wall panel is highest in T-3-3, where the stiffness of all wall panels is uniform. In such cases, the impact energy is distributed evenly across the structure, leading to higher load on the protective target. In the unequal-strength configurations such as T-5-1, the energy release effect of the rear wall panel reduces the load on the lower panel, thereby improving the protective performance of the structure.

3.1.3. Relationship Between Plate Matching Strength and Failure Morphology

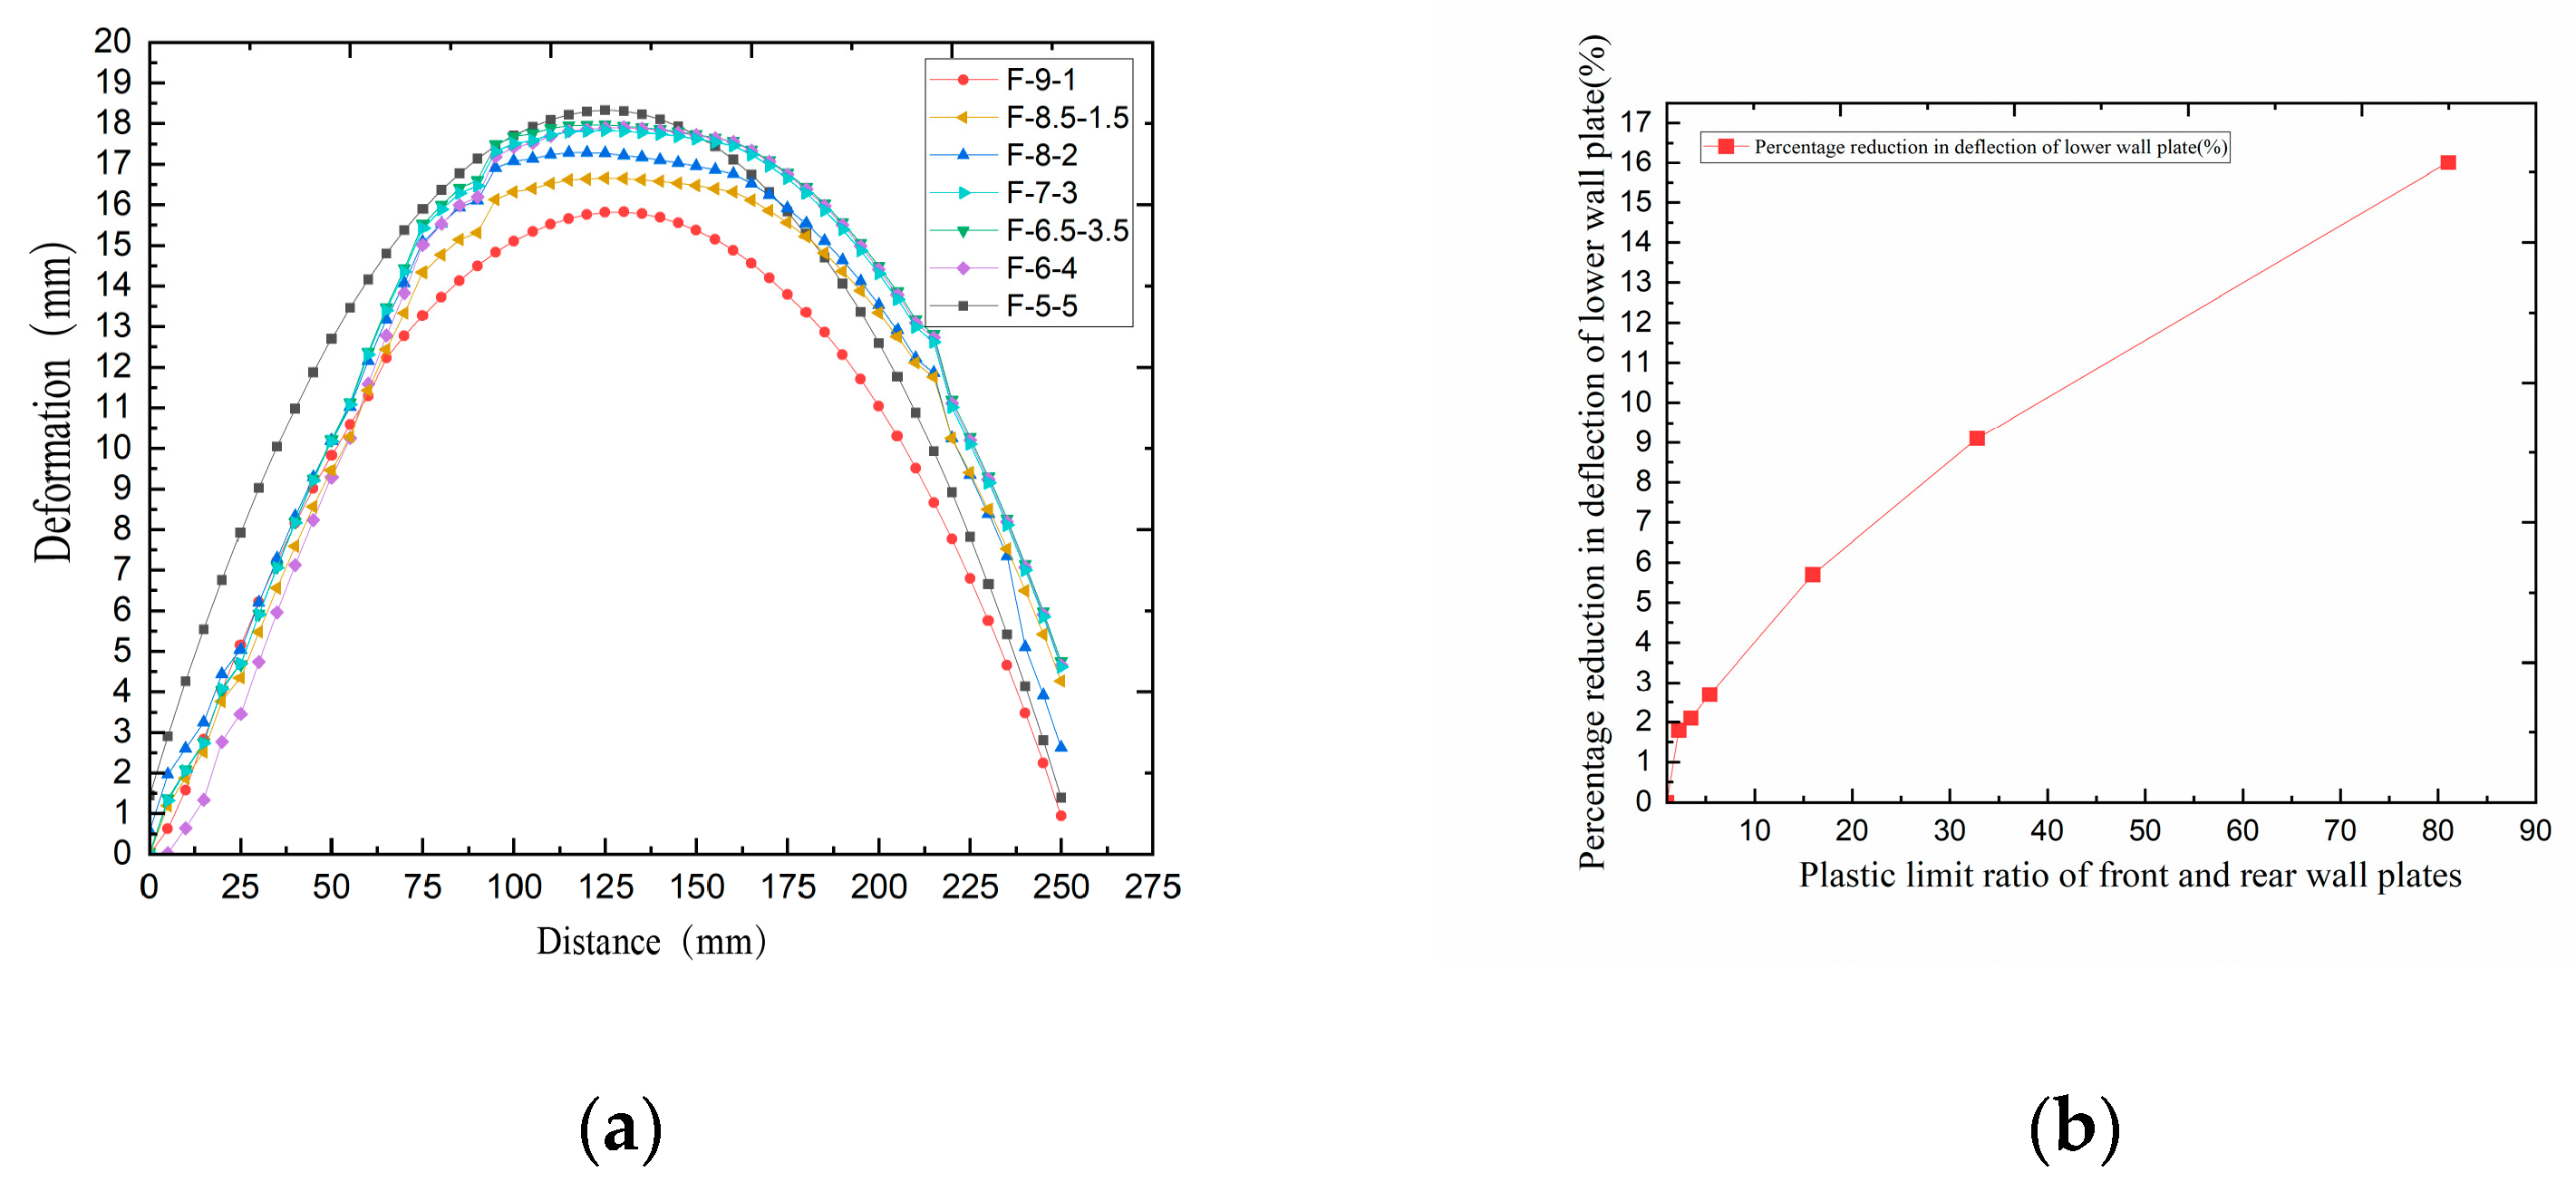
According to Equation (1), the plastic limit ratio between the front and rear wall plates in T-4-2 is 5.69, and the maximum deflection of the lower wall plate is reduced by 7.2% compared to T-3-3. For T-5-1, the plastic limit ratio reaches 24.91, resulting in a 19.2% reduction in the maximum deflection of the lower plate relative to T-3-3. To further investigate this relationship, the variation in maximum deflection of the lower wall plate was analyzed across a broader range of plastic limit ratios between the front and rear wall plates. Maintaining constant total mass of the structural wall and holding the drop hammer mass and impact velocity fixed, seven simulation cases—F-9-1, F-8-2, F-8.5-1.5, F-7-3, F-6.5-3.5, F-6-4, F-5-5—were designed, as previously detailed in Table 1. Figure 8 presents the displacement curves at the center section corresponding to maximum deflection for each of these simulation case. Using F-5-5 as a baseline, both the reduction in maximum deflection of the lower wall plate and the corresponding plastic limit ratios were calculated relative to F-5-5. The results are plotted in Figure 8b. The resulting curve approximates a linear trend: as the plastic limit ratio increases, the deflection of the lower wall plate decreases significantly. The figure shows that for small plastic limit ratios, even modest increases in the stiffness gradient between front and rear plates lead to considerable reductions in deflection. However, as the plastic limit ratio continues to increase, the improvement in deflection reduction begins to taper off, illustrating a “diminishing marginal benefit” effect in the context of plastic energy dissipation. Therefore, adjusting the wall plate strength to achieve a plastic limit ratio in the range of approximately 20–38 can effectively ensure structural stability while significantly reducing deflection deformation of the lower wall plate, thereby enhancing the overall protective capability of the structure.

3.2. Dynamic Response Process of the Structure

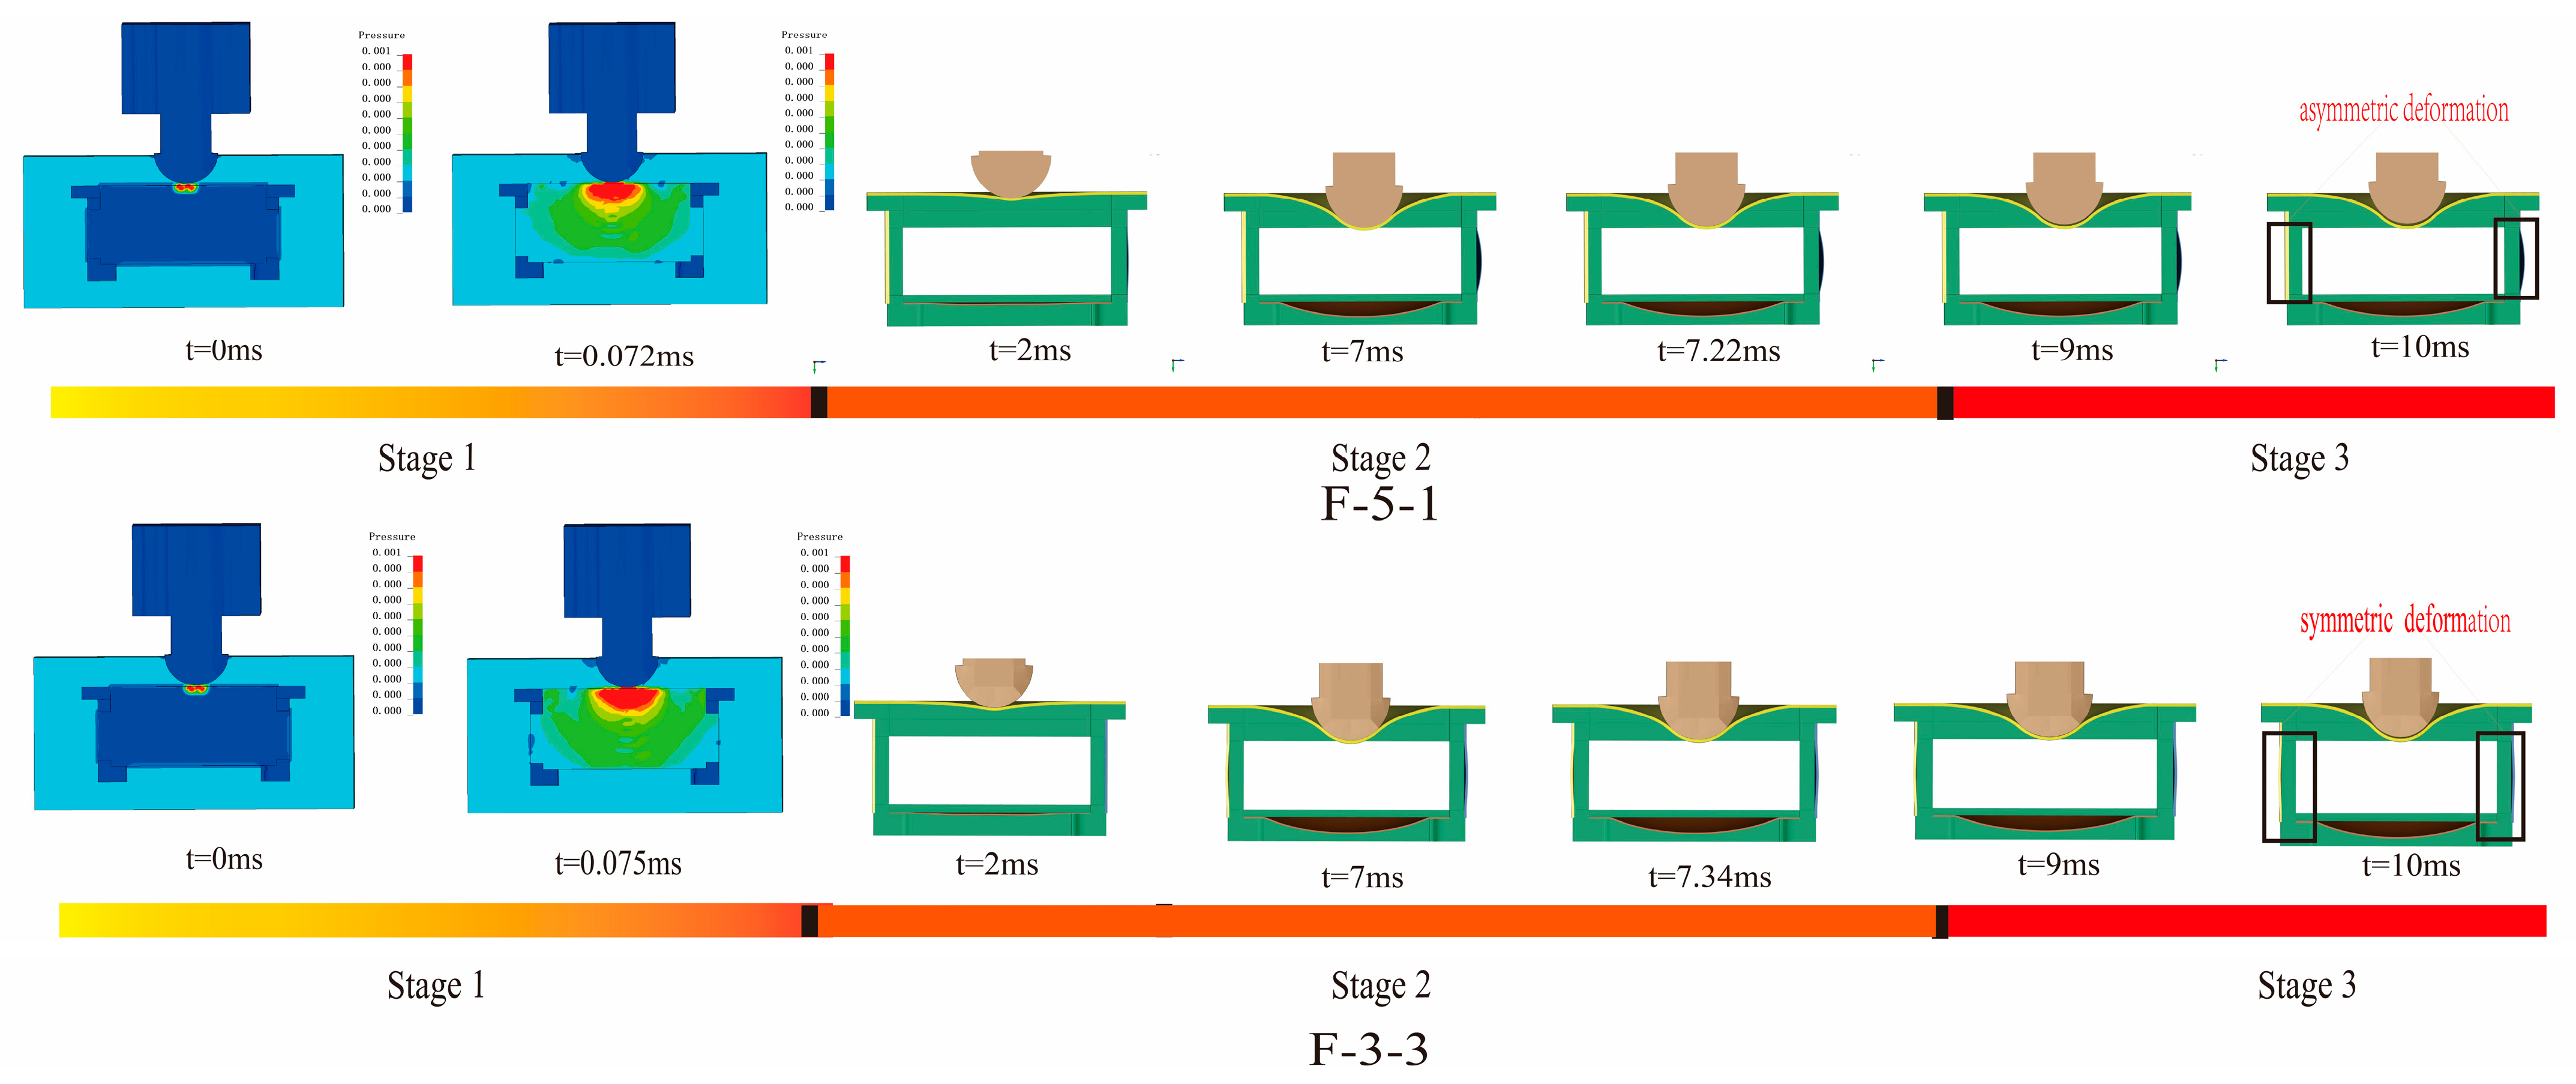
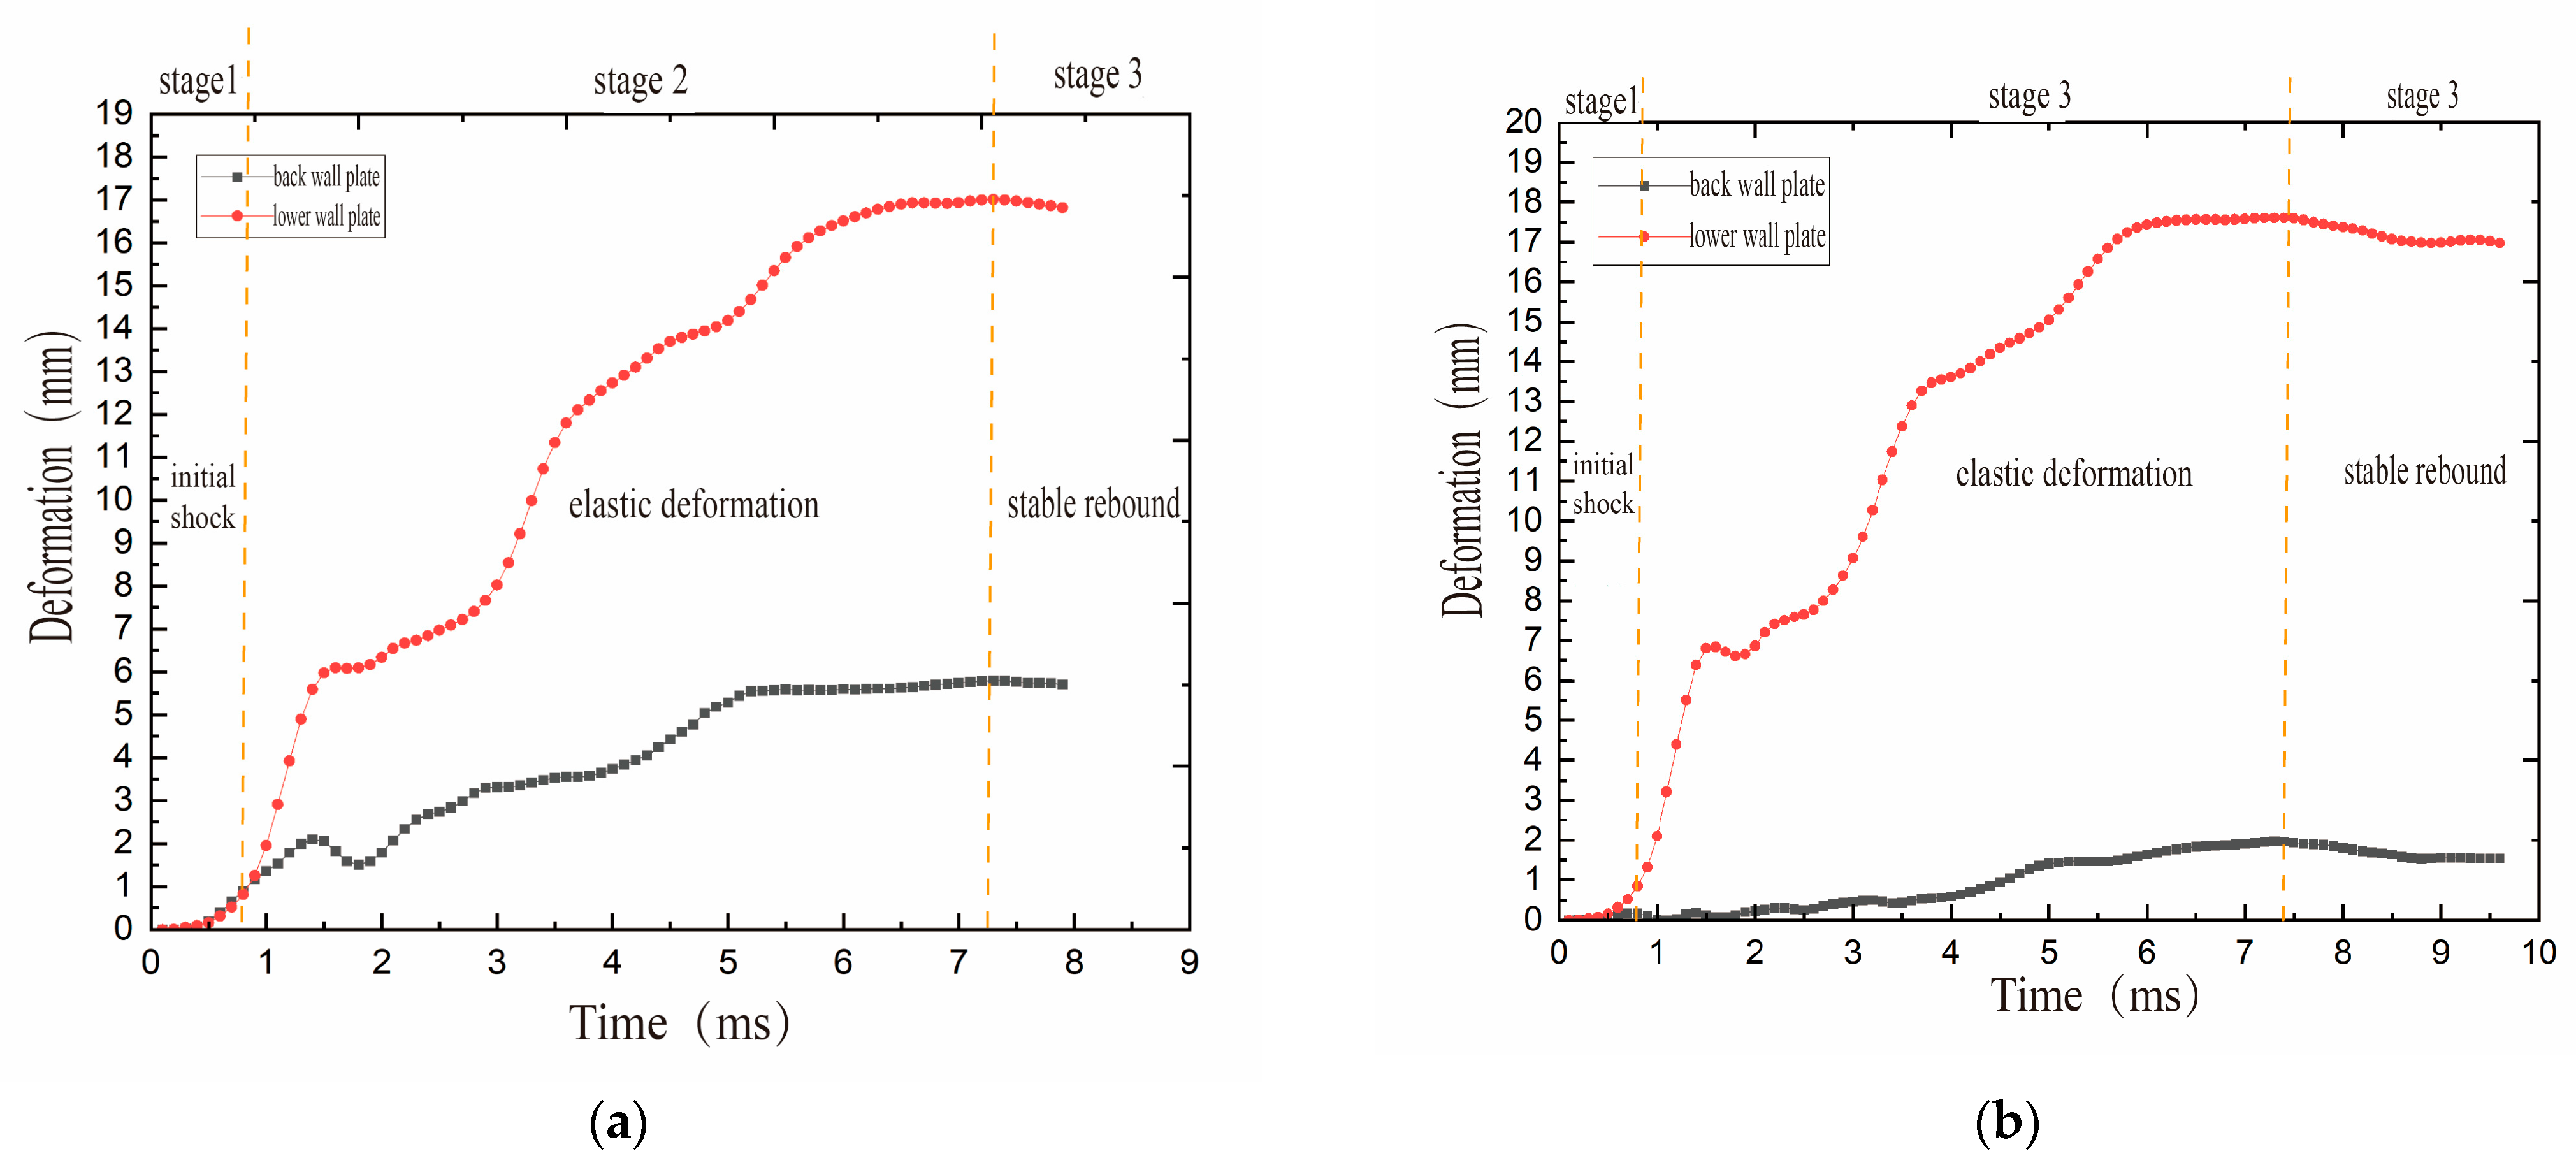
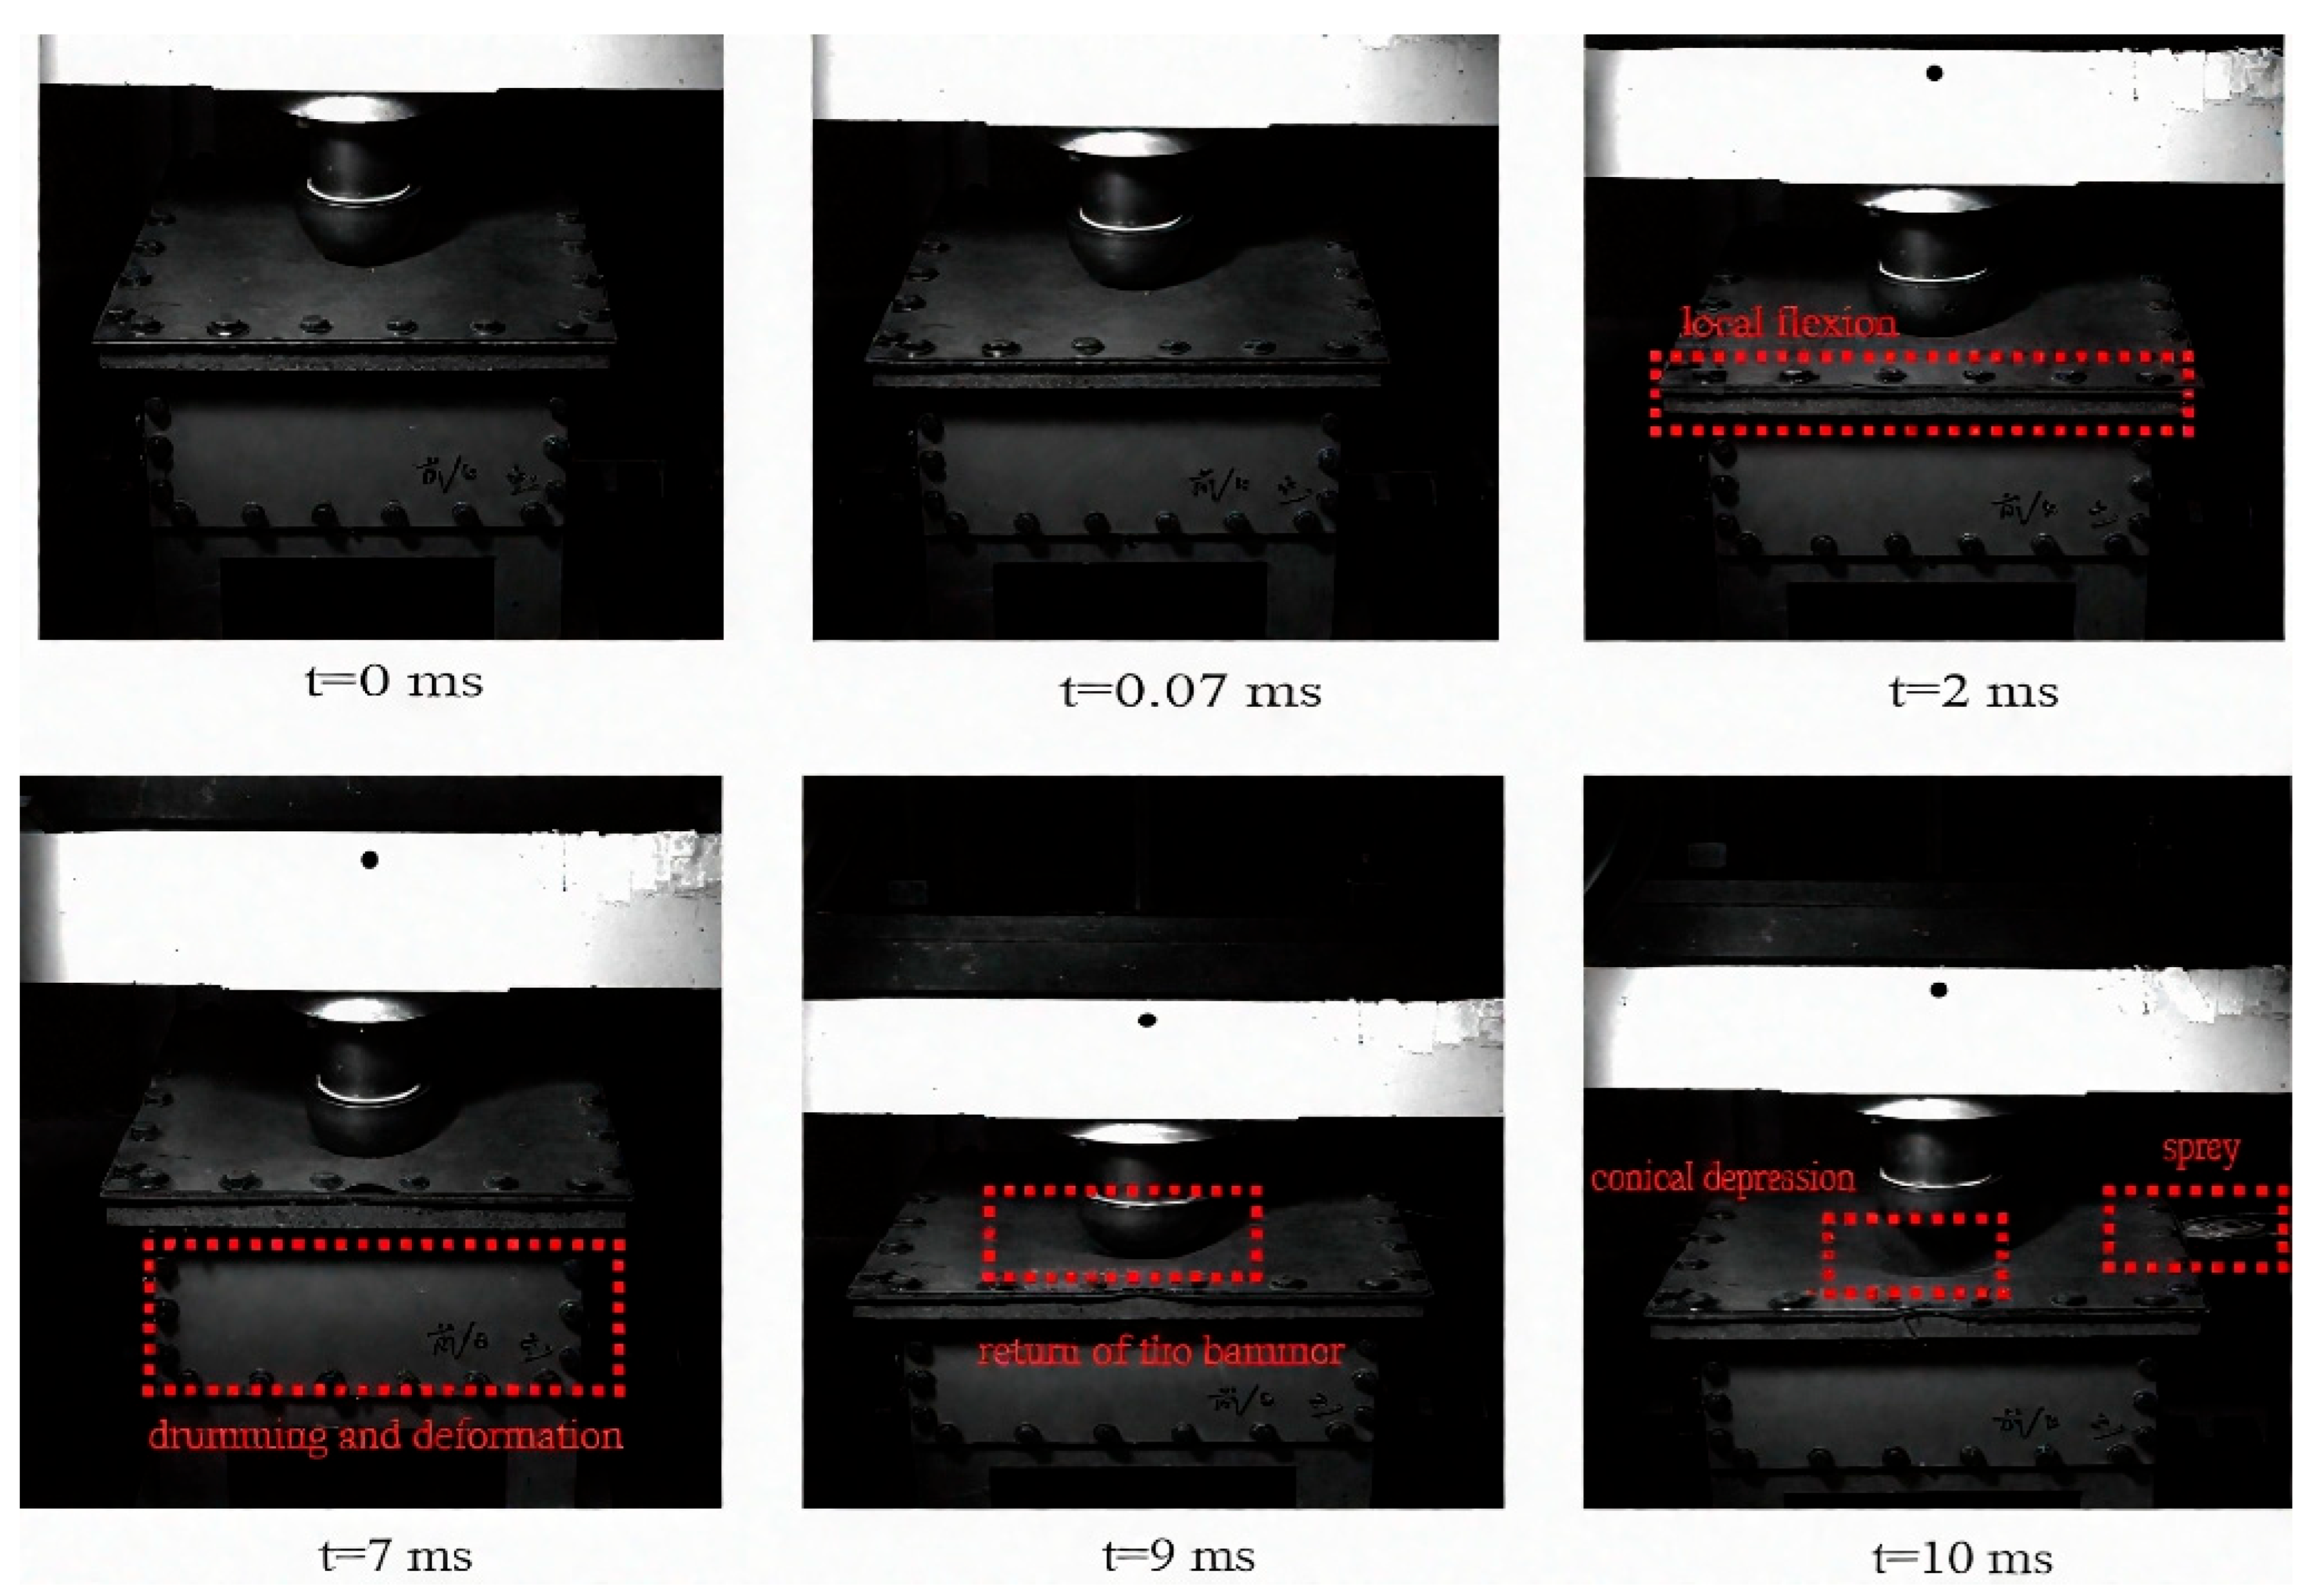
Typical structures F-5-1 and F-3-3 were selected to analyze their dynamic response processes and the characteristic deformation behavior of the structural panels, as shown in Figure 9 and Figure 10. At t = 0 ms, the structure generates pressure to the drop hammer impact, initiating a shock wave. At t = 0.075 ms, the shock wave first reaches the lower panel, and deformation begins to occur in both the lower and rear panels. At t = 7.34 ms, the panels reach their maximum deformation. The dynamic response process of the T-3-3 structure, recorded using high-speed photography, is presented in Figure 11. Based on both experimental records and simulation results, the post-impact structural response can be divided into three stages. The first is the initial impact phase, where the drop hammer delivers a high-intensity instantaneous load to the upper panel at t = 0 ms. The water medium behind the upper panel is disturbed, producing an initial shock wave that propagates as a spherical pressure wave through the liquid and reaches the lower panel. The second is the elasto–plastic deformation stage. As the impact load continues, the panels reach their plastic limit strength. The upper panel enters the plastic flow regime, experiencing significant buckling and instability in its central region. The drop hammer closely presses into the panel surface, forming a conical indentation. The rapid reduction in volume of the liquid-containing structure generates pressure waves in the liquid, which are transmitted to the other structural panels and cause bulging deformation. The third stage is the stabilization and rebound stage. In this phase, each panel reaches its maximum deflection. The drop hammer gradually loses its kinetic energy and begins to rebound, while the side panels unload following elastic behavior, leading to residual deformation. The bending deformation at the fixed panel edges compromises sealing, allowing the water medium to escape through the gaps along the boundaries. At this point, the deformation of all panels is complete, and the water splash has negligible influence on the final deformation. The structure enters a state of deformation stabilization.
The deformation behavior of the T-5-1 structure with unequal-strength web plates differs significantly during the second stage. The asymmetry in deformation arises from the intentional thickness gradient between the front and rear web plates. In the equal-strength sidewall structure T-3-3, where the front and rear web plates have identical thickness and stiffness, the pressure waves generated by compression of the upper panel are transmitted symmetrically. Consequently, the deformation responses of the front and rear web plates are synchronous, both undergoing bending, with a deformation difference of less than 0.5%. The entire structure maintains symmetric deformation. In contrast, the unequal-strength structure T-5-1 exhibits clearly asymmetrical deformation during the second stage. The thinner rear web plate, having lower plastic limit strength, reaches the plastic deformation regime earlier under the pressure wave and undergoes noticeable deflection. The redistribution of pressure wave energy causes the weakened rear plate to become the primary recipient of the impact load. Meanwhile, the front web plate, reinforced with greater thickness and plastic limit strength, remains in the elastic regime for a longer period, suppressing plastic deformation and resulting in smaller deflection. Therefore, during the dynamic response, the front and rear web plates are subjected to asymmetric loading, leading to distinctly different deformation behaviors.

4. Energy Absorption and Protective Mechanism

4.1. Energy Absorption Characteristics

The mechanism of energy absorption and distribution under impact loading in a liquid-holding structure is a key factor in evaluating its impact resistance performance. During the hammer drop, energy transfer follows a specific sequence: In the initial stage, the kinetic energy of the hammer is rapidly converted into the plastic and elastic deformation energy of the upper plate, producing local denting and overall bending. As a direct load-bearing component, the upper plate initially absorbs a large proportion of the impact energy. Subsequently, deformation of the upper plate compresses the water medium behind it, transforming the plate’s deformation energy into the pressure potential energy and kinetic energy of the fluid. This generates pressure waves that propagate to the other plates in the structure. Finally, through fluid–structure coupling, the energy in the water medium is transferred to the plates and dissipated through plastic flow, elastic deformation, and other mechanisms.
Each plate, depending on its strength, undergoes either elastic or plastic deformation. The energy absorbed through elastic deformation can be expressed using the principle of elastic strain energy:
U e = 1 2 k δ e 2
where Ue is the elastic strain energy absorbed, k is the structural stiffness, and δe is the elastic limit deflection.
The energy absorbed through plastic deformation follows the principle of plastic work:
U p = δ e δ max F ( δ ) d δ
where Up is the plastic work, F is the applied load on the panel, and δ is the structural plastic deformation.
From Equation (1), it follows that the smaller the plate thickness, the lower its plastic limit strength. Consequently, for the same incremental pressure load, the plate will reach the plastic flow stage more rapidly. At this point, the energy absorbed by the structure is dominated by “plastic energy”, as described in Equation (7). The greater the plastic deformation, the higher the energy absorbed. By deliberately designing the low-strength plate to undergo large deflection deformation, the plate’s energy absorption can be increased, achieving directional energy release.
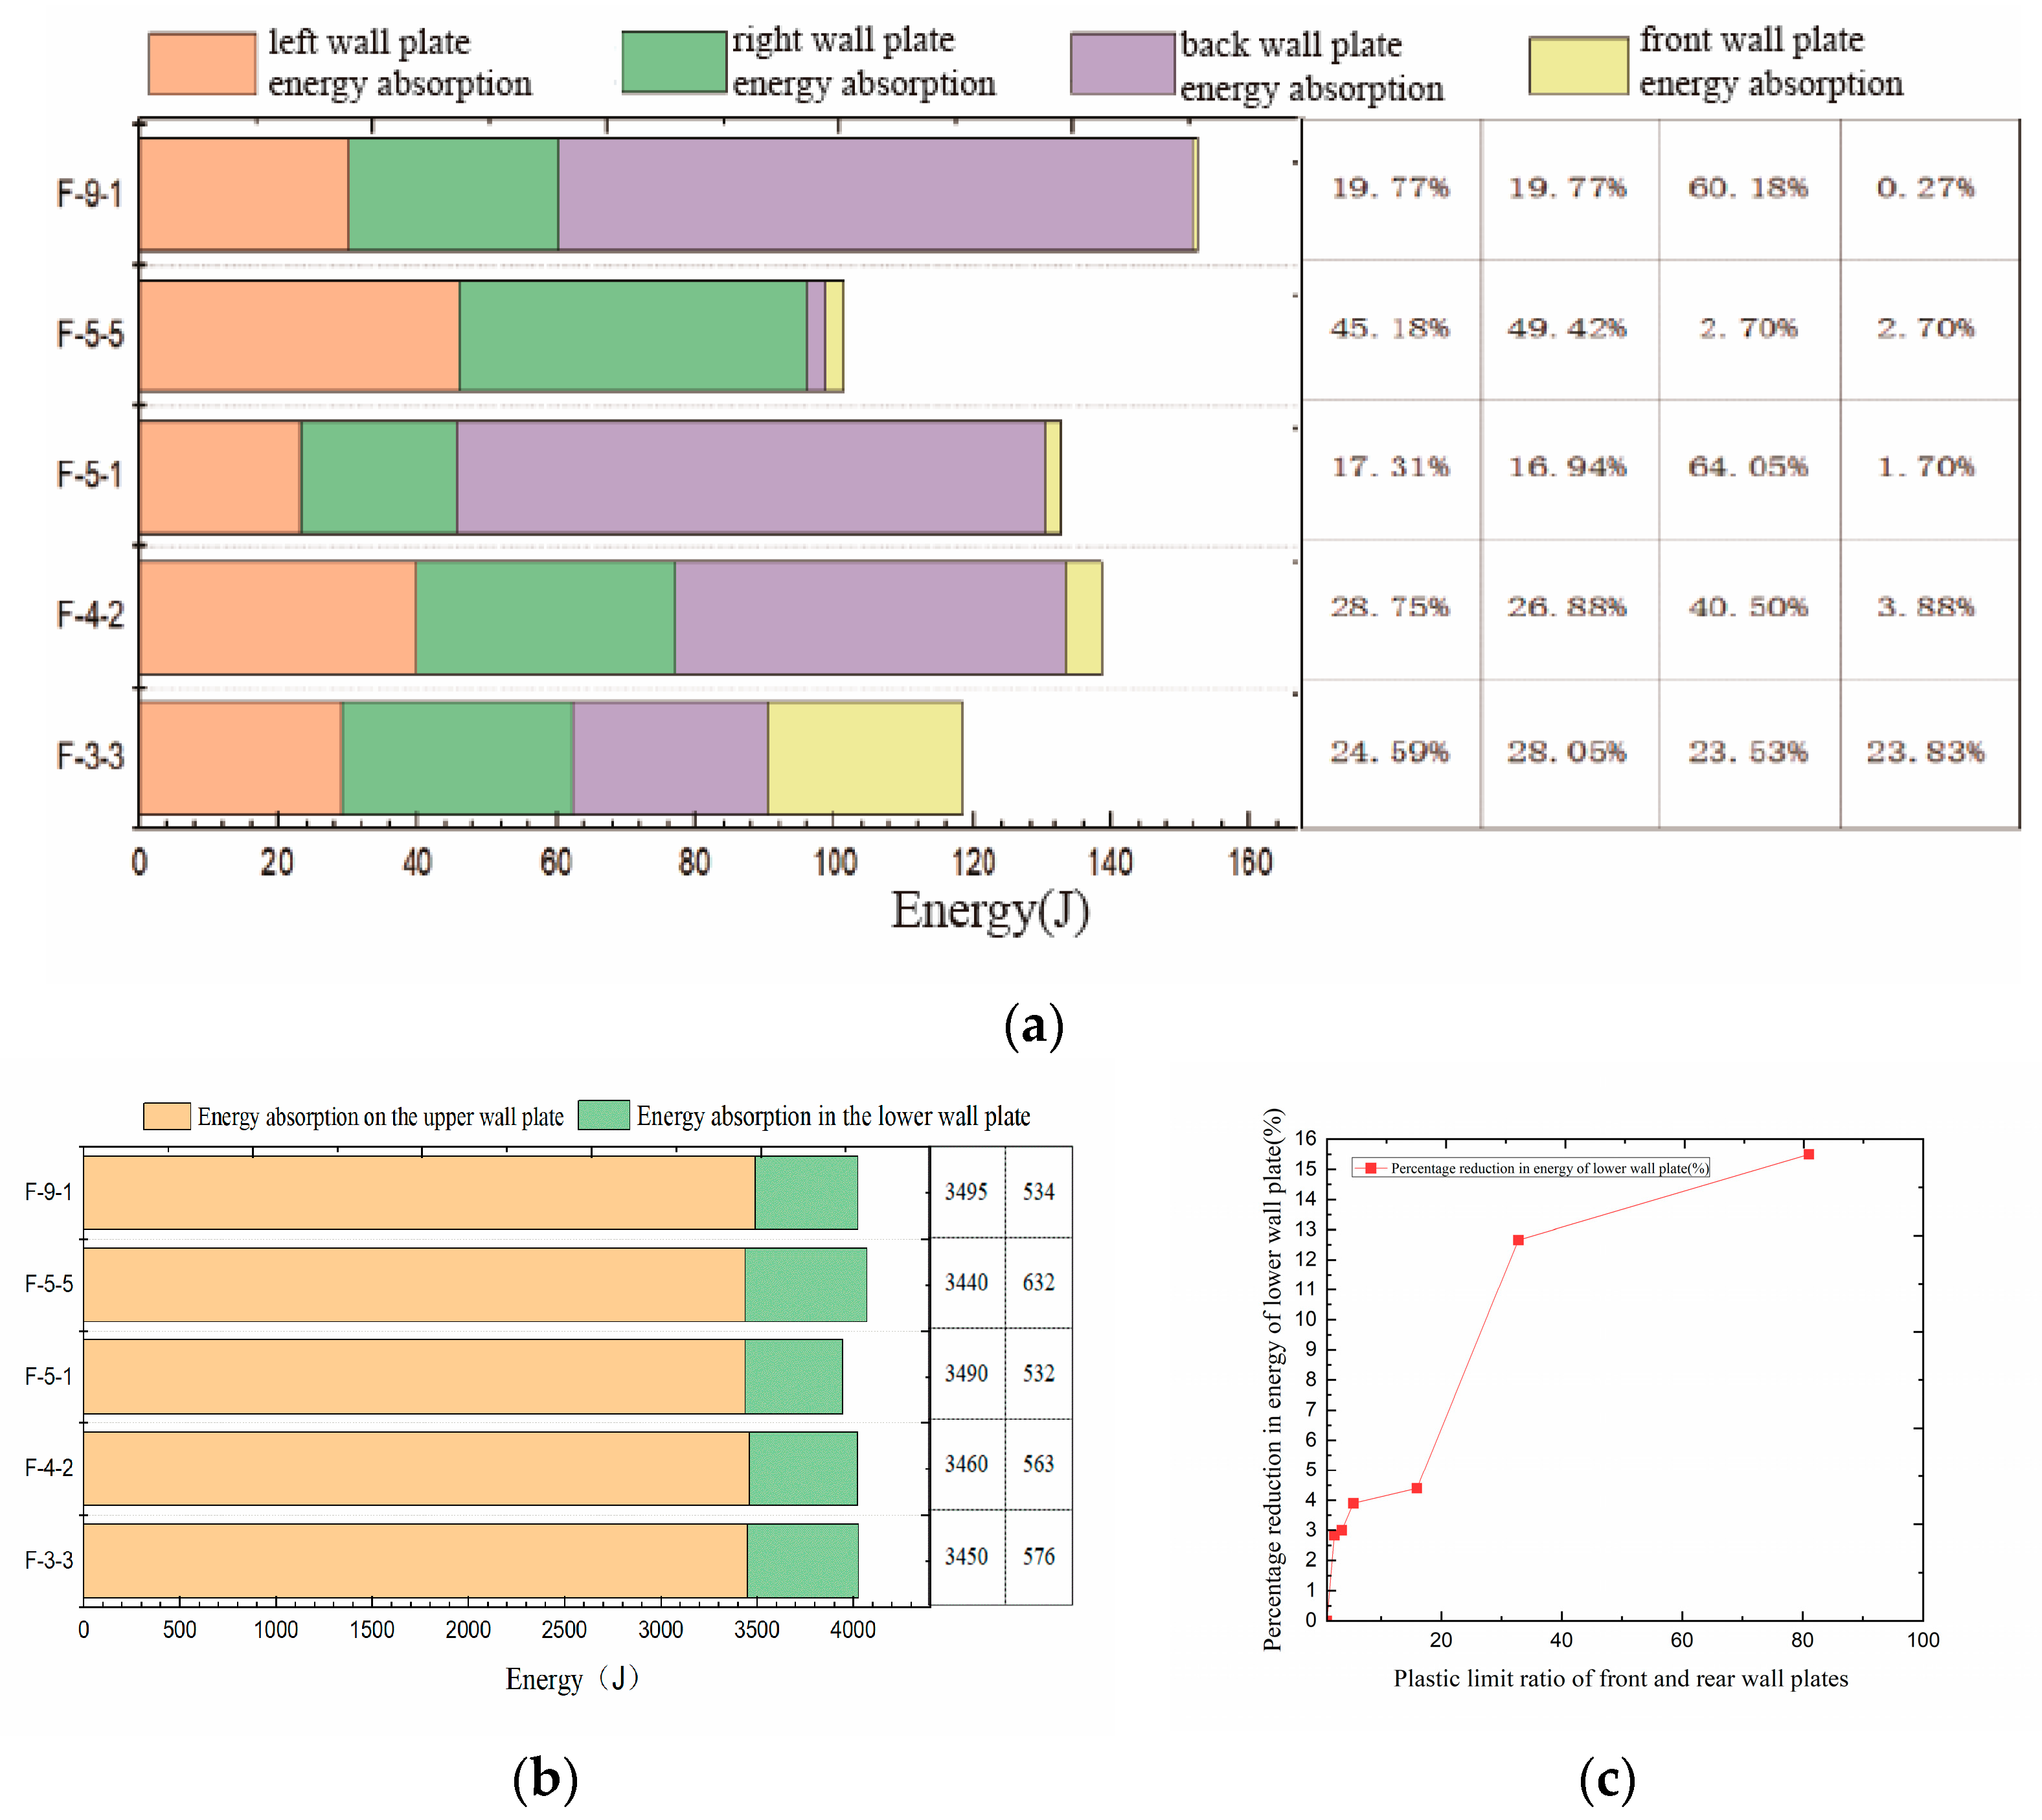
Figure 12a illustrates the energy absorption ratio of each side wall plate in the typical structure, defined as the ratio of the energy absorbed by a given wall plate to the total energy absorbed by all side wall plates. Figure 12b presents the energy absorption values of the upper and lower wall plates. For F-3-3, owing to the uniform strength of each side wall plate, the energy transmitted from the water medium is distributed evenly among them, with differences in energy absorption ratio below 5%, indicating balanced energy sharing. With the front and rear wall plates having higher plastic limit strength, and under equal impact loads, these plates undergo only elastic deformation, resulting in small structural deflections. According to Equation (6), their energy absorption is correspondingly low, and most of the pressure potential energy generated by the water medium is instead transferred to the lower wall plate. In contrast, for unequal strengths such as F-5-1, the reduction in rear wall plate thickness lowers its local strength, causing it to enter the plastic deformation stage under impact. This leads to significantly greater energy absorption through plastic work compared to elastic strain energy. As a result, the energy absorption ratio of the rear wall plate is substantially higher than that of the front wall plate, exhibiting a directional absorption pattern that reduces the energy transferred to the lower wall plate.
For T-4-2, the plastic limit ratio between the front and rear wall plates is 5.69, and the energy absorption value of the lower wall plate is reduced by 2.2% compared to T-3-3. For T-5-1, with a plastic limit ratio of 24.91, the energy absorption value of the lower wall plate decreases by 7.6% relative to T-3-3. Expanding the range of numerical simulation conditions, the relationship between the plastic limit ratio and the reduction in lower wall plate energy absorption is shown in Figure 12c. Simulations for F-9-1, F-8-2, F-8.5-1.5, F-7-3, F-6.5-3.5, F-6-4, and the structurally equivalent-mass F-5-5 reveal that increasing the plastic limit ratio of the front and rear wall plates leads to a progressive decrease in energy absorption by the lower wall plate. This reduction is associated with a shift in the rear wall plate’s deformation mode from elastic to plastic work. In this plastic regime, the rear wall plate absorbs a large proportion of the pressure potential energy from the water medium, substantially reducing the lower wall plate’s energy load. When the plastic limit ratio exceeds approximately 38, the efficiency of further energy reduction diminishes. These results demonstrate that inducing large-deflection plastic deformation in the rear wall plate plays a protective role for the target lower wall plate. For a constant total structural mass, reducing the strength of the rear wall plate alters the water medium’s energy transmission path, making the rear wall plate a “priority dissipation zone” for the pressure potential energy, thereby lowering the energy absorbed by the lower wall plate.
Figure 13 presents the dynamic evolution of energy absorption throughout the entire impact process for the fore plate, aft plate, and bottom plate of five representative structures. The observed energy absorption patterns closely correspond to the structures’ dynamic response behaviors. In the initial stage of hammer impact, the load is first concentrated on the upper plate, inducing local buckling. The bottom plate, acting as the primary target protection component, begins absorbing energy through elastic bending. Simultaneously, the aft plate absorbs a smaller amount of energy during the initial compression of the water medium, while the fore plate, owing to its high strength, absorbs almost no energy. At this stage, energy absorption primarily occurs in the form of elastic deformation energy. As the impact progresses, the upper plate enters a large deflection deformation phase, during which its indentation causes severe disturbances in the water medium. Through fluid–structure coupling, the resulting pressure wave propagates via the water to all structural plates. The energy absorbed by each plate subsequently enters an exponential growth stage, which marks the core phase of energy dissipation. Among the plates, the low-strength aft plate, due to its reduced thickness and low plastic limit strength, rapidly transitions from elastic deformation to the elastic–plastic flow stage. The high-strength fore plate primarily develops elastic strain energy, with its absorption curve remaining relatively stable, and the total energy absorbed decreases with increasing thickness. When the hammer’s kinetic energy is fully dissipated and rebound initiates, the structure enters a stabilization recovery phase. During this stage, each plate releases part of its deformation energy through elastic rebound, leading to a reduction in absorbed energy for all plates. However, because the aft plate has accumulated substantial plastic deformation energy, its energy absorption decreases significantly less than that of the fore plate, with its final residual absorbed energy exceeding 85%.

4.2. Study on Protective Mechanism

As illustrated in Figure 14, the strength-matching relationship among the structural plates constitutes the key technical pathway for achieving both impact resistance and efficient energy absorption in the unequal-strength liquid-holding structure. The core mechanism is to realize controlled diversion and targeted dissipation of impact load energy by strategically distributing strength among the wall plates. In this study, different wall plate thicknesses were selected to achieve varying plastic limit strengths. The thickness of the aft plate was deliberately reduced to lower its plastic limit strength, while maintaining the superior strength of the fore plate and other components. This configuration establishes a “strong–weak alternation” stiffness gradient system, enabling the aft plate to function as the “priority deformation zone” under impact loading. In the early phase of water pressure wave transmission, the aft plate enters the plastic flow regime, forming the core of the energy dissipation mechanism through large deflection bulging deformation.
From an energy distribution perspective [25], the gradient strength matching substantially modifies the energy transfer path under fluid–structure interaction, effectively reducing the transmission of energy to the bottom plate. According to the measured energy absorption ratios, the energy absorbed by the bottom plate decreases in a stepwise manner as the aft plate thickness is reduced, establishing a dynamic balance between sacrificial plate dissipation and target plate protection. The advantage of the unequal-strength configuration lies in overcoming the limitation of uniform energy distribution observed in equal-strength structures by intentionally designating a weak zone, thus granting the structure selective deformation capability. The plastic deformation of the aft plate not only directly consumes impact energy but also alters the pressure field distribution within the water medium, shifting the peak pressure toward the aft side to achieve load redistribution. For a fixed total structural mass, this design maintains the stability of the load-bearing frame while implementing an efficient directional energy release mechanism via aft plate weakening, thereby reducing the overall structural mass. In equal-strength structures, rarefaction waves reflected from both the fore and aft plates meet at the center, creating a symmetric pressure cancellation zone. This causes the bottom plate to experience a uniform but prolonged pressure load, which can lead to substantial bending deformation. In contrast, in unequal-strength structures, the rarefaction wave reflected from the aft plate is weaker and propagates more slowly, whereas that from the fore plate is stronger and travels faster. The superposition of these waves results in both a lower peak pressure and a shorter loading duration in the bottom plate region, thereby reducing its deformation [26].
Figure 15 shows the equivalent model of a ship’s double-bottom liquid tank designed as an unequal-strength liquid-holding structure [27]. In current ship designs, the double-bottom structure is large, containing numerous empty compartments and non-critical areas. By adopting an unequal-strength configuration for the double-bottom liquid tank, impact loads from collisions or groundings can be intentionally directed toward non-critical compartments and structures, rather than being resisted directly by the inner bottom plate. This approach helps to avoid large-deflection deformation and failure [28]. To achieve this, low-strength web plates can be strategically installed in selected compartments to absorb and dissipate energy, thereby reducing deformation and damage to the inner bottom plate. This method significantly decreases the size and weight of traditional protective structures while improving the protective capability of double-bottom liquid tanks. While ensuring the protective effect, it addresses the issues of increased weight and cost caused by the traditional method of increasing wall thickness [29]. In practical engineering applications, ships may also be subjected to non-central impacts, and this impact mode will be the focus of future research [30].

5. Conclusions

In this study, the ship’s double-bottom structure was equivalently modeled as an unequal-strength liquid-holding structure. The post-impact failure and energy absorption behavior were investigated through a combination of drop hammer impact tests and finite element simulations. The failure morphology of the plates, dynamic response process, energy dissipation characteristics, and protective performance under impact loading were analyzed. The plastic limit strength of each plate was calculated, enabling the relationship between different fore and aft plate strength ratios and energy absorption to be established. The main conclusions are as follows:
(1)
Effect of aft plate thickness on deformation and load distribution: Reducing the aft plate thickness in the unequal-strength liquid-holding structure lowers its plastic limit strength, causing large-deflection plastic deformation under impact loading and developing an annular and funnel-shaped plastic hinge. The bottom plate also undergoes plastic deformation, forming a cruciform plastic hinge. A smaller aft plate thickness results in a lower final deflection of the bottom plate. Due to the enhanced load-bearing capacity of the fore plate, it can effectively withstand the pressure wave transmitted through the water medium, limiting its deformation to the elastic range and keeping it minimal.
(2)
Dynamic response stages and asymmetry in deformation: Based on the shock wave propagation and structural deformation sequence, the dynamic response can be divided into three stages: initial impact, plate elastic–plastic deformation, and stabilized rebound. Compared with an equal-strength sidewall configuration, the unequal-strength structure directs the pressure wave preferentially toward the low-strength plate. The hammer-induced pressure wave produces asymmetric loading during transmission, leading to asymmetric deformation of the structure.
(3)
Influence of fore–aft plate plastic limit ratio on protective performance: As the plastic limit ratio between the fore and aft plates increases, the deflection and energy absorption of the bottom plate decrease more significantly compared to the equal-strength configuration. The maximum efficiency in reducing plate deflection and energy absorption is achieved when the plastic limit ratio is approximately 20–35. Beyond this range, the rate of improvement diminishes, illustrating the “marginal diminishing effect” of plastic deformation. Maintaining a fore–aft plate plastic limit ratio between 20 and 38 ensures structural stability and maximizes energy absorption and protective performance of the unequal-strength liquid-holding structure.

Author Contributions

Conceptualization, Z.C. and D.L.; Investigation, Z.C. and Y.L.; Methodology, Z.C.; Data curation, Z.C. and Y.L.; Formal analysis, Z.C., Y.L., H.H. and D.L.; Visualization, Z.C. and Y.L.; Project administration, Y.L. and D.L.; Resources, Y.L. and D.L.; Original draft, Z.C. and D.L.; Validation, Z.C., Y.L., H.H. and D.L.; Review and editing, Z.C., Y.L., H.H. and D.L.; Supervision, Y.L., H.H., and D.L. All authors have read and agreed to the published version of the manuscript.

Funding

The authors gratefully acknowledge the financial support provided by National Natural Science Foundation of China [grant no. 52371342].

Data Availability Statement

The original contributions presented in this study are included in the article. Further inquiries can be directed to the corresponding author.

Acknowledgments

We extend our gratitude to Liang Hong and Yi Zheng from Nanjing University of Science and Technology for their generous support in providing the experimental site and technical assistance in the field of ballistics.

Conflicts of Interest

The authors declare no conflicts of interest.

References

  1. Li, Y.N.; Gao, Z.; Gu, Y.N. Calibration Calculation of Specimen Ultimate Plasticity and Ship Grounding Model Test. Ship Eng. 2002, 6, 13–16. [Google Scholar]
  2. Nguyen, T.-H.; Amdahl, J.; Leira, B.J.; Garrè, L. Understanding ship-grounding events. Mar. Struct. 2011, 24, 551–569. [Google Scholar] [CrossRef]
  3. Zhang, L.G. Finite Element Analysis of Ship Collision Process and Emergency Avoidance Suggestions. Pearl River Water Transp. 2024, 20, 134–136. [Google Scholar]
  4. Prabowo, A.R.; Muttaqie, T.; Sohn, J.M.; Harsritanto, B.I.R. Investigation on structural component behaviours of double bottom arrangement under grounding accidents. Theor. Appl. Mech. Lett. 2019, 9, 50–59. [Google Scholar] [CrossRef]
  5. Yu, Z.L. Study on the Damage Mechanism of the Main Component Stiffeners of the Double Bottom When the Ship is Grounded on a Platform-Shaped Reef. Master’s Thesis, Shanghai Jiao Tong University, Shanghai, China, 2015. [Google Scholar]
  6. Sun, B. Research on the Structural Damage Mechanism and Ultimate Strength Prediction of Ships in Collision and Grounding Scenarios. Master’s Thesis, Shanghai Jiao Tong University, Shanghai, China, 2020. [Google Scholar]
  7. Guo, J.; Cui, J.; Xiao, W.; Sun, F.; Li, S.M. Dynamic Response of Ship Double-Bottom Liquid Tanks Under Underwater Explosion. Noise Vib. Control 2012, 32, 94–99. [Google Scholar]
  8. Ma, X.; Zhang, Y.C.; Wang, Z.L. Research on the Anti-impact Performance of Double-bottom Structure Units Under Underwater Non-Contact Explosion Loads. Ship Sci. Technol. 2008, 30, 39–43. [Google Scholar]
  9. Bornstein, H.; Phillips, P.; Anderson, C. Evaluation of the blast mitigating effects of fluid containers. Int. J. Impact Eng. 2015, 75, 222–228. [Google Scholar] [CrossRef]
  10. Zhou, Y.; Wang, T.; Zhu, W.; Bian, X.; Huang, G. Evaluation of blast mitigation effects of hollow cylindrical barriers based on water and foam. Compos. Struct. 2022, 282, 115016. [Google Scholar] [CrossRef]
  11. Wang, D.X.; Liu, Z.X.; Hu, H.; Cao, J.; Li, W.J. Special Structure of Cylindrical Explosion Containers. Sichuan Ordnance J. 2012, 33, 70–72. [Google Scholar]
  12. Zhao, P.D.; Huang, S.; Yin, J.P.; Zhang, L.; Huang, Y.Y.; Xu, Y.X. Numerical Simulation of the Influence of the Thickness of the Explosion Relief Thin Plate on the Damage of the Cabin and the Load in the Cabin. Chin. J. Ship Res. 2019, 14, 58–65+82. [Google Scholar]
  13. Chen, Y.; Huang, W.; Constantini, S. Blast Shock Wave Mitigation Using the Hydraulic Energy Redirection and Release Technology. PLoS ONE 2012, 7, e39353. [Google Scholar] [CrossRef] [PubMed]
  14. Shen, W.; Gu, X.; Jiang, P.; Hu, J.; Lv, X.; Qian, L. Crushing analysis and multiobjective optimization design for rectangular unequal triple-cell tubes subjected to axial loading. Thin-Walled Struct. 2017, 117, 190–198. [Google Scholar] [CrossRef]
  15. Fu, G.; Fu, G.; Yu, C.; Li, S.; Wang, F.; Yang, J. Behaviour of rectangular concrete-filled steel tubular slender column with unequal wall thickness. Eng. Struct. 2021, 236, 112100. [Google Scholar] [CrossRef]
  16. Kong, X.; Wei, W.; Xiao, L.; Shuang, X.; Tao, H. Numerical simulation of explosion inside ship compartments. Chin. Ship Res. 2009, 4, 7–11. [Google Scholar]
  17. Li, J.R.; Lu, Y.G.; Feng, X.W.; Wu, H. Analysis of the Loading Characteristics and Dynamic Behavior of RC Box Structures under Internal Explosion. Explos. Shock Waves 2025, 1–18. Available online: https://link.cnki.net/urlid/51.1148.o3.20250116.1650.009 (accessed on 1 September 2025).
  18. Zhao, Z.J.; Li, D.; Hou, H.L.; Yao, M.; Wuang, K. Study on dynamic response and loading mitigation characteristics of liquid-filled cell under drop-weight impact. Eng. Struct. 2021, 248, 113283. [Google Scholar] [CrossRef]
  19. Zhou, J.; Qin, R.; Chen, B. Energy absorption properties of multi-cell thin-walled tubes with a double surface gradient. Thin-Walled Struct. 2019, 145, 106386. [Google Scholar] [CrossRef]
  20. Wang, T.; An, J.; He, H.; Wen, X.; Xi, X. A novel 3D impact energy absorption structure with negative Poisson’s ratio and its application in aircraft crashworthiness. Compos. Struct. 2021, 262, 113663. [Google Scholar] [CrossRef]
  21. Zhang, Z.Q. Research on the Anti-impact Characteristics of Liquid-filled Double-layer Plate Structures. Master’s Thesis, Huazhong University of Science and Technology, Wuhan, China, 2017. [Google Scholar]
  22. Cui, J.; Zhang, A.M.; Yao, X.L.; Yang, S.T. Influence Analysis of Liquid Cargo in the Cabin on the Collision Performance of Double Sides. J. Ship Mech. 2011, 15, 259–268. (In English) [Google Scholar]
  23. Lu, G.Y.; Qin, B.; Zhang, G.Q.; Han, Z.J.; Lei, J.P. Dynamic Response of Sandwich Liquid-filled Thin-walled Hemispherical Shell Composite Structure under Impact. Explos. Shock Waves 2012, 32, 561–567. [Google Scholar]
  24. Guan, W.B.; Yang, H.W.; Hu, J.X.; Han, Z.J.; Lu, G.Y. Experimental and Numerical Analysis of Liquid-filled Hemispherical Shells under Drop Hammer Impact. J. Vib. Shock 2014, 33, 148–154. [Google Scholar]
  25. Zhang, J.Z.; Zhang, J.L. Research on the Liquid Impact Problem of Energy-absorbing Anti-collision Columns. J. Vib. Shock 2020, 39, 51–57. [Google Scholar]
  26. Wang, Z.P.; Xu, S.X.; Chen, W.; Le, J.X.; Chai, W.; Li, X.B. Characteristics of shock wave loading inside ship cabin with pressure relief hole. Chin. J. Ship Res. 2023, 18, 155–162. [Google Scholar]
  27. Held, M. Verification of the equation for radial crater growth by shaped charge jet penetration. Int. J. Impact Eng. 1995, 17, 387–398. [Google Scholar] [CrossRef]
  28. Gao, S.; Li, D.; Hou, H.; Li, Y.; Bai, X.; Jin, J.; Li, M.; Lin, Y. Investigation on dynamic response of liquid-filled concave cell structures subject to the penetration of high-speed projectiles. Thin-Walled Struct. 2020, 157, 107119. [Google Scholar] [CrossRef]
  29. Zhao, Z.J.; Hou, H.L.; Li, D. Research Progress on the Dynamic Characteristics and Protection Performance of Filled Multi-cell Anti-impact Protection Structures. Chin. J. Ship Res. 2021, 16, 96–111. [Google Scholar]
  30. Alavi Nia, A.; Sadeghi, M.Z. An experimental investigation on the effect of strain rate on the behaviour of bare and foam-filled aluminium honeycombs. Mater. Des. 2013, 52, 748–756. [Google Scholar] [CrossRef]
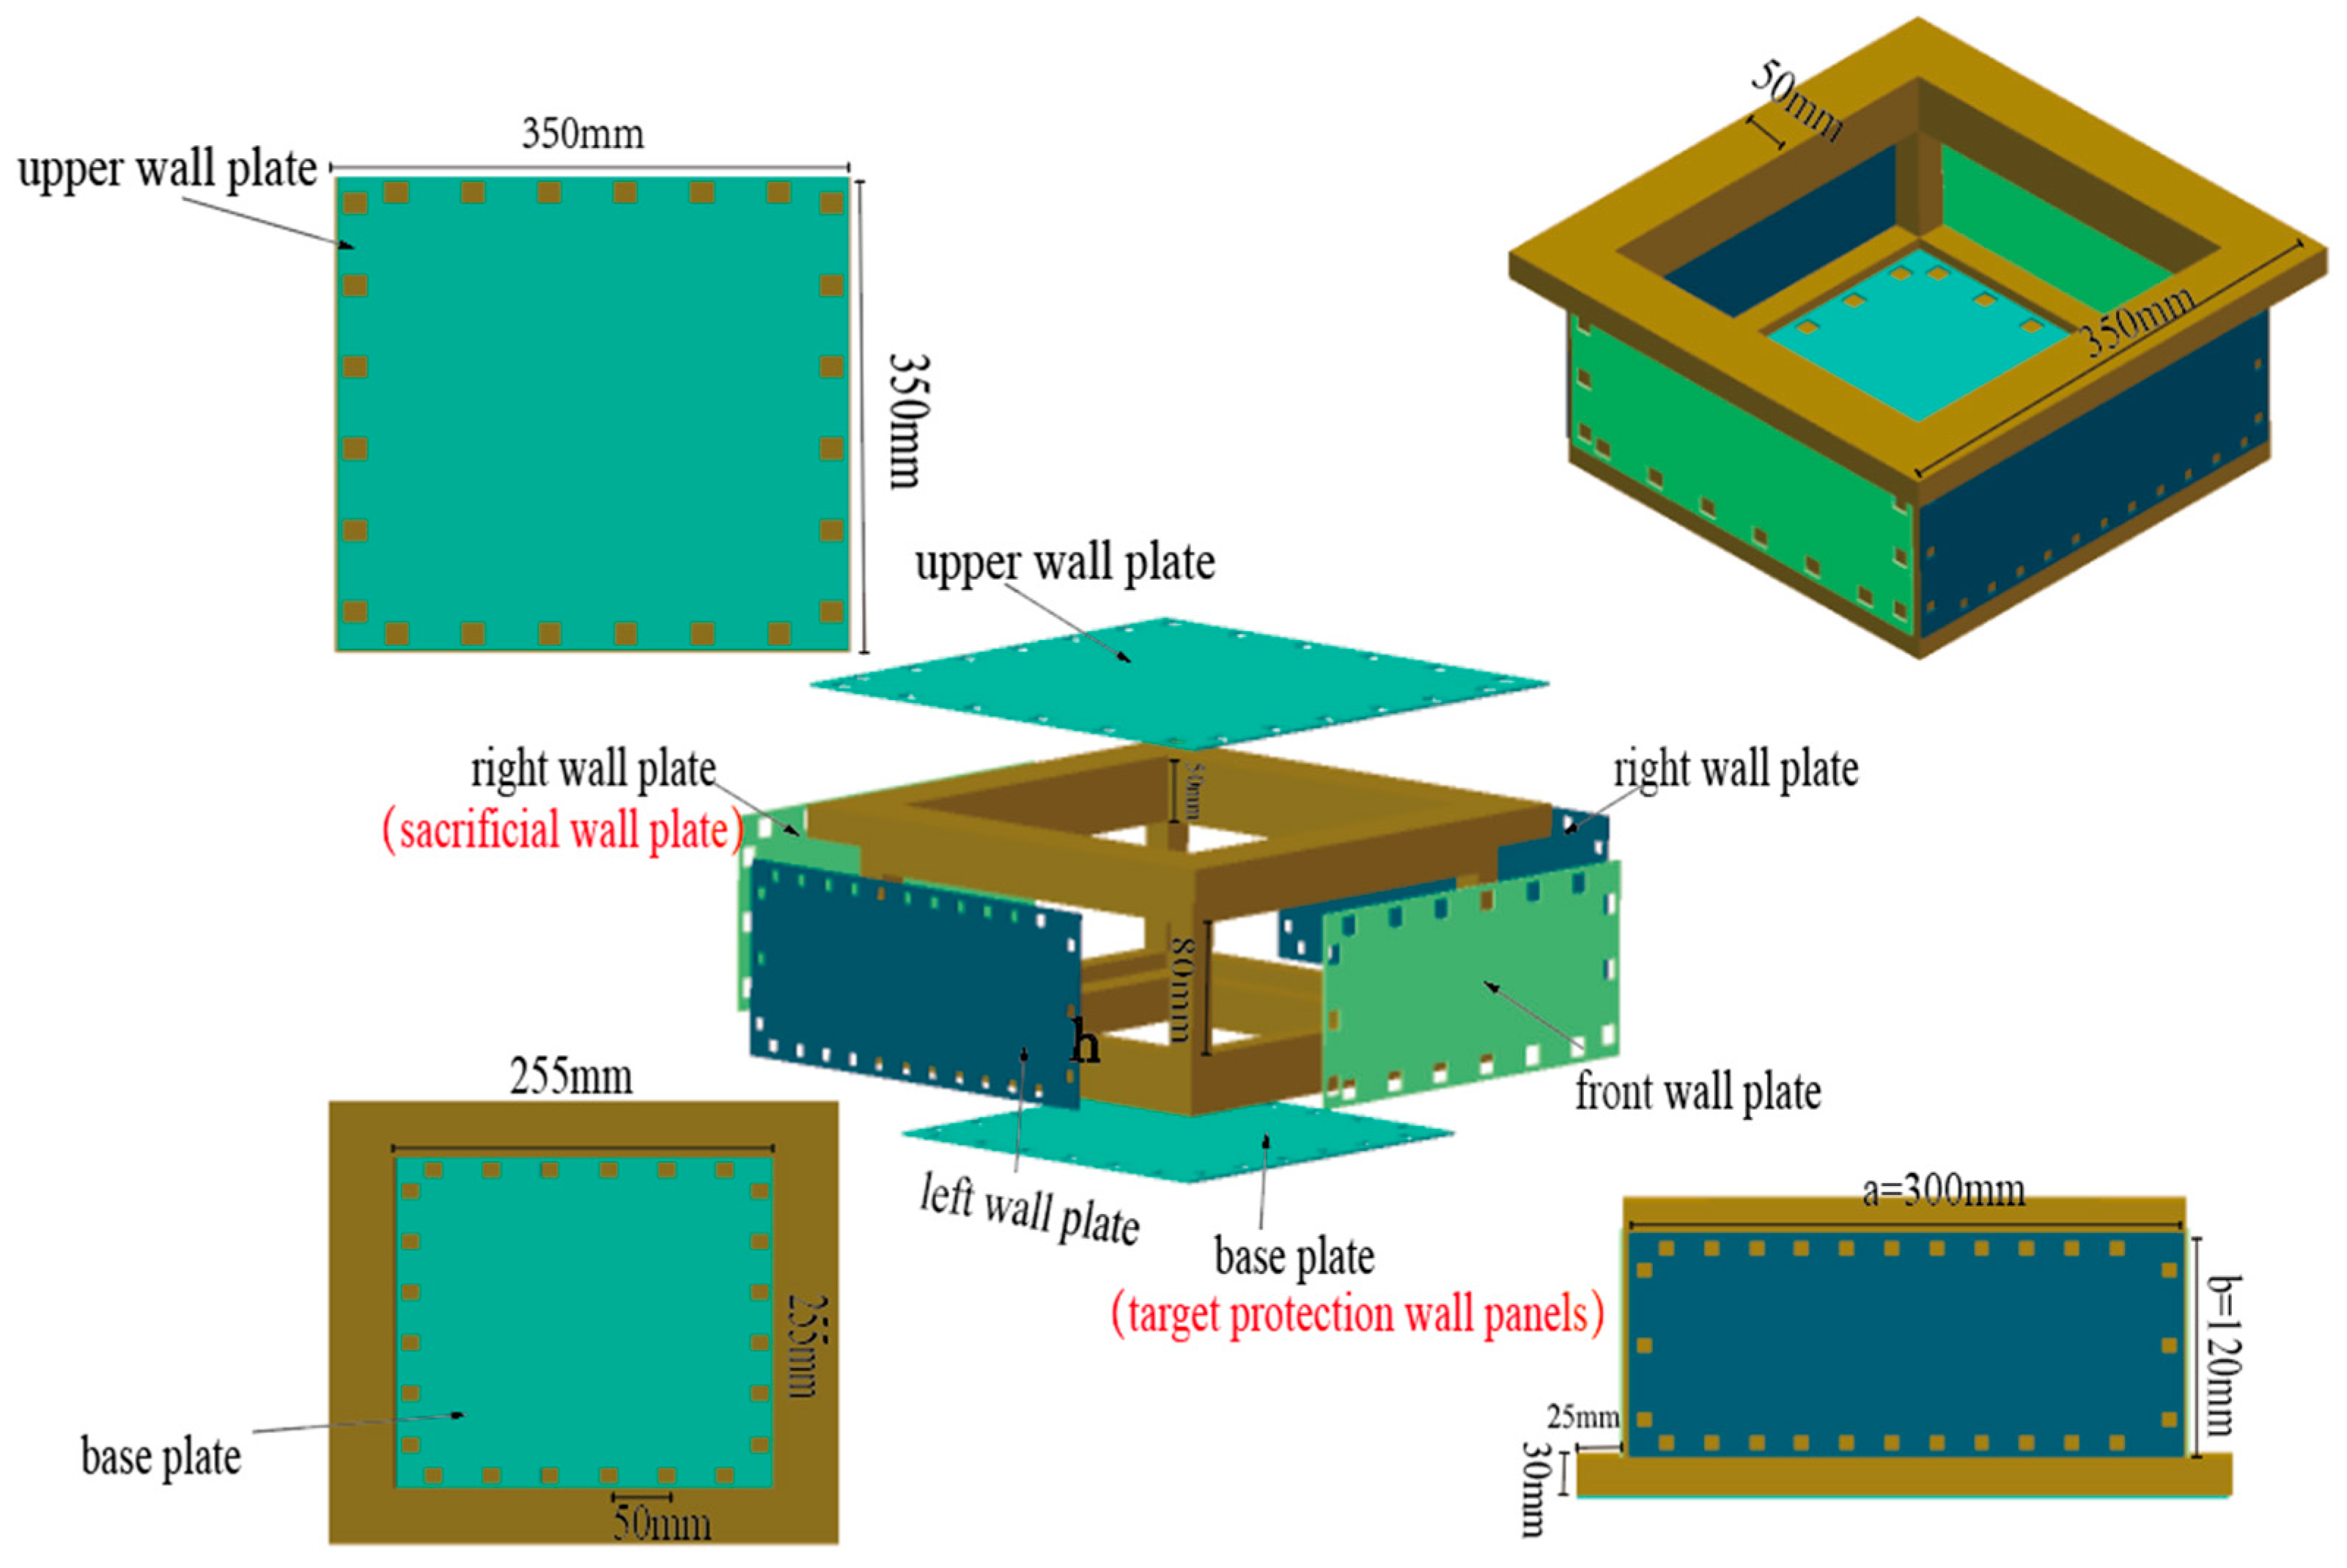
Figure 1. Structural dimensions.
Applsci 15 10211 g001
Figure 2. Schematic diagram of experimental device.
Applsci 15 10211 g002
Figure 3. Numerical simulation model.
Applsci 15 10211 g003
Figure 4. Comparison of failure morphology of bottom plate under test and simulation. (a) Comparison of final deformation of the lower wall panel; (b) comparison of displacement–time curves of the rear wall panel.
Applsci 15 10211 g004
Figure 5. Deformation features of fore and aft plates.
Applsci 15 10211 g005
Figure 6. Displacement curve of aft plate measured in test.
Applsci 15 10211 g006
Figure 7. Deformation and failure features of bottom plate. (a) T-3-3 lower web plate deformation, (b) T-4-2 lower web plate deformation, (c) T-5-1 lower web plate deformation, and (d) displacement curve of the section at the maximum deflection of the lower wall plate.
Applsci 15 10211 g007
Figure 8. Deformation curve of bottom plate of the structure. (a) Lower web plate central section deformation and (b) relationship between plastic limit ratio and lower wall plate deflection reduction ratio.
Applsci 15 10211 g008
Figure 9. Dynamic response process of the structure.
Applsci 15 10211 g009
Figure 10. Curves of deformation process for two typical characteristic plates of the structure. (a) T-5-1 feature web plate deformation process and (b) T-3-3 feature web plate deformation process.
Applsci 15 10211 g010
Figure 11. T-3-3 dynamic response process.
Applsci 15 10211 g011
Figure 12. Energy absorption situation of the plates. (a) Side web plate energy absorption ratio, (b) energy absorption ratio of the upper and lower wall plates, and (c) relationship between plastic limit ratio and lower wall plate energy reduction ratio.
Applsci 15 10211 g012
Figure 13. Energy absorption chart for five types of structures. (a) Energy absorption of front wall plate, (b) energy absorption of the rear wall plate, and (c) energy absorption of the lower wall plate.
Applsci 15 10211 g013
Figure 14. Protective mechanism of unequal-strength liquid-holding structure.
Applsci 15 10211 g014
Figure 15. Equivalent model of double-bottom liquid tank.
Applsci 15 10211 g015
Table 1. Test conditions.
Serial NumberTest Namev Drop hammer/m·s−1h Front (mm)ps Before (MPa)h Back (mm)ps After (MPa)h Top, left, right (mm)h Bottom (mm)ps Before/
ps After
Research Methods
No. 1T-5-19528.411.143.21.724.91Test + FEM
No. 2T-4-29418.224.573.21.75.69Test + FEM
No. 3T-3-39310.3310.33.21.71Test + FEM
No. 4F-9-19992.411.143.21.781.05FEM
No. 5F-8.5-1.598.561.361.51.873.21.732.8FEM
No. 6F-8-29872.924.573.21.715.95FEM
No. 7F-7-39755.7310.33.21.75.40FEM
No. 8F-6.5-3.596.535.043.510.063.21.73.48FEM
No. 9F-6-49640.9418.23.21.72.24FEM
No. 10F-5-59528.4528.43.21.71FEM
Table 2. Water medium model parameters.
Symbolc/m·s−1S1S2S3γ0AEW/kJ·s−3V0
Value14501.98000.5301
Table 3. Wall panel model parameters.
Symbolc/m·s−1S1S2S3γ0AEW/kJ·s−3V0
Value45601.49002.17301
Table 4. Air model parameters.
SymbolC0C1C2C3C4C5C6EA/kJ·s−3
Value00000.40.40253
Table 5. Structural model parameters.
SymbolRO/kg·m−3E/GPaPRA/MPaBNEPS1
Value78502100.32350.30.20.0
SymbolESPOCMERODDTFCPTM
Value1.00.0010.80.00.05001500
RO, E, PR, and A represent the mass density, Young’s modulus, Poisson’s ratio, and initial yield stress of the structure, respectively. The parameters B and N correspond to the strain hardening coefficient and strain hardening exponent, while EPS1 denotes the initial plastic strain.
Table 6. Comparison of final deflection values of bottom plate.
Serial NumberExperimental Results/mmNumerical Analysis Results/mmDeviation
T-3-318.95117.5937.1%
T-4-218.71917.4956.5%
T-5-115.11215.9795.7%
Disclaimer/Publisher’s Note: The statements, opinions and data contained in all publications are solely those of the individual author(s) and contributor(s) and not of MDPI and/or the editor(s). MDPI and/or the editor(s) disclaim responsibility for any injury to people or property resulting from any ideas, methods, instructions or products referred to in the content.