Review

IPP and PRT Depolarizing Spaces for the Study of Depolarizing Samples: A Review

1
School of Energy Science and Engineering, Henan Polytechnic University, Jiaozuo 454150, China
2
School of Physics and Electronic Information Engineering, Henan Polytechnic University, Jiaozuo 454150, China
3
Grup d’Òptica, Departament de Física, Universitat Autònoma de Barcelona, 08193 Bellaterra, Spain
4
Instituto de Bioingeniería, Universidad Miguel Hernández de Elche, Avda. Universidad s/n, 03202 Elche, Spain
5
Departamento de Ciencia de Materiales, Óptica y Tecnología Electrónica, Universidad Miguel Hernández de Elche, Avda. Universidad s/n, 03202 Elche, Spain
6
School of Computer and information, Hefei University of Technology, Hefei 230009, China
*
Authors to whom correspondence should be addressed.
Appl. Sci. 2025, 15(18), 10205; https://doi.org/10.3390/app151810205
Submission received: 10 August 2025 / Revised: 10 September 2025 / Accepted: 16 September 2025 / Published: 19 September 2025
(This article belongs to the Section Optics and Lasers)

Abstract

Depolarizing spaces can reveal and emphasize depolarization origins in samples, making them suitable tools for target detection and disease diagnosis. The Indices of Polarization Purity (IPP) space, considered a representative depolarizing space, highlights the depolarization characteristics of samples, and has demonstrated its superiority in analyzing and identifying depolarization samples, i.e., biological tissues and scattering environments. Recently, a new polarization representation, the so-called Polarizance–Reflection–Transformation (PRT) space has been proposed, which has been employed to distinguish between non-depolarization systems, as well as analyze anisotropic depolarizers. Importantly, the IPP and PRT spaces provide complementary information of samples, hence presenting more polarimetric characterizations of the samples of interest. In consideration of the high importance of the IPP and PRT spaces in this topic, in this paper, we review the methodology of these two spaces and their applications in depolarizer distinction.

1. Introduction

The interaction of a light beam with a sample typically alters its polarization state. As a result, the polarization properties of the interaction process become encoded in the emergent light beam [1,2]. By analyzing the state of polarization (SoP) of both the incident and emergent light beams, it is possible to retrieve the sample’s polarization characteristics, namely diattenuation, retardance, and depolarization [3], allowing for analyzing and classifying samples in a non-invasive way.
In particular, retardance has been used to distinguish between samples with different birefringent characteristics. For instance, it has been proven that retardance can allow for differentiation between healthy and cancerous tissues [4], as well as distinction between elastic and collagen fibers distributed in a rabbit aortic wall [5]. Additionally, regarding the diattenuation characterization, it allows for the distinction of brain regions from other neighboring tissues [6]. Note that in addition to diattenuation and retardance, depolarizing behavior is usually present in nature when polarized light interacts with samples, such as gases in the atmosphere [7,8,9], particles under water [10], rough surfaces [11], and biological tissues [12,13,14]. For this reason, the depolarization properties of samples are nowadays of significant importance in many research areas, such as communication [15], remote sensing [16,17,18,19,20,21], astronomy [22], 3D graphics simulation [23], integrated imaging sensors in self-driving cars [24,25], environmental studies [26], material characterization for industry [27,28,29], and biomedical applications [30] such as cancer detection in different human and animal tissues [31] and tissue recognition [32].
Until now, the most advanced method to analyze the polarization characteristics of a study sample has been the use of a polarimeter to obtain its Muller matrix (MM) image. MMs contain all polarimetric characteristics represented by their 16 elements. Importantly, based on these elements of the MMs, a series of polarimetric observables can be derived to represent the corresponding polarization characteristics of the studied sample. Among these polarimetric observables, the depolarizing observables study depolarization characteristics of samples from different perspectives and have been implemented in a series of applications. For instance, the depolarizing observable P, representing the overall depolarization of samples, has been implemented in remote sensing and biology [30]. Analogous to the polarimetric observable P, the depolarizing observables PI and En, respectively, defined as the average and entropy of the eigenvalues of the H covariance matrix of MM, present the overall depolarization of samples, which have been used to analyze dispersive systems with various particle sizes [33]. Furthermore, the Indices of Polarimetric Purity (IPP), consisting of P1, P2, and P3 observables, provide more information than the global depolarization described by the previously mentioned metrics, and they have the ability to reveal certain insights into the physical mechanisms within the samples that give rise to depolarization. For this reason, IPPs exhibit a significant ability to discriminate between samples containing different structural features with varying depolarizing capacities.
In the context of depolarization metrics, it is worth highlighting the concept of depolarization spaces: powerful imaging tools that enable efficient discrimination and visualization of depolarizing samples with different structural typologies. Depolarizing spaces are formed by a combination of several polarimetric observables representing different physical phenomena [34]. In this vein, depolarizing spaces can simultaneously contain several polarimetric properties of samples, hence highlighting the distinction of samples. So far, there are several depolarizing spaces described in the literature. On the one hand, some depolarizing spaces are formed by the polarimetric observables directly obtained by MM elements (namely MM-based depolarizing spaces) [35,36]. Usually, in addition to depolarization characterizations, MM-based depolarizing spaces also contain other non-depolarizing polarimetric properties such as diattenuation and retardance. For instance, the CP space, as a typical MM-based depolarizing space, represents the polarizance, diattenuation, and depolarization of samples [37]. On the other hand, another category of depolarizing spaces is formed by depolarizing observables derived from eigenvalues of the covariance matrix H, which results from a unitary transformation of MM (namely, eigenvalues-based depolarizing spaces) [38,39,40,41]. These depolarizing observables yield information about the depolarization properties of the samples [42]. So far, a number of studies have been devoted to study depolarizing spaces and their applications in target identification. For instance, A. van Eeckhout reviewed the physical meaning of several depolarizing spaces and took advantage of them to analyze animal tissues [43]; D. Li studied IPP space and proved the superiority of IPP space in remote sensing [44]. R. Ossikovsky reviewed eigenvalue-based depolarizing spaces and explored their potential in biological sample identification [41]. D. Ivanov studied depolarizing spaces and employed depolarizing spaces to analyze ex vivo colon tissue [30].
As stated above, MM-based depolarizing spaces represent the physical features of samples via corresponding polarimetric observables that serve as the axes of the spaces, whereas the eigenvalue-based depolarizing spaces reveal the depolarization characterization. In this vein, the information of samples provided by eigenvalue-based spaces and MM-based spaces is mutually complementary to some extent. The IPP space, as an MM depolarizing space, has demonstrated its superiority in distinguishing samples with different depolarization characterizations, and based on its nature, it has been widely implemented in biological tissue identification and biological image enhancement [45,46]. Recently, a new MM-based depolarizing space, the so called Polarizance–Reflection–Transformation (PRT) space, is on the rise [36]. It was proposed to resolve the problem of polarization pure system distinction. Nowadays, it has been demonstrated that this space is able to identify the origin of depolarization and extend its capability to biology [47].
In consideration of the factors stated above, in this paper, we review the IPP and PRT spaces, including the methodology of such two spaces and their applications in sample distinction. Unlike previous state-of-the-art studies, this paper aims to provide a comprehensive interpretation of the physical meaning of PRT and IPP spaces, and demonstrate how target identification tasks can be addressed by jointly considering both spaces. This approach is intended to inspire the development of practically advanced algorithms for target identification grounded on such spaces. The outline of this paper is as follows. In Section 2, the methodologies of PRT and IPP spaces are presented (Section 2.1 and Section 2.2, respectively). Additionally, the characteristic decomposition is presented in Section 2.3 to highlight the existence of isotropic depolarization components. Next, Section 3 and Section 4 focus on the discussion of these two spaces for the distinction of depolarizers with different physical origins. In particular, Section 3 presents how to distinguish between isotropic depolarizers from anisotropic depolarizers by IPP space, and then, Section 4 deals with the combination of the IPP and PRT spaces for identifying different anisotropic depolarizers. Afterward, in Section 5, the corresponding experiments to verify the simulations and results provided in Section 3 and Section 4 are presented. Finally, this review is summarized in Section 6.

2. Methodology of Depolarizing Spaces

The polarization characteristics of a sample can be explored by analyzing the distribution of the corresponding polarization systems in the IPP and PRT spaces. This implies that a clear understanding of the physical meaning of IPP and PRT spaces helps study the physical properties of the target without a priori information. For this reason, in this section, we discuss the physical means implied in the IPP and PRT spaces, and we show how to construct such two spaces. Additionally, the MM of a sample can be decomposed into several simpler parts that present different physical interpretations useful to analyze its depolarization properties. This is achieved by means of the characteristic decomposition of MMs, which is presented at the end of this section.
To begin, the Stokes–MM formalism is employed to describe the polarimetric characteristics of light and samples. In this framework, the State of Polarization (SoP) of light is represented by a 4-element vector called the Stokes vector (SV), whereas, as stated above, the modulation of the SoP by a sample is represented by an MM, which is a 16-element real matrix with the following form:
M = m 00 m 01 m 02 m 03 m 10 m 11 m 12 m 13 m 20 m 21 m 22 m 23 m 30 m 31 m 32 m 33
where mij (with i, j ∈ {0, 1, 2, 3}) is the MM elements. An MM can be measured using a polarimeter by generating a basis of SoPs of the incident light and analyzing the corresponding SoP of the output light with a polarization analyzer configuration. From this viewpoint, MM contains all polarimetric characteristics related to the physical properties of the samples, including the polarimetric characteristics that can be directly expressed by elements in MMs, such as diattenuation and polarizance, and other significantly essential polarimetric characteristics that are codified within the MM elements without direct identification, such as retardance.

2.1. The PRT Space

In this subsection, we focus on describing the observables forming the so-called PRT space [36], as it is an ideal MM-based depolarizing space in terms of depolarizing sample characterization. First, this subsection presents the physical characteristics of the polarimetric observables that form the PRT space and then describes the corresponding physical characterizations of the PRT space.
Let us recall the normalized block form of an MM [37]:
M ^ = 1 D T P m
where P refers to the polarizance vector, D refers to the diattenuation vector, DT represents the transpose of the diattenuation vector, and m is a 3 × 3 submatrix of the M ^ (where the symbol ^ indicates normalization with respect to the m00 element). According to these matrices, the scalar diattenuation (D), polarizance (P), and degree of spherical purity (PS) can be derived in turn. In addition to such polarimetric observables, each element in the submatrix m demonstrates the relation between Stokes elements of incident and emergent beams, forming several corresponding polarimetric observables. For instance, the diagonal elements (m11, m22, m33) characterize the direct reflectivity or transmittance of the Stokes elements (Q, U, V) for the reflection or transmission scenario, respectively. Therefore, the overall reflectivity of Stokes elements is defined as [36]
R = i = 1 3 m i i 2 / 3
Based on the rest of the elements, the polarimetric observable T is defined as [36]
T = m 12 2 + m 13 2 + m 21 2 + m 23 2 + m 31 2 + m 32 2 / 3
The definition of polarimetric observables R and T implies that they have contributions from the birefringent properties of the samples. Additionally, besides the elements included in polarimetric observables R and T, the polarimetric observable PP is able to characterize the dichroism of the samples. It is derived (and takes benefit) from vectors D and P, with the following form [36]:
P P = m 10 2 + m 20 2 + m 30 2 + m 01 2 + m 02 2 + m 03 2 / 2
Overviewing the definition of polarimetric PP, R, and T, these three polarimetric observables contain all the elements of MM except the normalized m00. Therefore, they can represent all polarization information of the samples. Moreover, the combination of PP, R, and T allows for obtaining the depolarization index P (Equation (6)). Considering the physical characteristics and relevant relation of polarimetric observables PP, R, and T, a valuable 3D depolarizing space is formed, as seen in Figure 1a, where different depolarizers occupy different positions within their volume.
For instance, whereas the points on the surface ABCE represent non-depolarizing pure systems, point O represents ideal depolarizers that always fully depolarize light. Except for these points described above, the rest of the points in PRT space represent non-ideal depolarizing systems of which the depolarizing ability is quantifiably described by PRT space through the depolarization index P∆(PRT) defined using the polarimetric observables PP, R, and T:
P Δ ( PRT ) 2 = 2 P P 2 / 3 + R 2 + T 2
In this vein, according to the distributed position of the samples under study, samples with different polarimetric characteristics can be distinguished by the PRT space. For instance, the samples without depolarizing are distributed in the surface ABCE, whereas ideal depolarizers lie on the point O, as shown in Figure 1b. Accordingly, taking advantage of the PRT space, these two types of samples are easy to identify. Furthermore, regarding the depolarizers with different depolarization ability, the PRT space can distinguish between them via corresponding distribution, which can be seen in Section 4 for details.

2.2. The IPP Space

In addition to the polarimetric observables that can be directly obtained from MM, there are more polarimetric observables encoded in the matrix. To extract these observables, several approaches for the decomposition of MMs have been proposed [48,49]. Among these, the so-called Parallel decomposition focuses on studying the depolarizing properties by considering the significance of non-depolarization components within the samples. This significance is described by the value of the coefficients λ0, λ1, λ2, and λ3 which are eigenvalues of the covariance matrix H of MM. The matrix H can be obtained by the following equation:
H ( M ) = i , j = 1 4 m i j σ i σ j
where mij is the element of MM, and σ refers to Pauli matrices. Based on such coefficients (λ0, λ1, λ2, λ3), there is a set of eigenvalue-based depolarizing observables that can be derived to measure the depolarization of samples. These observables can construct depolarizing spaces, as the so called IPP space [37] consisting of three real magnitudes P1, P2, and P3 defined as follows:
P 1 = λ 0 λ 1 / tr H
P 2 = λ 0 λ 2 + λ 1 λ 2 / tr H
P 3 = λ 0 λ 3 + λ 1 λ 3 + λ 2 λ 3 / tr H
where trH denotes the trace of the matrix H. Note that the parameter P1 weights the contribution of the first eigenvalue relative to the second; P2 considers the combined weight of the first two eigenvalues relative to the third; and P3 evaluates the contribution of the first three eigenvalues in relation to the fourth. This becomes particularly relevant when considering that eigenvalues have a physical interpretation in the context of the spectral theorem applied to Mueller matrices [37]. It is also worth noting that, due to the restrictions of these coefficients (λ0λ1λ2λ3 ≥ 0, λ0 + λ1 + λ2 + λ3 = 1), the values of IPP follow the inequalities:
0 P 1 P 2 P 3 1
Moreover, taking advantage of the IPP observables, the overall depolarization index P∆(Purity) can be calculated to represent depolarization characterization of the samples by the following format:
P Δ ( Purity ) 2 = 2 P 1 2 / 3 + 2 P 2 2 / 9 + P 3 2 / 9
The IPP observables are also able to form a physical geometrical space, namely IPP space, with the P1, P2, and P3 as X, Y, and Z axis, respectively. Subject to the relation between IPP observables, as demonstrated in Equation (11), the physical achievable region of the IPP space is restricted, as shown in Figure 1b.
In theory, all physically achievable depolarizers can be represented in the IPP space, but in different regions. As a limit case, non-depolarizing samples are characterized by P1 = P2 = P3 = 1. Conversely, samples with P1 = P2 = P3 = 0 are regarded as ideal depolarizers. By the same means of the PRT space, different samples can be distinguished using IPP space. Additionally, it is worth noting that the IPP space has the ability to distinguish between anisotropic and isotropic depolarization origins, since all possible pure anisotropy depolarizers are distributed in the shaded surface in Figure 1b, corresponding to P3 = 1 top plane. That will be introduced in Section 3 in detail.
Importantly, as stated above, both the PRT and IPP spaces can present depolarization characterizations of samples via obtaining the depolarizing observable P that performs as a function of the PRT and IPP space-related polarimetric observables. As a consequence, considering the observable P as a bridge, the connection between IPP and PRT spaces can be established as follows:
2 P 1 2 / 3 + 2 P 2 2 / 9 + P 3 2 / 9 = 2 P P 2 / 3 + R 2 + T 2

2.3. Characteristic Decomposition of MMs

An interesting feature of the IPPs, beyond their previously discussed discriminative capability, is that they allow for a physical interpretation of the depolarizing mechanisms within a sample. One way to extract this information from IPP data is by using the Characteristic decomposition of the MM, which enables any MM to be expressed as a sum of simpler MMs, each appropriately weighted by combinations of the IPPs. In this section, we highlight the usefulness of the Characteristic decomposition, which can be written as [37]
M = P 1   m 00 M J 0 + ( P 2 P 1 ) m 00 M 2 D + ( P 3 P 2 ) m 00 M 3 d + ( 1 P 3 ) m 00 M d
where P1 is the weight of the nondepolarizing component MJ0, P2P1 is the weight of the system that behaves as a 2D depolarizer (the depolarizing content can be expressed, in a minimal form, as the sum of two non-depolarizing matrices and represented by M2d), P3P2 indicates the weight of the term that behaves as a 3D depolarizer (the depolarizing content can be expressed, in a minimal form, as the sum of three non-depolarizing matrices and represented by M3d), and finally, 1 − P3 is the portion of the medium that behaves as a perfect depolarizer with MM of diag(1, 0, 0, 0) (represented by Md).
Note that the Md, which can depolarize the incident light to unpolarized light independently of the polarization of incidence, is an isotropic depolarizer. Conversely, the M2d and M3d can depolarize light, but the depolarization magnitude is dependent on the polarization of incidence. Therefore, the characteristic decomposition represents a beautiful way to describe the behavior of a depolarizer, as it can be decomposed into a non-depolarizing contribution (first term), a fully depolarizing one (last term), and a third component (second and third terms) associated with the statistical nature of the polarimetric elements inherent to the sample, which give rise to depolarization (see ref. [37]).

3. Discriminating Between Anisotropic and Isotropic Depolarization Origins by the IPP Space

As stated above, depolarization origin can be anisotropic or isotropic. These two origins represent samples with different physical characteristics, making it of high importance to distinguish between such two types. In fact, it has been demonstrated that, while the anisotropic content of a sample encodes highly significant information about its physical features [50]—and can be exploited for enhanced imaging—the isotropic component tends to mask all polarimetric information of the sample [51].
In this regard, this section introduces a series of simulations aimed at representing the behavior of different anisotropic depolarizers. These are analyzed in terms of the IPP, in order to evaluate their potential to discriminate between various depolarizing elements, and importantly, how to distinguish between anisotropic and isotropic origins by taking advantage of the IPP space.

3.1. Anisotropic Origin Behavior Presented by IPP Channels

According to the Parallel decomposition, stating that a depolarizing Mueller Matrix can be described as an incoherent addition of simpler MMs [52,53], an anisotropic depolarizer can be regarded as the addition of several non-depolarizing elements:
M = m 00 i n α i M i ; α i 0 ; i = 1 n α i = 1
where M represents the MM after the addition of Mi which represents the i-th non-depolarizing element of the sum, and αi refers to the weight of such term.
Therefore, the analyses conducted in this section to model different depolarizers will follow Equation (15). As elements to be used in the sum, this work explores two systems: depolarizers based on the sum of pure linear diattenuators and depolarizers based on the sum of pure linear retarders. It is worth noting that these systems are widely present in nature, as they aim to simulate the depolarizing responses of dichroic or birefringent samples.
In the following, the case of the numeric simulation of anisotropic depolarizers is first studied consisting of the incoherent addition of linear diattenuators of which Mueller matrix MLD can be written as [50]
M L D p x , p y = 1 2 p x 2 + p y 2 p x 2 p y 2 0 0 p x 2 p y 2 p x 2 + p y 2 0 0 0 0 2 p x p y 0 0 0 0 2 p x p y ; 0 p x , y 1
Here, px and py represent the amplitude attenuation coefficients along the x and y components, respectively. Moreover, the MM of linear retarders with various orientations can be calculated by taking into account the rotation of the MM shown in Equation (16) [54,55], using the following form:
M p x , p y , θ = M ro t ( θ ) M L D M rot   ( θ )
where θ is the rotation angle, and Mrot is the corresponding rotation MM. In this vein, with Equation (15) to Equation (17), a model of anisotropic depolarizers (herein called diattenuator-based depolarizers since the basic elements are diattenuators) can be constructed with different control parameters: the number n of MM in the summation, the amplitude coefficients (px and py) and the orientation angle (θ) for each MM of the element inside.
Notably, to mimic situations closer to real samples in the simulation process, the domain of variation is restrained. In particular, the values of these controlling parameters are set as X + δ, where X refer to the mean value of the parameter and δ is a random variable that follows a Gaussian distribution with a null mean and a given variance (σ). Regarding the generalized diattenuator-based depolarizers under study, the X for the amplitude coefficients px, py are bounded within the range (0, 1) and the mean orientation of the diattenuators is within the range (0.180°). Herein, the value of the amplitude coefficient along the x direction px is fixed to a constant value in all the simulations. Additionally, the number of elements in the incoherent addition is set as n = 1500, considering a trade-off between many elements and a reasonable computation time.
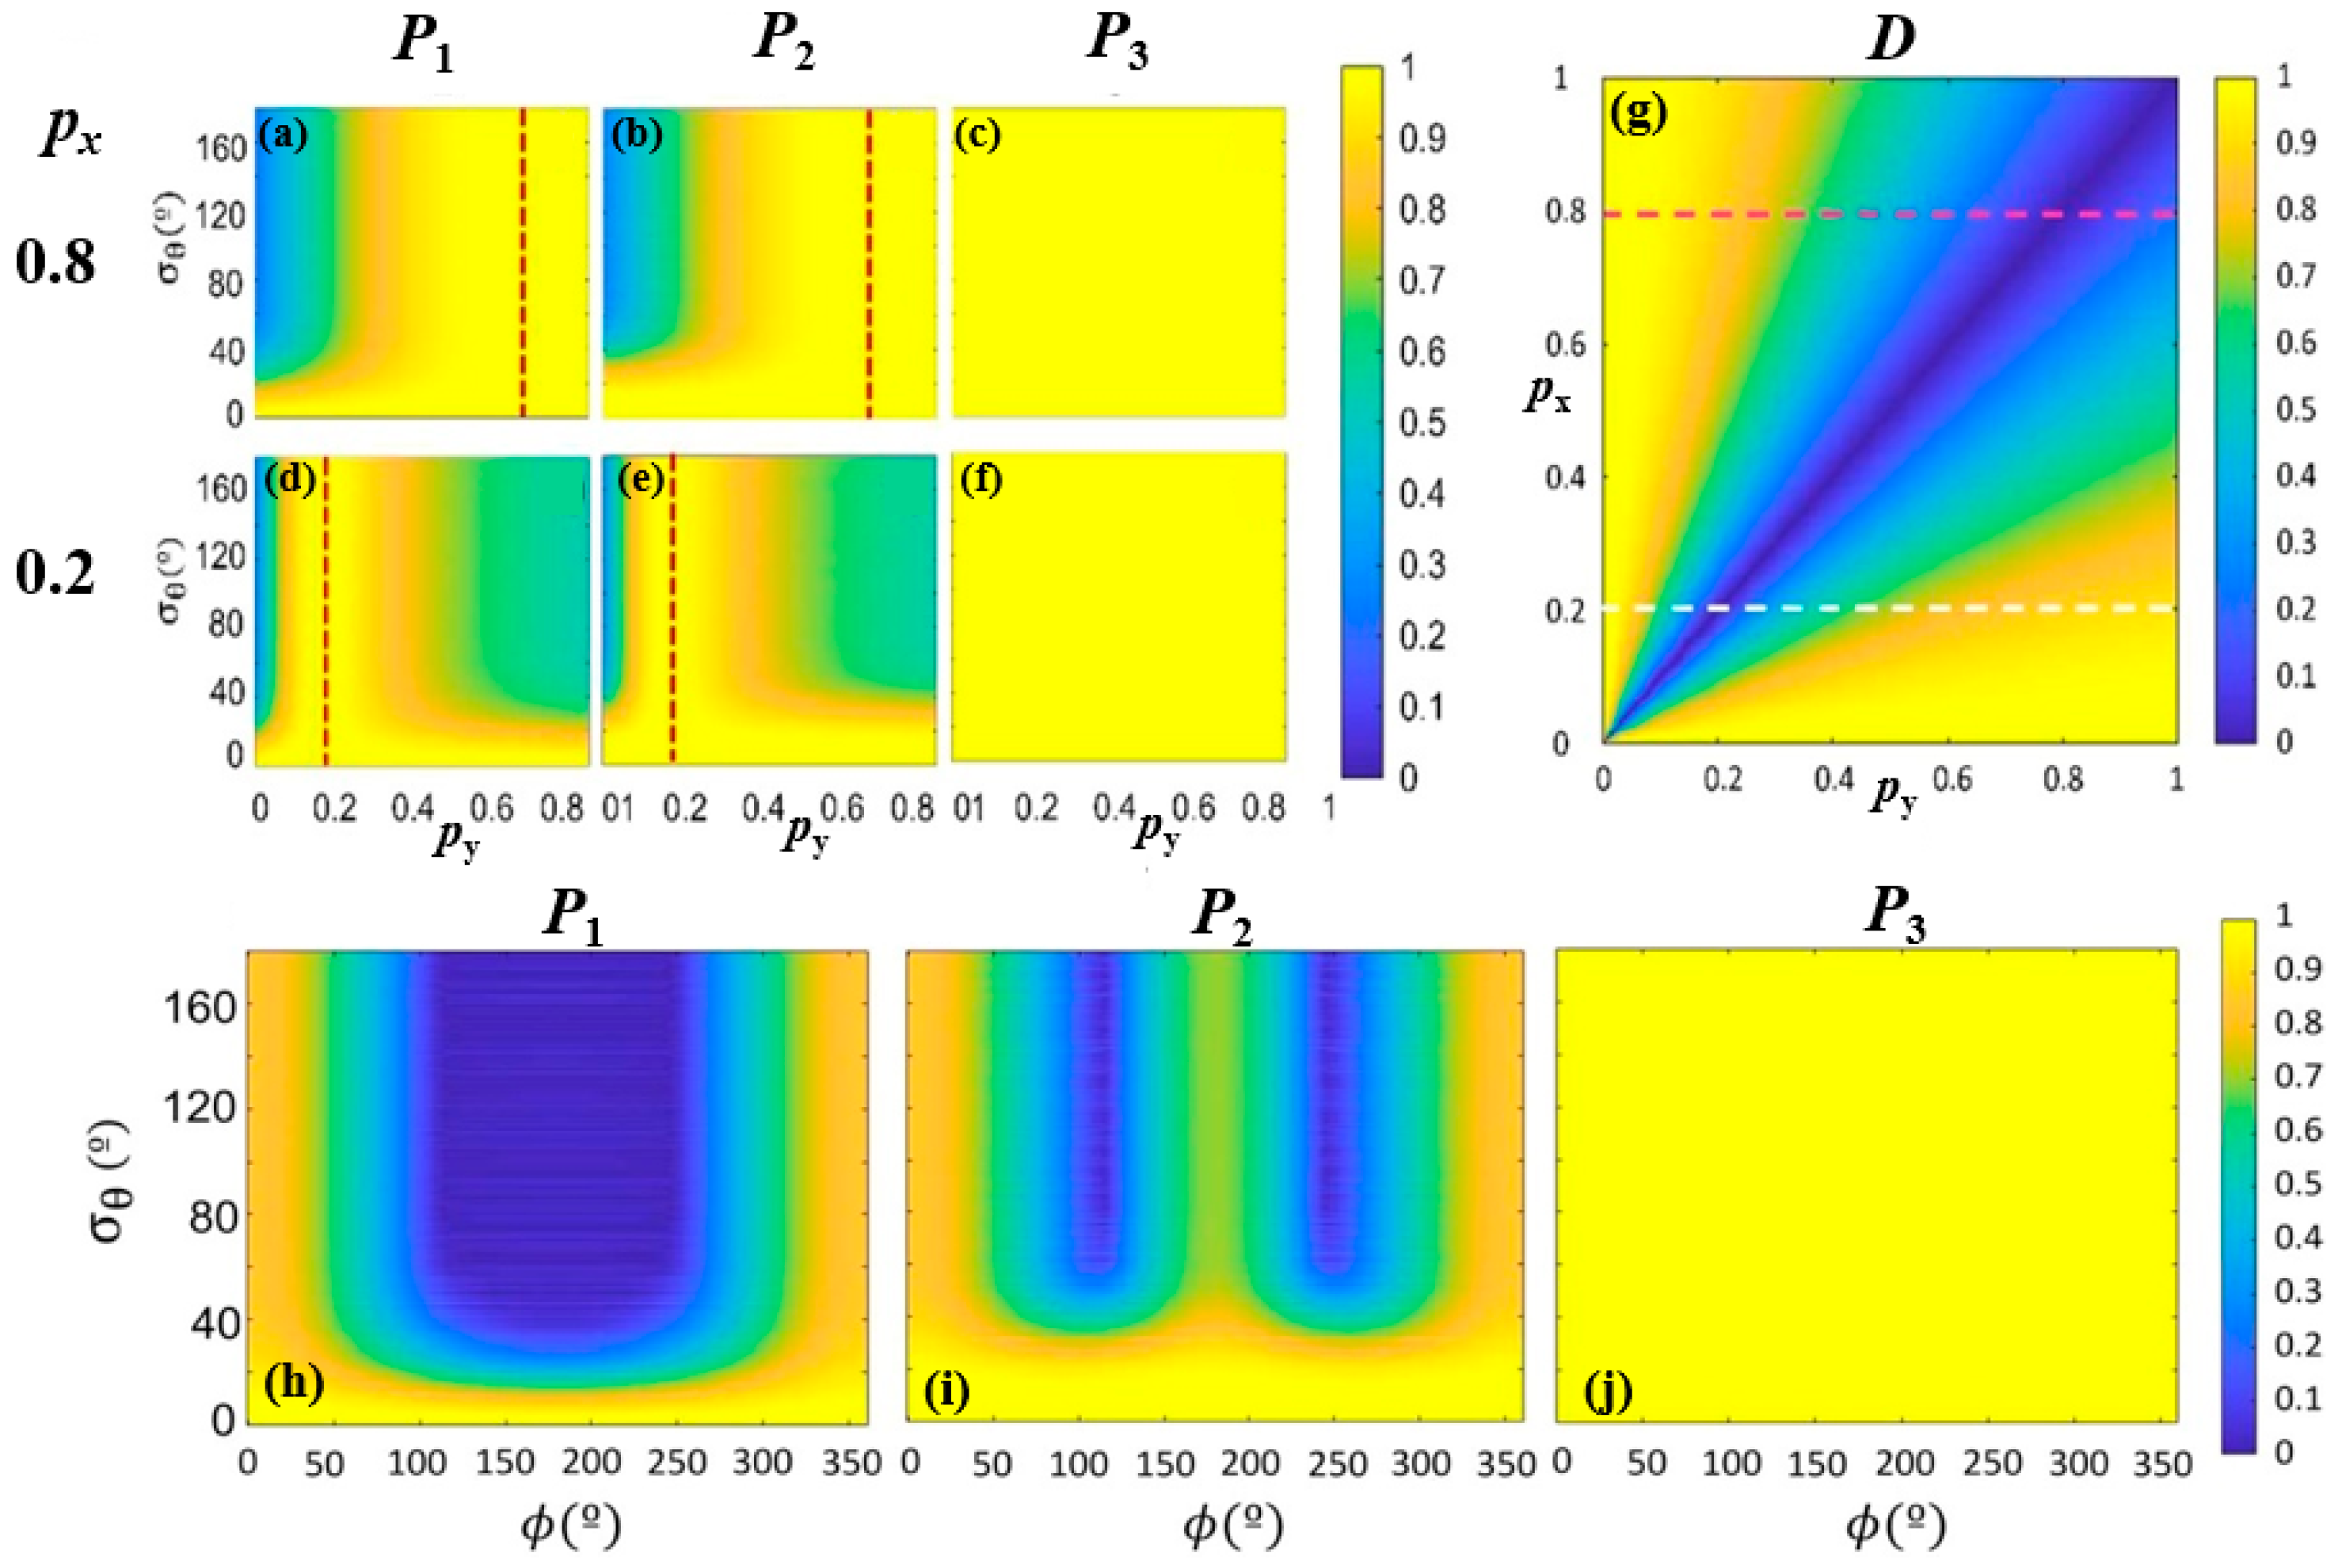
Once the values of px and n are assigned, the remaining controlling parameters are py and θ. Regarding the values of the controlling parameter py, they are from 0 to 1 with steps of 0.003. In the same way, the mean value of θ is set as 60°, and the variance (σθ) ranges from 0° to 180° with steps of 0.6°. This leads to 300 × 300 = 90,000 simulations. Regarding the constructed 90,000 depolarizers, the IPP (P1, P2 and P3) channels are calculated and presented in Figure 2.
Figure 2a–f presents the behavior of IPP values for diattenuator-based depolarizers with different characteristics of controlling parameters (px, py, and σθ). The orientation mean value of the diattenuator inside is set as 60° for all simulations in Figure 2a–f. These figures show the value of IPP varying with controlling parameters, where the x-axis refers to px, the y-axis refers to σθ, and the value of IPP is encoded in the color (see the colorbar). Regarding these figures, the first result is that, independently of the parameters (px, py, and σθ), the P3 remains 1. Conversely, the values of P1 and P2 channels are modified with the change of px, py, and σθ. For this reason, the channels P1 and P2 are suitable tools for differentiating between different depolarizers originating from dichroic structures, whereas the P3 channel loses the possibility to discriminate between these different depolarizers. Furthermore, these figures demonstrate that the IPP has potential in improving the visualization of samples with different depolarizing responses in different regions, for instance, distinguishing plant structures as cell clusters, vascular structures, plant veins or raphides [46].
This set of simulations can also be studied in terms of diattenuation D that is a significant feature of diattenuators. The red dotted lines presented in Figure 2a,b,d,e represent the depolarizers of D = 0, which leads to the simulation composed of the element represented by the identity matrix. In this case, the values of IPP are equal to 1. In contrast, Figure 2g presents the case of the units with certain diattenuation (i.e., D ≠ 0) that leads to the systems with a certain depolarizing response, where the x-axis refers to px, the y-axis refers to py, and the value of D is encoded in the color (see the colorbar). Additionally, the pink and the white dashed lines in Figure 2g indicate the D value when px = 0.8 and px = 0.2, respectively, with py taking values from 0 to 1. It can be found that the value of D is maximum for py = 0 and starts to decrease as py increases, reaching the minimum for py = 0.2 (i.e., px = py). Afterward, as py continually increases, the value of D increases as well, finally reaching the D = 1 value.
The second case of study considers depolarizers consisting of linear retarders, namely, retarder-based depolarizers. In analogy to the diattenuator-based depolarizers, the constructed retarder-based depolarizers consist of a number of retarders as a function of their retardation and orientation. Recall the MM for a linear retarder, the corresponding MM of a retarder located at 0° MLR has the following form [50]:
M L R = 1 0 0 0 0 1 0 0 0 0 cos ϕ sin ϕ 0 0 sin ϕ cos ϕ ; 0 ϕ π
where ϕ is the phase shift introduced to the orthogonal components of the incident light field. To make the simulations of retarder-based depolarizers more realistic, each constructed retarder-based depolarizer contains retarders with different orientations inside, which is achieved by considering the rotation as the same as the constructed diattenuator-based depolarizers. For the constructed retarder-based depolarizers, they are controlled by two parameters: the retardance (ϕ) and a standard deviation (σθ) of a probabilistic Gaussian distribution. The physical meaning presented by IPP for the constructed retarder-based depolarizers varies with such two parameters. The corresponding results are illustrated in Figure 2h–j, where the x-axis represents the value of retardance ϕ, ranging from 0° to 360°, y-axis represents the variance σθ, ranging from 0° to 180°, and the value of IPP can be seen by the color. Since ϕ and σθ both take 300 different values within their respective ranges, at the end, it leads to 300 × 300 (90,000) MMs presenting different retarder-based depolarizers of which the IPP value is encoded in the color.
As shown in Figure 2h–j, the values of P1 and P2 vary from 0 to 1, with the values of a combination of (σθ, ϕ), whereas P3 remain the value of 1. Therefore, as in the previous case (diattenuators-based depolarizers), retarder-based depolarizers cannot decrease the value of P3. In other words, different retarder-based depolarizers are distributed within the plane P3 = 1 in IPP space. Moreover, unlike the previous case where P1 and P2 showed a similar behavior, in the case of retarder-based depolarizers, P1 presents one minimum valley instead of the two shown by the P2 channel. Accordingly, the IPP has the ability to distinguish samples with birefringence, for instance, collagen-based tissues which are common in many animal tissues and present as retarder-based depolarizers without dichroic response [46].
The simulations developed in this section lead to several interesting conclusions. On one hand, the P1 and P2 channels of the IPP observable triplet prove to be useful tools for distinguishing between different types of anisotropic depolarizers. Moreover, independently of the values taken by the control parameters in the conducted model, the generated depolarizers consistently exhibit a value of P3 = 1. As a result, all these structures can be represented in the P1P2 plane with P3 = 1.
This situation raises an important question: if the statistical distribution—assumed to follow a Gaussian function in our simulations—of the polarimetric elements inherent to depolarizing samples composed of dichroic or linear retarding elements always leads to P3 = 1, then why do many biological tissues in nature exhibit low P3 values? As will be discussed in the following section, this phenomenon is connected to the isotropic depolarization behavior of such samples.

3.2. Isotropic Depolarization Behavior Presented by IPP

This subsection deals with the isotropic depolarizing nature of samples. As previously discussed, from the Characteristic decomposition shown in Section 2.3, the ideal depolarizer term within such decomposition relates to depolarization reduction independent of input polarization, and thus, with isotropic depolarization. For this reason, the case of P3 < 1 can be achieved by adding a perfect depolarizer with a certain weight (β) to the relation given by Equation (15). In fact, a more general scenario can be constructed by expressing the incoherent addition of two terms: the first accounts for the depolarization contribution arising from anisotropic constituent elements (such as linear retarders or diattenuators), while the second term, Miso, represents an ideal isotropic depolarizer, arising for physical processes (such as scattering) leading to a complete loss of polarimetric information [56,57]. The resultant M can be written as follows:
M = i n α i m 00 M i + j m β j m 00 M i s o ; α i , β j 0 ; i = 1 n α i + j = 1 m β j = 1
where M is the total MM, the Mi is the MM of the anisotropic element, and the Miso is the MM of the isotropic element. As the Miso is the MM of a perfect depolarizer (diag(1, 0, 0, 0)), the second term of Equation (19) can be written as
j m β j m 00 M i s o = β m 00 M i s o
Accordingly, Equation (20) can be expressed as
M = i n α i m 00 M i + β m 00 M i s o
The first term of Equation (21) presents the depolarizing systems’ anisotropic effect originated by the component elements showing retardance or dichroism, leading to P3 = 1. In turn, the newly added term corresponds to the depolarizing systems‘ isotropic effect that fully depolarize light, regardless of the input state of polarization of the illumination, leading to P3 = 0.
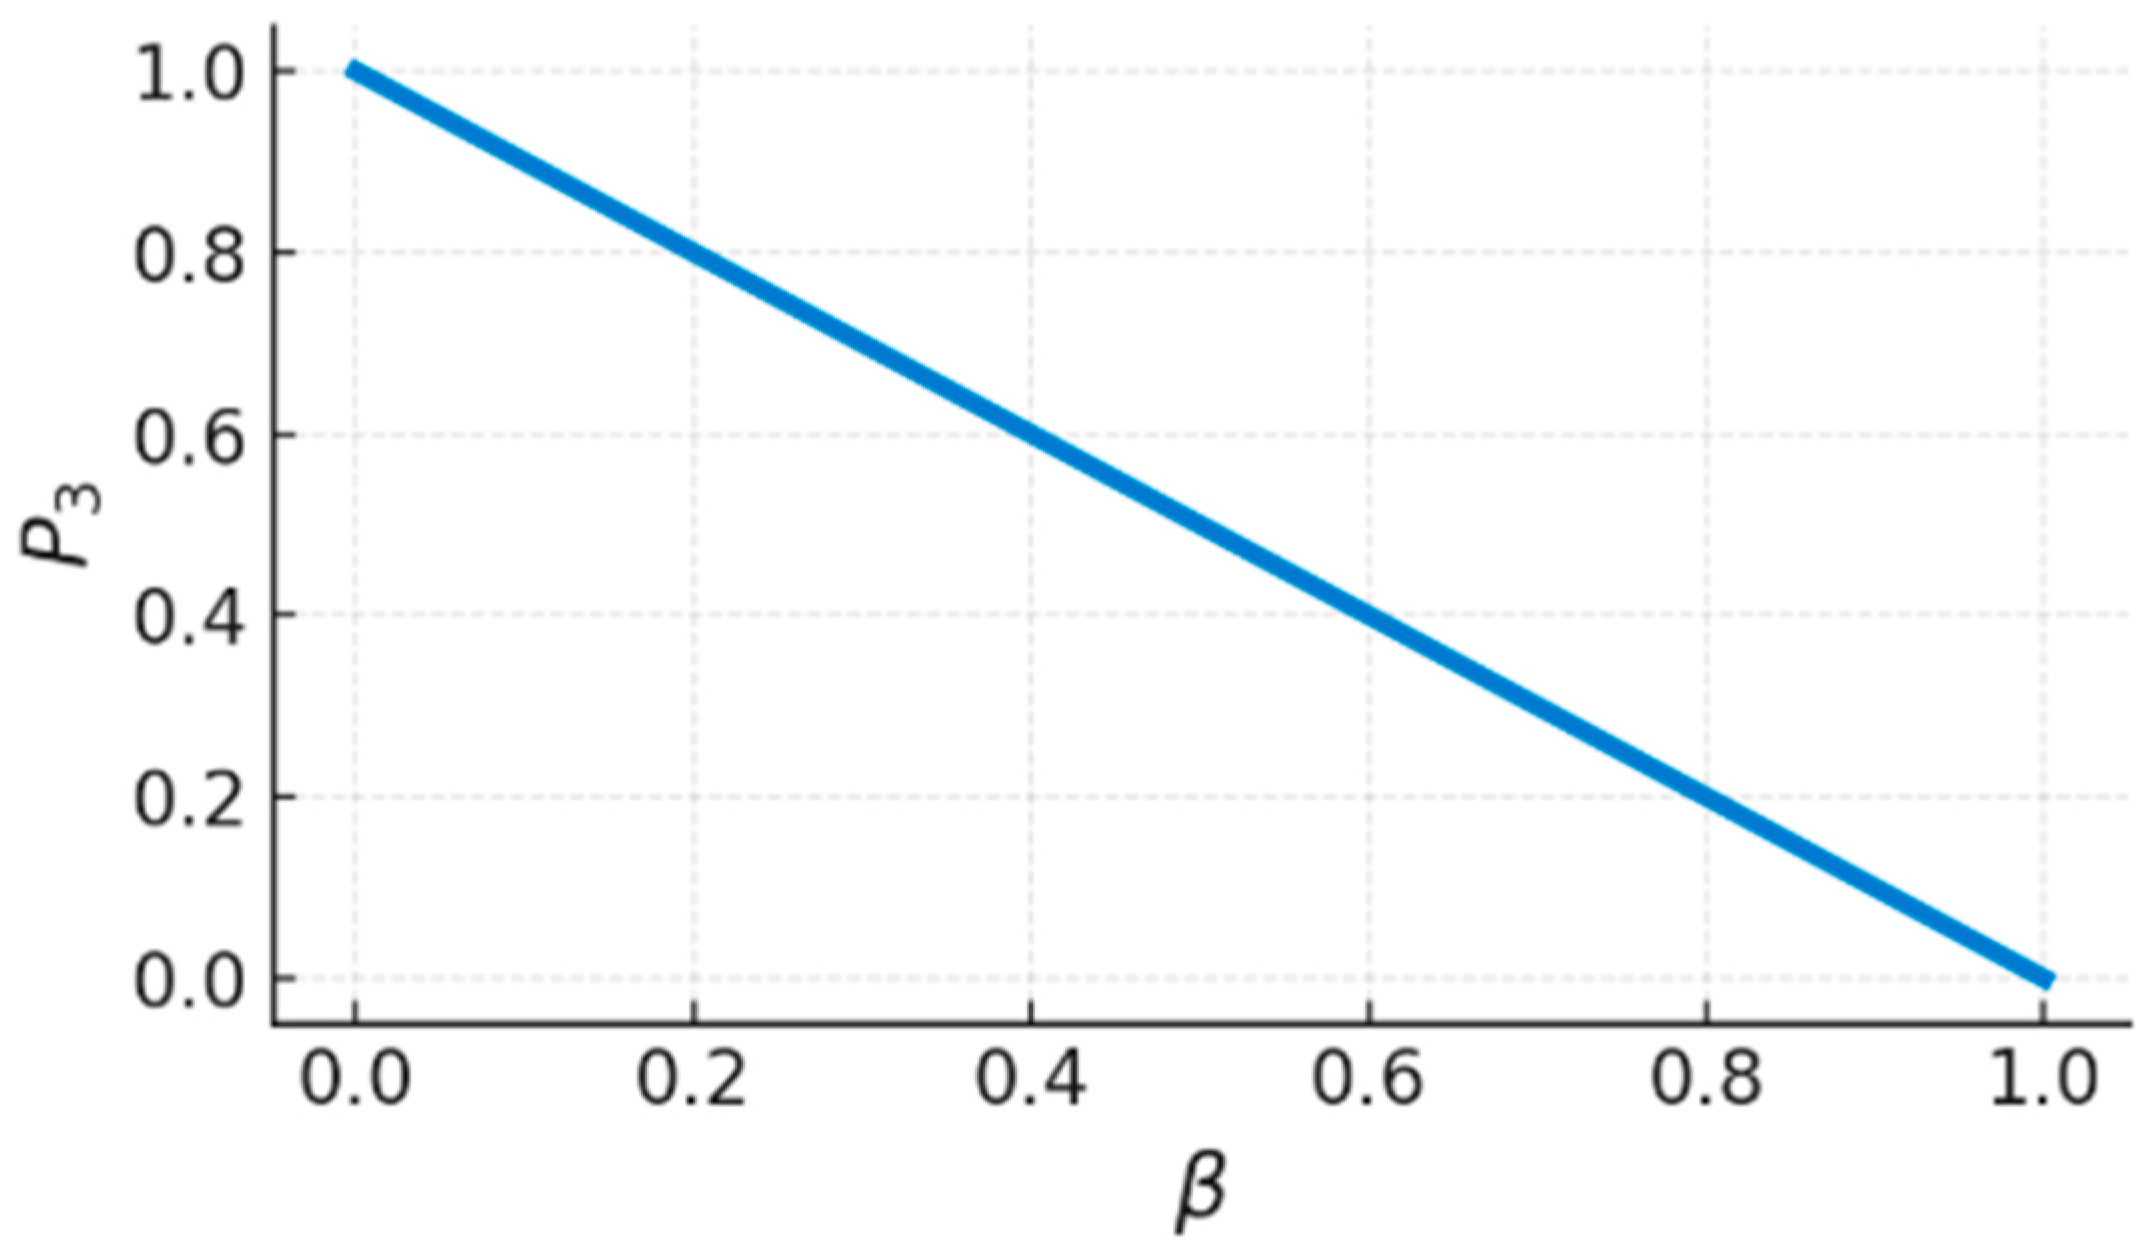
Following the scheme of previous simulations, we repeated the analysis of diattenuator-based and retarder-based depolarizers, but now considering, in both cases, an isotropic contribution as well. The isotropic component of constructed depolarizers can be controlled by the weight of the parameter β in Equation (21); and thus, simulated depolarizers both contained anisotropic depolarization and isotropic component. From the obtained simulations, we observed that P3 is independent of the control parameters related to the anisotropic term but exists an inverse linear relation between P3 and the weight β of the isotropic depolarization content, as illustrated in Figure 3 (i.e., the smaller P3, the larger the isotropic depolarization content in a sample).
In addition, comparing Equations (14) and (21), and in agreement with the above presented results, it was demonstrated that the term of the Characteristic decomposition providing fully depolarization, described by the P3 channel, is directly related to the weight of the isotropic depolarizers fraction:
1 P 3 m 00 M d = β m 00 M i s o
Equation (22) demonstrates that the relation between the weight of the isotropic contribution β, and P3 is given by β = 1 − P3. In this scenario, P3 reflect the origin of depolarization in samples. In particular, when P3 = 1, the isotropic term is zero (no isotropic depolarization is present); and thus, all depolarization arises from the anisotropic term. In this case, depolarization originates from the intrinsic polarimetric anisotropies of the sample. In contrast, when P3 = 0, the anisotropic term is absent, which means polarimetric anisotropies of constituent elements do not contribute to the depolarizing behavior. That is to say, all depolarization is originated from the isotropic term, and the corresponding samples behave as ideal depolarizers, typically resulting from processes such as isotropic scattering. Importantly, when the value of P3 is in the range [0, 1], both depolarizing mechanisms (isotropic and anisotropic) are present, and their relative contributions are reflected in the value of P3.
Summarizing, this section showed that the isotropic and anisotropic depolarizers can be studied in terms of the IPP (observables P1, P2 and P3). The observable P3 gives a measure of the presence of depolarization behavior featured by isotropic mechanisms. In turn, P1 and P2 provide information on physical characteristics of inherent elements giving rise to sample depolarization; and thus, they are connected to anisotropic mechanisms. In this vein, the IPP provides the physical mechanisms that lead to depolarization, which helps with the further description, categorization, and recognition of depolarizing systems.

4. Combining IPP and PRT Spaces for the Characterization of Anisotropic Depolarizers

In the previous section, we demonstrated that by taking advantage of the P3 channel associated with a MM, it is possible to distinguish anisotropic depolarization from isotropic depolarization. However, it has also been proved that all anisotropic depolarizers are located on the same surface, P3 = 1. This situation limits the potential of the IPP space to identify different physical origins among anisotropic depolarizers. As stated in Section 2, the information provided by the IPP and PRT spaces are complementary to each other, and moreover, the polarimetric observable PP in the PRT space can identify the depolarization origin of diattenuation. For this reason, the combined use of PRT and IPP can distinguish between different anisotropic depolarization origins. This section discusses this matter in detail and reviews how to efficiently identify anisotropic depolarization origins by properly combining the information provided by the IPP and PRT spaces.
The outline of this section is arranged as follows: Section 4.1 presents how to distinguish between diattenuator-based and retarder-based depolarizers by using such two spaces. Next, Section 4.2 focuses on analyzing and identifying depolarizers with different physical origins by studying the relevant distributions in IPP and PRT spaces. Last, Section 4.3 reviews the way to obtain the depolarizer constructions by calculating the parameters that control the physical meaning of the constructed depolarizers.

4.1. Retarder-Based and Diattenuator-Based Depolarizer Discrimination

As stated above, the construction of the simulated anisotropic depolarizers arises from the summarization of two types of unitary elements: linear retarders for retarder-based depolarizers and linear polarizers for diattenuator-based depolarizers. Therefore, we first review how to distinguish between these two depolarizer classes.
To simulate a set of diattenuator-based depolarizers, the D parameter representing the diattenuation value of diattenuators was set as a 1 × 10⁴ values array by taking values from 0 to 1 with a step of 10−4. In the same way, the orientation variance σ2 consisted of 104 different elements by taking values from 0 (all diattenuators pointing in the same direction) to π/2 (reasonable maxima orientation variance if considering real samples) with a step of π/2 × 10−4. This scenario led to 104 × 104 = 108 simulations of different diattenuator-based depolarizers.
Analogous to the previous case, the retarder orientation variance σ2 was also set as an array of 104 elements with values from 0 to π/2 with steps of π/2 × 10−4. The retardance ϕ consisted of 104 elements by taking values from 0 to π with a step of π × 10−4. Finally, we also obtained 108 simulations for retarder-based depolarizers.
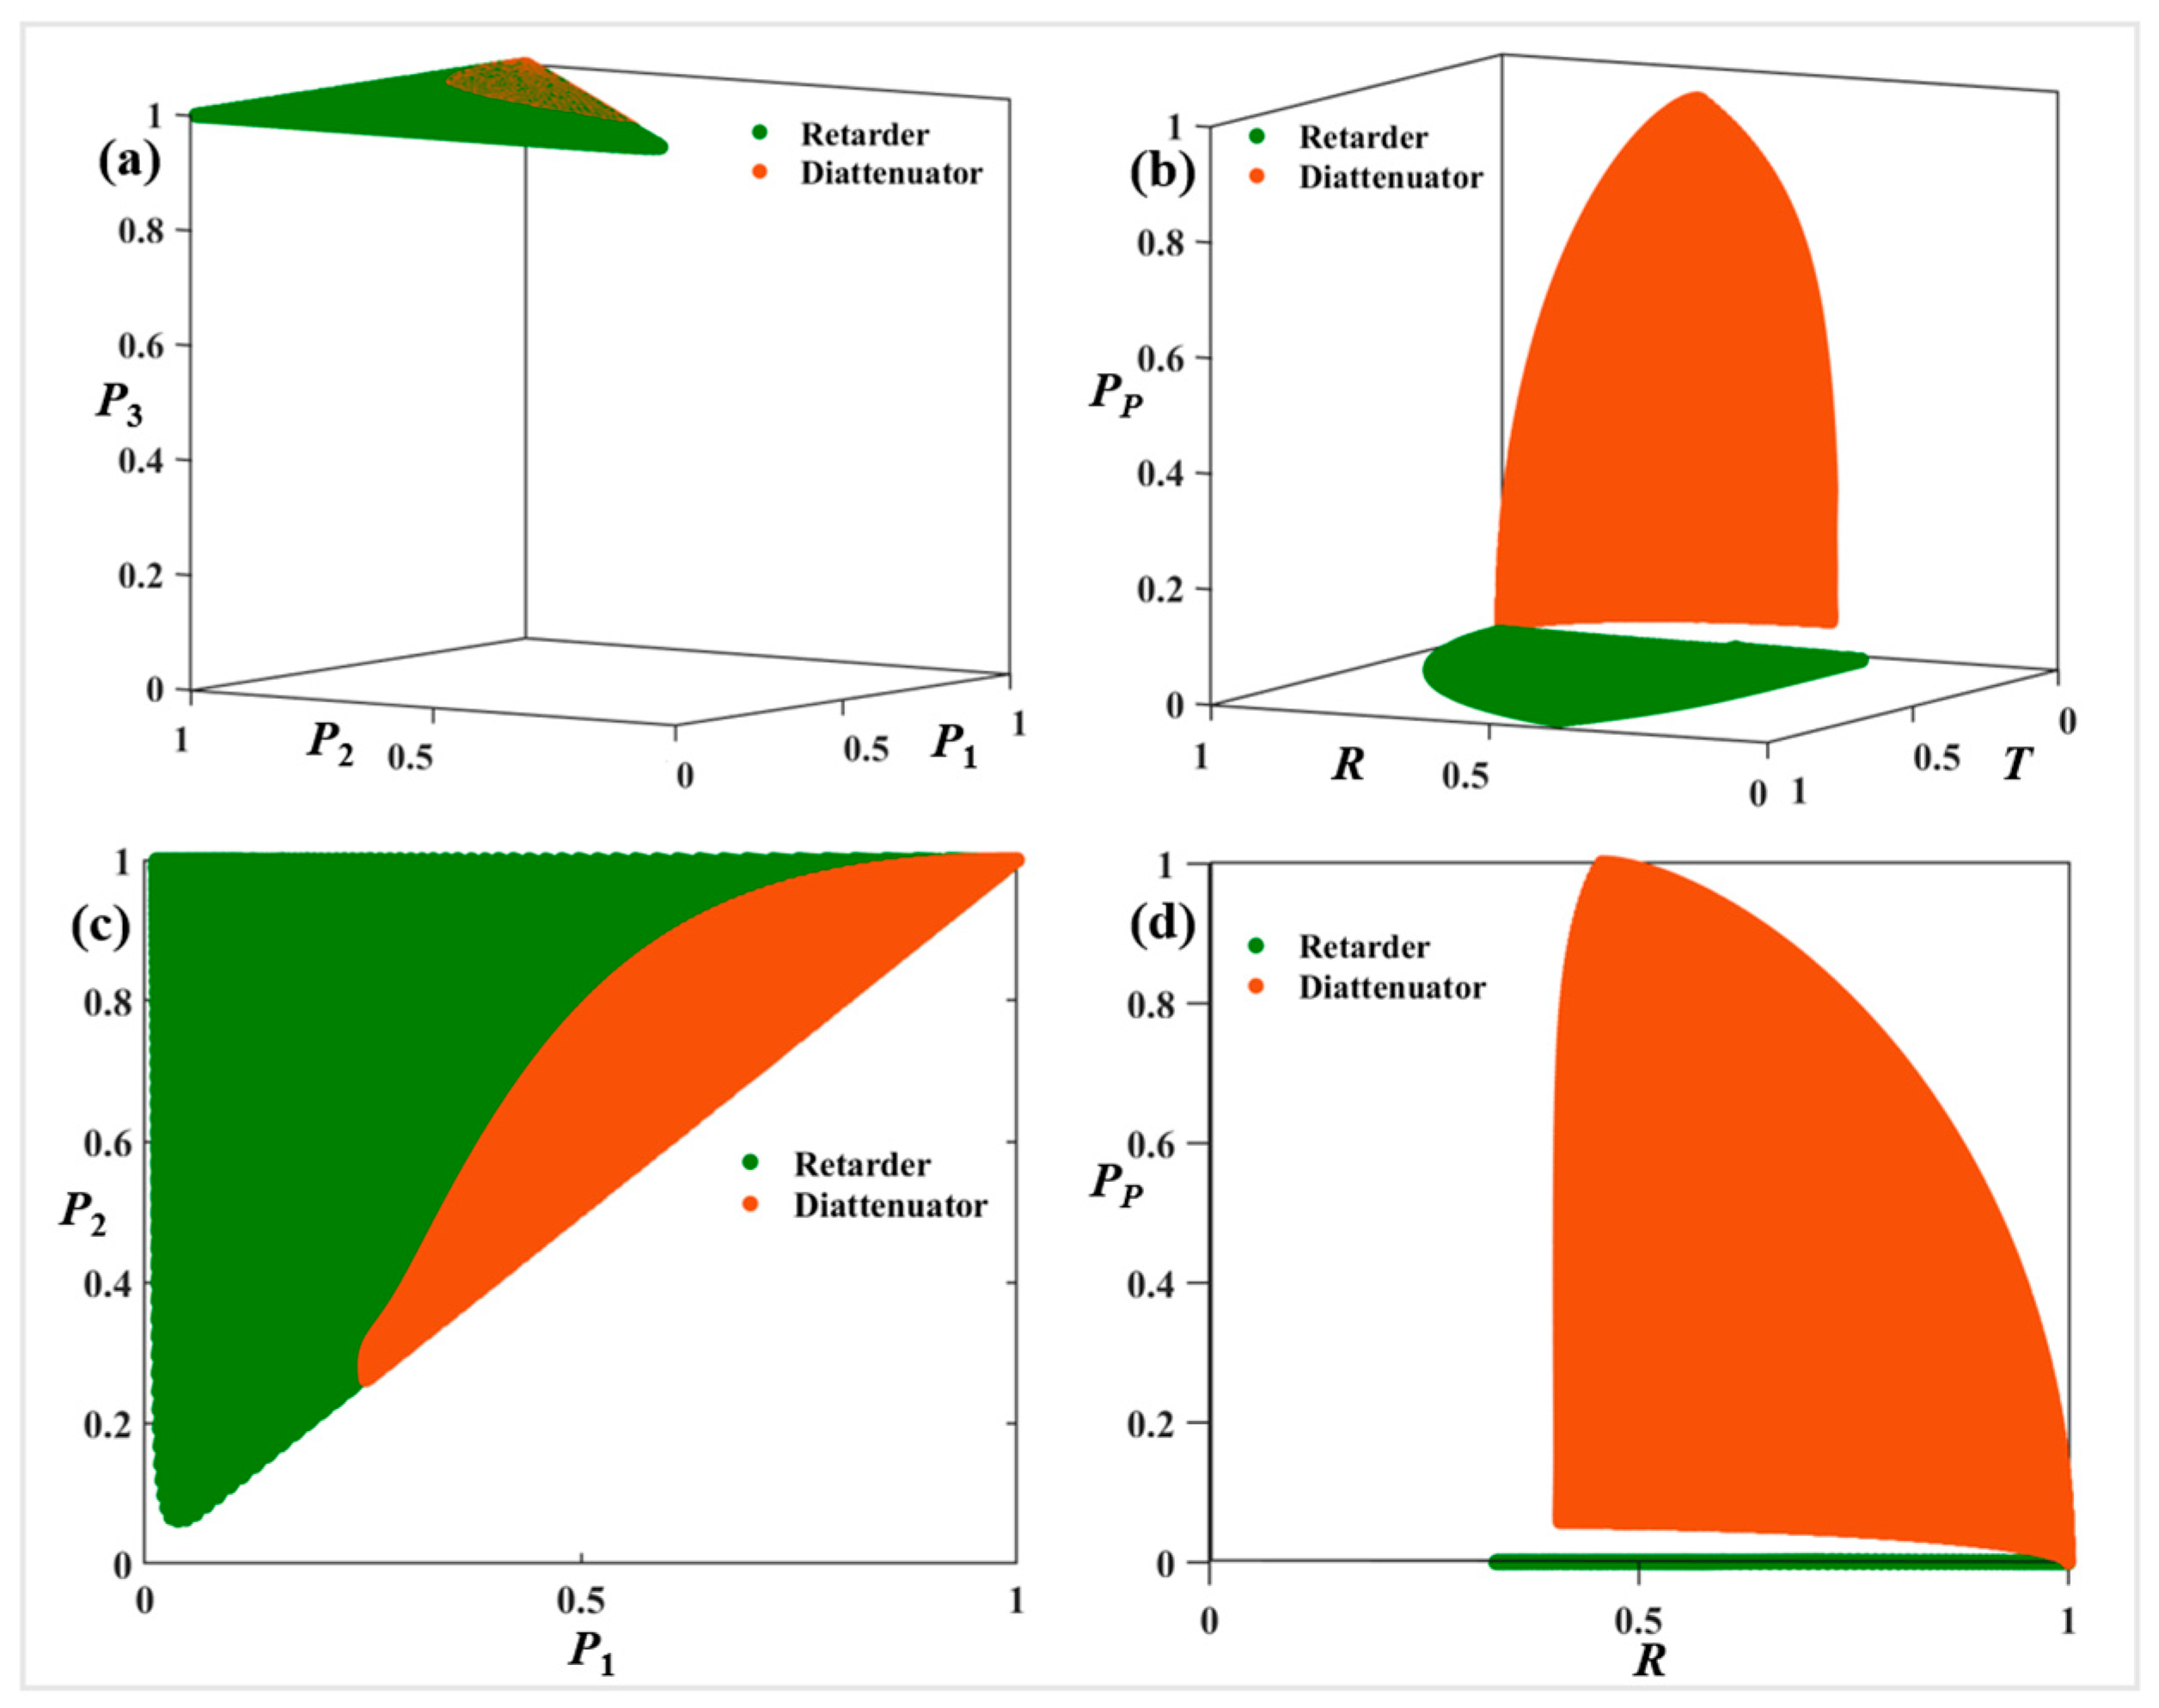
Then, regarding these 2 × 10⁸ simulated MMs of depolarizers (108 diattenuator-based depolarizers and 108 retarder-based depolarizers), the IPP and PRT associated observable values (as described in Section 2, P1, P2 and P3 for IPP and P, R and T for PRT spaces) were calculated. The corresponding data representing all this collection of depolarizers was represented both at the IPP and PRT spaces, in Figure 4a,b, respectively. Note that to provide another perspective to analyze the distribution of such points, the plane of P3 = 1 in IPP space and the plane of T = 0 in PRT space are illustrated in Figure 4c,d, respectively. Note that the points representing diattenuator-based and retarder-based depolarizers are colored in orange and green, respectively.
The corresponding distributions of depolarizers presented in IPP and PRT spaces reveal the potential of depolarizing spaces to discriminate between the depolarizing origins of the simulated depolarizers, whether diattenuator-based or retarder-based depolarizers. However, the PRT space proves to be significantly more suitable than the IPP space for discriminating between these two types of depolarization. Specifically, in the IPP space, all simulated depolarizers—irrespective of whether they are diattenuator- or retarder-based—lie on the top surface (P1P2 plane at P3 = 1; see Figure 4c). In contrast, the PRT space allows for a more efficient separation, as the depolarizers are dispersed throughout the full 3D volume (Figure 4d). This demonstrates that the PRT space has the ability to distinguish samples with birefringence response from those with dichroism response.
This scenario states that some different physical depolarizing systems may lead to the same representation within the IPP space, showing a limitation in its ability to discriminate between these systems. In contrast, in the PRT space, whereas retarder-based depolarizers are located at the PP = 0 plane (see green data in Figure 4b), diattenuator-based depolarizers (orange data in Figure 4b) are located at the rest of the PRT volume (they are distributed out of the plane PP = 0).
To quantify the ability of diattenuator-based and retarder-based depolarizers to occupy the studied depolarization spaces in IPP and PRT domains, we adopt the space-filling rate as the evaluation metric. As illustrated in Figure 4c,d, the area corresponding to each color-coded category can be quantitatively extracted using standard image processing techniques. In the IPP space (top surface, P3 = 1), following the inequalities of the IPP (0 ≤ P1P2P3), retarder-based depolarizers occupy 98.66% of the available region in P1P2 plane, whereas diattenuation-based depolarizers are largely confined within the orange-dominated region, covering only 28.98%. This indicates that retarder-based depolarizers have a broader spatial distribution, visually surrounding their diattenuator-based depolarizers. More importantly, the capacity of the IPP space to discriminate subtle nuances related to the statistical nature of the underlying elements responsible for depolarization is significantly greater for retarder-like depolarizers than for diattenuator-like ones. Considering that the plane P3 = 1 is the plane associated with a constant P3 value with the largest surface area, this analysis further confirms that the IPP space is particularly valuable for studying retarder-like depolarizers.
Conversely, in the PRT space, the two types of depolarizers are nearly disjoint, except at the singular point (PP, R, T) = (0, 0, 1). Notably, retarder-based depolarizers are highly localized near the axis PP = 0, accounting for only 0.61% of the total area. In contrast, diattenutor-based depolarizers span a significantly larger region, occupying 39.12% of the space, which reflects a greater degree of freedom in their spatial distribution within the PRT framework. Therefore, unlike the previous case, the PRT space proves to be particularly suitable for the study of diattenuator-like depolarizers, due to its enhanced ability to discriminate subtle structural features of this type of depolarizers.
It is worth noting that when focusing on a specific type of depolarizing origin (orange or green data in Figure 4), it becomes evident that varying different control parameters lead to different locations of the resulting depolarization in both IPP and PRT spaces. In particular, different locations for diattenuator-based depolarizers (orange data) corresponds to changes in either the orientation or the mean diattenuation value, or standard deviations from mean values. In the same vein, different locations for retarder-based depolarizers (green data) correspond to different orientations or deviations of the fast axis of the retarders, or different mean retardance values.
Consequently, the simulations in Figure 4 evidence the potential of IPP and PRT depolarizing spaces to discriminate between depolarizers arising from different internal arrangements of unitary polarimetric elements. This capability of the IPP and PRT depolarizing spaces is further studied in the following subsection.

4.2. Characterization of Anisotropic Depolarizers According to Their Inherent Structural Characteristics

In this section, we review how different control parameters from the models described in previous sections influence the spatial position of a depolarizer within the IPP and PRT spaces. This study is valuable as it establishes a direct connection between macroscopic depolarization measurements—i.e., observables derived from the Mueller matrix, which can be obtained through experimental polarimetric measurements—and the internal characteristics of the system, represented by the selected control parameters in the optical model under consideration. To do so, a space of simulated depolarizers (including diattenuator-based and retarder-based depolarizers) was constructed with different controlling parameters.
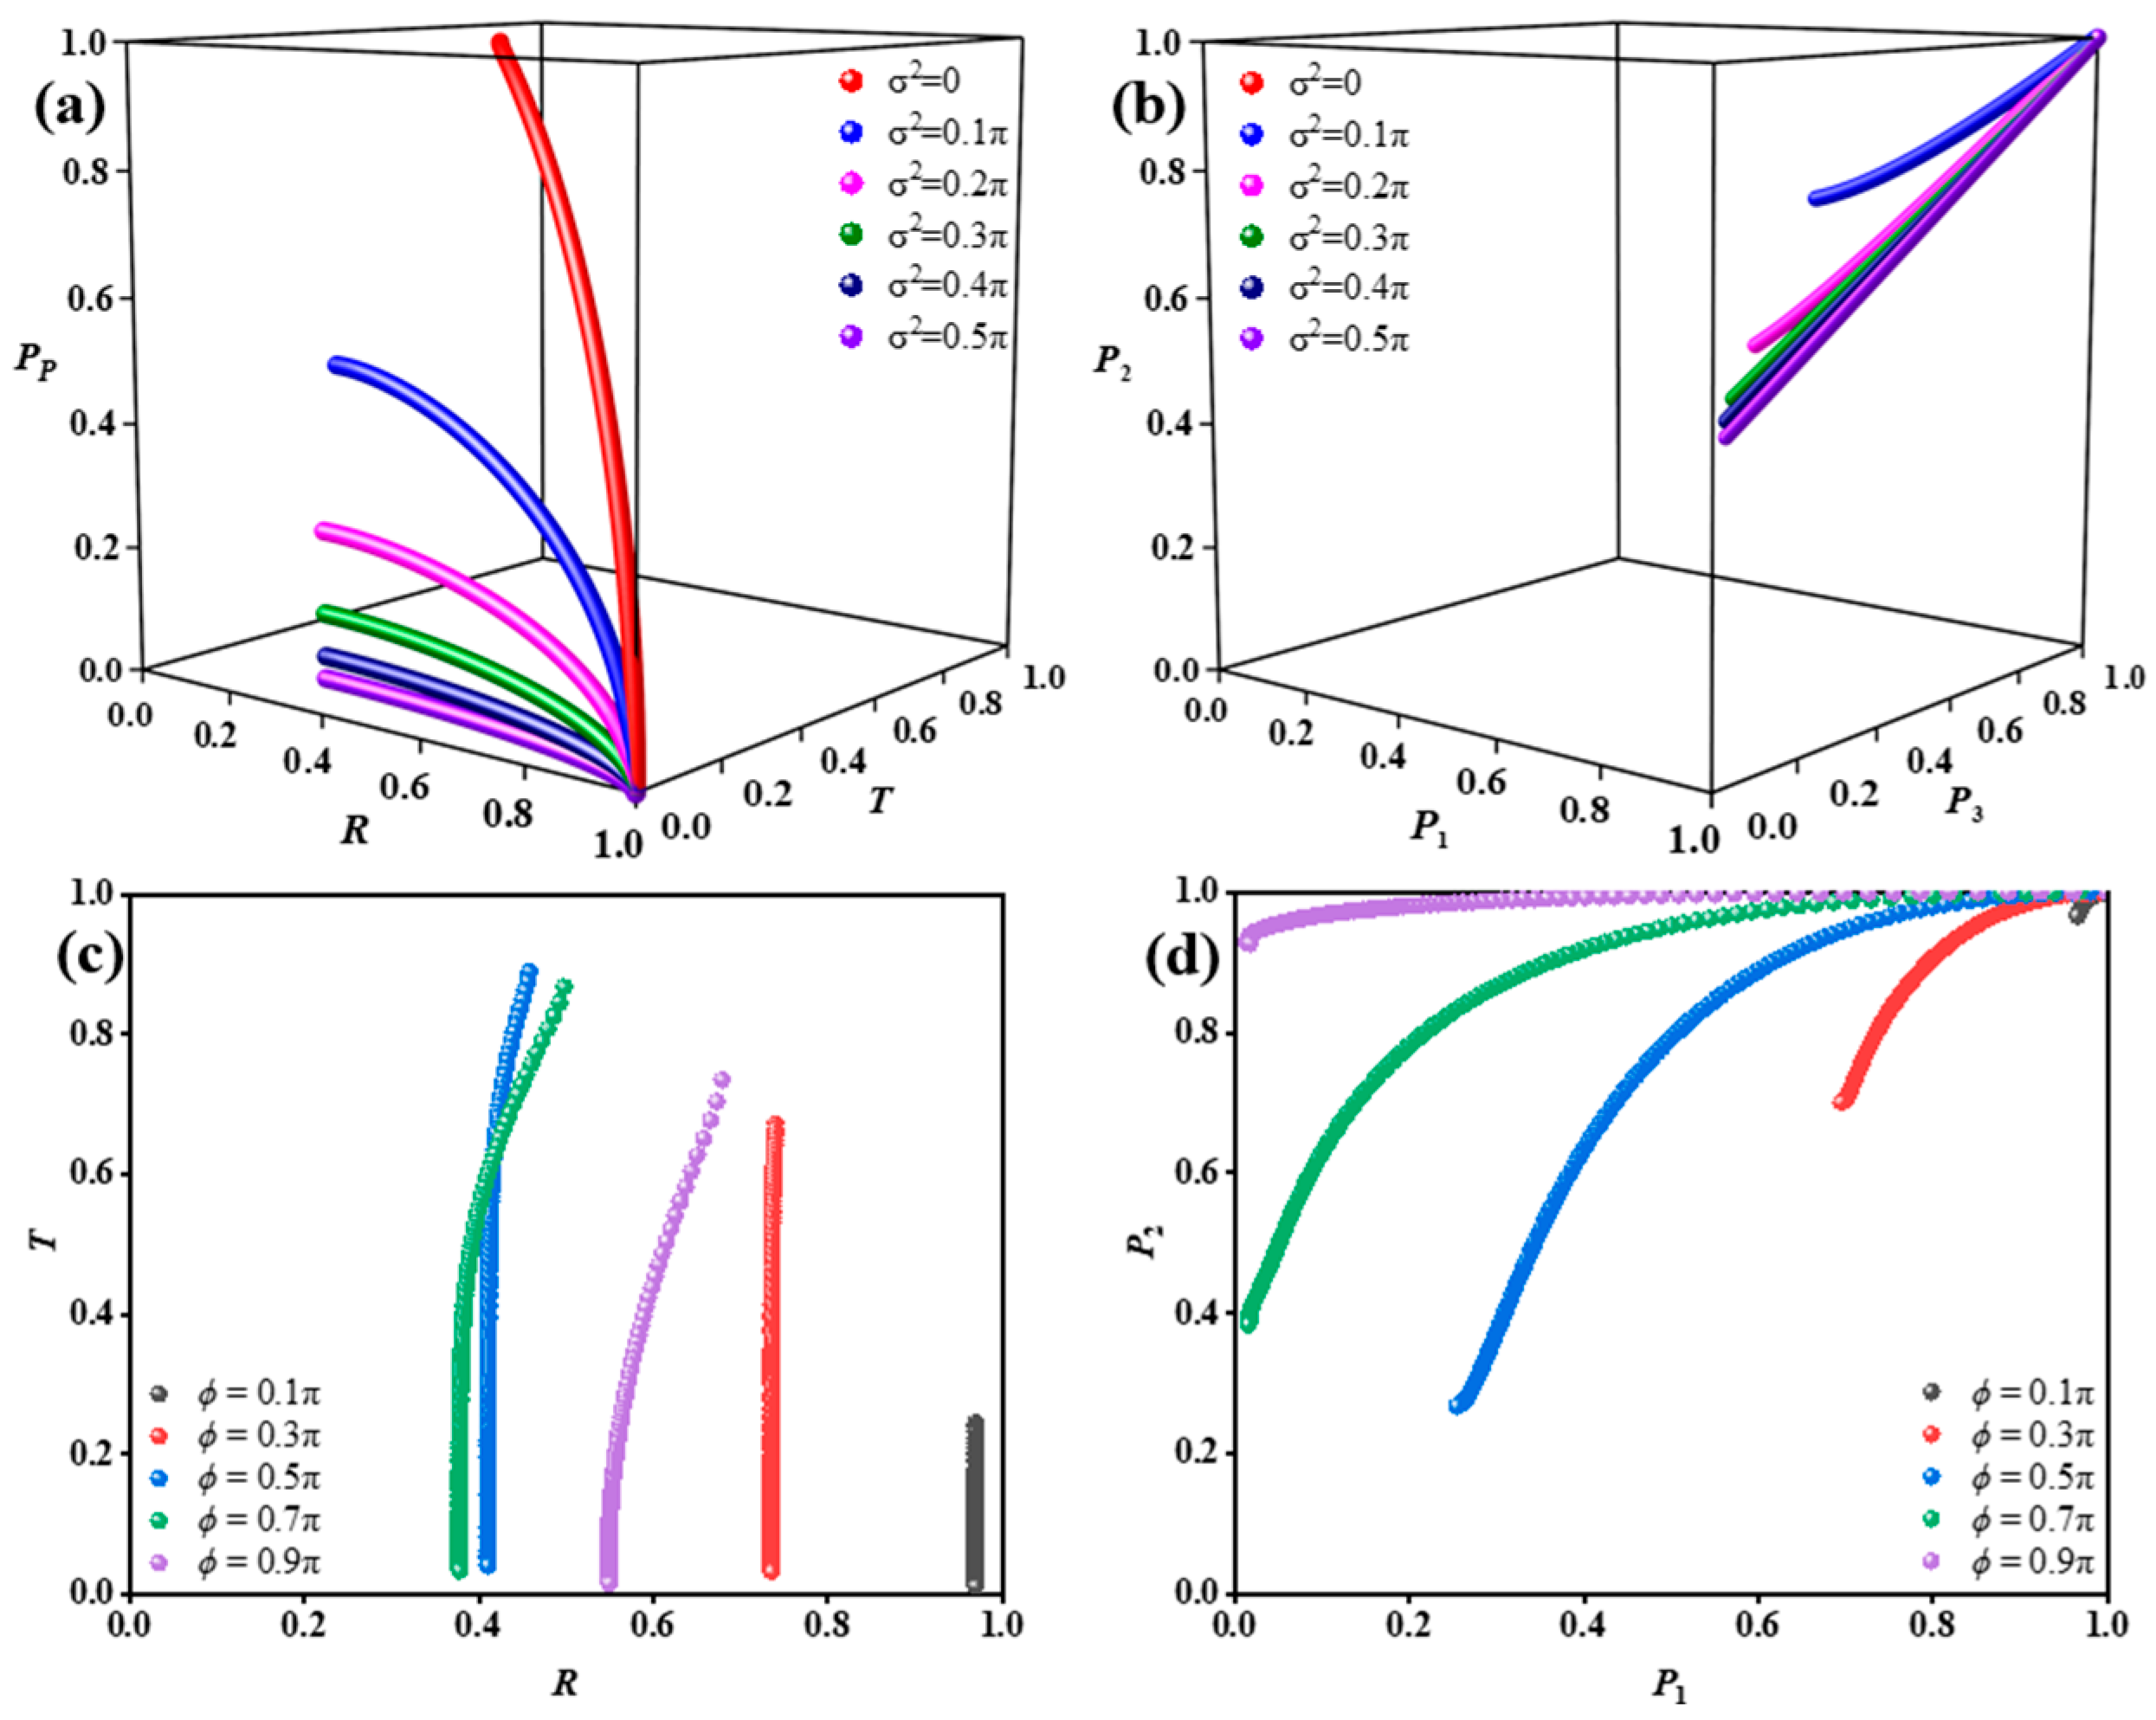
On the one hand, regarding the diattenuator-based depolarizers, each generated depolarizer is composed of 300 (N = 300) linear diattenuators of which D is set as an array of 104 elements uniformly distributed between [0, 1]. Moreover, the values of σ2 are set from 0 to 0.5π with a step of 0.1π. This way, 6 × 10⁴ different diattenuator-based depolarizers are constructed and then represented in the PRT and IPP spaces in Figure 5a,b, respectively. On the other hand, for consistency with the diattenuator-based depolarizers, the number of retarders to generate retarder-based depolarizers is set as 300 as well. Then, a set of retarder-based depolarizers are generated by properly setting the controlling parameters: the retardance (ϕ) value for constituent retarders and the deviation value σ2 from the mean orientation. In particular, the retardance ϕ was set as an array of five elements by taking values from 0.1π to 0.9π with a step of 0.2π. In addition, the orientation deviation σ2 of the constituent retarders was set as an array of 104 elements by taking values from 0 to π with a step of π × 10−4. These possible combinations lead to 5 × 10⁴ simulated retarder-based depolarizers, which were represented at the RT (Figure 5c and P1P2 (Figure 5d) planes belonging to the PRT and IPP spaces, respectively.
Figure 5 illustrates the spatial distribution of the simulated depolarizers at the IPP and PRT spaces as a function of the model-controlled parameters. In particular, Figure 5a,b represents diattenuator-based depolarizers varying with the controlling parameters D and σ2. Different colored curves correspond to diattenuator-based depolarizers with different values of the parameter σ2 (provided at Figure 5 legend). Note that red data in Figure 5b ( σ 2 = 0 ) corresponds to a dot at the 1 , 1 , 1 point. In contrast, Figure 5c,d present the relation between controlling parameters and spatial distributions for retarder-based depolarizers, where different color curves correspond to variations of the mean retardance ϕ.
The results in Figure 5 demonstrate the ability of PRT and IPP spaces to distinguish between the depolarizers with the same origin but different inherent structural characteristics, since the represented depolarizers occupy a vast volume in such spaces. In particular, in the IPP space, shown in Figure 5b, the distances between curves corresponding to σ2 values smaller than 0.2π are significant, ensuring clear discrimination between systems, but as σ2 increases, the corresponding curves become closer. Conversely, the PRT space shows better performance in distinguishing between lines representing depolarizers with different σ2. In particular, the related lines have clearly different behavior, especially when σ2 is smaller than 0.4π (a common range in biological tissues), which demonstrates the ability of PRT space to identify different diattenuator-based depolarizers. In summary, even though both polarization spaces can characterize the diattenuator-based depolarizers with different structural characteristics, the PRT space shows significant superiority over the IPP space in several tasks.
To study the physical properties of retarder-based depolarizers with controlling parameters, the corresponding distributions are shown in IPP and PRT spaces in Figure 5c,d. According to the retardance ϕ selected (see legend in Figure 5c), the observable R presents an important discriminatory capability to classify different retarder-based depolarizers with different retardance ϕ values within a range of ϕ = (0.1π, 0.5π). In addition, the observable T presents discriminatory capability for σ2. For this reason, the combination of observables T and R arises as a nice framework to study the inherent characteristics of retarder-based depolarizers. However, when dealing with retardance-based depolarizers with larger retardance ϕ values (ϕ is bigger than 0.5π), the newly analyzed curves overlap with those previously studied in Figure 5c, which leads to an ambiguity in the determination of the retardance parameter.
If the same study is implemented in terms of the P1P2 space, the same discriminatory potential is observed for the ϕ = (0.1π, 0.5π) range, but, unlike the RT plane case, the P1P2 space still presents certain discriminatory potential when ϕ is bigger than 0.5π. Therefore, the simulated results in Figure 5 indicate that PRT space has better potential in distinguishing diattenuator-based depolarizers than the IPP space due to the large space exist between lines presenting varying σ2. But the IPP space performs better over PRT space regarding retarder-based depolarizers since the IPP space effectively avoids the ambiguity in ϕ discrimination.
Summarizing, the combined consideration of IPP and PRT spaces, by analyzing the distributions of diattenuator-based and retarder-based depolarizers (controlled by parameters under study in such spaces), helps distinguishing between samples with different physical features. Furthermore, Figure 5 illustrates that the depolarizing spaces associated polarimetric observables present a unique relation with the parameters of the studied depolarizers. This insight provides a pathway for retrieving depolarizer parameters without relying on microscopic measurements, as will be detailed below.

4.3. Physical Parameter Characterization from PRT Space Polarimetric Observables

The goal of this section is to review a physical model, based on polarimetric observable data, able to retrieve inherent information of the samples. In particular, we chose to explore the PRT observables for this task, as they demonstrated superior performance in sample characterization, as discussed in the previous section.
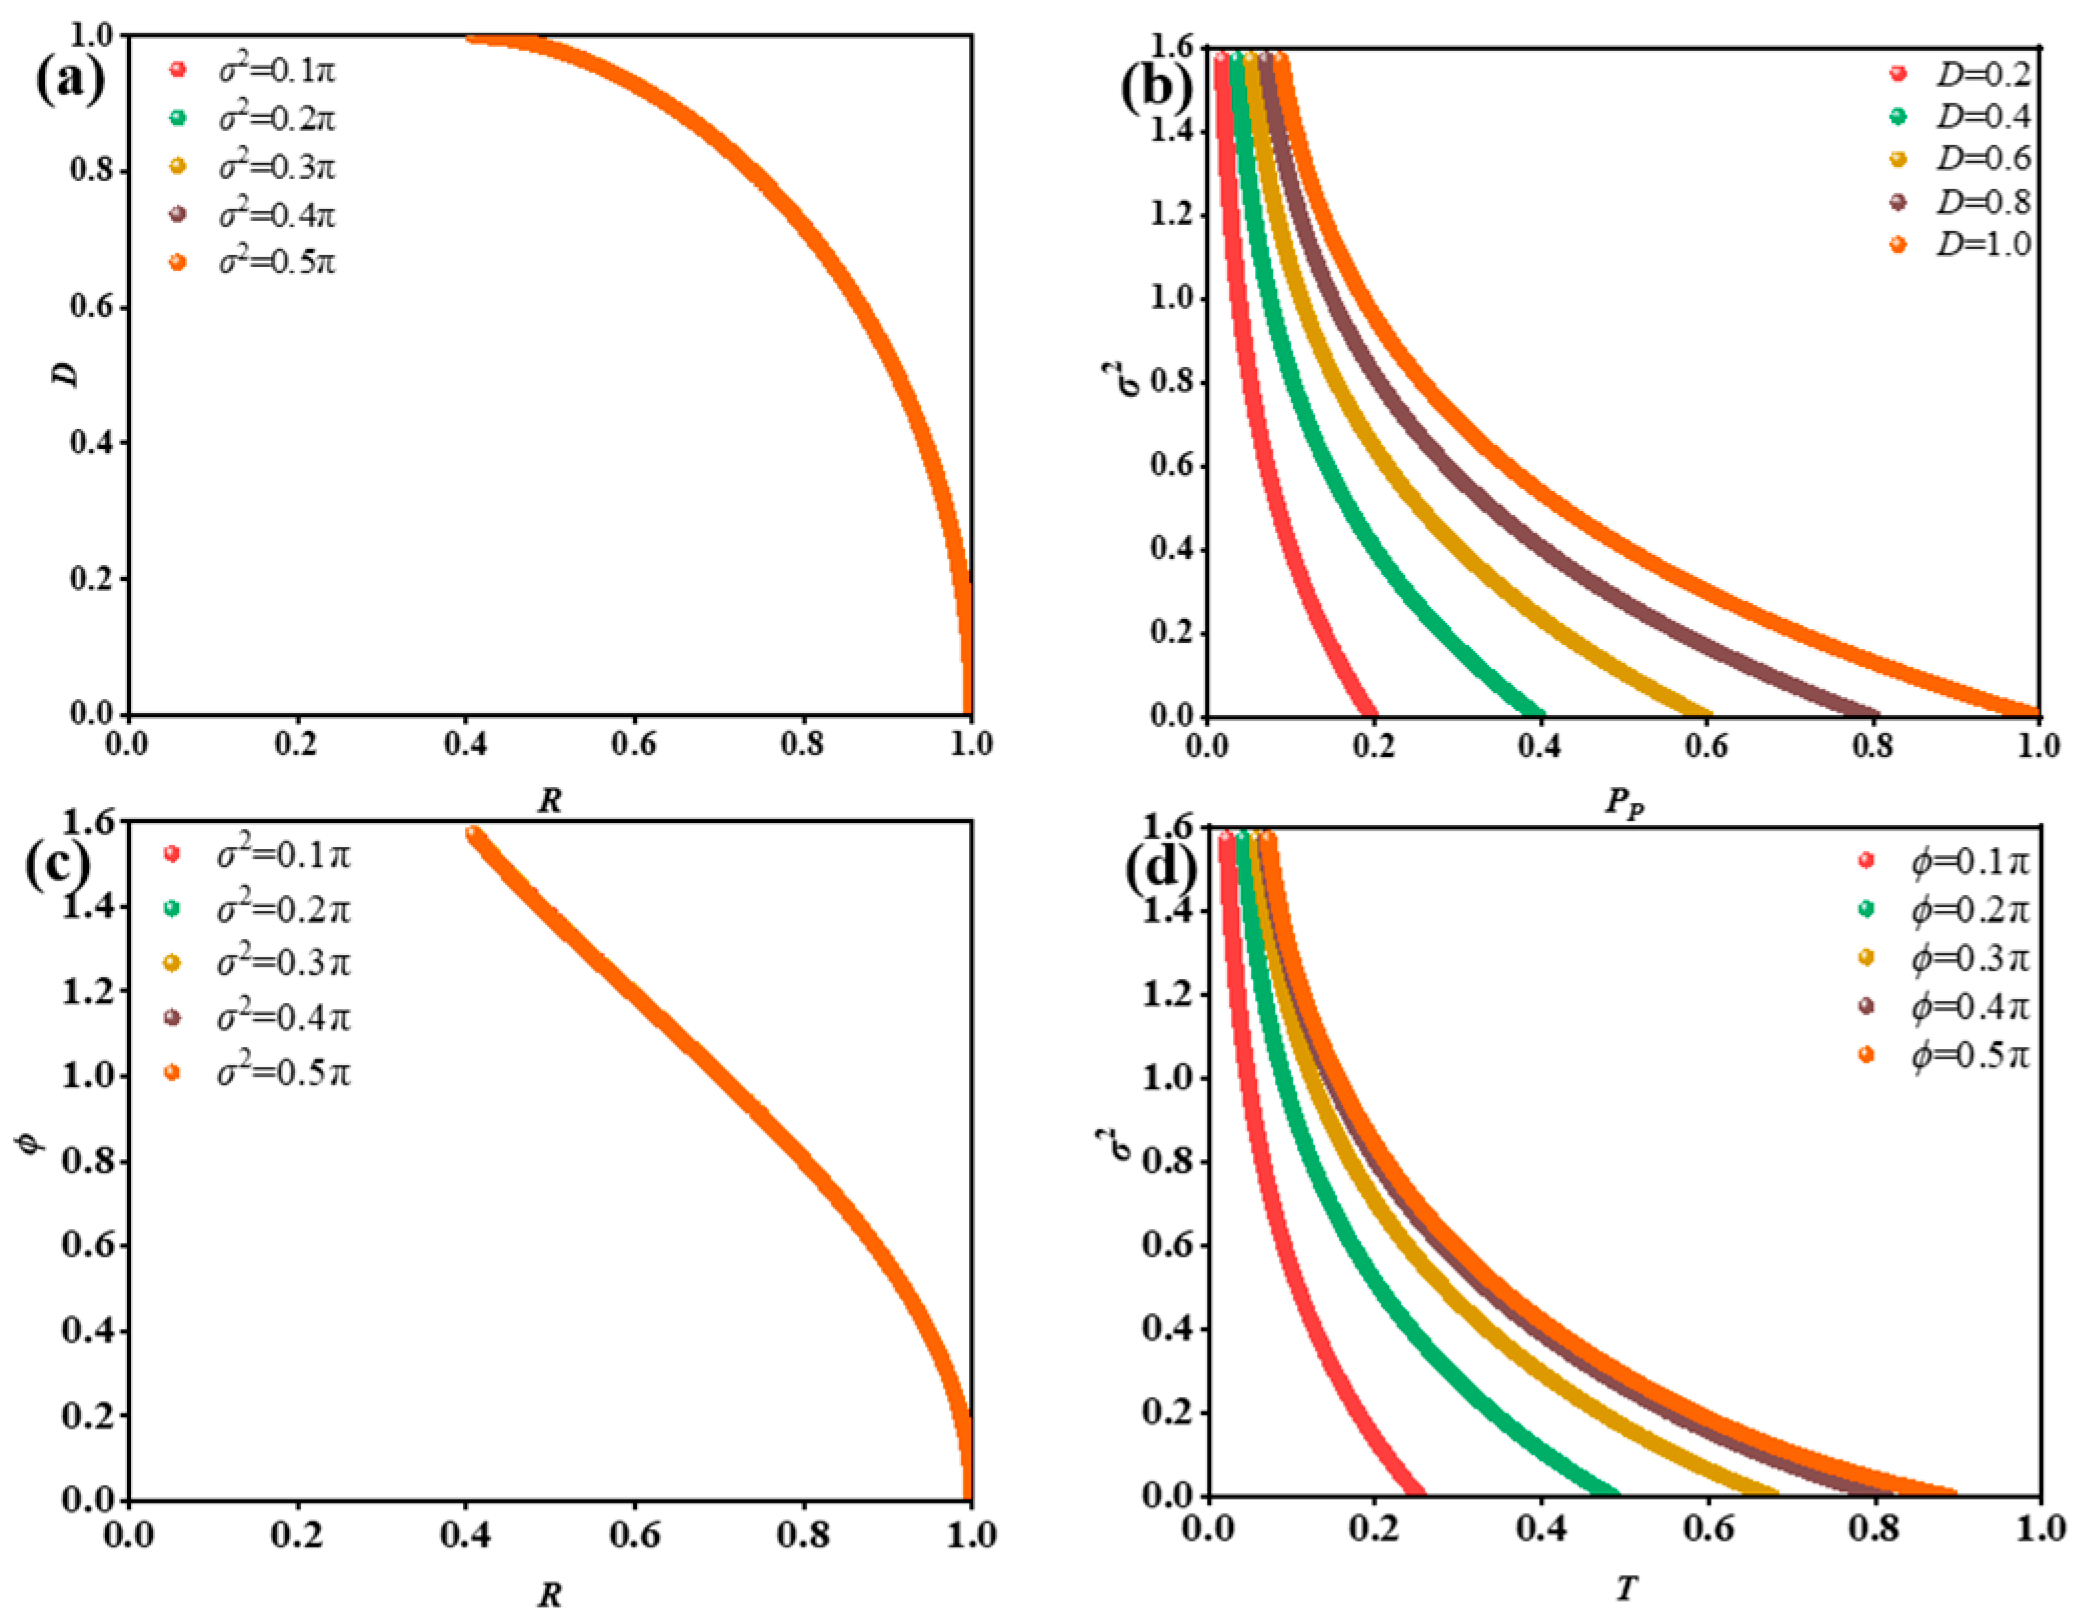
By observing the data presented in Figure 5, it is easy to find that there is a clear correlation between Pp observable and σ2. In addition, a deeper analysis of the relationship between PRT observables and physical features reveals a strong correlation between the observable R and the diattenuation magnitude D of the corresponding depolarizers, while remaining independent of σ2, as shown in Figure 6a. Thus, it should be possible to establish a functional relationship linking the polarimetric measurement of the R channel associated to a sample, with the physical parameter D, associated with inherent constituents of diattenuator-based depolarizers.
Complementarily, in the case of retarder-based depolarizers, a clear correlation between R observable and ϕ was found. Importantly, further analysis demonstrates that the observable R is independent of σ2. To prove this statement, the relation between R and ϕ with different σ2 is illustrated in Figure 6c, in which all curves representing varying σ2 values overlap.
As stated, Figure 6a clearly shows that all curves corresponding to different values of σ2 overlap along a single trajectory. Accordingly, by taking advantage of the existing relation between D and R, we performed a polynomial fit on the data in Figure 6a, this enabling the prediction of D from R measurements, as expressed in the following equation:
D R = 196.6   R 5 + 671.39 R 4 903.08 R 3 + 595.4 R 2 192.43 R + 25.39
To verify the accuracy of Equation (23), the experimental database (1800 equidistant orientations of polarizer from 0 to π with steps of π/1800) is employed to construct diattenuator-based depolarizers with different σ2. The detailed process is shown in ref. [36]. The results obtained show excellent agreement between the average of experimental Dexp values ( D e x p = 1.04 ± 0.03 ) and the expected value D = 0.97 .
The next goal is to find a function giving the σ2 value from polarimetric observables. This would enable the extraction of statistical information regarding the dispersion of inherent elements from measurable polarimetric observables. As previously discussed, the observable PP is especially suitable for this aim. Figure 6b shows that the relation between σ2 and PP for diattenuator-based depolarizers (related to different D values; see the legend in Figure 6b) is perfectly discriminated by the PP observable (X-axis in Figure 6b). Recall that different curves (colours) relate to different D values, which are perfectly determined from the R observable provided in Equation (23).
To implement the analytical function relating σ2 to PP measurements, an arbitrary curve D = 1 is chosen. This approach is reasonable as in experimental implementations, we can determine the proper D by Equation (23) and then fix it to be applied in the following approach. At this point, the D = 1 curve was fitted to a polynomial and the obtained results are presented in Equation (24).
σ 2 P P , D = 1 = 20.92   P P 5 + 63.14   P P 4 73.61   P P 3 + 42.25   P P 2 13.31   P P + 2.42
Importantly, the validity of the obtained Equation (24) is verified using experimental depolarizers by arbitrarily assigning different σ2 to the incoherent additions. Then, from the corresponding obtained MMs of implemented depolarizers, the experimental PP values were calculated. Finally, these PP values were applied to Equation (24) to obtain the corresponding calculated σ2. There is excellent agreement between experiments and calculations as can be observed in Table 1, where the mean absolute error is below 2 % , regardless of the depolarizer characteristics.
Afterward, following the same reasoning outlined above and according to data in Figure 6c, a polynomial relation can also be established between ϕ and the polarimetric observable R, this leading to the following analytical equation:
ϕ ( R ) = 9.54   R 3 + 18.41   R 2 13.42   R + 4.56
To confirm the validity of Equation (25), the data of the quarter-wave plate are measured (1800 equidistant orientations of the quarter-wave plate from 0 to π with steps of π/1800) to construct the retarder-based depolarizers with different σ2. Accordingly, the obtained average of the calculated retardances was ϕ e x p = 1.72 ± 0.03 . Compared with the expected value ( ϕ = 1.66 for the measured quarter wave), the small difference proves the applicability of Equation (25).
Afterward, while the polarimetric observable PP of retarder-based depolarizers always equals 0, due to the absence of diattenuation in retarder-based depolarizers, only observable T is left, and it is sensitive to the change of σ2. In particular, the relation between σ2 and T at different ϕ values is represented in Figure 6d, in which different ϕ values relate to different colour curves. As ϕ can be determined from R as shown in Equation (25), we chose an arbitrary curve ϕ = 0.5π to implement the formwork of calculating σ2 through observable T measurements. The corresponding polynomial for such a case is presented in Equation (26):
σ 2 ( T , ϕ = π / 2 ) = 38.12 T 5 + 101.19 T 4 103.44 T 3 + 52.19 T 2 14.60 T + 2.34
Finally, the T value is fixed for the retarder-based depolarizers constructed from the experimental waveplate by arbitrarily assigning different σ2. Then, these T values were applied to Equation (26) to obtain the corresponding calculated σ2. The experiments and calculations present an excellent agreement, as observed from the mean absolute error ( < 2 % error).

5. Experimental Validation

This section presents the experimental validation of the simulations and conclusions discussed in Section 3 and Section 4. The experimental Mueller matrix (MM) is obtained through the incoherent summation of MMs corresponding to representative polarimetric elements, such as polarizers and retarders. From these experimentally derived MMs, the associated IPP and PRT parameters are calculated and subsequently compared with the simulation results. Both the isotropic (P3 < 1) and anisotropic (P3 = 1) depolarization scenarios are studied, obtaining the expected agreement between simulations and experiments.

5.1. Experimental Results for the P3 = 1 Case

In this section, experimental validation of the anisotropic depolarizers is provided by measuring the experimental MM of corresponding polarimetric elements, using the complete imaging polarimeter sketched in Figure 7.
The light source of the polarimeter is a multiwavelength LED source, which can be chosen according to tasks. When using a polarimeter to measure samples, at first, the light launched from the LED source is modulated by the polarization state generator (PSG) that can modulate the incidence to any polarization state, composed of a linear polarizer and two liquid–crystal retarders (LCR1 and LCR2). Then, the incident light beam with customized polarization modulated by the PSG illuminates the studied samples. Afterward, the light exiting (reflected or refracted) from the sample is analyzed by a polarization state analyzer (PSA) that can detect polarization state of emergent light, composed of two LCRs, and a linear polarizer. Finally, images of the studying sample are obtained by a standard CCD camera (Allied Vision Manta G-504B, Stadtroda, Germany). By appropriately selecting a set of incident polarization states and analyzing the corresponding output polarization states emerging from the sample, the complete Mueller matrix (MM) of the sample under study can be experimentally determined using a polarimeter.
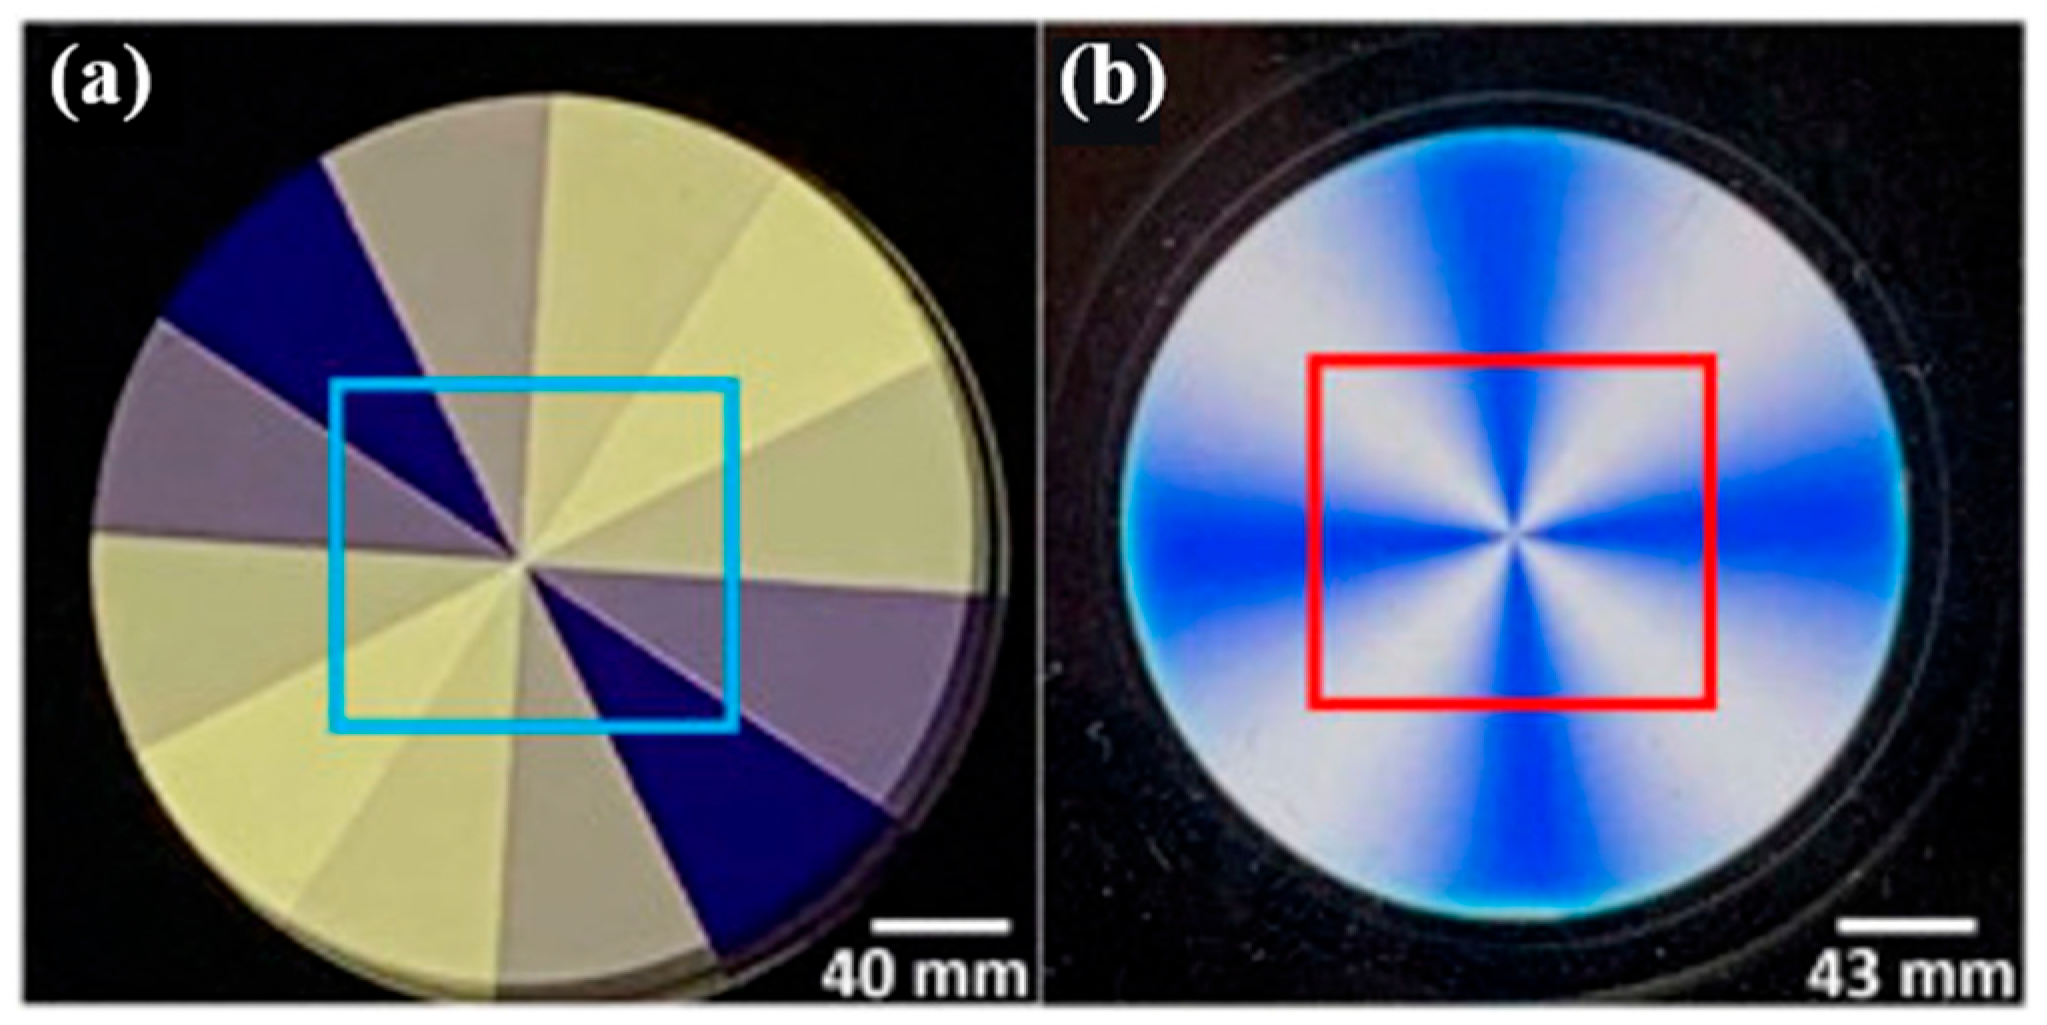
The first experiment conducted, designed to mimic diattenuation-based depolarizers, required the use of the radial polarizer (from Codixx, Barleben, Germany) shown in Figure 8a, which consists of 12 linear polarizers sectors with different orientations. The MM image of this spatially structured element was measured by using the imaging polarimeter in Figure 7. Afterward, a Region of Interest (ROI) centered at the intersection of all the sectors was chosen, which had 344 × 471 pixels, including all 12 linear polarizer orientations (see blue square in Figure 8a). Finally, the MMs of such pixels within this ROI were added, and the corresponding observables (IPP) were calculated.
The second experiment, conceived to study retarder-based depolarizers, required the use of the liquid crystal Q-plate element (model WPV10-633 from Thorlabs, Newton, NJ, USA) shown in Figure 8b. This element can be understood as a linear retarder with a fixed retardance (ideally of π radians for the wavelength of 633 nm) and with changed orientation in terms of the spatial position. The MM image of this structured element was measured as well, and the chosen ROI had 344 × 471 pixels (see red rectangle in Figure 8b). At this stage, all the MM within the ROI were incoherently added to obtain the IPP.
The IPP results obtained from the radial polarizer and Q-plate experiments are summarized in Table 2. These results show strong agreement with the simulation outcomes presented in Section 3.1, where the polarimetric observables P1 and P2 exhibit values lower than 1, while P3 remains equal to 1 (see the colorbar). This behavior confirms that the depolarization induced by unitary elements exhibiting dichroism or birefringence—i.e., anisotropic depolarization—is manifested in the P1 and P2 channels, whereas P3 consistently retains its maximum value, reflecting the absence of isotropic depolarization. It is worth noting, however, that the observed values of P1 and P2 are not fully consistent with the simulations shown in Figure 4c, where a Gaussian distribution was assumed. Since the statistical model used to weight the incoherent addition of unitary elements significantly influences the resulting depolarization response, and considering that the Gaussian distribution used in simulations differs from the equally weighted 12 radial sectors employed in the experiment, these differences may account for the discrepancies observed in the results. Nevertheless, the condition P3 = 1 remains robust across all cases and the trend observed in the P1P2 plane at the tetrahedron top, despite structural differences between the model and the experimental results, exhibits a coherent behavior that supports the validity of the proposed model.
Next, to validate the results presented in Section 4, the experimental MMs of a polarizer and a quarter-wave plate were measured for 1800 equidistant orientations (from 0 to π with steps of π/1800). The manufacturer states that the transmission coefficients for the polarizer used in experiments are larger than 0.82, the extinction ratio is larger than 683:1, and the retardance is π/2 for the quarter-waveplate at 625 nm. Afterward, by properly adding the obtained experimental MMs for different orientations, a collection of anisotropic depolarizers was generated.
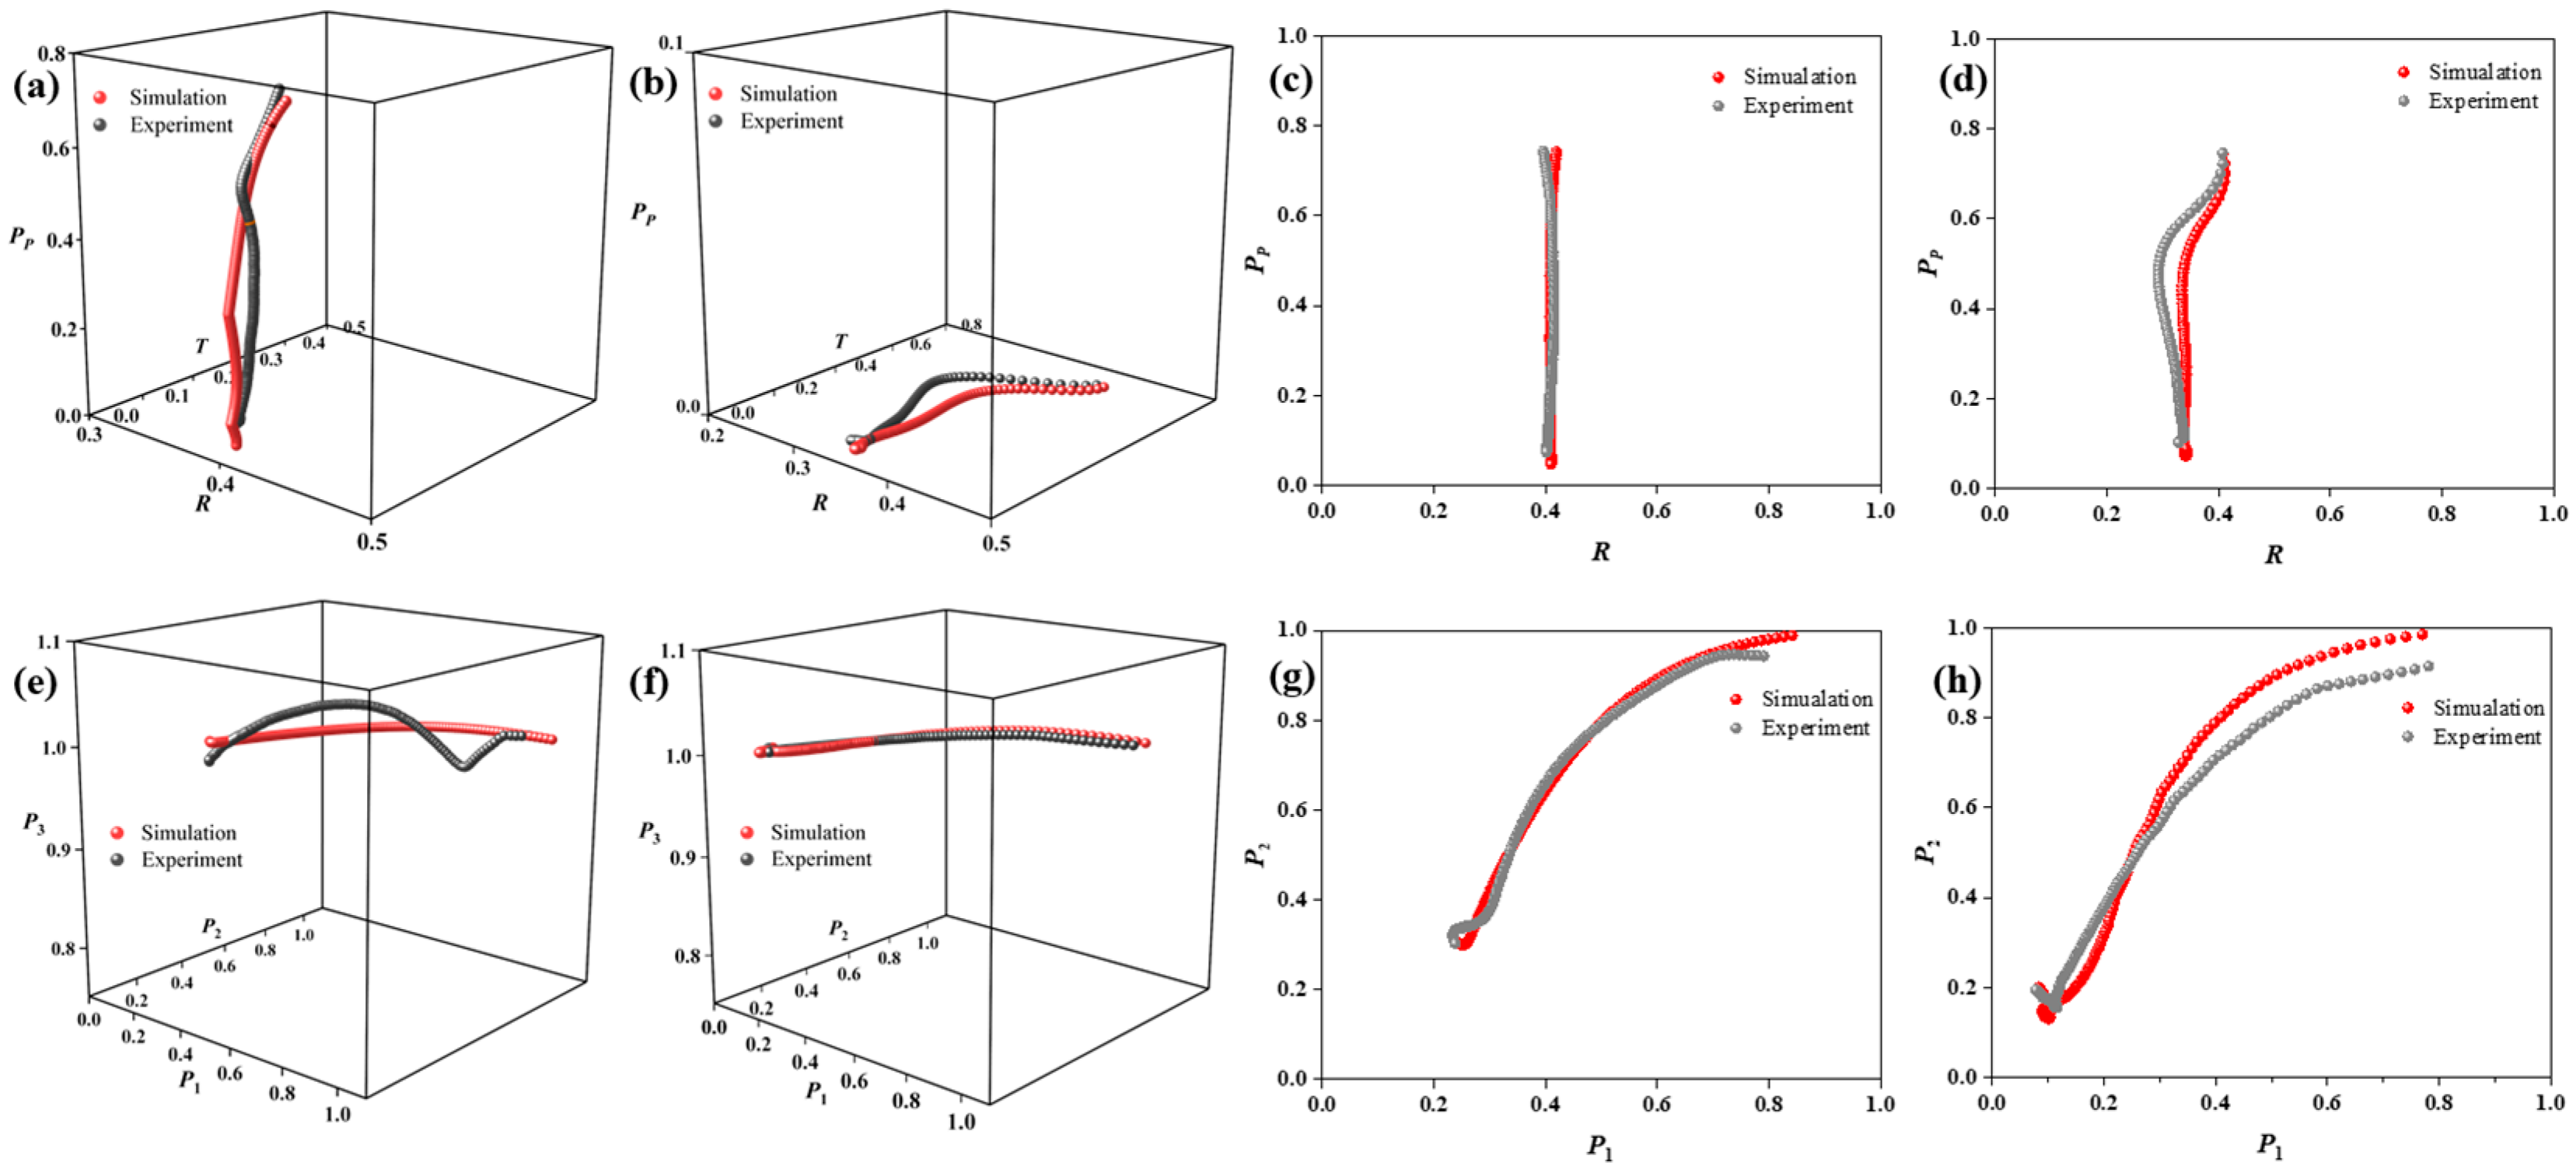
Note that a number of depolarizers can be produced by controlling the orientation standard deviation σ2 (set to follow a Gaussian distribution) when incoherently adding the measured MMs. Therefore, by taking advantage of this situation we implemented different depolarizers by modifying the selected σ2, and the obtained results are plotted in black at the PRT and IPP spaces (see Figure 9), both for the diattenuation-based depolarizers and retarder-based depolarizers cases. For comparison, the associated simulated results, considering an ideal polarizer (D = 1) and an ideal quarter-waveplate (ϕ = π/2) respectively, are also provided in Figure 9 in red [47]. As can be seen, there is an excellent agreement between simulated and experimental results, providing the validity of the proposed methods.
To quantifiably represent the discrepancy between the simulation and experiment, the mean square error (MSE) of the distance between points, respectively, representing the simulation and experiment with the same setups, was calculated. The results of the MSE corresponding to the data in Figure 9a,b,e,f were 0.027, 0.030, 0.026, and 0.029, respectively. The slight discrepancy of MSE demonstrates that the corresponding simulations presented in Section 4 are reliable. Notably, the discrepancy results from two aspects. The first factor is the non-ideal experimental elements (polarizer and quarter-waveplate) used in experiments [47]. The second factor is the experimental and environmental noise captured by the polarimeter, which causes the represented position to deviate from the original one.

5.2. Experimental Results for the P3 < 1 Case

Finally, this subsection provides experimental evidence of the P3 < 1 case (samples showing isotropic depolarization). These experimental scenarios are constructed on isotropic scattering processes and is at validating the simulations performed in Section 3.2.
The first sample studied was a diffuse reflector (Diffuser DG10-220-P01, from Thorlabs). This reflector diffuses light in all directions and behaves as a source with isotropic depolarization. In addition, a standard white paper was selected as the second sample, which is a possible source of isotropic scattering and has an isotropic depolarization origin.
To enhance the scattering response of the samples studied and thereby increase the probability of observing isotropic depolarization effects, an appropriate wavelength was selected to illuminate selected samples for MM images measurement: 1500 nm for the silver diffuse reflector surface and 660 nm for the white paper. Afterward, ROI (diffuser for 70 × 70 pixels and the white paper for 150 × 150 pixels) centered on the experimental MM images were obtained, and the mean value and standard deviation of the value of IPP for the ROI were calculated (see obtained results in Table 3).
As expected, the value of P3 (the silver diffuse reflector and white paper are 0.200 and 0.294, respectively) is significantly smaller than 1 in both test cases, showing the isotropic depolarization produced by these samples. Additionally, as shown in Table 3, P3 is not exactly equal to zero and there are still some non-zero values for P1 and P2, which means that even though isotropic depolarization is the predominant depolarization in these samples, there is still some anisotropic depolarization present. For instance, regarding white paper, this anisotropic scattering is originated from the retardance properties present in the cellulose fibers. For the silver diffuse reflector, the anisotropic depolarization can be due to the nonideality of the fabrication process and some intrinsic polarimetric characteristic of the component elements.

6. Conclusions

This work presents a review of several recent studies focused on the discrimination and classification of depolarizing samples through the analysis of depolarization observables. The study highlights the potential of the IPP and PRT spaces for depolarizer discrimination and provides a physical meaning of such two spaces.
The IPP space emphasizes the degree of polarimetric randomness introduced by the samples under study, which is a useful tool for biological tissue identification and remote sensing. The PRT space highlights the physical nature and mechanisms underlying depolarization, helping distinguish samples with different polarimetric characteristics. Furthermore, the combined use of both representations can offer a robust framework for distinguishing between different types of depolarizing media. In particular, by leveraging the IPP space, anisotropic depolarizers can be clearly distinguished from isotropic samples in terms of the value of P3, i.e., the points representing isotropic depolarizers always lie on the surface P3 = 1. For anisotropic depolarizers characterized by specific control parameters, the combined analysis in the IPP and PRT spaces not only enables the differentiation between depolarizers of distinct physical origins—such as those based on retardance or diattenuation—but also allows for the identification of depolarizers sharing the same origin yet exhibiting different statistical organization of their inherent structures.
In summary, the combined use of the IPP and PRT spaces enables a more comprehensive analysis of polarimetric targets. Within this framework, the study of the depolarization space—including both its theoretical foundations and the associated computational algorithms—plays a crucial role in target characterization and the development of high-performance detection strategies. Additionally, the experimental and environmental noise usually have affections on results, as the noise captured by the polarimeter results in corresponding represented positions deviating from the original one. For this reason, developing practical denoise methods is meaningful for improving the robustness of the PRT and IPP spaces-associated target identification algorithm.

Author Contributions

Conceptualization, D.L., M.C.-C. and A.L.; investigation, D.L., M.C.-C. and I.M.-G.; resources, D.L., Y.M. and I.M.-G.; software, D.L., M.C.-C., Y.T. and A.V.E.; validation, M.C.-C., I.M. and I.E.; formal analysis, I.E.; data curation, Li. D., I.M. and Y.M.; writing—original draft preparation, D.L. and O.L.-C.; writing—review and editing, I.M.-G., O.L.-C. and A.L.; visualization, Li. D.; supervision, Z.G.; project administration, J.C.; funding acquisition, J.C., I.M. and A.L. All authors have read and agreed to the published version of the manuscript.

Funding

Ministerio de Ciencia e Innovación and Fondos FEDER (ref. PID2021-126509OB-C21 and PDC2022-133332-C21 and C22), Generalitat de Catalunya (ref. 2021SGR00138), Generalitat Valenciana (ref. CIAICO/2021/276).

Data Availability Statement

Not applicable.

Conflicts of Interest

The authors declare no conflicts of interest.

References

  1. Brosseau, C. Fundamentals of Polarized Light: A Statistical Optics Approach; John Wiley: Hoboken, NJ, USA, 1998. [Google Scholar][Green Version]
  2. Tyo, J.; Goldstein, D.L.; David, B.C.; Joseph, A.S. Review of passive imaging polarimetry for remote sensing applications. Appl. Opt. 2006, 45, 5453–5469. [Google Scholar] [CrossRef]
  3. He, C.; He, H.; Chang, J.; Chen, B.; Ma, H.; Booth, M.J. Polarisation optics for biomedical and clinical applications: A review. Light. Sci. Appl. 2021, 10, 194. [Google Scholar] [CrossRef] [PubMed]
  4. He, C.; He, H.; Chang, J.; Dong, Y.; Liu, S.; Zeng, N. Characterizing microstructures of cancerous tissues using multispectral transformed Mueller matrix polarization parameters. Biomed. Opt. Express 2015, 17, 2934–2945. [Google Scholar] [CrossRef]
  5. Dubreuil, M.; Tissier, F.; Rivet, S.; Le, G. Linear diattenuation imaging of biological tissues with near infrared Mueller scanning microscopy. Biomed. Opt. Express 2021, 12, 41–54. [Google Scholar] [CrossRef]
  6. Menzel, M.; Axer, M.; Amunts, K.; De Raedt, H.; Michielsen, K. Diattenuation imaging reveals different brain tissue properties. Sci. Rep. 2019, 9, 1939. [Google Scholar] [CrossRef] [PubMed]
  7. Novák, J.; Iliyan, G.; Johannes, H. Monte Carlo methods for volumetric light transport simulation. Comput. Graph. Forum 2018, 37, 551–576. [Google Scholar] [CrossRef]
  8. Li, P.; Liu, C.; Li, X.; He, H.; Ma, H. GPU acceleration of Monte Carlo simulations for polarized photon scattering in anisotropic turbid media. Appl. Opt. 2016, 55, 7468–7476. [Google Scholar] [CrossRef]
  9. Luo, K.; Fu, Q.; Liu, X.; Zhao, R. Study of polarization transmission characteristics in nonspherical media. Opt. Lasers Eng. 2024, 174, 107970. [Google Scholar] [CrossRef]
  10. Huang, B.; Liu, T.; Hu, H. Underwater image recovery considering polarization effects of objects. Opt. Express 2016, 24, 9826–9838. [Google Scholar] [CrossRef]
  11. Nadal, F.; Bréon, F.M. Parameterization of surface polarized reflectance derived from POLDER spaceborne measurements. IEEE Trans. Geosci. Remote Sens. 1999, 37, 1709–1718. [Google Scholar] [CrossRef]
  12. Li, P.; Lee, H.; Chandel, S.; Lotz, C.; Dembski, S.; Ossikovski, R.; Ma, H.; Novikova, T. Analysis of tissue microstructure with Mueller microscopy: Logarithmic decomposition and Monte Carlo modelling. J. Biomed. Opt. 2020, 25, 015002. [Google Scholar] [CrossRef]
  13. Wang, L.; Jacques, S.L.; Zheng, L. MCML—Monte Carlo modelling of light transport in multi-layered tissues. Comput. Methods Programs Biomed. 1995, 47, 131–146. [Google Scholar] [CrossRef]
  14. Keijzer, M.; Jacques, S.L.; Prahl, S.A. Light distributions in artery tissue: Monte Carlo simulations for finite-diameter laser beams Lasers. Surg. Endosc. 1989, 9, 148–154. [Google Scholar] [CrossRef]
  15. Marshall, N.; Powell, S.; Cronin, T. Polarisation signals a new currency for communication. J. Exp. Biol. 2019, 222, 134213. [Google Scholar] [CrossRef]
  16. Liang, J.; Zhang, J.; Ren, L. Polarimetric dehazing method for visibility improvement based on visible and infrared image fusion. Appl. Opt. 2016, 55, 8221–8226. [Google Scholar] [CrossRef] [PubMed]
  17. Liang, J.; Ren, L.; Ju, H.; Qu, E.; Wang, Y. Visibility enhancement of hazy images based on a universal polarimetric imaging method. J. Appl. Phys. 2014, 116, 173107–173113. [Google Scholar] [CrossRef]
  18. Liang, J.; Ren Li Ju, H.; Zhang, W.; Qu, E. Polarimetric dehazing method for dense haze removal based on distribution analysis of angle of polarization. Opt. Express 2015, 23, 26146–26157. [Google Scholar] [CrossRef]
  19. Thilak, V.; Voelz, D.; Creusere, C. Polarization-Based Index of Refraction and Reflection Angle Estimation for Remote Sensing Applications. Appl. Opt. 2007, 46, 7527–7536. [Google Scholar] [CrossRef] [PubMed]
  20. Agnoil, G.; Cacciari, M.; Garutti, C.; Lenzi, P. Ship detection performance using simulated dual-polarization radarsat constellation mission data. Int. J. Remote Sens. 2015, 36, 1705–1727. [Google Scholar]
  21. Wang, Y.; Ainsworth, T.; Lee, J. Assessment of System Polarization Quality for Polarimetric SAR Imagery and Target Decomposition. IEEE Trans. Geosci. Remote Sens. 2011, 49, 1755–1771. [Google Scholar] [CrossRef]
  22. Karouzos, M. Cloudy with a chance of depolarization. Nat. Astron. 2021, 5, 224. [Google Scholar] [CrossRef]
  23. Li, X.; Liu, F.; Han, P.L.; Zhang, S.; Shao, X.P. Near-infrared monocular 3D computational polarization imaging of surfaces exhibiting nonuniform reflectance. Opt. Express 2021, 29, 15616–15630. [Google Scholar] [CrossRef]
  24. Ballesta-Garcia, M.; Peña-Gutiérrez, S.; Rodríguez-Aramendía, A.; García-Gómez, P.; Rodrigo, N.; Bobi, A.R. Analysis of the performance of a polarized LiDAR imager in fog. Opt. Express 2022, 30, 41524–41540. [Google Scholar] [CrossRef] [PubMed]
  25. Estévez, I.; Oliveira, F.; Braga-Fernandes, P.; Oliveira, M.; Rebouta, L.; IVasilevskiy, M. Urban objects classification using Mueller matrix polarimetry and machine learning. Opt. Express 2022, 30, 28385–28400. [Google Scholar] [CrossRef]
  26. Maldzius, R.; Lozovski, T.; Sidaravicius, J. Influence of environmental relative humidity on the polarization behaviour of paper and paper-dielectric structures. Cellulose 2020, 27, 10303–10312. [Google Scholar] [CrossRef]
  27. Lizana, A.; Foldyna1, M.; Stchakovsky, M.; Georges, B.; Nicolas, D.; Garcia-Caurel, E. Enhanced sensitivity to dielectric function and thickness of absorbing thin films by combining total internal reflection ellipsometry with standard ellipsometry and reflectometry. J. Phys. D Appl. Phys. 2013, 46, 105501. [Google Scholar] [CrossRef]
  28. Nabok, A.; Tsargorodskaya, A. The method of total internal reflection ellipsometry for thin film characterisation and sensing. Thin Solid Film. 2008, 516, 8993–9001. [Google Scholar] [CrossRef]
  29. Yang, B.; Zhang, Y.; Ouyang, M.; Zhu, Q.; Fu, Y. Tunable Circular Polarization Detection and Full Stokes Measurement Structure. IEEE Photonics J. 2021, 13, 5800109. [Google Scholar] [CrossRef]
  30. Ivanov, D.; Dremin, V.; Borisova, E.; Bykov, A.; Novikova, T.; Meglinski, I.; Ossikovski, R. Polarization and depolarization metrics as optical markers in support to histopathology of ex vivo colon tissue. Biomed. Opt. Express 2021, 12, 4560–4572. [Google Scholar] [CrossRef]
  31. Pierangelo, A.; Benali, A.; Antonelli, M.-R.; Novikova, T.; Validire, P.; Gayet, B. Ex-vivo characterization of human colon cancer by Mueller polarimetric imaging. Opt. Express 2011, 19, 1582. [Google Scholar] [CrossRef]
  32. Du, E.; He, H.; Zeng, N.; Sun, M.; Guo, Y.; Wu, J. Mueller matrix polarimetry for differentiating characteristic features of cancerous tissues. J. Biomed. Opt. 2014, 19, 076013. [Google Scholar] [CrossRef] [PubMed]
  33. Tariq, A.; Li, P.; Chen, D.; Lv, D.; Ma, H. Physically realizable space for the purity-depolarization plane for polarized light scattering media. Phys. Rev. Lett. 2017, 119, 033202. [Google Scholar] [CrossRef] [PubMed]
  34. Lu, S.; Chipman, R. Interpretation of Mueller matrices based on polar decomposition. J. Opt. Soc. Am. A 1996, 13, 1106–1113. [Google Scholar] [CrossRef]
  35. Van Eeckhout, A.; Garcia-Caurel, E.; Garnatje, T.; Durfort, M.; Escalera, J.C.; Vidal, J.; Gil, J.J.; Campos, J.; Lizana, A. Depolarizing metrics for plant samples imaging. PLoS ONE 2019, 14, e0213909. [Google Scholar] [CrossRef]
  36. Li, D. Polarizance-Reflection-Transformation representation space for sensing and distinguishing pure systems. IEEE Sens. J. 2025, 24, 14763–14769. [Google Scholar] [CrossRef]
  37. Gil, J.J.; Ossikovski, R. Polarized Light and the Mueller Matrix Approach; CRC Press: New York, NY, USA, 2022. [Google Scholar]
  38. Rodríguez, C.; Van Eeckhout, A.; Ferrer, L.; Garcia-Caurel, E.; Gonz’alez-Arnay, E.; Campos, J. Polarimetric data-based model for tissue recognition. Biomed. Opt. Express 2021, 12, 4852. [Google Scholar] [CrossRef]
  39. He, C.; Chang, J.; Salter, S.; Shen, Y.; Dai, B.; Li, P.; Ma, H.; Booth, M. Revealing complex optical phenomena through vectorial metrics. Adv. Photonics 2022, 4, 026001. [Google Scholar] [CrossRef]
  40. Aiello, A.; Woerdman, J. Physical Bounds to the Entropy-Depolarization Relation in Random Light Scattering. Phys. Rev. Lett. 2005, 94, 090406. [Google Scholar] [CrossRef]
  41. Ossikovski, R.; Vizet, J. Eigenvalue-based depolarization metric spaces for Mueller matrices. J. Opt. Soc. Am. A 2019, 36, 1173–1186. [Google Scholar] [CrossRef]
  42. Tariq, A.; He, H.; Li, P.; Ma, H. Purity-depolarization relations and the components of purity of a Mueller matrix. Opt. Express 2019, 27, 22645–22662. [Google Scholar] [CrossRef]
  43. Eeckhout, A.; Lizana, E.; Gil, J.; Ossikovski, R.; Campos, J. Synthesis and characterization of depolarizing samples based on the indices of polarimetric purity. Opt. Lett. 2017, 42, 4155–4158. [Google Scholar] [CrossRef]
  44. Li, X.; Zhang, L.; Qi, P.; Zhu, Z.; Xu, J.; Liu, T.; Hu, H. Are Indices of Polarimetric Purity Excellent Metrics for Object Identification in Scattering Media? Remote Sens. 2022, 14, 4148. [Google Scholar] [CrossRef]
  45. Van Eeckhout, A.; Lizana, A.; Garcia-Caurel, E.; Gil, J.J.; Sansa, A.; Rodríguez, C. Polarimetric imaging of biological tissues based on the indices of polarimetric purity. J. Biophotonics 2018, 11, e201700189. [Google Scholar] [CrossRef]
  46. Rodríguez, C.; Van Eeckhout, A.; Garcia-Caurel, E.; Lizana, A.; Campos, J. Automatic pseudo-coloring approaches to improve visual perception and contrast in polarimetric images of biological tissues. Sci. Rep. 2022, 12, 18479. [Google Scholar] [CrossRef]
  47. Li, D.; Montes, I.; Canabal-Carbia, M.; Estévez, I.; Guo, Z.; Campos, J.; Lizana, A. Enhanced characterization of depolarizing samples using indices of polarization purity and polarizance–reflection–transformation spaces. Adv. Photon. Nexus 2025, 4, 016009. [Google Scholar] [CrossRef]
  48. Ossikovski, R.; Martino, A.; Guyot, S. Forward and reverse product decompositions of depolarizing Mueller matrices. Opt. Lett. 2007, 32, 689–691. [Google Scholar] [CrossRef] [PubMed]
  49. Ossikovski, R. Analysis of depolarizing Mueller matrices through a symmetric decomposition. J. Opt. Soc. Am. A 2009, 26, 1109–1118. [Google Scholar] [CrossRef]
  50. Canabal-Carbia, M.; Estévez, I.; Nabadda, E.; Garcia-Caurel, E.; Gil, J.; Ossikovski, R.; Márquez, A.; Moreno, I.; Campos, J.; Lizana, A. Connecting the microscopic depolarizing origin of samples with macroscopic measures of the Indices of Polarimetric Purity. Opt. Lasers Eng. 2024, 172, 107830. [Google Scholar] [CrossRef]
  51. Canabal-Carbia, M.; Estévez, I.; González-Arnay, E.; Montes-Gonzalez, I.; Gil, J.; Garcia-Caurel, E.; Ossikovski, R.; Moreno, I.; Campos, J.; Lizana, A. Revealing hidden bioimaging information by isotropic depolarization filtering. Opt. Laser Technol. 2025, 188, 112956. [Google Scholar] [CrossRef]
  52. Gil, J.J. Polarimetric characterization of light and media: Physical quantities involved in polarimetric phenomena. Eur. Phys. J. Appl. Phys. 2007, 40, 1–47. [Google Scholar] [CrossRef]
  53. San José, I.; Gil, J.J. Invariant indices of polarimetric purity: Generalized indices of purity for n × n covariance matrices. Opt. Commun. 2011, 284, 38–47. [Google Scholar] [CrossRef]
  54. Goldstein, D.H. Polarized Light; CRC Press: Boca Raton, FL, USA, 2017. [Google Scholar]
  55. Ossikovski, R.; Arteaga, O.; Garcia-Caurel, E.; Hingerl, K. Model for the depolarizing retarder in Mueller matrix polarimetry. J. Opt. Soc. Am A 2022, 39, 873. [Google Scholar] [CrossRef]
  56. Gil, J.J. On optimal filtering of measured Mueller matrices. Appl. Opt. 2016, 55, 5449. [Google Scholar] [CrossRef] [PubMed]
  57. Gil, J.J. Components of purity of a three-dimensional polarization state. J. Opt. Soc. Am A 2016, 33, 40. [Google Scholar] [CrossRef] [PubMed]
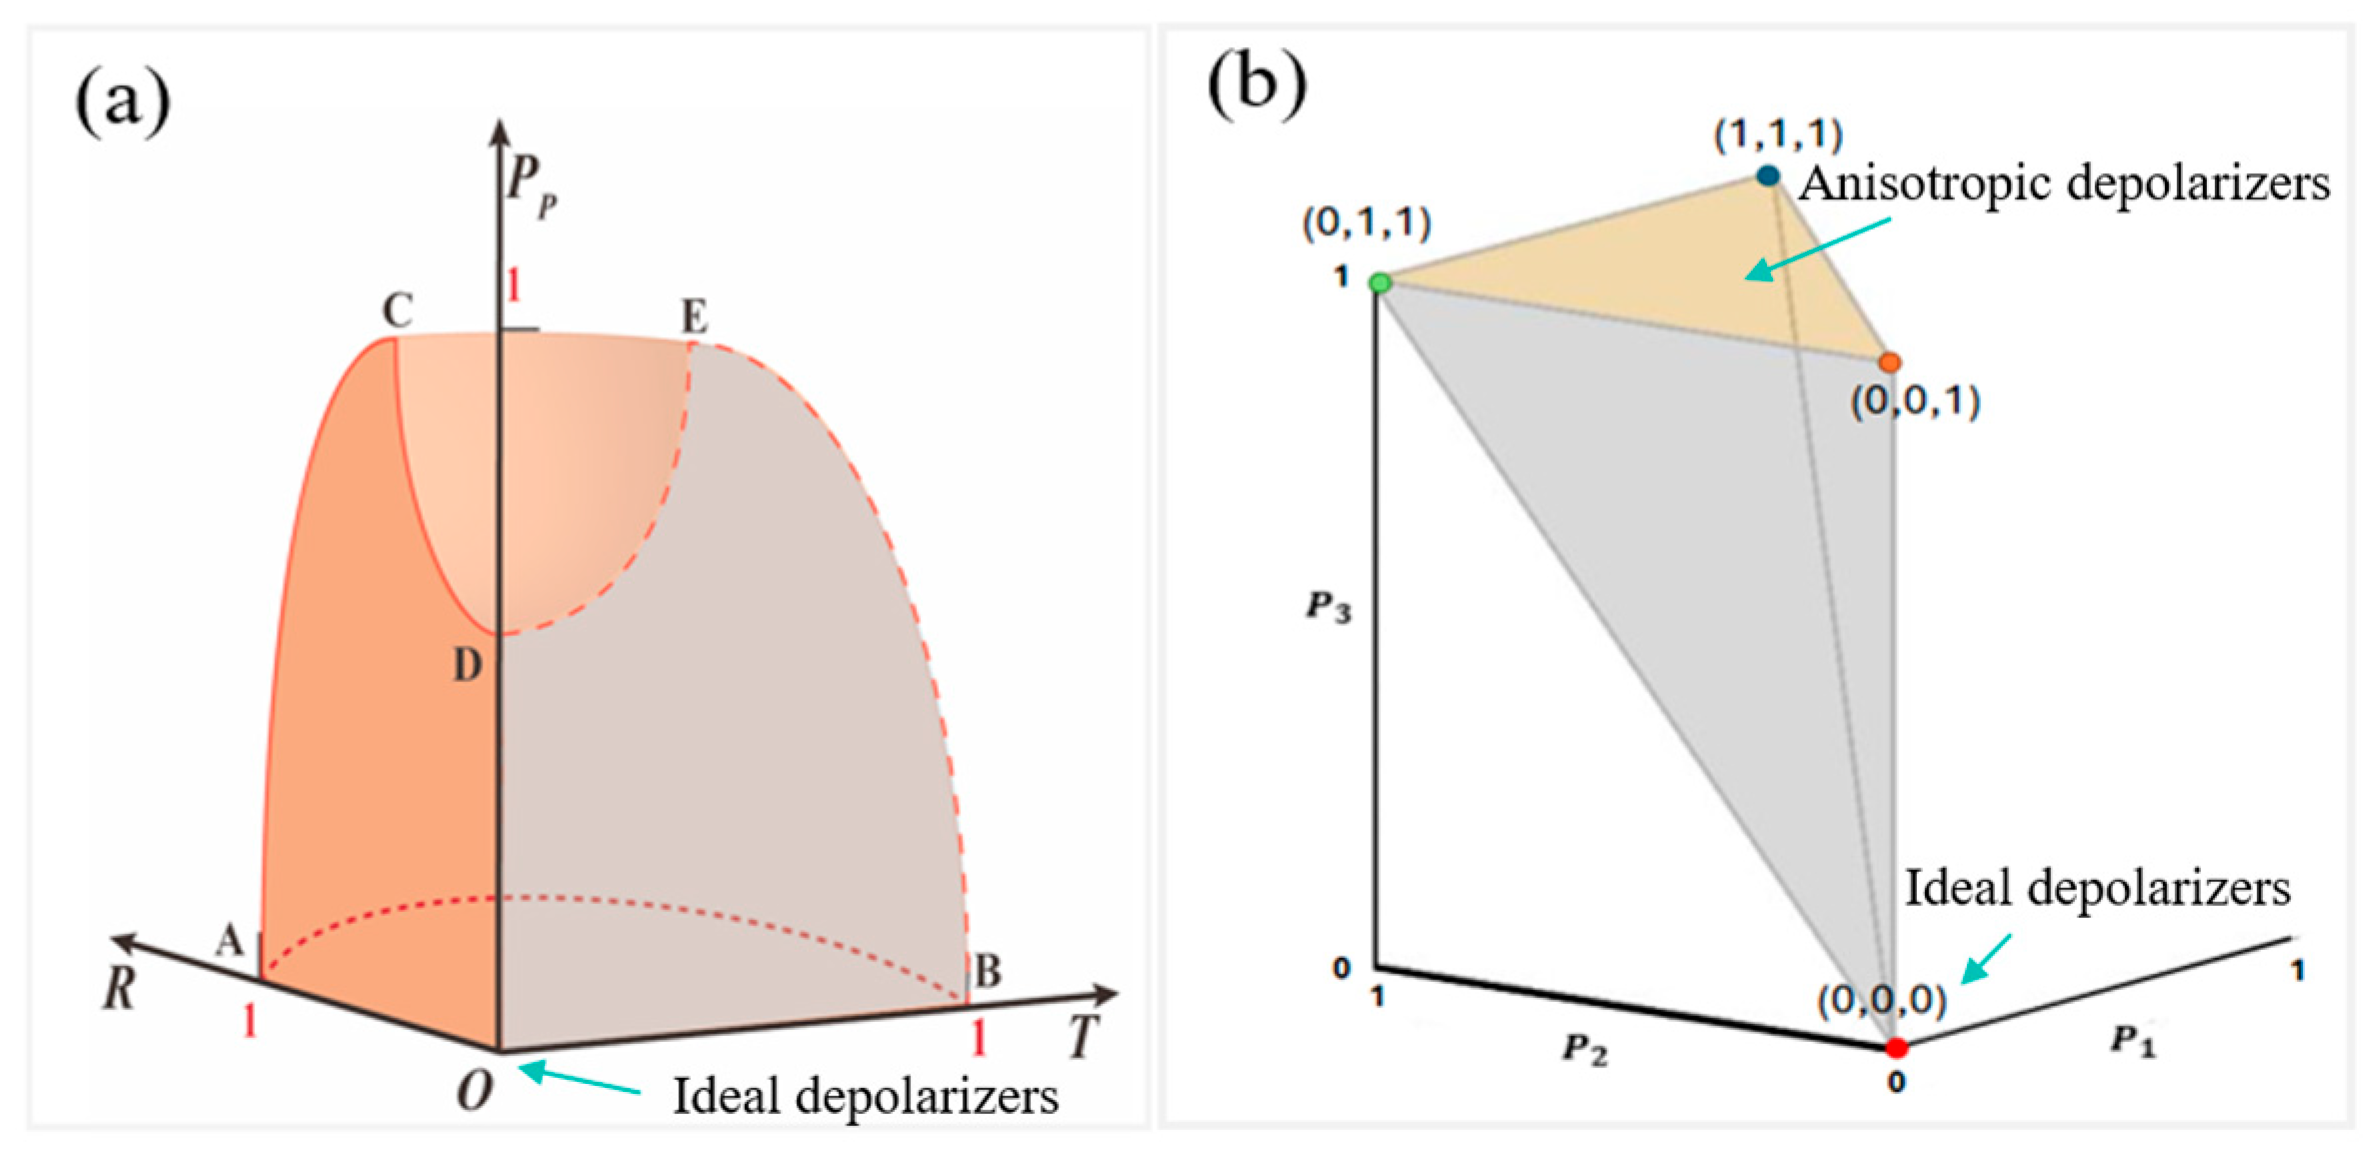
Figure 1. (a) The solvable domain of the PRT space; (b) the IPP space where the P1 − P2 (P3 = 1) surface is shaded in the picture.
Applsci 15 10205 g001
Figure 2. (af) IPP values for the simulated diattenuator-based depolarizers. The value of px is set as a constant for each image, with values of 0.8 for (ac) and 0.2 for (df). (g) D values, with the x- and y-axes representing the py and px parameters, range from 0 to 1. (hj) IPP values for simulated retarder-based depolarizers: (h) P1, (i) P2, and, (j) P3 [50].
Applsci 15 10205 g002
Figure 3. P3 values for the simulated depolarizer as a function of isotropic weight β.
Applsci 15 10205 g003
Figure 4. The distributions of diattenuator-based (orange color) depolarizers and retarder-based (green color) depolarizers represented in the studied depolarizing spaces: (a) IPP space; (b) PRT space; (c) plane of P3 = 1; and (d) T = 0 in the PRT space [47].
Applsci 15 10205 g004
Figure 5. (a,b) Representation of the constructed diattenuator-based depolarizers in different representation spaces: (a) PRT space; and (b) IPP space. (c,d) Representation of the constructed retarder-based depolarizers in different representation spaces: (c) RT space; (d) P1P2 space [47].
Applsci 15 10205 g005
Figure 6. The relation between the measured polarimetric and physical characteristics for anisotropic depolarizers. (a) The relation between D and R at different σ2 for diattenuator-based depolarizers; (b) the relation between PP and σ2 at different D for diattenuator-based depolarizers; (c) the relation between ϕ and R at different σ2 for retarder-based depolarizers; (d) the relation between T and σ2 at different ϕ for diattenuator-based depolarizers [47].
Applsci 15 10205 g006
Figure 7. Scheme of the MM polarimeter, composed of a light source, collimator, polarization state generator (PSG), filter, polarization state analyzer (PSA), objective, and CCD camera.
Applsci 15 10205 g007
Figure 8. (a) Radial polarizer illuminated at 45 ° linear polarization; each sector shows a different orientation (0 to 2π), with colors changing every 30 ° ; (b) Q-plate image: linear retarder (π phase at 633 nm) with orientations from 0 to 2π, represented by color changes [50].
Applsci 15 10205 g008
Figure 9. The comparison between simulations and experiments in the studied space for different samples with varying σ2. The distributions with σ2 for diattenuator-based depolarizers in (a) PRT space and (c) PR section; the distributions with σ2 for retarder-based depolarizers in (b) PRT space (d) PR section; the distributions with σ2 for diattenuator-based depolarizers in (e) IPP space (g) P1P2 section; and the distributions with σ2 for retarder-based depolarizers in (f) IPP space (h) P1P2 section [47].
Applsci 15 10205 g009
Table 1. The difference (in radians) between calculated σ2 and assigning σ2 for diattenuator-based and retarder-based depolarizers [50].
Diattenuator-Based DepolarizersRetarder-Based Depolarizers
Mean absolute error0.0128Mean absolute error0.0172
Table 2. IPP results of the experimentally measured samples (radial polarizer and Q plate) [50].
P1P2P3
Radial polarizer0.1630.8761
Q plate0.2880.7271
Table 3. Mean values and standard deviation of the IPP for the ROI of a diffuse reflector and white paper [50].
P1 ± σP1P2 ± σP2P3 ± σP3
Silver diffuse reflector0.05 ± 0.020.11 ± 0.030.20 ± 0.04
White paper0.05 ± 0.020.14 ± 0.040.29 ± 0.07
Disclaimer/Publisher’s Note: The statements, opinions and data contained in all publications are solely those of the individual author(s) and contributor(s) and not of MDPI and/or the editor(s). MDPI and/or the editor(s) disclaim responsibility for any injury to people or property resulting from any ideas, methods, instructions or products referred to in the content.