Article

Friction Coefficient Tests for Designs of Belt Conveyor Drive Systems

Accredited Belt Conveying Laboratory, Department of Mining, Faculty of Geoengineering, Mining and Geology, Wroclaw University of Science and Technology, Na Grobli 15, 50-421 Wrocław, Poland
Appl. Sci. 2025, 15(18), 10204; https://doi.org/10.3390/app151810204
Submission received: 7 July 2025 / Revised: 10 September 2025 / Accepted: 17 September 2025 / Published: 19 September 2025
(This article belongs to the Section Mechanical Engineering)

Abstract

In conveyor belt drive pulleys and intermediate belt drives, the power transferred from the drive system to the belt increases together with the increasing friction coefficient between the belt surface and the pulley surface, or between the surface of the main (carrying) belt and the surface of the intermediate (drive) belt. Belt conveyors used in the mining industry are typically exposed to dust and moisture. This paper presents the method and results of laboratory tests on the friction coefficient between a conveyor belt and rubber plates with grooved and flat surfaces. The tests were performed for different mine-typical contamination conditions of these surfaces. The results demonstrate that in the case of dry friction (regardless of the presence of dust), the grooving of the surface does not significantly affect the friction coefficient of the rubber–rubber friction pair. However, grooving has a significantly positive impact in the case of wet friction. In cases where the surface is grooved in a “diamond” pattern, the measured friction coefficient values are similar for both wet and dry surfaces. The lowest friction coefficient values were obtained for surfaces contaminated with solid rock dust.

1. Introduction

The effectiveness of conveyor belt drive systems largely depends on their frictional engagement, also referred to as friction coupling. The driving power is transmitted from the pulley to the belt, or from the intermediate drive belt to the carrying belt by means of friction forces (Figure 1). It is therefore necessary to ensure protection against the slip of the belt, as the force transmitted by the drive system increases with the increasing friction coefficient of the friction pair in contact [1].
In pulley drive systems, the friction coefficient and thus the frictional engagement between the belt and the drive pulley is increased with the use of rubber pulley linings with a suitable groove pattern. The length of the belt–pulley contact zone is limited by the achievable wrap angle of the belt around the pulley. Therefore, an appropriate belt pre-tension is required to ensure a safe level of friction forces between the engaged elements at which slip would be prevented. On the other hand, in systems with intermediate belt or rope drives (e.g., with flat rubber-coated ropes), the limitation is from normal force required to generate friction, as it is derived from the gravitational forces acting on the belt and on the conveyed material. For this reason, in intermediate belt or rope drives the contact zone between the main conveyor belt and the intermediate drive belt must be of an appropriate length [2,3,4,5]. To ensure that designs of conveyor drive and take-up systems are based on safe parameters, it is thus important to find the actual values of the friction coefficient μ. In mining transport systems, belt conveyors are operated in the presence of dust and humidity. Therefore, particular importance should be placed on ensuring a high level of friction coefficient between the frictionally engaged surfaces of the pulley drive or the intermediate belt drive.
Friction describes a group of phenomena occurring in the contact area of two bodies, both in the macroscopic and microscopic structures of the surface layers of these bodies. Rubber is unique in this context. Unlike most rigid materials, it does not show plastic deformation at the contact area of two sliding bodies, but instead exhibits elastic deformation. The result are the so-called Schallamach waves, i.e., folds of viscoelastic material deformations which occur during the movement of a hard specimen over an elastic substrate [6,7]. In effect, the phenomenon of internal friction and energy dissipation is observed in the subsurface layers [8]. The viscoelastic properties and adhesion characteristics of elastomers significantly affect the friction process. Some theories of friction distinguish between the adhesive and hysteresis components of frictional force [9,10,11]. The adhesive component depends on the structure of the elastomer, the surface condition, contact geometry, the mechanical properties of the material, the applied force, the sliding velocity, temperature, and humidity [12]. Adhesion is the main factor in the friction of elastic materials moving at low velocities and low loads. In such situations, dry friction forces may rapidly change in a phenomenon known as “stick-slip” motion [13]. The hysteresis component of the friction force is directly related to the energy dissipation that occurs during the elastic deformation of a highly elastic body, both in the contact area and in the subsurface layer [14,15]. Experimental and theoretical research on rubber friction conducted by Roth et al. [16], Grosch [17], Barquins and Roberts [18], Persson et al. [19,20], Klüppel and Heinrich [21], and Le Gal et al. [22] provides detailed information on how various factors influence the sliding friction of rubber. These factors include changes in sliding velocity, load, temperature, the type and amount of lubrication medium, as well as the properties of the materials involved. Much of the research on car tires focuses on achieving a high friction coefficient and low wear [23,24,25,26]. Hatanaka et al. [27] demonstrate that rubber wear is correlated with the adhesive component of friction. Although conveyor belt drive systems are, by definition, designed to operate without belt slip, some limited slip is inevitable. Moreover, normally the belt moves on the conveyor at a constant speed, and therefore the problem of rubber wear is not as significant as in the case of car tires. Unlike in the case of tires, belt transmission systems, or couplings, the frictional engagement is here due to friction between two viscoelastic materials, and not between a viscoelastic material and a rigid material.
Rubber friction tests typically consist in sliding tests, in which rubber specimens are slid across different surfaces under controlled load and speed. The specimens can be moved linearly [28] or rotationally [29,30].
The phenomenon of rubber friction is a complex and challenging object of both theoretical and experimental research. Friction coefficient values depend on many previously presented external factors, on the properties of the tested materials, and on the characteristics of the test apparatus. Therefore, design works should also focus on identifying the friction coefficient for specific friction pairs and for their specific operating conditions, and the test method should be possibly well adjusted to the actual type of the frictional engagement. Only a limited amount of research studies focus on the friction coefficient between the belt surface and the pulley surface or between the surfaces of the carrying and the drive belts. Kasza et al. [31] identified a friction coefficient for the rubber–rubber pair by using small (20 mm × 20 mm) rubber specimens cut from the pulley lining and a short section of a conveyor belt. They considered friction in dry and wet conditions, as well as in the presence of contamination from one type of dust. Their tests involved only flat surface specimens. Persson [32] identified a coefficient of friction between a rectangular rubber specimen several centimeters in thickness and a grooved rubber plate cut from the pulley lining. The tests were performed for dry conditions and for contamination with sand (with the sand particle diameter on the order of ~1 mm). The two studies show significant differences between the friction coefficient values obtained for dry and clean conditions.
This paper presents a method for and the results of laboratory tests on the friction coefficient of a rubber–rubber friction pair developed and performed for the purpose of designing a drive system for a belt conveyor or an intermediate belt drive. The tests were performed for both flat and grooved surfaces (two types of grooves), as well as for different surface contamination conditions found in copper ore mines and hard coal mines.

2. Materials and Methods

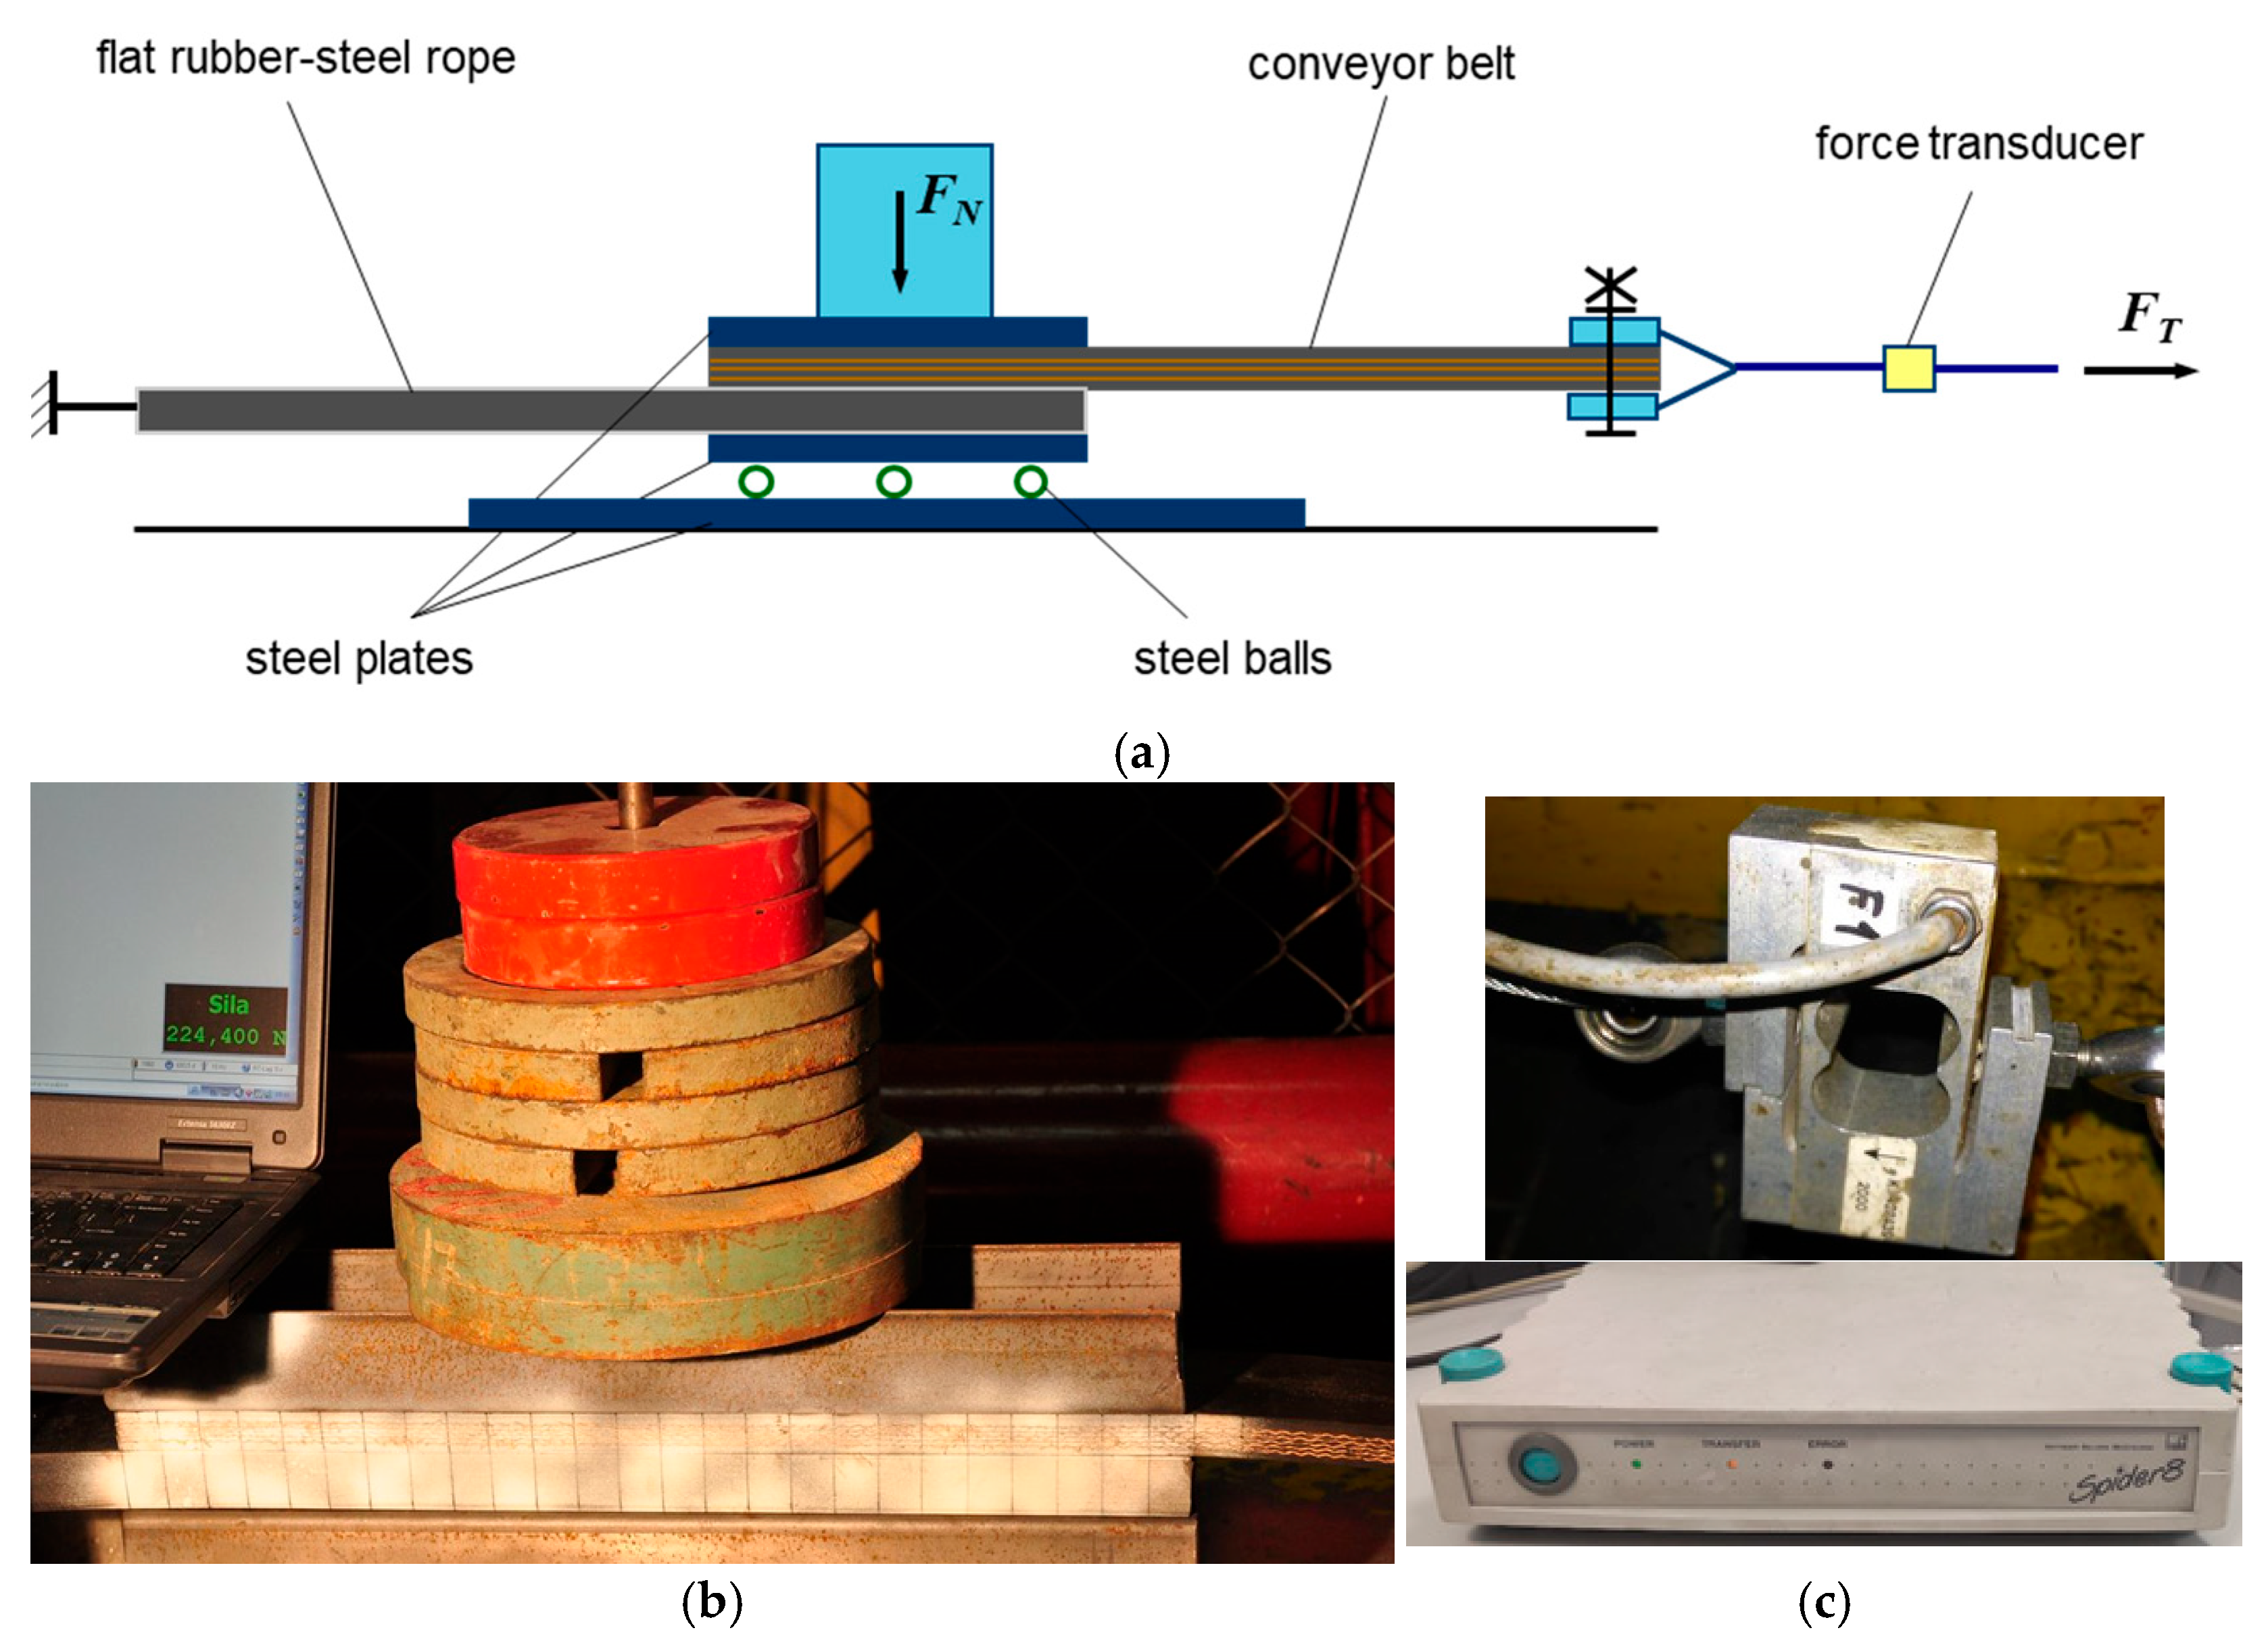
Friction coefficient was tested in a sliding friction experiment with a rubber–rubber friction pair for three surface conditions of the specimen (dry, wet, and contaminated), for four applied normal force values, for specimens with grooved surfaces (two types of grooves) and for a flat specimen without grooves. The method consists of determining the force required to move a loaded conveyor belt specimen on the flat surface of a steel–rubber rope. The tests are performed on a test stand (Figure 2) and with the use of a horizontal hydraulic testing machine. The steel–rubber rope specimen is mounted in the fixed grip of the testing machine and rests on a steel plate supported by steel balls. A loaded specimen of a textile-core conveyor belt rests on the rope, producing a frictional engagement over a length of 500 mm. The load is selected so as to ensure that the surface pressures correspond to the actual values observed on a working conveyor. The tensile force is applied using the hydraulic actuators of the testing machine. The force values are measured with the HBM type S2 force transducer (measuring range: 500 N; accuracy class: 0.05) and the HBM Spider8 measuring amplifier. The static coefficient of friction μs is identified as the relationship between the frictional force FT equal to the maximum force value that does not yet set the belt in motion and the normal force FN. The calculations also included the kinetic coefficient of sliding friction μk, defined as the ratio of the kinetic friction force, which is assumed to maintain the body in uniform motion, to the force FN.
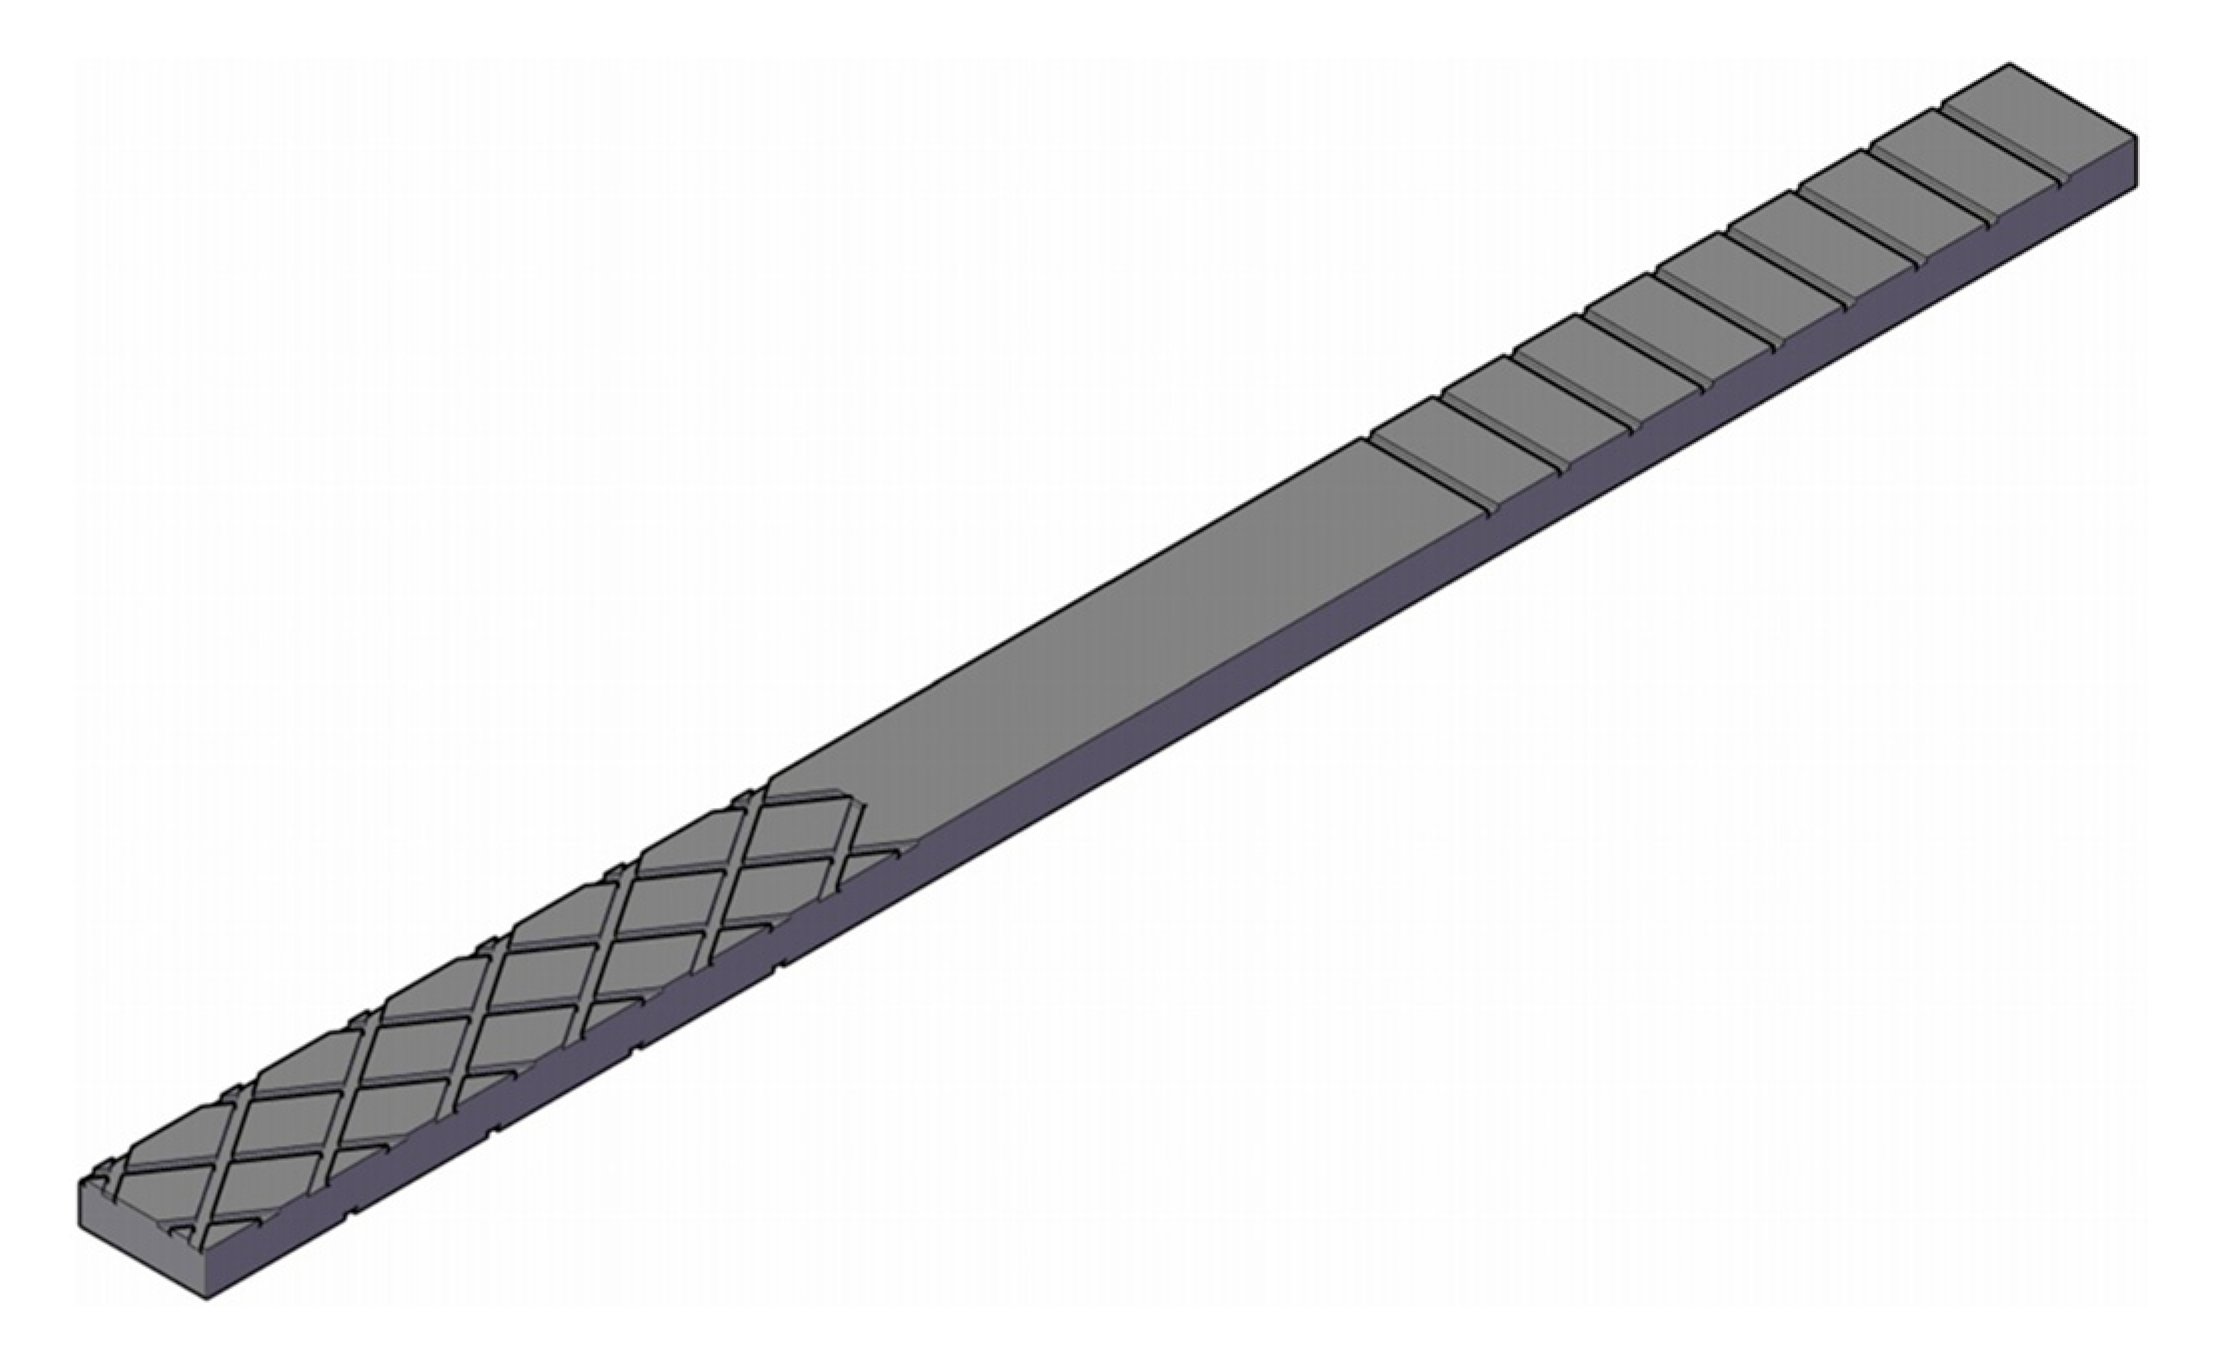
Grooves 8 mm in width and 3 mm in depth were prepared at the end of the flat steel–rubber rope, in the zone of the planned frictional engagement with the belt. The grooves were arranged in a “diamond” pattern and in a pattern transverse to the longitudinal axis of the specimen [33]. Cuts made on the surface of the specimen extended along the length of 500 mm and across the full width of the specimen (Figure 3). The opposite side of the specimen was left intact in order to compare the test results for the grooved surface and for the flat surface. The adopted names of the examined specimen surface types and their dimensions are listed in Table 1. The flat steel–rubber rope was engaged in a friction pair with the GPM 2000/5 type conveyor belt, which is a fabric-rubber belt with a five-ply carcass made of polyamide fabrics. The thickness of the belt rubber covers was 4 and 3 mm.
The phenomenon of sliding friction was studied for the following frictional engagement conditions:
  • dry and clean—before the examination, the friction surfaces of the rope and of the conveyor belt were cleaned with fuller’s earth along the length of the frictional engagement zone;
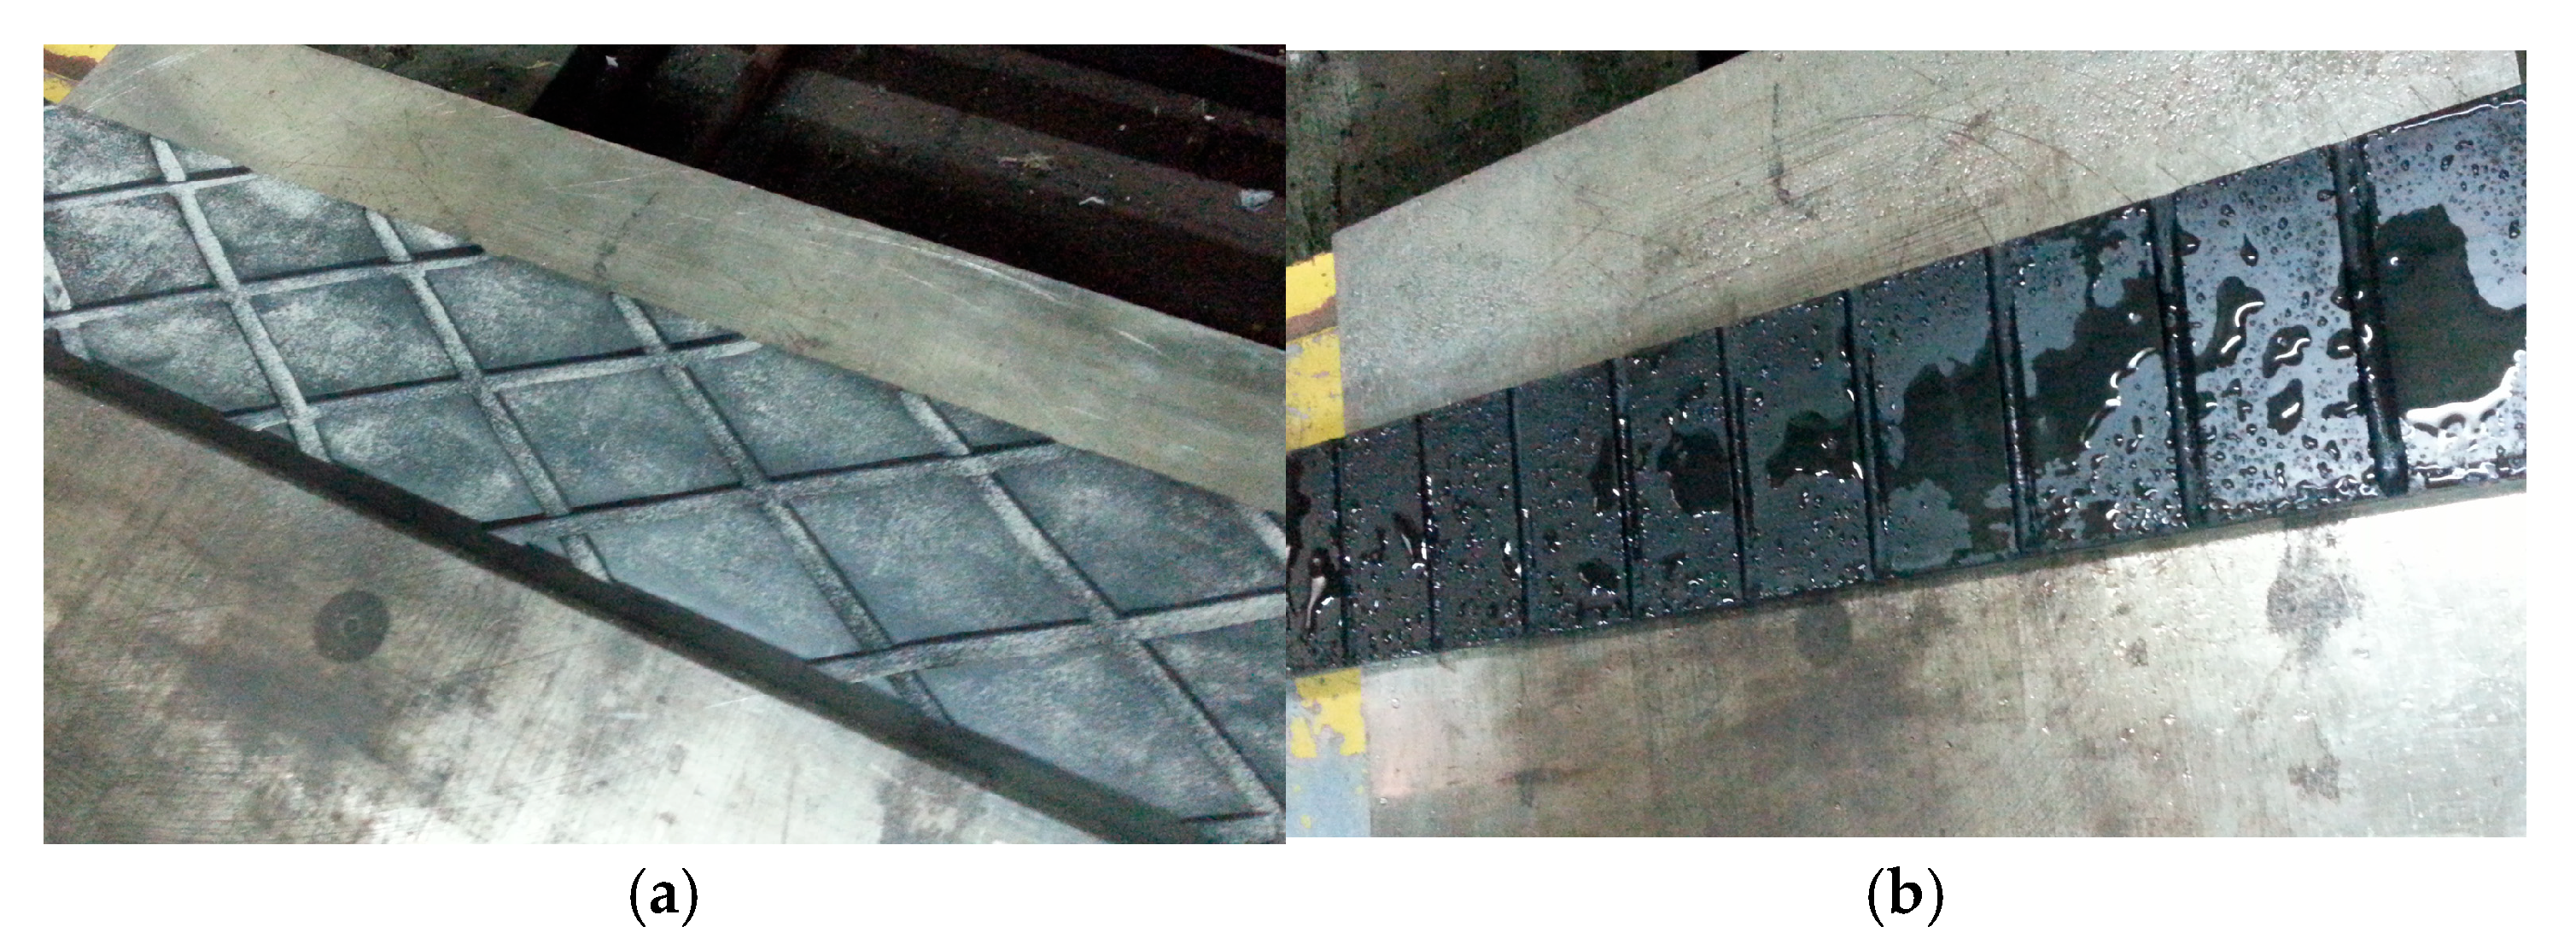
  • with copper ore dust—the friction surfaces were covered with dolomite rock dust (a thin layer of dust having a fraction of 0 ÷ 0.5 mm) (Figure 4a);
  • with hard coal dust—the friction surfaces were covered with hard coal dust (a thin layer of dust having a fraction of 0 ÷ 0.5 mm);
  • wet and clean—the friction surfaces were cleaned and wetted with water (Figure 4b).
The tests were performed for four values of normal force: 328 N, 415 N, 505 N, and 594 N. The tensile force was applied by moving the mobile traverse of the testing machine at a constant speed of about 3 cm per min (~5 × 10⁻⁴ m/s). The tests were performed in laboratory conditions at an air temperature of 22 °C and humidity of approx. 50%.

3. Results and Discussion

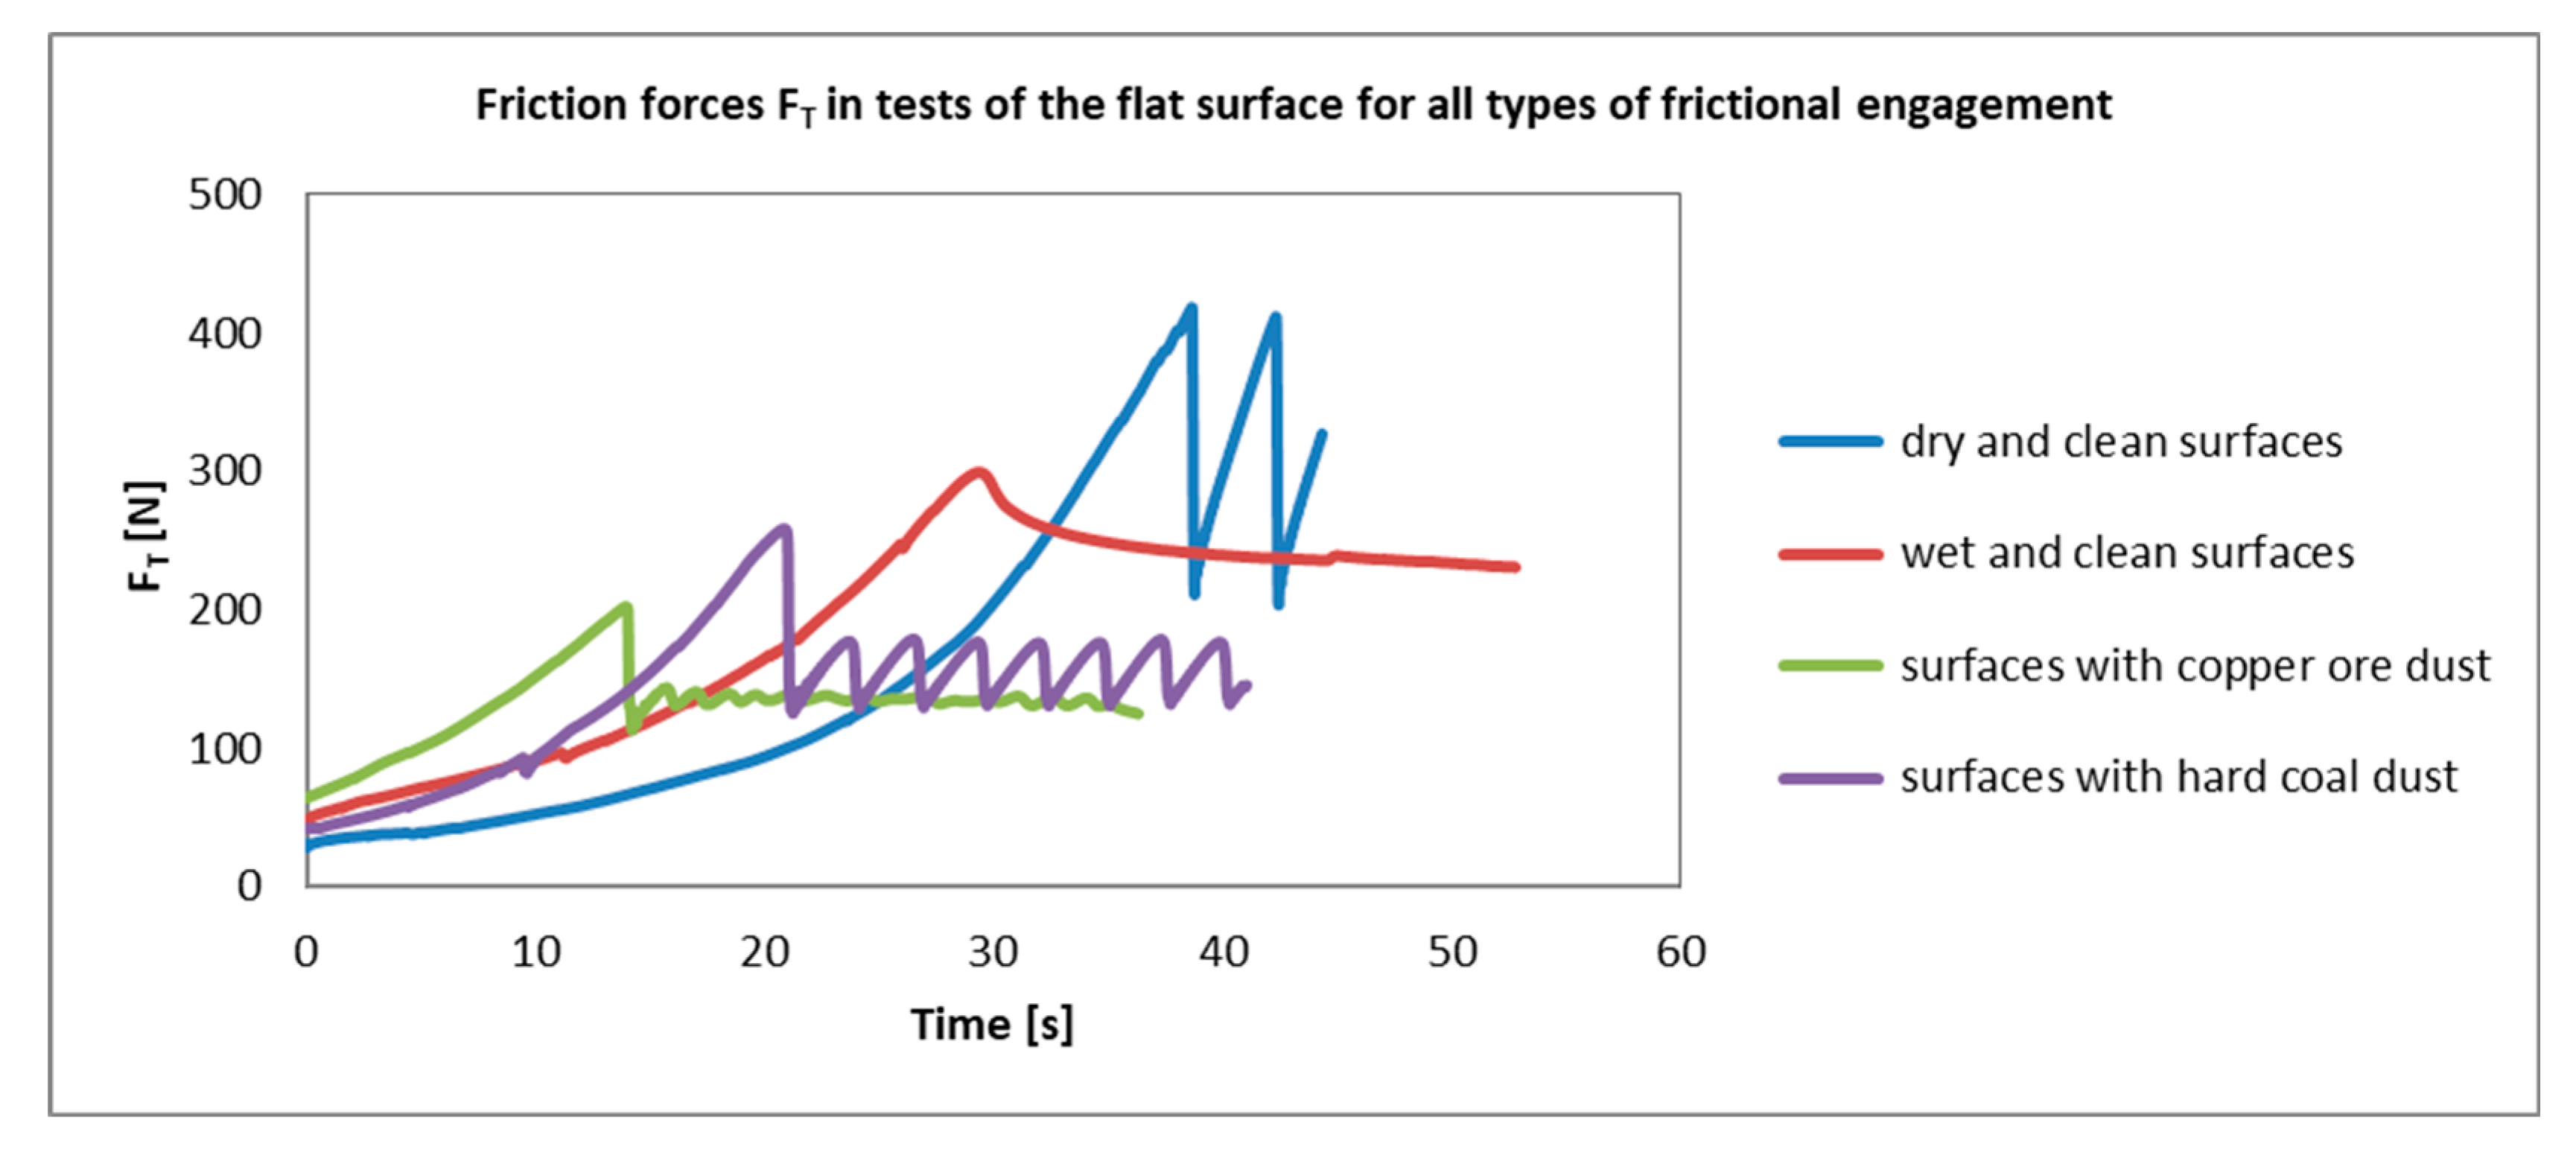
A representative series of friction force values are shown in graphs in Figure 5, Figure 6 and Figure 7. The value series of dry friction for clean surfaces, for surfaces with copper ore dust and for surfaces with hard coal dust were always similar. The tensile force increased until it reached the value of the static friction force which maintained the belt at rest (Figure 5, Figure 6 and Figure 7). After this value was exceeded, the specimen reached the state of slip and rapidly accelerated, reducing the tensile force value (the traverse moved at a constant speed). The force measured at that time fell below the value of kinetic friction, and the relative movement of the specimens stopped. This period was followed by another cycle of increasing force, specimen slip, and another decrease in the tensile force value, and so forth. This fluctuation is characteristic of many friction pairs in which dry friction induces vibrations. In the case of friction in the presence of dust, the cycle repeated with a decreasing amplitude, whereas in the case of dry and clean friction, amplitude of the force fluctuation did not decrease. Video records show that until static friction force was reached, the conveyor belt in the frictional engagement was not completely stationary. Starting from the side where the tensile force was applied, micro-slips occurred due to the significant difference between the elasticity modulus of the steel–rubber rope and the modulus of the belt with the polyamide carcass.
The stick-slip frictional motion was observed in all cases of dry-frictional engagement. In such situations, the problem is to determine the kinetic friction force, which is theoretically the force maintaining the body in uniform motion. It was assumed that the average line of the abrupt changes in the friction force indicates the level of the kinetic friction force. Adhesion is fundamental to stick-slip frictional motion, dictating when and how surfaces transition between sticking and slipping. Figure 8 presents the obtained fluctuations of the friction force values, with stick-slip features, as data for possible use in theoretical models.
In the case of wet friction, the fluctuation of force after the transition of the static friction force was significantly different (Figure 5, Figure 6 and Figure 7). After the force value rapidly decreased, the motion of the body stabilized. The belt moved at a constant speed. The value of the force decreased, but the length of the frictional engagement also decreased.
The friction tests were performed for 12 cases of frictional engagement, with four values of the pressure force (normal force) FN applied in each case. The results of the frictional force and the static coefficient of friction are shown in Table 2.
Figure 9 presents the results of the static and kinetic friction coefficient tests of the rubber–rubber pair for different friction conditions: dry and clean, dry with the copper ore dust, dry with the hard coal dust, wet and clean. The results of the friction coefficient tests are presented in the form of value ranges, which depended on the normal force applied in the experiment, with the rule that the greater the surface pressures, the lower the friction coefficient value. This rule does not apply to dry clean friction. The value ranges shown in the graph also include the scatter of the results due to, e.g., complicated process of covering the specimen surfaces with a uniform quantity of dust.
The highest coefficient values were obtained for dry clean friction, and the lowest—for dry friction with the copper ore dust (dolomite). The results obtained for wet friction seem surprising, as the friction coefficient for the surface grooved in a “diamond” pattern reached values comparably high to the values for dry clean friction conditions. In this case, the significance of the adhesive component of the friction force is probably increasing. Thus, grooved surface in the case of dry friction (whether with or without dust) does not significantly affect the friction coefficient of the rubber–rubber friction pair, but it has a noticeably positive influence on the coefficient in the case of wet friction. The tests also demonstrated that surface grooving does not affect the fluctuation of friction force values. In the case of similar frictional engagement conditions, the friction force values for grooved and non-grooved surfaces were similar.
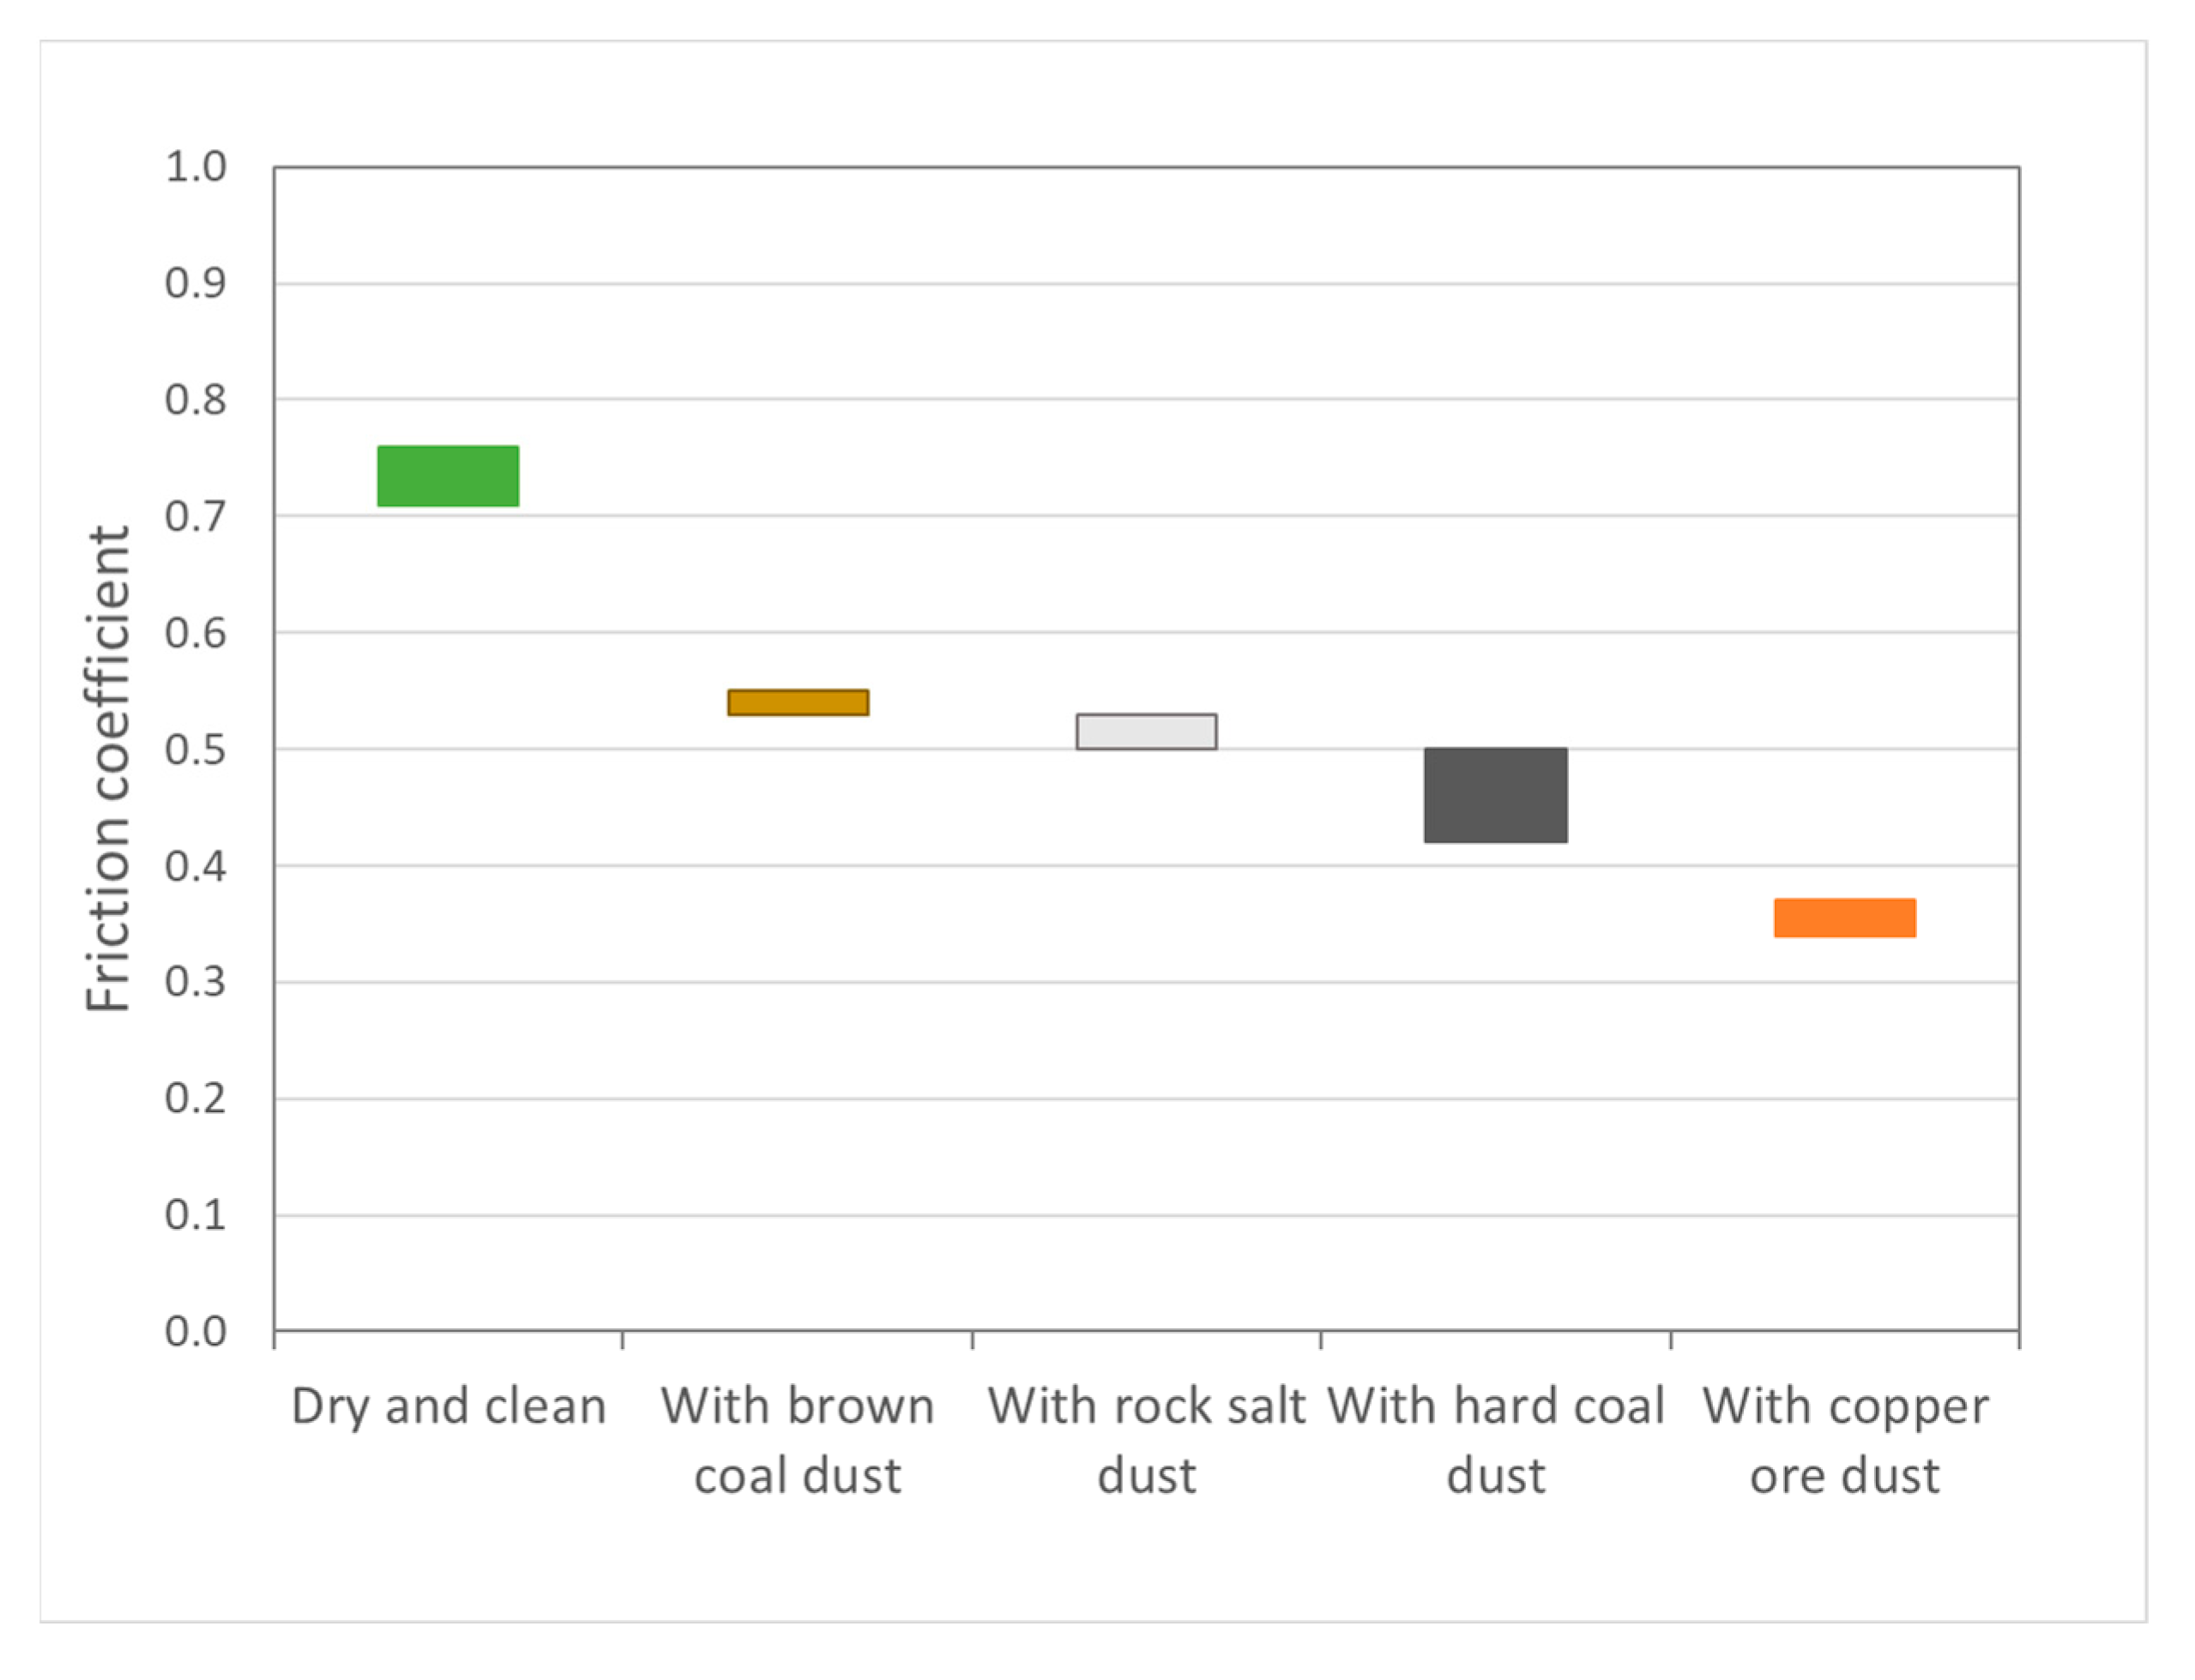
Additional tests were performed for specimens contaminated with brown coal dust and with rock-salt dust. These tests were performed only for the “diamond”-type Surface. Table 3 shows the frictional forces and static coefficients of friction, and Figure 10 shows how the coefficient of friction depends on the type of surface contamination.

4. Conclusions

In conveyor belt drive pulleys and in intermediate belt- and rope-type drives, the power transferred from the drive system to the belt increases together with the increasing friction coefficient between the engaged elements. The coefficient of friction, and thus the frictional engagement, is increased as a result of using grooved rubber pulley linings. The experiment demonstrated that during the dry friction test (regardless of the presence of dust), the grooving of the surface does not significantly affect the friction coefficient of the rubber–rubber friction pair. However, grooving has a significantly positive impact in the case of wet friction. In the case when the surface is grooved in a “diamond” pattern, the measured friction coefficient values were similar for wet surfaces and for dry surfaces. The tests also demonstrated that surface grooving does not affect the fluctuation of friction force values. In the case of similar frictional engagement conditions, the fluctuations of the friction force values for grooved and non-grooved surfaces have a similar character.
Contamination of friction surfaces with solid rock dust has a significantly negative effect on the friction coefficient values obtained in the tests. Therefore, frictional engagement zones in drive systems should be protected from contamination or cleaned, e.g., before the belt enters the drive pulley, so as to improve the effectiveness of the conveyor drive.
The friction coefficient values for rubber–rubber pairs identified in the above presented tests can be used for modeling frictional engagement in intermediate belt drives and in pulley drives of belt conveyors.

Funding

This research received no external funding.

Data Availability Statement

The data presented in this study are available on request from the corresponding author.

Conflicts of Interest

The author declares no conflicts of interest.

References

  1. Euler, M.L. Remarques sur l’effect du frottement dans l’equilibre. Mem. Acad. Sci. 1762, 18, 265. [Google Scholar]
  2. Gładysiewicz, L. Belt conveyors. In Theory and Calculations; Wrocław University of Science and Technology Publishing House: Wrocław, Poland, 2003; ISBN 83-7085-737-X. (In Polish) [Google Scholar]
  3. Gładysiewicz, L.; Woźniak, D. The effective belt tension in short conveyor belt drives. Min. Sci. 2014, 21, 65–75. (In Polish) [Google Scholar]
  4. Feng, Y.; Zhang, M.; Li, G.; Meng, G. Dynamic characteristic analysis and startup optimization design of an intermediate drive belt conveyor with non-uniform load. Sci. Prog. 2019, 103, 0036850419881089. [Google Scholar] [CrossRef] [PubMed]
  5. Bortnowski, P.; Gładysiewicz, A.; Gładysiewicz, L.; Król, R.; Ozdoba, M. Conveyor Intermediate TT Drive with Power Transmission at the Return Belt. Energies 2022, 15, 6062. [Google Scholar] [CrossRef]
  6. Schallamach, A. How does rubber slide? Wear 1971, 17, 301–312. [Google Scholar] [CrossRef]
  7. Wu, Y.; Leamy, M.J.; Varenberg, M. Schallamach waves in rolling: Belt drives. Tribol. Int. 2018, 119, 354–358. [Google Scholar] [CrossRef]
  8. Wieleba, W. The Analysis of Tribological Processes Proceeding in PTFE Composites Sliding Against Steel. In Prace Naukowe Instytutu Konstrukcji i Eksploatacji Maszyn Politechniki Wrocławskiej; Oficyna Wydawnicza Politechniki Wrocławskiej: Wrocław, Poland, 2002. (In Polish) [Google Scholar]
  9. Grosch, K.A. The relation between the friction and visco-elastic properties of rubber. Proc. R. Soc. London Ser. A Math. Phys. Sci. 1963, 274, 21–39. [Google Scholar]
  10. Golden, J.M. A molecular theory of adhesive rubber friction. J. Phys. A Math. Gen. 1975, 8, 966. [Google Scholar] [CrossRef]
  11. Persson, B.N.J. On the theory of rubber friction. Surf. Sci. 1998, 401, 445–454. [Google Scholar] [CrossRef]
  12. Smith, R.H. Analyzing Friction in the Design of Rubber Products and Their Paired Surfaces; CRC Press: Boca Raton, FL, USA, 2008. [Google Scholar] [CrossRef]
  13. Głąb, P.; Bieliński, D.; Maciejewska, K. An attempt to analyze the stick-slip effect for elastomers. Tribologia 2004, 4, 43–49. (In Polish) [Google Scholar]
  14. Bieliński, D. Tribology of Elastomers and Rubber from the Perspective of Materials Engineering; Wydawnictwo Naukowe Instytutu Technologii Eksploatacji-PIB: Radom, Poland, 2009; ISBN 978-83-7204-752-6. (In Polish) [Google Scholar]
  15. Furmanik, K. Vibrations excited by dry friction. Theory, experiment, simulation. In Rozprawy Monografie; AGH Uczelniane Wydawnictwa Naukowo-Dydaktyczne: Kraków, Poland, 2006; p. 157. ISSN 0867-6631. (In Polish) [Google Scholar]
  16. Roth, F.L.; Driscoll, R.L.; Holt, W.L. Frictional properties of rubber. Rubber Chem. Technol. 1943, 16, 155–177. [Google Scholar] [CrossRef]
  17. Grosch, A. The speed and temperature dependence of rubber friction and its bearing on the skid resistance of tires. Phys. Tire Tract. 1974, 143–165. [Google Scholar]
  18. Barquins, M.; Roberts, A.D. Rubber friction variation with rate and temperature: Some new observations. J. Phys. D Appl. Phys. 1986, 19, 547–563. [Google Scholar] [CrossRef]
  19. Persson, B.N.J. Sliding friction. Surf. Sci. Rep. 1999, 33, 83–119. [Google Scholar] [CrossRef]
  20. Persson, B.N.J.; Albohr, O.; Creton, C.; Peveri, V. Contact area between a viscoelastic solid and a hard, randomly rough, substrate. J. Chem. Phys. 2004, 120, 8779–8793. [Google Scholar] [CrossRef] [PubMed]
  21. Klüppel, M.; Heinrich, G. Rubber friction on self-affine road tracks. Rubber Chem. Technol. 2000, 73, 578–606. [Google Scholar] [CrossRef]
  22. Le Gal, A.; Yang, X.; Klüppel, M. Evaluation of sliding friction and contact mechanics of elastomers based on dynamic-mechanical analysis. J. Chem. Phys. 2005, 123, 14704. [Google Scholar] [CrossRef]
  23. Kong-Hui, G.; Ye, Z.; Shih-Ken, C.; Lin, W. Experimental Research on Friction of Vehicle Tire Rubber. Front. Mech. Eng. 2006, 1, 14–20. [Google Scholar] [CrossRef]
  24. Vieira, T.; Ferreira, R.; Kuchiishi, A.; Bernucci, L.; Sinatora, A. Evaluation of friction mechanisms and wear rates on rubber tire materials by low-cost laboratory tests. Wear 2015, 328, 556–562. [Google Scholar] [CrossRef]
  25. Riehm, P.; Unrau, H.; Gauterin, F. A model based method to determine rubber friction data based on rubber sample measurements. Tribol. Int. 2018, 127, 37–46. [Google Scholar] [CrossRef]
  26. Löwer, J.; Wagner, P.; Unrau, H.J.; Bederna, C.; Gauterin, F. Physical Model of Tire-Road Contact Under Wet Conditions. Tribol. Lett. 2020, 68, 25. [Google Scholar] [CrossRef]
  27. Hatanaka, S.; Ogawa, Y.; Okubo, H.; Hanzawa, K.; Kajiki, R.; Yamaguchi, K.; Nakano, K. Correlation between friction and wear of rubber: An experimental approach based on the disconnections of Stribeck curves. Wear 2024, 562–563, 205623. [Google Scholar] [CrossRef]
  28. Kondori, M.S.; Taheri, S. Linear friction tester design and validation. Proc. Inst. Mech. Eng. Part J J. Eng. Tribol. 2021, 236, 856–866. [Google Scholar] [CrossRef]
  29. Čepon, G.; Manin, L.; Boltežar, M. Experimental identification of the contact parameters between a V-ribbed belt and a pulley. Mech. Mach. Theor. 2010, 45, 1424–1433. [Google Scholar] [CrossRef]
  30. Hrabovský, L.; Nenička, P.; Fries, J. Laboratory Machine Verification of Force Transmission Provided by Friction Acting on the Drive Drum of a Conveyor Belt. Machines 2023, 11, 544. [Google Scholar] [CrossRef]
  31. Kasza, P.; Kulinowski, P.; Zarzycki, J. The Influence of an Operating Conditions on the Friction Coefficient in Transportation Machines Drives. New Trends Prod. Eng. 2020, 3, 294–302. [Google Scholar] [CrossRef]
  32. Persson, B.N.J. Conveyor Belt Drive Physics. Tribol. Lett. 2020, 68, 17. [Google Scholar] [CrossRef]
  33. Kułacz, J. The Effect of Grooving One Surface of A Rubber-Rubber Friction Pair on Sliding Friction. Master’s Thesis, Wrocław University of Science and Technology, Wrocław, Poland, 2013. not published. [Google Scholar]
Figure 1. Belt conveyor with belt intermediate drive.
Applsci 15 10204 g001
Figure 2. Test stand for measuring the friction coefficient of a rubber–rubber friction pair (a) schematic diagram; (b) actual view; (c) force transducer and measuring amplifier.
Applsci 15 10204 g002
Figure 3. Specimen surfaces with grooves in a “diamond” pattern and with transverse grooves.
Applsci 15 10204 g003
Figure 4. Surfaces of the tested specimens (a) with copper ore dust; (b) wet and clean.
Applsci 15 10204 g004
Figure 5. Recorded friction forces in the frictional engagement between the belt and the plate surface grooved in the “diamond” pattern (normal force FN = 594 N).
Applsci 15 10204 g005
Figure 6. Recorded friction forces in the frictional engagement between the belt and the flat plate surface with no grooves (normal force FN = 594 N).
Applsci 15 10204 g006
Figure 7. Recorded friction forces in the frictional engagement between the belt and the transversely grooved surface (normal force FN = 415 N).
Applsci 15 10204 g007
Figure 8. Recorded friction forces in tests of the “diamond” pattern surface (rubber–rubber pair, normal force FN = 594 N, surface area of the contact zone A = 0.031653 m2, speed V~5 × 10⁻⁴ m/s). Stick slip at frictional engagement conditions: (a) dry and clean surfaces; (b) surfaces with hard coal dust; (c) surfaces with copper ore dust.
Applsci 15 10204 g008
Figure 9. Results of the static and kinetic friction coefficient tests of the rubber–rubber pair for different conditions of the friction surfaces, for the specimen surfaces with grooves and without grooves.
Applsci 15 10204 g009
Figure 10. Friction coefficients of the rubber–rubber pair for different surface contamination conditions tested on the “diamond” type surfaces.
Applsci 15 10204 g010
Table 1. Dimensions and designations of the tested surfaces types.
Surface TypeContact
Zone Width
[mm]
Contact
Zone Length
[mm]
Surface Area of Grooves
[mm2]
Surface Area of the Contact Zone
[mm2]
Flat surface
(no grooves)
88500-44,000
Surface with transverse grooves88500633637,664
Surface with grooves in “diamond” pattern8850012,34731,653
Table 2. Research results.
Frictional Engagement ConditionsDry and CleanWet and Cleanwith Copper Ore Dustwith Hard Coal Dust
Normal force FN [N]328415505594328415505594328415505594328415505594
Specimen surfacesFlat surface
Max frictional
force FT [N]
222321390418192227265299111137170188172193233258
Static coefficient
of friction
0.680.770.770.700.580.550.530.500.340.330.340.320.520.460.460.43
Specimen surfacesSurface with transverse grooves
Max frictional
force FT [N]
212308328394208243295349118143178210171196221253
Static coefficient
of friction
0.650.740.650.660.640.580.590.590.360.340.350.350.520.470.440.43
Specimen surfacesSurface with “diamond” grooves
Max frictional
force FT [N]
248294358434254281329427120150173216163182216246
Static coefficient
of friction
0.760.710.710.730.770.680.650.720.370.360.340.360.500.440.430.41
Table 3. Additional tests results.
Frictional Engagement Conditionswith Brown Coal Dustwith Rock Salt Dust
Normal force FN [N]328415505594328415505594
Specimen surfacesSurface with “diamond” grooves
Max frictional force FT [N]180223272317174215256294
Static coefficient of friction0.550.540.540.530.530.520.510.50
Disclaimer/Publisher’s Note: The statements, opinions and data contained in all publications are solely those of the individual author(s) and contributor(s) and not of MDPI and/or the editor(s). MDPI and/or the editor(s) disclaim responsibility for any injury to people or property resulting from any ideas, methods, instructions or products referred to in the content.