Abstract
In underground mining, the stage pillar (SP) is essential for maintaining stope stability, acting as a load-bearing structure between stages. Determining the minimum safe SP thickness is critical to balancing mineral recovery and operational safety. This study investigates the design and mechanical stability of SP under substantial backfill loads, using a representative Iron ore mine as a case study. Based on the geometry of the overlying backfill and core sampling data, extreme loading conditions were identified, with the stope measuring 85 m in height, 72 m in length, and 18 m in width. A mathematical model incorporating the pressure arch effect and triangular pillar geometry was developed to estimate the backfill-induced load. Safety factors for various SP thicknesses were calculated using thin plate and elastic beam theories. Considering sequential excavation of the first- and second-step stopes, the minimum safe SP thickness was determined to be 6.0 m. This design was evaluated using FLAC3D numerical simulations. The results reveal that during the first step, stress concentrations occurred mainly at the pillar base, with a maximum displacement of approximately 2.0 cm and peak tensile stress of 0.36 MPa—both within acceptable limits. These findings support improved pillar design for safe, efficient ore recovery in underground metal mining.
1. Introduction
With the rapid socio-economic development, the demand for mineral resources has been steadily increasing in industrial production and infrastructure construction [1,2,3]. Underground mines, as the primary sites for extracting metal and non-metal ores, play a vital role in mineral resource recovery [4,5,6,7,8]. In underground mining, stage pillars (SPs), sometimes referred to as stope roofs, are an important component in maintaining stope stability [9,10,11]. SPs bear the stress of overlying rock strata and separate different mining stages, ensuring the safe and orderly operation of underground mines. However, they involve a trade-off between maintaining safety and stability and maximizing resource recovery [12,13,14,15]. This is mainly reflected in the fact that if the SP is too thick, it results in resource loss; if too thin, it poses a threat to safe production. Therefore, determining the optimal thickness of SPs has become a focus of attention among researchers [16].
In optimizing the thickness of the SP, Yang et al. [17] investigated the failure behavior of roofs with different thicknesses through on-site measurements, physical modeling, and numerical simulations. They found that as roof thickness increases, load-bearing capacity improves and deformation decreases. Ma et al. [18] analyzed stope roof failure based on elastic thin plate theory, revealing that failure is mainly caused by tensile stress at the roof center. Using the No. 10 stope of a bauxite mine as a case study, they designed the roof thickness as 0.5 m. Yang et al. [19] established a mechanical load model and derived the relationship between the thickness of temporary roof pillars and their ultimate lengths. After comprehensive evaluation, they recommended a thickness of 10 m for temporary roof pillars in first-step mining, corresponding to an ultimate length of 31 m. Hua et al. [20] improved the formula for calculating safe roof thickness based on beam–plate theory, considering roof weight and variations in vertical lateral pressure. Jiang et al. [21] proposed a method to calculate safety factors for roofs in deep mining, providing formulas for shear, compression, and comprehensive safety factors. Under conditions of a 30 m stope span and 10 m roof thickness, the comprehensive safety factor was 1.12. Numerical simulation is an effective method for analyzing the stability of mines and is widely applied due to its advantages of high efficiency and accuracy [22,23,24]. Liu et al. [25] analyzed changes in safety factors for roofs supported by misaligned pillars, revealing their evolution through numerical simulation combined with the strength reduction method. Wang et al. [26] developed a thick plate mechanical model for stope roofs based on Reissner theory. According to a creep damage model, the damage incubation time at the midpoint of the long side is 110.32 days, and at the short side midpoint, 121.19 days. Li et al. [27], studying deep caving-to-backfilling mining in a lead-zinc mine in Inner Mongolia, derived a stress expression based on the medium–thick plate theory for roofs simply supported on one pair of opposite sides and fixed on the other. Using maximum tensile stress theory, they calculated the safe isolation pillar thickness as 20 m. Zhang et al. [28] analyzed the damage and collapse process of goaf roofs with numerical simulations, calculating the relationship between safe thickness and critical span at initial damage and unstable collapse.
In summary, scholars both domestically and internationally have conducted extensive research on the thickness and stability of SPs; however, relatively little attention has been given to designing SPs under the load of high and large backfills. Therefore, using a domestic Iron mine as the case study, this paper calculates the optimal SP thickness by applying thin plate theory and elastic beam theory after analyzing the conditions of the overlying backfill. Furthermore, the FLAC3D model is employed to verify the safety of the stope and the SP.
2. Project Profile
Anhui Masteel Luohe Mining, located in Anhui Province, China, has a production capacity of 5 million tons per annum and uses the sublevel (or subsegment) open-stope subsequent backfilling mining method. The mining operation is divided into two main sections, the −540 m stage and the −620 m stage, with the −540 m stage mined first. The −455 m level serves as the drilling and backfilling return air level, while the −540 m level is the trackless ore extraction level. The designed stope dimensions are 72 m in length, 18 m in width, and 30–85 m in height, as shown in Figure 1, which illustrates the layout of the upper and lower sublevel mining. To reduce backfilling costs, a stepwise backfilling approach is adopted. The designed uniaxial compressive strength (UCS) of the backfill in the first-step stope is 2.2 MPa, and in the second-step stope, 1.0 MPa. The concentration of the backfill is 68% to 70%. The ratio of cement to sand for the first-step is 1:10, and for the second-step is 1:16. The main filling processes include the tailings produced by the concentrator are processed through a deep cone thickener to form high-concentration tailings mortar. The tailings and cementing materials are mixed and stirred in the mixing tank and then transported to the goaf through the filling pipeline.
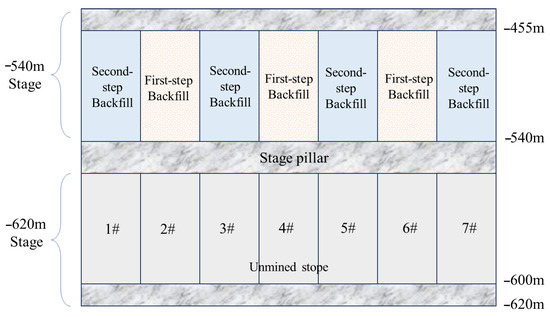
Figure 1.
Schematic diagram of the upper and lower stage mining layout.
Currently, mining of the −540 m stage stopes is complete, and construction work for the −620 m stage is underway. The key question is as follows: What thickness should the SP between these two stages be retained as to ensure production safety while maximizing mineral recovery?
3. Occurrence Status of Overlying Backfill
The mine uses a downward mining method, with mining at the −540 m level conducted after excavation and backfilling of the upper-stage stopes. The load from the upper backfill acts directly on the SPs, posing a potential threat to their stability. Therefore, analyzing the occurrence of the overlying stopes is crucial for assessing SP stability. There are 10 mining panels numbered 1 to 10 above the SPs, with connecting roads (20 m) arranged between adjacent panels. Perpendicular to the mining strips, 20 exploration lines (labeled A to T) are spaced on average 30 m apart. The following analysis examines stope dimensions and backfill strength for each mining strip and along each exploration line.
3.1. Height of the Backfill
As shown in Figure 2, the height distribution of stope backfills ranges from 30 m to 85 m. In Panel 1, the distribution of high and large stopes (i.e., those with a height exceeding 60 m) is the most extensive, accounting for 65% of the total area. It is well known that backfills in high and large stopes negatively affect floor stability. The pressure exerted by backfills on the floor is essentially vertical stress, primarily due to the self-gravity of the backfill. The compaction load from the upper backfill is transmitted to lower layers through interparticle contact. The greater the stope height, the higher the vertical stress borne by the floor [29]. In addition to the influence of high and large stopes, stopes distributed along exploration lines J to T are relatively dense, which can lead to stress concentration. In contrast, due to the orebody’s occurrence characteristics, no goafs are arranged in Panels 4 to 9 or along exploration lines A to J, so these areas do not impose additional pressure on the floor.
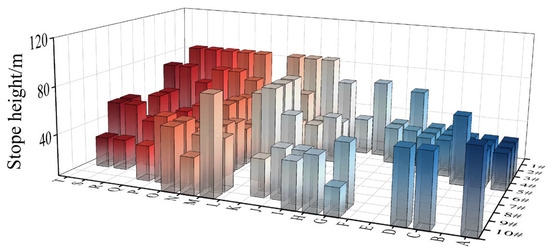
Figure 2.
Distribution of the height of the stope.
3.2. Length of the Backfill
As shown in Figure 3, the length distribution of stope backfills varies slightly, ranging from 50 m to 72 m. Stopes in Panels 1 to 3 have relatively larger lengths, and those along exploration lines L to T are densely distributed. Unlike stope height, which affects floor pressure through vertical stress, the influence of stope length depends more on the horizontal load distribution law and the span effect in structural mechanics. The stope floor can be regarded as a beam on an elastic foundation, where the backfill and overlying loads act as uniformly distributed loads on the beam, and the stope length corresponds to the beam’s span. According to elastic foundation beam theory, stope length directly determines the internal force distribution—bending moment and shear force—of the floor, thus affecting the pressure borne by the floor. When the stope length is small, the bending deformation of the floor beam is minor, and the bending moments are dispersed and low.
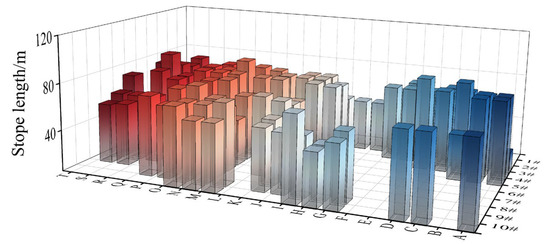
Figure 3.
Distribution of the length of the stope.
3.3. The Distance from the Stope Backfill Floor to the SP
The SP level is −540 m. If the stope backfill floor is at the −508 m level, the distance between the backfill floor and the SP is 32 m. Figure 4 illustrates the distance from the stope backfill floor to the SP. This distance directly affects SP stability—the greater the distance, the less the SP is affected by the load. Figure 4 shows that the distance between the stope floor in Panels 1 to 4 and the SP is essentially zero, which is detrimental to SP stability. In contrast, the distance from the stope floor along exploration lines M to T to the SP ranges from 20 m to 40 m, effectively reducing the impact on the fragment pillars. Stress transmission in rock mass does not follow linear rigid transmission but instead follows the stress diffusion principle in elastic mechanics. Stress diffuses into deeper parts at an angle, with its influence expanding as distance increases.
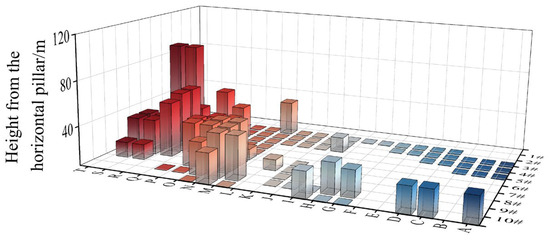
Figure 4.
Distance from the stope backfill floor to the SP.
3.4. Uniaxial Compressive Strength of the Backfill
To verify backfill quality, core samples are drilled from the top or bottom of the stope after the backfill has cured, and UCS tests are conducted randomly (Figure 5). According to the mine’s design requirements, the 28-day strength of the backfill in the first-step stopes should reach 2.2 MPa, while that in the second-step stopes should reach 1.0 MPa. The strength distribution of the backfill in stopes that have undergone quality inspection is shown in Figure 6. Figure 6a shows the UCS distribution in the first-step stopes, where the maximum UCS reaches 6 MPa and 83% of the stopes meet the design requirement. In the second-step stopes, UCS values range from 0.85 MPa to 2.67 MPa, with 92% of the stopes exceeding the required strength.

Figure 5.
Core sampling experiment of the backfill.
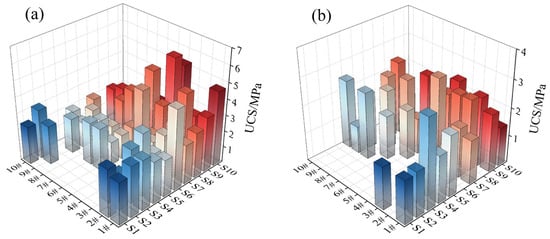
Figure 6.
UCS distribution of backfill. (a) First-step. (b) Second-step. S1 to S10 are the stope numbers.
4. Theoretical Calculation of SP Thickness
Based on the above analysis, the height of the overlying stope backfill ranges from 30 m to 85 m, the length from 50 m to 72 m, and the distance between the stope floor and the SP is essentially 0 m. To ensure production safety, the most extreme scenario is considered—an overlying stope backfill height of 85 m, a length of 72 m, and zero distance between the stope floor and the SP.
4.1. The Overloading Load on the SP
The arching effect of backfill is a critical factor in calculating the load on the SP. The load from the overlying backfill cannot be calculated directly from self-weight stress; instead, the mechanical interaction at the contact interface between the backfill and surrounding rock must be considered. Due to the frictional and non-smooth nature of this interface, when each layer of backfill settles under gravity, horizontal stress induces frictional force at the interface that resists settlement [30]. Additionally, hydration products in the backfill generate adhesive force at the interface. The combined action of friction and adhesion counteracts part of the backfill’s self-weight stress, resulting in vertical stress within the backfill being less than its theoretical self-weight [31].
Triangular pillars are typically retained during ore extraction at the stope bottom, as shown in Figure 7. The vertical component of the force (σvs) exerted by these triangular pillars on the backfill helps reduce the pressure on the SP [32]. Considering the effect of triangular pillars, the load (q′) of the upper backfill acting on the SP is shown in Equations (1) and (2):
where q is the sum of the self-weight stress of SP and the overlying load (kPa), ρ′ is the density of the upper backfill (kg/m3), h is the height of the SP (m), h2 is the height of the upper backfill (m), θ is the angle of the triangular pillar (45°), B is the width of the backfill (m), L is the length of the backfill (m), γ′ is the unit weight of the SP (kN/m3), and γ is the unit weight of the backfill (kN/m3).
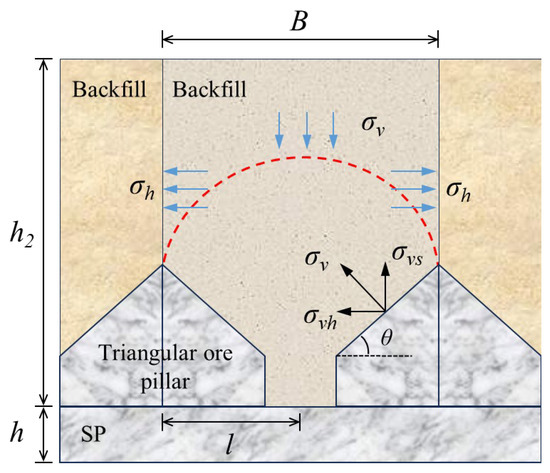
Figure 7.
Schematic diagram of the arch frame effect of the backfill.
4.2. Thin Plate Theory
The stope floor can be simplified as an elastic thin plate (with thickness much smaller than its length and width) subjected to the lateral load of the backfill. Its stress behavior can be analyzed using classical thin plate theory [33]. This theory quantifies the pressure on the floor—namely, the bending stress and shear force within the thin plate—by relating bending deformation to internal stress.
The SP is modeled as an ideal elastic body that satisfies the fundamental assumptions of elasticity—it is continuous, uniform, isotropic, and undergoes small, linearly elastic deformations. The plate is subjected to a uniformly distributed load q. Specifically, the linear strain εz perpendicular to the midplane is neglected; all points along the normal to the midplane are assumed to have the same lateral displacement, and secondary stress components τxz, τyz, σz, as well as their associated deformations, are ignored. Additionally, no displacements parallel to the midplane occur within the midplane itself.
Under vertical loading, the differential equation governing the deflection curve of the midplane in the bearing layer of the roof pillar is shown in Equation (3):
where W is the vertical deflection, D is the flexural rigidity of the bearing layer, , El is the elastic modulus of the bearing layer (GPa), h is the thickness of the bearing layer (m), μ is the Poisson’s ratio of the bearing layer, and l is half the length of the stope (m).
When 0 ≤ x ≤ l, the bending moment reaches its maximum:
When x ≥ l, the bending moment reaches its maximum at xA:
where H is the height of the lower goaf (m), H = 60-h. When αl > 3.4, the maximum value occurs at the edge of the plate; otherwise, the opposite is true. The maximum tensile stress (σtmax) in the SP occurs at the lower surface of the bearing layer and is shown in Equation (8):
4.3. Elastic Beam Theory
In mining operations involving SP between the upper, middle, and lower sublevels, the original sublevel stopes are generally treated as independent mining units. The load generated by loose backfill in the upper stopes can be approximately regarded as a uniformly distributed load. Given that the height of the SP within the stope is significantly smaller than the span of the mined stope, and the loose backfill in the lower stope has no load-bearing capacity, the stress state of the SP in a granular media environment is a typical beam bending problem under a uniformly distributed load. Its mechanical model can thus be simplified to an elastic beam with fixed ends subjected to a uniformly distributed load, as shown in Figure 8.
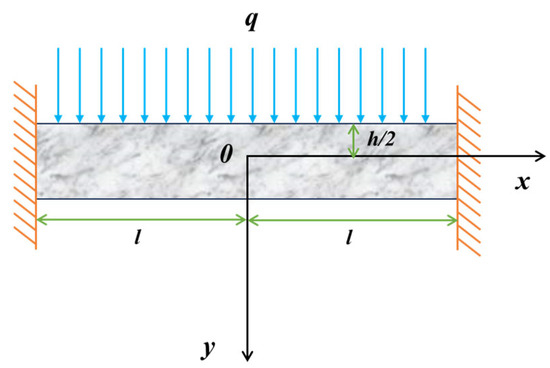
Figure 8.
The simplified mechanical model of SP.
By introducing fixed-end boundary constraints, a mechanical model for the SP roof in the granular media environment is constructed, and the analytical solution for its elastic stress is shown in Equations (9)–(11) [34]:
where σx is the stress in the x-direction, σy is the stress in the y-direction, σz is the stress in the z-direction, and μ is the Poisson’s ratio of the SP.
Since the span of the SP is much larger than its height, the value of σx is significantly greater than those of σxy and σy. The maximum σx manifests as tensile stress, and because the tensile strength of rock mass is much lower than its compressive and shear strength, σx is the primary stress causing failure. The maximum tensile stress occurs at both sides of the upper end of the SP. According to the rock tensile failure criterion, the critical stable state is achieved when σx < [σ]. The calculation for σx is shown in Equation (12) [34]:
4.4. Calculation Result
The maximum tensile stress values and safety factors ([σ]/σₓ) of the SP during first-step and second-step mining, calculated using thin plate theory under current stope structural parameters, are shown in Figure 9. Using a safety factor of 1 as the criterion, the stability of the SP under different theories is analyzed. h2 = 85 m, h = 1~20 m, B = 18 m, l = 9 m, L = 72 m. Other parameters are shown in Table 1.
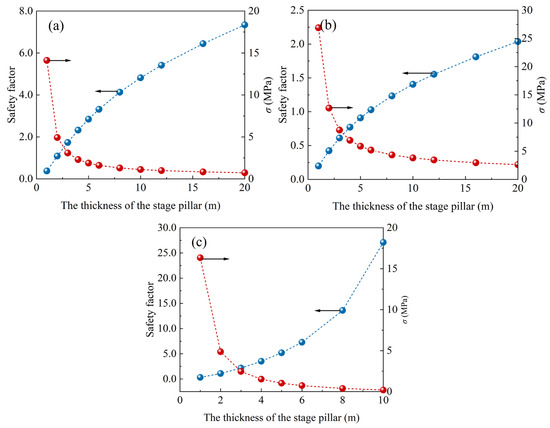
Figure 9.
Changes in the safety factor of SP thickness at different stages. (a) First step of theoretical calculation for thin plates. (b) Second step theoretical calculation of thin plates. (c) Theoretical calculation of elastic beams.

Table 1.
Comprehensive adopted values of rock mechanics parameters.
Figure 9a,b show that, under the same SP thickness condition, the safety factor during second-step mining is generally smaller than during first-step mining. During first-step stope mining, the stope sides consist of ore bodies, which provide strong support. The load from the overlying goaf is transferred to the surrounding rock on both sides, creating favorable conditions for goaf stability. In contrast, during second-step mining, the stope sides consist of backfills with a uniaxial compressive strength of 2.2 MPa and cohesion of 0.34 MPa, offering weaker support than the ore. Therefore, the most conservative scenario—the safety factor during second-step mining—should guide the selection of safe SP thickness. The thickness should be at least 6 m, at which point the safety factor is 1.02.
Based on the elastic beam theory, the safety factors for different SP thicknesses are calculated and shown in Figure 9c. It can be observed that as the SP thickness increases, the safety factor gradually rises. A thicker SP better transfers and distributes ground pressure between the upper and lower sublevels. During mining, as the orebody is extracted, stress in the surrounding rock mass undergoes redistribution. As an important supporting structure, increasing the SP thickness allows ground pressure to be transmitted more uniformly over a larger area, preventing local stress concentrations that could cause failure of the pillar or surrounding rock mass. It can be concluded that when the SP thickness reaches 2 m, the safety factor exceeds 1, meeting stability requirements.
5. SP Stability Analysis Based on FLAC3D
FLAC3D is based on the finite difference method (FDM). By adopting the explicit Lagrange algorithm and combining it with the hybrid discrete partitioning technology, it can accurately simulate the entire failure process and mechanical behavior of materials from elasticity to plasticity. This makes it a valuable tool for numerical simulation research in geomechanics and related fields [35,36,37].
5.1. Model Establishment
This study employed the finite difference analysis software FLAC3D (Version 6.0) to simulate ground pressure behaviors such as stress distribution and displacement changes in the SP (with a thickness of 6 m) and the lower stope. By comparing the results with the ultimate strength of the ore and surrounding rock, the stability of the SP and stope was assessed. During the mining process, the first-step stope is mined first, followed by the second-step stope, and the process is completed in the form of “mining one step at intervals”. To closely replicate real safety conditions and accurately reflect the actual stress state of the SP and lower stope, the simulation schemes were set as follows:
State I: The first-step stope has been excavated and backfilled, including 1#, 3#, 5#, and 7# stope (Figure 1);
State II: The second-step stope has been excavated, including 2#, 4#, and 6# stope (Figure 1). At this stage, the first-step backfill and roof are in their most critical condition during the entire construction process.
Considering the limitations of the finite element program, this model assumes that the ore and rock are ideal elastic–plastic and isotropic materials, and the contact between each rock layer and the filling body is integrated. The influence of tectonic activities, groundwater, and structural planes is ignored. The boundary conditions restrict lateral and vertical displacements, and the in situ stress is static field type. On the stress boundary, according to the mine production data, the structural stress σH = 0.02 + 0.0278 H, MPa, where H is the height of the overlying rock layer of the model, H = 309 m. The height of the backfill above the SP is 85 m, and the distance from the top of the SP to the top of the surrounding rock in the model is 255 m. The applied tectonic stress is 8.63 MPa.
Under the following assumptions, the simulated stope has a length of 72 m and a width of 18 m. The outer boundary of the ore layer is defined as surrounding rock, and the overall model dimensions are 400 m × 300 m × 450 m. A schematic diagram of the model setup is shown in Figure 10, and the comprehensive mechanical parameters of the rock mass are listed in Table 1.
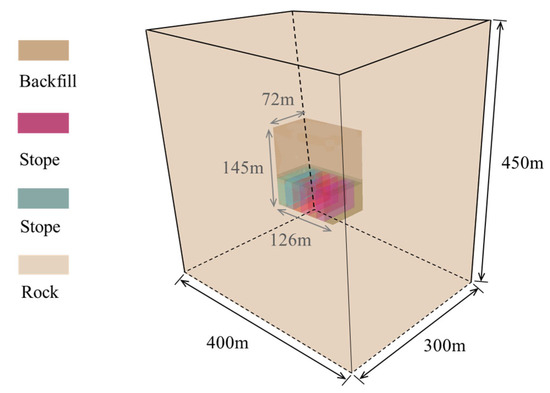
Figure 10.
Schematic diagram of surrounding rock and stope model.
5.2. Analysis of the Results of State I
The numerical simulation results of State I are shown in Figure 11. As indicated in Figure 11b, the plastic zone is mainly distributed along both sides of the stope. Its extent is relatively limited compared to the overall model scale, and the degree of plastic development in the SP is low. Figure 11c shows that the maximum displacement occurs in the backfill overlying the SP. Under the load of the upper backfill and overlying rock, the SP itself undergoes a displacement of approximately 5 cm.
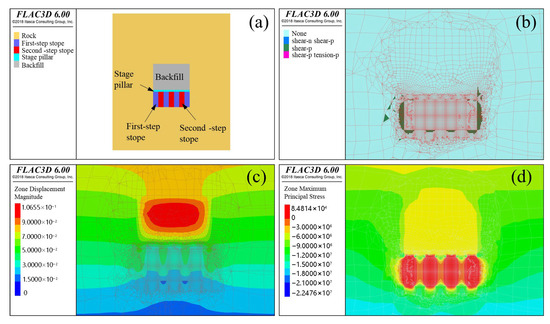
Figure 11.
The results of State I. (a) Model schematic diagram. (b) Plastic zone. (c) Displacement. (d) Maximum principal stress.
During the excavation of the first-step stope, deformation in the surrounding rock is constrained by the unexcavated second-step stope. As a result, subsidence is mainly concentrated at the base of the pillar, with a displacement of about 2 cm. Under the action of its own weight and the load of the overlying rock layer, the rock mass on the roof of the goaf will bend and sink like a simply supported beam. The degree of bending depends on the bending stiffness of the rock mass on the roof, the span of the goaf and the conditions of the lower support. As the main load-bearing structure on both sides of the goaf, the SPs need to bear the vertical load transferred from the roof and undergo slight deformation under compressive stress. The stress state analysis indicates that, following the excavation and backfilling of the first-step stope, tensile stress concentration primarily occurs within the first-step backfill. In the SP, tensile stress is mainly concentrated in the area corresponding to the upper part of the first-step stope. The measured maximum tensile stress in both cases is 0.085 MPa, which is well below the tensile strength of both the backfill and the SP. Therefore, the SP and the stope are determined to be in a safe and stable state.
5.3. Analysis of the Results of State II
The structural stability analysis of the stope below the SP is presented in Figure 12a–c. The maximum tensile stress in the stope backfill is 0.009 MPa, significantly lower than the standard tensile strength of the backfill material (0.186 MPa), amounting to only 4.8% of its capacity. As shown in Figure 12b, the maximum displacement in the stope is relatively small, approximately 4 cm. In addition, the analysis of the plastic zone evolution in the surrounding rock and backfill (Figure 12c) shows no large-scale connected or severely damaged regions, indicating good overall stability.
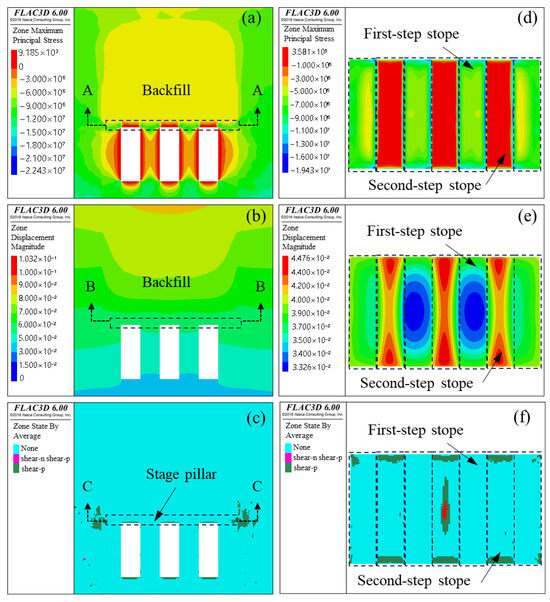
Figure 12.
The results of State II. (a) Maximum principal stress. (b) Displacement. (c) Plastic zone. (d) A-A section. (e) B-B section. (f) C-C section.
Simulation results for the SP in State II are shown in Figure 12d–f. During second-step mining, the SP experiences localized tensile stress concentration, with the peak tensile stress occurring near the boundary of the newly formed goaf. The maximum tensile stress in the SP is 0.36 MPa, and the maximum displacement is 4.5 cm. No large-scale or through-going plastic failure zones are observed in the SP, and the rock mass remains in an elastic or small-deformation state. After the second-step stope excavation, the plastic zone range around the stope and the SP expands and the development degree deepens (as shown in Figure 12c,f), reflecting a significant increase in the area where the rock mass enters plastic yield. According to the Mohr–Coulomb yield criterion, the formation of the plastic zone results from the rock mass stress exceeding its shear strength, causing irreversible plastic deformation. In Figure 12c, plastic zone patches such as shear-n and shear-p have appeared at the edge of the SP and on the side wall of the stope. The plastic zone of the profile more clearly shows that the plastic zone of the rock mass between the first- and second-step stopes and the side wall of the stope develops in a “strip-like” or “locally through” manner. From the perspective of failure mechanism, the plastic zone of the side wall of the stope is mainly caused by excessive shear stress, which is the result of shear yield of the rock mass under the combined action of horizontal and vertical stress.
Under the current mining stage and simulated working conditions, the structural integrity of the SP is fully maintained, and it remains in a safe and stable condition. Considering the stress state, structural displacement response, and plastic zone development of both the stage roof pillar and the lower stope, the system is mechanically stable, and the structural safety meets engineering requirements.
6. Shortcomings and Future Prospects
In this study, an analysis of the static mechanical response under sequential excavation and backfilling was conducted via theoretical analysis and numerical simulation. While existing studies predominantly rely on theoretical models such as thin plate theory to assess roof stability [33], this research pioneeringly integrates the pressure arch effect with the geometry of triangular pillars to establish a load transfer model for backfill. Given that both the arch effect of backfill and triangular pillars exert a positive influence on the stability of SPs, the proposed approach enables the maximum recovery of pillar resources compared with previously reported studies. For instance, the reserved thickness of SPs in other mining operations typically exceeds 20 m [27].
Notably, this study did not account for the influence of vibration loads induced by blasting operations in underground mining on SP stability during the design of the safe thickness of SPs and the stability analysis. Excavation of stopes in underground mines generally relies on blasting techniques; the seismic waves generated by blasting propagate to the surrounding rock mass in the form of stress waves, causing dynamic disturbances to SP. The transient high-amplitude stress from blasting vibrations accelerates the propagation of microcracks in the rock mass and reduces the dynamic load-bearing capacity of SP. To comprehensively evaluate the stability of SP in actual mining scenarios, future research could leverage the advantages of explicit dynamic analysis in LS-DYNA software to investigate the dynamic response of SP under blasting vibrations. This would render the pillar design more aligned with the actual working conditions characterized by frequent blasting operations, thereby enhancing the safety and economic efficiency of underground mining.
7. Conclusions
The thickness of the SP was determined by integrating the arching effect, thin plate theory, and elastic beam theory, and its stability was evaluated using FLAC3D numerical simulations. The following conclusions are drawn:
- (1)
- Analysis of the backfill conditions in the overlying stopes revealed the presence of many high and large backfills, with stope heights ranging from 30 m to 85 m and lengths mainly between 50 m and 72 m. The maximum UCS of the first-step backfill reaches 6.0 MPa, with 83% of the stopes meeting the design requirement. The UCS of the second-step backfill ranges from 0.85 MPa to 2.67 MPa, with 92% of the stopes exceeding the design requirement.
- (2)
- A mathematical model of backfill load, incorporating the effect of triangular pillars, was established. Under comprehensive extreme conditions—i.e., after first-step mining and during second-step mining—the minimum safe thickness of the SP was determined to be 6 m.
- (3)
- FLAC3D was used to analyze the stress, displacement, and plastic zone development of a 6 m thick SP. During first-step mining, displacement was mainly concentrated at the base of the pillar, with a maximum of approximately 2 cm. The maximum tensile stress borne by the SP was 0.36 MPa. The simulation results show that the SP remains stable throughout the mining process, meeting the required safety standards.
Author Contributions
Conceptualization, Q.N., Q.C., Y.L. and Y.F.; methodology, Q.C., W.J. and J.Y.; software, C.C., J.Y. and W.J.; validation, Q.C., Y.L., Y.F. and C.C.; formal analysis, W.J., J.Y., Q.C. and Y.L.; investigation, Y.L., C.C. and W.J.; resources, Q.N., J.Y. and Y.F.; data curation, Y.L., C.C. and J.Y.; writing—original draft preparation, Q.N., Q.C., Y.L. and Y.F.; writing—review and editing, Q.N., C.C. and W.J.; supervision, Y.L., W.J. and J.Y.; project administration, Q.N., Q.C. and Y.F.; funding acquisition, Q.C. and Y.F. All authors have read and agreed to the published version of the manuscript.
Funding
This research was funded by the National Natural Science Foundation of China (52474165).
Institutional Review Board Statement
Not applicable.
Informed Consent Statement
Not applicable.
Data Availability Statement
The raw data supporting the conclusions of this article will be made available by the authors upon request.
Conflicts of Interest
Authors Wei Jia and Jinfeng Yuan were employed by the company Anhui Masteel Luohe Mining Co. The remaining authors declare that the research was conducted in the absence of any commercial or financial relationships that could be construed as a potential conflict of interest.
References
- Wang, Y.; Chen, Q.; Dai, B.; Wang, D. Guidance and review: Advancing mining technology for enhanced production and supply of strategic minerals in China. Green Smart Min. Eng. 2024, 1, 2–11. [Google Scholar] [CrossRef]
- Zhang, H.; Li, B.; Karimi, M.; Saydam, S.; Hassan, M. Recent Advancements in IoT Implementation for Environmental, Safety, and Production Monitoring in Underground Mines. IEEE Internet Things J. 2023, 10, 14507–14526. [Google Scholar] [CrossRef]
- Behera, S.K.; Singh, P.; Mishra, D.P.; Mishra, K.; Kumar, A.; Mandal, S.K.; Mandal, P.K.; Mishra, A.K. Required strength design of cemented backfill for underground metalliferous mine. Int. J. Min. Reclam. Environ. 2023, 37, 927–952. [Google Scholar] [CrossRef]
- Zhou, Z.; Hou, K.; Ren, Y. Roof Stability Analysis of Sublevel Open Stope and Caving Mining Method. J. Min. Saf. Eng. 2012, 29, 538–542. [Google Scholar]
- Lu, R.; Ma, F.; Zhao, J.; Wang, J.; Li, G.; Dai, B. Monitoring and Analysis of Stress and Deformation Features of Boundary Part of Backfill in Metal Mine. Sustainability 2020, 12, 733. [Google Scholar] [CrossRef]
- Shaposhnik, Y.N.; Konurin, A.I.; Neverov, A.A.; Neverov, S.A.; Usol’tseva, O.M.; Shaposhnik, S.N. Validation of Friction-Anchored Rock Bolt Supports for Underground Excavations in Backfill. J. Min. Sci. 2021, 57, 775–786. [Google Scholar] [CrossRef]
- Chen, Q.; Zhang, C.; Wang, D.; Liu, Y.; Qi, C. Carbon sequestration potential and mechanisms of shotcrete for tunnel support in underground metal mines through cement hydration. Int. J. Miner. Metall. Mater. 2025, 32, 1496–1506. [Google Scholar] [CrossRef]
- Na, Q.; Chen, Q.; Wu, A. Precise and Non-destructive Approach for Identifying the Real Concentration Based on Cured Cemented paste Backfill Using Hyperspectral Imaging. Int. J. Miner. Metall. Mater. 2025. [Google Scholar] [CrossRef]
- Dintwe, T.K.M.; Sasaoka, T.; Shimada, H.; Hamanaka, A.; Moses, D.N.; Peng, M.; Fanfei, M.; Liu, S.; Ssebadduka, R.; Onyango, J.A. Numerical Simulation of Crown Pillar Behaviour in Transition from Open Pit to Underground Mining. Geotech. Geol. Eng. 2022, 40, 2213–2229. [Google Scholar] [CrossRef]
- Ahmad, M.; Al-Shayea, N.A.; Tang, X.-W.; Jamal, A.; Al-Ahmadi, H.M.; Ahmad, F. Predicting the Pillar Stability of Underground Mines with Random Trees and C4.5 Decision Trees. Appl. Sci. 2020, 10, 6486. [Google Scholar] [CrossRef]
- Ghasemi, E.; Kalhori, H.; Bagherpour, R. Stability assessment of hard rock pillars using two intelligent classification techniques: A comparative study. Tunn. Undergr. Space Technol. 2017, 68, 32–37. [Google Scholar] [CrossRef]
- Kou, X.; Xu, F.; Chu, H.; Pan, D.; Liu, X. Study on Safety Thickness of Isolation Layer for Transferfrom Caving to Stoping and filling in Yangiiawan Mine. Min. Res. Dev. 2013, 33, 59–62. [Google Scholar] [CrossRef]
- Liu, Z.; Xiong, P.; Lei, M.; Feng, F.; Yang, Z. Thickness Determination and Stability Analysis of Boundary Pillar in Transition fromOpen-Pit to Underground Mining of An Iron Mine. Min. Res. Dev. 2024, 44, 1–6. [Google Scholar] [CrossRef]
- Xu, H.; Wang, Y.; Wu, A.; Li, F.; Gao, W. A computational model of safe thickness of roof under filling body based on cusp catastrophe theory. Chin. J. Rock Mech. Eng. 2017, 36, 579–586. [Google Scholar] [CrossRef]
- Yang, Y.; Gao, H.; Li, Y. Analysis on Roof Stability of Concealed Gob Area Under Additional Loading. J. Northeast. Univ. (Nat. Sci.) 2011, 32, 1332–1335. [Google Scholar]
- Yang, Y.; Li, Y.; Yin, G.; Han, H. Stability Analysis of Boundary Pillars Safety Thickness for Transition from Open Pit to Underground Mining. J. Northeast. Univ. (Nat. Sci.) 2011, 32, 1032–1035+1040. [Google Scholar]
- Yang, S.; Yue, H.; Li, Q.; Chen, Y. Study on Failure Behaviors of Roofs with Varying Thicknesses in Longwall Coal Mining Working Face. Rock Mech. Rock Eng. 2024, 57, 6259–6282. [Google Scholar] [CrossRef]
- Ma, S.-W.; Hu, J.-H.; Qin, Y.-G.; Ren, Q.-F.; Yang, D.-J. Bearing mechanism and thickness optimization of ore roof in bauxite stope. Trans. Nonferrous Met. Soc. China 2022, 32, 285–295. [Google Scholar] [CrossRef]
- Yang, W.; Li, H.; Chen, Q.; Xiao, F.; Huang, H.; Liang, Z.; Liang, Z. Temporary Roof Pillar Cyclic Induced Collapse: Beam Mechanics Analysis of Thickness and Limit Length. Rock Mech. Rock Eng. 2024, 57, 11351–11365. [Google Scholar] [CrossRef]
- Hua, S.; Li, Y.-A.; Wang, Y.; Hu, F. Theoretical Calculation of Safety Thickness of Stope Roof Considering the Effect of Structural Planes. Electron. J. Geotech. Eng. 2015, 20, 1843–1850. [Google Scholar]
- Jiang, L.-C.; Jiao, H.-Z.; Wang, Y.-D.; Wang, G.-G. Comprehensive safety factor of roof in goaf underdeep high stress. J. Cent. South Univ. 2021, 28, 595–603. [Google Scholar] [CrossRef]
- Basarir, H.; Sun, Y.; Li, G. Gateway stability analysis by global-local modeling approach. Int. J. Rock Mech. Min. Sci. 2019, 113, 31–40. [Google Scholar] [CrossRef]
- Sun, Y.; Bi, R.; Chang, Q.; Taherdangkoo, R.; Zhang, J.; Sun, J.; Huang, J.; Li, G. Stability Analysis of Roadway Groups under Multi-Mining Disturbances. Appl. Sci. 2021, 11, 7953. [Google Scholar] [CrossRef]
- Yang, H.; Zhang, N.; Han, C.; Sun, C.; Song, G.; Sun, Y.; Sun, K. Stability Control of Deep Coal Roadway under the Pressure Relief Effect of Adjacent Roadway with Large Deformation: A Case Study. Sustainability 2021, 13, 4412. [Google Scholar] [CrossRef]
- Liu, C.; Zhao, K.; Zeng, P.; Gong, C. Stability Analysis of Isolated Roof in Overlapping Goaf Based on Strength Reduction. Appl. Sci. 2025, 15, 3067. [Google Scholar] [CrossRef]
- Wang, J.; Zhang, C.; Zheng, D.; Song, W.; Ji, X. Stability analysis of roof in goaf considering time effect. J. Min. Strat. Control Eng. 2020, 2, 013011. [Google Scholar] [CrossRef]
- Li, X.; Peng, D.; Feng, F.; Li, X. Stability analysis of horizontal insulating pillar in deep mining from caving to filling method on the basis of refined plate theory. J. China Univ. Min. Technol. 2019, 48, 484–494. [Google Scholar] [CrossRef]
- Zhang, M.; Zhu, W.; Hou, Z.; Guo, X. Numerical Simulation for Determining the Safe Roof Thickness and Critical Goaf Span. J. Min. Saf. Eng. 2012, 29, 543–548. [Google Scholar]
- Wang, R.; Zeng, F.; Li, L. Stability analyses of side-exposed backfill considering mine depth and extraction of adjacent stope. Int. J. Rock Mech. Min. Sci. 2021, 142, 104735. [Google Scholar] [CrossRef]
- Wang, Y.; Na, Q.; Zhang, L. Monitoring of in-situ properties for cemented tailings backfill that under drainage condition. Constr. Build. Mater. 2022, 356, 129254. [Google Scholar] [CrossRef]
- Tao, M.; Zhao, Y.; Guo, J. Arch model of roof and optimization of roof-contacted filling rate in two-step mining. Trans. Nonferrous Met. Soc. China 2023, 33, 1893–1905. [Google Scholar] [CrossRef]
- Peng, C. Study on Stability of Filling Goaf Based on Arch Effect. Master’s Thesis, South China University of Technology, Guangzhou, China, 2018. [Google Scholar]
- Chen, A.; Du, A.; Chu, L.; Wang, P.; Chen, G. Calculation model of roof span and thickness of goaf under high stage backfill considering arch effect. J. Min. Saf. Eng. 2025, 42, 218–228. [Google Scholar] [CrossRef]
- Wang, X.; Feng, X.; Zhao, K.; Shao, H.; Ye, Z. Study of critical thickness of roof of level pillar stoping under multifactor influence. Rock Soil Mech. 2013, 34, 3505–3512. [Google Scholar] [CrossRef]
- Wang, J.; Jiang, J.; Li, G.; Hu, H. Exploration and Numerical Analysis of Failure Characteristic of Coal Pillar Under Great Mining Height Longwall Influence. Geotech. Geol. Eng. 2016, 34, 689–702. [Google Scholar] [CrossRef]
- Ma, D.; Cai, X.; Li, Q.; Duan, H. In-Situ and Numerical Investigation of Groundwater Inrush Hazard from Grouted Karst Collapse Pillar in Longwall Mining. Water 2018, 10, 1187. [Google Scholar] [CrossRef]
- Rashed, G.; Slaker, B.; Sears, M.M.; Murphy, M.M. A Parametric Study for the Effect of Dip on Stone Mine Pillar Stability Using a Simplified Model Geometry. Min. Metall. Explor. 2021, 38, 967–977. [Google Scholar] [CrossRef]
Disclaimer/Publisher’s Note: The statements, opinions and data contained in all publications are solely those of the individual author(s) and contributor(s) and not of MDPI and/or the editor(s). MDPI and/or the editor(s) disclaim responsibility for any injury to people or property resulting from any ideas, methods, instructions or products referred to in the content. |
© 2025 by the authors. Licensee MDPI, Basel, Switzerland. This article is an open access article distributed under the terms and conditions of the Creative Commons Attribution (CC BY) license (https://creativecommons.org/licenses/by/4.0/).