1. Introduction
Observing the Earth’s magnetic field is an important scientific task. Studying magnetic field variations allows for a better understanding of the physical processes occurring both on Earth and in near space. Currently, hundreds of magnetic observatories are recording the magnetic field on all continents [
1,
2,
3]. Space observatories are also operating [
4,
5]. The development of data transmission systems allowed researchers to quickly obtain the results of magnetic field measurements from observatories located at great distances from each other. International organizations that combine geomagnetic observatories into networks have emerged, providing measurement results in a unified format, such as INTERMAGNET (International Real-Time Magnetic Observatory Network) [
6]. The appearance of the possibility of collective data processing from many observatories has become a breakthrough finding in the field of geomagnetic observations [
7].
INTERMAGNET establishes uniform requirements for providing measurements, their processing, format, and transmission of final data [
8,
9]. However, the collective processing of data from numerous magnetic observatories revealed problems related to the quality of the data provided by these observatories. Some observatories revealed problems with sensor orientation [
10], their temperature instability [
11], the existence of interference from alternating current (AC) [
12] and direct current (DC) power transmission networks [
13,
14], and the violation of time synchronization of the observatories [
15].
In recent years, sources of interference of industrial origin have begun to create particularly serious problems [
16]. The authors of [
17] consider the cases of the existence of interference results at the observatories of Egypt, including Misallat (MLT) and Abu-Simbel (ABS). From 2015 to October 2022, the interference level at the Misallat (MLT) observatory became so high that natural signals at ultra-low frequencies were completely hidden by it. In [
18], the authors indicate transport traffic, power transmission lines, and power plants at a distance of 500 m to 1 km as the main sources of noise in magnetic measurements at the Hyderabad (HYB) Observatory. A comparison with the measurements carried out during the general lockdown of automobile and railway metro traffic during the COVID-19 pandemic from 24 March to 17 May 2020, with the previous values of magnetic measurements, revealed a significant difference in the level of interference.
As an effective method for solving the problem of maintaining data quality, INTERMAGNET suggests performing a mutual comparison between the values of vector and scalar magnetometers or between the values of neighboring magnetic observatories. Valuable results can only be achieved if the data is accurate and flawless. High-quality instruments and a high level of abilities and motivation of the observatory staff are needed, but a rigorous verification process is just as important for data quality control. Observatory data is useful for science only if the quality can be guaranteed by peer review before publication. A Geomagnetic Information Node (GIN) of INTERMAGNET encourages observatories to verify measurement data before sending it to the network. After receiving these data, they are carefully rechecked by volunteers and the Definitive Data Subcommittee of INTERMAGNET before their final publication for the scientific community. This procedure is necessary to maintain a consistently high level of data quality, but it is very laborious [
19]. The disadvantage of post-processing is the delay in the release of final data from magnetic observatories [
20,
21,
22].
The verification and correction of the measurement data sent to INTERMAGNET is carried out by the personnel of the observatories that perform the measurements. There are currently no general international algorithms for improving the quality of magnetograms. There are many works offering original methods of preprocessing magnetograms [
19,
23,
24,
25,
26]. In some countries, uniform (within the framework of the state) methods of improving the quality of magnetograms are used, such as in Indonesia [
27] or in China [
28]. In different methods, defective data is replaced either by median values [
29] or interpolated values [
30] or replaced by conditional values unrelated to a natural phenomenon [
31].
In our opinion, interference is most effectively suppressed by collectively processing measurement results of several spatially separated magnetic observatories. Thus, in [
27], data from four observatories (TUN, TND, PLR, and KPG) for the period from 2010 to 2017 were processed in post-processing mode, which are now available from the World Data Centre of Geomagnetism (WDC-G). The distance between the observatories ranged from 10 to 25 geographical degrees. This shows an example of using a comparison-based method. However, its effectiveness depends on the criterion applied.
This paper proposes a method for the preprocessing of magnetograms obtained from four spatially separated observatories, which is suitable for use in an automated mode.
In order to set the task of automating the process of preprocessing magnetic measurements of several magnetic observatories separated in space, we must, first of all, ascertain the methodological validity of using remote magnetometers for comparative analysis. In [
27], data obtained from observatories located at a distance of up to 2700 km from each other were used for comparison. The examples of the dynamics of the average daily values given in this study indicate discrepancies in the magnitudes of the magnetic field components, reaching 3000 nT, and in their various daily trends. This leads to difficulties for automating the processing. Another problem mentioned by the authors, which had to be fixed manually, was the out-of-sync timestamps of the magnetometers.
In the process of preparing quasi-defined magnetic observatory data, it is necessary to eliminate the results of interference regardless of their origin. Interference results are assumed by their signatures; for example, in the method proposed by IPGP (Institut de physique du globe de Paris) (Paris, France), spikes and jumps in the data series are assumed to be the results of interference. At the same time, spikes and jumps can be the subjects of research because they can carry important scientific information.
Jumps of the signal level in magnetograms can serve as earthquake precursors [
32,
33]. However, in [
33], in the discussion of the results, it is suggested that these may be switching effects in DC circuits on the railway.
The situation is the same with signal spikes. They can be associated with industrial interference [
17], interference from ionosondes [
26] operating near geomagnetic observatories, or cosmic ray bursts [
34] or lightning [
35,
36]. At the same time, magnetic observatories register lightning discharges with conventional magnetometers at distances over 300 km, as well as at distances over 2000 km using special magnetic antennas.
Such large signal propagation distances make it possible to use probability theory to separate signals from interference. If the probability of occurrence of a random event A leading to interference on the magnetogram is equal to P, then the probability that such an event will occur simultaneously at several observatories will be significantly lower according to (1):
where
are independent interference events, affecting
(a number of) magnetic field sensors.
This method relies on the statistical improbability that random, mutually independent disturbances occur simultaneously.
2. Materials and Methods
If the event is recorded simultaneously by remote observatories, then the higher the probability that this event is not an interference, the farther the observatories are from each other, and therefore, it should not be deleted from the magnetograms. Thus, monitoring the time of event occurrence can play an important role in the quality control of magnetograms and their preprocessing in magnetic observatories. It was shown in [
15] that 20 years ago, there were cases of desynchronization of magnetograms of up to several minutes relative to each other. Choosing the equipment with synchronization from the GPS navigation system reduced the problem, but it did not eliminate it completely [
37]. Therefore, at the first step of the implementation of the proposed algorithm, the synchronization of magnetic observatories should be checked for short-period variations in the magnetic field, which are observed almost constantly [
34,
38,
39]. The author of [
40] proposed algorithms for finding short-period pulsations developed on the data analysis results of “Abisko” (Sweden,
N
E) and “Ministik Lake” (Canada,
N
W) observatories.
Another methodological issue is the choice of the acceptable distance between observatories used to control and improve the quality of magnetograms. To resolve this issue, it is necessary to proceed with the Biot–Savart law (2):
where
is the unit vector, directed from the measuring point in the direction of the differential current element
; r is the distance from the measuring point to the differential current element; and
is the permeability of free space.
Using this equation, it is possible to estimate the distances between magnetic observatories at which possible industrial interference recorded by one of the observatories could not affect measurements at another observatory. The mentioned work [
27] provides information on significant interference from electrified DC railways. In [
13], devoted to studying the modeling of interference from electrified railways, it was proposed that the permissible interference level should not exceed 0.01 nT based on the sensitivity level of modern equipment of magnetic observatories. Electrified railways have an extended contact network with currents of up to 3000 A. In the case of measuring the interference caused by the motion of electric locomotives, interference reaching 0.2 nT was recorded on a magnetic observatory located 5 km from the railway [
41], which is 20 times higher than the permissible level accepted by the author.
Based on Equation (2), we can assume that by increasing the distance from the railway to the measuring point of the magnetic field by about times, that is, up to , we can expect no interference from the railways. For the “worst case”, when two observatories are located on opposite sides of the railway, the protective distance should be doubled to 45 km.
These distances between the observatories are suggested for the “worst case” in conditions of high interference. In practice, in the case of placing observatories away from the sources of interference, backup magnetometers can be used, in the same way as, for example, BGS (British Geological Survey) uses them [
42]. In these cases, backup magnetometers may be located at shorter distances, relative to each other, than 45 km.
In the case of seismic impacts on a magnetic observatory [
26], signal variations unrelated to the magnetic field may also appear on magnetograms. If a magnetic observatory is not specifically designed to study the complex geophysical factors preceding and accompanying earthquakes, then such variations should also be considered as results of interference and removed. Unlike electromagnetic signals that propagate through space at the speed of light, the speed of seismic waves is limited to 3–5 km/s. Therefore, it is unlikely that different magnetic observatories with per-second measurements will simultaneously detect variations associated with vibrations of the Earth’s surface. The proposed algorithm will remove such variations. At the same time, in the case of per-minute measurements, the distances between the observatories should exceed
. In cases where variations are associated with a destruction of the flow of telluric currents in the earthquake zone, they will be simultaneously recorded by observatories, even with per-second measurements, and such variations will not be deleted.
To verify the method, four magnetic observatories with identical POS-1 (Processor Overhauser Sensor) scalar magnetometers performing per-minute measurements were selected. The type of magnetometer selected is a precision measuring device of cyclic type based on the principle of dynamic polarization of nuclei (Overhauser effect). It is designed to measure the induction modulus of the Earth’s magnetic field in the range of 20,000–100,000 nT. The modulus of the standard deviation of the absolute random component of the measurement error of the magnetometer is no more than 0.03 nT. One of the magnetometers is located at the Almaty magnetic observatory (“AAA”) with coordinates (). It belongs to the Ionosphere Institute (Almaty, Kazakhstan) and is intended to study solar–terrestrial relations.
Three other observatories—Maitobe (Mtb) (
), Kastek (Kst) (
), and Izvestkovy (Izv) (
) owned by the Institute of Seismology (Almaty, Kazakhstan)—are intended to be used to study the nature of seismic processes. Characteristics of the magnetometers are presented in
Table 1.
The “AAA” observatory, owned by the Institute of Ionosphere, is part of INTERMAGNET, while the “Izv”, “Mtb”, and “Kst” observatories, owned by the Institute of Seismology, are not included. All of them are geomagnetic observatories.
The method of improving the quality of magnetograms is illustrated by the processing of magnetograms recorded on 4 March 2024. The choice of the day was due to the fact that it was on this day that an earthquake of magnitude M 4.7 (at the epicenter) occurred near the city of Almaty [
43]. In the city of Almaty itself, the earthquake was felt at the level Mb = 5.6 (body-wave magnitude) [
44], and it caused interference in the record of the “AAA” observatory related to the kinetic effect of the seismic wave on the magnetometer (swinging of the measuring instrument and the foundation of the observatory building).
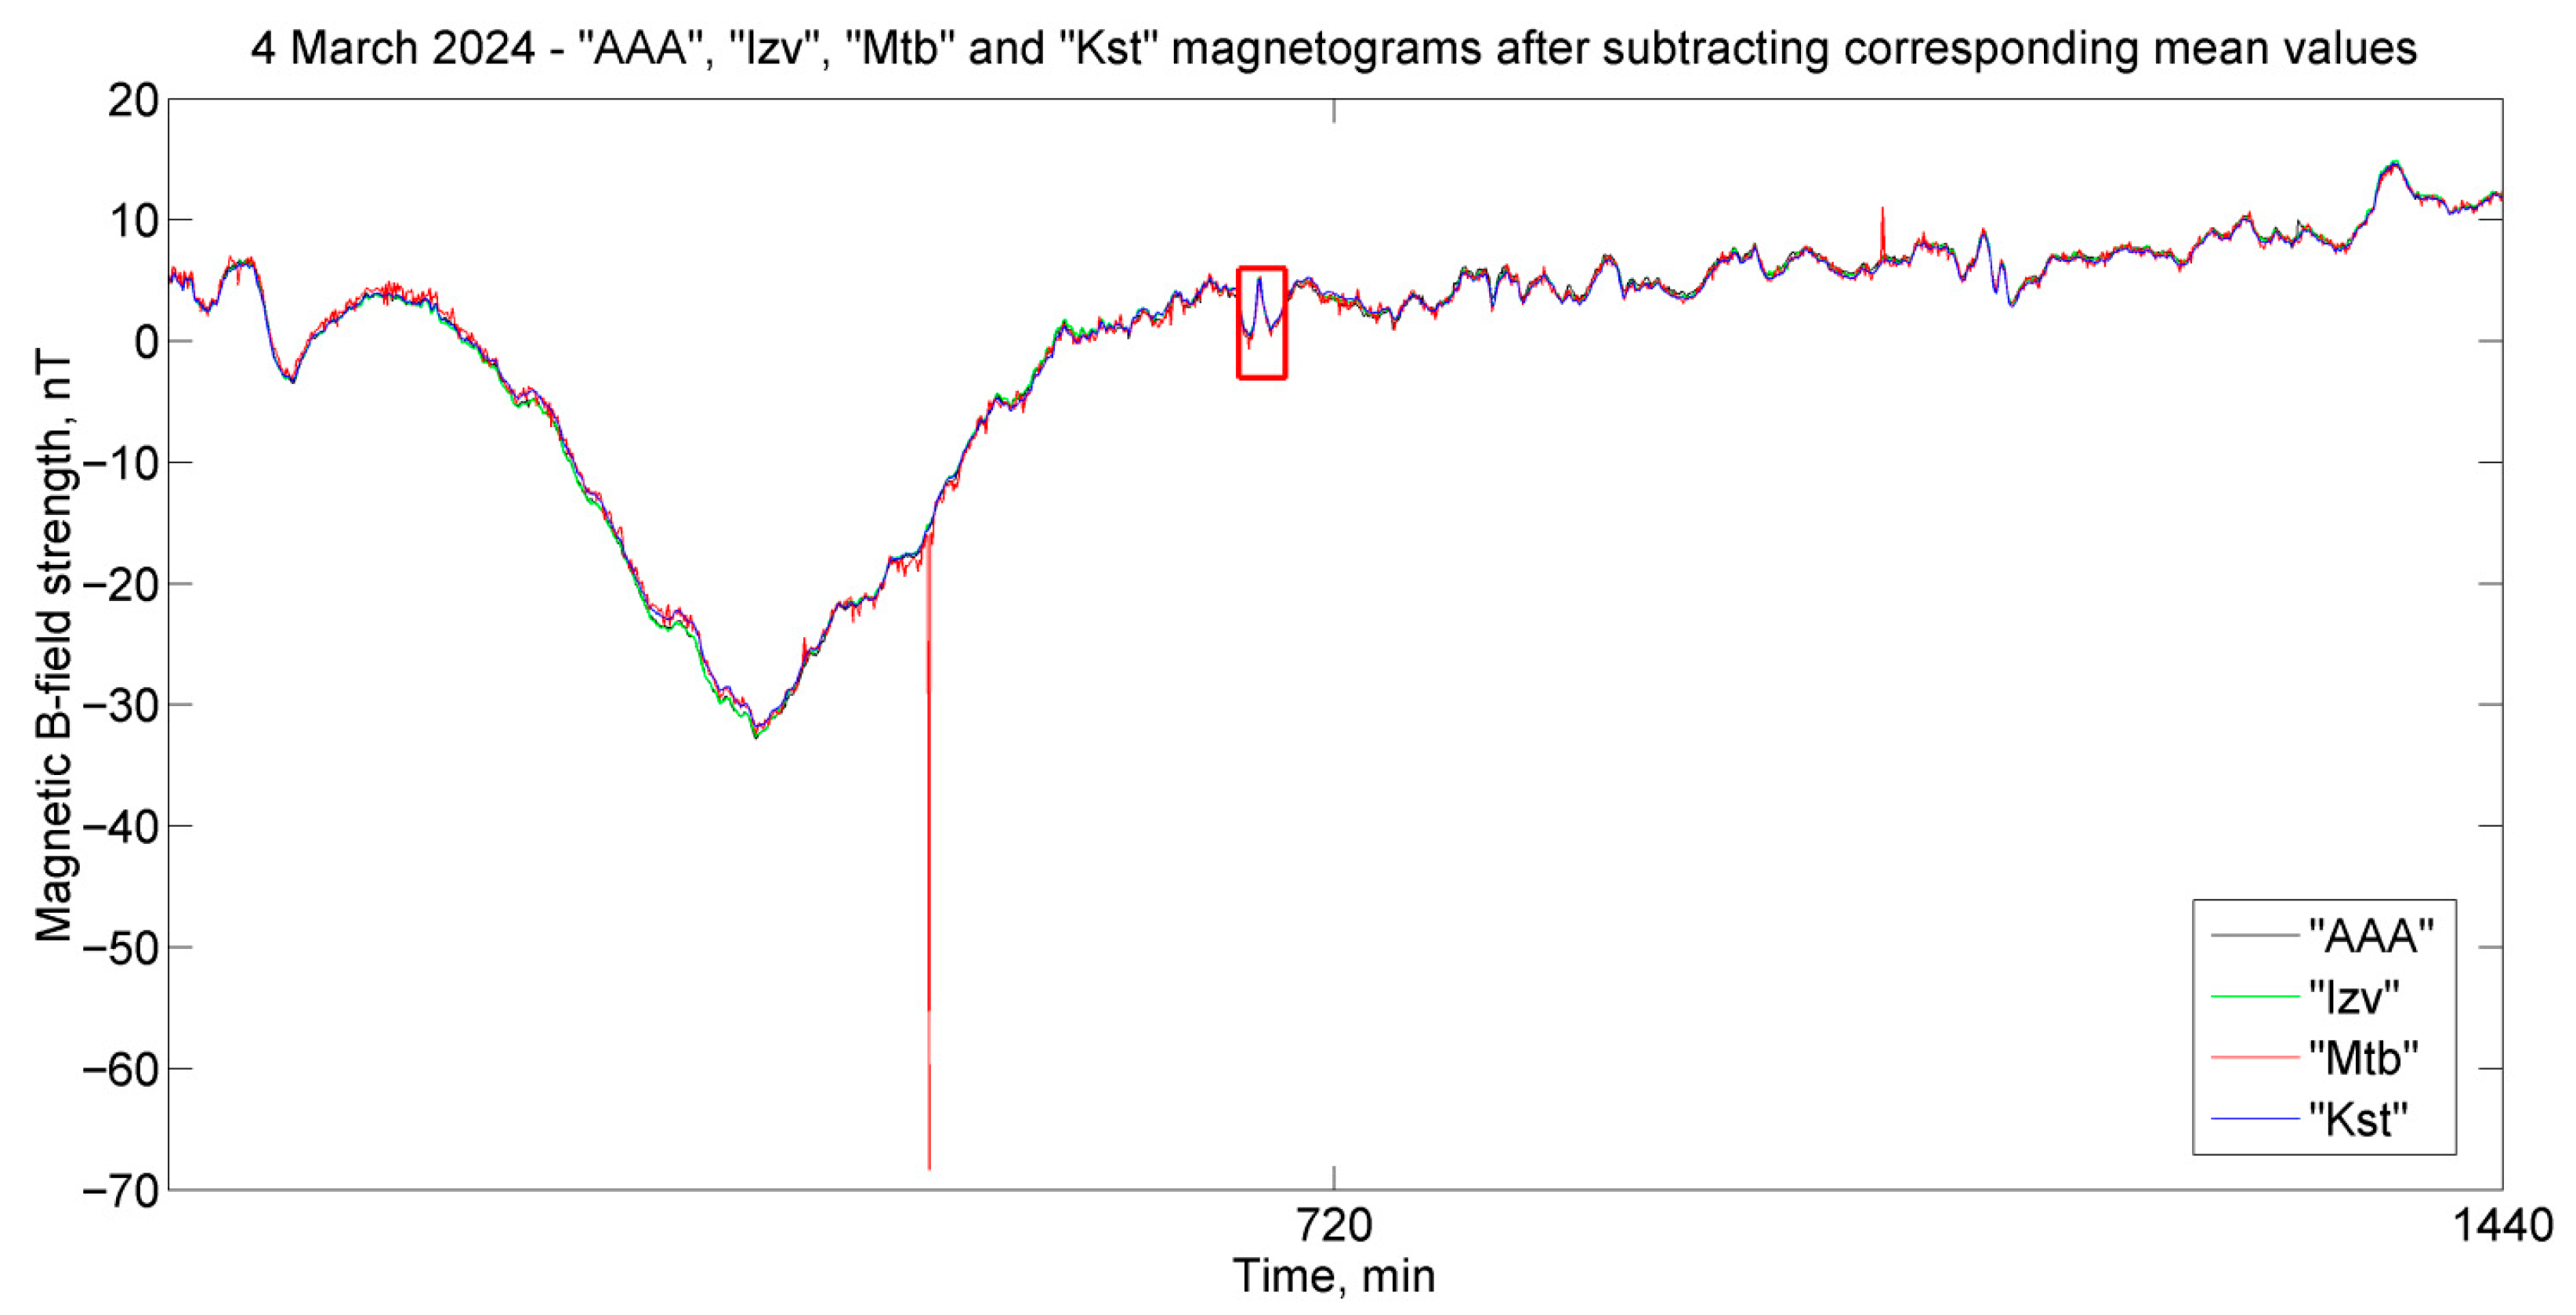
Figure 1 shows magnetograms of magnetic field variations obtained after subtracting the average daily values from each observatory independently. The removal of the daily averages was only carried out to better visualize the interference. This is not necessary for the method to work.
In the record of the four magnetometers on 4 March 2024, there was only one data skip in the record of the “AAA” observatory (99999). In
Figure 1, this number is not shown in order to display the figure proportionally.
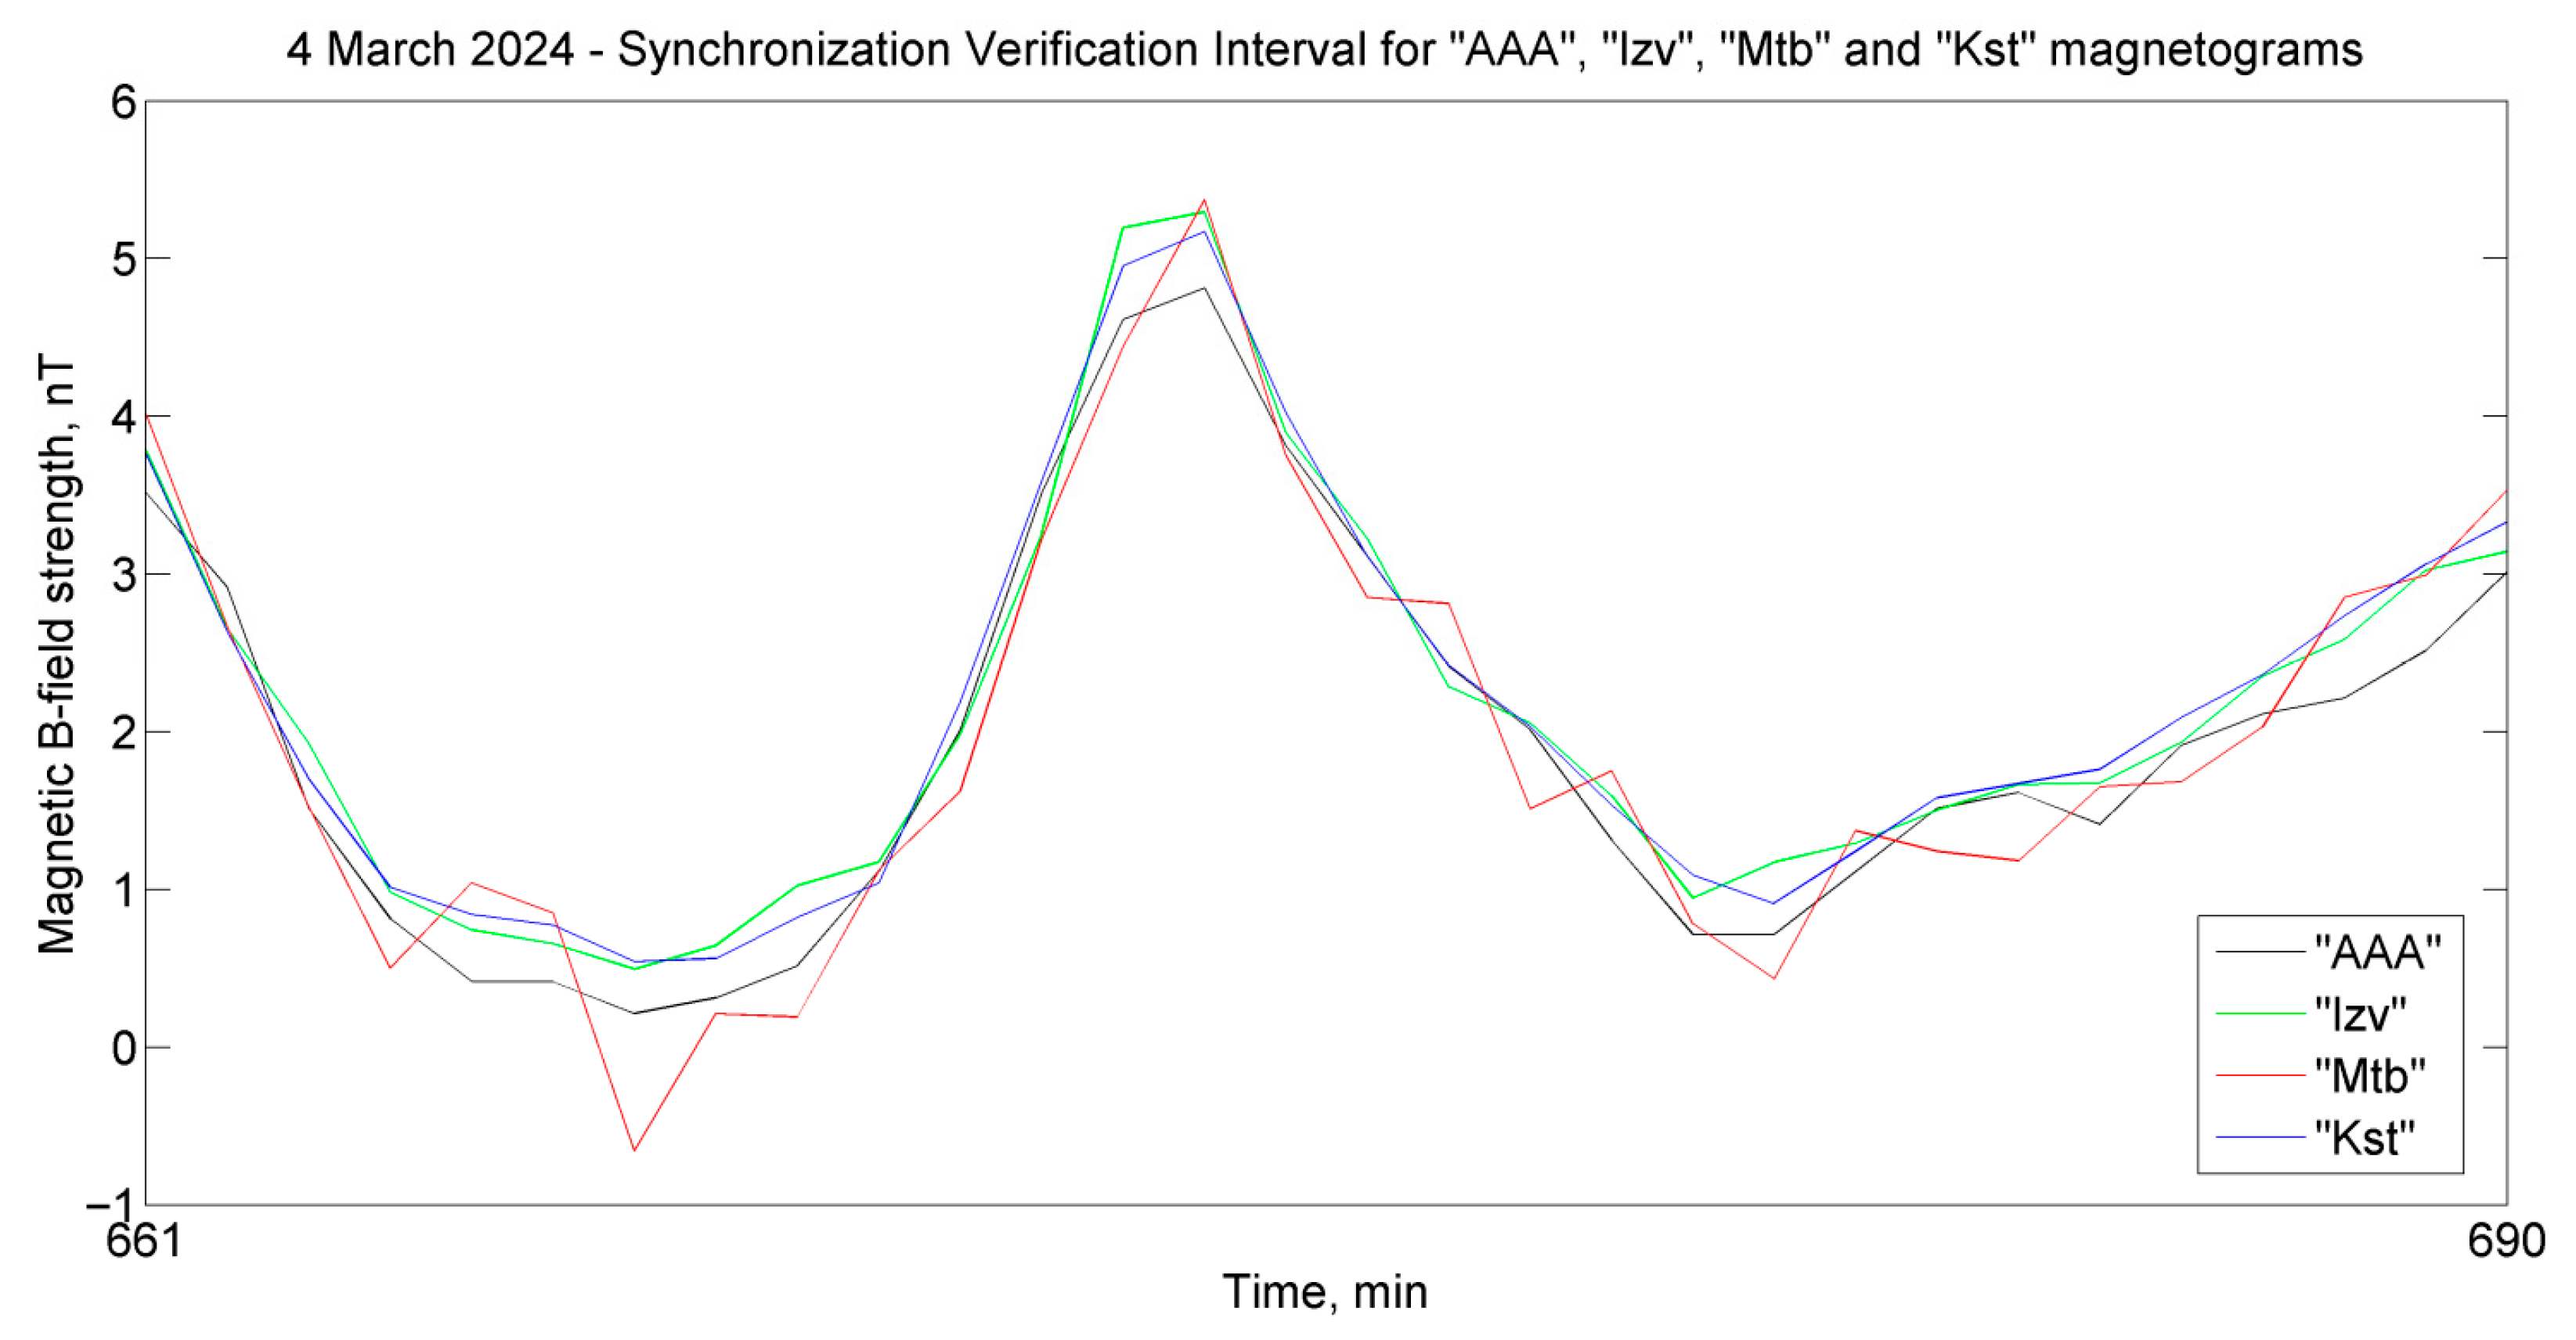
Figure 1 shows that the low-frequency trends in the field on all four magnetograms hardly differ, and the magnetogram of the “Mtb” observatory contains the greatest amount of interference results. It can be assumed that this is due to the fact that this observatory is located near the R43 highway. Although the low-frequency trends in magnetograms hardly visually differ, for the method to work correctly, it is necessary to make sure that the measurements in all observatories are synchronous. This procedure should be performed on a one-time basis before preprocessing the magnetograms. To check the synchronicity of magnetic observatories, it is necessary to select a short-duration section with rapid variations on the magnetograms. In this example, the section of magnetograms from 661 to 690 min was selected, as highlighted in
Figure 1 by the red rectangle shown in
Figure 2.
Compared magnetograms are shifted relative to each other by one time position to the right and left until the highest correlation coefficient is reached. When desynchronization is detected, the magnetograms should be adjusted to the detected time shifts. In [
15], the authors described a methodology for revealing and eliminating desynchronization in the operation of INTERMAGNET magnetic observatories.
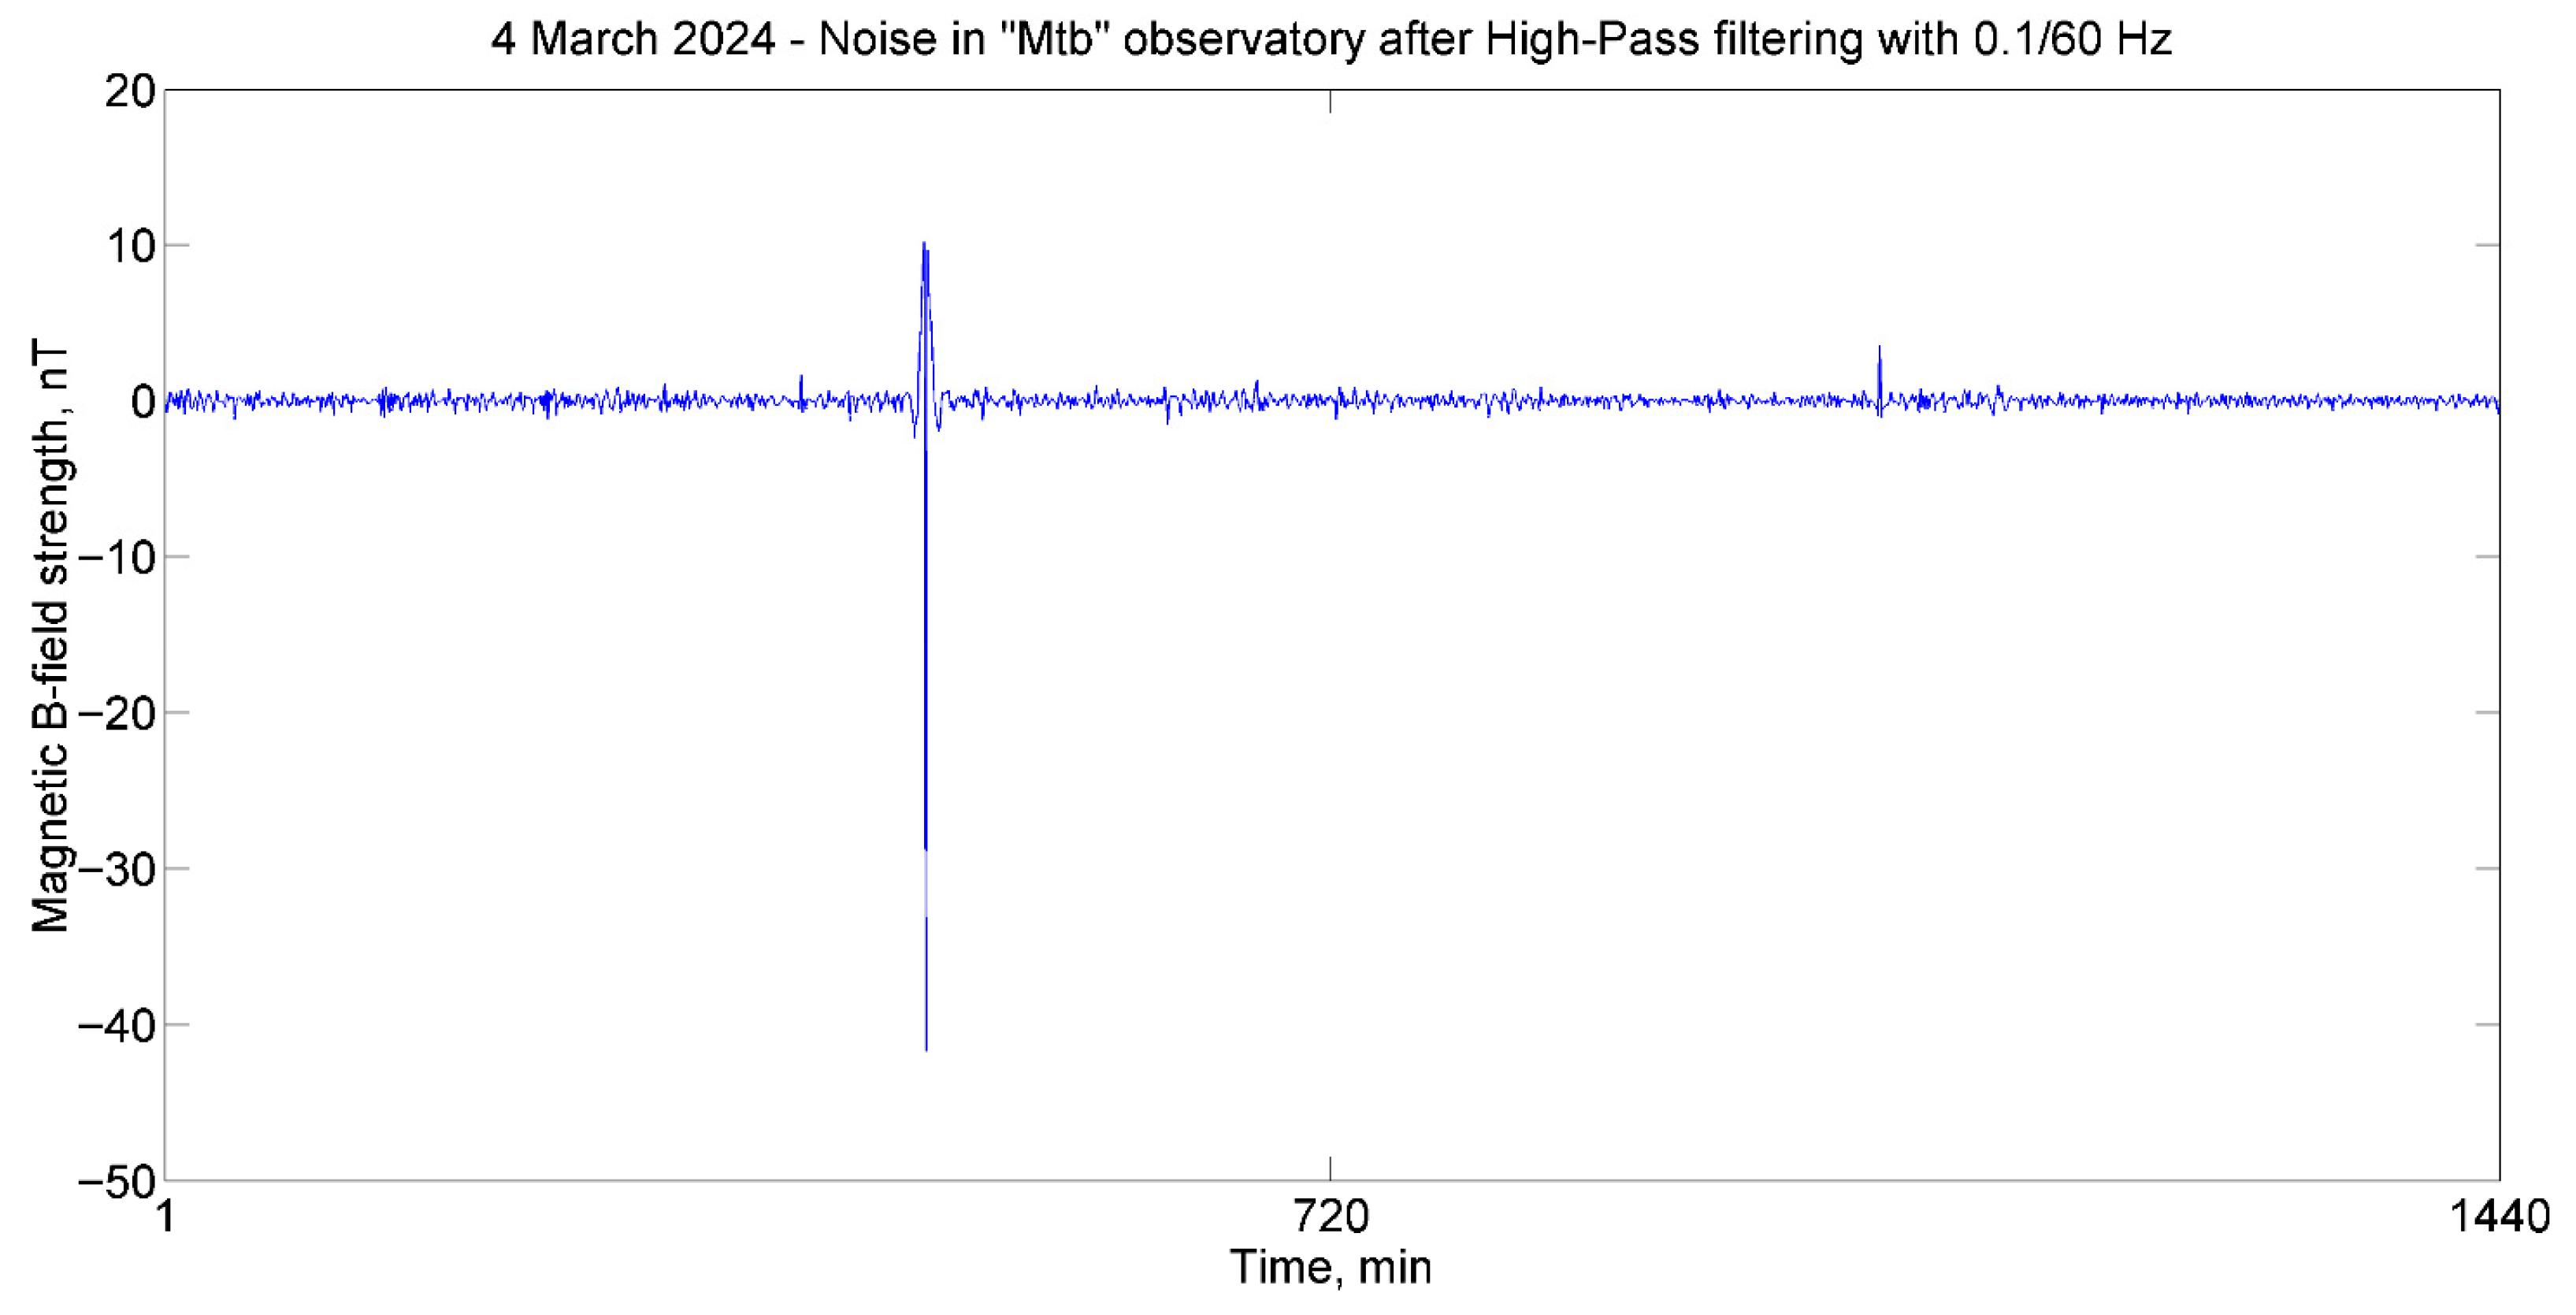
To distinguish spikes and jumps, magnetograms were processed with a high-pass filter. As a filter, the fourth-order Butterworth filter with a cutoff frequency of 1/600 Hz was selected. The result of magnetogram filtering using the “Mtb” observatory as an example is shown in
Figure 3.
As can be seen from
Figure 3, the constant component and slow variations in the magnetic field were filtered out. After filtering, there is noise and a few spikes on the magnetogram. These spikes are likely objects used for eliminating or replacing values during the process of magnetogram cleaning. To distinguish between these spikes, we will determine the standard deviation values of the noise of the measuring devices in order to set the threshold values. As is known [
45], the normal distribution of random variables (noise of the measuring device) assumes that 99.7% of the values will be within ±3 standard deviations. If the threshold for distinguishing spikes is set at ±3 standard deviations, then the threshold should be exceeded (in the absence of interference) by no more than three cases per thousand measurements. An average of
threshold exceedances at random times will be recorded per day (1440 min). The probability of exceeding the threshold in two consecutive measurements
will be negligible. The presence of more than 4 spikes per day will be a sign of qualifying them as interference results.
To calculate the standard deviation of the noise of the measuring device, we calculate it with a sliding window of 200 measurements using a filtered magnetogram. By using a sliding window of 200 measurements through 1440 values, we obtain 1241 values of standard deviations (
Figure 4).
When the sliding window captures samples with interference, the standard deviation values increase significantly until these samples’ values reach the out-of-window interval. In order to find the true value of the standard deviation of the noise of the magnetogram, we apply median filtering on the calculated standard deviation values. To achieve this, we sort the calculated values in ascending order, exclude 30% of the minimum and 30% of the maximum values from the series, and select the median number from the remaining values (
Figure 5).
A variation exceeding the standard deviation () by several times () should be considered the result of interference. In this paper, we show how the results of magnetogram cleaning vary from the levels of the selected threshold of excess (by varying ).
3. Results
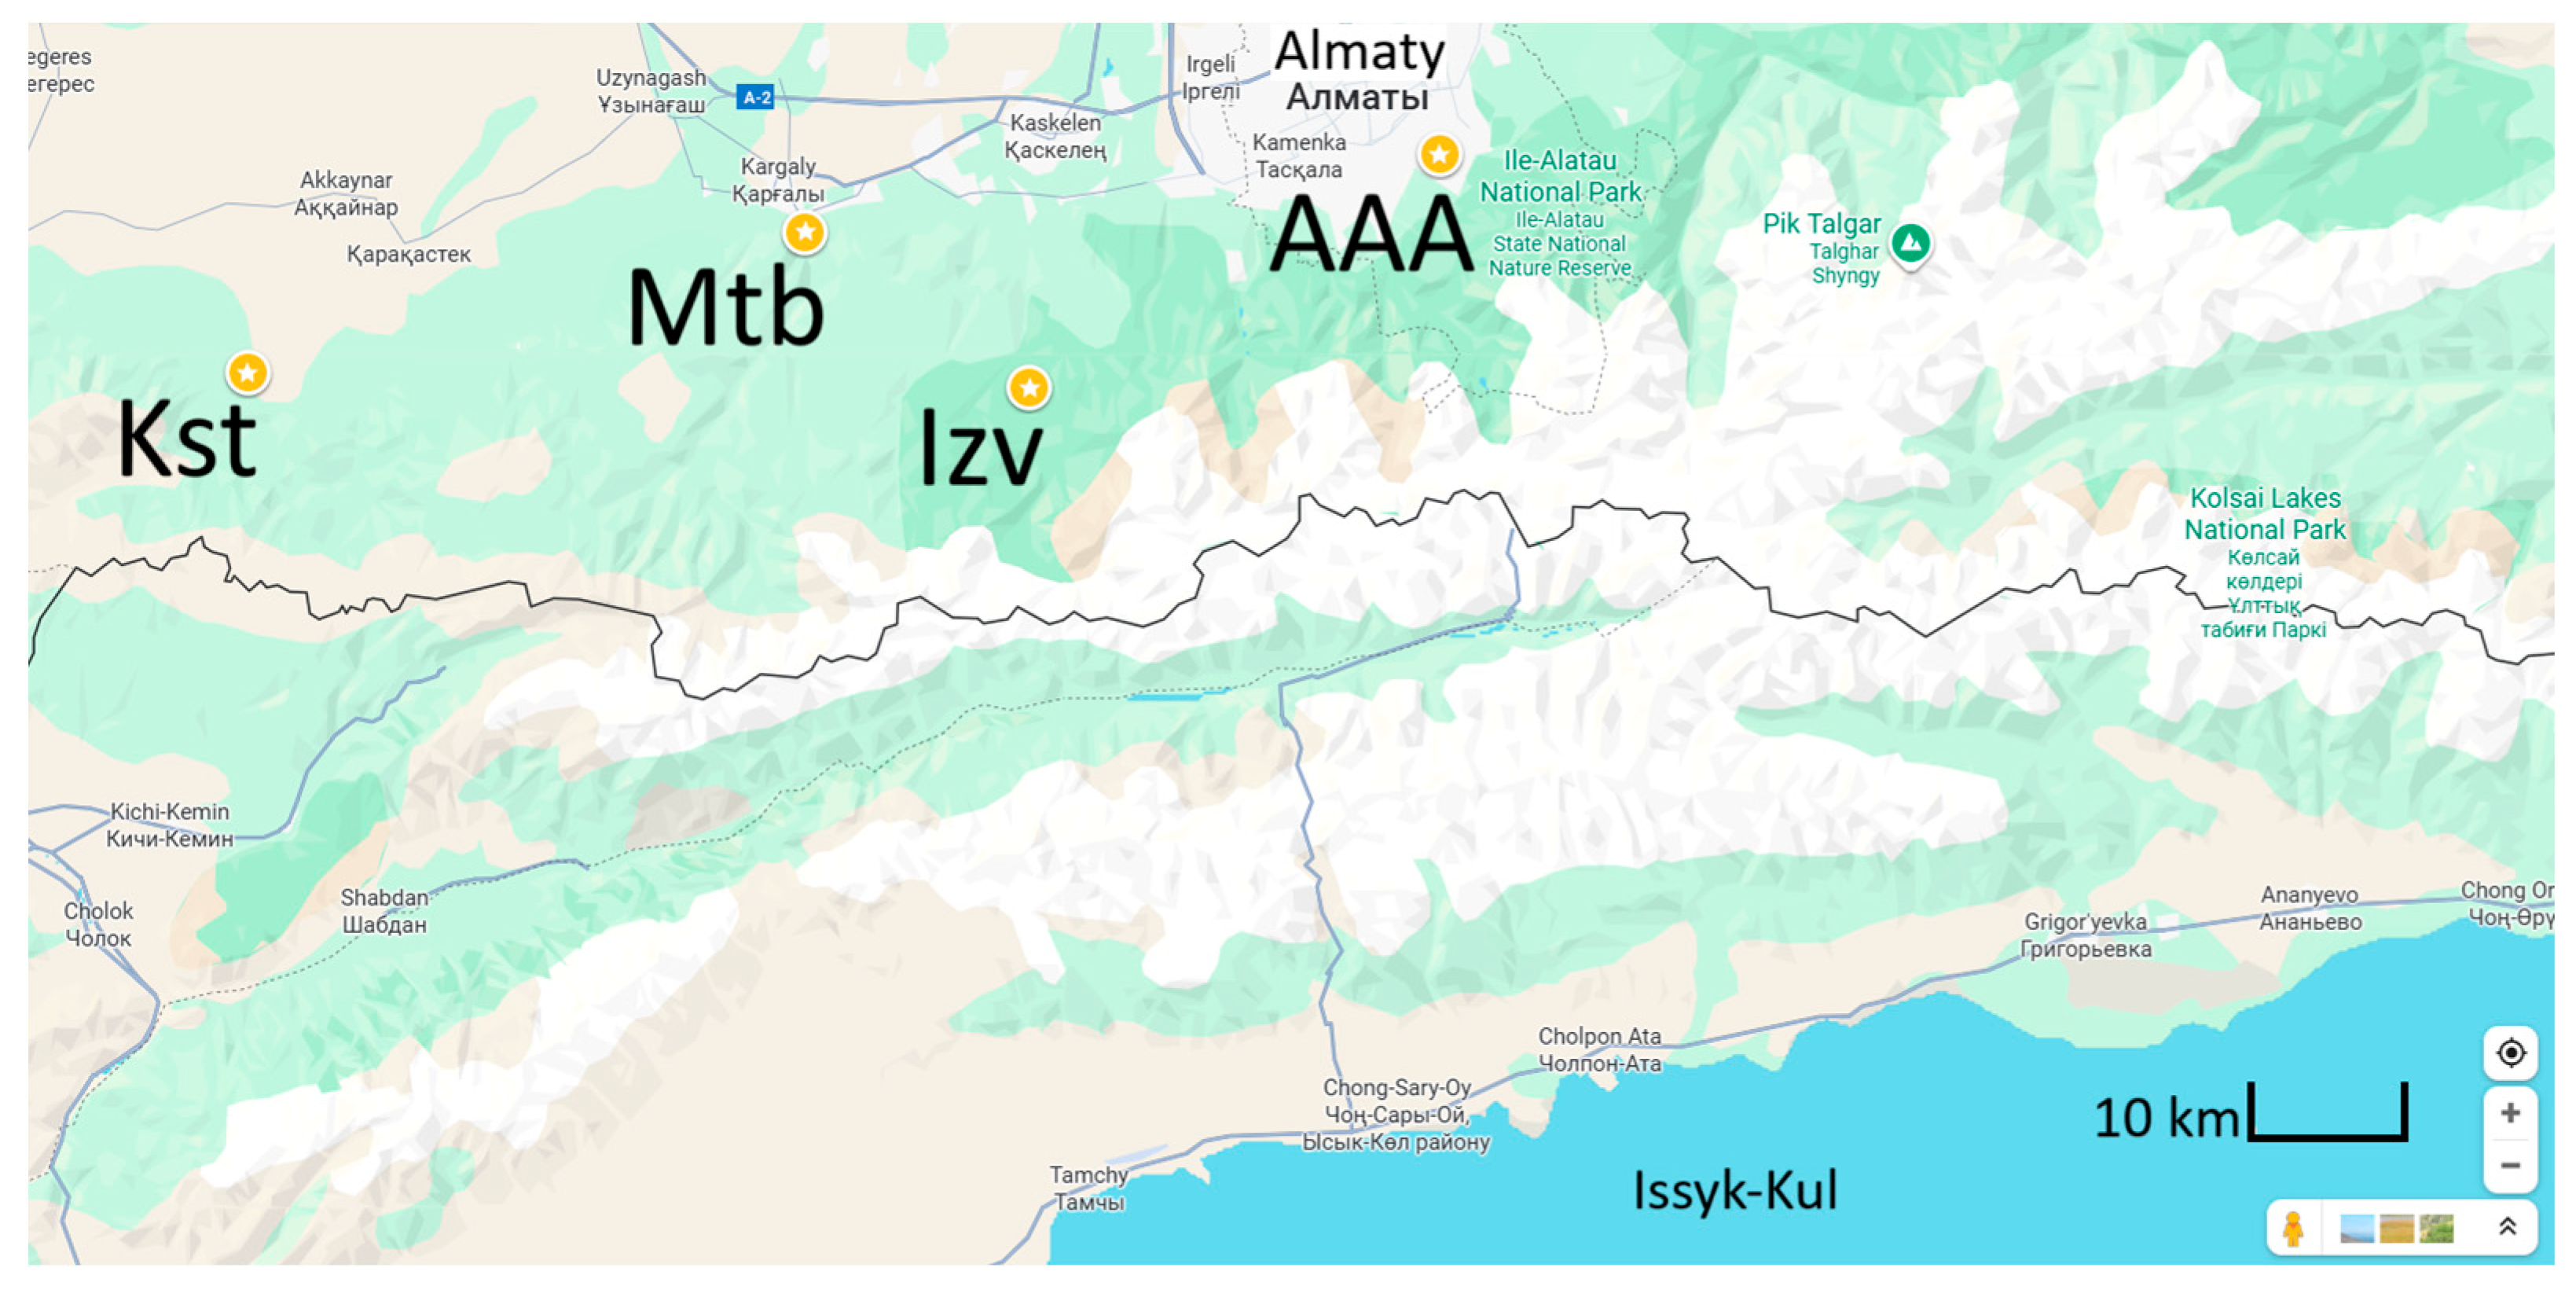
Figure 6 shows the location of magnetometers in space relative to each other, with acceptable distances.
The distances between observatories are as follows:
Verification of the synchronization of observatories based on the results of the correlation analysis is presented in
Table 2.
Mutual correlation coefficients for magnetograms were calculated by shifting them relative to each other in both directions by a 1 min step. After shifting to a 1 min step, the correlation coefficients decreased below 0.9. This confirms that the magnetometers performed measurements synchronously. These results allow us to proceed to the next stage of processing without shifting the magnetograms in time to correct them.
As a result of processing the daily magnetograms of four observatories, the standard deviation values for all instruments involved in the experiments were calculated:
Standard deviation value of noise on “Mtb” = 0.27;
Standard deviation value of noise on “Kst” = 0.11;
Standard deviation value of noise on “Izv” = 0.14;
Standard deviation value of noise on “AAA” = 0.14.
The results obtained are quite close to each other. This is as it should be, because all the observatories used magnetometers of the same model. In the commentary for
Figure 1, the increased noise level of the “Mtb” observatory magnetogram was noted, and here, we see this fact in quantitative terms. This procedure (calculation of the standard deviation), as well as the synchronization verification procedure, is performed once in this method before starting the collective preprocessing of magnetograms.
By setting the individual thresholds at the level of three standard deviations for each magnetic observatory, we will find the sample numbers (times) of measurements that exceed these thresholds (
Table 3).
As follows from the data shown in
Table 3, each observatory recorded from 38 to 55 threshold exceedances per day (the number N in parentheses next to the observatory code in the table header), which significantly exceeds the exceedances associated with noise signal statistics. Signal spikes were recorded in 114 min intervals (about 8% of the measurements of the day), of which 72 measurements (highlighted in red in
Table 3) were recorded only by one of the observatories, that is, 63% of all spikes. In total, 19 spikes were recorded simultaneously by two observatories, 19 by three observatories, and 4 by four observatories simultaneously.
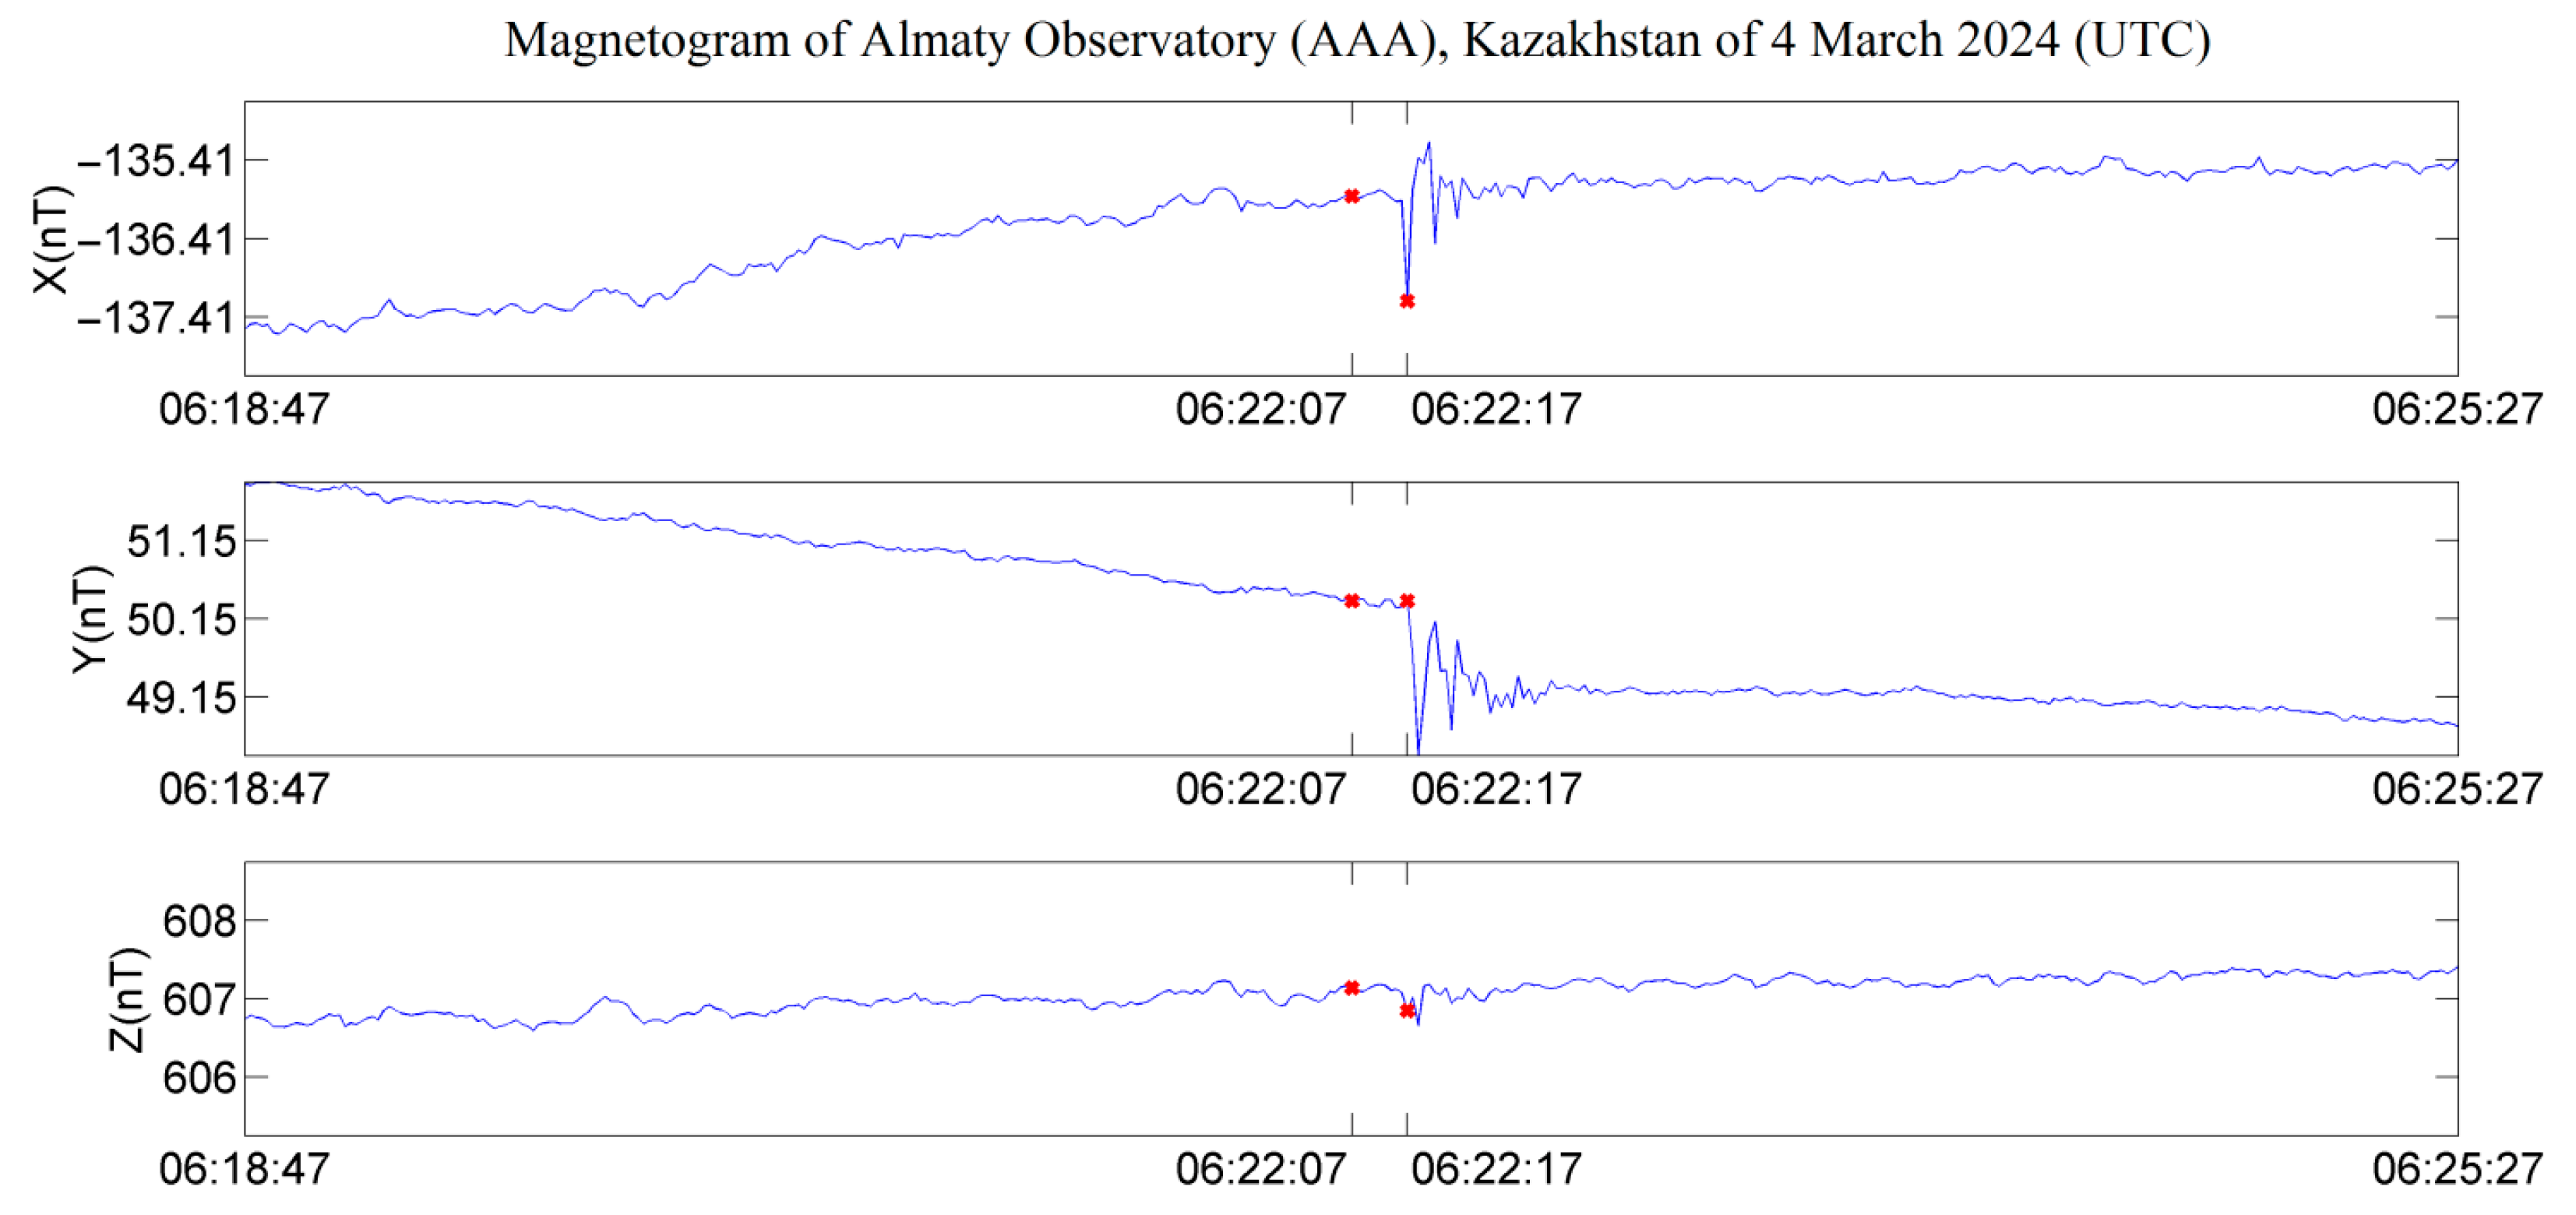
At the same time, none of the observatories registered events related to the earthquake of 4 March 2024, with a magnitude of Mb 5.6 [
44], which occurred 38 km south of the “AAA” observatory.
Figure 7 shows a section of the “AAA” observatory magnetogram with per-second registration of magnetic field components. The red dots indicate the time of the earthquake at the epicenter and the time of earthquake registration by the Almaty city seismic station (383 min UTC).
Variations associated with the earthquake, although it occurred near the magnetic observatory, did not exceed 2 nT on the per-second magnetogram. With per-minute recording, such high-frequency variations are averaged and do not exceed the noise level of the magnetometer.
Variations of three standard deviations are extremely small, and their magnitude is about 0.5 nT. Spikes of such magnitude are visually inconspicuous and are not removed during manual cleaning of magnetograms from spikes. It should be noted that almost 1/3 of these spikes were recorded in parallel by several observatories, which indicates the possibility of distinguishing low-level variations in the case of collective processing of magnetograms of several observatories separated in space.
Let us check the operation of the method after increasing the threshold level for distinguishing spikes to six standard deviations (about 1 nT). Calculation results are shown in
Table 4.
As follows from the data shown in
Table 4, each observatory recorded from 2 to 13 threshold exceedances per day (the number N in parentheses next to the observatory code in the table header), which is significantly less than in the previous case. Signal spikes of more than 1 nT were recorded only in 20 min intervals (about 1.4% of measurements), of which 17 measurements (highlighted in red in
Table 3) were recorded only by one of the observatories, that is, 85% of all spikes. Three threshold exceedances were recorded simultaneously by two observatories. These spikes are clearly visible in both
Figure 1 and
Figure 3.
The events recorded by the two observatories simultaneously are clearly visible on magnetogram 2; they are not interference results. The first two (673 and 674) of these events were used to verify the synchronicity of the magnetograms.
After increasing the threshold to the level of 60 standard deviations (about 10 nT), the number of distinguished spikes sharply decreases (
Table 5).
As follows from
Table 5, spikes common to several observatories are no longer detected at this threshold. Instead, 16 interference results, recorded at a threshold of six standard deviations, were missed. Although the question of the optimal threshold value for detecting interference results may remain a matter of debate, to demonstrate the effectiveness of the described method,
Figure 8 shows the result of magnetograms after removing interference results with a threshold of three standard deviations.
The magnetograms were restored by skipping the samples of the interference results (obtained after eliminating the constant component). It was possible to choose a replacement method with values from three magnetograms that had no interference results. By choosing this method of replacing the corrupted value, it can be assumed that if there was a variation in the magnetic field recorded by all observatories at this moment, then it must also be present in the “cleaned” magnetogram, and if there was no variation, then the noise of various magnetometers will be smoothed out, and the calculated value will be within the natural noise of the measuring device.
We consider the method of interpolation by neighboring values to be less effective, especially if several consecutive measurements are corrupted.
4. Discussion
Currently, the procedures used to remove spikes on magnetograms are performed by employees of magnetic observatories. This not only slows down the process of preparing processed magnetograms, but it can also lead to the removal of spikes mistaken for interference results. If such spikes that occurred simultaneously are deleted in all magnetograms, then the scientific community may not “notice” such events. At the same time, by processing magnetograms in a separate magnetic observatory, the observatory staff does not have confidence during the cleaning of magnetograms.
Although no large-amplitude synchronous spikes were recorded on the day under consideration (4 March 2024), we had previously recorded such spikes [
15] with values of up to 20 nT. Choosing the day of 4 March 2024, we expected to see a magnetic precursor or a magnetic event directly related to the earthquake, the epicenter of which was located near the magnetic observatories. It became obvious that the use of per-minute data to register short-period (pulse, jump-like) precursors is not justified. A common decrease in the magnetic field level before an earthquake, if it was associated with it, would show different levels of decrease in magnetic field intensities, since, according to Equation (2), variations in magnetic field intensities are inversely proportional to the square of the distances to the field sources. Since the distances from different magnetic observatories to the epicenter of the earthquake differed by four or more times, the difference in variations should have been noticeable.
Next, using the proposed method of measuring the standard deviation of noise, we plan to consider the issue of identifying noise-like earthquake precursors on magnetograms.
The filter parameters were empirically selected by us. Strict justification of the choice of filter parameters may become the subject of one of the future studies.
Such collective preprocessing of magnetograms could be efficiently performed in regional data collection centers of the INTERMAGNET observatory network (GINs) and in similar nodes of other networks.
To verify the proposed method, a program was developed that works with daily 1440 min values. The block diagram of the algorithm is shown in
Figure 9.
However, the algorithm can also be used to work with per-second sample values using an arbitrary number of observatories.
The algorithm can also work in real streaming mode since it does not use the previous values during execution.
5. Conclusions
The article demonstrates the possibility of using the method for separating results of interference, affecting magnetic field sensors, from magnetic field variations through the time analysis of recorded signal variations by several magnetic observatories, separated in space, which gives the possibility to improve the quality of magnetograms at a rate close to real time.
To increase the effectiveness of the method, it is desirable that the distance between the magnetic observatories does not allow powerful industrial interference to be detected at several observatories.
In the case of using records of four magnetometers distributed in space, the practical possibility of restoring magnetograms was demonstrated.
It was shown that the method makes it possible to distinguish between weak variations in the Earth’s magnetic field (0.5 nT or less) and, after averaging records of several observatories, to study weak variations in the Earth’s magnetic field.
A method for calculating and monitoring the standard deviation value of the noise of measuring devices of magnetic observatories was proposed. This method is applicable both for periodic control of the condition of measuring devices and for automatically defining threshold values during the process of distinguishing interference results on magnetograms.
