Abstract
Electronic nose technology is attracting attention with its diagnostic applications in the healthcare field. In this study, respiratory samples of individuals with systolic heart failure (HFrEF) were analyzed using an electronic nose device to investigate the diagnostic feasibility for this disease. A total of 275 breath samples were collected from 29 patients and 31 healthy volunteers followed in a cardiology clinic. Classification using support vector machines (SVM) yielded an average accuracy rate of 85.21%. The simplicity of the statistical features used in the classification, combined with the low computational complexity, increases the method’s practicality. This study demonstrates that, unlike existing imaging and laboratory techniques, electronic nose technology can be considered a non-invasive, rapid, and cost-effective alternative for diagnosing heart failure, particularly notable for its potential to contribute to early diagnosis.
1. Introduction
Electronic systems now recognize many odors through electronic noses, which are being developed in sensor technology and the software industry. This technology is a product that facilitates human life in today’s world. These systems can detect the presence and amount of gases in the air through gas sensors integrated into their structure and recognize odors previously introduced to them using artificial intelligence-based algorithms. Notably, the electronic nose, which has gained significant importance in scientific research over the past three decades, has enabled numerous successful studies across various fields, including food science, chemistry, and medicine. In the food field, notably, electronic noses have been used in many studies ranging from determining the freshness of meat [1] and milk [2] to identifying fish species [3] and from controlling the quality of beverages [4] to monitoring fermentation stages [5]. A variety of studies using the electronic nose have been conducted in the chemical industry, for example, to separate different perfumes [6] or determine the efficiency of waste oils used in biodiesel production [7], with success rates of 80–90%.
Although the first system prototypes that imitate the biological olfactory system date back to the early 1980s [8], studies on diagnosing diseases with the electronic nose have especially gained momentum over the last two decades. Some electronic nose studies conducted in the field of health are as follows: In many studies, with a total number of participants in the patient and control groups ranging from 27 to 82, the breaths of asthma patients and control subjects are classified using the electronic nose with an accuracy of 70% to 99% [9]. More than 20 studies have been conducted on the diagnosis of lung cancer using the electronic nose from breath. In those studies, the number of participants (patient-control group) varied between 18 and 229, and classification success rates ranged from 70% to 100% [10]. In addition, many diseases such as prostate [11], breast [12], colon [13], and lung [14] cancers, chronic obstructive pulmonary disease (COPD) [15], kidney diseases [16], diabetes [17], and ulcers [18] have been diagnosed by the electronic nose. A recently published comprehensive review summarizes the current status of electronic nose technology in exhalation-based disease analysis, provides a detailed assessment of the sensor technologies and algorithms used, and discusses the methodological challenges that may be encountered in the future [19]. Furthermore, the diagnosis of heart attack and cardiovascular diseases from patients’ breathing with the electronic nose was also studied by these researchers [20].
Heart failure (HF) is a disease that worsens the quality of life and functional capacity of patients, requires costly hospital procedures, and causes premature death [21]. Currently, the leading underlying cause of HF is coronary artery disease (CAD) [22]. HF is encountered in approximately 1–2% of the adult population in developed countries, and the prevalence of HF increases up to 10% in individuals aged 70 and over [23]. The diagnosis of HF can be difficult, especially in the early stages. Although symptoms may direct a patient to seek medical attention, many HF symptoms are not specific.
Although transthoracic echocardiography (TTE) is the primary diagnostic tool in patients with clinical suspicion, because of its high cost and unavailability at every center, B-type natriuretic peptide (BNP) and the N-terminal prohormone of BNP (NT-proBNP) are the keystone biomarkers used in the diagnosis of HF, which also predict the disease prognosis [24]. The updated European Society of Cardiology (ESC) 2021 Guidelines similarly identify echocardiography and natriuretic peptides as essential tools for diagnosing heart failure but also highlight the limitations of these methods related to accessibility, cost, and comorbidities [25]. These limitations clearly highlight the need for alternative diagnostic approaches that are faster, non-invasive, and cost-effective. The ESC-focused update, published in 2023, expanded on this approach and further emphasized the role of biomarkers and advanced imaging modalities in the diagnosis of heart failure [26]. However, the high cost and infrastructure requirements of these modalities remain limitations in clinical practice. Cut-off points of NT-proBNP used in many studies have higher negative predictive values in the differentiation between individuals with and without. To distinguish among them, especially from individuals without HF [27], natriuretic peptide levels increase with age in patients with renal dysfunction and may be lower in obese individuals [28]. Since NT-proBNP and BNP can also be elevated in noncardiac causes such as atrial fibrillation, anemia, sepsis, and chronic kidney disease, they have relatively low diagnostic accuracy in patients with these diagnoses [29]. Additional diagnostic methods are necessary due to accessibility issues, higher costs, and limitations in specific patient groups when using existing diagnostic modalities.
Mechanisms such as the activation of the renin-angiotensin system and increased symptomatic activity in heart failure induce the release of neuroendocrine mediators, oxidative stress markers, and cytokines while also promoting fibrous and remodeling processes. Heart failure is a complex process involving many biochemical mediators beyond mechanical pump dysfunction [30]. Therefore, dozens of known biochemical mediators increase in the blood during heart failure. Some of these increased markers may also be released by inhalation.
Voss et al. classified the skin odors of 27 decompensated heart failure (DHF) patients, 25 compensated heart failure (CHF) patients, and 28 control group (CON) participants with the electronic nose device. The authors achieved 85% accuracy rates with the CHF-CON classification and 76% accuracy rates with the DHF-CON classification [31]. However, studies provide limited details on the standardization of the sampling system (e.g., bag/flow/valve), the composition and selectivity of the sensor array, and the feature extraction and training–testing procedures, leaving uncertainty regarding the reproducibility and generalizability of the findings. Again, the same working group stated that they used the electronic nose sensing device to detect odors and flavors of the breaths of 13 DHF, 16 CHF, and 13 CON patients and made differential diagnoses among DHF-CHF, CHF-CON, and DHF-CON patients with accuracy rates of 91%, 97%, and 100%, respectively. However, the group did not specify the type of electronic nose sensor used, the number of sensors in each device, which sensor was used, which features of the device were utilized, or how much of the data was used for training and testing. The group also noted that essential factors such as air, skin, and surface temperature, drugs, comorbidities, and nutrition were not considered [32]. However, the methodological comparability of reported accuracies is limited because sensor array composition and selectivity, sampling transfer conditions, and classification/cross-validation details are not reported. In a larger-scale study, Finamore et al. used a BIONOTE brand commercial electronic nose device in 89 CHF and 103 COPD patients and 117 healthy controls. The authors did not provide details of any selection criteria or classification algorithm and reported success rates of 81% and 69% for the differential classification between CHF-CON and CHF-COPD, respectively [33]. However, the lack of detailed information on the selection criteria and algorithms used, as well as the lack of reporting of the sensor array’s technical specifications, complicates the comparability and independent verification of the results of such studies. These shortcomings highlight the importance of methodological transparency and reporting of technical details in electronic nose research.
The current study, however, takes these limitations into account and explicitly reports the detailed characteristics of the sensor array (see Table 1), the sampling conditions used, and the classification algorithms. Furthermore, the selection of simple statistical features (see Table 2) and the use of SVM-based classification increase the practicality and reproducibility of the method.
This study aimed to diagnose heart failure with high accuracy using an electronic nose from a person’s breath; this is significantly faster than existing non-invasive methods. Unlike existing diagnostic methods, which are time-consuming, costly, and invasive, the proposed approach offers practicality and reproducibility through simple statistical features, a standard bag sampling method, and SVM-based classification. While most previous research has focused on acute conditions or respiratory comorbidities, this study, applied to patients with chronic HFrEF, aims to make an early and original contribution to the literature.
2. Methodology
2.1. Subjects and Study Design
In this study, 29 patients with compensated heart failure (CHF, mean age 63.4 ± 8.1 years) and 31 patients without heart failure (CON, mean age 59.7 ± 8.7 years) who received optimal medical treatment at the Hitit University Faculty of Medicine Cardiology Outpatient Clinic were included.
Inclusion Criteria: The definition of systolic heart failure (HFrEF), in accordance with the 2016 European Society of Cardiology Guidelines, includes patients with symptoms and signs of heart failure, a left ventricular ejection fraction (EF) <40% on transthoracic echocardiography, and elevated natriuretic peptide levels [34]. Accordingly, patients with NYHA I–III functional capacity who were not hospitalized for HFrEF and whose medical treatment had not changed in the previous three months were also included in the study.
Exclusion Criteria: This study excluded HF patients with preserved ejection fraction (HFpEF) and mid-range (HFmrEF) ejection fraction, those with active infection, known malignancy, obstructive or restrictive lung disease requiring inhaler therapy, severe anemia, or kidney failure requiring dialysis, and smokers. Hospitalization due to worsening heart failure within three months was accepted as an exclusion criterion. HFpEF and HFmrEF patients were excluded from the study to objectify the findings due to the difficulties in treatment, the mechanism of formation, and the diagnostic challenges.
The New York Heart Association (NYHA) classification [35] is a widely used clinical tool that measures the functional capacity of the heart. The evaluation of the NYHA class was based on the time the patient’s exhaled breath sample was taken. As the HF patient group, patients with NYHA Class 1-2-3 heart failure were included in the study. The NYHA Class 4 HF patients were excluded from the study because it would not be suitable for them to provide breath samples.
Patients participating in this study who experienced sudden deterioration in clinical findings are considered to have decompensated heart failure. The stable and good health status of these patients may deteriorate due to conditions such as intervening vascular occlusion, infection, lung problems, anemia, and arrhythmia (sudden increases in blood pressure). Hospitalization may be required for these patients. Because these are secondary factors that affect the clinical picture of the patients and may cause difficulties in interpreting and standardizing exhaled respiratory parameters, these patients were excluded from the study. Additionally, diabetes mellitus (DM) was not an exclusion criterion in the study. This was because the proportion of individuals with diabetes was similar in both groups (HF: 10/29; control: 5/31; p = 0.056, see Table 3). This was intended to prevent systematic bias from distorting the effect of DM on classification performance.
Echocardiography was performed on all participants using a GE Vingmed Ultrasound AS device (Horten, Norway) with a 3.5 MHz transducer. The patients were examined in the left lateral decubitus position in accordance with the standards of the American Society of Echocardiography. Left ventricular EF was measured by using biplane Simpson’s and Teicholz’s methods.
Venous blood samples were collected in the morning after an overnight fast for 12 h. Routine serum biomarkers such as glucose, urea, creatinine, C-reactive protein, total cholesterol, high-density lipoprotein (HDL), low-density lipoprotein (LDL), triglyceride, and complete blood count were calculated by standard laboratory methods (Beckmann Coulter aU5800 Autoanalyser, Beckmann Coulter Inc, Brea, CA, USA). Low-density lipoprotein (LDL) was calculated using the Friedewald formula [LDL (mg/dL) = TC − (HDL + TG/5)] [36].
Statistical analyses were performed by using IBM SPSS Statistics for Windows, Version 23.0 (IBM Corp., Armonk, NY, USA). The variables that were distributed normally were presented as mean ± standard deviation, whereas the variables that were not normally distributed were presented as median (25th–75th interquartile range). For normally distributed variables, comparisons between the two independent groups were performed using the Student’s t-test. Categorical variables were compared using the χ2 test or Fisher’s exact test as appropriate.
Ethics committee approval for the study was obtained from Hitit University (Ethics No. 2019–48 and Declaration of Helsinki). Scientific research study permission was obtained from Hitit University Erol Olçok Hospital. An information form was presented to all patients and healthy volunteers. Their consent was obtained with a signature. To ensure data confidentiality, all data were anonymized and stored in a secure environment accessible only to the research team, and the identity of the participants was kept entirely confidential.
2.2. Hardware of the Electronic Nose
The electronic nose hardware used in the authors’ previous work was also designed and produced by the authors [20]. Although only some of the sensors can detect volatile organic compounds in exhaled breath, the hardware features a wide range of sensors to provide a broad perspective (Table 1). The sensors used in this study were factory-calibrated using the standard calibration provided by the manufacturer. Because the study design focused on relative differences in sensor performance, no additional individual calibration procedures were implemented.
Figure 1 presents the sensor block of the electronic nose system, which constitutes the core component responsible for capturing and transducing volatile compounds from breath samples.
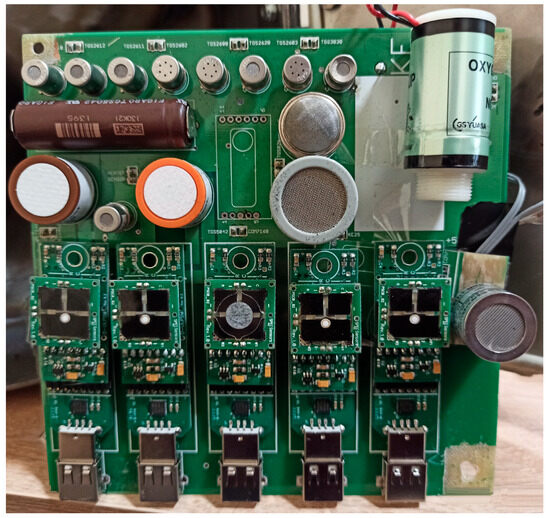
Figure 1.
Sensor block of the electronic nose system used for breath analysis.
While the data from the sensors with analog output were transferred to the PC environment using an interface created with National Instruments’ (NI) data-acquisition system (NI USB-6210 DAQ card, National Instruments, Austin, TX, USA), the data from the sensors with digital output were transferred to the PC environment via a USB hub. The data from both interfaces were subjected to the desired signal-processing techniques using software written in the LabVIEW program (LabVIEW 2016, 64-bit, National Instruments, Austin, TX, USA). The hardware and software, prepared to manage cleaning and ventilation processes autonomously, collect data by taking a number of samples that can be considered valid in terms of quantity and duration, taking into account the sensors’ response times.
An air transfer pump was used in front of the sensor box to deliver the exhaled breath from plastic bags to the sensor box with a transfer rate of 20 L/min.

Table 1.
Sensors in the sensor array (ppm: parts per million, LEL: lower explosive limits).
Table 1.
Sensors in the sensor array (ppm: parts per million, LEL: lower explosive limits).
| TARGET GASES | Alcohol | Ammonia (NH3) | Carbon Dioxide (CO2) | Carbon Monoxide (CO) | Chlorofluorocarbons | Ethanol (C2H5OH) | Hydrogen (H2) | Hydrogen Sulfide (H2S) | Isobutane (C4H10) | Methane (CH4) | Methanethiol (CH4S) | Nitrogen Dioxide (NO2) | Oxygen (O) | Ozone (O3) | Propane (C3H8) | Solvent Vapors | Sulfur Dioxide (SO2) | Toluene (C7H8) | Trimethylamine(C2H9N) | Humidity | |
|---|---|---|---|---|---|---|---|---|---|---|---|---|---|---|---|---|---|---|---|---|---|
| SENSORS | |||||||||||||||||||||
| Sensor Model | Measurement Range | ||||||||||||||||||||
| Spec Sensors DGS 968-039 | 0–20 ppm | X | |||||||||||||||||||
| Spec Sensors DGS 968-036 | 0–10 ppm | X | |||||||||||||||||||
| Spec Sensors DGS 968-034 | 0–1000 ppm | X | |||||||||||||||||||
| Spec Sensors DGS 968-038 | 0–20 ppm | X | |||||||||||||||||||
| Spec Sensors DGS 968-037 | 0–10 ppm | X | |||||||||||||||||||
| Figaro TGS-2610 | 500–10,000 ppm | X | X | X | X | ||||||||||||||||
| Figaro TGS-2612 | 1–25% LEL | X | X | X | |||||||||||||||||
| Figaro TGS-2611 | 500–10,000 ppm | X | X | X | X | ||||||||||||||||
| Figaro TGS-2602 | 1–10 ppm | X | X | X | X | X | |||||||||||||||
| Figaro TGS-2600 | 1–30 ppm | X | X | X | X | X | |||||||||||||||
| Figaro TGS-2620 | 50–5000 ppm | X | X | X | X | X | X | ||||||||||||||
| Figaro TGS-2603 | 1–10 ppm | X | X | ||||||||||||||||||
| Figaro TGS-3830 | 5–100 ppm | X | |||||||||||||||||||
| Figaro TGS-821 | 10–5000 ppm | X | |||||||||||||||||||
| Figaro TGS-832 | 1000–10,000 ppm | X | |||||||||||||||||||
| Figaro KE-25 | 0–100% O | X | |||||||||||||||||||
| Sensortech INIR-CD-5% | 0–5% CO2 | X | |||||||||||||||||||
| Figaro TGS-2444 | 10–100 ppm | X | |||||||||||||||||||
| Sensirion SHT15 | 0–100% RH and −40 to +120 °C | X |
2.3. Collection of Exhaled Breath and the Signal Acquisition Process
The process of collecting breath samples from participants, which lasted three months in total, was conducted in the same location to prevent any changes in the ambient air. To eliminate the possible effects of anything participants had eaten or drunk on their breath, breath samples were taken from the participants at the end of 12 h when they did not use drugs or eat or drink anything but water. Breath samples were taken between 8:00 and 10:00 a.m. under ambient conditions of 24–25 °C temperature and 60–70% humidity.
Disposable 10 L sterile bags were used for breath sample collection; sterile disposable nozzles were used for blowing. Participants were asked to blow into the bag until it was full but not pressurized. By using a one-way air-permeable valve at the entrance of the bags, the breath filled in the bag was prevented from escaping. The breath in the bag was immediately transferred to the sensor box of the electronic nose system by the air pump after it was taken. Although the breath in the bag was transmitted to the sensor box in approximately 30 s, data recording was maintained for a total of 60 s with a 1000-samples-per-second sampling rate in case of delayed sensor reactions. At the end of this period, the sensor box was ventilated with ambient air again, allowing the sensor values to return to their reference values.
Data from 5 of the sensors were transferred to the computer via the USB port. Data from the other 14 sensors were converted to digital data via the National Instruments USB-6210 DAQ card and transferred to the computer. The software required to record sensor data was prepared via the LabVIEW program. The collected data served as the basis for feature extraction and classification algorithms developed in the MATLAB R2017b (MathWorks, Natick, MA, USA). The general view of the system is presented in Figure 2.
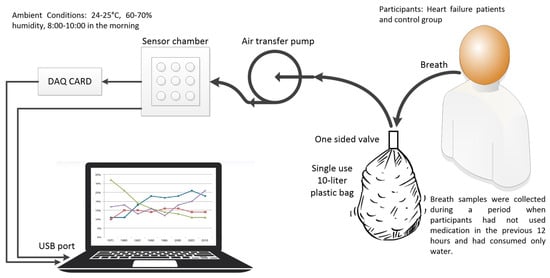
Figure 2.
Block diagram of the data collecting system.
In this study, multiple breath samples (three to six) were collected from each participant, consistent with previous studies in this area [37,38]. One hundred sixty-four breath samples were collected from 29 CHF (heart failure) patients, and 111 were collected from 31 healthy individuals. The example-based approach, widely used in the literature [31,33], was employed to separate the training and test data.
In the experimental setup, data obtained from 19 different sensors were used. The data were prepared for the classification process without any special calibration procedure. Additionally, basic statistical analyses were conducted to enhance the reliability of the data. Within the scope of these analyses, outliers were checked, data distribution was examined, and the conformity of the data to normal distribution was evaluated by calculating the mean and standard deviation.
2.4. Feature Extraction, Feature Selection, and Classification Procedures
In recent years, pattern recognition and machine learning methods have been used in many disciplines. In the present study, breath data samples recorded by the electronic nose system were analyzed using the seven statistical features listed in Table 2, which were extracted from the signals obtained by the electronic nose sensors. Afterward, we applied the sequential forward feature selection procedure on the training dataset to obtain the most discriminative feature combination, which achieves the best CA on the validation set for classifying systolic heart failure disease. Finally, according to the effective features, we conducted the testing procedure. Figure 3 shows a flowchart of the classification process in the proposed electronic nose system. The diagram illustrates the main steps, including dataset partitioning, feature extraction and selection, classifier training, and performance evaluation.
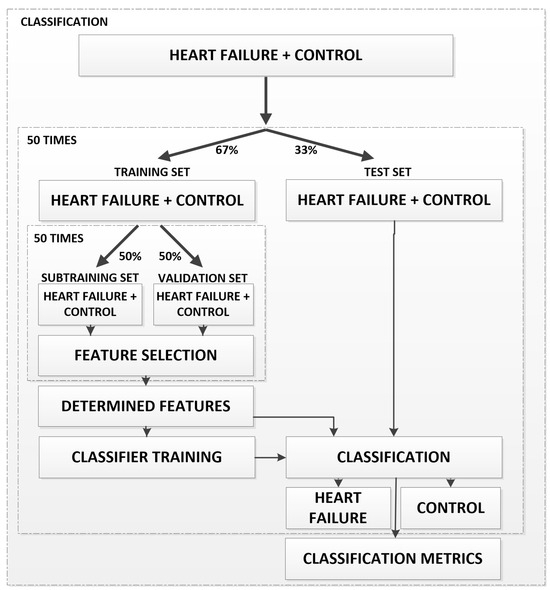
Figure 3.
Flowchart of the classification process in the proposed electronic nose system.
During the data preprocessing phase, outliers were checked, distributional characteristics were examined, and the data were evaluated for normal distribution by calculating mean and standard deviation values. Because the features are normalized statistical parameters derived from sensor signals, no additional scaling step was applied.
Table 2.
Extracted features.
Table 2.
Extracted features.
| Feature | Mathematical Equation |
|---|---|
| Sum of derivatives (SoD): The sum of derivatives is used to detect sudden changes or trends in sensor signals [39]. | |
| Root mean square (R): Root mean square measures the energy level of a signal and is often used in fields such as vibration analysis, acoustic signal processing, and electrical signals [40]. | |
| Kurtosis (K): Kurtosis is a statistical measure used to assess the extreme values of data. It is widely used mainly in anomaly detection and distribution analysis studies [41]. | |
| Median (M): The median is a robust attribute that reflects the central tendency of the data and is not affected by extreme values. This is often emphasized in statistical analyses [42]. | |
| Skewness (S): Skewness is an essential property for measuring the asymmetric distribution of data. It is widely used in financial, biomedical, and engineering applications [43]. | |
| Variance (V): Variance measures the overall variability of a data set. It is a fundamental property in the fields of machine learning, signal processing, and statistics [44]. | |
| Variance of the Second Derivative (VoSD): The variance of the second derivative is used to detect trends and sudden changes in signals. It is vital in time series and vibration analysis studies [45]. |
In this study, data obtained from 19 different sensors were used. A total of 133 features were obtained by applying seven different feature extraction methods to these data. To optimize classification performance, a choice had to be made among these features. During feature selection, the features that were used more than half of the time were determined as the selected features among all the features. This method was applied to identify the most significant features of the model and to enhance its classification performance.
In the present study, the k-nearest neighbor (k-NN), support vector machine (SVM), and neural network (NN) classifiers, which are widely used by the machine learning community, were tested. In this section, only the properties considered by the classifier algorithms are introduced, rather than their detailed descriptions, as they are well known in the related field.
The k-NN is a useful and effective classifier that successfully applies to both binary and multi-class classification datasets. In the classification phase, the k-NN requires all the features of training trials to estimate the label of a test trial on the set of S-labeled samples and predefined C classes. This classifier calculates the distances between the features of the testing trial and all the features of training trials to find its nearest neighbors. It considers a majority vote to estimate the class of a testing trial according to the k-nearest neighbor(s). It is worth mentioning that the performance of a k-NN algorithm depends on the distance metric and the value of k. In our study, we employed the Euclidean distance metric and a random subsampling cross-validation technique to determine the optimal value of k that maximizes classification performance.
The SVM is a well-known and widely used classification algorithm employed to analyze data in classification and regression problems. An SVM performs classification tasks by constructing the optimal hyperplane in a multidimensional space and maximizing the margin. We utilized the most commonly used radial basis function because the number of hyperparameters for this kernel is smaller than that of other kernels. The sigma and the regularization parameter R provide a means to adjust the hyperplane, resulting in improved training performance. In the present study, while the regularization parameter was set to R = 1, the most appropriate sigma parameter was searched during the training phase, within an interval of 0.1 to 2.5, with a step size of 0.1.
The NN is one of the most used classifiers in classification problems. In this study, a feedforward training process consisting of multiple layers was employed. While each subsequent layer has a connection to the previous layer, the first layer receives connections from the network input, and the final layer produces the network’s output. This output is also known as a class label. In this study, we employed a single hidden layer and searched for the optimal number of neurons, ranging from 1 to 100, during the training stage.
In this study, a classifier performance assessment was performed by calculating the classification accuracy (CA), sensitivity (recall) (SE), and specificity (SP), precision (PR), and F1 score (F1) metrics. The CA was mathematically obtained by dividing the correctly classified breath trials by the total number of considered trials [Equation (1)]. The mathematical equations of SE, SP, PR, and F1 are given in Equations (2), (3), (4) and (5), respectively:
where CCBT represents the number of correctly classified trials and TCT represents the total number of considered trials. TP, TN, FP, and FN indicate true positives, true negatives, false positives, and false negatives, respectively.
A total of 50 classifications were made, with different training–test clusters randomly selected each time (67% training, 33% test). In each classification, 50 different learning processes were performed with 50–50% random selections of different sub-training-validation clusters in the training cluster. If the classification process had been performed only once or several times, the result that the same classification performance could be obtained when a different data set was matched would be doubtful. However, as a result of the classification being made 50 times with different training–test clusters, the result was obtained by averaging the achievements in these classifications, thereby increasing the reliability of the classification process.
3. Results
3.1. Laboratory Measurements and Demographic Variables of the Participants
Twenty-nine patients in the HF and thirty-one individuals in the control group were included in the study. Demographic data, laboratory values of all participants, and their statistical significance are given in Table 3. The mean age of both groups was comparable. While the mean age was 63.4 ± 8.1 years in the HF group, it was 59.7 ± 8.7 years in the control group (p > 0.05). Although the number of patients with hypertension (HT) and diabetes mellitus (DM) was higher in the HF group, no statistically significant intergroup difference was observed. The number of patients diagnosed with DL (dyslipidemia) was higher in the HF group. Since active smoking was used as an exclusion criterion, no participants in either group were smokers. The mean EF% values in the HF and control groups were 59.69 ± 1.7 and, 31.64 ± 6.8 respectively, with no statistically significant intergroup difference (p < 0.001).
Table 3.
Clinical and demographic characteristics of HFrEF patients and controls.
Table 3.
Clinical and demographic characteristics of HFrEF patients and controls.
| Heart Failure | Control | p | |
|---|---|---|---|
| Patient n | 29 | 31 | |
| Age (years) | 63.4 ± 8.1 | 59.7 ± 8.7 | 0.099 |
| Woman/Total | 15/29 | 11/31 | 0.43 |
| HT | 19/29 | 15/31 | 0.203 |
| DM | 10/29 | 5/31 | 0.056 |
| DL | 15/29 | 4/31 | <0.001 |
| Smoking | 0 | 0 | |
| EF (%) | 59.69 ± 1.7 | 31.64 ± 6.8 | <0.001 |
| MY (Grade) (mild + moderate) | 13/29 | 2/31 | <0.001 |
| HB [g/dL] | 13.46 ± 1.3 | 13.65 ± 1.4 | 0.605 |
| HCT [%] | 41.23 ± 3.6 | 41.67 ± 3.7 | 0.831 |
| Glucose [mg/dL] | 125 ± 38 | 102.24 ± 26 | 0.015 |
| Urea [mg/dL] | 32.4 ± 9.5 | 43.8 ± 18 | 0.004 |
| Creatinine [mg/dL] | 0.77 ± 0.17 | 0.87 ± 0.16 | 0.021 |
| Hb | 13.63 ± 1.4 | 13.46 ± 1.3 | 0.64 |
| Hct | 41.67 ± 3.7 | 41.25 ± 4.07 | 0.67 |
| T. Cholesterol [mg/dL] | 182.55 ± 57 | 170.69 ± 33 | 0.49 |
| LDL [mg/dL] | 113 ± 42 | 92.92 ± 32 | 0.120 |
| HDL [mg/dL] | 43.7 ± 18 | 42.92 ± 8.6 | 0.97 |
| TG [mg/dL] | 136.34 ± 45 | 163.05 ± 65 | 0.28 |
| CRP [mg/L] | 4.54 ± 1.1 | 5.36 ± 2.4 | 0.49 |
| Medication | |||
| Antiplatelet-ASA | 17/29 | 6/31 | 0.003 |
| Clopidogrel | 8/29 | 2/31 | 0.038 |
| OAK | 8/29 | 2/31 | 0.038 |
| β-blockers (%) | 29/29 | 15/31 | <0.0001 |
| ACE + ARB (%) | 19/29 | 11/31 | 0.021 |
| NDH-KKB | 3/29 | 8/31 | 0.117 |
| Statin (%) | 14/29 | 5/29 | 0.011 |
| Loopdiuretics (%) | 23/29 | 9/31 | <0.0001 |
| Sprinanolactone (%) | 19/29 | 0/31 | <0.0001 |
| OAD | 7/29 | 6/31 | 0.756 |
| Insulin | 5/29 | 1/31 | 0.096 |
Abbreviations: HT, hypertension; DM, diabetes mellitus; DL, dyslipidemia; EF, ejection fraction; MV, mitral valve regurgitation; Hb, hemoglobin; Hct, hematocrit; LDL, low-density lipoprotein cholesterol; HDL, high-density lipoprotein cholesterol; TG, triglycerides; CRP, C-reactive protein; ASA, acetylsalicylic acid (aspirin); OAK, oral anticoagulant; ACE, angiotensin-converting enzyme inhibitors; ARB, angiotensin receptor blockers; NDH-CCB, non-dihydropyridine calcium channel blockers; OAD, oral antidiabetic drugs. Values are presented as mean ±SD or number (%). Statistical comparisons were performed between patients with HFrEF (n = 29) and control subjects (n = 31).
None of the patients had advanced-stage mitral regurgitation. However, the number of patients with mild and moderate mitral regurgitation (MR) was statistically significantly higher in the HF group (H = 13/29) than in the control 2/31, and (p < 0.001) without any statistically significant intergroup difference. Statistically significant differences were found for mean values of blood glucose (HF = 125 ± 38 mg/dL; control = 102.24 ± 26 mg/dL; p = 0.015), urea (HF = 43.8 ± 18 mg/dL; control = 32.4 ± 9.5 mg/dL; p = 0.004), and creatinine (0.87 ± 0.16 mL/dg; control = 0.77 ± 0.17 mg/dL; p = 0.021).
While no significant difference was observed between groups for the use of NDH-KKB (non-didropyridine-calcium channel blocker) and OAD (oral antidiabetic drug), a statistically significantly higher number of patients in the HF group were using antiplatelet-ASA (acetylsalicylic acid), clopidogrel, OAK (oral anticoagulant), β-blockers, ACE + ARB (angiotensin converting inhibitor + angiotensin receptor blocker), statin, loop diuretics, and spironolactone.
3.2. Electronic Nose Scores
In this study, patients’ breath samples were collected in sterile bags and then transferred to the electronic nose system, where they were transmitted to the sensor chamber of the device for analysis. Data from 164 breaths of 29 CHF patients and 111 breaths from 31 healthy individuals were collected and recorded for 60 s by the electronic nose, which utilized 19 gas sensors, at a rate of 1000 data points per second and transferred to the computer. Figure 4 shows the raw response curves obtained from the TGS-2602 sensor for breath samples from two patients with HFrEF and two healthy control participants. The curves were recorded at a sampling rate of 1000 samples per second over a 60 s measurement period, resulting in a total of 60,000 data points each. The graph clearly demonstrates that the TGS-2602 sensor responds differently to breath samples from different individuals.
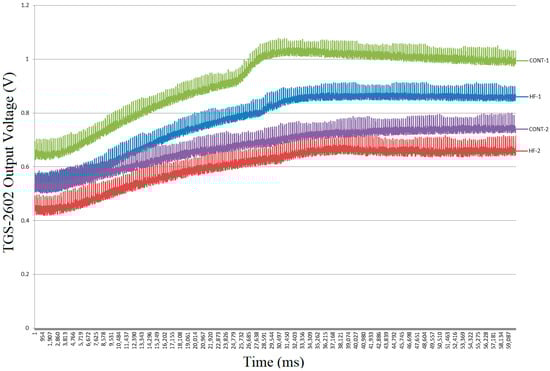
Figure 4.
Raw exhaled breath TGS-2602 sensor signals from two HF patients and two control subjects (60 s).
Thus, a 3D matrix of size 275 × 60,000 × 19 was generated at the end of the data collection period. A total of 133 features were obtained by applying seven feature extraction processes to the data from 19 sensors in 50 different sub-training processes of a classification, as shown in Figure 5.
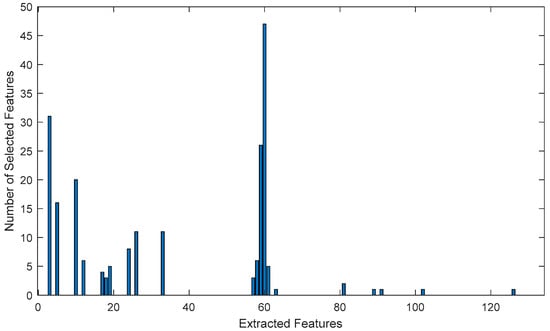
Figure 5.
Graph of the number of selected features for one classification cycle.
As can be seen in the graph in Figure 5, feature number 60, which is the most frequently used one, is obtained as a result of the median method applied to the Figaro TGS-2602 gas sensor data, followed by the second most frequently used feature, which is a result of the kurtosis method applied to the SpecSensors DGS 968-039 (SPEC Sensors, LLC, Newark, CA, USA) gas sensor data. The third most frequently used feature was obtained using the kurtosis method applied to Figaro TGS-2602 (Figaro Engineering Inc., Osaka, Japan) gas sensor data, specifically number 59.
The total selection number of all selected features in each sub-learning of 50 classification operations with different training–test sets is given in Figure 6. As a feature selection method, features that are used more than half as often as the most frequently used feature are selected. This method is then applied to optimize the classification performance of the model. While Figure 5 presents the graph of selected features for a single classification operation, Figure 6 shows the total number of selected features across 50 classification operations.
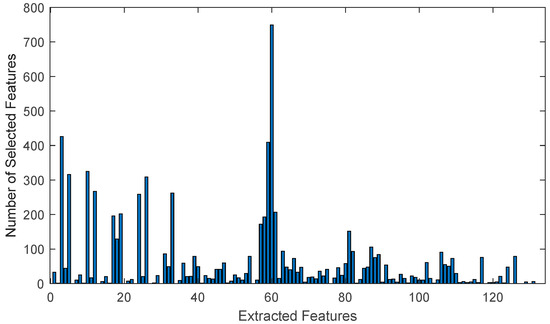
Figure 6.
Graph of the number of selected features for 50 classification cycles.
As shown in the graph, the feature graph selected in only one classification operation, as depicted in Figure 5, remained unchanged throughout 50 classifications with different training and test sets. This proves the accuracy and consistency of the method used for feature selection.
The distribution graph of the HF and control group breath data, plotted according to the two most commonly used feature axes, is shown in Figure 7.
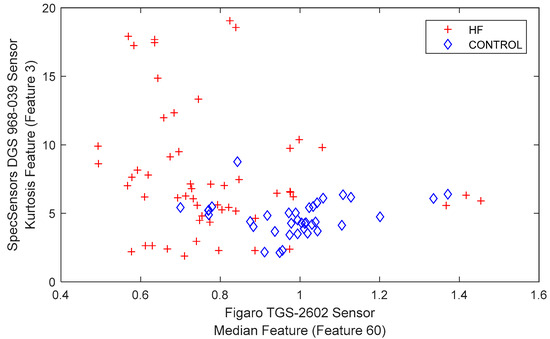
Figure 7.
Representation of HF and the control group.
The neural network model used in this study is a feedforward neural network created with the fitnet function of MATLAB. In the model, seven features selected for classification are represented in the input layer. While 10 neurons utilize the log-sigmoid (logsig) activation function in the hidden layer, the purelin (linear activation) function is employed in the output layer. The output layer produces the classification result (a single class label).
The neural network is trained with MATLAB’s default training algorithm, Levenberg–Marquardt (trainlm). This algorithm is preferred because it provides fast and effective optimization. While the neurons in the input layer represent the features selected for classification, the hidden layer enhances the model’s learning capacity. The output layer represents the classification result.
The average classification performance, sensitivity, and specificity obtained using SVM, NN, and k-NN classification algorithms with these selected features are presented in Table 4, along with their standard deviations. In addition, the average error matrix (confusion matrix) calculated for the SVM classifier, which is the most successful classifier, is presented in Table 5.
Table 4.
Classification results of the HF versus the control group. In addition, for the most successful classifier (SVM), the error matrix (confusion matrix) calculated based on only the test set samples is presented in Table 5.
Table 5.
Average confusion matrix for SVM.
To visualize the overall classification performance of the study, the average ROC (receiver operating characteristic) curve for the SVM classifier that provided the highest accuracy was generated. This curve demonstrates the classifier’s ability to distinguish between positive and negative groups based on results from 50 different training–test splits. As seen in Figure 8, the curve generally follows a path near the upper left corner, indicating the model’s high discrimination. The area under the curve (AUC) value is approximately 0.89, supporting the model’s strong classification performance.
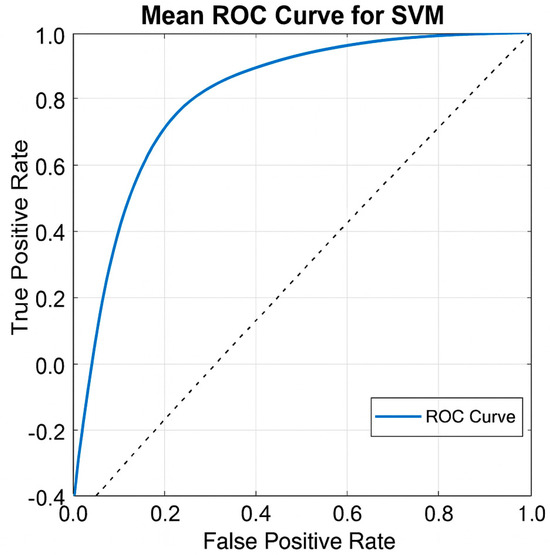
Figure 8.
Average ROC curve of SVM classifier. AUC ≈ 0.89.
4. Discussion
The breath samples of HFrEF patients and control group participants were accurately separated using an electronic nose. HFrEF is not only a condition characterized by a decrease in myocardial contraction; rather, it is a mechanical-neuro-hormonal syndrome that involves the adrenergic system, the renin-angiotensin aldosterone system, oxidative mechanisms, the inflammatory process, and cardiac remodeling [30]. For this reason, every HFrEF patient has more or less interacted with these systems. The main difference between the two groups in this study was possibly a component involved in the complex process mentioned above and exhaled through the respiratory tract. Due to the design of our study, the mediator that made this difference was not investigated; however, this research may be the subject of another study using gas chromatography.
Echocardiography is mainly used in the clinical diagnosis and classification of heart failure. Markers such as BNP and NT-ProBNP are also used both to aid diagnosis and as prognostic indicators [34]. When the disease occurs, early diagnosis will undoubtedly be beneficial in HFrEF, as it is in all diseases. Within this framework, the present work addresses the use of an alternative diagnostic tool to electrocardiography (ECG) and biochemical tests.
The accuracy obtained in this study (85.21%) is similar to the results reported in previous studies using electronic nose technology for the diagnosis of cardiac diseases. Witt et al. distinguished between heart failure and control groups with 97% accuracy using breath samples, and Tozlu et al. distinguished between myocardial infarction and both healthy individuals and those with coronary artery disease with approximately 97% accuracy [20,32]. Finamore et al. achieved 81% accuracy in distinguishing CHF from healthy individuals and 69% accuracy in distinguishing CHF from COPD [33]. While these studies focused on acute ischemic conditions or respiratory comorbidities, the current study examined chronic HFrEF with a simpler feature set, standard bag sampling, and SVM-based classification. While differences in cohort and outcome limit direct numerical comparisons, the performance achieved is consistent with the ranges reported in the literature. Furthermore, echocardiography and natriuretic peptides remain the gold standards for diagnosis; however, their use is affected by factors such as cost, time, and comorbidities. In contrast, the electronic nose approach stands out as a rapid, non-invasive, and low-complexity alternative.
Only patients with HFrEF were included in this study. However, the cardiac contractile functions of HFpEF patients were normal; there was an increase in left ventricular end-diastolic pressure (LVEDP) as a result of serious impairment in diastolic function. Therefore, since the etiologies and treatment algorithms of HFrEF differ from those of HFpEF, this study only included HFrEF patients to avoid complications in interpreting the results.
In this study, patients with heart failure who had a stable course for the last three months were preferred. Due to additional factors such as intervening infection, ischemia, volume load, and severe anemia, decompensation develops in HF patients. These factors themselves will mask HF-specific differences in respiratory samples independently of HF and also complicate their interpretation. Therefore, the difference between DHF and CHF in the studies of Voss et al. is due to this factor, which is more significant than the difference between DHF and CON.
To provide a more precise comparison with previous studies, the basic methodological features and results of electronic nose applications in cardiac diseases are summarized in Table 6.
Table 6.
Comparison of recent electronic-nose studies in cardiac disease diagnosis.
Support Vector Machine (SVM) was used as the base classifier due to its robustness to high-dimensional data and relatively small sample sizes, a common scenario in breath analysis research. A 67–33% split between training and test data provides a balanced approach that strikes a balance between adequate training and unbiased evaluation. Similar ratios have been reported in previous cardiac e-nose studies; for example, ref. [20] used a 66–34% split. Furthermore, the standard deviation and 95% confidence intervals of the classification accuracy were reported, supporting the statistical reliability and reproducibility of the findings.
In this study, the training and test datasets were separated on a per-sample basis. Multiple breath samples collected from each individual were mixed and randomly distributed across the training and test sets. This approach is a frequently used method in the literature. However, including all samples from the same individual in the same set could increase the generalization capacity of the model. This distinction was not made in this study. This was considered a significant limitation, and comparative analyses using a per-sample method are planned for future studies.
With feature selection, the data was made suitable for classification algorithms, and the noise effect was indirectly reduced. However, direct noise reduction or normalization techniques were not employed in this study, and such methods could enhance accuracy in future studies.
In the study, a sample-based approach was employed for the separation of training and test data. Fifty different random classification operations were performed to mitigate biases that may arise from random selection, and the averages of the results were reported. In future studies, the generalizability of the results will be evaluated by comparing the current approach with the person-based separation methodology.
In this study, breath samples were collected in the morning, after a 12 h fast and drug-free period, using disposable bags/nozzles, with temperature and humidity conditions maintained at constant levels to minimize potential variations in participants’ breathing profiles. However, to further clarify the distinction between disease markers and drug effects, it would be beneficial to collect pre-treatment breath samples and create a database in this area in the future.
The electronic nose system used in this study focused on heart failure diagnosis through breath analysis, and a detailed evaluation of sensor performance (e.g., calibration, sensitivity, and selectivity) was outside the scope of the study. However, the sensitivity and selectivity of the sensors are critical elements that can directly affect the overall performance of the electronic nose system. In this context, a detailed consideration of the calibration procedures, sensitivities, and selectivities of the sensors in future studies has the potential to further increase the accuracy and reliability of the system.
This study represents a significant step forward in this field and aims to contribute to advancements in the use of electronic nose systems in medical diagnosis.
In this study, the effects of sensor aging were not directly addressed. However, the high accuracy rates achieved by the classification model indicate that these effects do not significantly affect the classification performance. However, it is thought that future studies examining the effects of sensor aging on classification results in more detail would be helpful. In the literature, it has been reported that sensor drift and aging can affect the long-term performance and classification reliability of electronic nose systems [46]. Therefore, it is essential to consider these methodological limitations in future studies.
Additionally, the cost, durability, and long-term use of the device were beyond the scope of this study. A detailed examination of the practical advantages, limitations, and potential advantages of the electronic nose device over traditional diagnostic methods in clinical applications represents an important area of research for future studies. Such studies will provide a more comprehensive picture of the device’s applicability and long-term effects in healthcare settings. In this context, the most recent research indicates that electronic nose technology is also being evaluated for the diagnosis of acute and critical clinical conditions, such as sepsis [47], revealing that the technology’s range of applications is not limited to cardiovascular diseases but has broader clinical potential.
The main limitation of this study is that it was designed as a single-center cross-sectional trial with a small sample size. Another limitation is that, since gas chromatography was not used, the biochemical products in the exhaled samples from which the differences in reaction degrees of the biosensors between the groups originated could not be identified. Differences in medical treatments between the HFrEF and CON groups may also have influenced the results due to the nature of the diseases. Although all exhaled breath samples were obtained in the morning from fasting patients who had not taken any medication, the possibility of drug effects cannot be completely excluded. Additionally, multiple samples from the same individual were randomly distributed across training and test sets; the lack of individual-based discrimination has been considered one of the methodological limitations of the study. Since it is challenging to work with HFrEF patients who do not use drugs, and it would be unethical to discontinue a patient’s drug treatment for a specific period of time, no alternative solution has been possible in studies with this design. Moreover, although the rates of diabetes (DM) were similar in the patient and control groups (34.5% and 16.1%, respectively), the potential impact of DM, which has been reported in the literature to affect exhaled composition, on the classification results cannot be entirely excluded.
Furthermore, the collection of breath samples from patients was initiated 1.5 years after the purchase of the gas sensors and continued for approximately three months. It is anticipated that higher classification performances will be achieved in future studies using similar standards as soon as newly purchased gas sensors are employed.
5. Conclusions
In this study, patients with systolic heart failure were identified using components of breath recorded with an electronic nose system. The results show that the proposed method achieves a success rate of 85.21% with the support vector machine of statistical features. A significant advantage of the proposed method is that it can be classified using simple features with low computational complexity. This study is promising because it has demonstrated that a method different from imaging methods and laboratory analysis can be used in the early diagnosis of HFrEF patients in the future.
6. Patents
Some of the authors of this study registered the results obtained in the first part of this study with the Turkish Patent Institute under the number TR 2019 09,792 B, titled “Heart Attack Diagnosis Method from Individual Breath Data Using an Electronic Nose,” on 21 September 2022.
Author Contributions
Conceptualization, M.Y., Y.K. and B.H.T.; methodology, C.Ş. and B.H.T.; software, C.Ş., Ö.A. and B.H.T.; validation, M.Y., Y.K. and B.H.T.; formal analysis, M.Y.; investigation, B.H.T.; resources, M.Y., Y.K. and B.H.T.; writing—original draft preparation, M.Y., C.Ş. and Ö.A.; writing—review and editing, Y.K. and B.H.T.; project administration, B.H.T.; funding acquisition, B.H.T. All authors have read and agreed to the published version of the manuscript.
Funding
This study was supported by Hitit University Scientific Research Projects (BAP), Project number ODMYO19001.15.004.
Institutional Review Board Statement
The study was approved by the Hitit University Ethics Committee (Ethics No: 2019-48) and conducted in accordance with the Declaration of Helsinki. Scientific research permission was obtained from Hitit University Erol Olçok Hospital.
Informed Consent Statement
All patients and healthy volunteers were provided an information form, and their consent was obtained by signing. To ensure data confidentiality, all data was anonymized and stored in a secure environment accessible only to the research team, and the identities of the participants were kept entirely confidential.
Data Availability Statement
As the data are currently being used in some of the authors’ studies, they cannot be shared at this time. However, the data collected and analyzed during the current study are available from the corresponding author upon reasonable request.
Acknowledgments
This study was supported by Hitit University Scientific Research Projects (BAP), with the project number ODMYO19001.15.004. We want to thank all the staff of the Cardiology Department at Hitit University Erol Olçok Training and Research Hospital.
Conflicts of Interest
The authors declare that they have no conflicts of interest.
References
- Ren, X.; Wang, Y.; Huang, Y.; Sun, D.; Xu, L.; Wu, F. E-nose System using CNN and Abstract Odor Map to Classify Meat Freshness. In Proceedings of the 2023 IEEE 6th Information Technology, Networking, Electronic and Automation Control Conference (ITNEC), Chongqing, China, 24–26 February 2023; pp. 1200–1204. [Google Scholar] [CrossRef]
- Kapse, S.; Kedia, P.; Kumar, A.; Kausley, S.; Pal, P.; Rai, B. A non-invasive method for detection of freshness of packaged milk. J. Food Eng. 2023, 346, 111424. [Google Scholar] [CrossRef]
- Güney, S.; Atasoy, A. Study of fish species discrimination via electronic nose. Comput. Electron. Agric. 2015, 119, 83–91. [Google Scholar] [CrossRef]
- Seesaard, T.; Wongchoosuk, C. Recent Progress in Electronic Noses for Fermented Foods and Beverages Applications. Fermentation 2022, 8, 302. [Google Scholar] [CrossRef]
- Sharma, P.; Ghosh, A.; Tudu, B.; Sabhapondit, S.; Baruah, B.D.; Tamuly, P.; Bhattacharyya, N.; Bandyopadhyay, R. Monitoring the fermentation process of black tea using QCM sensor based electronic nose. Sens. Actuators B Chem. 2015, 219, 146–157. [Google Scholar] [CrossRef]
- Aghoutane, Y.; Brebu, M.; Moufid, M.; Ionescu, R.; Bouchikhi, B.; El Bari, N. Detection of Counterfeit Perfumes by Using GC-MS Technique and Electronic Nose System Combined with Chemometric Tools. Micromachines 2023, 14, 524. [Google Scholar] [CrossRef] [PubMed]
- Vidigal, I.G.; Siqueira, A.F.; Melo, M.P.; Giordani, D.S.; da Silva, M.L.; Cavalcanti, E.H.; Ferreira, A.L. Applications of an electronic nose in the prediction of oxidative stability of stored biodiesel derived from soybean and waste cooking oil. Fuel 2021, 284, 119024. [Google Scholar] [CrossRef] [PubMed]
- Persaud, K.; Dodd, G. Analysis of discrimination mechanisms in the mammalian olfactory system using a model nose. Nature 1982, 299, 352–355. [Google Scholar] [CrossRef] [PubMed]
- Peel, A.M.; Wilkinson, M.; Sinha, A.; Loke, Y.K.; Fowler, S.J.; Wilson, A.M. Volatile organic compounds associated with diagnosis and disease characteristics in asthma—A systematic review. Respir. Med. 2020, 169, 105984. [Google Scholar] [CrossRef]
- Baldini, C.; Billeci, L.; Sansone, F.; Conte, R.; Domenici, C.; Tonacci, A. Electronic Nose as a Novel Method for Diagnosing Cancer: A Systematic Review. Biosensors 2020, 10, 84. [Google Scholar] [CrossRef] [PubMed]
- Talens, J.B.; Pelegri-Sebastia, J.; Sogorb, T.; Ruiz, J.L. Prostate cancer detection using e-nose and AI for high probability assessment. BMC Med. Inform. Decis. Mak. 2023, 23, 205. [Google Scholar] [CrossRef]
- Leemans, M.; Bauër, P.; Cuzuel, V.; Audureau, E.; Fromantin, I. Volatile Organic Compounds Analysis as a Potential Novel Screening Tool for Breast Cancer: A Systematic Review. Biomark. Insights 2022, 17, 11772719221100709. [Google Scholar] [CrossRef]
- Poļaka, I.; Mežmale, L.; Anarkulova, L.; Kononova, E.; Vilkoite, I.; Veliks, V.; Ļeščinska, A.M.; Stonāns, I.; Pčolkins, A.; Tolmanis, I.; et al. The Detection of Colorectal Cancer through Machine Learning-Based Breath Sensor Analysis. Diagnostics 2023, 13, 3355. [Google Scholar] [CrossRef]
- Vadala, R.; Pattnaik, B.; Bangaru, S.; Rai, D.; Tak, J.; Kashyap, S.; Verma, U.; Yadav, G.; Dhaliwal, R.; Mittal, S.; et al. A review on electronic nose for diagnosis and monitoring treatment response in lung cancer. J. Breath Res. 2023, 17, 024002. [Google Scholar] [CrossRef]
- Binson, V.A.; Subramoniam, M.; Mathew, L. Detection of COPD and Lung Cancer with electronic nose using ensemble learning methods. Clin. Chim. Acta 2021, 523, 231–238. [Google Scholar] [CrossRef]
- Day, B.A.; Wilmer, C.E. Computational Design of MOF-Based Electronic Noses for Dilute Gas Species Detection: Application to Kidney Disease Detection. ACS Sens. 2021, 6, 4425–4434. [Google Scholar] [CrossRef]
- Gudiño-Ochoa, A.; García-Rodríguez, J.A.; Ochoa-Ornelas, R.; Cuevas-Chávez, J.I.; Sánchez-Arias, D.A. Non-invasive Diabetes Detection through Human Breath Using TinyML-Powered E-Nose. Sensors 2024, 24, 1294. [Google Scholar] [CrossRef]
- Wilson, A.D. Application of Electronic-Nose Technologies and VOC-Biomarkers for the Non-invasive Early Diagnosis of Gastrointestinal Diseases. Sensors 2018, 18, 2613. [Google Scholar] [CrossRef] [PubMed]
- Li, Y.; Wei, X.; Zhou, Y.; Wang, J.; You, R. Research progress of electronic nose technology in exhaled breath disease analysis. Microsyst. Nanoeng. 2023, 9, 129. [Google Scholar] [CrossRef] [PubMed]
- Tozlu, B.H.; Şimşek, C.; Aydemir, O.; Karavelioglu, Y. A High performance electronic nose system for the recognition of myocardial infarction and coronary artery diseases. Biomed. Signal Process. Control 2021, 64, 102247. [Google Scholar] [CrossRef]
- Dharmarajan, K.; Rich, M.W. Epidemiology, Pathophysiology, and Prognosis of Heart Failure in Older Adults. Heart Fail. Clin. 2017, 13, 417–426. [Google Scholar] [CrossRef] [PubMed]
- Gheorghiade, M.; Flaherty, J.D.; Fonarow, G.C.; Desai, R.V.; Lee, R.; McGiffin, D.; Love, T.E.; Aban, I.; Eichhorn, E.J.; Bonow, R.O.; et al. Coronary artery disease, coronary revascularization, and outcomes in chronic advanced systolic heart failure. Int. J. Cardiol. 2011, 151, 69–75. [Google Scholar] [CrossRef]
- Mosterd, A.; Hoes, A.W. Clinical epidemiology of heart failure. Heart 2007, 93, 1137–1146. [Google Scholar] [CrossRef] [PubMed]
- Gaggin, H.K.; Januzzi, J.L. Biomarkers and diagnostics in heart failure. Biochim. Biophys. Acta 2013, 1832, 2442–2450. [Google Scholar] [CrossRef] [PubMed]
- McDonagh, T.A.; Metra, M.; Adamo, M.; Gardner, R.S.; Baumbach, A.; Böhm, M.; Burri, H.; Butler, J.; Čelutkienė, J.; Chioncel, O.; et al. 2021 ESC Guidelines for the diagnosis and treatment of acute and chronic heart failure. Eur. Heart J. 2021, 42, 3599–3726. [Google Scholar] [CrossRef]
- McDonagh, T.A.; Metra, M.; Adamo, M.; Gardner, R.S.; Baumbach, A.; Böhm, M.; Burri, H.; Butler, J.; Čelutkienė, J.; Chioncel, O.; et al. 2023 Focused Update of the 2021 ESC Guidelines for the diagnosis and treatment of acute and chronic heart failure: Developed by the task force for the diagnosis and treatment of acute and chronic heart failure of the European Society of Cardiology (ESC) With the special contribution of the Heart Failure Association (HFA) of the ESC. Eur. Heart J. 2023, 44, 3627–3639. [Google Scholar] [CrossRef]
- Choudhary, R.; Iqbal, N.; Khusro, F.; Higginbotham, E.; Green, E.; Maisel, A. Heart failure biomarkers. J. Cardiovasc. Transl. Res. 2013, 6, 471–484. [Google Scholar] [CrossRef] [PubMed]
- Wang, T.J.; Larson, M.G.; Levy, D.; Leip, E.P.; Benjamin, E.J.; Wilson, P.W.; Sutherland, P.; Omland, T.; Vasan, R.S. Impact of age and sex on plasma natriuretic peptide levels in healthy adults. Am. J. Cardiol. 2002, 90, 254–258. [Google Scholar] [CrossRef]
- Farnsworth, C.W.; Bailey, A.L.; Jaffe, A.S.; Scott, M.G. Diagnostic concordance between NT-proBNP and BNP for suspected heart failure. Clin. Biochem. 2018, 59, 50–55. [Google Scholar] [CrossRef] [PubMed]
- Lee, C.S.; Auld, J. Heart Failure: A Primer. Crit. Care Nurs. Clin. N. Am. 2015, 27, 413–425. [Google Scholar] [CrossRef]
- Voss, A.; Witt, K.; Fischer, C.; Reulecke, S.; Poitz, W.; Kechagias, V.; Surber, R.; Figulla, H.R. Smelling heart failure from human skin odor with an electronic nose. In Proceedings of the 2012 Annual International Conference of the IEEE Engineering in Medicine and Biology Society, San Diego, CA, USA, 28 August–1 September 2012; pp. 4034–4037. [Google Scholar] [CrossRef]
- Witt, K.; Fischer, C.; Reulecke, S.; Kechagias, V.; Surber, R.; Figulla, H.R.; Voss, A. Electronic nose detects heart failure from exhaled breath. Biomed. Tech. 2013, 58 (Suppl. 1), 000010151520134145. [Google Scholar] [CrossRef]
- Finamore, P.; Pedone, C.; Lelli, D.; Costanzo, L.; Bartoli, I.R.; De Vincentis, A.; Grasso, S.; Parente, F.R.; Pennazza, G.; Santonico, M.; et al. Analysis of volatile organic compounds: An innovative approach to heart failure characterization in older patients. J. Breath Res. 2018, 12, 026007. [Google Scholar] [CrossRef] [PubMed]
- Ponikowski, P.; Voors, A.A.; Anker, S.D.; Bueno, H.; Cleland, J.G.F.; Coats, A.J.S.; Falk, V.; González-Juanatey, J.R.; Harjola, V.-P.; Jankowska, E.A.; et al. 2016 ESC Guidelines for the diagnosis and treatment of acute and chronic heart failure. Eur. Heart J. 2016, 37, 2129–2200. [Google Scholar] [CrossRef] [PubMed]
- Bennett, J.A.; Riegel, B.; Bittner, V.; Nichols, J. Validity and reliability of the NYHA classes for measuring research outcomes in patients with cardiac disease. Heart Lung 2002, 31, 262–270. [Google Scholar] [CrossRef]
- Friedewald, W.T.; Levy, R.I.; Fredrickson, D.S. Estimation of the Concentration of Low-Density Lipoprotein Cholesterol in Plasma, Without Use of the Preparative Ultracentrifuge. Clin. Chem. 1972, 18, 499–502. [Google Scholar] [CrossRef] [PubMed]
- Machado, R.F.; Laskowski, D.; Deffenderfer, O.; Burch, T.; Zheng, S.; Mazzone, P.J.; Mekhail, T.; Jennings, C.; Stoller, J.K.; Pyle, J.; et al. Detection of Lung Cancer by Sensor Array Analyses of Exhaled Breath. Am. J. Respir. Crit. Care Med. 2005, 171, 1286–1291. [Google Scholar] [CrossRef]
- Jiang, C.; Sun, M.; Wang, Z.; Chen, Z.; Zhao, X.; Yuan, Y.; Li, Y.; Wang, C. A Portable Real-Time Ringdown Breath Acetone Analyzer: Toward Potential Diabetic Screening and Management. Sensors 2016, 16, 1199. [Google Scholar] [CrossRef]
- Schölkopf, B.; Smola, A.J. Learning with Kernels: Support Vector Machines, Regularization, Optimization, and Beyond. Available online: https://direct.mit.edu/books/monograph/1821/Learning-with-KernelsSupport-Vector-Machines (accessed on 12 January 2025).
- Lyons, R. Understanding Digital Signal Processing, 3rd ed.; Pearson Prentice Hall: Bergen County, NJ, USA, 2010. [Google Scholar]
- Papoulis, A.; Pillai, S. Probability, Random Variables and Stochastic Processes, 4th ed.; McGraw-Hill Education: Boston, MA, USA, 2001. [Google Scholar]
- Ansari, K.J.; Ahmad, I.; Mursaleen, M.; Hussain, I. On Some Statistical Approximation by (p,q)-Bleimann, Butzer and Hahn Operators. Symmetry 2018, 10, 731. [Google Scholar] [CrossRef]
- Joanes, D.N.; Gill, C.A. Comparing measures of sample skewness and kurtosis. J. R. Stat. Soc. Ser. D 1998, 47, 183–189. [Google Scholar] [CrossRef]
- Chaddad, A.; Wu, Y.; Kateb, R.; Bouridane, A. Electroencephalography Signal Processing: A Comprehensive Review and Analysis of Methods and Techniques. Sensors 2023, 23, 6434. [Google Scholar] [CrossRef]
- Raubitzek, S.; Neubauer, T.; Friedrich, J.; Rauber, A. Interpolating Strange Attractors via Fractional Brownian Bridges. Entropy 2022, 24, 718. [Google Scholar] [CrossRef]
- Bosch, S.; de Menezes, R.X.; Pees, S.; Wintjens, D.J.; Seinen, M.; Bouma, G.; Kuyvenhoven, J.; Stokkers, P.C.F.; de Meij, T.G.J.; de Boer, N.K.H. Electronic Nose Sensor Drift Affects Diagnostic Reliability and Accuracy of Disease-Specific Algorithms. Sensors 2022, 22, 9246. [Google Scholar] [CrossRef] [PubMed]
- van der Aart, T.J.; Visser, M.; van Londen, M.; van de Wetering, K.M.H.; Maaten, J.C.T.; Bouma, H.R. The smell of sepsis: Electronic nose measurements improve early recognition of sepsis in the ED. Am. J. Emerg. Med. 2025, 88, 126–133. [Google Scholar] [CrossRef] [PubMed]
Disclaimer/Publisher’s Note: The statements, opinions and data contained in all publications are solely those of the individual author(s) and contributor(s) and not of MDPI and/or the editor(s). MDPI and/or the editor(s) disclaim responsibility for any injury to people or property resulting from any ideas, methods, instructions or products referred to in the content. |
© 2025 by the authors. Licensee MDPI, Basel, Switzerland. This article is an open access article distributed under the terms and conditions of the Creative Commons Attribution (CC BY) license (https://creativecommons.org/licenses/by/4.0/).