Article

Quantitative Analysis Method for Full Lifecycle Aging Pathways of Lithium-Ion Battery Systems Based on Equilibrium Potential Reconstruction

1
State Key Laboratory of Smart Power Distribution Equipment and System, Hebei University of Technology, Tianjin 300401, China
2
College of Electrical and Power Engineering, Taiyuan University of Technology, Taiyuan 030024, China
*
Author to whom correspondence should be addressed.
Appl. Sci. 2025, 15(18), 10079; https://doi.org/10.3390/app151810079
Submission received: 9 August 2025 / Revised: 11 September 2025 / Accepted: 12 September 2025 / Published: 15 September 2025

Abstract

High-specific-energy lithium-ion batteries face accelerated degradation and safety risks. To ensure stable and safe operation of such batteries in electric vehicles throughout their service life, this study proposes a quantitative aging mechanism analysis method based on electrode equilibrium potential reconstruction under rest conditions. First, by integrating the single-particle electrochemical model with equilibrium potential reconstruction, a quantitative mapping framework between State of Charge (SOC) and electrode lithiation concentration is established. Subsequently, to address the strong nonlinearity between equilibrium potential and lithiation concentration, the State Transition Algorithm (STA) is introduced to solve the high-dimensional coupled parameter identification problem, enhancing aging parameter estimation accuracy. Finally, the effectiveness of the proposed method was validated using a commercial NCM622/graphite power cell as the research object, and the battery’s aging pathways were analyzed using differential voltage analysis (DVA) and incremental capacity analysis (ICA) methods. Experimental results indicate that the OCV curve fitting achieved a maximum Root Mean Square Error of 0.00932, while quantitatively revealing the degradation patterns of electrode lithiation degrees during aging under both fully charged (SOC = 100%) and fully discharged (SOC = 0%) states.

1. Introduction

In recent years, lithium-ion power batteries have been widely adopted in new energy electric vehicles due to their advantages, such as high energy density, high operating voltage, strong charge retention capability, and environmental friendliness [1,2,3]. Concurrently, to further meet user demands for extended range and driving performance, researchers have developed a series of novel high-nickel ternary power batteries. While these next-generation lithium-ion batteries exhibit significantly improved specific energy, they also suffer from accelerated performance degradation and heightened safety risks. To ensure the stable and safe operation of high-specific-energy power batteries during service, it is imperative to establish a performance detection mechanism for individual cells. This mechanism aims to quantitatively analyze the aging characteristics of high-specific-energy power batteries throughout their full lifecycle and elucidate the underlying aging mechanisms.
However, lithium-ion batteries constitute a complex, enclosed electrochemical system. In practical engineering applications, only the current, voltage at the electrodes, and surface temperature can be measured, while internal side reactions remain unobservable [4]. Research indicates that the degradation mechanisms of lithium-ion batteries primarily fall into two categories: loss of lithium-ion inventory (LLI) and loss of active material (LAM) in the electrodes [5].
To monitor the aging progression of batteries in service, domestic and international research teams have proposed various online state estimation methods, which can be broadly classified into two categories: data-driven model-based state estimation approaches and battery model-based parameter identification methods [6]. Both methodologies have demonstrated progress under specific application scenarios.
Data-driven methods can accurately estimate the state of health (SOH) of lithium-ion batteries solely based on historical data, without requiring knowledge of the intricate internal electrochemical mechanisms [7]. These methods employ algorithms to establish a mapping between health indicators (HIs) and SOH, and their accuracy largely depends on the quality of the selected health features and the learning capability of the training algorithm. Prominent data-driven techniques include support vector machines (SVMs) [8], Gaussian process regression (GPR) [9], and neural network algorithms [10]. Reference [11] combined empirical mode decomposition (EMD) with a bidirectional long short-term memory (BiLSTM) neural network to achieve SOH prediction. Reference [12] proposed a fusion method integrating incremental capacity analysis with a wavelet neural network and genetic algorithm (GA-WNN) to estimate SOH. Reference [13] combined an unscented Kalman filter (UKF) and a Transformer model to establish an online, cloud-collaborative SOH estimation method for lithium-ion batteries. However, data-driven models merely fit black-box mappings, require high-quality training data to ensure robustness and stability of the trained model, and their predictions lack physical interpretability.
Model-based parameter identification methods have been extensively studied, covering two main directions: electrochemical model parameter identification and equivalent circuit model (ECM) parameter identification. Electrochemical models are built upon a set of partial differential algebraic equations (PDAEs) that describe the spatiotemporal distribution of electrochemical variables inside lithium-ion batteries, such as lithium-ion concentration and electrode/electrolyte potentials. Physical parameter identification methods are used to detect degradation at the electrode level, thus offering high estimation accuracy. Reference [14] employed an adaptive unscented Kalman filter based on an electrochemical model for accurate and robust estimation of lithium-ion concentration and potential. Reference [15] utilized fractional-order and integer-order calculus to construct a series of fractional-order models (FOMs) and integer-order models (IOMs). The model parameters were then identified using particle swarm optimization across the entire SOC range. However, the system of PDAEs is highly complex, making parameter identification based on electrochemical models challenging. Compared to electrochemical models like the pseudo-two-dimensional (P2D) or single-particle model (SPM), equivalent circuit models have fewer parameters and lower computational costs. Reference [16] used a forgetting factor recursive least squares (FFRLSs) method for real-time identification of battery model parameters and the open-circuit voltage (OCV) curve, alongside an unscented Kalman filter algorithm for SOH estimation. Reference [17] established an explicit relationship between OCV changes and combinations of dominant capacity loss mechanisms to diagnose aging in batteries. Reference [18] combined an equivalent circuit model with a novel voltage reconstruction model that considers polarization processes; the identified physical parameters in the model can be used for quantitative identification of degradation modes in lithium-ion batteries. Reference [19] proposed a new method for lithium-ion battery aging modeling and diagnosis based on OCV analysis. A two-stage piecewise nonlinear regression algorithm was used to smooth the incremental capacity (IC) curve to reconstruct a universal OCV curve. The voltage reconstruction model method can separate changes in cathode and anode capacity, enabling quantitative determination of the battery’s degradation level [20]. This approach allows for obtaining aging information from the charge/discharge curves of lithium-ion batteries without disassembly. Furthermore, methods like incremental capacity analysis (ICA)/differential voltage analysis (DVA) can qualitatively determine the degradation mode of lithium-ion batteries through dQ/dV or dV/dQ curves [21,22,23]. Currently, these methods are widely applied for analyzing the aging mechanisms of lithium-ion batteries.
To ensure the safe operation of lithium-ion batteries in electric vehicles, this study takes commercial power batteries as the research object. Starting from the electrochemical model, we developed a non-destructive diagnostic method for lithium-ion batteries that combines OCV curve reconstruction and IC/DV analysis. This method can intuitively and quantitatively reveal the internal aging mechanisms of the battery.
The primary innovations of this work are summarized as follows:
(1)
An OCV curve analysis method under rest conditions is proposed. Using commercial NCM622/graphite power batteries as the research object, charge–discharge experiments were conducted to analyze aging modes, establishing a transferable experimental framework for investigating the degradation mechanisms of high-nickel NCM batteries.
(2)
When the actual properties of the cathode and anode materials were difficult to measure experimentally, we conducted this study based on the material property parameters (SOC-OCV) from COMSOL 6.0. By integrating the single-particle (SP) electrochemical model with the electrode equilibrium potentials, the OCV curve is reconstructed, thereby establishing a quantitative mapping from external battery characteristics to internal aging states.
(3)
To address the highly nonlinear relationship between the equilibrium potential and lithium intercalation concentration within the electrochemical model, an STA was introduced to resolve the high-dimensional, strongly coupled parameter identification problem. Finally, IC/DV analyses were synergistically integrated to analyze the complex degradation pathways within the battery.
The organization of the subsequent chapters in this study is as follows: Section 2 elaborates in detail on the battery-aging-parameter identification method based on an electrochemical model under constant-current conditions. This includes the construction and simplification of the single-particle model, the identification of active material loss under rest conditions, and the open-circuit voltage reconstruction method. Section 3 introduces the principles, optimization procedures, and experimental validation process of the STA and the ICA method for analyzing battery-aging pathways. Section 4 analyzes the experimental results. Section 5 presents the conclusion and directions for future work.

2. Electrochemical Model-Based Identification of Battery-Aging Parameters Under Constant-Current (CC) Operation

2.1. Electrochemical Model for Lithium-Ion Batteries Under CC Conditions

To establish a generalized electrochemical mechanism model for lithium-ion batteries, the SP model implements appropriate simplifications of both the internal structure and the underlying physical/electrochemical reaction processes within the battery:
  • Li+ transport within solid-phase active particles is simplified as spherical diffusion;
  • Infinite electrolyte conductivity is assumed, implying uniform lithium-ion distribution across all particles in both electrodes;
  • Infinite solid/liquid phase conductivity is presumed, neglecting ohmic drops in these phases.
Within the SP model framework, all electrode-active particles in both the positive and negative electrode regions are under identical electrochemical reaction environments. Consequently, the SP model represents each electrode as a single spherical particle, as shown in Figure 1.
It is evident that the simplification approach inherent in the SP model closely aligns with the operational characteristics of lithium-ion batteries under CC conditions. Therefore, this study employs the SP model framework to analyze battery state under CC conditions, thereby completing identification of battery-aging parameters.
During CC charge/discharge cycles, the output voltage V(t) of a lithium-ion battery primarily comprises three voltage drops beyond the relative equilibrium potential E(t) between electrodes: SEI resistance drop ηSEI(t), electrolyte ohmic drop ηelectrolyte(t), and activation overpotential ηact(t). The output voltage in the SP model is expressed as
V ( t ) = E t η S E I t η e l e c t r o l y t e t η a c t t
where individual components are defined by
E t = U p r e f c s , p , s u r f t c s , p , max U n r e f c s , n , s u r f t c s , n , max η S E I t = R S E I , p a s , p j f , p ¯ + R S E I , n a s , n j f , n ¯ η e l e c t r o l y t e t = δ n 2 2 κ n e f f j f , n ¯ + δ s e p δ n κ s e p e f f j f , n ¯ + δ p 2 2 κ p e f f j f , p ¯ η a c t t = R T α F ln ξ p t + ξ p 2 t + 1 ξ n t + ξ n 2 t + 1
where I represents constant current, p/n represents cathode/anode parameters; Uref(t) represents the equilibrium potential of active materials, governed by surface Li-ion concentration cs,surf(t) and maximum intercalation capacity cs,max; RSEI represents SEI resistance; as represents the specific surface area of active particles; j f ¯ represents local current density; δ represents the thickness of electrodes and separator; Κeff represents the effective ionic conductivity of the electrolyte; R represents the universal gas constant; T represents temperature; α represents the charge transfer coefficient; F represents Faraday’s constant; j f ¯ , cs,surf(t) and the intermediate variable ξ(t) are defined as
j f , n ¯ = j f , p ¯ = I A δ n c s , s u r f t = c s , a v g t j f ¯ R s 2 6 F ε s D s ξ t = j f ¯ 1 2 a s k c s , max c s , s u r f α c s , s u r f α c e α
where A represents total equivalent surface area, Rs represents active particle radius, Ds represents solid-phase Li+ diffusion coefficient, and k represents kinetic reaction constant.
Equations (1)–(3) reveal intricate coupling effects among voltage characteristics, charge–discharge protocols, active material degradation, and SEI growth. Precise extraction of internal aging states from external parameters (current, voltage, temperature, capacity) necessitates further model simplification.

2.2. Identification of Active Material Loss in Lithium Batteries Under Rest Conditions

This study investigates lithium-ion batteries under rest conditions, during which lithium-ion distributions within both positive and negative electrode active materials reach equilibrium states:
c s , s u r f t = c s , a v g t
Under this condition, ηSEI(t), ηelectrolyte(t), and ηact(t) all equal zero.
The output voltage depends exclusively on the active materials and their lithiation degree:
V ( t ) = U o c t = U p r e f c s , p , a v g t c s , p , max U n r e f c s , n , a v g t c s , n , max
where Uoc(t) denotes OCV.

2.3. Electrochemical Parameter Identification Based on OCV Reconstruction

For commercial lithium-ion batteries, only electrode chemistry (e.g., LFP, LCO, graphite) and operational data (voltage, current, and surface temperature) during charge/discharge cycles are typically accessible, while internal material properties and structural design parameters remain largely inaccessible. Crucially, maximum lithium intercalation concentrations and equilibrium potential curves for various electrodes are obtainable. Therefore, based on (5), we propose an OCV reconstruction method to determine the lithiation degree of active materials across SOC states in commercial NMC batteries.
To standardize the SOC range for lithium-ion batteries, this study defines
  • SOC = 0% as the state where the relative equilibrium potential Uoc(t) reaches the lower cut-off voltage Vmin;
  • SOC = 100% as the state where Uoc(t) reaches the upper cut-off voltage Vmax.
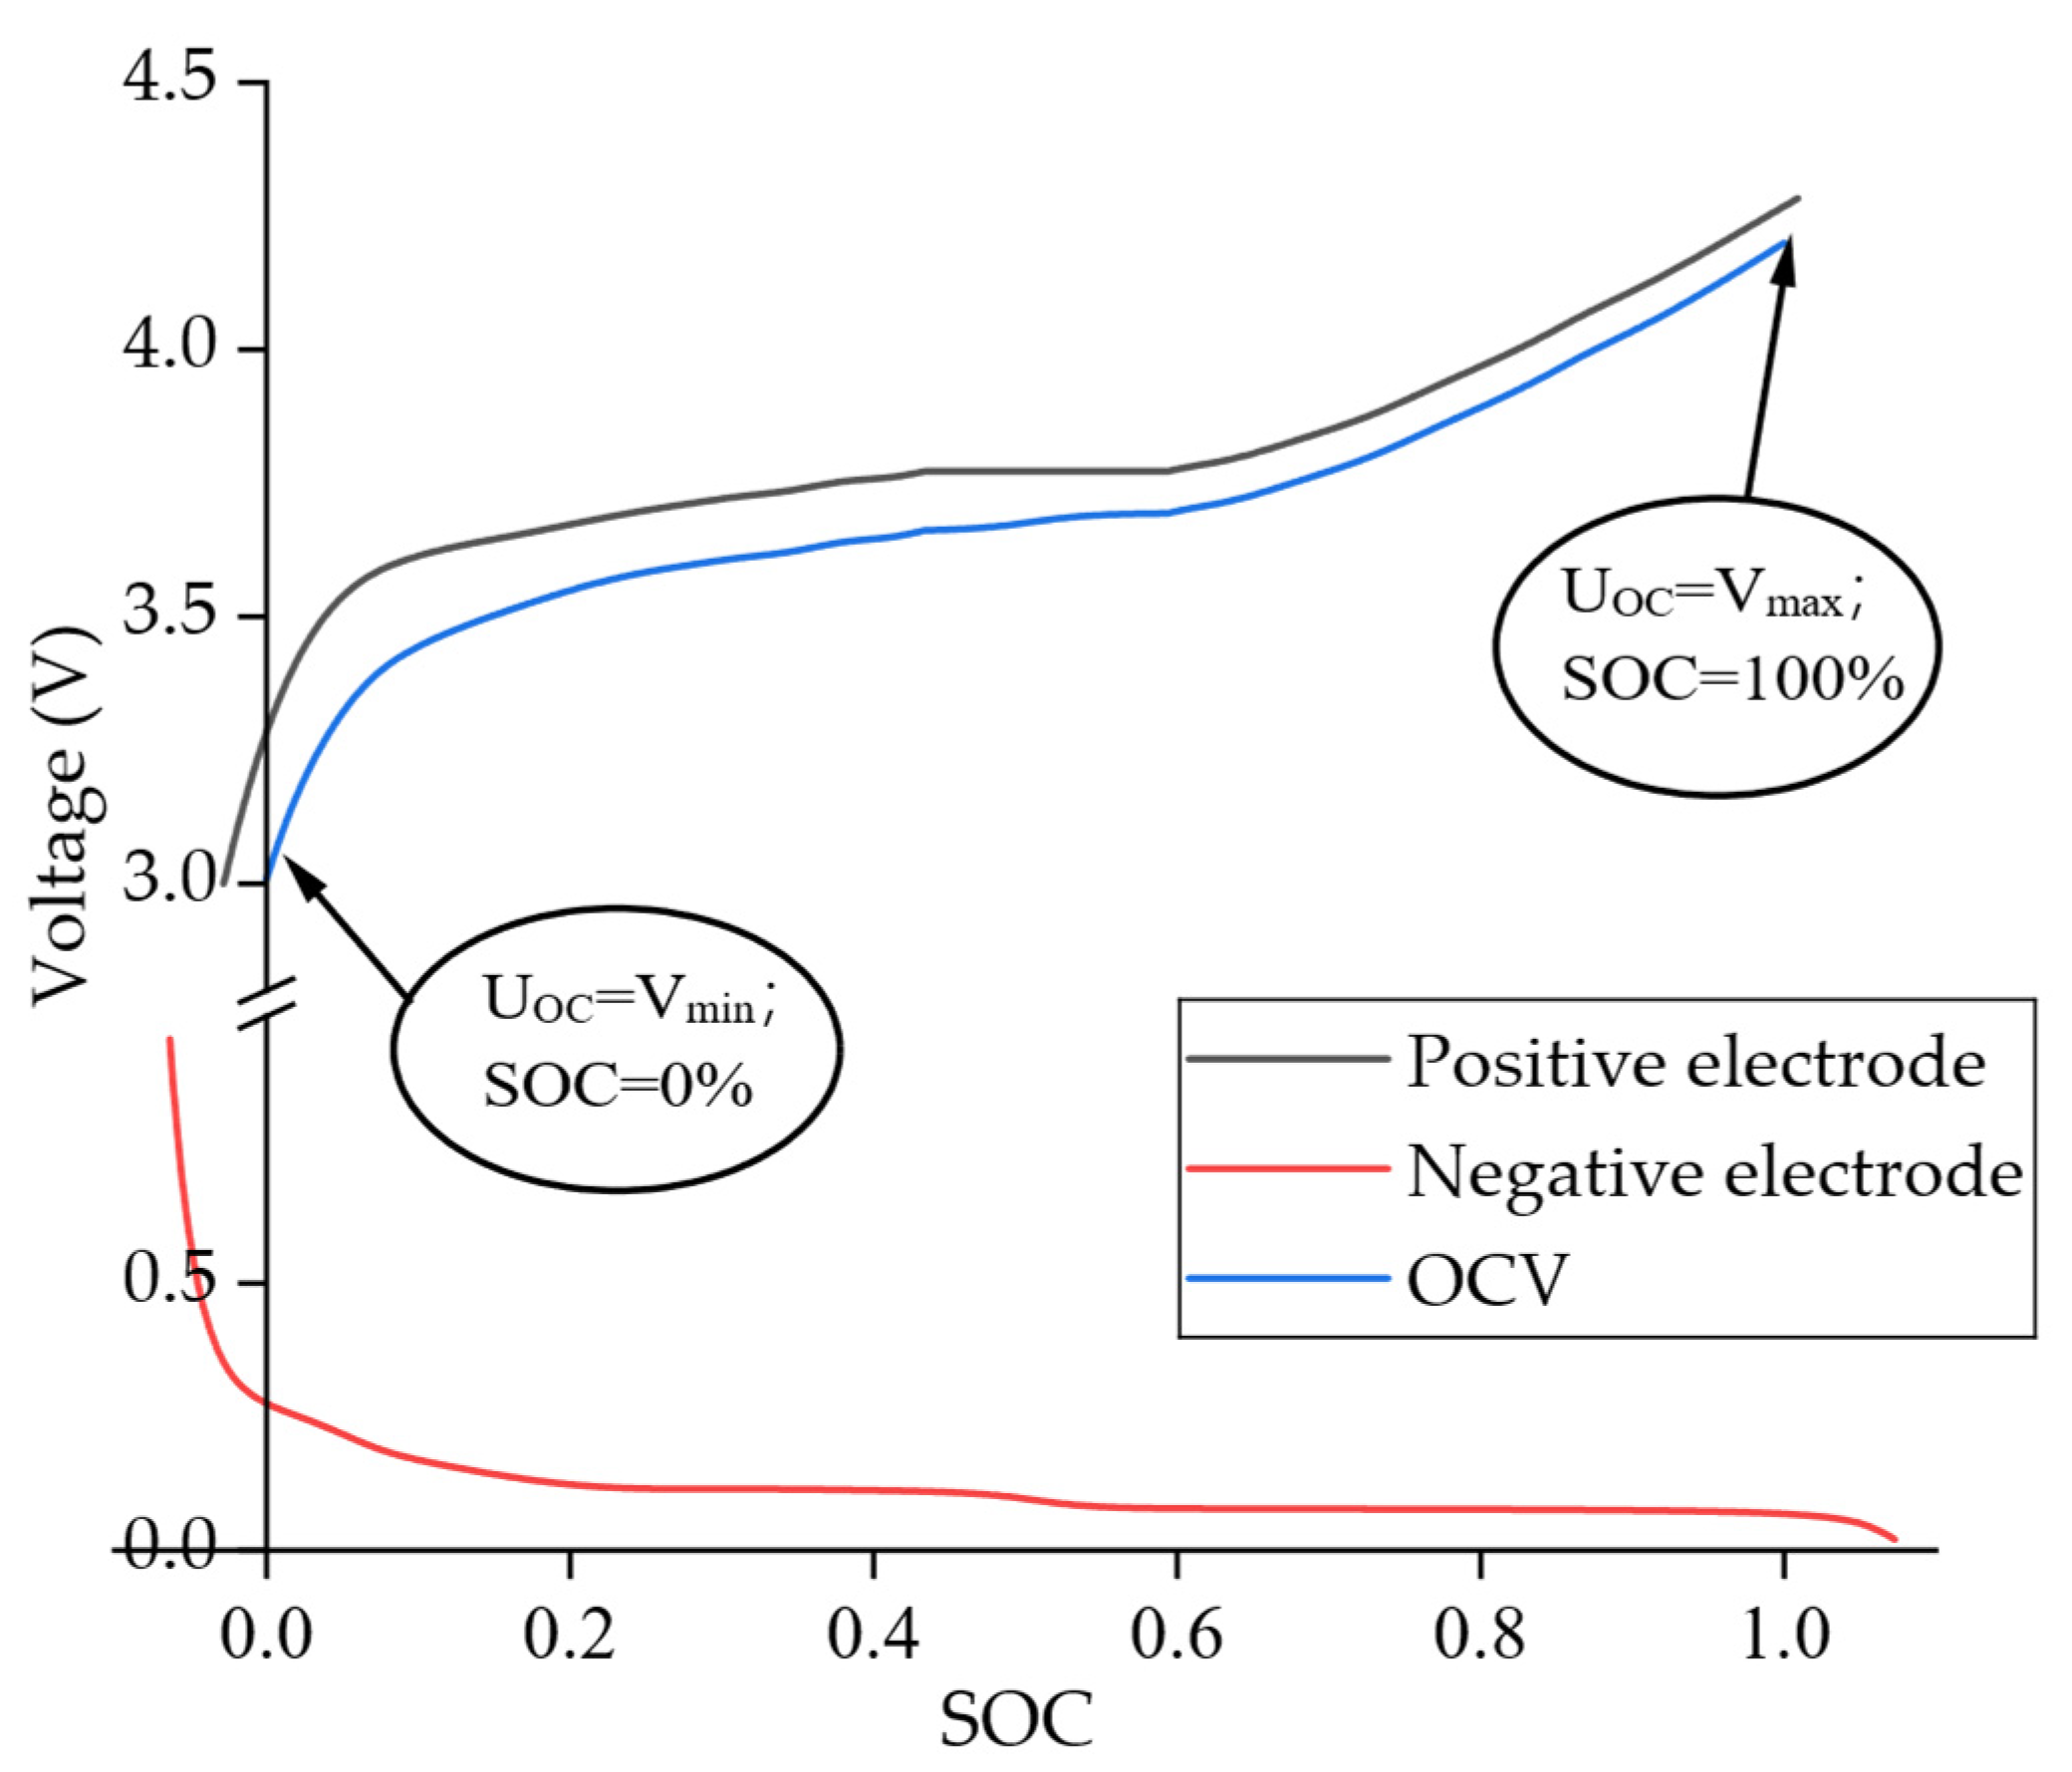
Figure 2 illustrates equilibrium potentials Uref of cathode and anode materials and OCV Uoc curves for the NCM622/graphite battery during charge–discharge cycles. The operational voltage range (3.0 V–4.2 V) delimits the SOC 0% and 100% points, as annotated in Figure 2.
Based on Figure 2, the average lithium-ion concentrations of the cathode in the empty battery state cs,p,avg,SOC=0% and cs,n,avg,SOC=0%, and in the full battery state cs,p,avg,SOC=100% and cs,n,avg,SOC=100% satisfy the following equations:
c s , p , a v g , S O C = 0 % = c s , p , a v g t U o c t = V min c s , n , a v g , S O C = 0 % = c s , n , a v g t U o c t = V min c s , p , a v g , S O C = 100 % = c s , p , a v g t U o c t = V max c s , n , a v g , S O C = 100 % = c s , n , a v g t U o c t = V max
A linear relationship exists between SOC and the average lithium-ion concentration cs,avg of electrode materials:
c s , p , a v g S O C = c s , p , a v g , S O C = 100 % c s , p , a v g , S O C = 0 % S O C + c s , p , a v g , S O C = 0 % c s , n , a v g S O C = c s , n , a v g , S O C = 100 % c s , n , a v g , S O C = 0 % S O C + c s , n , a v g , S O C = 0 %
Consequently, given known equilibrium potential curves Uref(cs,avg/cs,max) and OCV profile Uoc(SOC), we estimate Li-ion concentration distributions during operation via parameter optimization:
arg   min a , b , c , d U o c S O C U p r e f c s , p , a v g S O C / c s , p , max U n r e f c s , n , a v g S O C / c s , n , max 2 s . t .   0 % S O C 100 % a = c s , n , a v g , S O C = 0 % b = c s , n , a v g , S O C = 100 % c = c s , p , a v g , S O C = 0 % d = c s , p , a v g , S O C = 100 %
In other words, this paper analyzes the active material loss of lithium-ion batteries by identifying lithiation states of positive and negative electrode active materials at SOC = 0% and SOC = 100% points. However, in practical applications, the open-circuit voltage Uoc of lithium-ion batteries is difficult to be directly expressed in the form of a function but rather is composed of a series of discrete points corresponding to Uoc points at different SOC points: [Uoc,SOC=0%, Uoc,SOC=1%, Uoc,SOC=2%, …, Uoc,SOC=100%], requiring reformulation of (8) as (9):
arg   min a , b , c , d S O C = 0 % 100 % U o c S O C U p r e f c s , p , a v g S O C / c s , p , max U n r e f c s , n , a v g S O C / c s , n , max 2

3. STA-Based Battery Parameter Identification

The optimization problem from (5) to (9) is formulated as
arg   min a , b , c , d S O C = 0 % 100 % U o c S O C U p r e f c s , p , a v g S O C / c s , p , max U n r e f c s , n , a v g S O C / c s , n , max 2 c s , n , a v g S O C = b a S O C + a c s , p , a v g S O C = d c S O C + c a = c s , n , a v g , S O C = 0 % b = c s , n , a v g , S O C = 100 % c = c s , p , a v g , S O C = 0 % d = c s , p , a v g , S O C = 100 %
It is observed that as the identified parameters cs,n,avg,SOC=0%, cs,n,avg,SOC=100%, cs,p,avg,SOC=0%, and cs,p,avg,SOC=100% are updated, the arguments of Upref() and Unref() in the objective function continually vary. Consequently, parameter identification via gradient descent methods becomes impracticable. Furthermore, Upref() and Unref() represent the equilibrium potential curves of cathode and anode active materials at different lithiation degrees, which are nonlinear functions. This study employs the STA for parameter identification and integrates ICA to analyze battery-aging pathways.

3.1. STA Optimization Method

STA is a stochastic global optimization method based on state transition and state space concepts. It treats a solution to the optimization problem as a state and solution updates as state transitions, with state transition matrices representing operators that generate candidate solutions. For an optimization problem involving n parameters, the state space representation is
x k + 1 = A k x k y k + 1 = f x k + 1
where xkRn represents the current state corresponding to a solution; Ak R n × n represents the state transition matrix governing solution updates; xk+1 represents the candidate solution generated by transition operators; and f(xk+1) represents the loss function of the optimization problem.
Four operators generate new candidate states for continuous function optimization:
(1)
Rotation Operator
x k + 1 = x k + ε α 1 n x k 2 R r x k
Here, εα > 0 denotes the rotation factor, Rr R n × n is a random matrix with elements uniformly distributed in [−1, 1], and ‖⋅‖2 is the Euclidean norm. This operator confines candidate solutions within a hypersphere centered at xk with radius εα. During optimization, εα progressively decreases, transitioning the search from global to local.
(2)
Translation Operator
x k + 1 = x k + ε β R t x k x k 1 x k x k 1 2
Here, εβ > 0 is the translation factor and Rt∼U [0, 1]. This preserves persistence in the search direction.
(3)
Expansion Operator
x k + 1 = x k + ε γ R e x k
Here, εγ > 0 is the expansion factor, and Re R n × n is a random diagonal matrix with elements N∼(0, 1). This achieves global exploration.
(4)
Axial Search Operator
x k + 1 = x k + ε δ R a x k
Here, εδ > 0 is the axial factor, and Rα R n × n is a sparse random diagonal matrix with one zero element (others∼N(0, 1)). This enhances single-dimensional search capability.
Using these four operators, SE new candidate states xk+1 are generated from the current best state xbest,k. The optimal solution xbest,new is selected from {xbest,k}∪{xk+1} based on loss function evaluation, and iterations continue.
The state update iterative process of the STA is as shown in Figure 3.
The synergistic operation of the expansion and axial exploration operators empowers STA with global explorative capabilities throughout the solution space. As iterations progress, the annealing rotation factor εα systematically decays, driving convergence toward local optima. Moreover, the synergistic operation of all operators facilitates efficient escape from local solution traps. Consequently, STA exhibits significant advantages in resolving highly nonlinear optimization problems exemplified by (10).

3.2. Experiment

To validate the proposed method for lithium-ion battery-aging-mechanism analysis, accelerated lifecycle aging tests were conducted on NCM622/graphite ternary lithium-ion batteries. OCV profiles at different aging states were measured to investigate degradation pathways.
The integrated battery testing platform comprises four core components:
  • NCM622/graphite prismatic ternary lithium-ion power battery.
  • Programmable battery test system (LTM200, Shenzhen Wright Energy Technology Co., Ltd, Shenzhen, China) with eight independent channels. Each channel provides
    • Voltage sampling/output range: 0 to 5 V (voltage accuracy: ±0.01% FS, voltage stability: ±0.01% FS);
    • Current output range: −100 A to +100 A (current accuracy: ±0.01% FS, current stability: ±0.01% FS).
  • Programmable thermal chamber (JD-8001B, Dongguan Jiedong Testing Equipment Co., Ltd, Dongguan, China). The battery was maintained at 25.0 ± 0.5 °C throughout testing.
  • Host computer controlling charge/discharge protocols and logging electrochemical data at 1 Hz sampling frequency.
For automotive lithium-ion batteries, the primary charging protocol is Constant Current–Constant Voltage (CC-CV), while discharging follows dynamic drive cycles. Lithium-ion batteries undergo 100 charge–discharge cycles per aging phase. After each cycle, comprehensive characterization measurements are performed at the designated aging checkpoint.

3.3. IC-Based Degradation Mechanism Analysis

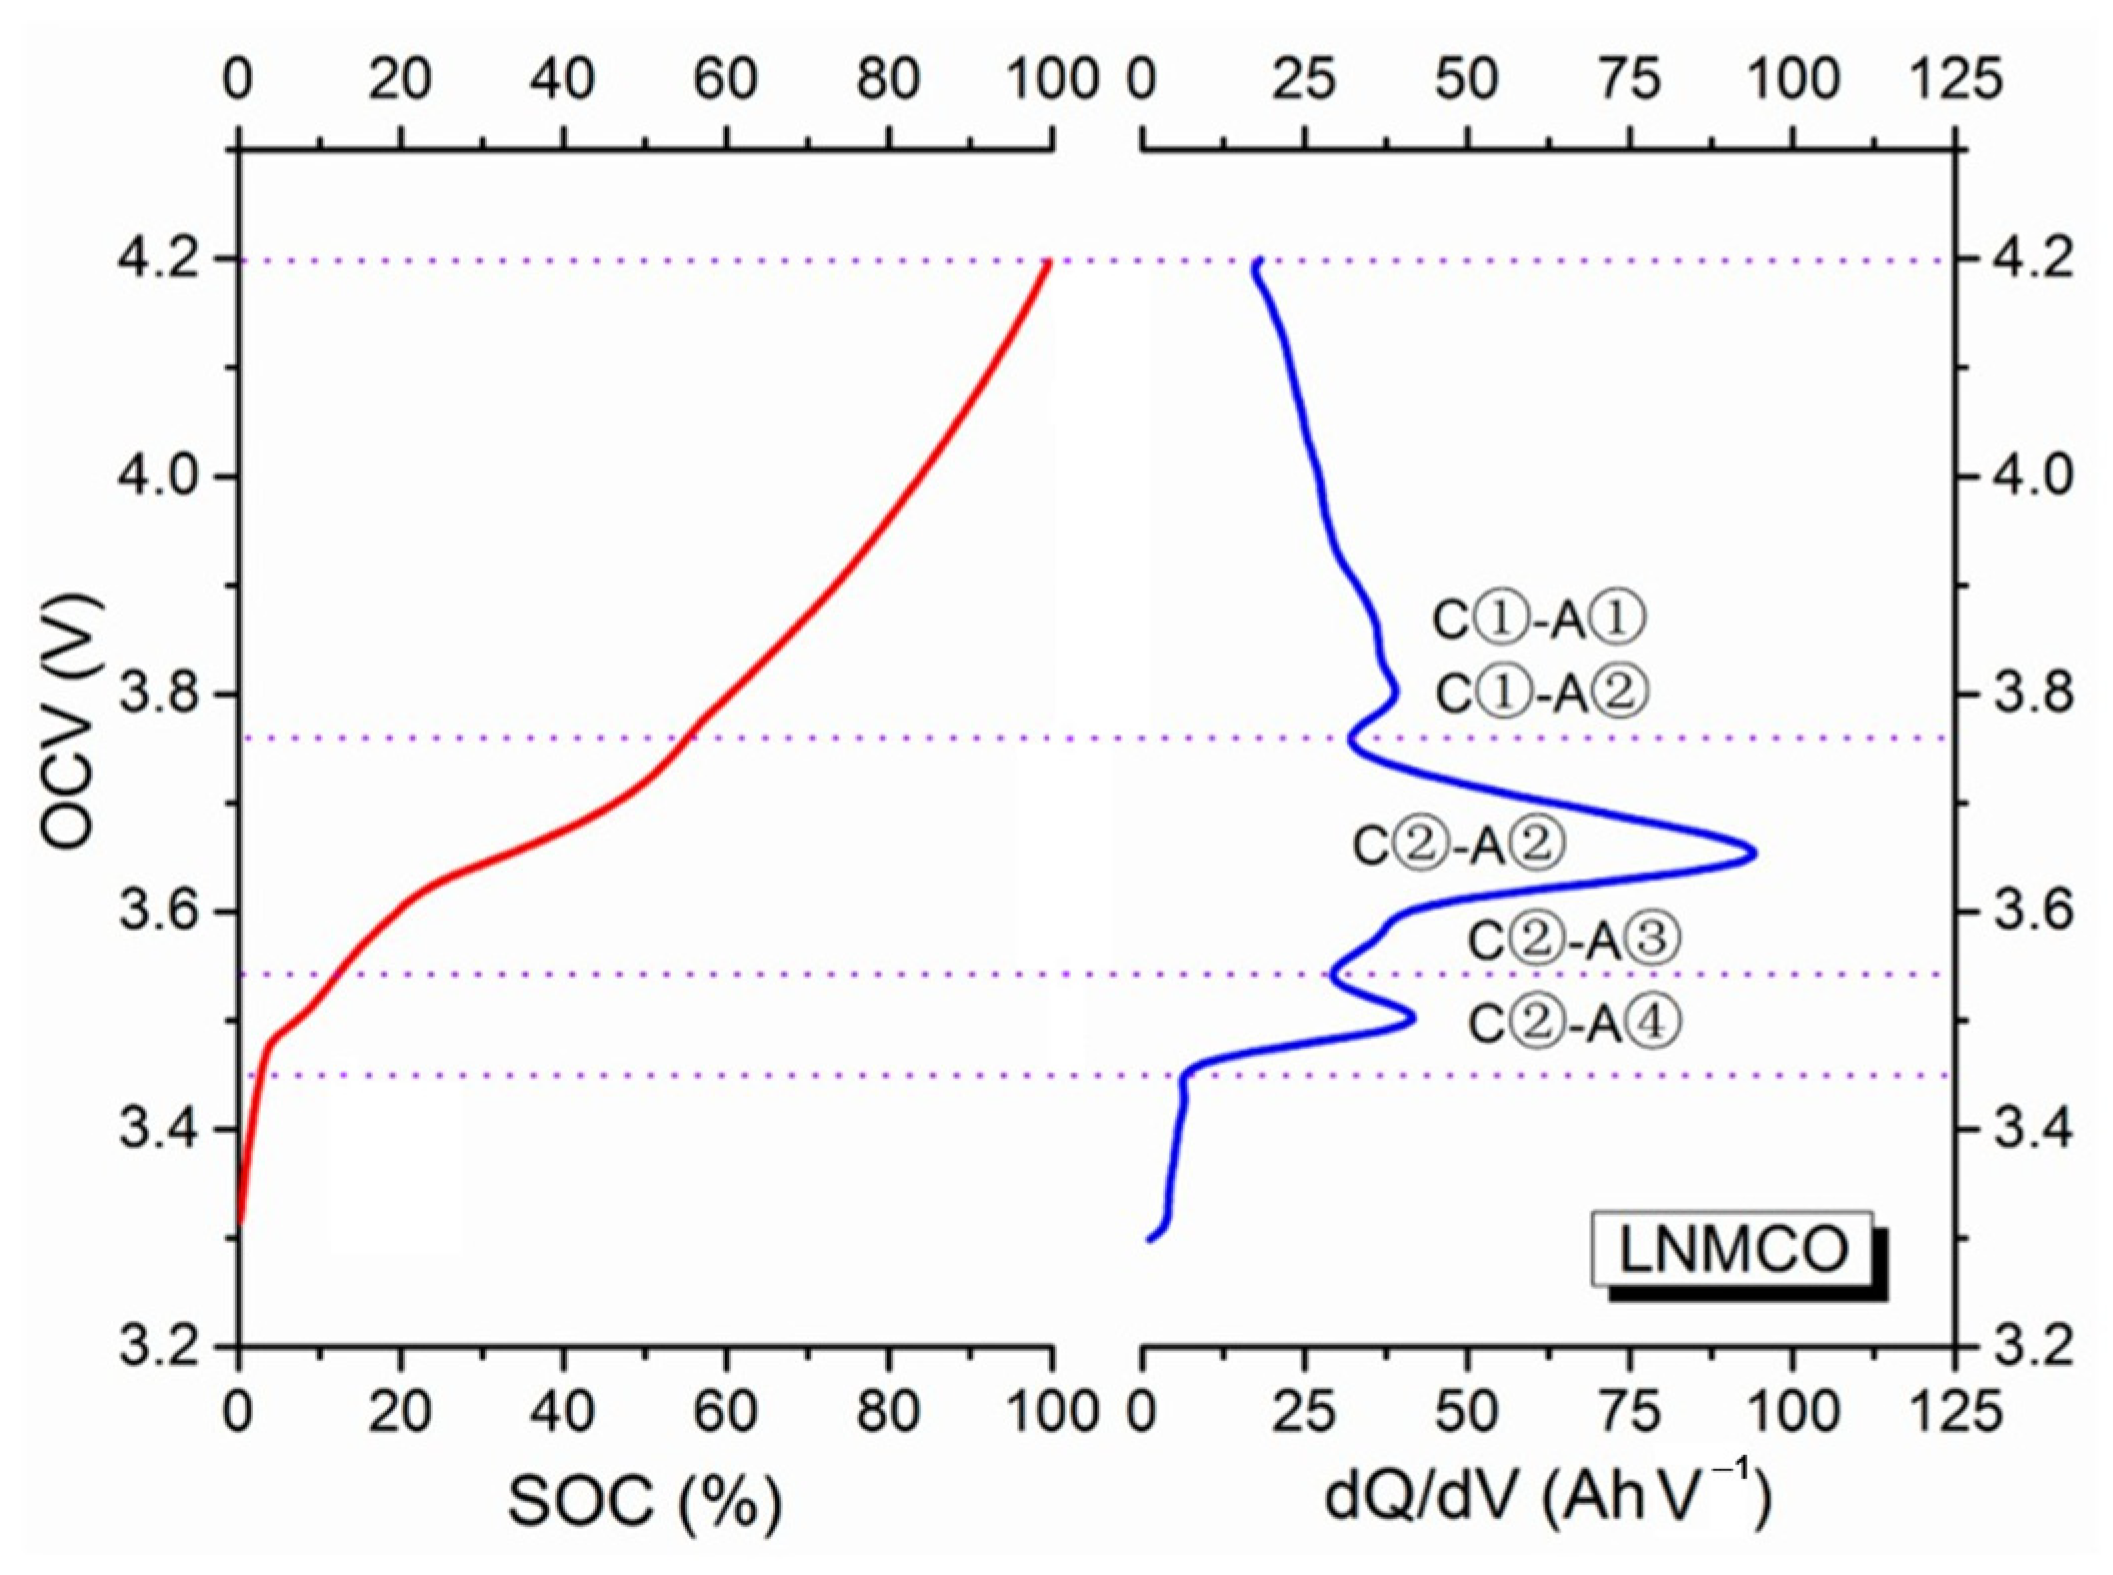
During lithium-ion battery operation and storage, parasitic side reactions induce capacity fade, impedance rise, and power deterioration. Figure 4 displays the characteristic SOC-OCV profile and corresponding initial IC curve for commercial NMC/graphite batteries. Table 1 summarizes the internal electrochemical reactions.
According to (5), the equilibrium potential Uref of electrode materials is governed by the degree of lithiation ξ. Characteristic peaks in IC/DV curves emerge at critical ξ values. Building on the relationship between cs,avg, j f ¯ , and capacity established in (3) and (10), respectively, ξ can be expressed as a linear function of capacity:
ξ n ( C a p a c i t y ) = ξ n , C a p a c i t y = 0 + C a p a c i t y F V s , n c s , n , max ξ p ( C a p a c i t y ) = ξ p , C a p a c i t y = 0 C a p a c i t y F V s , p c s , p , max
where V s , j = A δ j ε s , j represents the effective volumes of anode/cathode active materials.
Simultaneously, Equation (5) defines OCV as the potential difference between cathode and anode equilibrium potentials. Consequently, OCV evolution is exclusively governed by active material transformations. The OCV-IC profiles are shown in the right panel of Figure 4. The integrated area under each IC peak corresponds to the lithium inventory participating in specific redox reactions.
Therefore, this study decomposes charge/discharge processes into several electrochemical redox reactions, as shown in Figure 4 and Table 1 [24].
In NCM cathodes, two solid-state redox reactions occur during charge/discharge cycling:
  • Reaction C① (voltage range of 4.2–3.75 V): Ni4+ ↔ Ni3+;
  • Reaction C② (voltage range of 3.75–3.55 V): Ni3+ ↔ Ni2+.
In the graphite anode, four distinct phase transformations occur during charge/discharge cycling:
  • A①: LiC6 ↔ LiC12 at 0.10–0.08 V;
  • A②: LiC12 ↔ LiC18 ↔ LiC36 at 0.14–0.11 V;
  • A③: LiC36 ↔ LiC72 at 0.22–0.20 V;
  • A④: LiC72 ↔ C6 above 0.30 V.
The NCM cathode material in lithium-ion batteries constitutes a complex system comprising three transition metals: nickel (Ni), cobalt (Co), and manganese (Mn). In theory, all three elements can participate in redox reactions during charge and discharge processes. Within the voltage window (3.0–4.2 V) upon which our analysis is based, nickel (Ni) serves as the primary contributor to capacity. In NCM622 material, the relatively high proportion of nickel means its redox reactions (Ni2+/Ni3+/Ni4+) dominate the majority of the reversible capacity. These reactions produce distinct characteristic peaks on the IC/DV curves. The redox potential of cobalt (Co) is relatively high (typically > 4.5 V), exceeding the conventional operating range of this battery system. In contrast, manganese (Mn) primarily functions as a structural stabilizer, maintaining a stable +4 valence state and thus not participating in electrochemical reactions. Therefore, in our analysis focusing on NCM622 material, we primarily concentrated on the redox reactions of nickel (Ni).

4. Experimental Results Analysis

4.1. Evolution of Electrode Lithiation States with Cycling

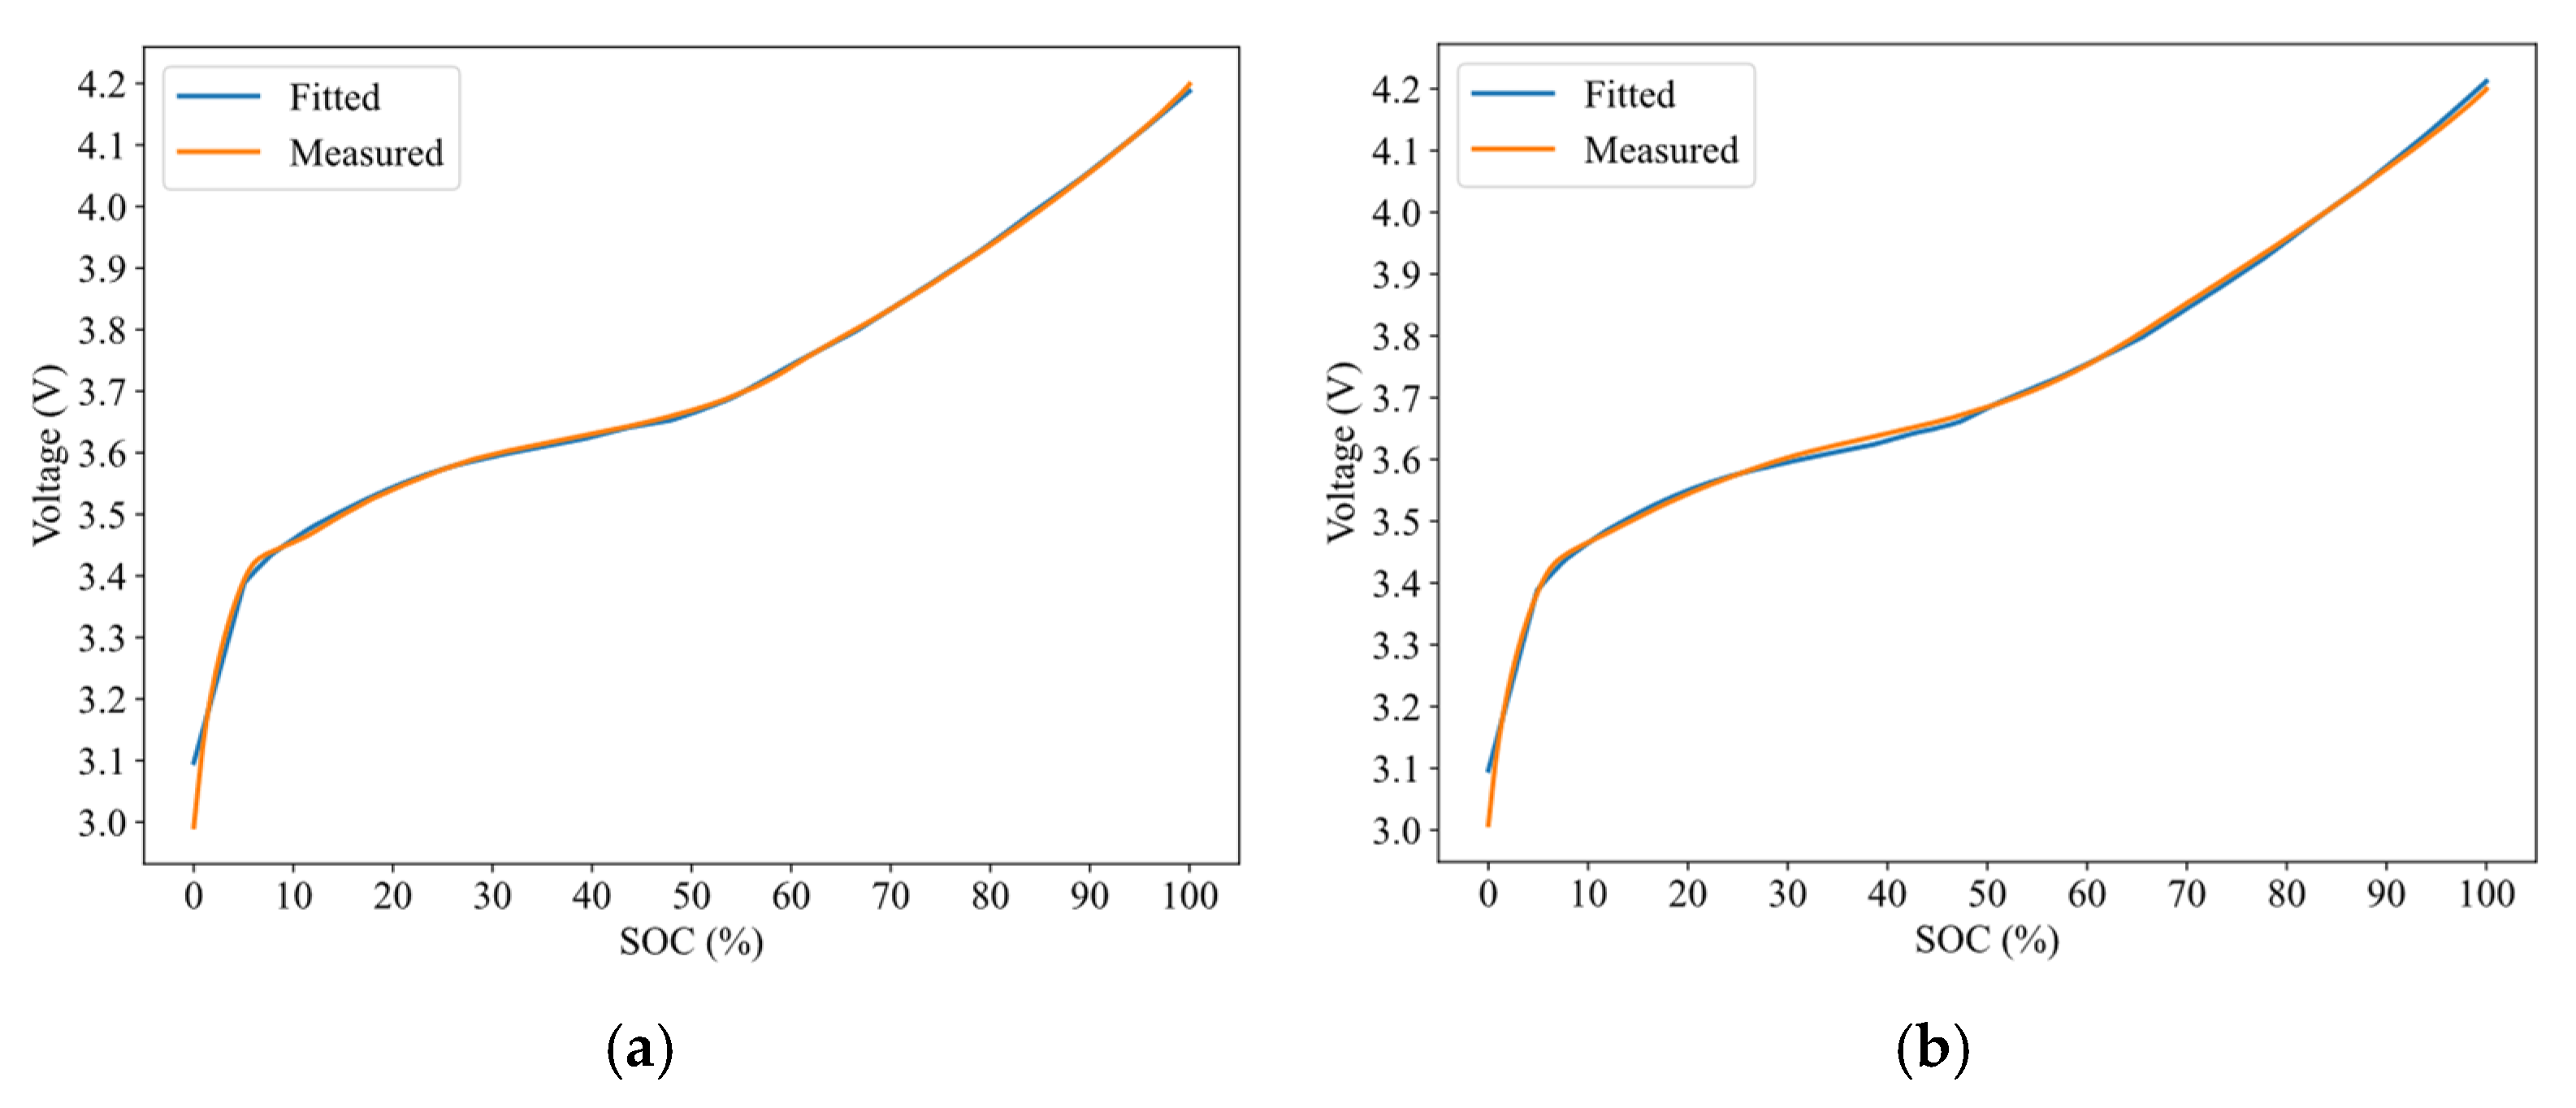
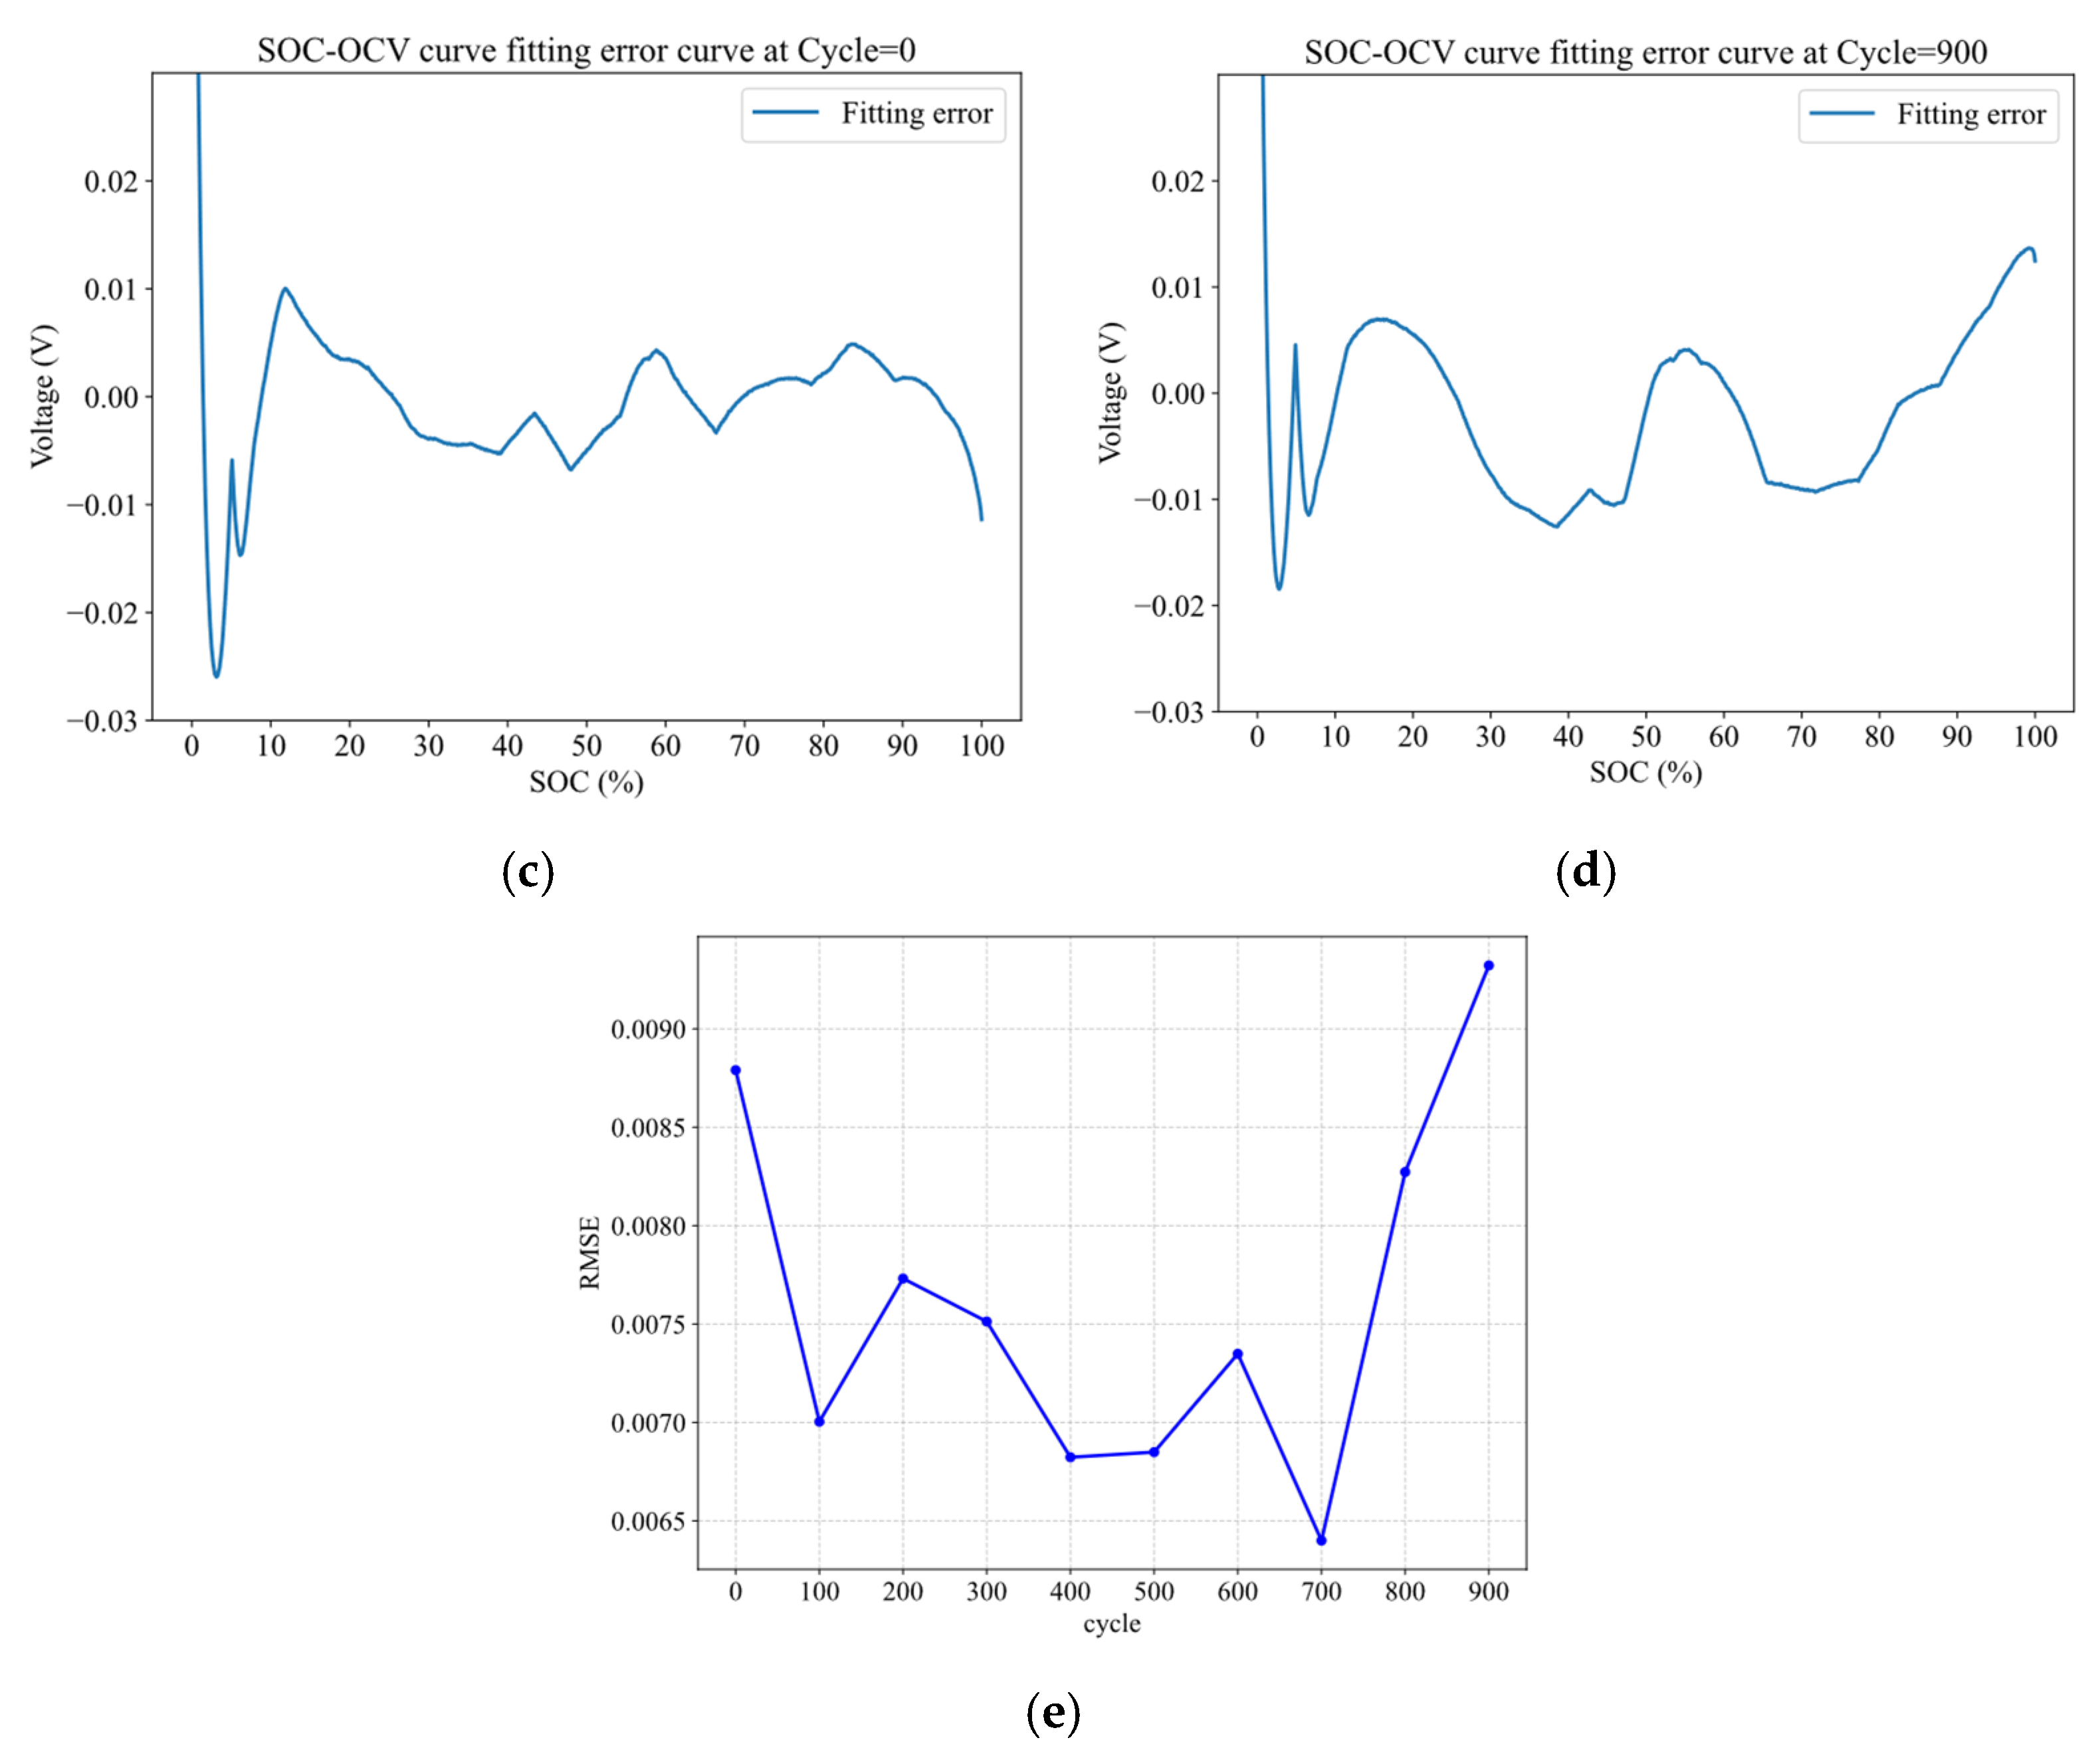
Figure 5 presents the fitting results between the proposed OCV reconstruction method and the experimentally measured OCV curves at cycle = 0 and cycle = 900, as well as the Root Mean Square Error (RMSE) between them. As shown in Figure 5c,d, the error remains below 10 mV over the majority of the SOC range but significantly increases in the vicinity of SOC = 0%. As shown in Figure 5e, the maximum RMSE throughout the aging phase is 0.00932.
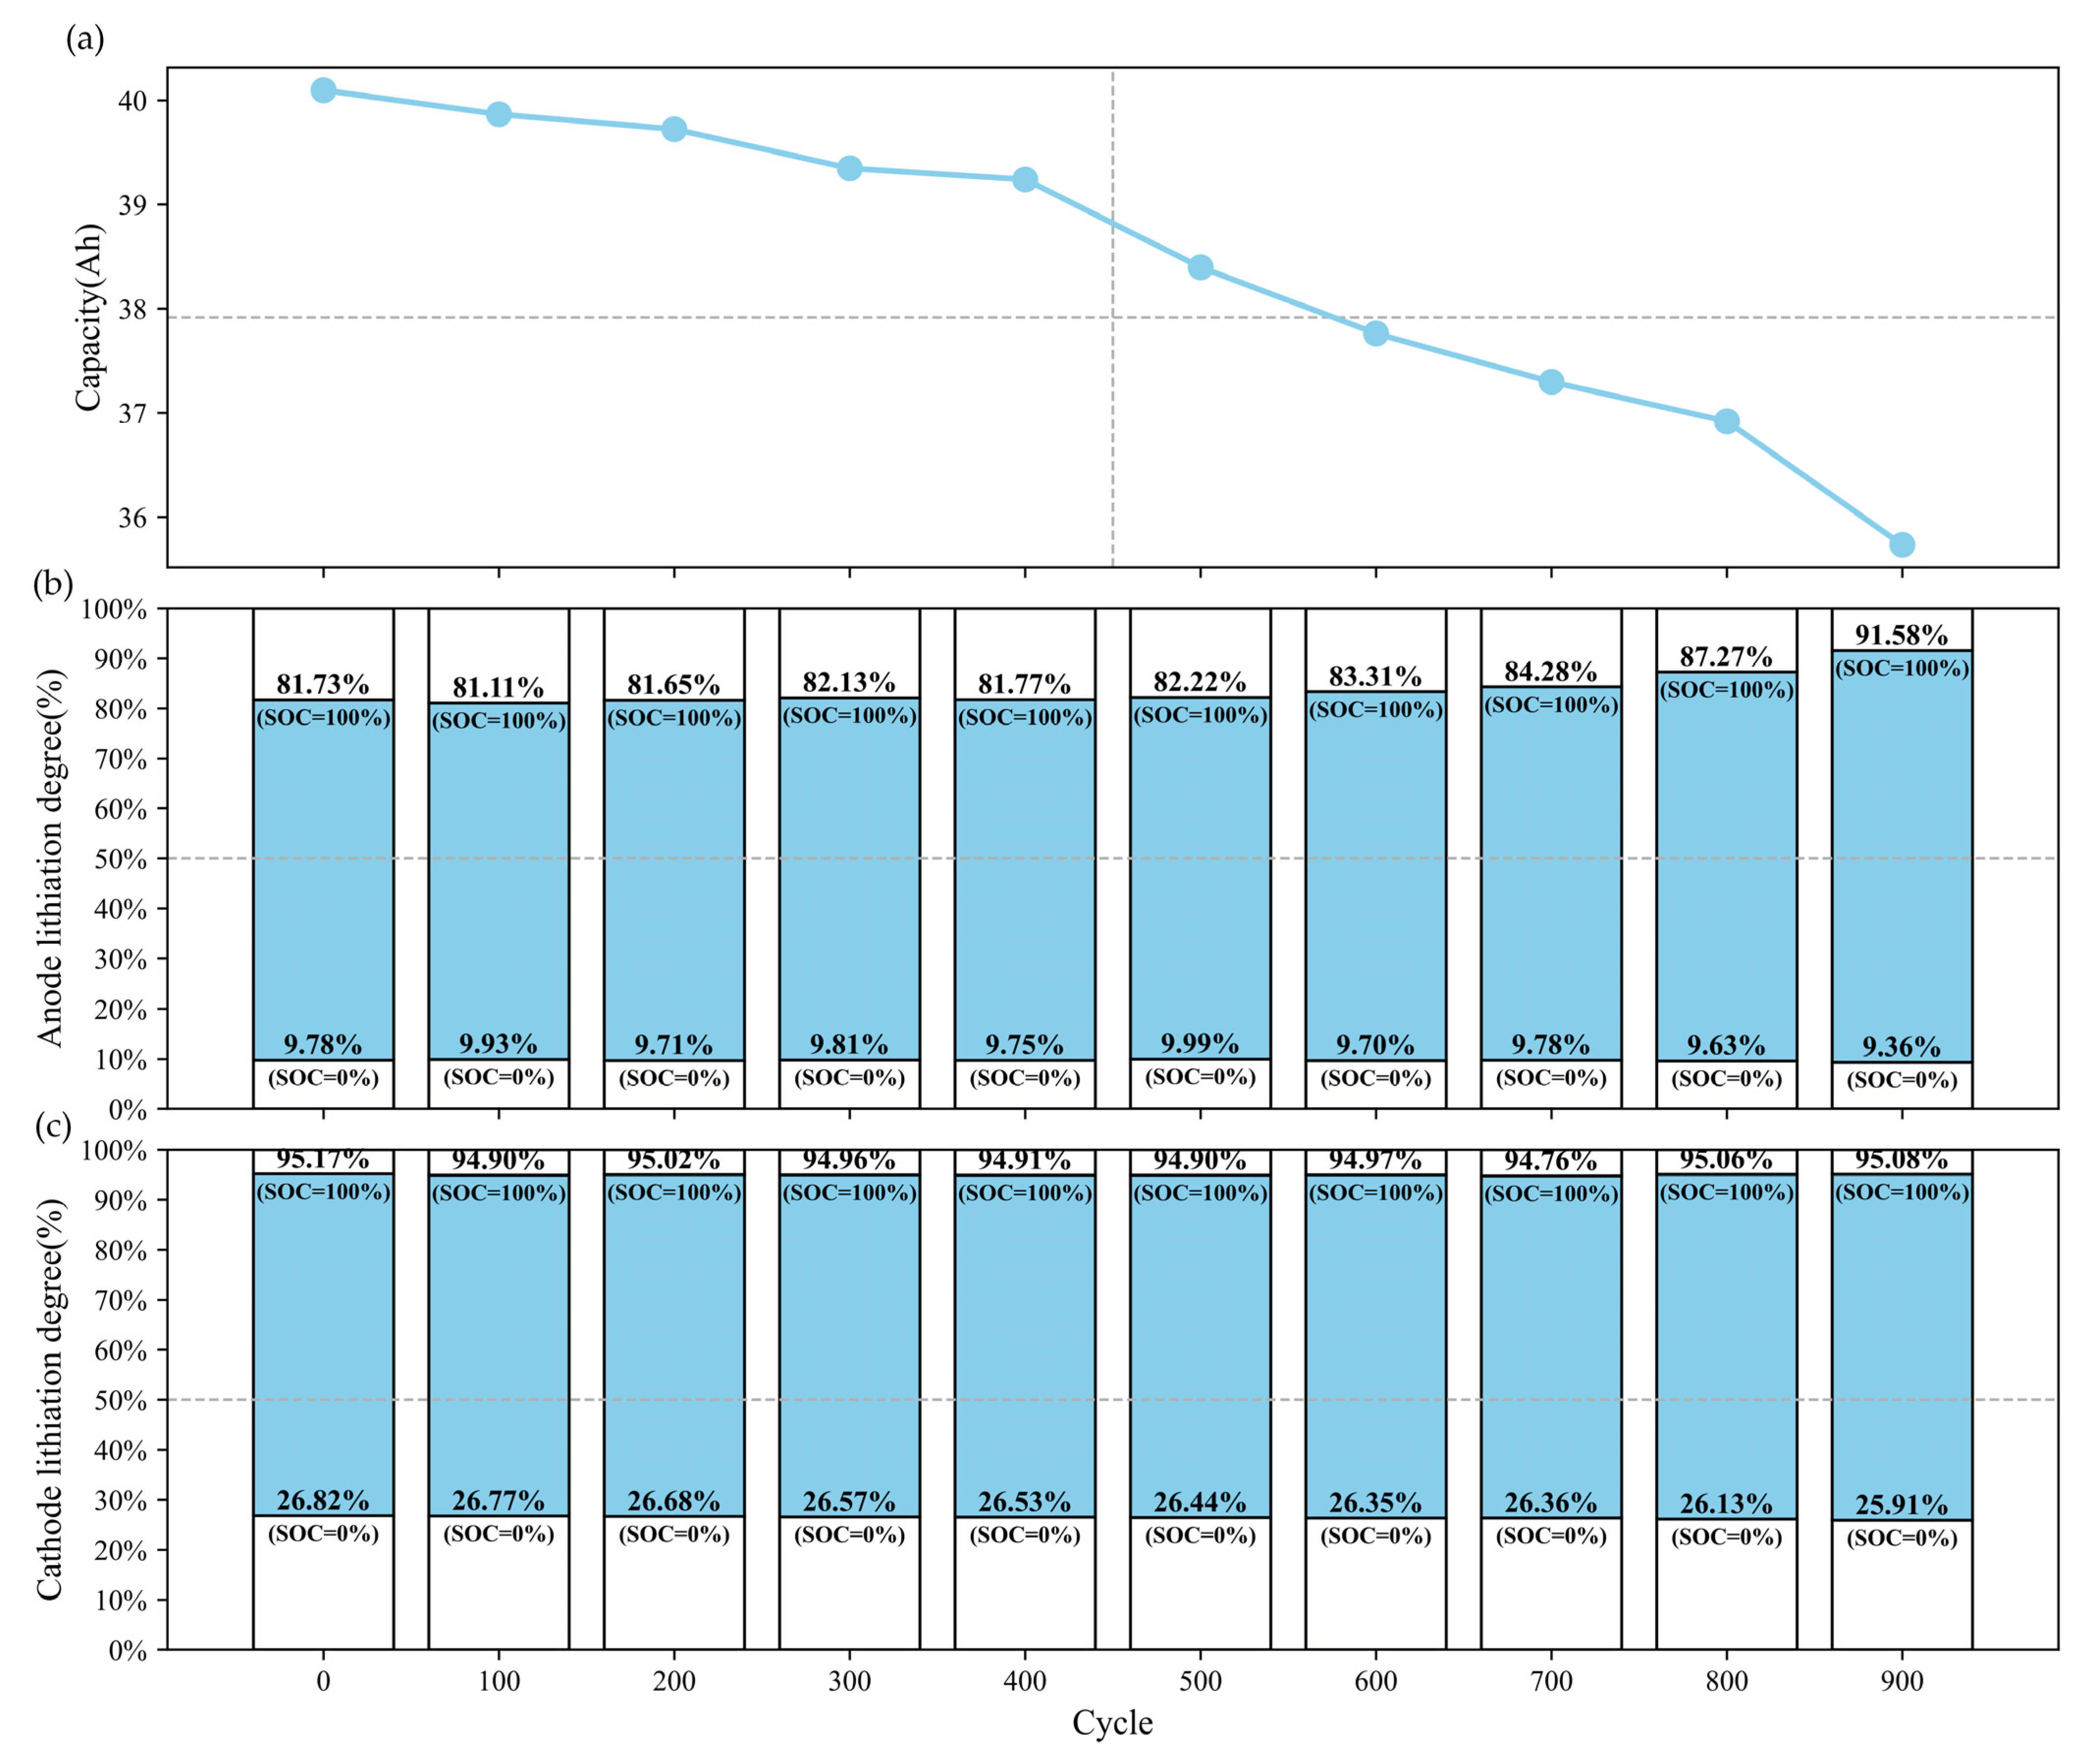
Figure 6 displays the experimentally measured battery capacity degradation curve, along with the degree of lithiation for both the anode and the cathode. As shown in Figure 6, the lithiation degree of the anode at SOC = 0% remains virtually unchanged. Compared with the measured reference point and the data at SOC = 100%, this comparison provides a clearer reflection of the variations under fully charged conditions. The critical observation emerges when comparing SOC = 100% data: the anode lithiation state systematically increases with aging. This indicates that progressively more lithium ions must be intercalated into the anode to reach the same full-charge voltage cutoff, demonstrating a continuous reduction in anode available capacity. The increasing lithiation requirement at SOC = 100% reveals two primary degradation mechanisms: (1) Progressive SEI Growth: Following initial formation, a primary SEI layer passivates the anode surface. This process irreversibly consumes lithium ions and electrolyte, resulting in the typical <100% initial coulombic efficiency. During cycling, dynamic SEI fracture-repair processes further deplete active lithium. Concurrently, SEI thickening occupies electrode surface area and blocks graphite pores, reducing accessible intercalation sites and increasing impedance for lithium insertion. (2) Lithium Plating: Under aggressive operating conditions (e.g., low temperature, fast charging), lithium ions may preferentially deposit as metallic lithium rather than intercalating into graphite. This plated lithium reacts with electrolyte to form electrochemically inactive “dead lithium” and additional SEI, further consuming active lithium and blocking surface sites. In contrast, the cathode exhibits remarkable stability with minimal lithiation change at SOC = 100% and only a 0.91% shift at SOC = 0%, indicating that it is not the primary direct source of capacity degradation. However, minor degradation may have occurred at the cathode–electrolyte interface, potentially masked by dominant aging modes: (1) growth of the Cathode Electrolyte Interphase (CEI) consumes trace active lithium, though significantly less than SEI consumption; (2) increased interfacial impedance occurs at the cathode surface. But this study focuses on reconstructing open-circuit voltage curves under static conditions to identify the lithiation degree of electrode active materials at different SOC states.

4.2. IC-Based Degradation Mechanism Analysis Results

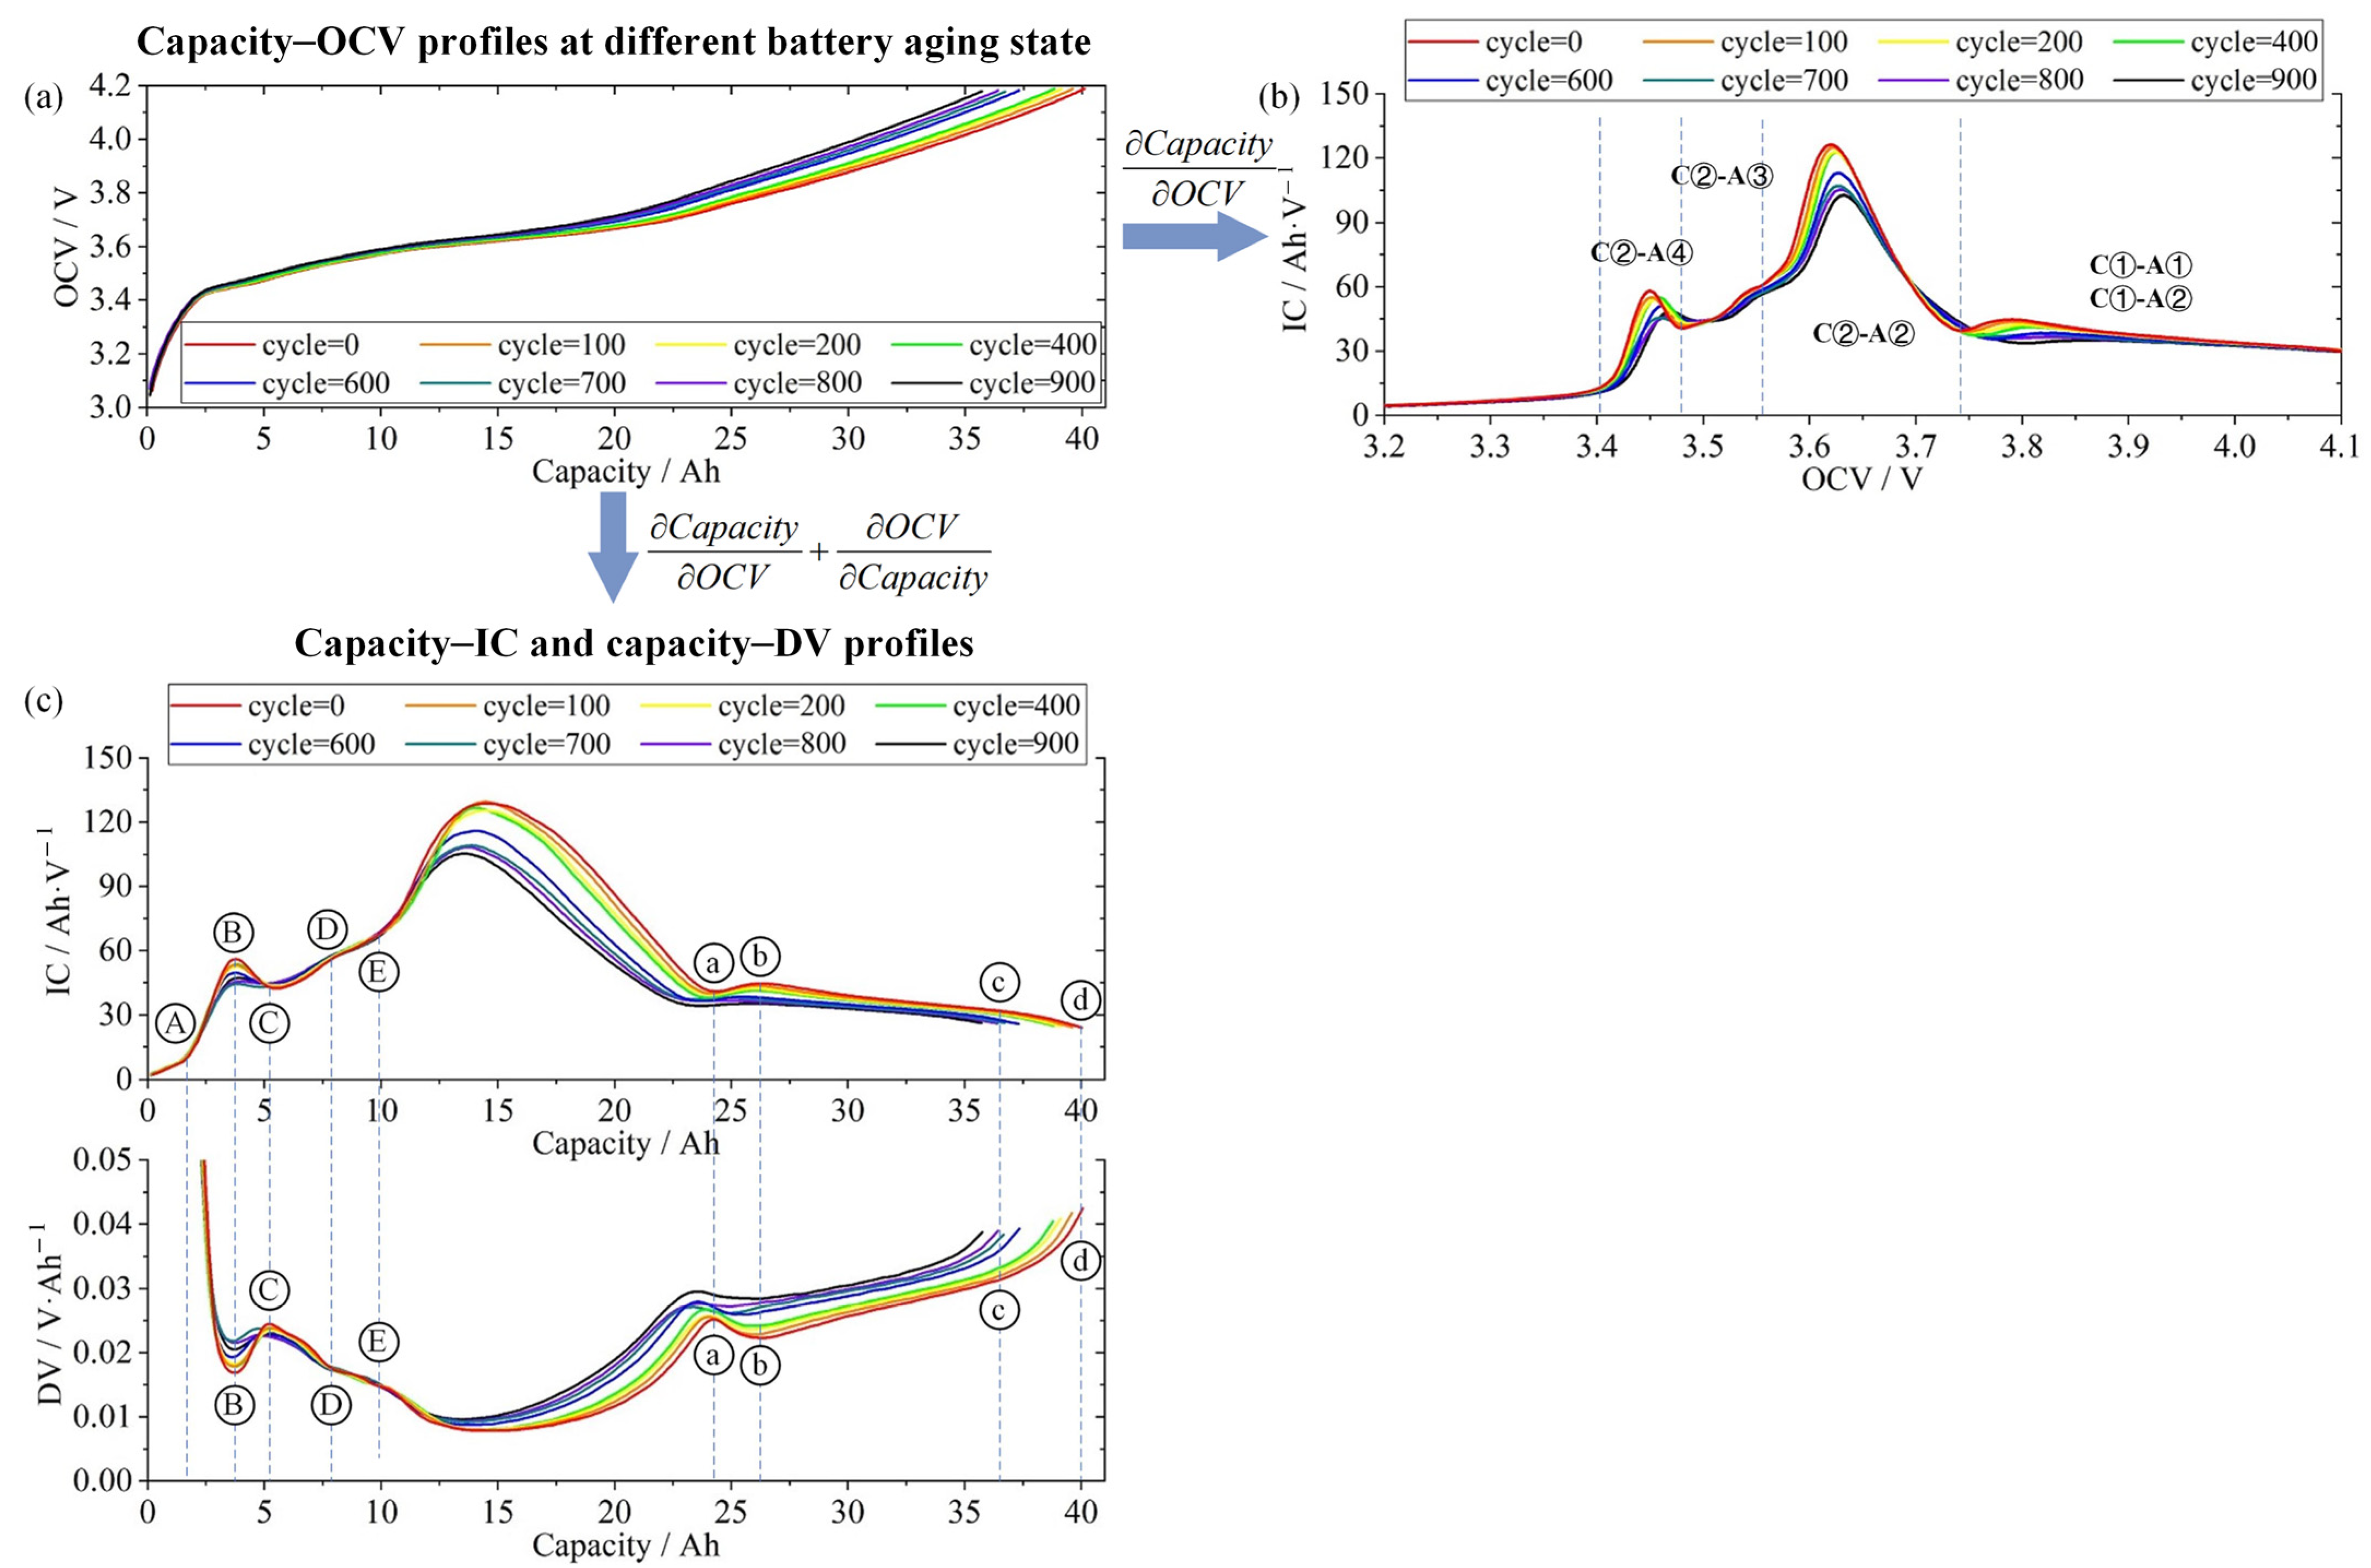
Figure 7a shows capacity–OCV profiles during accelerated aging of the battery. To suppress numerical noise, Figure 7b shows OCV-IC profiles (cycle = 0) after Gaussian smoothing (GS) with σ = 1.5, where peak areas quantify lithium inventory in redox reactions.
According to Figure 7a, the experimental OCV-IC profile aligns with the characteristic IC profile of LNMCO/graphite batteries in Figure 4. Thus, charge/discharge processes are similarly decomposed into electrochemical redox steps. The OCV-IC profiles (cycle = 0) for the NCM622 battery in Figure 7b exhibit peak superposition between C① and A① due to differences in initial lithium concentration and electrode volume design. Four distinct peaks correspond to C②-A④, C②-A③, C②-A②, and C①-A①.
Derived from capacity–OCV profiles, capacity–IC and capacity–DV profiles are as shown in Figure 7c. GS filters were applied consistent with OCV-IC processing. Corresponding to the peak and convexity on the capacity increment curve, the valley and concaveness on the differential voltage curve represent the voltage platform in the phase transition of the active substance at the positive and negative electrodes. Taking the fresh cell (cycle = 0) as an example, the feature of interest (FOI) of graphite (anode) is labeled as Applsci 15 10079 i001 to Applsci 15 10079 i002, and the FOI of NCM622 (cathode) is labeled as Applsci 15 10079 i003 to Applsci 15 10079 i004. The location of the FOI is shown in Figure 7c, and its physical significance is shown in Table 2. The evolution of these FOIs (e.g., peak shift or attenuation) aligns with the degradation pathways inferred from the OCV reconstruction analysis.

5. Conclusions

To ensure the safe operation of lithium-ion batteries in electric vehicles, this study developed a non-destructive diagnostic method based on OCV reconstruction and IC/DV analysis under static conditions, using commercial power batteries as the research object. This method demonstrates potential for analyzing degradation pathways in various battery systems. Experimental results from aging tests on NCM622/graphite cells demonstrated the effectiveness of the proposed method. The method successfully captured the evolution of electrode lithiation degrees under both charged and discharged states and identified characteristic peak shifts in ICA/DV curves associated with nickel redox reactions and graphite phase transitions, providing clear physical insights into degradation pathways. Similarly, for other battery chemistries, the electrode material SOC-OCV data can also be acquired from the literature or databases, thereby allowing the proposed method to facilitate battery-aging analysis. Consequently, this methodology demonstrates broad applicability across various battery systems.
Relying solely on the OCV curve of the battery without requiring knowledge of internal design parameters, this method holds potential for integration into electric vehicle battery-management systems (BMSs). The onboard BMS could utilize slow-charging piles to perform a full charge–discharge cycle at 0.05 C, collecting high-precision SOC-OCV data for upload to the cloud. On the cloud platform, leveraging STA and IC/DV analyses, precise parameter identification and aging mechanism analysis can be efficiently accomplished.

Author Contributions

Conceptualization, J.Y. and Y.G.; methodology, J.Y. and W.Z.; software, J.Y.; validation, J.Y. and W.Z.; formal analysis, Y.G.; investigation, J.Y.; resources, W.Z.; data curation, J.Y. and W.Z.; writing—original draft preparation, J.Y.; writing—review and editing, J.Y. and W.Z.; visualization, J.Y.; supervision, Y.G. and W.Z.; funding acquisition, Y.G. and W.Z. All authors have read and agreed to the published version of the manuscript.

Funding

This work was funded in part by the National Natural Science Foundation of China (No. 52307247), in part by the S&T Program of Hebei (No. 24464401D), and in part by the Shanxi Provincial Basic Research Program (No. 202203021222124).

Data Availability Statement

Restrictions apply to the availability of these data. Data were obtained from the Intelligent Systems and Control Laboratory, College of Electrical and Power Engineering, Taiyuan University of Technology, and are available from the authors with the permission of the Intelligent Systems and Control Laboratory, College of Electrical and Power Engineering, Taiyuan University of Technology.

Conflicts of Interest

The authors declare no conflicts of interest.

Abbreviations

Variable/SymbolDescriptionUnits
V(t)output voltageV
Vmaxupper cut-off voltageV
Vminlower cut-off voltageV
E(t)relative equilibrium potentialV
ηSEI(t)SEI resistance dropV
ηelectrolyte(t)electrolyte ohmic dropV
ηact(t)activation overpotentialV
Iconstant currentA
pcathode parameter-
nanode parameter-
Uref(t)equilibrium potential of active materialsV
cs,surf(t)surface Li-ion concentrationmol/m3
cs,avgaverage lithium-ion concentrationmol/m3
cs,maxmaximum intercalation concentrationmol/m3
RSEISEI resistanceΩ
asspecific surface area of active particlesm−1
j f ¯ local current densityA/m2
δ thickness of electrodes and separatorm
Κeffeffective ionic conductivity of electrolyteS/m
Runiversal gas constantJ/(mol·K)
TtemperatureK
αcharge transfer coefficient-
FFaraday’s constantC/mol
Atotal equivalent surface aream2
Rsactive particle radiusm
Dssolid-phase Li+ diffusion coefficientm2·s−1
kkinetic reaction constant-
Uoc(t)open-circuit voltageV
εssolid-phase volume fraction of active materials-
nLi,usefulusable lithium-ion molar quantitymol
Vs,jeffective volumes of anode/cathode active materialsm3
ξlithiation degree-

References

  1. Wang, Z.; Zhao, X.; Fu, L.; Zhen, D.; Gu, F.; Ball, A.D. A review on rapid state of health estimation of lithium-ion batteries in electric vehicles. Sustain. Energy Technol. Assess. 2023, 60, 103457. [Google Scholar] [CrossRef]
  2. Wang, F.; Zhai, Z.; Zhao, Z.; Di, Y.; Chen, X. Physics-informed neural network for lithium-ion battery degradation stable modeling and prognosis. Nat. Commun. 2024, 15, 4332. [Google Scholar] [CrossRef] [PubMed]
  3. Li, Y.; Gao, G.; Chen, K.; He, S.; Liu, K.; Xin, D.; Luo, Y.; Long, Z.; Wu, G. State-of-health prediction of lithium-ion batteries using feature fusion and a hybrid neural network model. Energy 2025, 319, 135163. [Google Scholar] [CrossRef]
  4. Barcellona, S.; Colnago, S.; Dotelli, G.; Latorrata, S.; Piegari, L. Aging effect on the variation of Li-ion battery resistance as function of temperature and state of charge. J. Energy Storage 2022, 50, 104658. [Google Scholar] [CrossRef]
  5. Xiao, Y.; Wen, J.; Yao, L.; Zheng, J.; Fang, Z.; Shen, Y. A comprehensive review of the lithium-ion battery state of health prognosis methods combining aging mechanism analysis. J. Energy Storage 2023, 65, 107347. [Google Scholar] [CrossRef]
  6. Sun, R.; Chen, J.; Li, B.; Piao, C. State of health estimation for Lithium-ion batteries based on novel feature extraction and BiGRU-Attention model. Energy 2025, 319, 134756. [Google Scholar] [CrossRef]
  7. Peng, S.; Sun, Y.; Liu, D.; Yu, Q.; Kan, J.; Pecht, M. State of health estimation of lithium-ion batteries based on multi-health features extraction and improved long short-term memory neural network. Energy 2023, 282, 128956. [Google Scholar] [CrossRef]
  8. Li, X.; Yuan, C.; Wang, Z. State of health estimation for Li-ion battery via partial incremental capacity analysis based on support vector regression. Energy 2020, 203, 117852. [Google Scholar] [CrossRef]
  9. Yu, Q.; Nie, Y.; Liu, S.; Li, J.; Tang, A. State of health estimation method for lithium-ion batteries based on multiple dynamic operating conditions. J. Power Sources 2023, 582, 233541. [Google Scholar] [CrossRef]
  10. Wu, J.; Fang, L.; Dong, G.; Lin, M. State of health estimation of lithium-ion battery with improved radial basis function neural network. Energy 2023, 262, 125380. [Google Scholar] [CrossRef]
  11. Cheng, G.; Wang, X.; He, Y. Remaining useful life and state of health prediction for lithium batteries based on empirical mode decomposition and a long and short memory neural network. Energy 2021, 232, 121022. [Google Scholar] [CrossRef]
  12. Chang, C.; Wang, Q.; Jiang, J.; Wu, T. Lithium-ion battery state of health estimation using the incremental capacity and wavelet neural networks with genetic algorithm. J. Energy Storage 2021, 38, 102570. [Google Scholar] [CrossRef]
  13. Wang, W.; Yang, K.; Zhang, L.; Zhou, S.; Ren, B.; Lu, Y.; Tan, R.; Zhu, T.; Ma, B.; Yang, S.; et al. An end-cloud collaboration approach for online state-of-health estimation of lithium-ion batteries based on multi-feature and transformer. J. Power Sources 2024, 608, 234669. [Google Scholar] [CrossRef]
  14. Li, W.; Fan, Y.; Ringbeck, F.; Jöst, D.; Han, X.; Ouyang, M.; Sauer, D.U. Electrochemical model-based state estimation for lithium-ion batteries with adaptive unscented Kalman filter. J. Power Sources 2020, 476, 228534. [Google Scholar] [CrossRef]
  15. Lai, X.; He, L.; Wang, S.; Zhou, L.; Zhang, Y.; Sun, T.; Zheng, Y. Co-estimation of state of charge and state of power for lithium-ion batteries based on fractional variable-order model. J. Clean. Prod. 2020, 255, 120203. [Google Scholar] [CrossRef]
  16. Lai, X.; Weng, J.; Huang, Y.; Yuan, M.; Yao, Y.; Han, X.; Zheng, Y. A joint state-of-health and state-of-energy estimation method for lithium-ion batteries through combining the forgetting factor recursive least squares and unscented Kalman filter. Measurement 2022, 205, 112187. [Google Scholar] [CrossRef]
  17. Wang, T.; Pei, L.; Wang, T.; Lu, R.; Zhu, C. Capacity-loss diagnostic and life-time prediction in lithium-ion batteries: Part 1. Development of a capacity-loss diagnostic method based on open-circuit voltage analysis. J. Power Sources 2016, 301, 187–193. [Google Scholar] [CrossRef]
  18. Wang, F.; Tang, S.; Han, X.; Lu, L.; Yu, C.; Zhao, C.; Gao, Y.; Zhu, G.; Zhuang, K.; Ouyang, M. A voltage reconstruction model for lithium-ion batteries considering the polarization process. J. Power Sources 2023, 588, 233744. [Google Scholar] [CrossRef]
  19. Pan, B.; Dong, D.; Wang, J.; Nie, J.; Liu, S.; Cao, Y.; Jiang, Y. Aging mechanism diagnosis of lithium ion battery by open circuit voltage analysis. Electrochim. Acta 2020, 362, 137101. [Google Scholar] [CrossRef]
  20. Yang, S.; Zhang, C.; Jiang, J.; Zhang, W.; Gao, Y.; Zhang, L. A voltage reconstruction model based on partial charging curve for state-of-health estimation of lithium-ion batteries. J. Energy Storage 2021, 35, 102271. [Google Scholar] [CrossRef]
  21. Schaltz, E.; Stroe, D.I.; Nørregaard, K.; Ingvardsen, L.S.; Christensen, A. Incremental Capacity Analysis Applied on Electric Vehicles for Battery State-of-Health Estimation. IEEE Trans. Ind. Appl. 2021, 57, 1810–1817. [Google Scholar] [CrossRef]
  22. Xie, Y.; Wang, S.; Zhang, G.; Takyi-Aninakwa, P.; Fernandez, C.; Blaabjerg, F. A review of data-driven whole-life state of health prediction for lithium-ion batteries: Data preprocessing, aging characteristics, algorithms, and future challenges. J. Energy Chem. 2024, 97, 630–649. [Google Scholar] [CrossRef]
  23. Dubarry, M.; Truchot, C.; Liaw, B.Y. Synthesize battery degradation modes via a diagnostic and prognostic model. J. Power Sources 2012, 219, 204–216. [Google Scholar] [CrossRef]
  24. Zhang, C.; Jiang, J.; Zhang, L.; Liu, S.; Wang, L.; Loh, P.C. A Generalized SOC-OCV Model for Lithium-Ion Batteries and the SOC Estimation for LNMCO Battery. Energies 2016, 9, 900. [Google Scholar] [CrossRef]
Figure 1. Schematic representation of SP model for lithium-ion batteries.
Applsci 15 10079 g001
Figure 2. Equilibrium potentials Uref of electrode materials and open-circuit voltage Uoc profile.
Applsci 15 10079 g002
Figure 3. The state update iterative process of the STA.
Applsci 15 10079 g003
Figure 4. SOC-OCV profile and IC curve for commercial NMC/graphite lithium-ion battery.
Applsci 15 10079 g004
Figure 5. (a) SOC-OCV curve fitting results (cycle = 0); (b) SOC-OCV curve fitting results (cycle = 900); (c) SOC-OCV curve fitting error curve (cycle = 0); (d) SOC-OCV curve fitting error curve (cycle = 900); (e) The RMSE between the proposed OCV reconstruction method and the experimentally measured OCV.
Applsci 15 10079 g005aApplsci 15 10079 g005b
Figure 6. (a) Experimentally measured battery capacity degradation curve; (b) anode lithiation degree; (c) cathode lithiation degree.
Applsci 15 10079 g006
Figure 7. Aging evolution curves for NCM622 battery: (a) capacity–OCV profiles; (b) OCV-IC profiles (cycle = 0); (c) capacity–IC and capacity–DV profiles.
Applsci 15 10079 g007
Table 1. Electrochemical redox reactions in LNMCO/graphite systems.
ElectrodeC①-A①C①-A②C②-A②C②-A③C②-A④
CathodeC①
Ni4+ ↔ Ni3+
C②
Ni3+ ↔ Ni2+
AnodeA①
LiC6 ↔ LiC12
A②
LiC12 ↔ LiC18 ↔ LiC36
A③
LiC36 ↔ LiC72
A④
LiC72 ↔ C6
Table 2. Physical significance of FOI on IC/DV curves.
ElectrodeFOIPhysical MeaningRemark
graphiteApplsci 15 10079 i005Start of phase transformation LiC72 ↔ C6Corresponds to the starting voltage plateau of lithium deintercalation.
Applsci 15 10079 i006Phase transformation LiC72 ↔ C6Point of phase transformation completion, reflecting the integrity of the phase transformation in the high SOC region of the anode.
Applsci 15 10079 i007Start of phase transformation LiC36 ↔ LiC72Corresponds to phase transformation in the medium–high SOC region.
Applsci 15 10079 i008Phase transformation LiC36 ↔ LiC72Point of phase transformation completion, coupled with the cathode C② reaction.
Applsci 15 10079 i009Start of phase transformation LiC12 ↔ LiC18 ↔ LiC36Corresponds to multi-stage phase transformation in the medium SOC region.
NCM622Applsci 15 10079 i010Start of phase transformation Ni4+ ↔ Ni3+Corresponds to the redox reaction in the high-voltage region.
Applsci 15 10079 i011Phase transformation Ni4+ ↔ Ni3+ and LiC6 ↔ LiC12The IC peaks of C① and A① overlap. As the lithium-ion battery ages, the IC peak of C① gradually shifts left, making FOI increasingly inaccurate.
Applsci 15 10079 i012Convexity of the IC curveThe peak area reflects the amount of available lithium ions in the high-voltage region; peak attenuation during aging indicates LLI.
Applsci 15 10079 i013 U p r e f ≈4.27 VDuring phase transformation A① ,   U n r e f     0.08   V .   Therefore ,   at   the   end   of   the   CC - CV   charging   process ,   OCV     4.19   V ,   U p r e f ≈ 4.27 V.
Disclaimer/Publisher’s Note: The statements, opinions and data contained in all publications are solely those of the individual author(s) and contributor(s) and not of MDPI and/or the editor(s). MDPI and/or the editor(s) disclaim responsibility for any injury to people or property resulting from any ideas, methods, instructions or products referred to in the content.