Article

Potential Evaluation of Cross-Seasonal Heat Storage of Coal Mine Underground Reservoir: A Case Study Based on Multiphysics Coupling Numerical Simulation Method

1
State Key Laboratory of Water Resource Protection and Utilization in Coal Mining, National Institute of Low Carbon and Clean Energy, Beijing 102211, China
2
School of Civil Engineering and Architecture, Northeast Electric Power University, Jilin City 132012, China
3
China Construction Second Engineering Bureau Co., Ltd., Beijing 100160, China
*
Authors to whom correspondence should be addressed.
Appl. Sci. 2025, 15(18), 10070; https://doi.org/10.3390/app151810070
Submission received: 23 July 2025 / Revised: 11 September 2025 / Accepted: 11 September 2025 / Published: 15 September 2025

Abstract

This study explores the innovative use of post-mining subsurface voids by proposing a coal mine goaf-based underground reservoir energy storage system. By fully utilizing the geothermal potential and insulation properties of the mined-out coal seam, we established a finite element model considering the thermal-fluid coupling process to describe the seasonal energy storage process of the underground coal mine reservoir and analyzed the feasibility of achieving seasonal hot water storage through the underground reservoir, based on the model calculation results. By studying the temperature state of the hot water after the end of the heat storage process and the hot water output effect, the thermal energy storage and utilization potential of the underground reservoir were quantitatively analyzed using the factors of heat storage and heat production. The research results have clarified the feasibility of using coal mine underground reservoirs for cross-seasonal heat storage applications. The results of this study can provide new ideas for the utilization of coal mine goaf areas and underground goaf residual spaces and serve as a reference for the development and design of new energy storage facilities.

1. Introduction

Coal resources are the main source of energy in China. Extensive goaf has been formed underground through mining operations in the mining area. These interconnected cavities now form a complex three-dimensional void system. Some studies indicate that by 2030, the number of closed or abandoned mines in China will reach 15,000 [1]. After the termination of mining activities, the resulting caves and cracks created new underground spaces, and, when these mines accumulate water, they create new aquifers. These geological structures accelerate groundwater depletion and soil quality deterioration, which cause ground subsidence and damage the stability of surface infrastructure. These abandoned mining areas are located far from the city center, at depths exceeding 500 m, and are still in the early stages of development. Utilizing them through traditional methods is particularly challenging [2].
In current research on coal mine underground reservoirs, most studies are conducted with the purpose of water storage, and these reservoirs can achieve in situ water storage and flow management within the previous mining space. Chen et al. [3]. were the first to propose the structure and operational mode of underground reservoirs in coal mines, and they studied the feasibility of using goaf areas for mine water management. Based on this model, researchers conducted an on-site experiment of an underground reservoir at the Daliuta coal mine in the Shendong mining area. By comprehensively considering the geological structure of the shallow coal seam and the water balance conditions during operation, the water-storage performance of the underground reservoir in the coal mine was tested in the field, yielding optimistic results [4]. Field data and related site studies indicate that coal mine underground reservoirs that are used as water storage have a very high application potential [5,6].
Across the world, the secondary utilization of abandoned coal mines has been considered by researchers for a long time, and a lot of research has been carried out. Menéndez et al. [7] analyzed the feasibility of using an abandoned coal mine in northwest Spain to carry out pumped storage application. This study analyzes the stability of the 450 m-deep tunnel system in sandstone shale formation and analyzes the energy storage potential of using these tunnels to build pumped storage power stations. However, this kind of application is still for the storage of water in underground spaces and does not involve the storage and application of heat.
Due to the existence of the ground temperature gradient, the coal mine goaf usually has a rock temperature of 35~40 °C. Although it is difficult to produce hot water with this temperature underground, it has great potential for thermal insulation. This insulation property brings possibilities for the application of Underground Thermal Energy Storage (UTES). The underground space in the goaf can serve as a location for UTES for cross-seasonal thermal storage applications [8,9]. The research on the UTES application of thermal insulation mode has been carried out for more than 50 years around the world [10,11,12]. In 1984, Germany carried out the research on functional heat storage space in abandoned mines [13]. The results showed that the ore bed gradually filled with water after mining, and the ore bed water was heated by the formation temperature to form low enthalpy geothermal water, which has great development potential [14]. In this study, researchers carried out research on a wisdom 302 uranium deposit in Marienberg. In 2005, field experiments were carried out in this mine, energy storage infrastructure was built in the mine, and research on geothermal power generation was carried out, and good results were achieved [15].
Menéndez and Loredo [16] analyzed thermal energy extraction from flooded coal mines in Spain’s Asturian Basin, and the geothermal recovery potential from water-saturated mine cavities has been studied. The results show that thermal energy exploitation has achieved good results and reduced carbon emissions in the region. In addition, in Poland, the Netherlands, Germany and other countries, geothermal water production has been carried out by using the mined ore beds, and the geothermal water produced has been used to heat buildings, and a good heating effect has been achieved. However, the overall research results of the project show that although the use of abandoned ore beds can provide heat for buildings for heating applications, and compared with traditional fossil fuels, geothermal systems can provide better heating performance, the construction of mine geothermal systems and supporting heating facilities requires higher construction costs, and there are still some economic problems [17,18,19].
The above research shows that the mine formation and underground space have great potential for energy storage. However, it is only used for geothermal energy exploitation, and the produced fluid temperature is low, which is difficult to meet the demand of industrial heat for fluid temperature. Therefore, this study focuses on the energy storage application of underground space after mining. Previous research on underground water reservoirs in coal mines mainly focused on using them as water storage spaces without considering the thermal effects during application. However, there is little research on using a coal mine goaf as an energy storage space in other underground space energy storage studies. In order to evaluate the potential application of the coal mine goaf in cross-seasonal heat storage, this study used numerical simulation methods to analyze the performance of cross-seasonal heat storage and confirmed the potential of coal mine underground reservoirs in cross-seasonal heat storage. In this paper, a Coal Mine Underground Reservoir Energy Storage System (CMUR-ESS) has been proposed. This system integrates subsurface structures with geothermal characteristics to establish a seasonal “summer-storage/winter-utilization” application cycle. It uses native rock mass as thermal barriers and utilizes stable geothermal gradients for industrial waste heat storage. In this study, firstly, the finite element model of CMUR-ESS cross-seasonal heat storage was established by using the coupled multi-physical field theory, and the energy characteristics of the system in the heat-storage stage and heat-generation stage were analyzed. The feasibility and application potential of the system for inter-seasonal energy storage were evaluated. Then, for the key factors that affect the thermal storage performance of the system, the sensitivity analysis was carried out, the key parameters affecting the system were determined, and its impact on the system performance was evaluated. The results of this study provide a new idea for the secondary development of abandoned mines and also provide a reference for the design and research of CMUR-ESS.

2. Problem Setup

2.1. Conceptual Model of CMUR-ESS

In this study, we use the actual conditions of the 52503 working face in the 5-2 goaf of the Daliuta coal mine in the Shendong mining lot to establish CMUR-ESS model. Coal seam 5-2 is one of the main mining seams in the Daliuta coal mine, of which working face 52503 is an area where mining operations are completed in coal seam 5-2. In order to deal with the challenges brought by industrial water shortage, the Daliuta colliery has built an underground reservoir using the 52503 working face as the site for storing mine water. The lithology of the strata above and below the working face is mainly mudstone and sandy mudstone, with low permeability, which is an advantage for the construction of the underground reservoir [20,21,22,23].
The basic structure of CMUR-ESS is shown in Figure 1. The whole reservoir system is composed of the reservoir area, comprising the middle goaf area and surrounding rock. The depth of the bottom of the goaf is 420 m. According to the actual conditions of the mined-out area in the coal seam, the size of the surrounding rock is 500 m × 470 m × 90 m, and the size of the middle reservoir area is 200 m × 200 m × 10 m. In the model, the top of the reservoir area is 40 m away from the top of the model. The reservoir area is located in the middle of the model and surrounded by rock. A group of pipelines are set on the opposite corner of the reservoir, for the injection and production of water. In addition, an impermeable layer with a thickness of 1 m is set on the wall of the reservoir area to prevent water from leaking into the surrounding rock. In an energy storage period, the reservoir area of the system first stores hot water for a period of time, which is usually provided by the hot tail water of the plant in the slack season. Due to the thermal insulation performance of the surrounding rocks, only a small part of the heat energy inside the hot water can be lost during storage. After the heat storage period, the hot water in the reservoir is pumped out of the ground through the production pipe for utilization. In the process of production, out of consideration for water resource conservation, the used tail water is reinjected into the reservoir through the injection pipe to ensure the balance of water volume and help the flow of hot water in the reservoir. This is also the most convenient tail water treatment method under the condition of maintaining no loss of water. This kind of reservoir operation setting can realize the cross-seasonal storage and utilization of heat energy, which keeps water resources from being wasted.

2.2. Governing Equations of CMUR-ESS

According to the difference in physical processes, CMUR-ESS can be divided into two parts: reservoir area and surrounding rock. The water in the reservoir area is continuously fluid. During the operation of the system, the reservoir area is governed by the N-S equation and the convection heat transfer equation, while the surrounding rock is regarded as porous media. In the analysis process, the infiltration of water into the surrounding rock, the seepage in the surrounding rock and the energy flow caused by seepage are considered. These processes can be governed by the seepage continuity equation and convection heat transfer equation in porous media.
The governing equations for each area are described in the following sections.

2.2.1. Governing Equations for the Fluid Flow

(1) Fluid flow in the reservoir area
As mentioned earlier, the fluid flow in the reservoir area is controlled by the Navier–Stokes (N-S) equation, which has the following form:
ρ u t + ρ u u = p I + K + F + ρ g
ρ u = 0
where ρ is the density; u is the fluid velocity; g is the gravitational acceleration; p is the fluid pressure and I is the unit tensor used to convert fluid pressure into a tensor acting on the equation.
In Equation (1), the effect of fluid viscosity on fluid pressure is considered, which is expressed by viscosity stress K in the equation, which can be calculated using:
K = μ u + u T
where μ is the fluid dynamic viscosity.
(2) Fluid flow in the surrounding rocks
In the area around the reservoir, the leakage of the reservoir area into the surrounding rock has been considered, and the leakage fluid in the surrounding rock is governed by the non-steady state seepage continuity equation based on Darcy’s law, and its governing equation is as follows:
t ε p ρ · ρ f × k μ p r = q m
where p r is the pressure of the fluid inside the surrounding rocks; k is the permeability; q m is the mass recharge source of seepage field and ε p is the porosity of the rock.
In the boundary between the reservoir area and surrounding rock, the fluid flow is governed by Brinkman equation, which considers both the permeability of Darcy’s law and the shear stress caused by viscosity in the fluid, and is widely used in the analysis of the transition area between porous media and free fluid [24]. The Brinkman equation is as follows:
1 ε p ρ u t = p I + K μ k + q m ε p 2 u + ρ g
K = μ ε p u + u T 2 μ 3 ε p u I
The meanings of the symbols in the formula are the same as previously mentioned.

2.2.2. Governing Equations for Heat Transfer

(1) Heat transfer in reservoir
The heat conduction in the reservoir area is governed by the heat conduction inside fluids and the heat convection caused by fluid flow. This process can be described by the linear transport equation for heat transfer [25], and the control equation is as follows:
ρ f c f T t = λ f T ρ f c f u T + R h r
where c f is the heat capacity of fluid; T is the temperature of fluid; λ f is the thermal conductivity of the fluid and R h r is the additional heat sources in the reservoir.
(2) Heat transfer in surrounding rocks
Similarly, the heat exchange in surrounding rock also includes two parts: heat conduction and heat convection via seepage. Differently from the reservoir area, the convection velocity in the surrounding rock is the seepage velocity of the fluid in the surrounding rock, and the calculation methods of some parameters in the equation are also different due to the porous media of surrounding rocks. The governing equation of heat exchange in surrounding rock is as follows [26]:
ρ c e f f T t = λ e f f T ρ f c f u s T + R h s
ρ c e f f = ε r ρ f c f + 1 ε r ρ r c r
where ρ c e f f is the mass heat capacity of saturated rock, which can be calculated by Equation (9); λ e f f is thermal conductivity of saturated rock; R h s is the additional heat source in surrounding rock; ε r is the porosity of the surrounding rock and ρ r and c r are density and heat capacity of surround rock, respectively. u s is seepage velocity in rock, which computed using Darcy’s law:
u s = k μ p r

2.3. Boundary and Initial Conditions

Based on the actual structure of CMUR-ESS, the model includes the fluid area of the reservoir area and the surrounding rock region outside. The boundary between the two regions is a seepage continuity boundary, where the temperature and seepage velocity within both regions remain equal. Since the surrounding rock of the model extends outward more than 100 m, the heat transfer and fluid flow within the surrounding rock do not affect the boundary. Therefore, the external boundary of the surrounding rock is set as a zero-flux boundary for heat and fluid flow. This approach reduces the computational overhead and ensures the accuracy of the model, which facilitates the numerical simulation.
In the field measured data, the geothermal gradient in this area is approximately 1.4 °C/100 m [3], which means that the initial temperature difference in the rocks at the top and bottom of the model is less than 1.5 °C. Because of this, in the initial state, the temperature of the surrounding rock is set to 40 °C, and the fluid pressure is set according to the hydrostatic pressure. This can improve computational efficiency without significant impact. Since the depth at the top of the model is 380 m, the pressure at the top of the model is 3.025 MPa, and the pressure at the bottom is 4.707 MPa; the overall initial temperature of the surrounding rock is set to 40 °C. In the reservoir area, the fluid pressure is set to the hydrostatic pressure of the continuous fluid, with the hydrostatic surface located at the top of the reservoir, automatically balanced according to hydrostatic pressure within the 10 m height of the reservoir area. Initially, the reservoir is filled with hot water at a temperature of 90 °C. Additionally, during the heating phase of the CMUR-ESS, tailwater at a temperature of 40 °C is injected at a constant pressure into the injection pipe, while water is pumped out at a fixed flow rate by the extraction pipe. The water injection and production in the model are realized by setting a constant pressure point source and constant flow point source. The two points are located at the opposite corners of the reservoir area, as shown in Figure 1.

2.4. Model Parameters

The layers of the model consist of mudstone, so the model can be considered as homogeneous [20]. Table 1 shows the thermo-physical parameters of the considered mudstone.

2.5. Simulation Scheme and Simulation Software

The numerical simulation of the CMUR-ESS was completed using COMSOL Multiphysics 6.2. It has a laminar flow interface to simulate the reservoir area and a groundwater flow interface to simulate the surrounding rock area. The connection between the two areas can be achieved with the connection boundary conditions. The built-in integration interfaces in COMSOL software facilitate the establishment and the solution of models.
The simulation of CMUR-ESS in the study contains two stages. The first stage is the heat storage, during which hot water is stored in a stationary state in the reservoir area. In this process, the heat exchange between the hot water and the surrounding rock are considered. The duration of this stage is 180 days, which meets the current operating conditions of CMUR-ESS and is also the longest cross-seasonal heat storage time (from summer to winter). Subsequently, in the heat production stage, the hot water in the reservoir area is extracted through the production pipe. The overall thermal storage and heat production performance of the system is evaluated by analyzing the production temperature. The duration of the heat production stage is 120 days. The time step control of the model is automatically set by COMSOL software, with an initial time step value of 1 day, and the total simulation duration is set to 300 days. At 180 days, the model operation phase transitions from the heat storage stage to the heat production stage. This transition is realized by controlling the point source boundaries at the injection and production points.
The fluid flow and heat transfer processes involved in the CMUR-ESS can be realized with COMSOL Multiphysics software. Fluid flow and heat transfer in the reservoir area can be modeled using the laminar non-isothermal flow interface [27], while the flow and heat transfer processes in the surrounding rock can be implemented using the Brinkman equation module within the non-isothermal flow interface [28]. During the analysis, a three-dimensional non-stationary model was selected to describe the evolution of the system state over time within a three-dimensional spatial range. These functions can be conveniently accessed and configured in COMSOL to perform numerical simulation and analysis of the heat storage and heat generation processes in the CMUR-ESS. The establishment of numerical models is completed by using the built-in modeling tools in the software, and mesh generation is carried out by using the software’s built-in mesh generator. After grid convergence verification, it was determined that using the predefined “Extra Fine” option can ensure the convergence and accuracy of the model.
In addition, to investigate the impact of main engineering factors of CMUR-ESS on heat storage and heat generation performance, a parameter sensitivity analysis was also conducted. The parameter sensitivity analysis examined the thermal conductivity, the specific heat capacity of the surrounding rock and the production flow rate during the heat generation process. The values of the relevant parameters are shown in Table 2.

3. Results and Analysis

3.1. Temperature Distribution and Evolution of Fluid During Heat Storage Stage

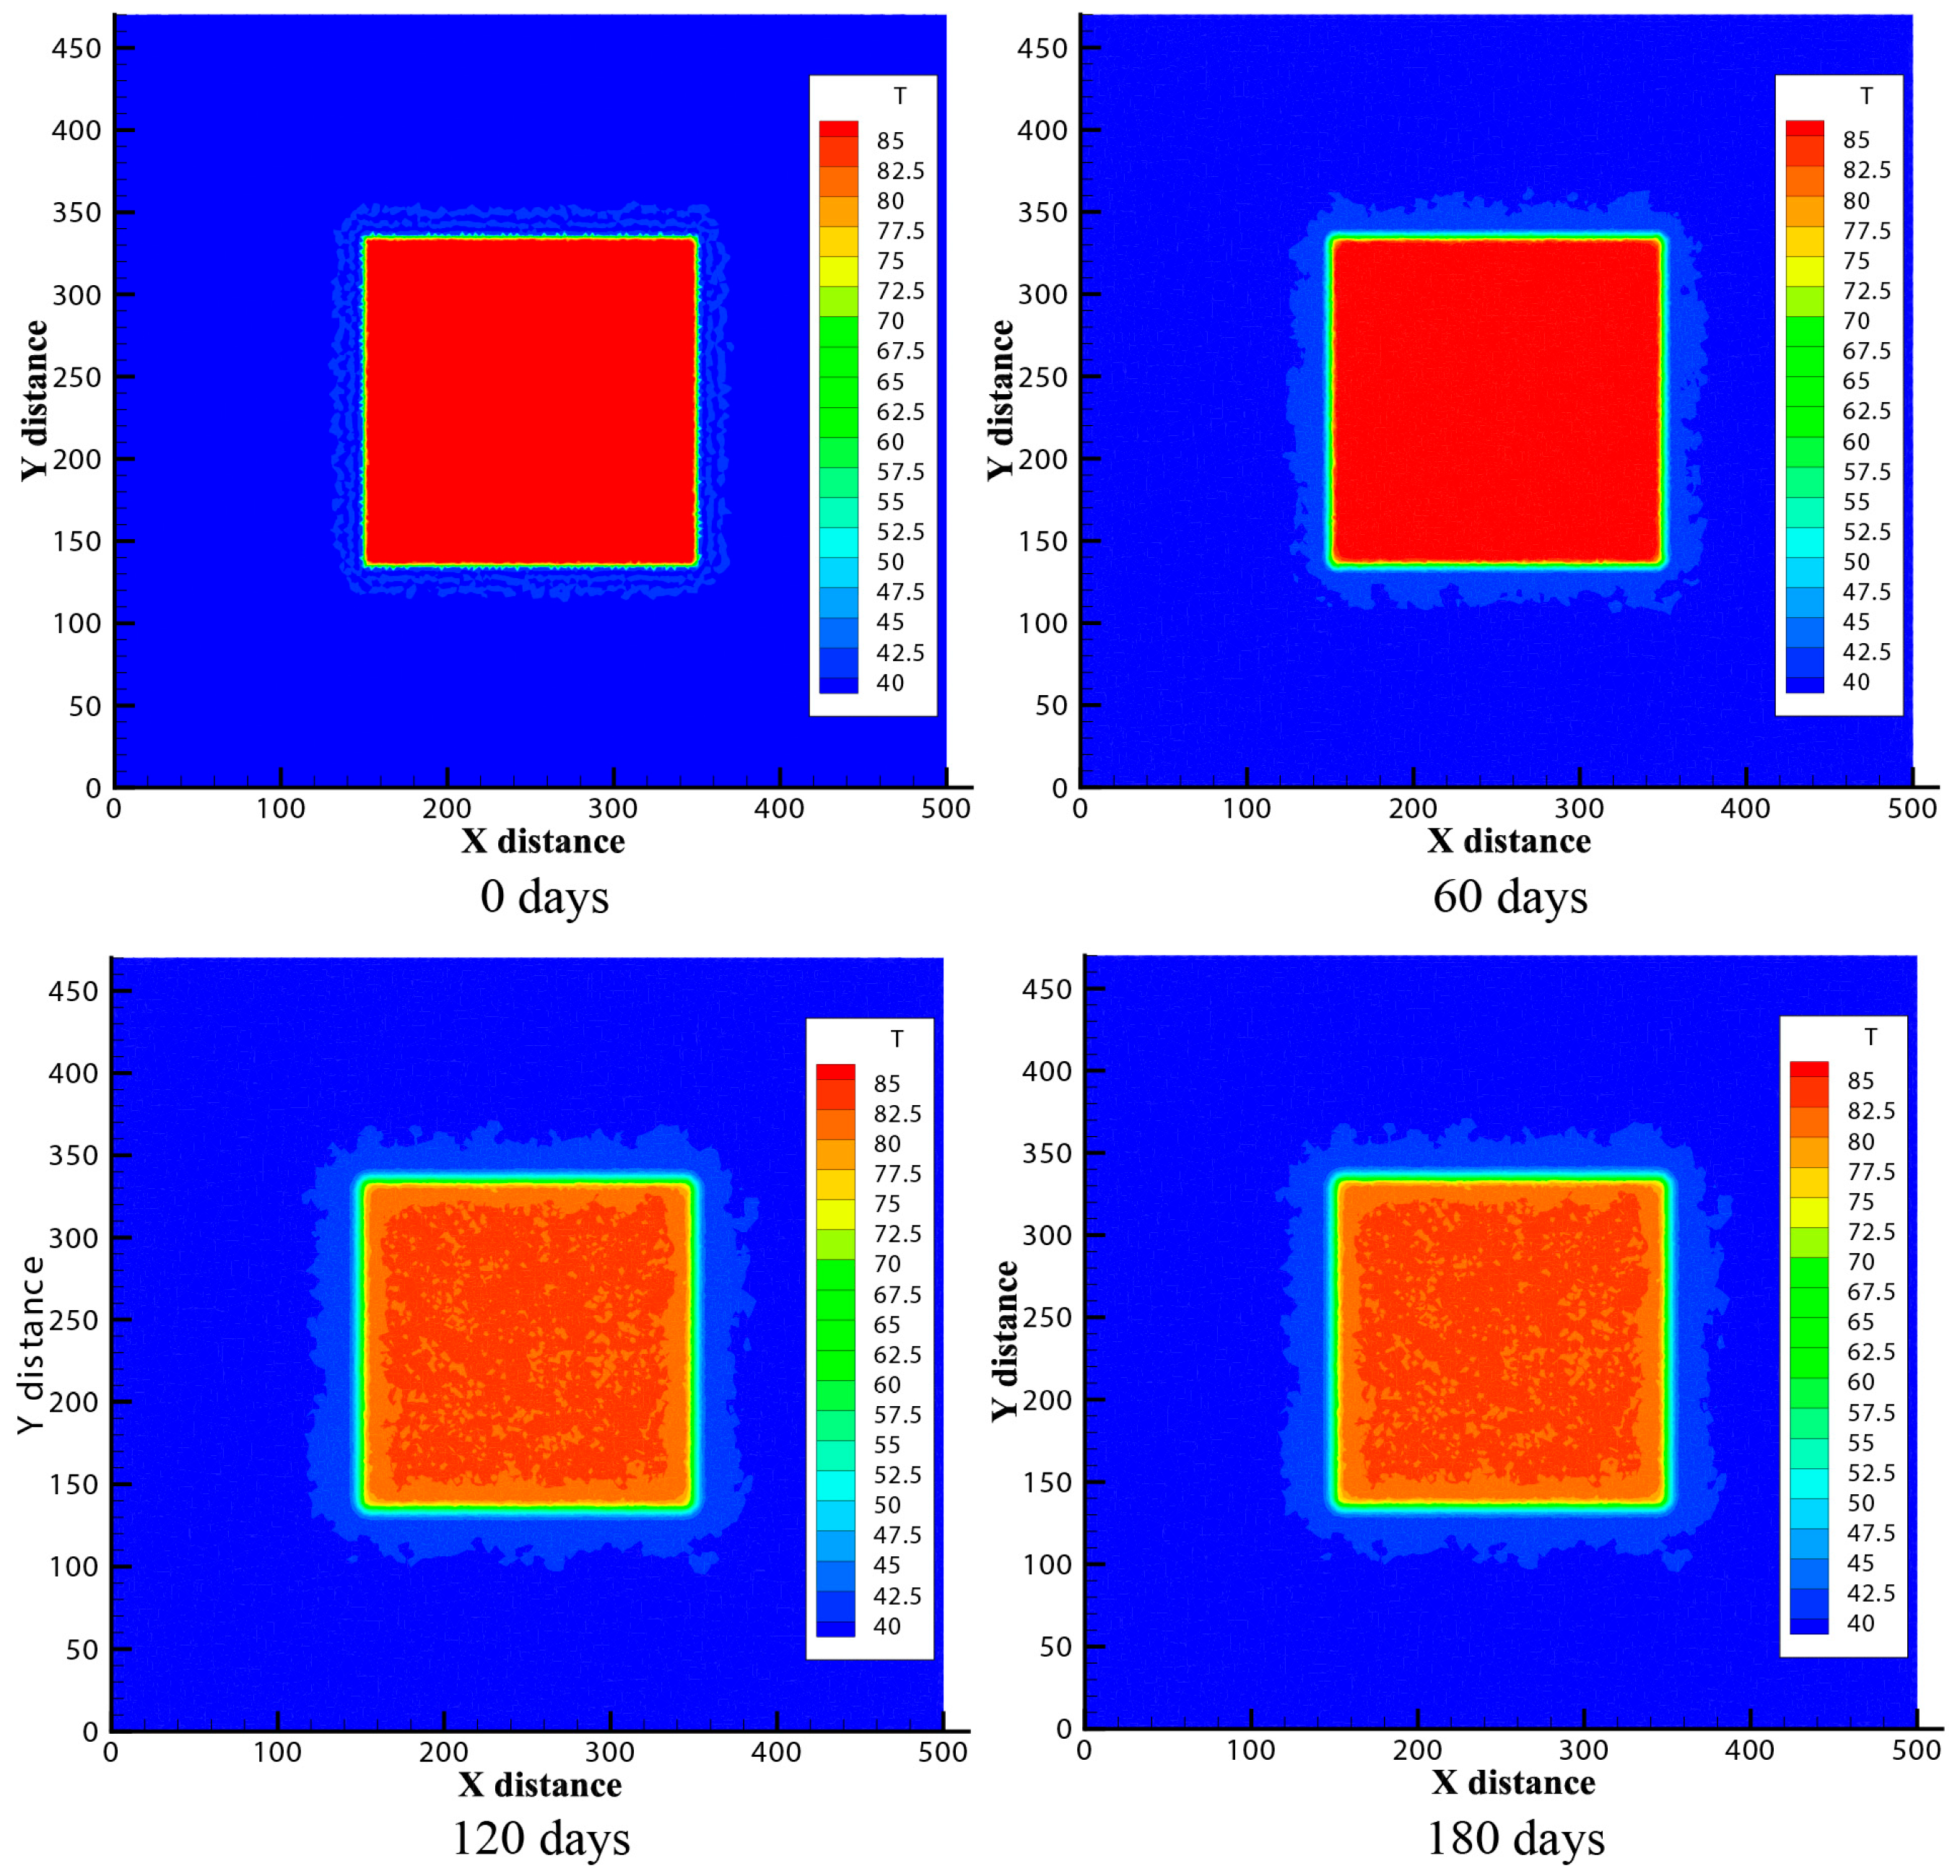
Figure 2 shows the temperature contour of the reservoir area and surrounding rock area, and its evolution with time during the heat storage stage of CMUR-ESS. It can be seen that in the heat storage stage, the temperature of the fluid in the reservoir area has decreased, but there is only a significant cooling near the boundary of the reservoir area (~3 m), and the cooling in most areas far away from the boundary is limited. During the 180 days heat storage stage, the cooling degree of the central area far from the boundary of the reservoir area is about 5~10 °C, which indicates that CMUR-ESS can ensure that most of the fluids can maintain good thermal insulation effect.
In terms of temporal evolution patterns, it can be observed that the temperature evolution behavior of the fluid near the boundary differs significantly from that of the fluid in the interior region of the reservoir area. The fluid near the boundary experiences a rapid temperature drop within a very short period after the start of heat storage stage. Under the current conditions, simulation results show that the water near the boundary region cools by more than 20 °C within the first two days of heat storage. Thereafter, the cooling rate rapidly decreases, maintaining a slow cooling velocity. In contrast, the fluid temperature farther from the boundary region does not exhibit a sharp decrease, but rather decreases slowly at a lower rate throughout the heat storage phase.
The primary cause of this phenomenon is the heat conduction effect at the boundaries of the reservoir area. This creates a rapid cooling zone (RCZ) near the boundaries, where the temperature of the hot water can drop by more than 20 °C within a very short time. Due to the low thermal conductivity of water, the heat transfer through conduction from the hot water farther from the boundary to the rock is suppressed by RCZ. Additionally, because the height of the reservoir area is small, the convection caused by temperature differences does not have a significant impact. These factors collectively result in the low-temperature water near the boundary remaining stable and not migrating too quickly toward the interior, thereby preserving the thermal insulation effect of the hot water. The overall cooling observed is primarily due to heat conduction at the bottom and top boundaries. According to the analysis of cooling at the side-boundaries, the influence of the boundary on the reservoir area only extends about 3 m. Although the hot water in the central region is not significantly affected by the top and bottom boundaries, it will still produce a certain degree of cooling, due to heat transfer through the low-temperature water layer around the boundaries (RCZ). This influence causes a slow and stable cooling process in the central region, albeit with a very low cooling rate.
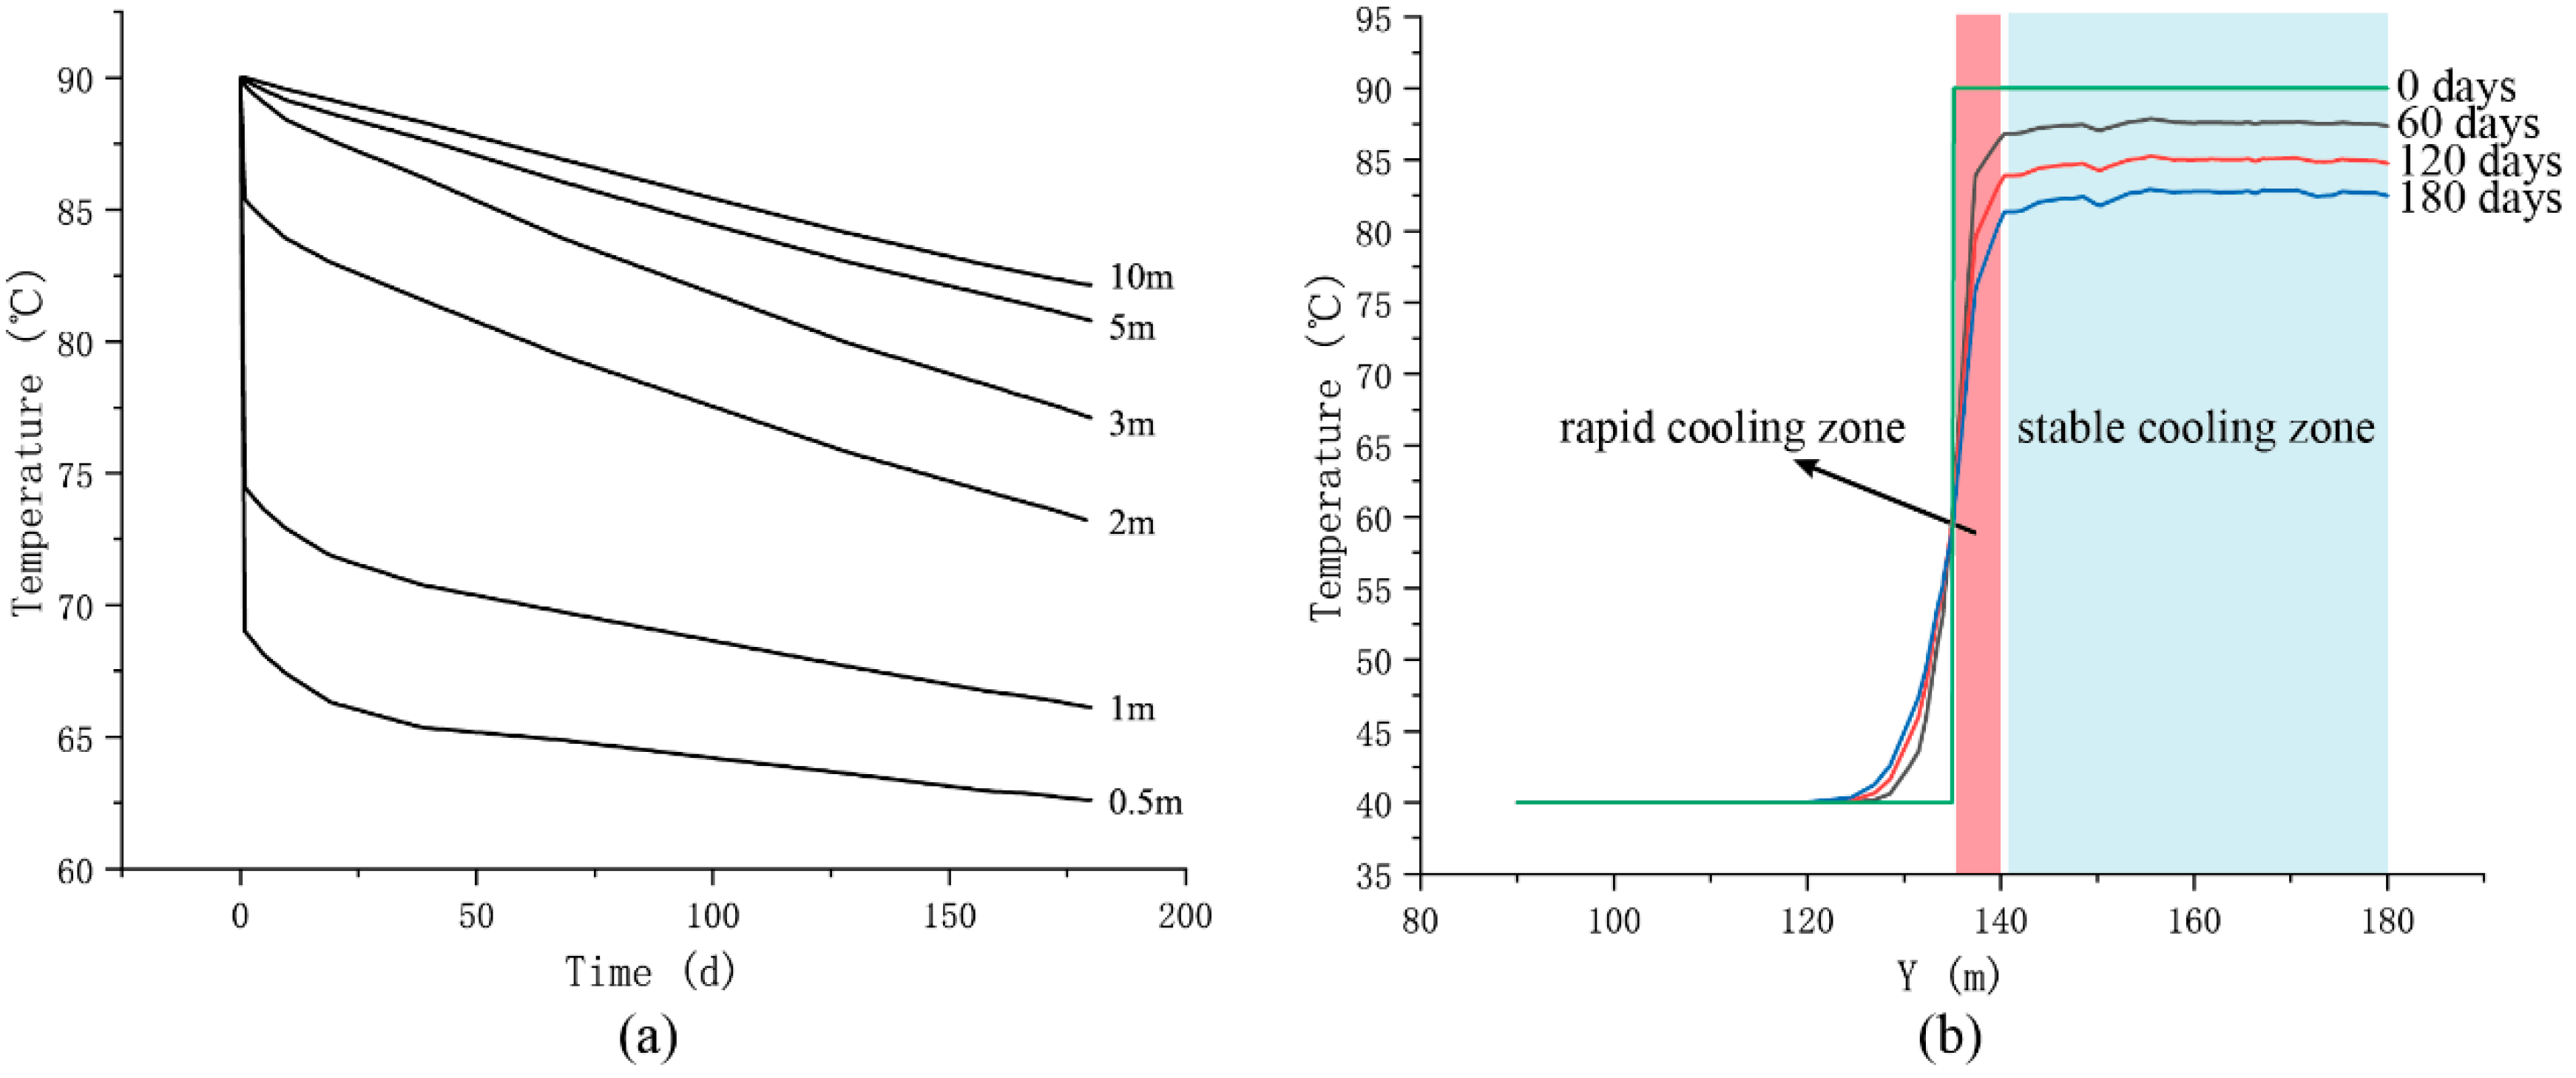
To analyze the impact of boundary heat transfer on thermal storage performance, we further studied the temporal variation in fluid temperature at distances of 0.5 m, 1 m, 2 m, 3 m, 5 m and 10 m from the boundary within the reservoir area, as shown in Figure 3a. Additionally, Figure 3b illustrates the temporal variation in temperature in the rock and fluid near the reservoir area. Simulation results indicate that during the thermal storage stage, the temperature distribution of most of the hot water within the reservoir area remains stable, and a significant cooling occurs only within approximately 5 m of the boundary, as also reflected in the temperature contours. The temperature distribution near the boundary can be divided into two regions. The temperature decreases within 0–5 m from the boundary are very fast. This region of the area is the rapid cooling zone mentioned above; the remaining area is referred to as the stable cooling zone (SCZ). During the thermal storage stage, the RCZ experiences a drastic temperature decrease within a very short time, and the closer to the boundary, the greater the degree of cooling. Within 1~2 days from the start of storage, the hot water within 3 m of the boundary undergoes a drastic temperature decrease, with cooling magnitudes ranging from 23 °C (at 0.5 m from the boundary) to 3 °C (at 3 m from the boundary). After two days, the cooling rate in the RCZ gradually slows and approaches the temperature decline rate of the internal fluid. Furthermore, as shown in Figure 3b, the extent of the RCZ advances very slowly into the reservoir area during the storage process. After 60 days of storage, the width of the RCZ is ~5 m, and at 180 days of storage, the width remains ~5 m, showing no significant change, with only an overall temperature decrease. In the SCZ, although no intense cooling occurs at the beginning of storage, an overall stable cooling phenomenon still exists. Under the current geological and operational conditions, the global stable cooling rate is approximately 0.025 °C/day. Over the 180 day storage period, the temperature decreases by about 7 °C.
The RCZ near the boundary of the reservoir is mainly caused by the heat transfer of the rock at the boundary. At the beginning of heat storage, the temperature difference between the rock and the hot water in the reservoir area is large, which induces a strong heat transfer, resulting in a rapid decrease in the fluid temperature near the reservoir boundary area. However, due to the poor thermal conductivity of water and the lack of significant convective phenomena caused by temperature differences within the reservoir area, the distribution of RCZ remains stable. While the internal hot water can dissipate some heat via thermal conduction through RCZ, the velocity of heat loss is slow, thereby achieving a stable thermal field distribution in the reservoir area. This also means that while there is heat loss inside the hot water, the RCZ near the boundaries can ensure that most of the hot water in the reservoir area can remain at a high temperature after the heat storage stage. Within the reservoir area, there is an overall stable cooling phenomenon, which is caused by the gradual and stable heat transfer through the boundaries. This heat loss occurs through the surrounding boundaries but also involves heat dissipation through the top and bottom boundaries. The combined heat dissipation from these boundaries has resulted in a slow decline in the overall temperature of the hot water. However, due to the existence of RCZ, this heat dissipation process is extremely slow, which is a very positive outcome for insulation purposes.
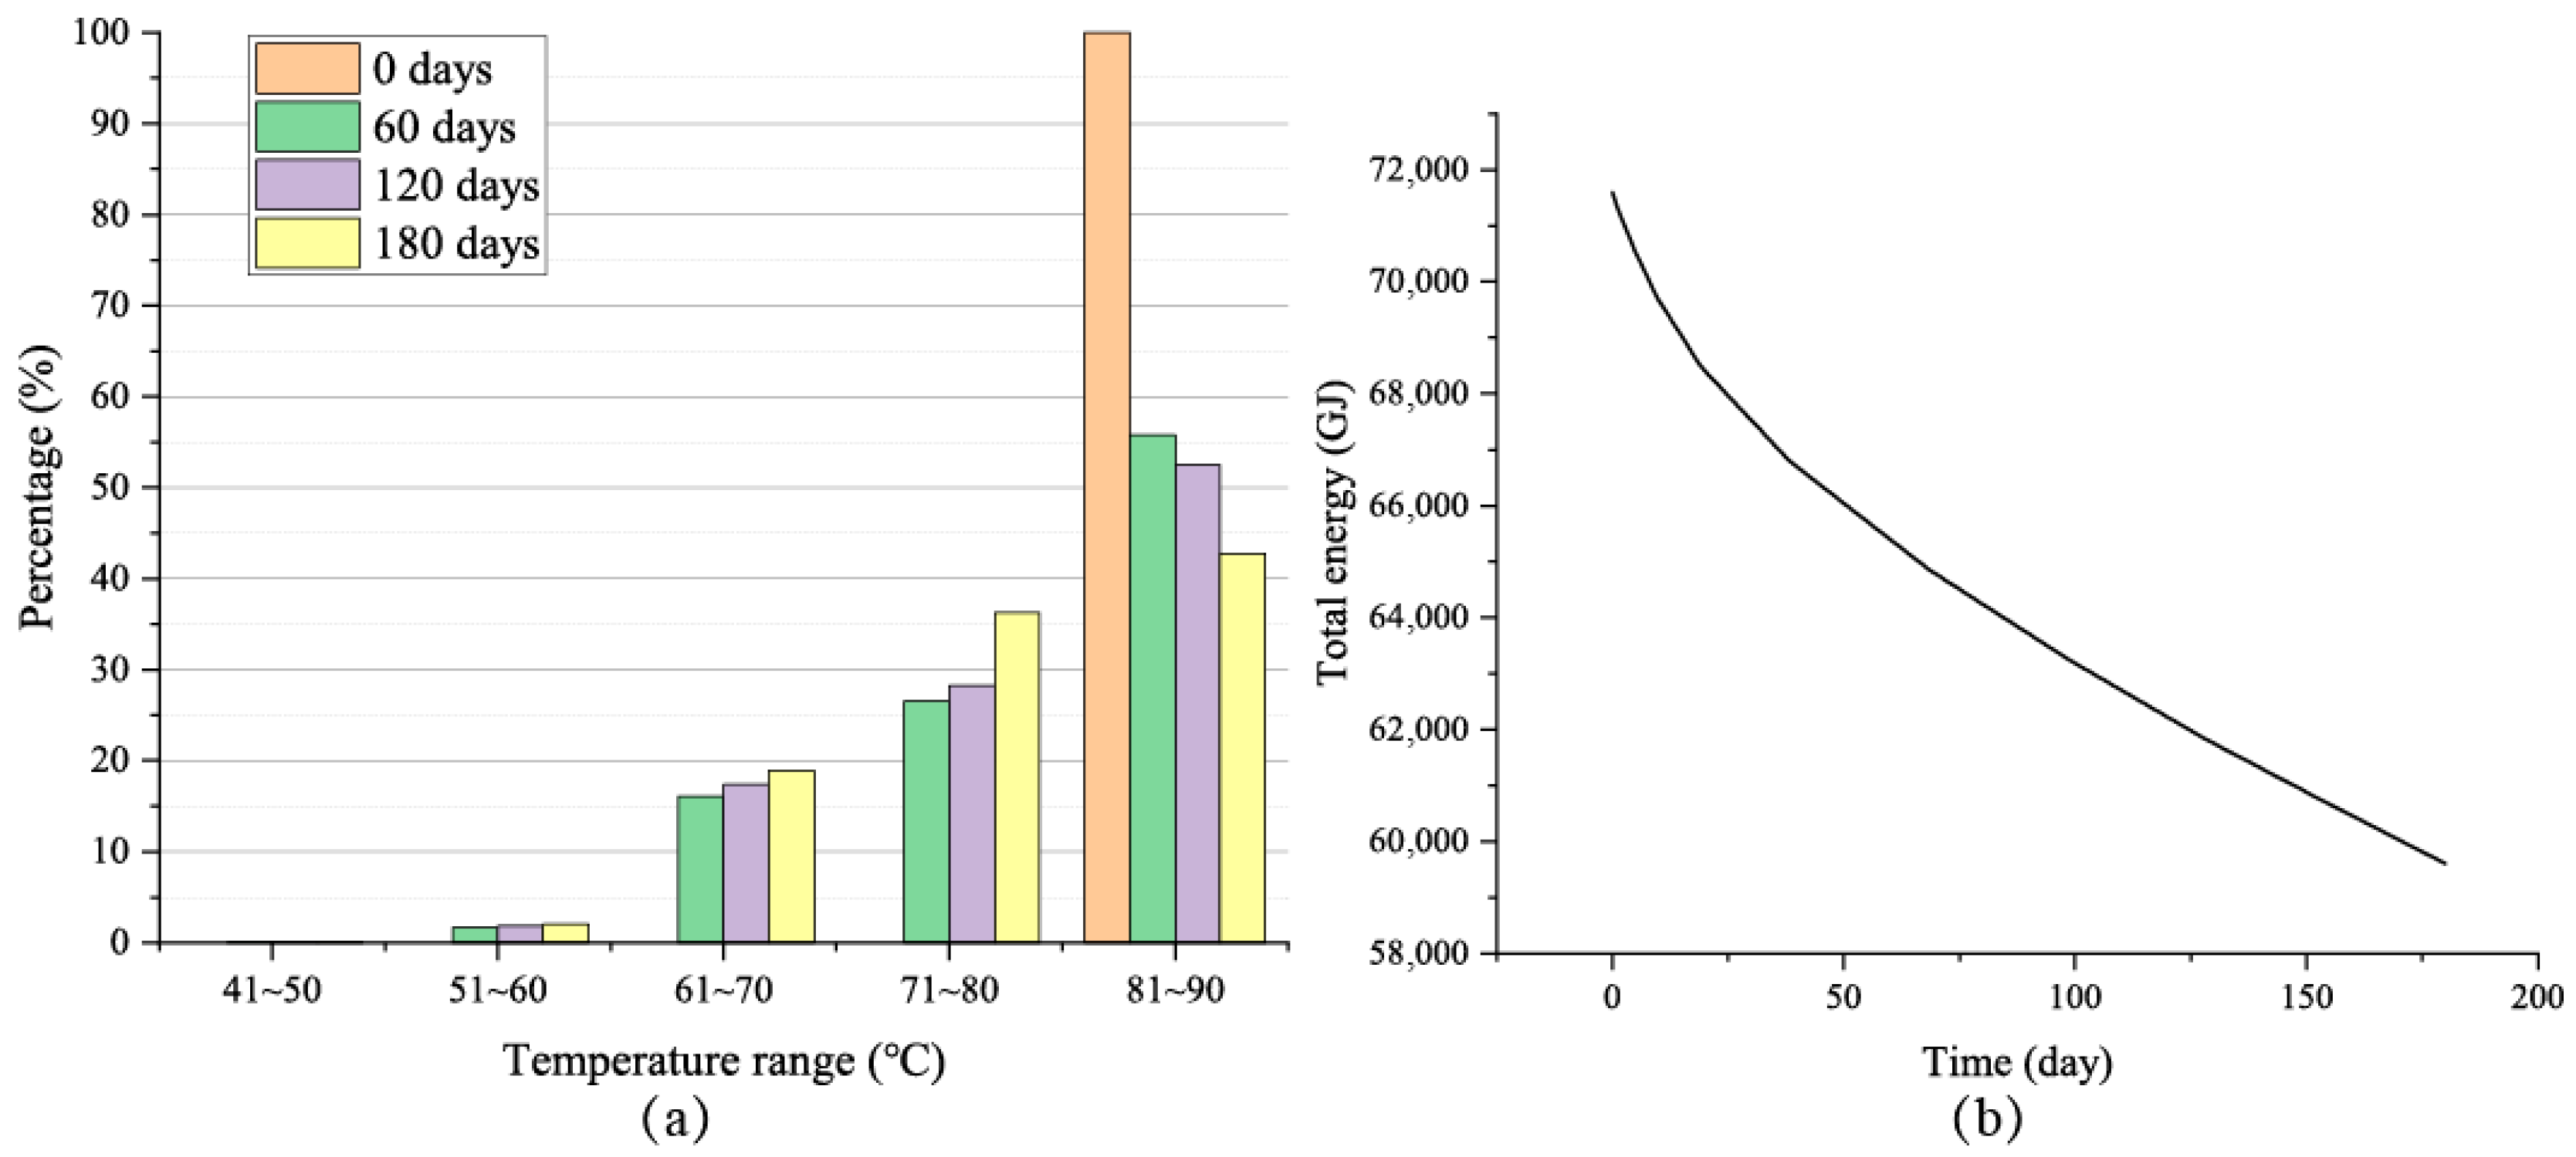
The statistical results of the proportion of hot water volume within the reservoir area during the heat storage phase (a) and the total contained energy (b) are shown in Figure 4. The results indicate that as the heat storage progresses, the proportion of high-temperature water (80~90 °C) gradually decreases, while the volume of sub-high-temperature water (70~80 °C) increases. However, the proportion of boundary low-temperature water (50~70 °C) only has a little increase with the heat storage process; except for a certain amount of low-temperature water generated at the beginning of heat storage due to boundary heat transfer, the volume of boundary low-temperature water remains essentially unchanged throughout the entire heat storage phase. This indicates that the temperature of low-temperature water caused by boundary cooling mostly remains within 50~70 °C, and its volume remains basically constant during the entire heat storage phase, accounting for approximately 20% of the total volume; the volume of sub-high-temperature water generated by natural cooling gradually increases with heat storage, reaching about 37% of the total volume. Meanwhile, high-temperature water maintains a volume of approximately 45% after being stored for 180 days. The total amount of heat generated by adding the two can exceed 80%, which demonstrates the feasibility of CMUR-ESS for seasonal heat storage.
The evolution of the total thermal energy of hot water in the reservoir area during the heat storage phase is shown in Figure 4b. It can be seen that at the beginning of the heat storage phase, the total thermal energy of hot water in the entire reservoir area is 7.16 × 10⁴ GJ (with 40 °C as the reference temperature). As the heat storage process proceeds, the total thermal energy of the hot water gradually decreases, with the rate of decrease slowing down progressively and eventually stabilizing at a constant value. This process is consistent with the previous analysis results. According to the simulation results, under the current geological and operational conditions, after 180 days of heat storage, the total thermal energy in the hot water is 5.96 × 10⁴ GJ, indicating that only about 16.76% of the heat is lost during the entire insulation phase. According to previous research, the thermal storage efficiency of aquifer thermal storage systems (ATES) is close to 80% [29,30,31]; therefore, the thermal storage effect of CMUR-ESS is better than ATES. However, the insulation effect cannot be determined solely by the total energy; a comprehensive assessment must also consider the distribution of the hot water volume.

3.2. Output Temperature Analysis During Heat Production Stage

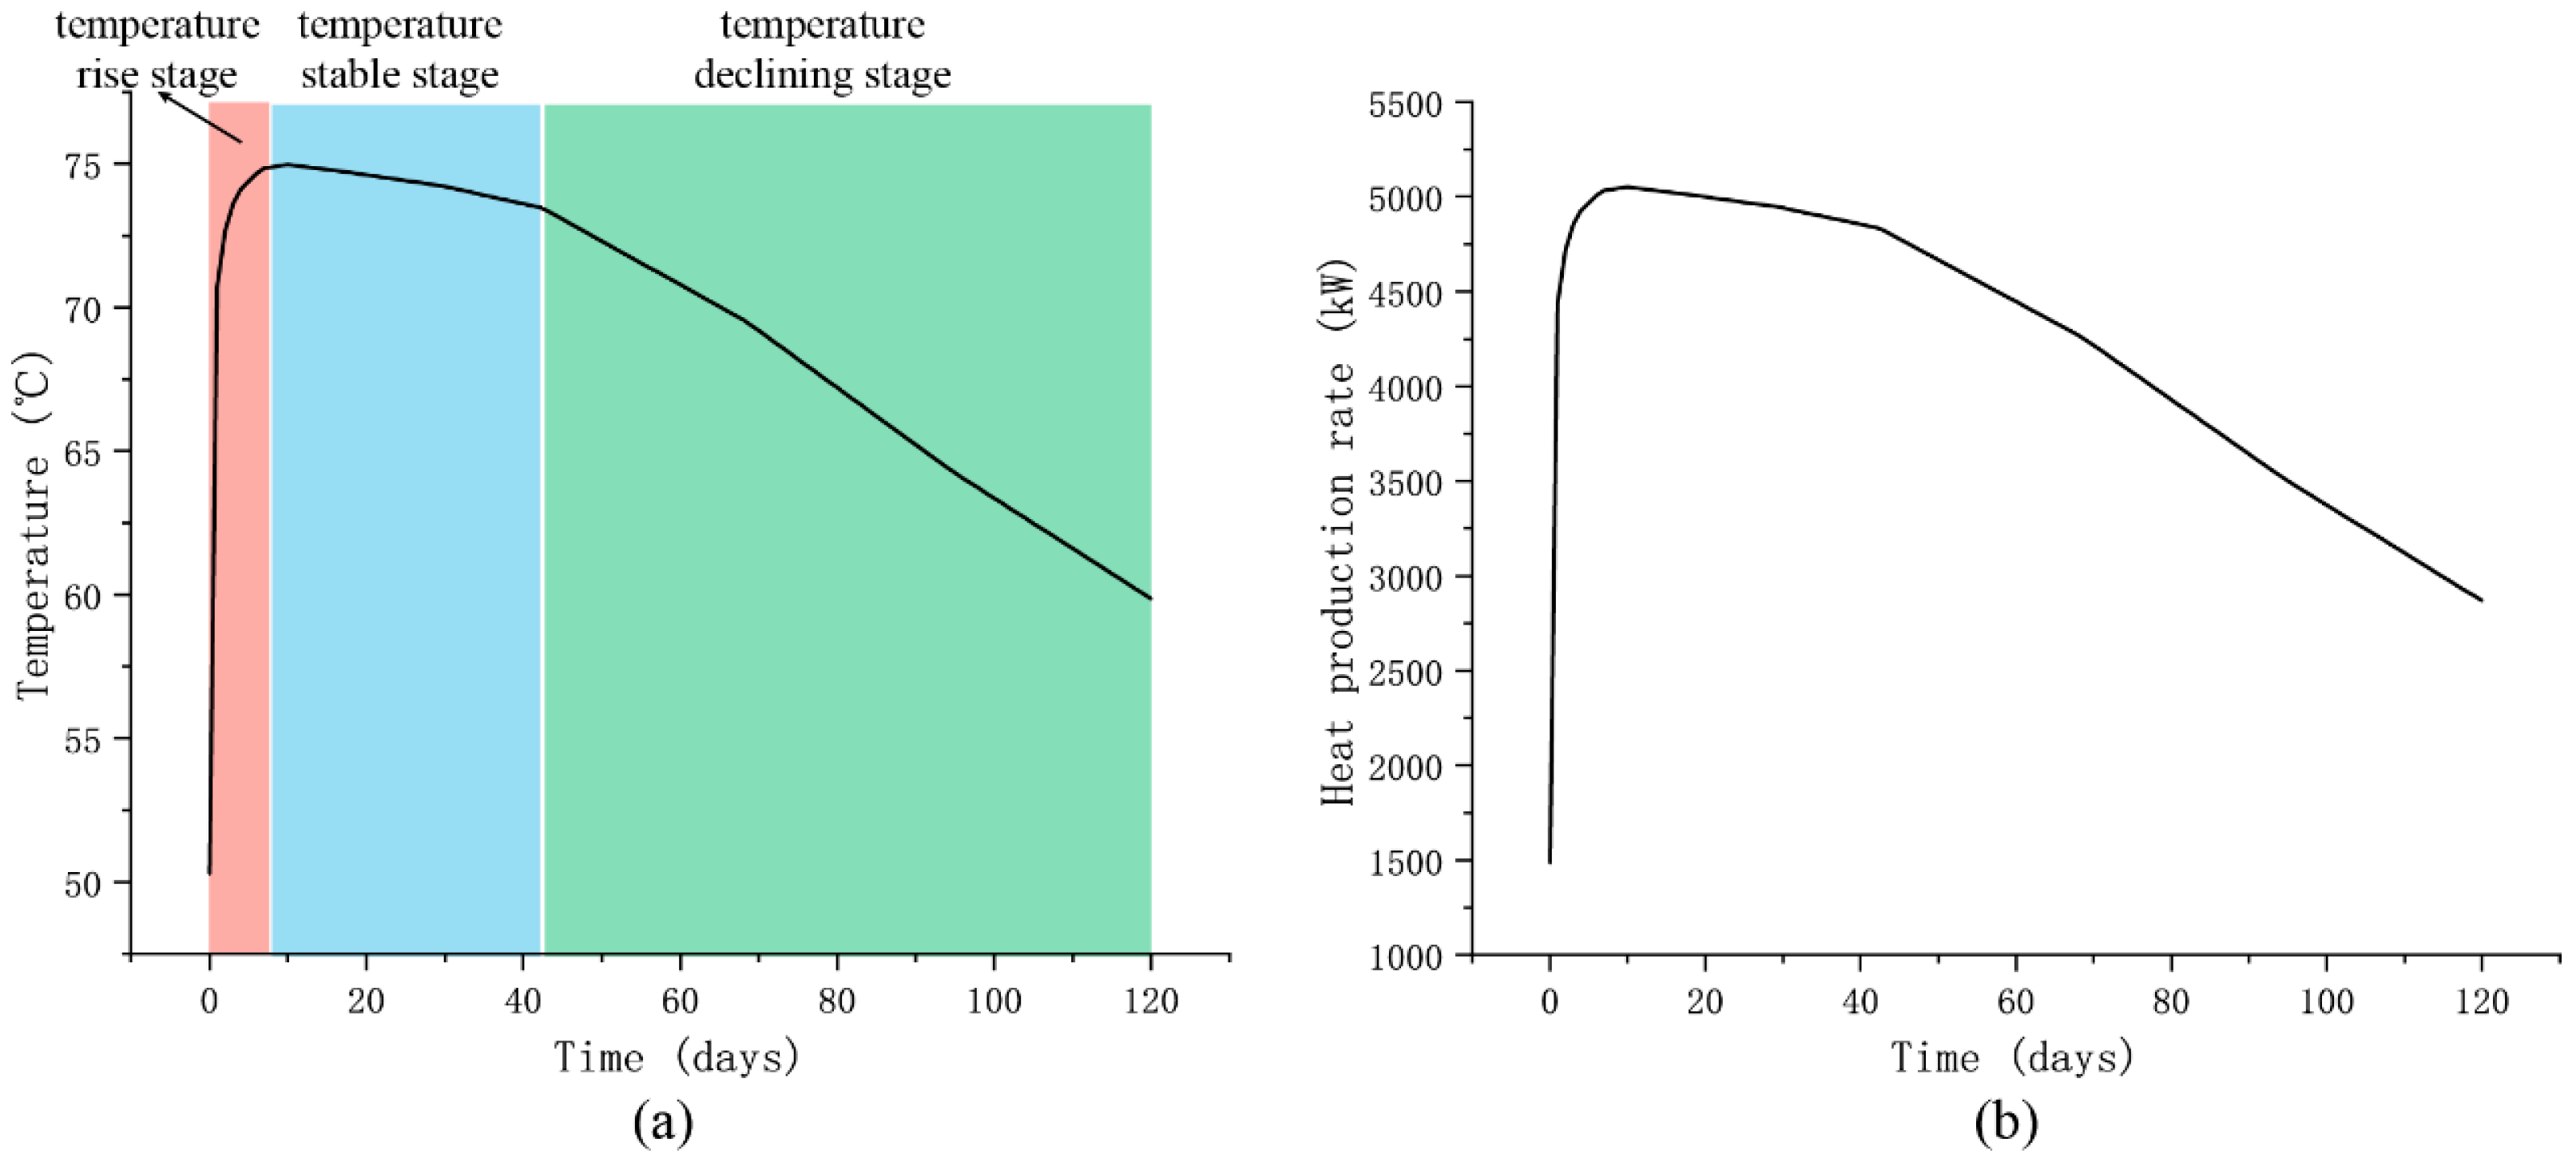
After the end of the heat storage phase, the output temperature and the overall heat production of the system during the heat production phase are also investigated in this research. The production time is 120 days, and the production flow rate is 30 L/s. Throughout the entire production phase, 311,040 m3 of water is extracted from the reservoir area to the surface, accounting for 77.7% of the total water volume. The output temperature and heat output power during the heat production stage are shown in Figure 5. The simulation results indicate that during the 120 day heat production phase, the production process can be divided into three stages: a temperature rise stage (TRS), a stable stage (TSS) where the output temperature remains relatively stable (in reality, there is also a certain degree of decline, but the rate of decline is very small), and a declining stage (TDS) where the output temperature gradually decreases. During the TRS, the output temperature increased by more than 20 °C within the first five days of production. This was followed by a TSS lasting over 35 days, during which the output temperature was stable at 72~75 °C. Finally, the temperature gradually declined at a rate of approximately 0.2 °C/day. At the end of the heat production phase (120 days), the output temperature decreased to 60 °C. Compared to the heat storage results, in which most of the water temperatures were 80~90 °C, it is evident that the output temperature has a decline, indicating that the heat storage results of the CMUR-ESS may not be fully recoverable. The evolution of the heat output power curve is similar to that of the production temperature and can also be divided into three stages: rising, stable and declining. Under the current geological and operational conditions, the heat output power of the CMUR-ESS rapidly increases from 1500 kW to 5000 kW, then after stable operation for 35 days, slowly decreases to 3000 kW. The total heat (energy) during the heat production phase is calculated to be 43,976 GJ. Compared to the heat storage results after 180 days (59,600 GJ), the system’s effective heat recovery rate is 73.79%. This indicates that although the thermal storage effect is better than ATES, the overall thermal storage efficiency of the system is slightly lower, compared to traditional ATES after considering the influence of the heat generation process [29,30,31]. However, compared to ATES, the cavity structure of CMUR-ESS allows for greater heat storage capacity and allows for larger flow rates, making it easy to use and without environmental risks. This indicates that CMUR-ESS has great potential for cross-seasonal heat storage development.
The reason why the output temperature during the heat production phase has three stages is due to the boundary heat transfer effect controlled by the reservoir area. After the heat storage phase, considering that the rock near the boundary has cooled to about 50 °C, the hot water near the boundary also has a similar temperature. This conclusion has been demonstrated in the analysis of the heat storage phase. With the start of the heat production phase, the pumping points near the boundary will first extract the low-temperature water, resulting in a low production temperature. As heat production continues, the high-temperature water from the interior gradually flows to the pumping points, causing the production temperature to rise significantly, and the output temperature enters a stable stage. After that, the reinjected low-temperature tail water will gradually affect the pumping points, leading to a gradual decline in production temperature. However, since the duration of the heat-production phase is not long enough to connect the reinjection points and pumping points, although the production temperature decreases, it will not cause the temperature of pumping water to be too low to be the same as the reinjection water (40 °C). This process can be confirmed by the temperature field evolution cloud map of the reservoir during the heat production phase (Figure 6).
According to Figure 6, it can be further seen that the distribution of hot water in the whole reservoir area is affected by tail water reinjection in the process of heat generation. With the progress of heat generation, the low-temperature tail water reinjection will gradually affect the generation point, causing the low-temperature part of the water to flow to the pumping point, and the output temperature to decrease. At this time, the hot water in the reservoir area is still not fully extracted, and some hot water of 65~75 °C is still left in the corner of the reservoir area, which is the main reason for the recovery rate of over 70%. In addition, because the pumping point is near the boundary, when the internal hot water moves to the pumping point, the huge temperature difference between the rock and hot water will still cause a strong heat transfer, resulting in a reduction in the hot water temperature. This is also the reason why the output temperature is lower than the hot water temperature in the reservoir area after the heat storage stage, which also causes a decline in the recovery factor.
To summarize, although most of the hot water can be maintained at a high temperature after the thermal storage stage, the hot water recovery of CMUR-ESS is reduced due to the heat loss through the reservoir boundary and the hot water residue controlled by the flow field. Under the current geological and operating conditions, the CMUR-ESS designed in this study can achieve about 73.79% of the effective recovery of heat storage. Although this result does not seem to reach a high conclusion, it is still a good thermal storage effect for large-scale geological body thermal storage engineering.

4. Discussion

In order to expand the applicability of research conclusions above, we discussed the parameters involved in CMUR-ESS based on the analysis of model results and analyzed the impact of changes in these parameters on system performance.

4.1. Influence of Surrounding Rock Thermal Conductivity

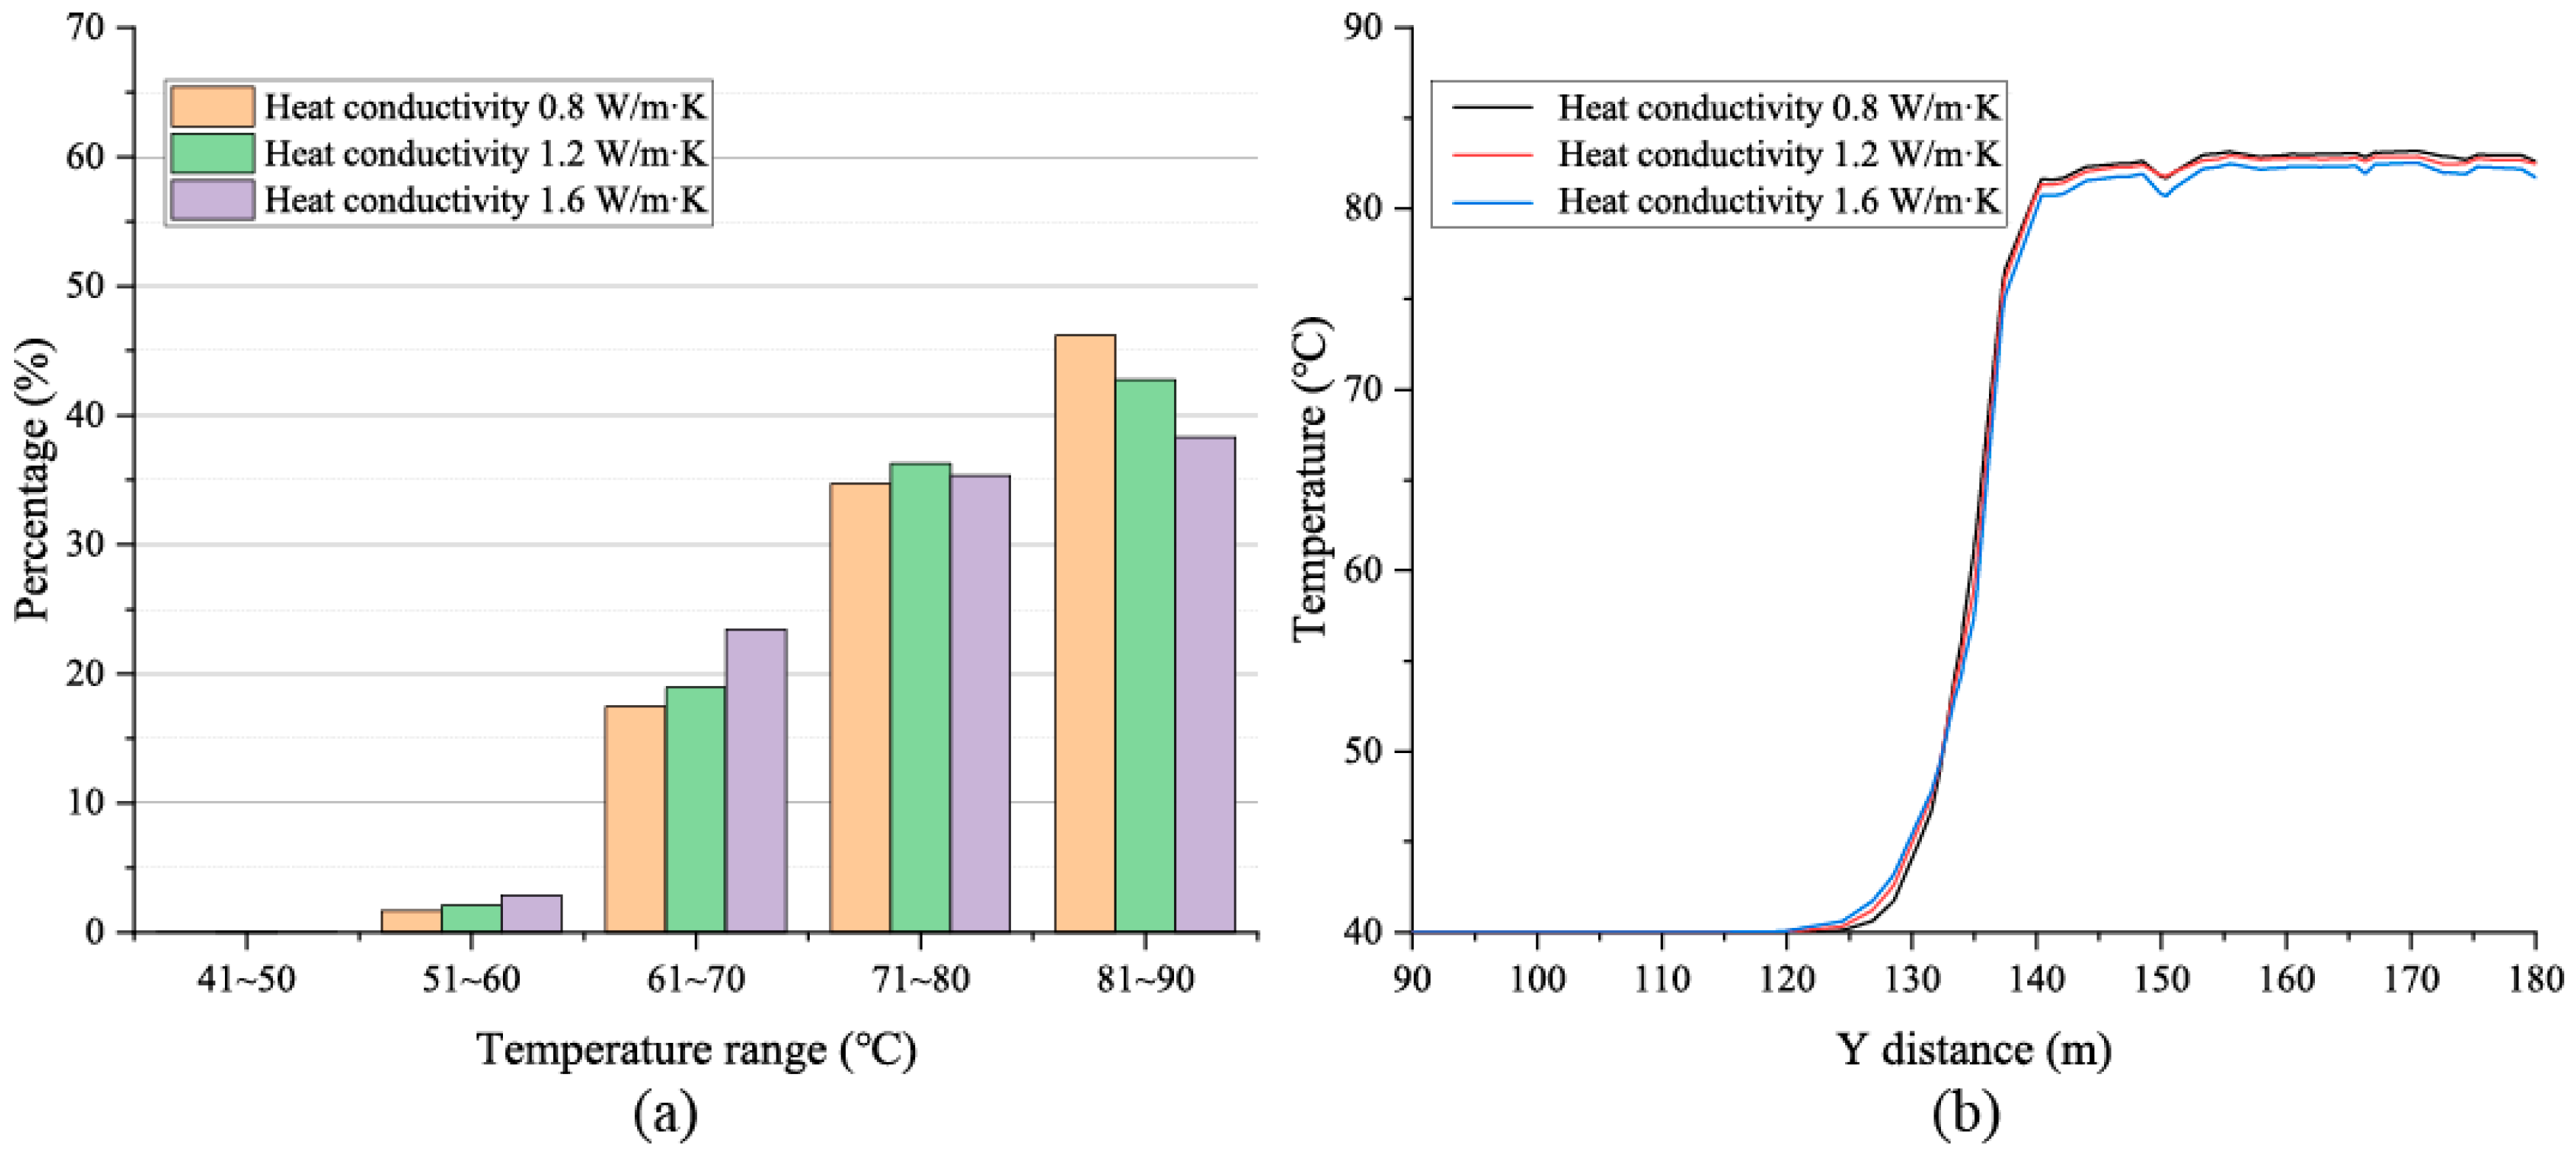
Figure 7 shows the statistical results of the volume ratio of hot water temperature and the temperature distribution in boundary region at the end of the thermal storage stage under different thermal conductivity conditions. The result shows that the thermal conductivity of surrounding rock has an impact on the thermal storage stage. Higher thermal conductivity will lead to an increase in the proportion of high temperature water and increase the proportion of sub-high temperature water, but the volume of low temperature water at the boundary basically remains unchanged. At the same time, it can also be seen from Figure 7b that the thermal conductivity does affect the overall temperature of the reservoir area but has little effect on the distribution of RCZ and SCZ. Under different thermal conductivity, the width of RCZ basically does not change, but the overall temperature after the thermal storage stage will decrease under the condition of high thermal conductivity. This is because the thermal conductivity of the surrounding rock mainly controls the overall heat transfer process after the initial hot water in the RCZ region has completed cooling. This process is mainly reflected in the global cooling of the hot water in the reservoir area. A higher thermal conductivity of surrounding rock will accelerate the cooling, resulting in a lower global hot water temperature at the end of the heat storage stage.
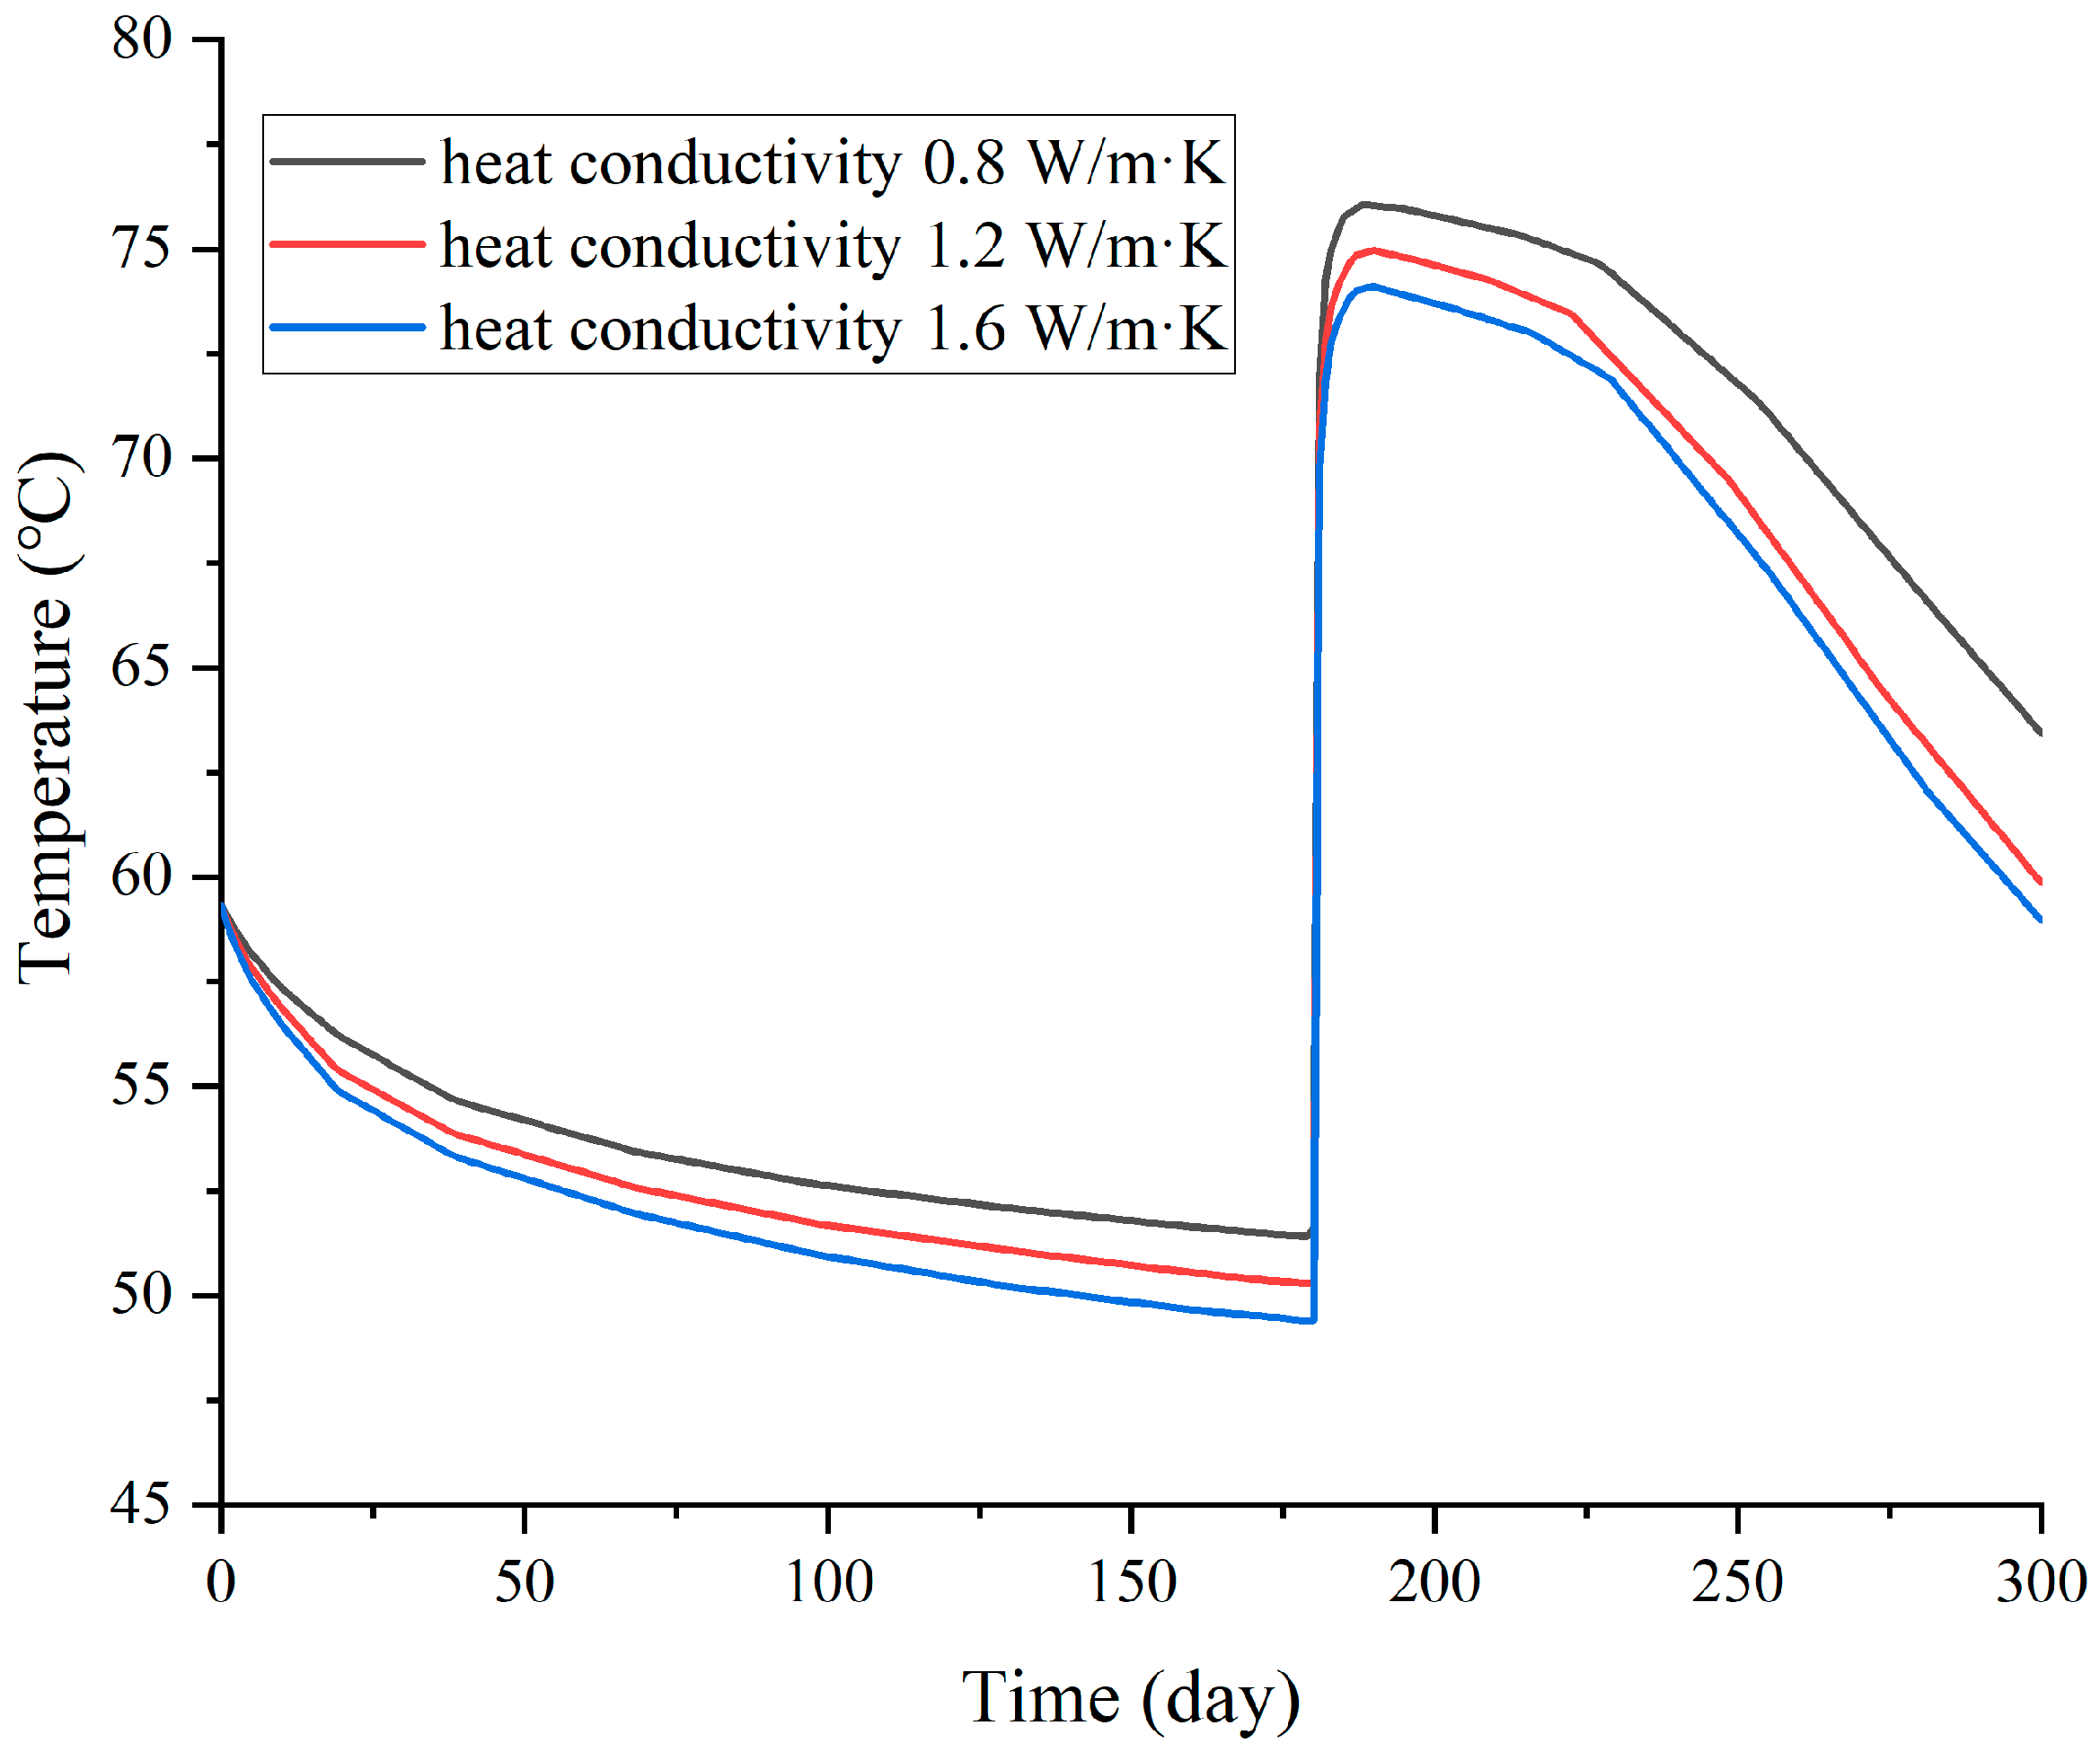
Figure 8 illustrates the temperature at the pumping point (during the heat storage stage), and the production temperature curves (during the heat production stage) under different thermal conductivity conditions. The results indicate that higher thermal conductivity reduces the overall temperature of the hot water within the reservoir area, resulting in a correspondingly lower temperature at the pumping point during the heat storage phase. With the start of the heat-extraction phase, the production temperature increases rapidly; however, due to the lower hot water temperature under higher thermal conductivity conditions, the production temperature is also correspondingly lower. Since the distribution of hot water produced by different thermal conductivity is not significant, the evolution of the production temperature under the same production conditions is essentially similar. Additionally, regarding the recovery rate of hot water, the recovery rates for thermal conductivity coefficients of 0.8, 1.2 and 1.6 W/(m·K) are 77.77%, 73.79% and 72.99%, respectively. It can be observed that as thermal conductivity increases, the effective heat recovery rate of the thermal storage area decreases to some extent, but the decrease is very small. This result also shows a similar phenomenon in ATES research, but the decrease in ATES is greater than that in CMUR-ESS [29,31].

4.2. Surrounding Rock-Specific Heat Capacity

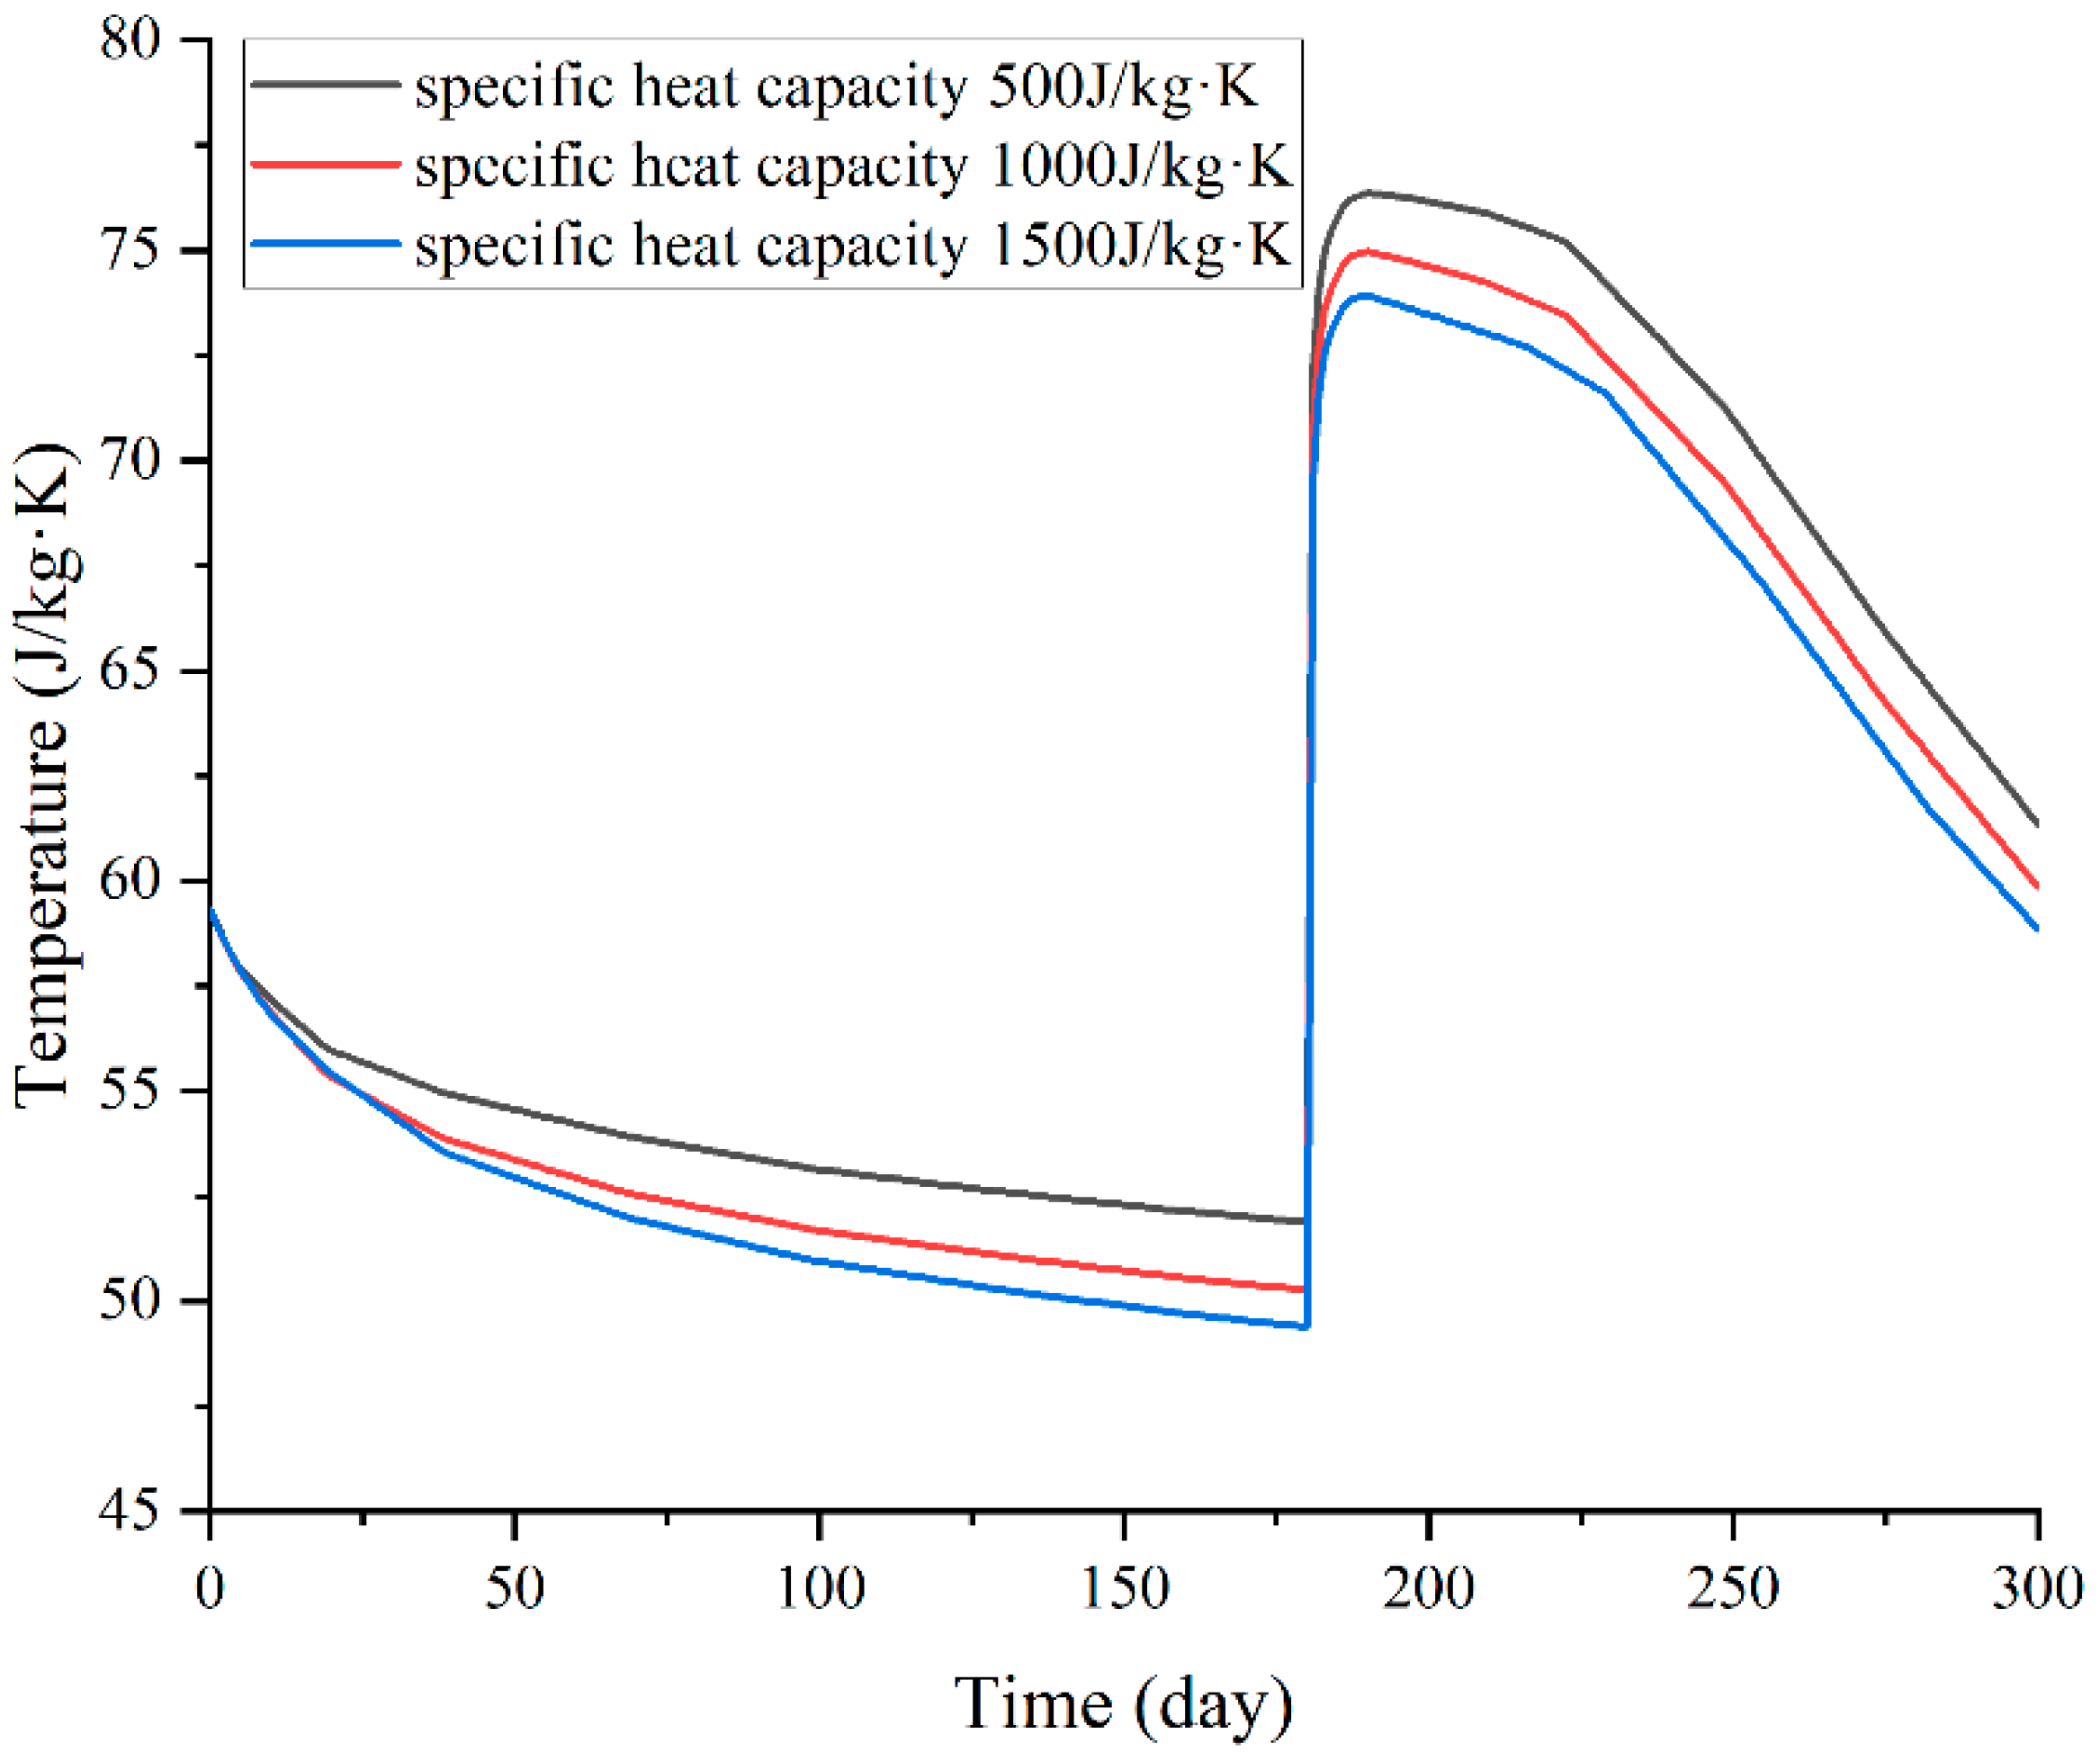
The temperature of the hot water near the pumping point and the production temperature results under surrounding rock specific heat capacities of 500 J/(kg·K), 1000 J/(kg·K) and 1500 J/(kg·K) are shown in Figure 9. The results indicate that during the heat storage phase, a higher rock-specific heat capacity absorbs more heat from the hot water, resulting in a lower hot water temperature at the end of the heat storage phase. Under three different specific heat capacities, the residual heat of hot water at the end of the heat storage stage is 61,550 GJ, 59,600 GJ and 58,126 GJ, respectively. With the increase in specific heat capacity, the total residual heat of hot water will decrease to a certain extent, but the decrease is very small. Simultaneously, during the heat production phase, the lower hot water temperature also leads to a decrease in production temperature. However, similarly to the results with different thermal conductivity, although the overall hot water temperature at the end of the heat storage phase declines, the distribution of the temperature remains essentially same. Therefore, the evolution of the production curve during the heat production phase is basically the same, with the only differences being in production temperature. That is to say, overall, a higher specific heat capacity will cause CMUR-ESS to lose more heat and lower the production temperature. The effective thermal recovery rates calculated based on the production temperature curve are 75.45%, 73.79% and 72.72%, respectively. It can be seen that the effect of specific heat capacity on the effective thermal recovery rate is smaller than that of the thermal conductivity coefficient, but the influence pattern is still that the larger specific heat capacity will reduce the effective recovery rate of hot water.

4.3. Pumping Flow Rate

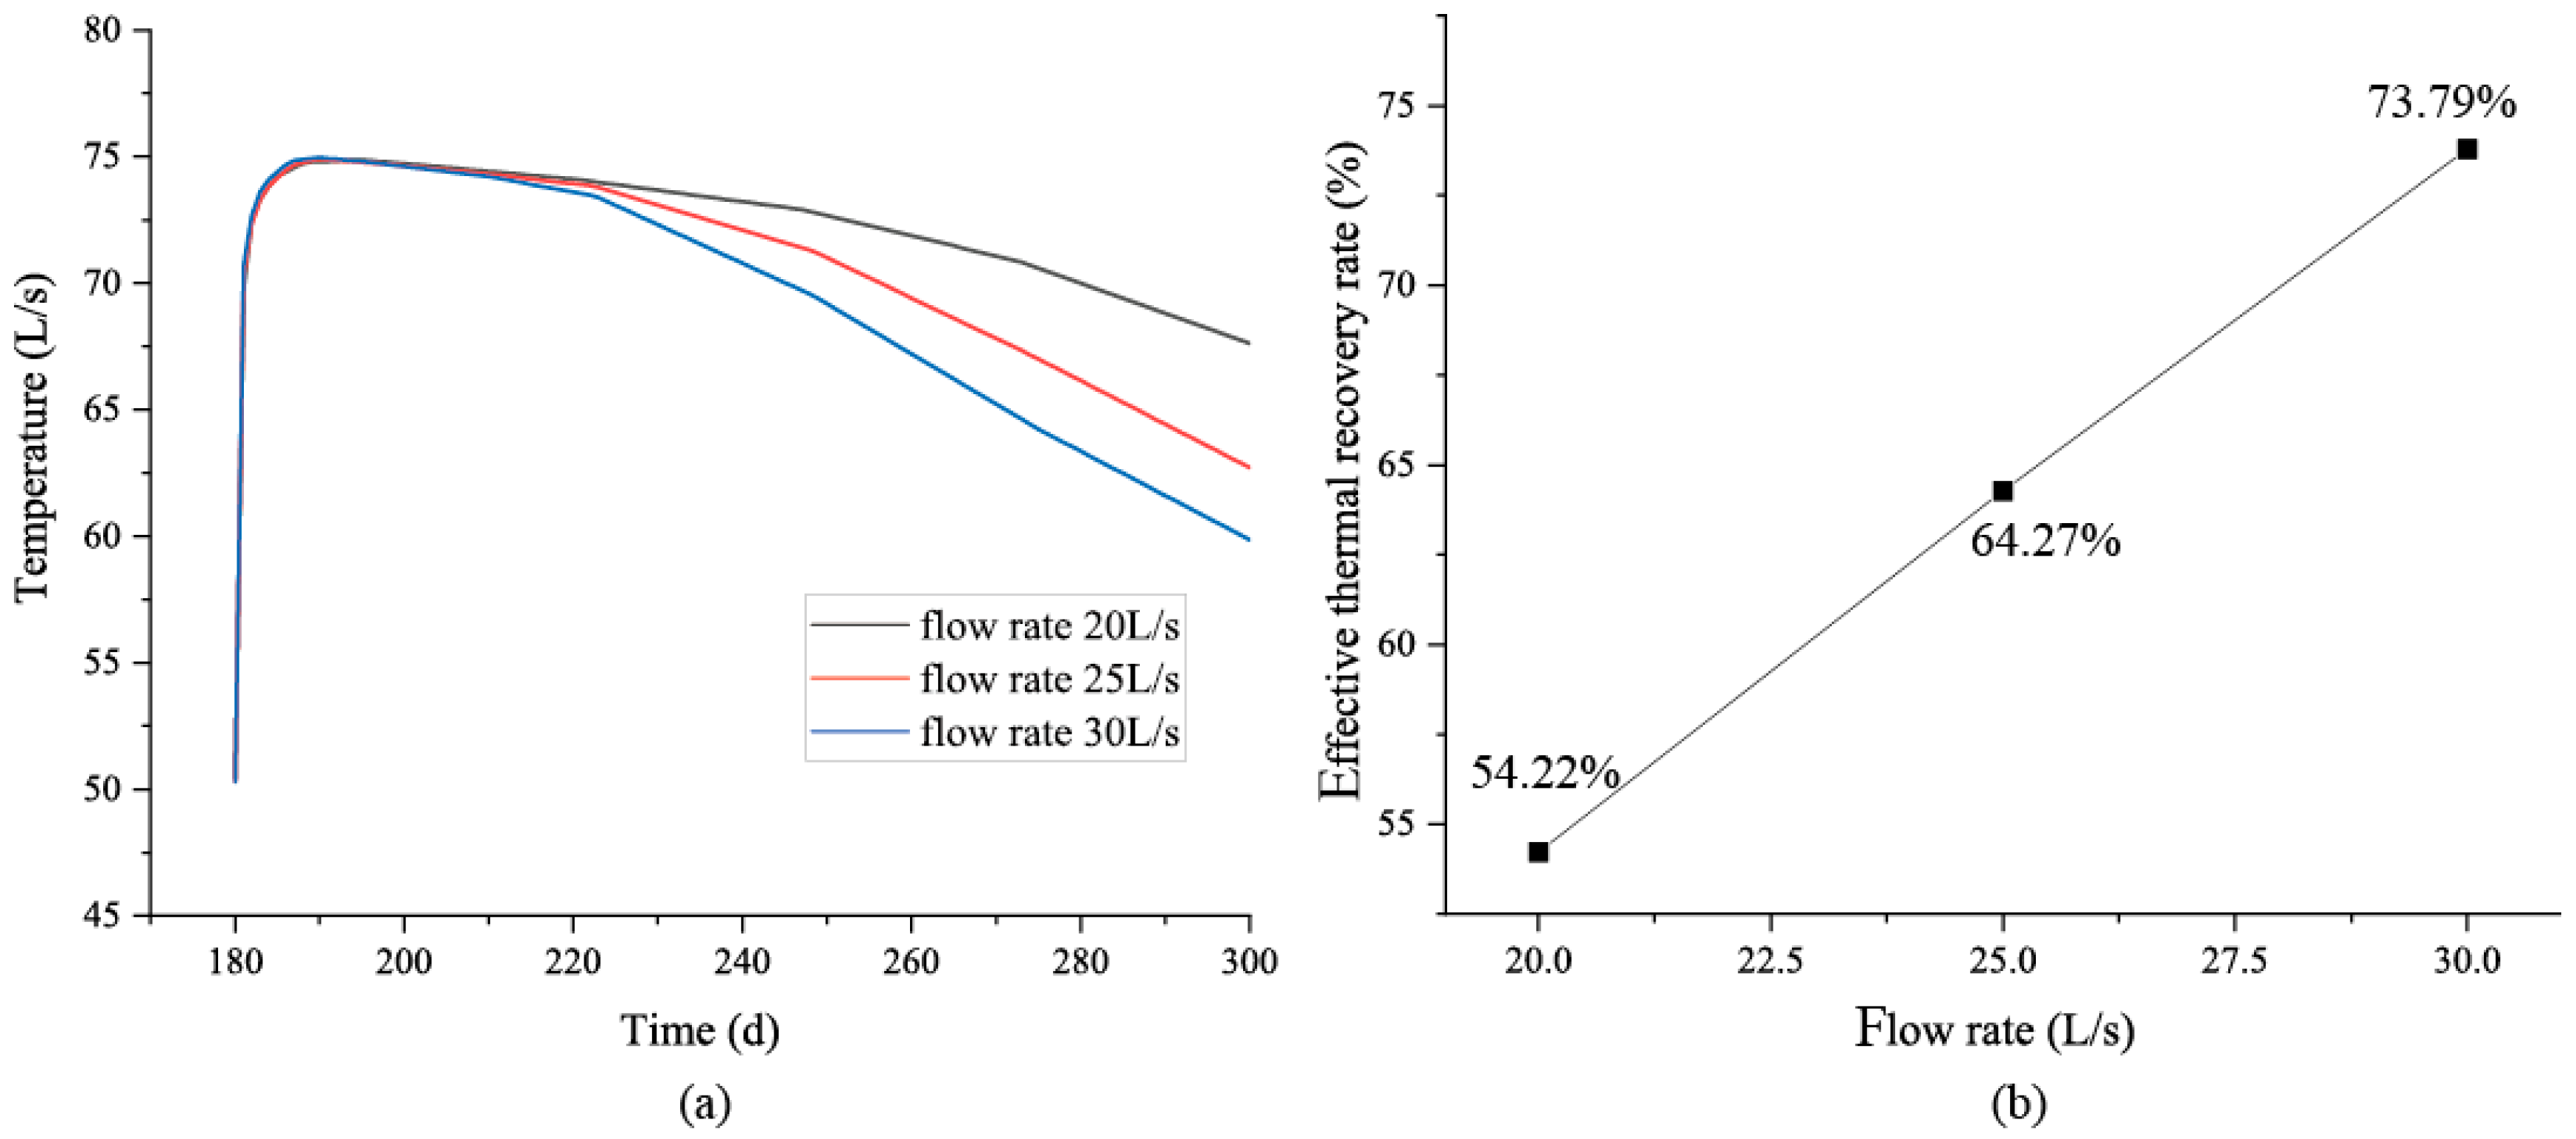
Under different engineering conditions, the pumping flow rate during the heat-production stage may have different requirements. To investigate the impact of different flow rates on the system’s heat production performance, this study analyzed the heat production and heat output under pumping flow rates of 20 L/s, 25 L/s and 30 L/s, with the surrounding rock thermal conductivity set at 1.2 W/(m·K) and specific heat capacity at 1000 J/(kg·K) (Figure 10a). The results indicate that during the initial stage of heat production, whether in the TRS or the TSS, the pumping flow rate has essentially no effect on the output temperature. However, during the TDS, a higher pumping flow rate causes the output temperature to decrease more rapidly. This is primarily because a larger pumping flow rate transports the reinjected cold water more quickly to the pumping point, causing a cold short-circuit phenomenon that rapidly lowers the production temperature. Regarding the heat output, the total extracted heat at flow rates of 20 L/s, 25 L/s and 30 L/s are 32,316 GJ, 38,306 GJ and 43,977 GJ, respectively. Considering the total heat after the storage phase is approximately 63,000 GJ, the effective recovery rates at the three flow rates are 54.22%, 64.27% and 73.79% (Figure 10b), indicating that a higher flow rate improves the effective recovery rate of the CMUR-ESS. The results show that although lower pumping flow rates result in higher output temperatures, the overall hot water recovery rate is lower. Similar phenomena can also occur in ATES, which indirectly proves that the circulation flow rate of the system affects the thermal storage efficiency of the thermal storage system. However, the formation mechanism of CMUR-ESS is different from ATES [29,30]. For CMUR-ESS, it is mainly because the lower pumping flow rate results in a smaller total amount of pumping during the 120 day heat generation period, leading to a lower overall heat recovery rate. However, in actual production, it is necessary to determine the appropriate pumping flow rate based on the system’s output temperature requirements and the system’s heat generation.

5. Conclusions

This study investigated the performance and optimization of the Coupled Mine Underground Reservoir Energy Storage System with a focus on the thermal characteristics of the surrounding rock, the impact of engineering parameters and the heat production efficiency of the system. This study analyzed the feasibility of CMUR-ESS in cross-seasonal energy storage, and then evaluated the impact of geological parameters, such as rock thermal conductivity and specific heat capacity, as well as operational parameters such as hot water extraction flow rate, on the overall system performance. The overall results of numerical simulation showed that CMUR-ESS has significant feasibility in cross-seasonal heat storage, and the heat storage effect is very good. The comprehensive heat-recovery rate of the system is higher than 70%, which can meet the needs of most cross-seasonal heat storage applications. Through numerical simulations and sensitivity analyses, several key findings were derived that contribute to a deeper understanding of the system’s behavior and its potential for practical engineering applications.
According to the simulation results, the thermal conductivity of the surrounding rock significantly affects the cooling process and temperature distribution of the hot water. During the thermal storage phase, higher thermal conductivity of the surrounding rock causes the hot water to cool rapidly near the reservoir boundary, resulting in a noticeable temperature decrease in the boundary region (RCZ). Although the temperature change in the central region of the reservoir is minor, the overall temperature of the hot water gradually decreases due to the accelerated heat conduction process caused by the higher thermal conductivity of the surrounding rock. Further analysis shows that variations in thermal conductivity do not significantly affect the width of the RCZ and SCZ but lead to an overall reduction in the temperature of the hot water.
The thermal conductivity of surrounding rock plays a significant role in the heat storage phase and subsequent heat production. Higher thermal conductivity leads to a decrease in the overall temperature of the stored hot water, enhancing the cooling rate during the storage stage. This results in a lower temperature during the heat extraction phase, though the recovery rate of hot water remains unaffected by the thermal conductivity variation.
A higher specific heat capacity of surrounding rock results in more heat being absorbed by the rock, thereby lowering the temperature of the hot water at the end of the heat storage phase. This lower temperature during the heat production phase leads to a decrease in the production temperature, with the specific heat capacity influencing the overall heat loss from the system, thereby reducing the efficiency of heat production.
The pumping flow rate has a negligible effect on the output temperature during the initial stages of heat production. However, during the thermal drawdown stage (TDS), higher flow rates cause the production temperature to decrease more rapidly due to a cold short-circuit phenomenon. Despite this, higher flow rates result in a greater effective heat recovery rate, with flow rates of 30 L/s achieving the highest recovery rate of 60.73%, indicating that optimizing the pumping flow rate is crucial for improving the CMUR-ESS efficiency.
In conclusion, this study highlights the importance of geological and operational parameters in the performance of CMUR-ESS systems. By optimizing factors such as surrounding rock thermal conductivity, specific heat capacity and pumping flow rates, the efficiency and effectiveness of these systems can be significantly enhanced, thereby contributing to the advancement of geothermal energy storage technologies.

Author Contributions

Conceptualization, Z.W., Z.H. and J.T.; methodology, Z.W. and X.H.; software, Z.W. and X.H.; validation, Z.W. and Z.H.; formal analysis, Z.W. and Z.H.; investigation, Z.W. and K.Z.; resources, Q.G.; writing—original draft preparation, Z.W.; writing—review and editing, J.T., Z.H., H.Z., S.K. and X.H.; visualization, Z.W. and Z.H.; supervision, Z.H. and J.T.; project administration, H.Z. and Q.G. All authors have read and agreed to the published version of the manuscript.

Funding

This research was funded by State Key Laboratory of Water Resources Protection and Utilization in Coal Mining Open Fund (grant number: NICE_RD_2023_156), Scientific Research Project of Jilin Provincial Department of Education (grant number: JJKH20240157KJ) and National Energy Group Science and Technology Innovation Project (grant number: GJNY-20-114). APC was funded by State Key Laboratory of Water Resources Protection and Utilization in Coal Mining Open Fund.

Data Availability Statement

Data are contained within the article.

Conflicts of Interest

Author Xiaolin He was employed by the company China Construction Second Engineering Bureau Co., Ltd. The remaining authors declare that the research was conducted in the absence of any commercial or financial relationships that could be construed as a potential conflict of interest.

References

  1. Cui, C.Q.; Wang, B.; Zhao, Y.X.; Xue, L.M. Waste mine to emerging wealth: Innovative solutions for abandoned underground coal mine reutilization on a waste management level. J Clean Prod. 2020, 252, 119748. [Google Scholar] [CrossRef]
  2. Duchane, D.V. Geothermal energy from hot dry rock: A renew able energy technology moving towards practical implementation. Renew. Energy 1996, 9, 1246–1249. [Google Scholar] [CrossRef]
  3. Chen, Y.; Zhang, Y.; Xia, F.; Xing, Z.; Wang, L. Impacts of underground reservoir site selection and water storage on the groundwater flow system in a mining Area—A case study of daliuta mine. Water 2022, 14, 3282. [Google Scholar] [CrossRef]
  4. Pan, L.; Wang, F.; Miao, X. Concurrent mining during construction and water-filling of a goaf groundwater reservoir in a coal mine. Mine Water Environ. 2018, 37, 760–772. [Google Scholar] [CrossRef]
  5. Liu, Z.; Feng, Q.; Wang, T.; Li, Y. Drivers of groundwater storage dynamics in China’s Ordos mining region: Integrating natural and anthropogenic influences. Chin. Geogr. Sci. 2025, 35, 412–427. [Google Scholar] [CrossRef]
  6. Chen, Y.; Zhang, J.; Liu, R.; Zhao, H. Creep behavior and permeability evolution of coal pillar dam for underground water reservoir. Int. J. Coal Sci. Technol. 2023, 10, 78–92. [Google Scholar] [CrossRef]
  7. Menéndez, J.; Loredo, J.S.S. Use of coal mines facilities in northern Spain for the production of sustainable energy. Int. J. Environ. Sci. 2017, 2, 324–328. [Google Scholar]
  8. Andersson, J. Improving the efficiency of district heating and cooling using a geothermal technology: Underground thermal energy storage (UTES). Renew. Energy Rev. 2021, 15, 45–60. [Google Scholar]
  9. Smith, L.P.; Johnson, M.K. Modelling the energy production of a borehole thermal energy storage (BTES) system. Geotherm. Energy J. 2020, 8, 112–125. [Google Scholar]
  10. Lu, J.; Huang, G.; Gao, H.; Li, X.; Zhang, D.; Yin, G. Mechanical Properties of Layered Composite Coal–Rock Subjected to True Triaxial Stress. Rock Mech. Rock Eng. 2020, 53, 4117–4138. [Google Scholar] [CrossRef]
  11. Su, Z.; Yang, L.; Wang, H.; Liu, S.; Song, J.; Jin, X. Solar-assisted combined cooling and power system integrating energy storage and desulfurization for coal-fired power plants. Therm. Sci. Eng. Prog. 2023, 45, 102110. [Google Scholar] [CrossRef]
  12. Zhao, H.; Tu, S.; Liu, X.; Ma, J.; Tang, L. Energy-efficient heat resistance and cooling technology for high-temperature working faces with multiple heat sources in deep mines. Int. J. Coal Sci. Technol. 2023, 10, 45–61. [Google Scholar] [CrossRef]
  13. Saadat, A.; Shojaosadati, S.A. A review of underground energy storage in abandoned mines: Technical insights and case studies. Energy Sources Part A Recovery Util. Environ. Eff. 2019, 41, 820–837. [Google Scholar]
  14. Holmslykke, H.; Weibel, R.; Olsen, D.; Anthonsen, K.L. Geochemical reactions upon injection of heated formation water in a Danish geothermal reservoir. ACS Earth Space Chem. 2023, 7, 1486–1498. [Google Scholar] [CrossRef]
  15. Menéndez, J.; Schmidt, F.; Konietzky, H.; Bernardo Sánchez, A.; Loredo, J. Empirical Analysis and Geomechanical Modelling of an Underground Water Reservoir for Hydroelectric Power Plants. Appl. Sci. 2020, 10, 5853. [Google Scholar] [CrossRef]
  16. Menéndez, J.; Loredo, J. Thermal energy recovery from flooded coal mines in northern Spain: A numerical model-based assessment. Renew. Energy 2019, 143, 1386–1396. [Google Scholar]
  17. Chudy, K. Mine Water as Geothermal Resource in Nowa Ruda Region (SW Poland). Water 2022, 14, 136. [Google Scholar] [CrossRef]
  18. Menéndez, J.; Loredo, J. Energy from closed mines: Underground energy storage and geothermal applications. Renew. Sustain. Energy Rev. 2019, 108, 498–512. [Google Scholar] [CrossRef]
  19. Menéndez, J.; Ordónez, A.; Fernández-Oro, J.M.; Loredo, J.; Díaz-Aguado, M.B. Feasibility analysis of using mine water from abandoned coal mines in Spain for heating and cooling of buildings. Renew. Energy 2020, 146, 1166–1176. [Google Scholar] [CrossRef]
  20. Ren, G. Water absorption characteristics of sand-mudstone composite lithology model in low/ultra permeability reservoirs. J. Oil Gas Technol. 2020, 42, 40251. [Google Scholar] [CrossRef]
  21. Smye, K.; Banerji, D.A.; Eastwood, R.; McDaid, G.; Hennings, P. Lithology and reservoir properties of the Delaware Mountain Group and implications for saltwater disposal and induced seismicity. J. Sediment. Res. 2021, 91, 587–601. [Google Scholar]
  22. Zhang, H.; Ye, Q.; Huan, J.; Zhang, C.; Chen, R. Identification of complex lithofacies based on compositional indicators: A case study of deep-water low-permeability gas reservoir in Baodao Sag, South China Sea. Mar. Geol. Front. 2024, 40, 87–95. [Google Scholar]
  23. Zhang, K.; Li, H.; Han, J.; Jiang, B.; Gao, J. Understanding of mineral change mechanisms in coal mine groundwater reservoir and their influences on effluent water quality: An experimental study. Int. J. Coal Sci. Technol. 2021, 8, 154–167. [Google Scholar] [CrossRef]
  24. Yang, Z.; Zhang, Y. Convergence of solutions for Brinkman equations and Darcy equations interacting in porous media. J. Comput. Math. 2022, 40, 753–772. [Google Scholar]
  25. Gao, X.-W.; Ding, J.-X.; Liu, H.-Y. Finite line method and its application in coupled heat transfer between fluid-solid domains. Acta Phys. Sin. 2022, 71, 190201. [Google Scholar] [CrossRef]
  26. Esfe, M.H.; Bahiraei, M.; Hajbarati, H. A comprehensive review on convective heat transfer of nanofluids in porous media: Energy-related and thermohydraulic characteristics. Appl. Therm. Eng. 2020, 175, 115487. [Google Scholar]
  27. Chaurasia, A.S. Computational Fluid Dynamics and COMSOL Multiphysics: A Step-by-Step Approach for Chemical Engineers; Apple Academic Press: Burlington, ON, USA, 2021. [Google Scholar]
  28. Zeng, Z.; Shen, W.; Wang, M.; Li, Z.; Wang, X.; Ding, J. Numerical simulation of multi-field coupling in geothermal reservoir heat extraction of enhanced geothermal systems. J. Pet. Explor. Prod. Technol. 2024, 14, 1631–1642. [Google Scholar] [CrossRef]
  29. Li, X.; Wang, Y.; Zhang, S. Thermal performance and analysis of high-temperature aquifer thermal energy storage based on a practical project. J. Energy Storage 2024, 75, 109702. [Google Scholar]
  30. Huang, Y.; Li, S.; Zhang, W. Numerical modeling of the high-temperature thermal energy storage system in deep aquifers. Energy 2023, 282, 128875. [Google Scholar]
  31. Yuan, T.; Li, Y.; Wang, S.; Li, J.; Wang, J.; Chen, J. Energy storage mechanism and modeling method of underground aquifer to meet the demand of large-capacity new energy consumption. Appl. Therm. Eng. 2024, 246, 122966. [Google Scholar] [CrossRef]
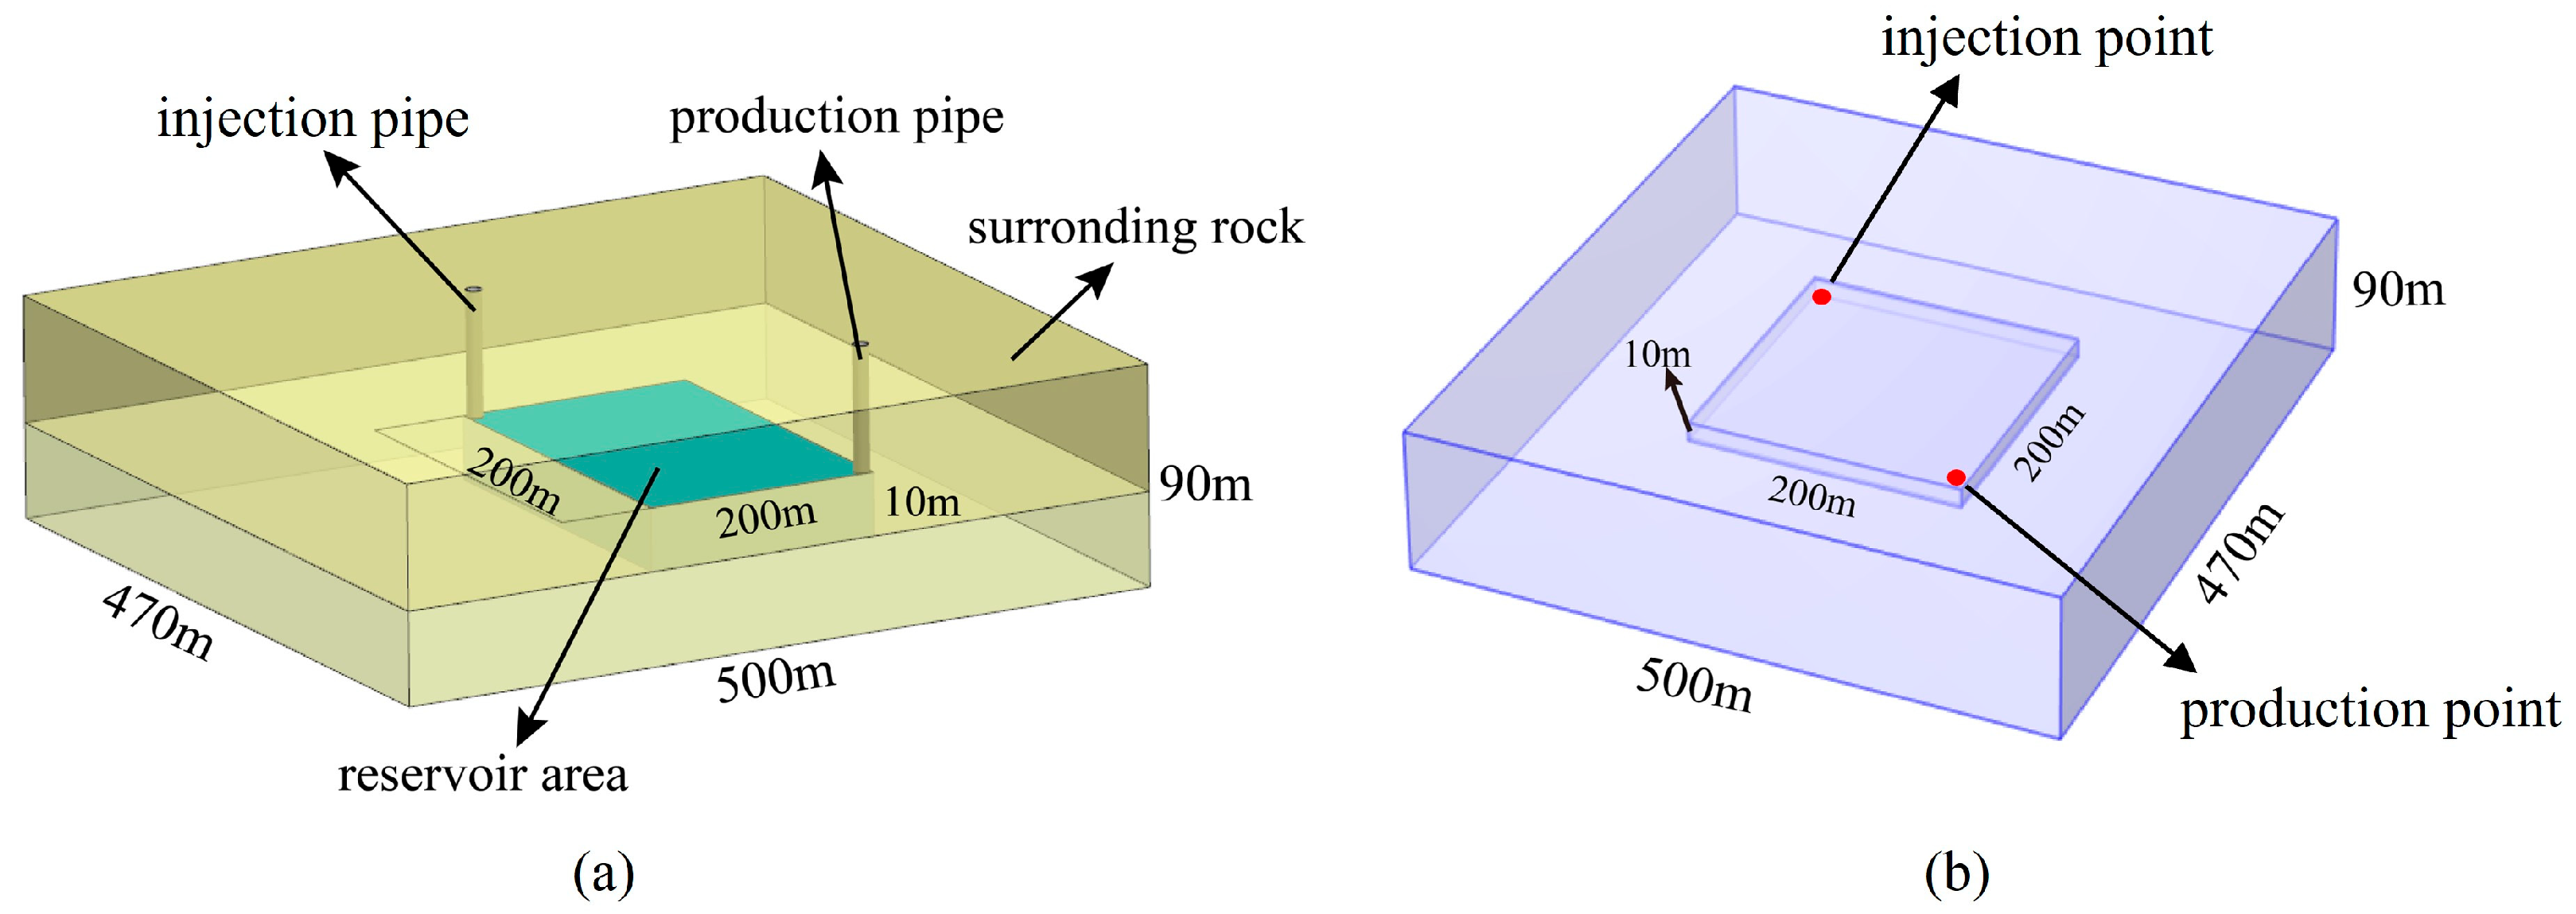
Figure 1. Conceptual model of CMUR-ESS:(a) Conceptual model diagram and dimensions; (b) Numerical simulation model.
Applsci 15 10070 g001
Figure 2. Temperature evolution during heat storage stage.
Applsci 15 10070 g002
Figure 3. Evolution process of fluid temperature at different distances from the boundary in the reservoir area (a) and temperature distribution near the reservoir boundary (b).
Applsci 15 10070 g003
Figure 4. Volume distribution of hot water (a) and total energy (b) in reservoir area during heat storage stage.
Applsci 15 10070 g004
Figure 5. Evolution of runoff generation temperature (a) and heat production rate (b) of CMUR-ESS with time in heat production stage.
Applsci 15 10070 g005
Figure 6. Evolution of temperature field in reservoir area during heat generation stage.
Applsci 15 10070 g006
Figure 7. Volume ratio of hot water (a) and temperature distribution in boundary region (b) under different thermal conductivity after thermal storage.
Applsci 15 10070 g007
Figure 8. Evolution process of pumping point temperature (in heat storage stage) and runoff temperature curve (in heat production stage) under different thermal conductivity conditions.
Applsci 15 10070 g008
Figure 9. Evolution process of pumping point temperature (in heat storage stage) and runoff temperature curve (in heat production stage) under different surrounding rock- specific heat capacity.
Applsci 15 10070 g009
Figure 10. System output temperature (a) and effective recovery rate (b) under different pumping flow conditions.
Applsci 15 10070 g010
Table 1. Thermal-physical parameters setting [20].
Parameter Name (Unit)Parameter Value
Surrounding rocks density (kg/m3)1940
Surrounding rocks permeability (m2)1 × 10⁻¹⁶
Surrounding rocks porosity0.05
Thermal conductivity of surrounding rocks (W/m·K)1.2
Heat capacity of surrounding rocks (J/kg·K)9.7
Water density (kg/m3)1000
Dynamic viscosity of water (Pa·s)1.01 × 10⁻³
Thermal conductivity of water (W/m·K)0.59
Heat capacity of water (J/kg·K)4185
Initial water temperature (K)363.15
Initial rock temperature (K)313.15
Table 2. Simulation scheme and parameters setup.
Rock Specific Heat Capacity (J/kg·K)Rock Thermal Conductivity (W/m·K)Flow Rate (L/s)
Base case9701.230
Case 15001.230
Case 215001.230
Case 39700.830
Case 49701.630
Case 59701.220
Case 69701.225
Disclaimer/Publisher’s Note: The statements, opinions and data contained in all publications are solely those of the individual author(s) and contributor(s) and not of MDPI and/or the editor(s). MDPI and/or the editor(s) disclaim responsibility for any injury to people or property resulting from any ideas, methods, instructions or products referred to in the content.