Abstract
Active tectonics in the Arabian Shield region has substantially influenced the drainage system and geomorphic expressions. The Nabitah Fault Zone (NFZ), located in the southern portion of the Arabian Nubian Shield, is an intra-arc suture that traces the boundary between two young Neoproterozoic intra-oceanic arc terranes: the Tathlith–Malahah terrane and the Al Qarah terrane. In this study, an active tectonic model was assessed and developed to evaluate the level and distributions of the tectonic activity related to the NFZ in Saudi Arabia. To achieve that, a digital elevation model-derived drainage system and a series of geomorphic indices were used, including mountain front sinuosity, valley floor width-to-valley height ratio, basin shape, hypsometric integral, and basin asymmetry. The average value of each geomorphic index was calculated and assigned. The results extracted were integrated to obtain the Tectonic Activity index (TA). Three classes were defined in this study to indicate the tectonic activity degree: low tectonic activity (class 3; TA > 2.5), moderate tectonic activity (class 2; 1.75 < TA ≤ 2.5), and high tectonic activity (class 1; 0 < TA < 1.75). Based on the results, this paper deduced that the highly deformed regions associated with active tectonics can be recognized and evaluated using this effective integration technique. Therefore, this can be applied to other significant fault zones elsewhere, particularly those whose tectonic activity has not yet been evaluated.
1. Introduction
Active fault zones are critical regions of crustal deformation where tectonic processes are the main factor for the present-day Earth’s surface morphology. These processes reshape topography, control the distribution and incision rates of drainage networks, and affect erosion, sediment transport, and deposition patterns. In arid and semi-arid regions, geomorphic signatures of tectonic activity are preserved for long periods of time due to reduced erosional rates including sparse vegetation and reduced weathering rates, presenting these landscapes as natural laboratories of recent deformation [1,2,3,4,5]. Examining and understanding the interactions between tectonics and drainage systems is crucial for both reconstructing landscape development and studying hazard assessment, water resource management, and accurate sustainable land-use planning [6,7,8].
Analysis of drainage basins and systems presents significant insights into fault evolution and active tectonics assessment [9,10]. Numerous and different studies have been applied to test how drainage networks act along faults, folds, and uplifting blocks [11,12,13,14,15]. The difference between inactive and active tectonic features can be assessed through detailed quantitative studies of geomorphic indices including mountain front sinuosity (Smf), valley floor width-to-height ratio (Vf), hypsometric integral (Hi), hypsometric curve shape (Hc), basin shape (Bsh) indices. These indices proved to be effective to statistically identify the evolutionary stage of landscapes and tectonically controlled areas and highlight changes in tectonic activity. The accuracy of tectonic interpretations is frequently improved by combining geomorphic indices with lithological data such as rock strength index.
Numerous studies have successfully used geomorphic indices to test and read dynamic landscapes in several different environmental conditions (e.g., [3,6,14,15,16,17]). These methods have been especially valuable and effective in regions with little paleoseismic and geodetic data. Thus, drainage system and basin morphometry serve as an indirect useful technique for reading and understanding the relative uplift rates, fault activity, and landscape reaction periods in these situations [11]. However, such integrated tectonic geomorphic studies are still few in Saudi Arabia’s Arabian Shield, especially along the Nabitah Fault Zone (NFZ), a significant Neoproterozoic suture and crustal-scale fault system. The quantitative description of active deformation and its effects on the environment is lacking since previous studies have mostly concentrated on regional geology and geochemistry analysis [18,19].
The NFZ represents a significant and important feature for understanding both ancient and modern crustal dynamics because of its long history of deformation and position in a seismically active region. Natural hazards like landslides and flash floods can be made worse by active deformation, particularly in areas where infrastructure and human settlements intersect active fault traces. Understanding these connections is essential for creating strategies that effectively mitigate hazards and making sure that infrastructure development complies with the landscape’s natural dynamics. Additionally, active tectonics have consequences for environmental sustainability. Resilient ecosystems in arid places depend on soil development, vegetation patterns, and water availability, all of which are influenced by tectonically driven changes in topography and hydrology. For this reason, mapping and identifying areas of continuous deformation can help guide resource management plans, land-use planning, and sustainable development policies in addition to geological and seismic assessments.
The tectonic history of the NFZ was interpreted differently. It has been viewed as a major suture zone separating the juvenile western arc terranes from the older eastern continental terranes of the Arabian–Nubian Shield [20]. Nevertheless, more recent isotopic and geochronological research reinterprets it as an intra-arc suture that formed in the western terranes during the closure of a back-arc basin between Tathlith arc and Tarib arc [18,21,22]. The fault is portrayed as a remnant of Pan-African orogeny by several geological and geochronological studies, which highlight its Neoproterozoic beginnings [19]. For example, USGS mapping and geochronological data show that there was little indication of subsequent reactivation and that fault activity and arc-related plutonism occurred between roughly 710 and 670 million years ago [20]. Furthermore, examinations of the Arabian Shield’s crustal terrane borders and ophiolite complexes support the Nabitah Fault’s long-standing structural function [20,23]. Regional gravity and magnetic surveys that have been recently carried out by authors in Ref. [18] have identified basement anomalies and inherited NE-trending fault structures, particularly in the southern Arabian Shield. These structures are aligned with surface epicenters of contemporary seismicity and are thought to be reactivations of the ancient dextral strike-slip Nabitah fault system [18,24]. These findings suggest dextral strike-slip motion that may be connected to Red Sea rifting dynamics. These investigations highlight the wider possibility of reactivated Precambrian structures within the shield, even though they do not yet specifically target the NFZ [20,24,25]. This discrepancy between theories regarding the fault as an ancient, mostly dormant suture and one that might be impacted by current tectonic activity and reactivation emphasizes the necessity of thorough, quantitative geomorphic study.
In this study, we use drainage basin parameters acquired from remote sensing including Digital Elevation Model (DEM) to quantitatively assess active deformation along the NFZ using a tectonic geomorphology application. We evaluate the spatial variability of recent tectonic activity, investigate the impact of lithological diversity on landscape response to deformation, and consider the implications for environmental sustainability and seismic hazard assessment in arid, tectonically active regions by integrating several geomorphic indices into a composite relative tectonic activity index (TA). The results of this paper provide fresh light on how tectonics and drainage system evolution are coupled in the Arabian Shield. The developed methodology can be applied to the study of other active fault zones in regions where limited data are available [6,9].
2. Regional Setting
The NFZ, also known as the Nabitah suture, is located in southwestern Saudi Arabia, along the axis of the Arabian Shield between latitudes 19° N and 22° N and longitudes 42° E and 44° E (Figure 1). The NFZ system, which is extended over 900 km, is identified by a locus of north-trending, fault-bounded serpentinite bodies [26]. The Nabitah suture zone refers to both the Nabitah fault system and a belt of foliated grano-dioritic plutonic rocks that are connected to it [20,25]. Based on comparisons between scale models and recent Phanerozoic volcanic arcs, the NFZ may have formed as a transform fault in the frame of sinistral oblique subduction east of the Al Amar fault [20]. The north–south NFZ is recognized and mapped between the two major terranes: Tathlith–Malahah and Al Qarah terrane, which are situated east and west of the fault zone (Figure 1), respectively [18,27]. In this work, the term terrane refers to a fault-bounded crustal block that is distinct from its surrounding blocks in terms of geological history and rock assemblage. Terranes like those seen in Saudi Arabia are the remains of ancient island arcs, oceanic crust, and microcontinents that were accreted and sutured together as part of the Arabian–Nubian Shield assembly in the late Proterozoic.
2.1. Tathlith–Malahah Terrane
Two different volcanic and sedimentary successions distinguish the Tathlith–Malahah terrane from the Al Qarah terrane [27]. Most of the northern part of the terrane is made up of an upper series of meta-greywacke and greenschist-facies meta-andesite rocks [18,24]. The southern portion of the Tathlith–Malahah terrane from its conjugate fault zone, the Mulha Fault Zone, is made up of a metamorphic sequence at greenschist-facies that includes a bimodal suite of rhyolitic and basaltic volcanic rock units. It is suggested that the southern section was deposited in a marine basin in a back arc environmental setting [28]. Authors in Ref. [28] suggested that these rocks are thought to extend northward into the terrane and are connected to the higher- and lower-grade succession.
2.2. Al Qarah Terrane
The distinct Al Qarah terrane is a component of a collection of young intra-oceanic arcs known as the Asir composite terrane [29] or simply the Asir terrane [26,30]. It is composed of an obvious succession of metasedimentary and metavolcanic rock units, andesite to greenschist-facies, andesite to dacite in compost, which are intruded by dioritic and tonalitic intrusions [18,31] (Figure 2).
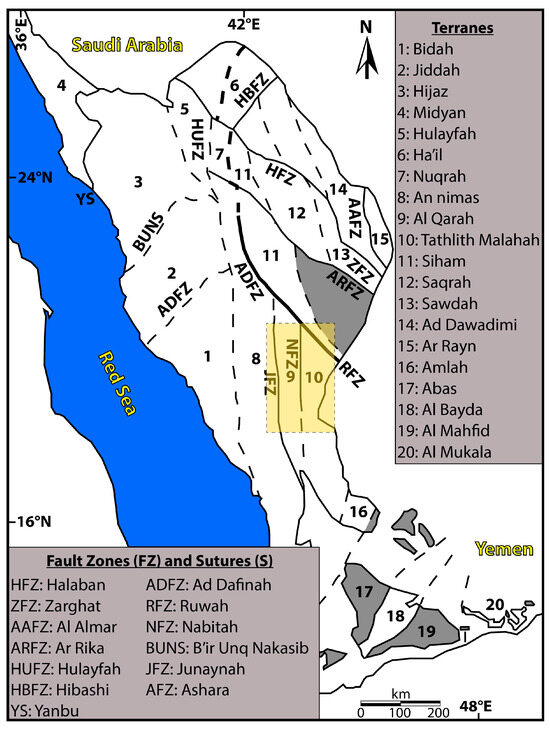

Figure 1.
Illustration shows the Arabian–Nubian Shield’s terranes and major fault systems modified after [18,27,32,33]. The yellow dashed box indicates the location of the NFZ.
2.3. Nabitah Fault Zone
The NFZ is mapped south of the Hulayfah–Ad Dafinah fault zone and extends through the Al-Tathlith-Malahah and Qarah terranes, as previously mentioned. It also records many serpentinite units [34]. During its early ductile and subsequent brittle history, the NFZ experienced dextral (right-handed) kinematics [35]. Several authors such as authors in Refs. [19,36,37] suggest that the age of the NFZ ranges from roughly 660 Ma to 640 Ma, indicating that activity along the fault zone also stretched across this age range. The NFZ extension south of its conjugation with the fault zone of Mulha is still under discussion due to the superimposing of intense later plutonism and tectonism [19].
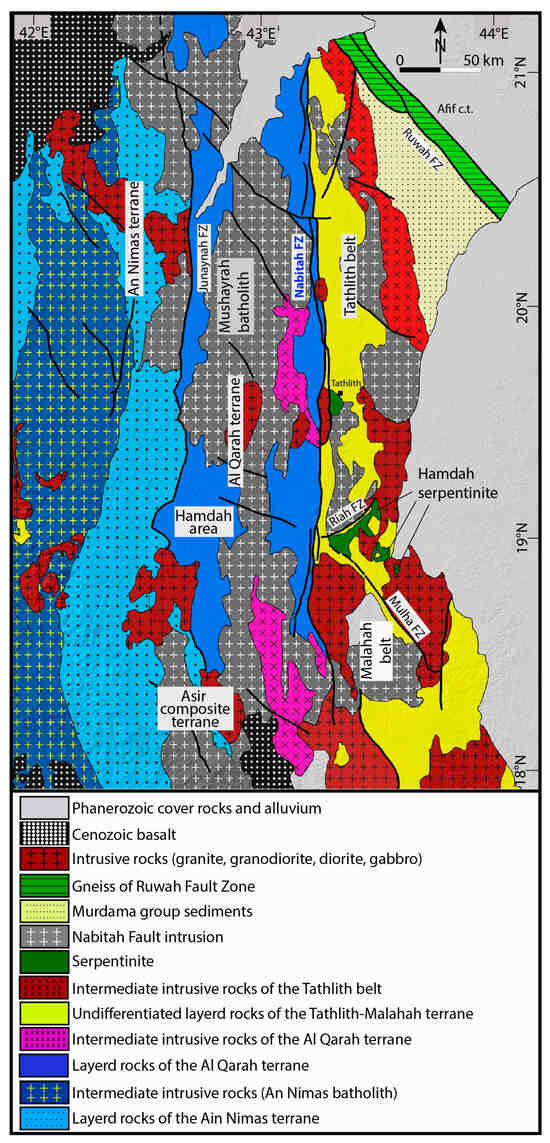

Figure 2.
Map illustrates the simplified geology of the NFZ, Tarib arc, and Tallith terrane (yellow dashed box in Figure 1), modified after [18,38,39,40].
3. Material and Methods
This study collected and used several raster and vector datasets. ArcGIS 10.4 software and a 30 m spatial resolution digital elevation model (DEM) extracted from a Shuttle Radar Topography Mission (SRTM) were applied in this study for morphological analyses along the entire zone of the NFZ. Data was downloaded from the USGS website, (https://earthexplorer.usgs.gov/), accessed on 21 January 2025. Raw DEM data are the primary focus of pre-processing step. Data corrections and rectifications through the fill option in the hydrology tools of ArcGIS 10.4 were the initial stage in preparing for data extraction. In this work, the NFZ area was presented and visualized as 41 different sized catchments providing six orders (Figure 3a,b).
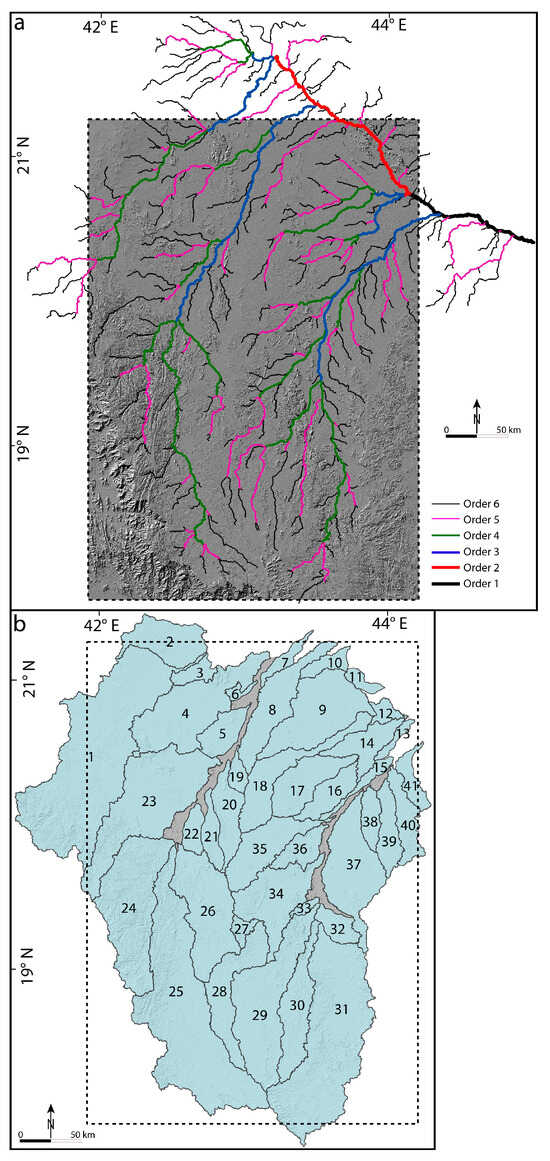
Figure 3.
(a) Stream orders and (b) catchments (1–41) extracted from the study fault zone. Dashed square indicates the study NFZ.
Geomorphic features and relative tectonic activity can be recognized and analyzed using various geomorphic indicators. These effective indices or parameters act as a quantitative technique to build up a geomorphic analysis model based on the analysis of several processes, including valley morphology, long profiles, and river channels, as well as distinct tectonic features like fault scarps [2,6]. Anomalies seen in drainage systems or along mountain fronts in active tectonic investigations frequently represent regional differences in tectonic activity, such as subsidence or uplift [2,15]. Although these anomalies may be a sign of real tectonic behavior, they can also result from the applied geomorphic indices’ shortcomings, such as their sensitivity to lithology, climate, or data resolution. Consequently, both methodological limitations and potential tectonic reasons should be considered while interpreting them [7]. In this work, we examined six distinct indices in the NFZ region catchments (Figure 3a) and classified them according to the range of values of each index. Following their summation and averaging, the result is arbitrary classifications of relative tectonic activity (TA) across the fault zone. Similar class ranges calculated from the averaged values of several geomorphic indices were used in these and other investigations to classify relative tectonic activity. The normalized values of Smf, Vf, Bs, Hi, and Af were added together and averaged, and the findings were then split into three activity groups to establish the categorization thresholds for our study. These criteria are based on the geological and geomorphological background of the fault zone and are in line with the ranges documented in previous tectonic geomorphology studies [16,41]. Using the available methodology, the digital elevation data was processed to extract catchments, watershed delineation, catchment sizes, and river drainage pattern in ArcGIS 10.4 software. The level of uncertainty related to the geomorphic parameters was constrained by the DEM’s resolution. Unlike prior studies, we do not impose an uncertainty on our geomorphic indices [6].
3.1. Rock Strength
This study began assessing the tectonic geomorphology of the NFZ by determining the rock strength based on previous field observations, geological maps and previous analyses along the catchments and mountain front of the fault zone. [6,8,15,42]. The current study used the scheme of rock strength by the author of [43], which links hardness to the constituent material and cement to help with resistance to weathering and river erosion [8,41]. Rock strength classification was suggested in this study as very low level (sand, silt, marl, limestone, alluvium), low level (sandstone, conglomerate, shale with interbedded limestone), medium level (sandy limestone), high level (ignimbrites, basalt), or very high level (schist, gneiss, gabbro, quartzite) (Table 1).
3.2. Mountain Front Sinuosity, Smf
Mountain front sinuosity parameter (Smf) is an index of tectonic activity and erosion. which values depend on block uplift rate [8,44]. This index is defined as the ratio of a mountain front’s actual length along the piedmont junction to its straight-line length, which helps determine the front’s sinuosity [2,44]. Mountain front sinuosity values are extracted by using the following equation:
where Lmf measures the straight distance along an adjacent contour line and Ls defines the sinuous length along the used contour line [10]. The lengths Lmf and Ls were measured along distinct contour lines using topographic maps and DEMs in a GIS software [2,7,45]. This approach allows for precise and reproducible extraction of the relevant topographic parameters [8]. Active tectonic processes versus erosion processes play a primary role in shaping the sinuosity lines with different mountain fronts. The values of the Smf index that are assigned by active faults have low values (1.0 to 1.5), whereas mountain fronts that are heavily altered by erosion processes have higher values (>3). Such high Smf values would suggest that the range controlling fault that shaped the mountain front may be located some distance from the mountain front that has been formed by erosion [2,8,41]. The current study looked at the Smf analysis of the main fault zone strand that detects the main fronts.
Smf = Lmf/Ls
3.3. Ratio of Valley Floor Width to Valley Height, Vf
The index width-to-heigh ratio of the valley floor is a very effective index reading tectonic uplift signatures in active tectonic regions. These informative values are calculated from the following formula:
where Vfw defines the width of the analyzed valley floor, Erd and Eld define the altitudes of the right and left analyzed valley divides, and Esc defines the average height of the valley floor [10]. In most tectonic geomorphology studies, authors stated that low Vf values indicate “V” shaped valleys that are characterized by active signatures experiencing rapid uplift and valley incision, whereas high Vf values generally characterize broad, flat-floored valleys [6,7,15,41,44]. This study applied this index for 41 valleys aligned along the proposed 41 catchments.
Vf = 2Vfw/(Eld-Esc) − (Erd-Esc)
3.4. Hypsometric Integral, Hi
The hypsometric integral index is an important factor in relief description in different landscapes. It characterizes the distribution of height in a specific area or landscape [46]. This informative parameter represents the volume of a basin that has not been eroded and is generally recognized as the total area beneath the hypsometric curve [43]. A formula that might be applied to calculate this index is stated as:
where this formula uses DEM data to define the highest and minimum heights and then uses 50 randomly selected elevation points from the drainage basin or DEM to obtain the average elevation values. Significantly, there is no direct connection between the Hi parameter and relative active tectonics. Low values of the Hi index correspond to landscapes that have been more eroded and less affected by recent active tectonics, whereas high values of this index may be associated with young landscapes that have been affected by tectonic activity signatures. The results of this index are produced as hypsometric values and hypsometric curves.
Hi = (Average elevation − Minimum elevation/Maximum elevation − Minimum elevation)
3.5. Asymmetry Factor, Af
Several tectonic activity assessment studies applied the valuable asymmetrical factor index to identify tectonic tilting at the entire range scale of different catchments [2,15,46]. This parameter is described from the following formula:
where Ar is the total drainage area for the entire catchment and At represents the catchment area to the right of the main catchment stream. In the current analysis, excursion from a value of 50 presents insight into catchment tilting. A drainage catchment is considered asymmetrical if its Af value is much higher or lower than 50, indicating a considerable amount of tectonic tilting toward one side. On the other hand, a catchment with an Af value close to 50 is almost symmetrical, indicating little to no tilting and, hence, no recent tectonic influence on basin form. Authors in Refs. [2,15] stated that Af values, such as the Af-50, which is the discrepancy between the defined values and the neutral value of 50, are applied as follows: symmetrical catchments (Af-50 of 50 < 5), gently asymmetrical catchments (Af-50 = 5–10), moderately asymmetrical catchments (Af-50 = 10–15), and substantially asymmetrical catchments (Af-50 of >15). In the current study, 41 catchments were evaluated by this indicative parameter.
Af = 100 (Ar/At)
3.6. Drinage Basin Shape, Bsh
In active tectonic regions, relatively young drainage catchments have an extended shape typical of a mountain’s relief slope. The elongated catchments tend to provide more active tectonic signatures, while circular catchments indicate further evolution or less active tectonic processes [10,47]. The drainage basin shape index can be used to characterize the horizontal projection of basin shape due to the following equation:
where the Bi parameter measures the total length of the catchment between the headwaters and the mouth, while Bw measures the vastest width area of the catchments. In active tectonic studies, elongated catchments with high Bs values are known to exhibit comparatively high tectonic activity signatures. More circular catchments are defined by low Bs values, which exhibit low tectonic activity signatures. Elongated, steep catchments are formed due to rapid uplifted movement along mountain fronts; when tectonic activity slows down or stops, the catchments spread from the mountain front up [7,48].
Bs = Bi/Bw
3.7. Tectonic Activity (TA)
The Tectonic Activity (TA) index was calculated as a mean value of the class values assigned to every single geomorphic index, in accordance with the methodology employed in earlier tectonic geomorphology research. Every single index was divided into three classes of activates according to their values (e.g., Table 2 and Table 3 for Vf and Bsh indices). The obtained classes of all indices were tabulated for every single catchment. Then, three TA classes were defined using the mean value of each geomorphic index, which was divided into distinct groups that represented growing tectonic activity. Class 1 (high tectonic activity) denotes intense active deformation and is represented by mean index values between 0 and 1.75. Averaged index values higher than 1.75 and up to 2.5, which represent intermediate degrees of deformation, are found in class 2 (moderate tectonic activity). Landscapes with average index values above 2.5 are classified as class 3 (low tectonic activity), which denotes areas with little recent tectonic effect.
4. Results
4.1. Rock Strength
There are different lithologies along the mountain face in the NFZ region. Basalt, granite, gabbro, diorite, granodiorite, gneiss, serpentinite, and intrusive rocks (Figure 2) are the geological units of the catchments under study, characterized by high and very high strength levels (Table 1). The Phanerozoic rocks and alluvium (low level strength) (Table 1) are not deformed by either faults or other structural features (Figure 2).


Table 1.
Lithology strength levels of the study fault zone.
Table 1.
Lithology strength levels of the study fault zone.
| Lithologies | Strength Level |
|---|---|
| Basalt | High |
| Granite | Very high |
| Gabbro | Very high |
| Diorite | Very High |
| Granodiorite | Very High |
| Gneiss | Very high |
| Serpentinite | High |
| Phanerozoic cover | Low |
| Alluvium | Low |
4.2. Mountain Front Sinuosity, Smf
The values of the mountain front sinuosity (Smf) for the study fault zone range from 1.0 to 2.2 (Table 2), demonstrating significant regional variations in tectonic activity along the front under analysis (Figure 4). The lowest values of the Smf (close to 1.0) occur in fronts S7, S8, S49, and S46 as 1.01, 1, 1.02, and 1.12, respectively (Table 2). These fronts were recorded in the northern half of the study fault zone (Figure 4). On the other hand, the highest values of the Smf index were observed for fronts S24 (2.2), S16 (2.1), and S31 (2.1) in the southern part of the NFZ (Table 2, Figure 4).


Table 2.
Table showing values of the Smf parameter along the NFZ; S: front.
Table 2.
Table showing values of the Smf parameter along the NFZ; S: front.
| S. | Smf | Class | S. | Smf | Class | S. | Smf | Class | S. | Smf | Class |
|---|---|---|---|---|---|---|---|---|---|---|---|
| S1 | 1.62 | 2 | S17 | 1.3 | 1 | S33 | 1.62 | 2 | S49 | 1.02 | 1 |
| S2 | 1.7 | 2 | S18 | 1.1 | 1 | S34 | 1.32 | 1 | S50 | 1.6 | 2 |
| S3 | 1.65 | 2 | S19 | 1.23 | 1 | S35 | 1.28 | 1 | S51 | 1.77 | 2 |
| S4 | 1.68 | 2 | S20 | 1.24 | 1 | S36 | 1.13 | 1 | S52 | 1.52 | 2 |
| S5 | 2.1 | 2 | S21 | 1.62 | 2 | S37 | 1.07 | 1 | S53 | 1.82 | 2 |
| S6 | 1.3 | 1 | S22 | 1.64 | 2 | S38 | 1.34 | 1 | S54 | 1.61 | 2 |
| S7 | 1.01 | 1 | S23 | 1.69 | 2 | S39 | 1.21 | 1 | S55 | 1.1 | 1 |
| S8 | 1 | 1 | S24 | 2.2 | 2 | S40 | 1.62 | 2 | S56 | 1.25 | 1 |
| S9 | 1.06 | 1 | S25 | 1.9 | 2 | S41 | 1.66 | 2 | S57 | 1.43 | 1 |
| S10 | 1.3 | 1 | S26 | 1.79 | 2 | S42 | 1.23 | 1 | S58 | 1.36 | 1 |
| S11 | 1.25 | 1 | S27 | 1.6 | 2 | S43 | 1.39 | 1 | S59 | 1.32 | 1 |
| S12 | 1.26 | 1 | S28 | 1.57 | 2 | S44 | 1.03 | 1 | S60 | 1.47 | 1 |
| S13 | 1.46 | 1 | S29 | 1.2 | 1 | S45 | 1.02 | 1 | S61 | 1.4 | 1 |
| S14 | 1.3 | 1 | S30 | 1.75 | 2 | S46 | 1.12 | 1 | |||
| S15 | 1.03 | 1 | S31 | 2.1 | 2 | S47 | 1.98 | 2 | |||
| S16 | 1.49 | 1 | S32 | 1.1 | 1 | S48 | 1.78 | 2 |
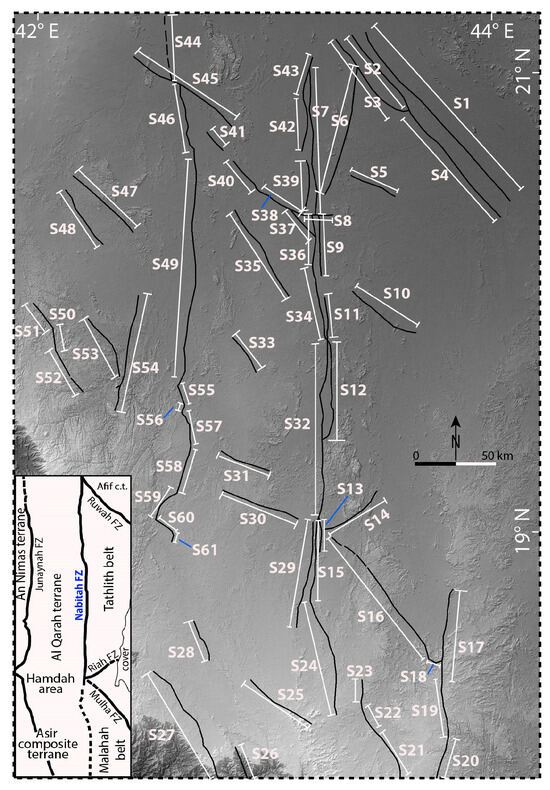
Figure 4.
Shaded relief image (data from https://earthexplorer.usgs.gov/, accessed on 16 January 2025) showing the different mountain fronts of the NFZ with delimited numbers for every single front for the Smf parameter (see Table 3 for values). The small sketch illustrates the main terrains and fault zones of the study area.
4.3. Ratio of Valley Floor Width to Valley Height, Vf
The NFZ’s Vf values range between 0.01 and 1.31 (Table 3). The lowest value of this valuable index was observed for catchment 21, which is located at the middle part of the study fault zone (Table 3, Figure 5). The highest Vf value of the NFZ was recorded for catchment 2 in the most northeastern part of the study fault zone (Table 3, Figure 5 and Figure 6). The rest of the values are distributed over the remaining parts of the NFZ region.


Table 3.
Vf classes that are extracted from values computed in the NFZ region. C.: catchments.
Table 3.
Vf classes that are extracted from values computed in the NFZ region. C.: catchments.
| C. | Vf | Class | C. | Vf | Class | C. | Vf | Class |
|---|---|---|---|---|---|---|---|---|
| C1 | 0.78 | 2 | C15 | 0.04 | 1 | C29 | 0.16 | 1 |
| C2 | 1.31 | 3 | C16 | 0.02 | 1 | C30 | 0.18 | 1 |
| C3 | 0.16 | 1 | C17 | 0.14 | 1 | C31 | 0.25 | 1 |
| C4 | 0.51 | 2 | C18 | 0.04 | 1 | C32 | 0.12 | 1 |
| C5 | 0.11 | 1 | C19 | 0.09 | 1 | C33 | 0.12 | 1 |
| C6 | 0.06 | 1 | C20 | 1.16 | 1 | C34 | 0.07 | 1 |
| C7 | 1.10 | 3 | C21 | 0.01 | 1 | C35 | 0.10 | 1 |
| C8 | 0.07 | 1 | C22 | 0.08 | 1 | C36 | 0.20 | 1 |
| C9 | 0.07 | 1 | C23 | 0.61 | 2 | C37 | 0.66 | 2 |
| C10 | 0.07 | 1 | C24 | 0.11 | 1 | C38 | 0.54 | 2 |
| C11 | 0.78 | 2 | C25 | 0.51 | 2 | C39 | 0.59 | 2 |
| C12 | 0.63 | 2 | C26 | 0.31 | 1 | C40 | 0.66 | 2 |
| C13 | 0.18 | 1 | C27 | 0.15 | 1 | C41 | 0.78 | 2 |
| C14 | 0.26 | 1 | C28 | 0.14 | 1 |
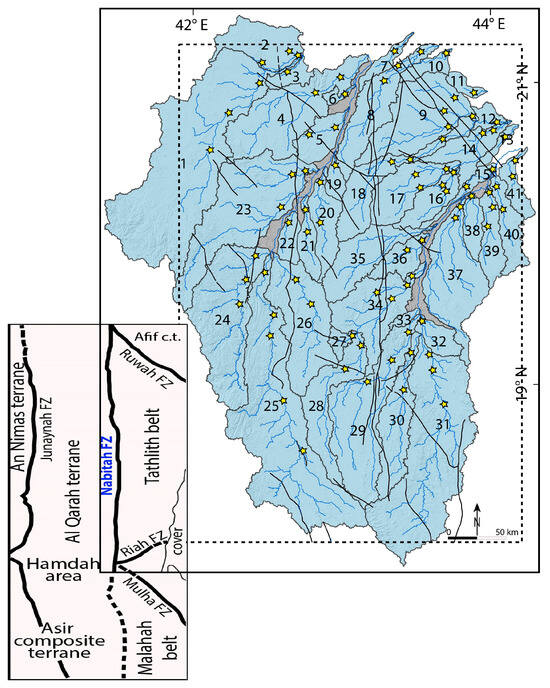
Figure 5.
Sections in the NFZ where the Vf calculations are selected. Yellow stars indicate the Vf sections positions, and black lines are the mountain fronts of the study fault zone.
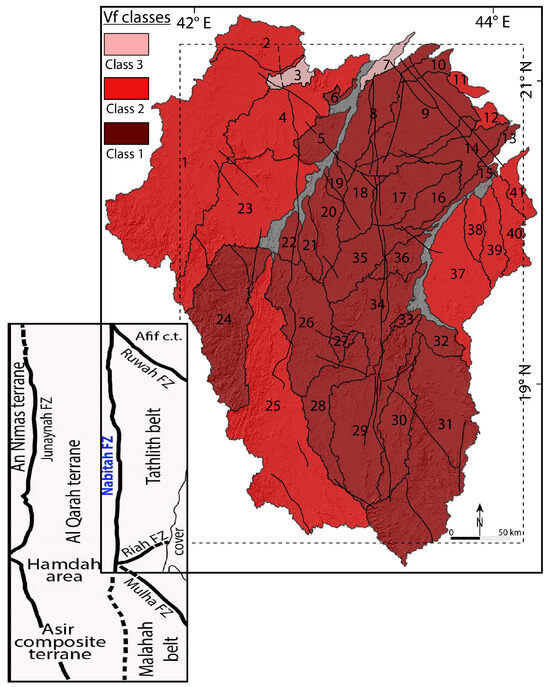
Figure 6.
Classes of the Vf values in the NFZ region.
4.4. Hypsometric Integral, Hi
The hypsometric integral values in the study fault zone range from 0.2 to 0.53. The highest value of this index was observed for catchment 2, while the lowest value was measured for catchment 28 in the southern part of the study fault zone. Most catchments were illustrated with hypsometric concave or convex curves (Figure 7). Only catchments 25 and 28 in the southern part of the study zone are shaped by concave–convex curves (Figure 7).
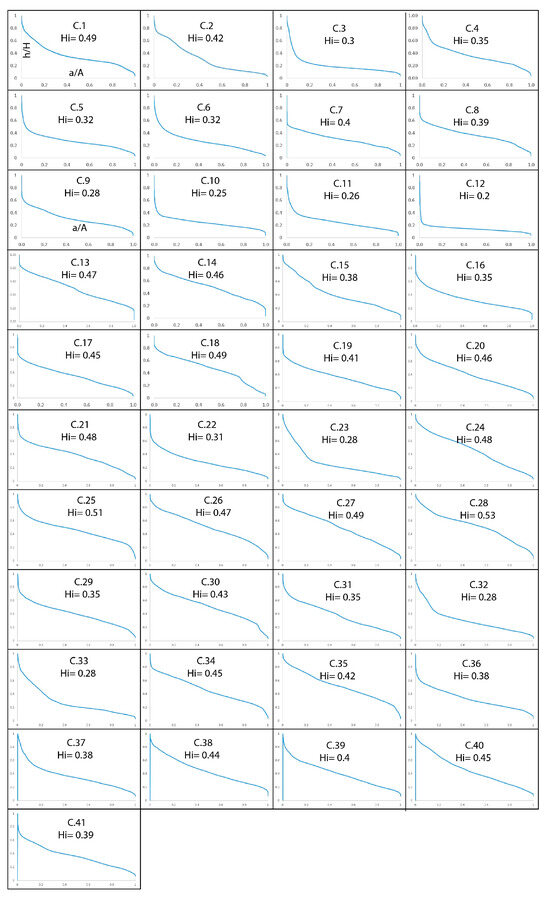
Figure 7.
Hypsometric curves and values of the NFZ region. A: Total surface of the basin and a: surface area within the catchment above a given line of elevation (h). (H) is the highest elevation of the catchment.
4.5. Asymmetry Factor, Af
The values of Af-50 for the catchments within the NFZ fall between −39.77 and 42.57, presenting varying levels of tilting (Table 4). C16, C36, and C41, with values of 0.63, 0.23, and −0.09, respectively, are the catchments with values that are closest to the neutral state, indicating little tilting or lateral migration. On the other hand, C14, C32, and C4, with values of −39.77, 42.57, and 34.89, respectively, exhibit the most variance, indicating a notable asymmetry that may be related to lithological restrictions or tectonic tilting (Table 4 and Figure 8; for catchment locations, see Figure 3b).

Table 4.
Af classes that are extracted from values computed in the NFZ region. C.: catchments.
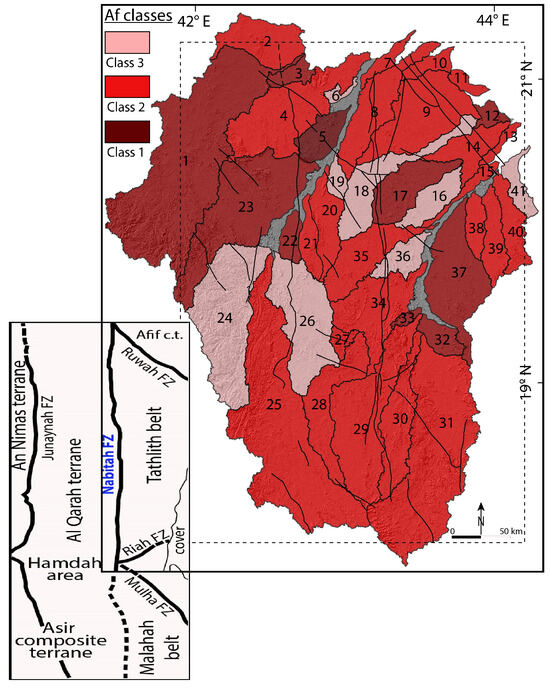
Figure 8.
Classes of the Af values in the NFZ region.
4.6. Drainage Basin Shape, Bsh
The Bsh index in the study fault zone provides values ranging from 0.62 to 6.72 (Table 5). The most elongated catchments include C28, C12, C18, C15, and C30 with values 6.72, 6.63, 6.53, 6.60, and 5.74, respectively (Table 5). On the other hand, the most circular catchments are C24, C23, C8, and C27 with values of 0.62, 0.66, 0.86, 0.80, respectively (Table 5 and Figure 9). The transition between circular and elongated (semi-circles or semi-elongated) catchments were recorded for the other 32 catchments (Table 5; for catchment locations, see Figure 3b).

Table 5.
Classes and values of the Bsh parameter. C.: catchment.

Figure 9.
Classes of the Bsh values in the NFZ region.
4.7. Tectonic Activity (TA)
To present an overall quantitative assessment of relative tectonic activity of the study fault zone region, the results of individual geomorphic indices (including AF, Bsh, Hi, and Vf) were combined to create the composite Tectonic Activity Index (TA). Averaged values of the classes of all indices range from 1.25 for catchments 8, 15, and 30 to 2.5 for catchment 26 (Table 6). Class 3 (low tectonic activity) was recorded for catchments 2, 19, and 26, while TA class 2 (moderate tectonic activity) was assigned for catchments 1, 4, 6, 7, 11, 14, 24, 25, 27, 29, 34, 36, 38, and 39. The remaining 23 catchments were observed for class 1 (High tectonic activity) (Table 6 and Figure 10).

Table 6.
Classification of the TA (tectonic activity index) in the NFZ.
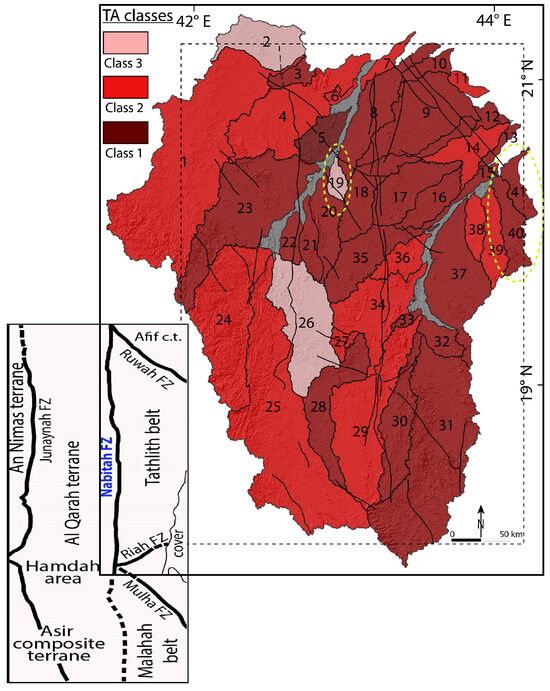
Figure 10.
Distribution of the TA index of the tectonic activity in the NFZ. Dashed yellow ellipsoids indicate the tectonic anomalies observed in this study zone.
5. Discussion
5.1. Tectonic Geomorphology and the Synthesis of Geomorphic Indices
The study of active tectonic processes through the analysis of landforms, or tectonic geomorphology, provides a powerful tool for identifying areas of crustal deformation where direct evidence of faulting may be absent or obscured [6,39]. In regions like the Nabitah Fault Zone (NFZ), a significant Proterozoic structure whose neo-tectonic importance is unclear, this method is especially helpful. The rates and types of crustal deformation can be inferred by examining different landforms including drainage patterns, fault scarps, river terraces, and raised sea platforms [16,48]. Following the methodology established and developed by several authors (e.g., [2,6,7,15,43]), this study applied a set of geomorphic indices including mountain front sinuosity, valley floor width-to-height ratio, basin shape, hypsometric integral, and asymmetric factor to assess relative tectonic activity. This method’s strength lies in the integration of the used indices to create a composite index of relative tectonic activity (TA), which provides a reliable, semi-quantitative evaluation of how the landscape responds to deformation over a wide region.
5.2. Lithological Framework and Its Influence
A complex collection of Precambrian rocks, comprising low-strength Phanerozoic sediments, very high-strength volcanic rocks (basalt), and high-strength intrusive (granite, gabbro) and metamorphic strata (gneiss), are transected by the NFZ (Figure 2). Although these units naturally differ in their resistance to erosion [8,18], tectonic activity is thought to be the main factor regulating the geomorphic signal throughout the NFZ. Rather than lithological contacts, this is demonstrated by the high spatial link between abnormal index values and large fault structures. Moreover, tectonic processes are anticipated to dominate geomorphic expression due to the widespread fracture associated with the NFZ, which reduces the primary lithological strength contrast [6]. Additionally, although lithology affects absolute index values (e.g., Vf is lower in resistant rocks), we discussed that fault structures and/or catchments, not lithological limits, strongly correspond with the geographical distribution of high and low values. Furthermore, lithology’s influence on the determined morphometric indices is reduced when approximately the same lithological level is present [9].
5.3. Tectonic Process Proxies in Geomorphic Indices
A consistent pattern of tectonic activity throughout the NFZ can be seen in the spatial distribution of geomorphic indices (Figure 10). Young, straight mountain fronts sustained by high rates of tectonic uplift that surpass erosional processes are indicated by low Smf values (1.01–1.17) (Table 2) concentrated along the main N-S moving fault strands [6,8,10]. The high activity of the central NFZ is confirmed by these values, which are like those recorded along actively uplifting fronts in the East Anatolian Fault Zone [6] and the Betic Cordillera (Smf: 1.04 –1.61) [12]. A drop in uplift rates towards the fault tips or zones of dispersed shear is suggested by the higher, Class 2 Smf values at the eastern and western borders (such as the Ruwah Fault Zone).
The index of the valley floor width-to-height ratio (Vf) offers a crucial and supplementary record on how rivers respond to tectonic deformation. The NFZ’s central N-S trending strands are dominated by very low Vf values (Class 1, <0.5) (Table 3; Figure 6), which is a potent geomorphic signal. Rivers function as aggressive agents of vertical erosion in these values, which indicate narrow, deeply incised valleys with a V shape. When the pace of lateral plantation equals or surpasses the rate of river incision, a dynamic equilibrium, usually fueled by rapid and continuous rock uplift, this morphology takes place [8,10]. The rivers are unable to create a broad floodplain because they are successfully chiseling away at the elevating bedrock, preserving steep channel gradients [7]. This distribution’s lithological significance is a concentration of strain and differential uplift along the central fault core. These low Vf values and the low Smf values (straight, undissected mountain fronts) have a substantial spatial correlation, which offers multifaceted, mutually supporting evidence for continuous tectonic activity. The combination between Smf and Vf is a classic indicator of a Class 1 active tectonic front, which is seen in contemporary active environments such as the Betic Cordillera [2,7,9,12,15]. When a mountain front is straight (low Smf), it means that uplift has occurred too recently and quickly for the front to have been greatly embayed by erosion. At the same time, the V-shaped valleys (low Vf) attest to the rivers’ forceful response to that same elevation, which is to cut down rather than go sideways. Tectonic processes are the basic geomorphic agent in this correlation, exceeding surface processes’ capacity to degrade the landscape into a low-relief, more mature condition, indicating a dynamic disequilibrium condition. This signal’s durability over several catchments supports the concept that the uplift is a neo-tectonically active feature, suggesting that it is a widespread aspect of the main NFZ structure rather than a confined occurrence.
In refs. [11,12] the Hypsometric Integral provides clues on the amount of rock that has not been broken down and the landscape’s erosional condition/stage. It is also noteworthy how frequent class 1 (high activity; Hi > 0.5) (Table 5) results are throughout the NFZ (Figure 6). These elevated values suggest an unbalanced, young terrane in which a significant amount of the initial uplift material is still present. Streams are unable to reach a stable graded profile in regions that are undergoing continuous and recent uplift, which continuously renews the terrain [12]. The hypsometric curve’s shape adds even more detail; convex curves, which are frequently linked to high Hi values, suggest that slope-driven processes predominate over fluvial incision, which is compatible with rapid uplift. Typically depicted by more s-shaped (concavo-convex) curves, class 2 (Moderate activity; Hi: 0.4–0.5) values signify a landscape in a transitional condition/stage. This index analysis, suggesting that the majority of the NFZ is geomorphologically young and actively deforming, is supported by the rarity of class 3 (Low activity; Hi < 0.4) values, which have concave curves, indicating considerable erosion and mostly fluvial processes.
At the catchment scale, the Asymmetry Factor indicates strong evidence for tectonic tilting, indicated by the noticeable asymmetry (high |Af-50| values) at the NW border (Junaynah Fault Zone), which belongs to class 1 (High activity; |Af-50| > 15) (Figure 8). Two geological interpretations were suggested for this: a differential uplift on blind faults causing tectonic tilting of the entire catchment block, or structural control by the ubiquitous Precambrian basement fabric [2,7,15]. A widespread anisotropy would be produced if the fault planes or bedrock foliation dipped steadily southeast, which would encourage preferential erosion and stream migration in that down-dip direction.
The structural constriction of drainage systems is well-represented by the Basin Shape index (Bsh). Most of the catchments along the Mulha and Riah Fault Zones are elongated (high Bsh values, Class 1: >4) (Table 4; Figure 9). Erosion is directed into narrow, steep catchments that are extended parallel to the underlying structural grain because of rapid uplift along different mountain fronts, which prevents the development of lateral drainage and causes this noticeable elongation [11,12]. These Class 1 catchments indicate intense structural control and considerable tectonic activity (Figure 9). With catchments exhibiting a shift from elongated to more equidimensional forms, Class 2 basins (Bsh: 3–4) (Table 4) indicate a moderate amount of tectonic influence. This suggests either less strong uplift or a more advanced stage of drainage integration that is starting to overcome initial tectonic restrictions. Usually found on the edges of the main active fault strands, the less common Class 3 basins (Bsh: <3) have a more circular shape and are generally linked to regions of lower relative tectonic activity where drainage systems have developed with less structural constraint (Figure 9).
One valley side would be methodically affected by this process, creating asymmetric valleys with one gentle, retreating slope and one sharp, resisting slope [12,16]. Lower tilting and more steady drainage development are indicated by class 2 (Moderate activity; |Af-50|: 7–15) and Class 3 (Low activity; |Af-50| < 7) values. As these historical vulnerabilities are reactivated under the current stress field, the concentration of high-class Af values along certain fault zones highlights the significant and continuous effect of deep-seated Precambrian structures in regulating modern geomorphic evolution. A complex and convincing geomorphic case for continuous tectonic activity is suggested by the convergence of laterally tilted catchments (High Af), juvenile landscapes (high Hi), and elongated basins (high Bsh) along the central and western NFZ. The current landscape is a clear indication of the reactivation of these old structures, as this pattern is not random but rather spatially correlates with significant fault strands that are known to exist.
5.4. Implications for Environmental Sustainability and Seismic Hazard Assessment
In this study, considering the evaluation of the tectonic activity indicated by the TA index (Figure 10) is essential to discuss the implications of environmental sustainability and seismic hazard assessment of the NFZ region. A late Proterozoic (~670–640 Ma) intra-arc suture [18], a basic lithospheric feature, is continuously reactivated rather than merely a snapshot of recent deformation. According to geomorphic study, the existing landscape is a definite example of this structure’s reactivation under the current stress field, which was probably impacted by the combined pressures of the Red Sea extension and the Zagros continental collision [39]. The convergence of evidence, including elongated basins (High Bsh), young landscapes (High Hi), laterally tilted catchments (High Af), and the synergistic combination of straight mountain fronts (Low Smf) with V-shaped valleys (Low Vf), identifies the central NFZ and its major splays (Mulha, Riah) as zones of concentrated strain. This quantitative evaluation of ongoing tectonic activity has immediate and significant ramifications for the NFZ region’s seismic hazard assessment and environmental sustainability, two areas that have received very little attention. Continuous deformation is a major activity behind landscape evolution, impacting important environmental elements such soil formation, erosion patterns, groundwater aquifer shape, and flora distribution in this arid area. These dynamic tectonic boundaries must therefore be taken into consideration in sustainable land-use planning and water resource management. Roads, pipelines, and urban growth are examples of infrastructure projects that should be planned to avoid locations with high TA values (such as catchments 8, 15, 30) to reduce the danger of fault rupture, ground shaking, and related secondary hazards like landslides [18,19,20,39].
The lack of a comprehensive, instrumental seismicity database is one of the main obstacles to performing a traditional seismic hazard assessment for the NFZ. Only a small number of low-magnitude events that were directly connected with the primary fault tracks that we have determined to be extremely active were found during our thorough examination of the USGS earthquake database and regional catalogs [18,20]. It is important to avoid interpreting this absence of seismic activity as proof of quiescence. Rather, it draws attention to an important data gap and emphasizes the importance of our research; tectonic geomorphology is a vital tool in areas with sparse seismic networks and long earthquake recurrence intervals because it offers a long-term record of deformation that supplements short-term instrumental records. Through the demonstration of ongoing deformation of the terrain, our study provides a clear interpretation of the seismic danger conditions. According to the strong, multi-parameter signal of continuous tectonic activity, the fault segments in high-TA zones are probably locked, building up strain that will eventually be released during subsequent seismic events. Importantly, the geomorphic anomalies we find, especially those that indicate blind thrusts (such as catchments 40 and 41), indicate latent seismic sources that conventional hazard maps would not show.
This work provides a basic and initial inventory of active structures in the NFZ. It turns the fault zone into a landscape that is prioritized for further targeted work, rather than a geological feature that has been mostly ignored. This study offers the first comprehensive map of relative tectonic activity, laying the groundwork for further action. Detailed risk evaluations that overlay tectonic activity with infrastructure, paleoseismic trenching research, and targeted seismic monitoring should all be guided by this map. Thus, our geomorphic data clearly establishes the NFZ as an active tectonic structure, even though direct seismicity records are few. In the end, this improves the safety and resilience of people in southwestern Saudi Arabia by offering the fundamental framework for developing further environmental and seismic risk assessments.
6. Conclusions
This study shows that geomorphic indices are effective and valuable indices for evaluating active tectonics and landscape deformation. They are particularly useful for reconnaissance at the regional level since they can be effectively computed over wide regions utilizing remote sensing and GIS. Geomorphic abnormalities, such as asymmetric basins, deformed mountain fronts, and aberrant drainage systems, can be identified as markers of recent or continuing tectonic activity by methodically applying these characteristics. This strategy provides an economical and successful way to rank regions for in-depth geological and geophysical research in southwestern Saudi Arabia along the Red Sea coast, where few studies offer precise age limitations on tectonic activity. The study region is divided into three activity levels by the total tectonic activity index (TA), which is based on the Af, Hi, Vf, Bsh, and Smf factors. In the southeast, the Mulha and Riah Fault Zones, as well as the major track of the NFZ, are the sites of high activity (TA class 1). Over the study fault zone, nearly half of the region (46%) is dominated by moderate activity (TA class 2), indicating the necessity for further studies that combine deformation analysis and Quaternary dating. Structural deformation, fault scarps, hanging valleys, deformed alluvial fans, and deeply incised river valleys close to mountain fronts are all common features of areas with moderate to high activity. Natural hazard assessment, groundwater management in fault-controlled aquifers, and avoiding high-risk areas in infrastructure planning all depend on an understanding of the geographical distribution of tectonic activity. These results serve as a foundation for sustainable land use plans that strengthen the NFZ region’s resilience, protect ecosystems, and promote community safety.
Author Contributions
Conceptualization, B.B.; methodology, B.B. and A.M.A.; software, B.B. and A.M.A.; validation, B.B. and A.M.A.; formal analysis, B.B. and A.M.A.; investigation, B.B. and A.M.A.; resources, A.M.A.; data curation, A.M.A.; writing—original draft preparation, B.B.; writing—review and editing, A.M.A.; visualization, B.B. and A.M.A.; supervision, B.B. and A.M.A.; project administration, B.B. and A.M.A.; funding acquisition, B.B. and A.M.A. All authors have read and agreed to the published version of the manuscript.
Funding
The authors would like to extend their appreciation to the Deanship of Scientific Research at King Saud University for funding this work through the Waed Program (W25-73).
Data Availability Statement
Data is contained within the article.
Conflicts of Interest
The authors declare no conflicts of interest.
References
- Khalifa, A.; Çakir, Z.; Owen, L.A.; Kaya, Ş. Morphotectonic analysis of the East Anatolian Fault, Turkey. Turk. J. Earth Sci. 2018, 27, 110–126. [Google Scholar] [CrossRef]
- Spyrou, E.; Maroukian, H.; Evelpidou, N. Application of morphotectonic indices for assessing active tectonics: A case study of Acheron river basin. J. Struct. Geol. 2024, 187, 105240. [Google Scholar] [CrossRef]
- Owen, L.A. Tectonic Geomorphology: A Perspective. Treatise Geomorphol. 2022, 2, 1–12. [Google Scholar] [CrossRef]
- Silva, P.G.; Goy, J.L.; Zazo, C.; Bardají, T. Fault-Generated Mountain Fronts in Southeast Spain: Geomorphologic Assessment of Tectonic and Seismic Activity. Geomorphology 2003, 50, 203–225. [Google Scholar] [CrossRef]
- Görüm, T. Tectonic, topographic and rock-type influences on large landslides at the northern margin of the Anatolian Plateau. Landslides 2019, 16, 333–346. [Google Scholar] [CrossRef]
- Kalifa, A.; Çakir, Z.; Owen, L.A.; Kaya, Ş. Evaluation of the relative tectonic activity of the adıyaman fault within the arabian-anatolian plate boundary (Eastern Turkey). Geol. Acta 2019, 17, 1–17. [Google Scholar] [CrossRef]
- Ahmad, S.; Alam, A.; Ahmad, B.; Afzal, A.; Bhat, M.I.; Bhat, M.S.; Ahmad, H.F.; Tectonics and Natural Hazards Research Group. Tectono-geomorphic indices of the Erin basin, NE Kashmir valley, India. J. Asian Earth Sci. 2018, 151, 16–30. [Google Scholar] [CrossRef]
- Topal, S.; Keller, E.; Bufe, A.; Koçyiğit, A. Tectonic geomorphology of a large normal fault: Akşehir fault, SW Turkey. Geomorphology 2016, 259, 55–69. [Google Scholar] [CrossRef]
- Azor, A.; Keller, E.A.; Yeats, R.S. Geomorphic indicators of active fold growth: South Mountain-Oak Ridge anticline, Ventura basin, southern California. Bull. Geol. Soc. Am. 2002, 114, 745–753. [Google Scholar] [CrossRef]
- Rockwell, T.K.; Keller, E.A.; Johnson, D.L. Tectonic geomorphology of alluvial fans and mountain fronts near Ventura, California. In Tectonic Geomorphology; Allen and Unwin Publishers: Boston, MA, USA, 1985. [Google Scholar]
- El Hamdouni, R.; Irigaray, C.; Fernández, T.; Chacón, J.; Keller, E.A. Assessment of relative active tectonics, southwest border of the Sierra Nevada (southern Spain). Geomorphology 2008, 96, 150–173. [Google Scholar] [CrossRef]
- Pérez-Peña, J.V.; Azor, A.; Azañón, J.M.; Keller, E.A. Active tectonics in the Sierra Nevada (Betic Cordillera, SE Spain): Insights from geomorphic indexes and drainage pattern analysis. Geomorphology 2010, 119, 74–87. [Google Scholar] [CrossRef]
- Ramírez-Herrera, M.T. Geomorphic assessment of active tectonics in the acambay graben, Mexican volcanic belt. Earth Surf. Process. Landf. 1998, 23, 317–332. [Google Scholar] [CrossRef]
- Mahmood, S.A.; Gloaguen, R. Appraisal of active tectonics in Hindu Kush: Insights from DEM derived geomorphic indices and drainage analysis. Geosci. Front. 2012, 3, 407–428. [Google Scholar] [CrossRef]
- Han, X.; Dai, J.-G.; Smith, A.G.G.; Xu, S.-Y.; Liu, B.-R.; Wang, C.-S.; Fox, M. Recent uplift of Chomolungma enhanced by river drainage piracy. Nat. Geosci. 2024, 17, 1031–1037. [Google Scholar] [CrossRef]
- Molin, P.; Pazzaglia, F.J.; Dramis, F. Geomorphic expression of active tectonics in a rapidly-deforming forearc, Sila Massif, Calabria, southern Italy. Am. J. Sci. 2004, 304, 559–589. [Google Scholar] [CrossRef]
- Biswas, M.; Paul, A. Application of geomorphic indices to Address the foreland Himalayan tectonics and landform deformation- Matiali-Chalsa- Baradighi recess, West Bengal, India. Quat. Int. 2021, 585, 3–14. [Google Scholar] [CrossRef]
- Amine, A.; El Ouardi, H.; Zebari, M.; El Makrini, H.; Habibi, M. Relative landscape maturity in the South Rifian Ridges (NW Morocco): Inferences from DEM-based surface indices analysis. Appl. Comput. Geosci. 2020, 6, 100027. [Google Scholar] [CrossRef]
- Khalifa, A.; Bashir, B.; Alsalman, A.; Naik, S.P.; Nappi, R. Remotely Sensed Data, Morpho-Metric Analysis, and Integrated Method Approach for Flood Risk Assessment: Case Study of Wadi Al-Arish Landscape, Sinai, Egypt. Water 2023, 15, 1797. [Google Scholar] [CrossRef]
- Khan, M.A.; Gupta, V.P.; Moharana, P.C. Watershed prioritization using remote sensing and geographical information system: A case study from Guhiya, India. J. Arid. Environ. 2001, 49, 465–475. [Google Scholar] [CrossRef]
- Patton, P.C.; Baker, V.R. Morphometry and floods in small drainage basins subject to diverse hydrogeomorphic controls. Water Resour. Res. 1976, 12, 941–952. [Google Scholar] [CrossRef]
- Stoeser, D.B.; Frost, C.D. Nd, Pb, Sr, and O isotopic characterization of Saudi Arabian Shield terranes. Chem. Geol. 2006, 226, 163–188. [Google Scholar] [CrossRef]
- Flowerdew, M.J.; Whitehouse, M.J.; Stoeser, D.B. The Nabitah fault zone, Saudi Arabia: A Pan-African suture separating juvenile oceanic arcs. Precambrian Res. 2013, 239, 95–105. [Google Scholar] [CrossRef]
- Schmidt, D.L.; Hadley, D.G.; Stoeser, D.B. Late Proterozoic Crustal History of the Arabian Shield, Southern Najd Province, Kingdom of Saudi Arabia. In Evolution and Mineralization of the Arabian-Nubian Shieldvol; Elsevier: Amsterdam, The Netherlands, 1979; Volume 3, pp. 41–58. [Google Scholar]
- Bookstrom, A.A.; Vennum, W.R.; Doebrich, J.L. Geology and Mineral Resources of the Farah Garan-Kutam Mineral Belt, Southeastern Asir, Kingdom of Saudi Arabia; Saudi Arabian Directorate General of Mineral Resources, U.S. Geological Survey: Jeddah, Saudi Arabia, 1989. [Google Scholar]
- Kröner, A.; Pallister, J.S.; Fleck, R.J. Age of initial oceanic magmatism in the Late Proterozoic Arabian Shield. Geology 1992, 20, 803. [Google Scholar] [CrossRef]
- Kröner, A. Ophiolites and the evolution of tectonic boundaries in the late proterozoic Arabian—Nubian shield of northeast Africa and Arabia. Precambrian Res. 1985, 27, 277–300. [Google Scholar] [CrossRef]
- Schmidt, D.L.; Hadley, D.G.; Stoeser, D.B. Geochronology and origin of an early tonalite gneiss of the Wadi Tarib batholith and the formation of syntectonic gneiss complexes in the southeastern Arabian Shield. Bull. Faulty Earth Sci. King Abdulaziz Univ. 1983, 6, 351–364. [Google Scholar]
- Whitehouse, M.J.; Windley, B.F.; Stoeser, D.B.; Al-Khirbash, S.; Ba-Bttat, M.A.O.; Haider, A. Precambrian basement character of Yemen and correlations with Saudi Arabia and Somalia. Precambrian Res. 2001, 105, 357–369. [Google Scholar] [CrossRef]
- Johnson, P.R. Post-amalgamation basins of the NE Arabian shield and implications for Neoproterozoic III tectonism in the northern East African orogen. Precambrian Res. 2003, 123, 321–337. [Google Scholar] [CrossRef]
- Pallister, J.S.; Stacey, J.S.; Fischer, L.B.; Premo, W.R. Arabian Shield ophiolites and Late Proterozoic microplate accretion. Geology 1987, 15, 320. [Google Scholar] [CrossRef]
- Johnson, P. Implications of SHRIMP and Microstructural Data on the Age and Kinematics of Shearing in the Asir Terrane, Southern Arabian Shield, Saudi Arabia. Gondwana Res. 2001, 4, 172–173. [Google Scholar] [CrossRef]
- Stoeser, D.B.; Stacey, J.S. Evolution, U-Pb Geochronology and Isotope Geology of the Pan-African Nabitah Orogenic Belt of Saudi Arabia. In The Pan-African Belt of Northeast Africa and Adjacent Areas: Tectonic Evolution and Economic Aspects of a Late Proterozoic Oregon; El-Gaby, S., Greiling, R.O., Eds.; Friedrich Vieweg: Wiesbaden, Germany, 1988; pp. 227–288. [Google Scholar]
- Johnson, P.R.; Kattan, F. Oblique sinistral transpression in the Arabian shield: The timing and kinematics of a Neoproterozoic suture zone. Precambrian Res. 2001, 107, 117–138. [Google Scholar] [CrossRef]
- Cooper, J.A.; Stacey, J.S.; Stoeser, D.G.; Fleck, R.J. An evaluation of the zircon method of isotopic dating in the Southern Arabian Craton. Contrib. Mineral. Petrol. 1979, 68, 429–439. [Google Scholar] [CrossRef]
- Greenwood, W.R. Geologic Map of the Jibal Al Qahr Quadrangle, Sheet 19G, Kingdom of Saudi Arabia, Saudi Arabian Directorate General of Mineral Resources Geoscience Map GM-76C; Ministry of Petroleum and Mineral Resources: Jidda, Saudi Arabia, 1985.
- Greenwood, W.R.; Jackson, R.O.; Johnson, P.R. Geologic Map of the Al Hasir Quadrangle, Sheet 19F, Kingdom of Saudi Arabia, Saudi Arabian Directorate General of Mineral Resources Geoscience Map GM-94C; Ministry of Petroleum and Mineral Resources: Jidda, Saudi Arabia, 1986.
- Kellogg, K.S.; Janjou, D.; Minoux, L.; Fourniguet, J. Geologic Map of the Wadı Tathlıth Quadrangle, Sheet 20G, Kingdom of Saudi Arabia, Saudi Arabian Directorate General of Mineral Resources Geoscience Map GM-103C; Ministry of Petroleum and Mineral Resources: Jidda, Saudi Arabia, 1986.
- Alipoor, R.; Poorkermani, M.; Zare, M.; El Hamdouni, R. Active tectonic assessment around Rudbar Lorestan dam site, High Zagros Belt (SW of Iran). Geomorphology 2011, 128, 1–14. [Google Scholar] [CrossRef]
- Selçuk, A.S. Evaluation of the relative tectonic activity in the eastern Lake Van basin, East Turkey. Geomorphology 2016, 270, 9–21. [Google Scholar] [CrossRef]
- Selby, M.J. A rock mass strength classification for geomorphic purposes: With tests from Antarctica and New Zealand. Z. Geomorphol. 1980, 24, 31–51. [Google Scholar] [CrossRef]
- Yildirim, C. Relative tectonic activity assessment of the Tuz Gölü Fault Zone Central Anatolia, Turkey. Tectonophysics 2014, 630, 183–192. [Google Scholar] [CrossRef]
- Bull, W.B.; McFadden, L.D. Tectonic geomorphology north and south of the Garlock fault, California. In Geomorphology in Arid Regions; Routledge: London, UK, 1977. [Google Scholar] [CrossRef]
- Strahler, A.N. Hypsometric (area-altitude) analysis of erosional topography. Bull. Geol. Soc. Am. 1952, 63, 1117–1142. [Google Scholar] [CrossRef]
- Hare, P.W.; Gardner, T.W. Geomorphic Indicators of Vertical Neotectonism along Converging Plate Margins, Nicoya Peninsula Costa Rica. In Tectonic Geomorphology; Allen and Unwin Boston: Boston, MA, USA, 1985; Volume 4, pp. 123–134. [Google Scholar]
- Green, D.J. Active Tectonics Earthquakes, Uplift, and Landscape. Environ. Eng. Geosci. 1997, III, 463–464. [Google Scholar] [CrossRef]
- Gregory, K.J.; Wallingford, D.E. Drainage Basin form and Process—A Geomorphological Approach. Water Res. 1974, 8, 1115. [Google Scholar] [CrossRef]
- Pike, R.J.; Wilson, S.E. Elevation-relief ratio, hypsometric integral, and geomorphic area-altitude analysis. Bull. Geol. Soc. Am. 1971, 82, 1079–1084. [Google Scholar] [CrossRef]
Disclaimer/Publisher’s Note: The statements, opinions and data contained in all publications are solely those of the individual author(s) and contributor(s) and not of MDPI and/or the editor(s). MDPI and/or the editor(s) disclaim responsibility for any injury to people or property resulting from any ideas, methods, instructions or products referred to in the content. |
© 2025 by the authors. Licensee MDPI, Basel, Switzerland. This article is an open access article distributed under the terms and conditions of the Creative Commons Attribution (CC BY) license (https://creativecommons.org/licenses/by/4.0/).