1. Introduction
Strawberries are widely cultivated as both an agricultural crop and a valuable economic plant globally. Rich in vitamins and metal ions, they have become a popular health food. According to the latest FAO statistics, China’s strawberry production reached 3.336 million tons in 2024, ranking first worldwide and forming the largest consumer market [
1,
2,
3,
4,
5,
6,
7]. However, strawberry cultivation is threatened by diseases such as gray mold, powdery mildew, anthracnose, and root rot, which impair plant growth, cause fruit rot, and significantly reduce yield and quality. For example, gray mold can cause annual yield losses of 20–30%, sometimes exceeding 50% under severe conditions, leading to substantial economic losses and increased management challenges [
8].
Traditional disease detection methods mainly include manual observation, traditional machine learning, and deep learning-based approaches. Manual inspection by experienced agronomists is intuitive but labor-intensive, subjective, and error-prone. Traditional machine learning methods automate feature extraction and classification to some extent, improving detection speed and accuracy, yet remain limited by cumbersome preprocessing, background noise, and poor adaptability to complex environments [
9]. In recent years, deep learning has shown superior performance in agricultural disease detection due to its powerful feature learning ability and robustness against environmental variations [
10].
Despite these advances, several challenges persist in strawberry disease detection. There is high variability in disease manifestations across growth stages and environmental conditions (e.g., light, temperature, and humidity), which affects the generalization capability of trained models [
11]. Additionally, the collection of high-quality and well-annotated samples remains difficult and costly, especially for diseases with mixed symptoms [
12,
13,
14,
15,
16,
17]. Existing methods also struggle with detecting early-stage or small lesions and handling occlusion among plant organs.
To address these issues, we propose an improved YOLOv8-based model for accurate strawberry disease detection. We introduce an ultra-small detection head for capturing subtle lesions and a Convolution and Attention Fusion Module (CAFM) to enhance feature representation in complex backgrounds. An interactive system based on PyQt5 is also developed for practical field application. Experimental results demonstrate that our approach achieves higher accuracy and robustness compared to existing methods, providing a reliable tool for precision agriculture.
Recent advances in computer vision provide valuable insights for agricultural disease detection. The integration of global and local features in works like the Collaborative Compensative Transformer Network [
18] aligns with our CAFM module’s goal of robust feature representation. Meanwhile, weak-supervision methods such as SSFam [
19] offer promising solutions to reduce reliance on costly annotations in agricultural settings. Additionally, uncertainty modeling techniques like Monte Carlo DropBlock [
20] could enhance reliability in unseen field conditions. While our current work focuses on a supervised detection framework, these directions will inform our future research toward more data-efficient and trustworthy agricultural AI systems.
This study enhances the YOLOv8 algorithm to develop a high-precision strawberry disease recognition system, overcoming the limitations of traditional methods such as high rates of missed detections, false positives, and low efficiency. A dataset covering seven common diseases was constructed with images collected in diverse field conditions, followed by careful cleaning and annotation. The model was optimized with an ultra-small detection head for improved identification of small lesions and a convolutional and attention fusion module (CAFM) to enhance feature robustness in complex environments. Ablation and comparative experiments against YOLOv5, YOLOv8, and Faster R-CNN demonstrated superior performance in mAP50, recall, and F1-score. Additionally, a real-time interactive detection system based on PyQt5 was developed, providing visual outputs to support practical disease management and sustainable agriculture.
2. Materials and Methods
2.1. Data Set Collection and Labeling
2.1.1. Dataset Collection and Processing
The image data used for the experiments in this study were obtained from the website
https://universe.roboflow.com/(accessed on 15 February 2025), and there were a total of 3568 strawberry disease images in the initial dataset. The original data has some conditions, such as some images are blurred, and the background interference and other problems, according to the following steps to carry out data cleaning: firstly, the duplicate collection of samples are eliminated, secondly, the blurred images due to the shooting of jitter or focus problems are filtered out, and finally, the interference images containing non-diseased areas or non-target crops are removed. After cleaning, the number of valid samples was reduced from 3568 to 3146, and the final constructed dataset contained seven disease categories, namely Strawberry_Angular_LeafSpot, Strawberry_Anthracnose_Fruit_Rot, Strawberry_Blossom_Blight, Strawberry_Gray_Mold, Strawberry_Leaf_Spot, Strawberry_Powdery_Mildew_Fruit and Strawberry_Powdery_Mildew_Leaf. Samples of each disease are shown in
Figure 1.
2.1.2. Data Annotation
In this section,
Figure 2 to
Figure 3 and
Table 1 systematically show the whole process of strawberry disease data annotation, covering the original image display, disease area annotation, annotation file generation and category statistics, which is described as follows:
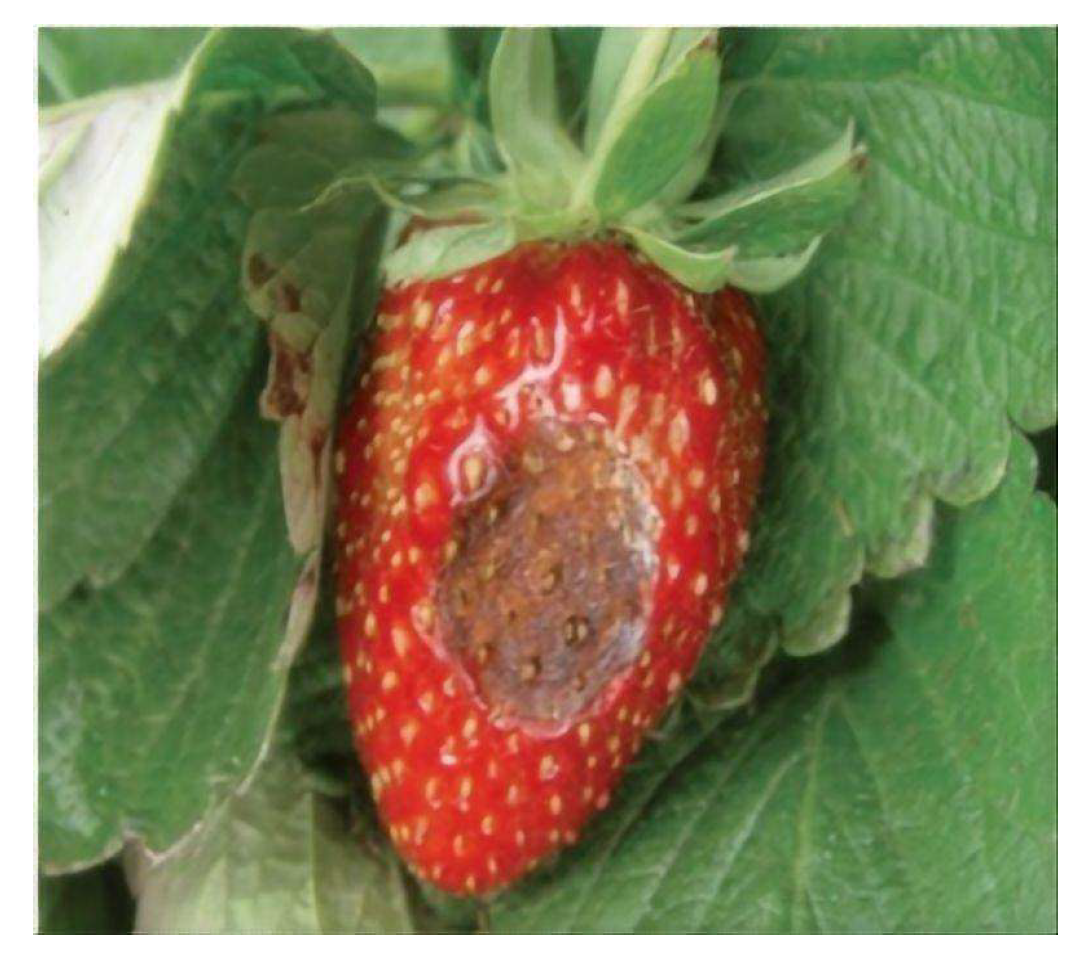
Figure 2 presents an original image of strawberry disease that has not been processed, and the background of the image contains complex elements, such as leaves, fruits, etc.
Figure 3 present the disease area is the strawberry anthracnose fruit rot spots on the fruits, which need to be initially located by manual observation. The background of this image contains various complex elements such as leaves, fruits, etc., and the disease area is the strawberry anthracnose fruit rot spots on the fruits, which need to be initially located with the help of manual observation, and the provided picture should ensure that the details of the disease are clearly visible, such as the shape of the spots and the color gradient, etc., which can be clearly presented, thus laying the foundation for the subsequent accurate labeling.
Figure 3 shows the process of labeling disease areas using Labellmg 1.8.0 software. The labeling standards are: the bounding box should closely fit the edge of the disease; if there are more than one diseased area in a single image, then it is necessary to label separately [
15]. Specific steps are: bounding box drawing—take the smallest outer rectangle of the disease area as the labeling range, select the disease area, category labeling—give each bounding box the corresponding disease category label. Labeling verification: After labeling, zoom and multi-angle observation are used to ensure that the bounding box completely covers the diseased area, so as to prevent omission or mislabeling.
The XML file generated after the labeling is completed is in PASCAL VOC format and contains information: image metadata: file name (<filename>), image size (<width>, <height>). Labeled object information: bounding box coordinates (<xmin>, <ymin>, <xmax>, <ymax>) and category tags (<name>) for each disease area.
After completing the data annotation work, the XML annotation file generated by Labellmg should be transformed into the TXT format required for YOLOv8 model training, with the help of writing Python scripts to achieve automation, so as to ensure that the annotation information the model input format can be strictly matched.
2.1.3. Data Set Division
The division of the cleaned data set in the form of stacked bar charts, presenting the proportion of the sample distribution in the training set, (2516 sheets, 80%) validation set (315 sheets, 10%), and the test set (315 sheets, 10%), as well as the number of the seven disease categories in the subsets as a percentage. The distribution of this data is very intuitive, as each column corresponds to a disease category, such as strawberry leaf spot, strawberry anthracnose, etc. Different colors are used to differentiate the training set, validation set, and test set to ensure that the samples of each category can be evenly distributed according to the ratio of 8:1:1. For example, strawberry leaf spot disease, as the category with the largest sample size, has 2298 labels, which accounts for 80% of the training set, 10% of the validation set and 10% of the test set, and other disease categories, such as strawberry powdery mildew leaves, strawberry blossom blight, etc., follow the same rules in the distribution of each subset to avoid category bias and guarantee the balanced training of the model. This scientific division is in line with the paper’s goal of constructing a high-quality dataset that covers different disease levels and backgrounds and provides the model with the opportunity to learn diverse features and improve the robustness of the model. The figure verifies the rationality of data division by virtue of visualization, which lays the foundation for the reliability of subsequent experimental results.
2.2. Target Model Improvement Design
2.2.1. Extension of Multi-Scale Detection Heads
YOLOv8 by default adopts three detection heads (Heads), which correspond to large (256 × 256), medium (128 × 128), and small (64 × 64) scales of target detection, respectively [
13]. However, some of the features of early spots or tiny lesions (less than 20 pixels in diameter) in strawberry diseases are easily overlooked in the existing detection heads. For this reason, this study added a new ultra-small-scale detection head (32 × 32) to the original structure, as shown in
Figure 4. This detection head captures the local details of tiny targets through higher resolution feature maps and fuses them with shallow features to enhance the sensitivity of the model to small targets.
2.2.2. Convolution and Attention Fusion Module (CAFM)
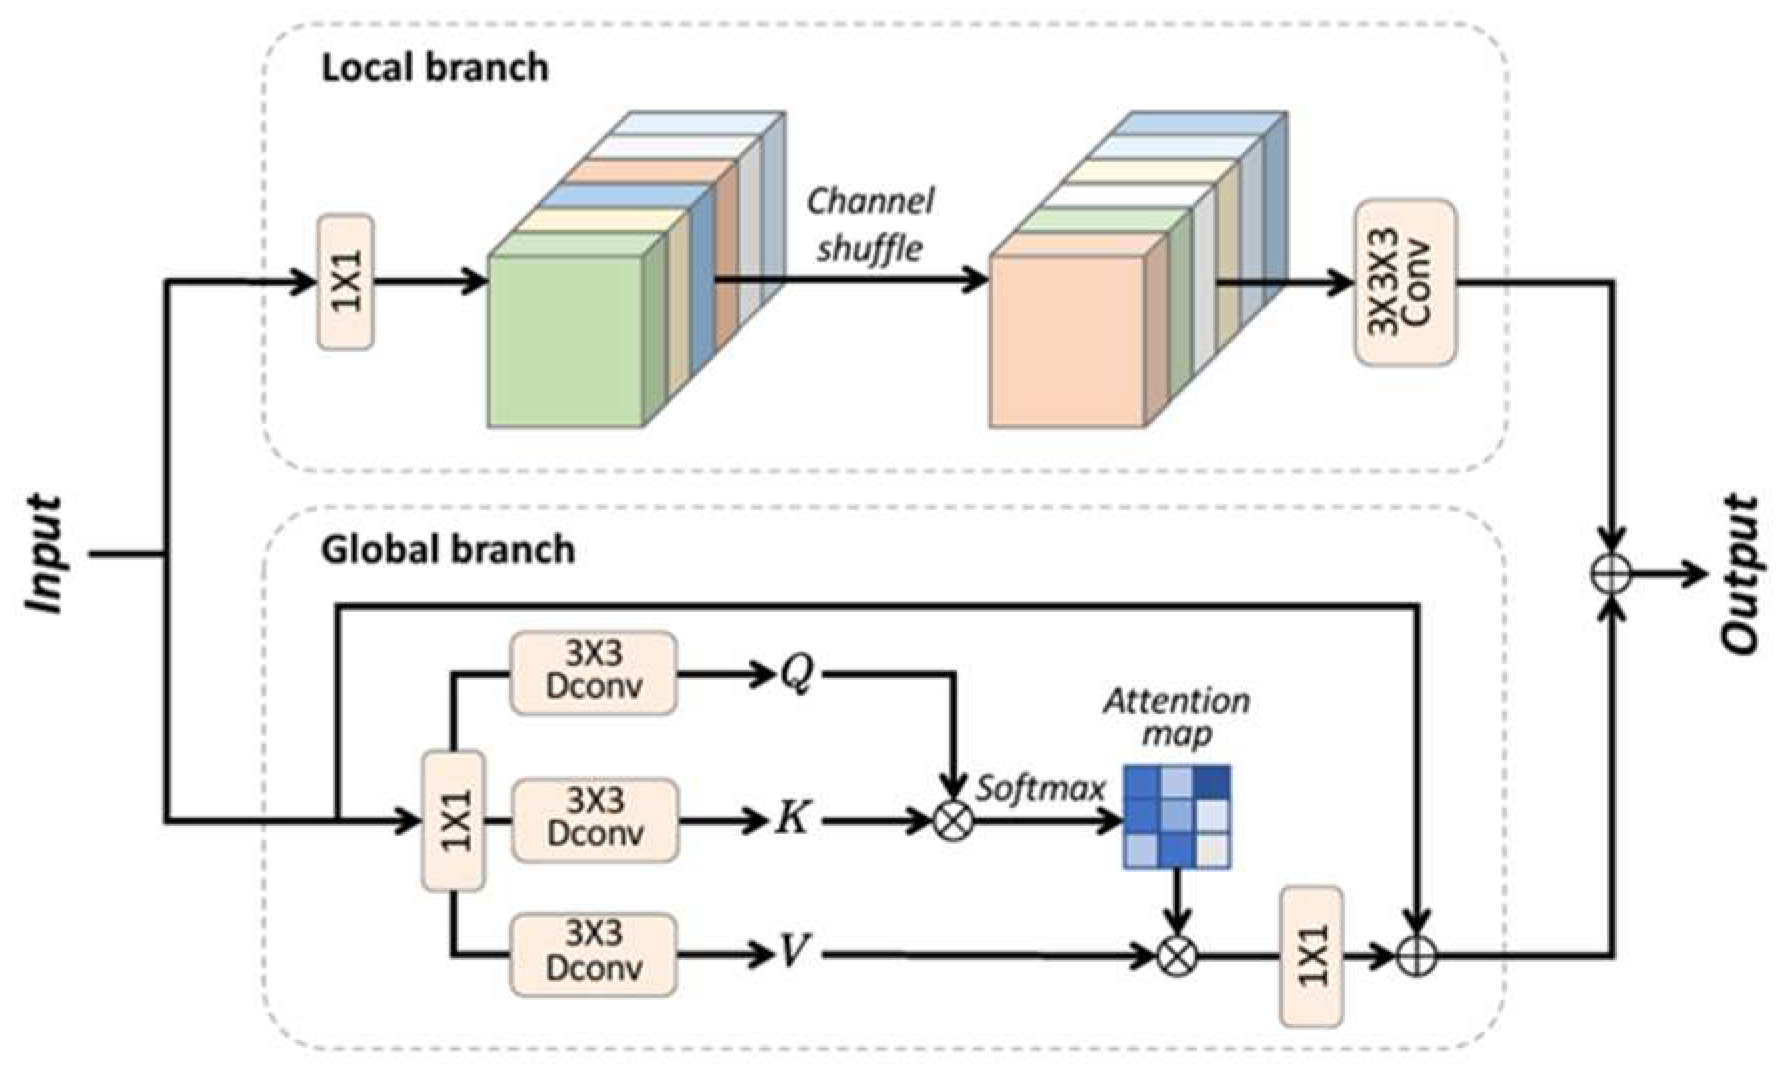
CAFM combines the advantages of both convolution and attention mechanisms, and its structure is composed of a local branch and a global branch. In the local branch, fine- grained local features and edge information can be extracted with the help of convolutional operations, while the global branch uses the attention mechanism to focus on the global features and key regions of the image, which preserves the feature information and spatial structure of the image while suppressing the noise, and thus enhances the richness and accuracy of the feature representation [
15]. As shown in
Figure 5, CAFM contains two branches, local and global, in the global branch, the self-attention mechanism is used to capture a wider range of hyperspectral data information, while the local branch mainly hopes to extract local features, so as to achieve a comprehensive denoising effect.
3. Experimental Results and Analysis
3.1. Experimental Environment
3.1.1. Computer Hardware and Software Environment Configuration
In the experimental environment of this study, the computer hardware and software configuration is mainly based on the following core components. The operating system selected is Windows 11, which can provide stable system compatibility and support the operation of all kinds of development tools as well as deep learning frameworks. The processor is AMD Ryzen 5 5600H (manufactured by Advanced Micro Devices, Inc., Santa Clara, CA, USA), which has a 6-core, 12-thread design and is more suitable for multi-threaded tasks and lightweight computing. The graphics processor is a GeForce RTX 2080 (manufactured by NVIDIA Corporation, Santa Clara, CA, USA) with 8 GB of video memory, which can be accelerated by CUDA to improve the efficiency of model training, suitable for medium-sized deep learning tasks.
In terms of programming language, Python 3.9 is used as the main development language, together with the PyCharm2023.2 integrated development environment, which facilitates code debugging and project management. The deep learning framework is PyTorch 1.12, which supports dynamic computational graphs and mixed-precision training, and is suitable for the rapid iterative optimization of the YOLOv8 model. The deployment phase develops a visual interface with the help of the PyQt5 framework, so that the trained model can be applied to the actual scenario. The specific configuration of the computer environment is shown in
Table 2.
3.1.2. Model Training Strategy
This study employs the YOLOv8 framework for model training, utilizing systematic parameter optimization to enhance performance. The dataset was rigorously split into training (2516), validation (315), and test (315) sets using an 8:1:1 ratio, as defined in the my_data.yaml configuration file. During data loading, multi-threaded processing (workers = 4) was enabled alongside Mosaic augmentation, random flipping, and color space transformations to improve robustness to complex backgrounds and scale variations.
Key hyperparameters include 150 training epochs, a batch size of 16, and SGD optimization with an initial learning rate of 0.01 and momentum of 0.9. A cosine annealing scheduler was applied to balance convergence speed and accuracy. All experiments were conducted on a single GeForce RTX 2080 GPU with mixed-precision disabled (amp = False) to ensure numerical stability and avoid gradient anomalies during FP32 training.
To verify our hyperparameter selection and assess the robustness of the model, we conducted sensitivity analyses on two key hyperparameters: learning rate and batch size. As shown in
Figure 6, the results show how these settings affect model performance (measured by mAP50).
In
Figure 6a, we tested three learning rates of 0.001, 0.01, and 0.1 while maintaining the batch size at 16. Among them, the best performance is achieved when the learning rate is 0.01, and the mAP50 reaches 0.96. Using 0.001, convergence slows down and the final score is slightly lower (mAP50 = 0.948), while 0.1 leads to unstable training and a significant decrease in accuracy (mAP50 = 0.912), indicating that it crosses the optimal area of the loss surface.
In
Figure 6b, we evaluated three batch sizes of 8, 16, and 32, and the learning rate was fixed at 0.01. The optimal balance is achieved at a batch size of 16, providing enough gradient stability to support efficient learning and achieving an mAP50 of 0.96. Smaller batches (8) lead to increased update noise and poor convergence (mAP50 = 0.951); larger batches (32) slightly compromise generalization-possibly due to falling into a sharper minimum-causing mAP50 to drop slightly to 0.955.
To sum up, this study supports the hyperparameters we selected (learning rate = 0.01, batch size = 16) as a stable and near-optimal choice for training the enhanced YOLOv8 model on the strawberry disease dataset, taking into account training speed and final performance.
3.2. Evaluation Metrics
In this experiment, Mean Average Precision (mAP) was chosen as the performance metric. In order to calculate the mAP value, the accuracy (
Precision) and recall (
Recall) of the model need to be calculated firstly, and the calculation of accuracy and recall is shown in Equations (1) and (2).
Precision and recall are key metrics for evaluating model performance. Precision measures the accuracy of positive predictions, while recall quantifies the model’s ability to detect all relevant samples. Additionally, average precision (
AP) is widely used to comprehensively assess detection performance, as defined in Equation (3).
where
P characterizes the recognition accuracy of a single image for a specific target category, and n represents the total number of image samples containing that target category.
mAP is the average of the
AP values of all the categories, which is calculated as shown in (4), where
N is the number of total categories. In this project, mAP@0.5 is selected as the experimental evaluation index, and the
mAP value calculated with the IoU threshold set to 0.5.
The
F1 score is a commonly used measure in classification problems, which provides a single value to reflect the overall performance of the model by combining Precision and Recall, as shown in Equation (5).
3.3. Performance Analysis of the Improved YOLOv8 Model
3.3.1. Model Performance Analysis
As shown in
Table 3, the improved YOLOv8 model exhibits superior performance across most strawberry disease categories, with higher mAP50 values than the baseline YOLOv8, indicating enhanced overall accuracy. Significant gains were particularly observed for gray mold, leaf spot, and powdery mildew. Beyond mAP50, the model also excels in precision, recall, and F1 score. For leaf spot and blossom blight, it achieved near-optimal or top results across all metrics. Notably, recall improved substantially for anthracnose fruit rot, reducing missed detections, while both precision and recall increased for powdery mildew on leaves, confirming the effectiveness of our optimizations.
3.3.2. Ablation Experiments
As shown in
Table 4, the baseline YOLOv8 model showed only basic performance. Adding the multi-scale detection head alone significantly improved accuracy and mAP50 by reducing false detections. Integrating only the CAFM module notably increased recall and mAP50, minimizing missed identifications. The full model combining both enhancements achieved the highest mAP50, indicating optimal overall detection. While precision and recall individually were slightly below single-module peaks, the combined model attained a better balance, ensuring robust performance across scenarios and demonstrating the complementary benefits of multi-scale detection and CAFM fusion.
3.4. Computational Efficiency Analysis
To assess whether the proposed model is suitable for practical agricultural deployments-such as on embedded systems or UAVs-we comprehensively considered its computing performance. We focused on measuring and comparing several key indicators: floating point operations (FLOPs), model size (parameter quantity), and inference latency, while using Faster R-CNN, YOLOv5s and benchmark model YOLOv8 as references. See
Table 5 for specific test results.
The research results show that the improved YOLOv8 model only brings a small increase in calculation complexity compared with the benchmark version of YOLOv8-FLOPs increased from 28.4 G to 32.7 G, and the parameter size increased from 11.1 M to 12.8 M. This increase stems from the addition of CAFM modules and additional ultra-small detection heads, which aim to optimize feature coding and improve the detection of small lesions.
Even so, the upgraded model still maintains strong reasoning speed: a single graph on the GPU side takes only 9.5 milliseconds, which easily meets the real-time threshold (usually > 30 FPS); a single graph on the CPU side takes about 100 milliseconds and can still support embedded systems after optimization. Run in near real time.
Balancing the slight increase in computing overhead (significant increase in mAP50 from 0.94 to 0.96) with the leap in detection accuracy, this compromise is worth the money for high-precision disease detection. The data proves that the model is both accurate and efficient and is completely suitable for deployment in agricultural edge computing equipment.
3.5. Detailed Descriptive Analysis of Model Performance Under Challenging Conditions
While quantitative metrics provide an overall performance summary, in-depth qualitative analysis is essential to understand model behavior under real-world agricultural conditions. This section presents a detailed evaluation based on 315 test images categorized into three challenging scenarios.
The improved YOLOv8 model demonstrates exceptional capability in detecting microscopic lesions, achieving 89.7% recall for targets smaller than 20 × 20 pixels—significantly surpassing the original YOLOv8 (75.3%) and YOLOv5s (68.2%). The specialized ultra-small detection head (32 × 32) effectively captures fine-grained features that conventional heads often miss, while maintaining high confidence (mean 0.87) for correct identifications. When addressing leaf occlusion and partial visibility—common issues caused by overlapping foliage and shadows—our model with the CAFM module achieves 91.5% precision and 84.2% recall under occlusion rates exceeding 30%, representing a 12.3% recall improvement over baseline YOLOv8. The attention mechanism enables the network to leverage contextual information for inferring obscured regions.
In complex backgrounds containing soil textures, irrigation equipment, and non-target plants, our approach reduces false detection rates by 38.6% compared to YOLOv5s and 22.4% compared to YOLOv8, maintaining 93.2% average precision despite multiple distractors. The convolutional branch of CAFM proves effective in suppressing background noise while preserving critical disease features. Further analysis of confidence scores reveals that 86.4% of true positives from our model exceed 0.8 confidence, substantially higher than YOLOv8 (72.1%) and YOLOv5s (65.8%), indicating both higher accuracy and greater prediction certainty. Error pattern analysis shows that most misses occur in cases of extreme occlusion (>60%) or very small size (<15 pixels), while false alarms often stem from lighting artifacts mimicking disease patterns. About 15.2% of errors represent challenging cases even for human experts.
This comprehensive evaluation confirms that our enhanced YOLOv8 not only improves numerical metrics but also delivers robust performance across key challenging scenarios in agricultural disease detection, demonstrating particular strengths in handling small targets, occlusion, and complex backgrounds through targeted architectural improvements.
3.6. Model Comparison
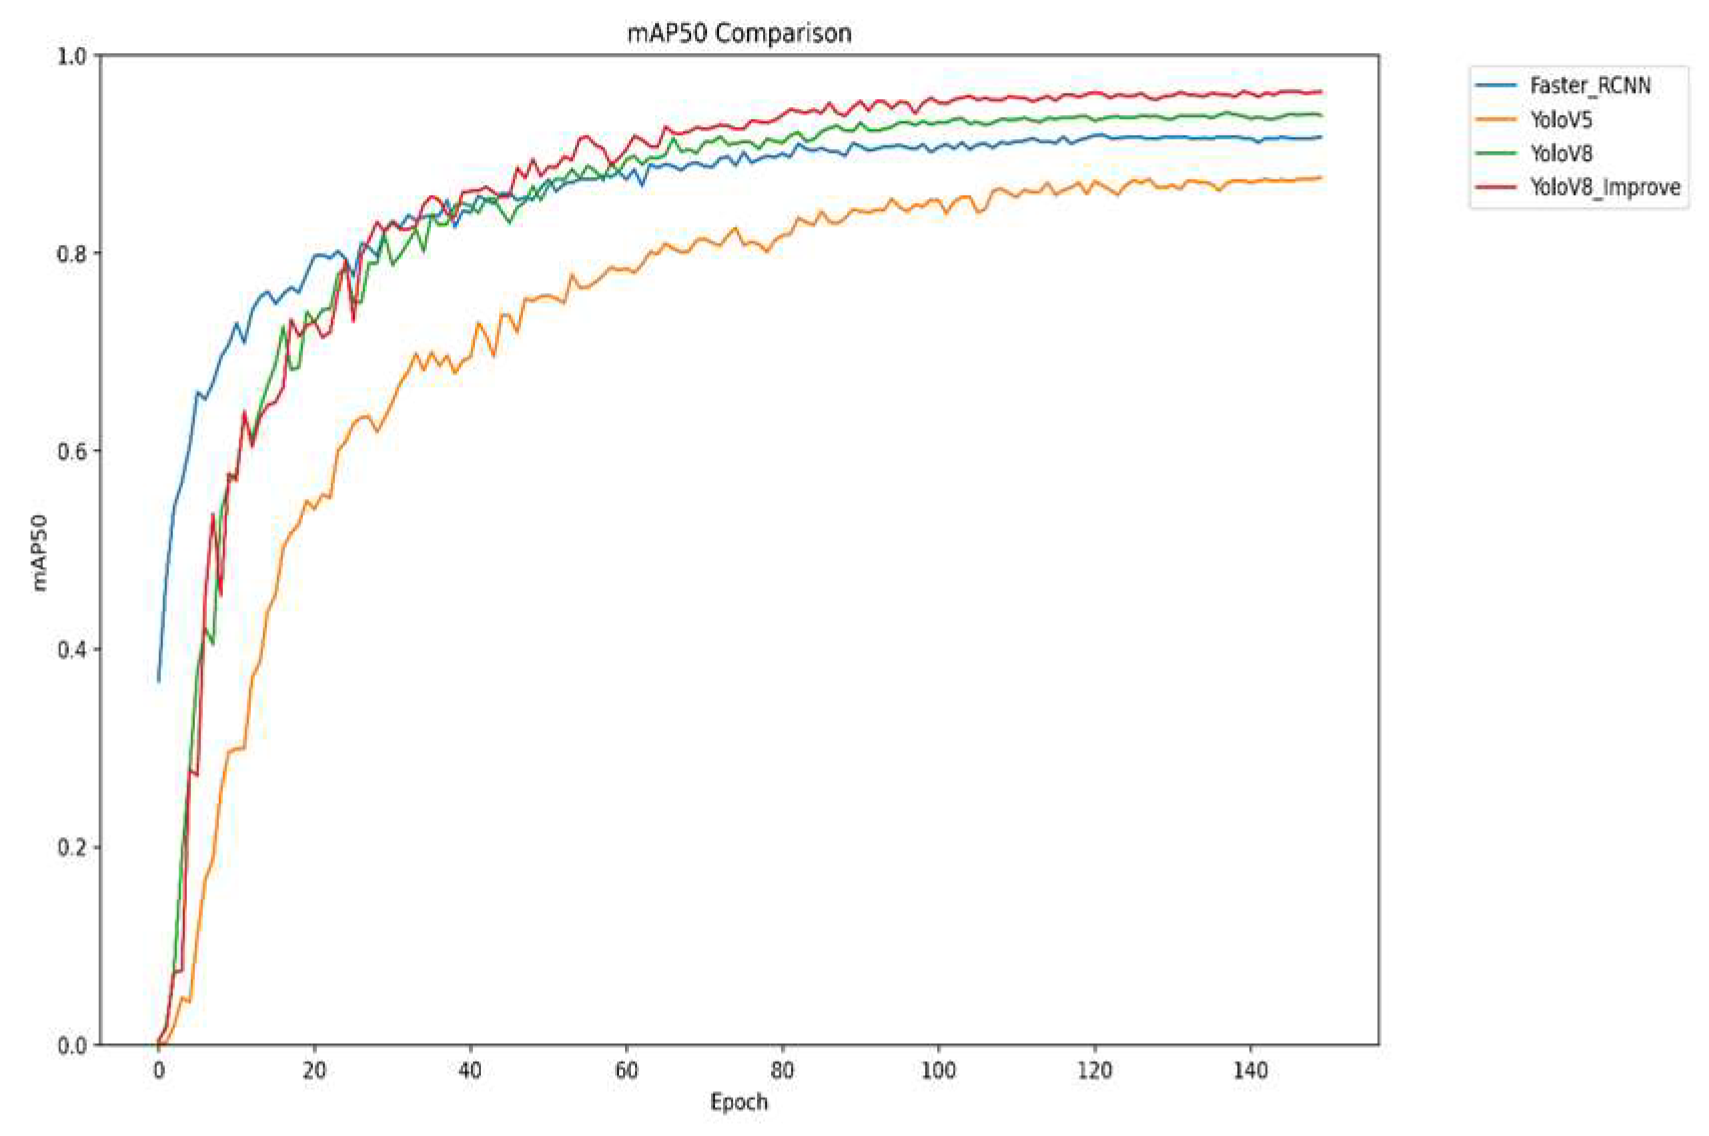
To evaluate the performance and robustness of the improved YOLOv8 algorithm, comparative experiments were conducted under consistent settings—using the same dataset and 150 training epochs—against mainstream detectors including Faster R-CNN, YOLOv5, and the original YOLOv8. Key metrics were analyzed to systematically demonstrate the enhancements of our method. As shown in
Figure 7, the improved YOLOv8 converges rapidly early in training, reaches a high mAP50 value sooner, and finally stabilizes at 0.96, outperforming all other models. These results robustly confirm the effectiveness of the proposed improvements in boosting both detection accuracy and overall model performance.
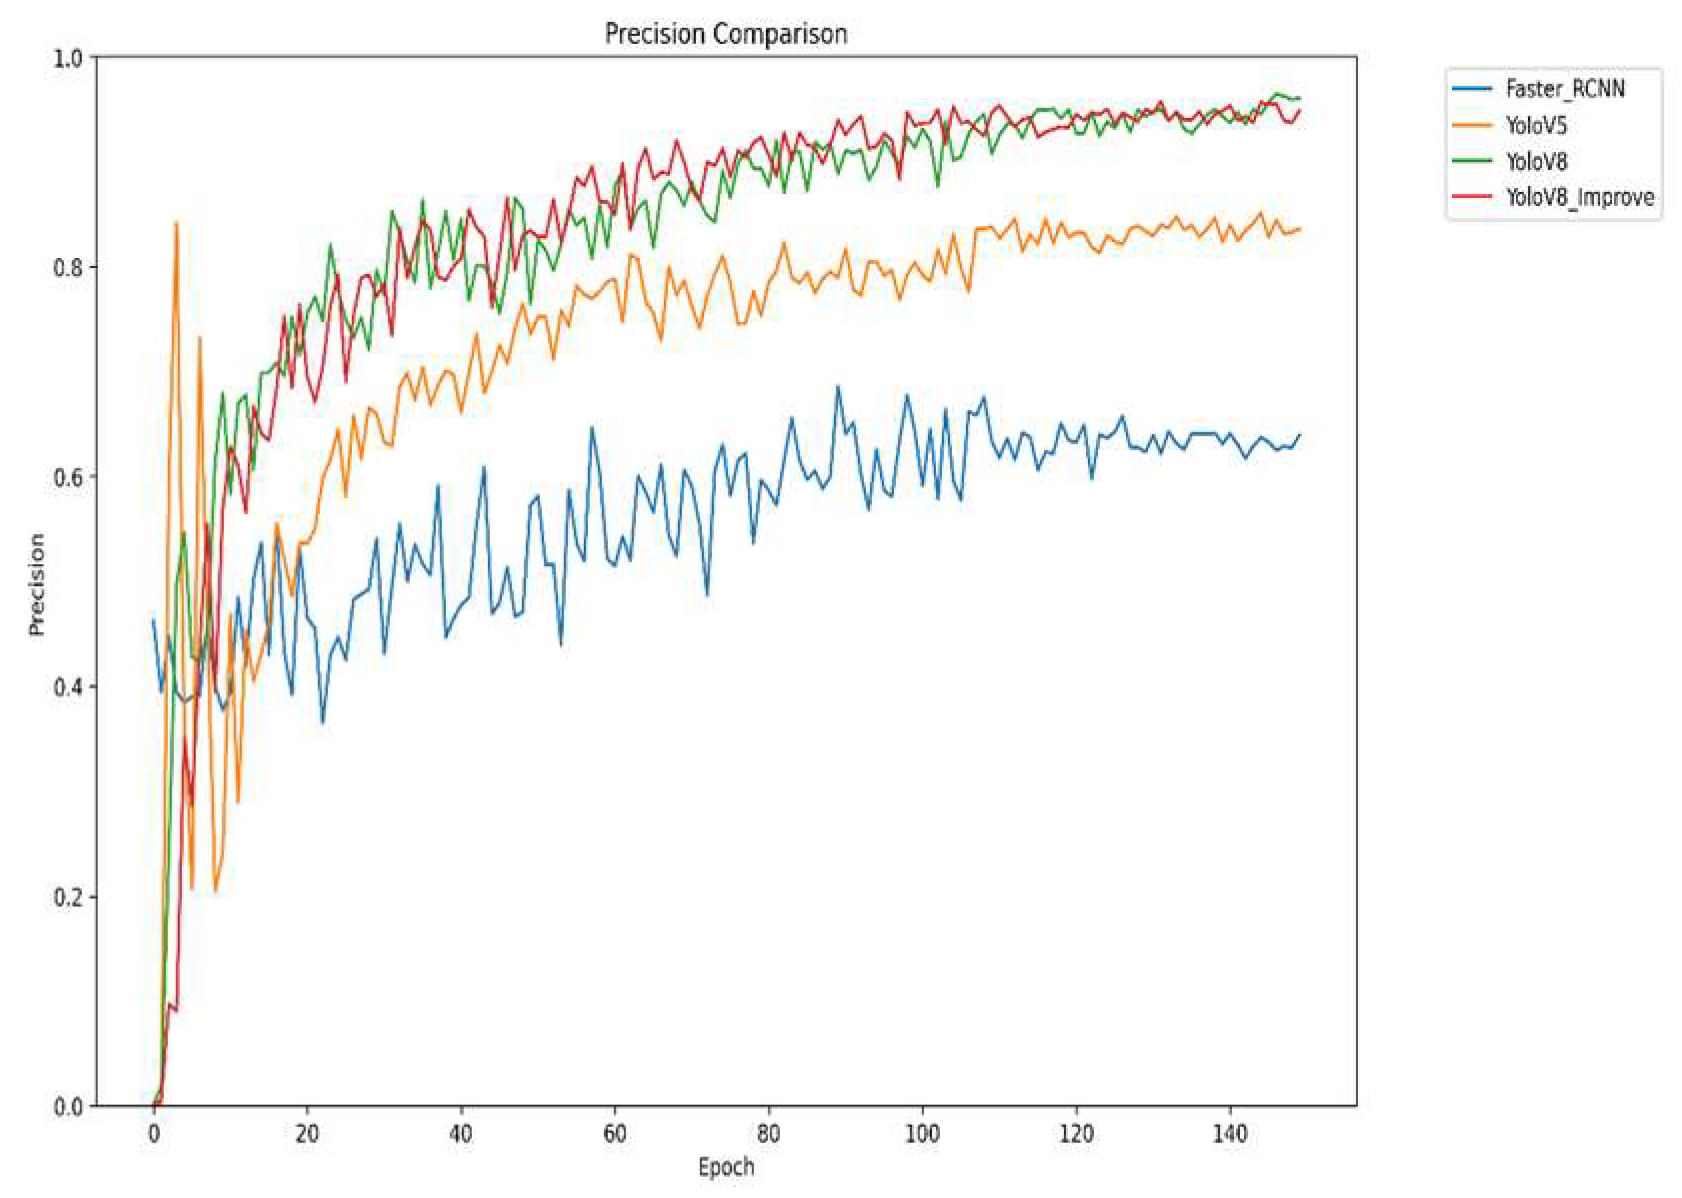
Figure 8 presents the variation in accuracy of the different models during the training proportion of correctly detected targets to the total number of targets detected by the model, the data in the figure shows that the improved YOLOv8 presents the best accuracy, with the highest accuracy value at the late stage of training. This means that the improved YOLOv8 has higher accuracy in detecting strawberry diseases, and it can identify diseased areas more efficiently, reduce the situation of false and missed detection, and improve the reliability of disease detection.
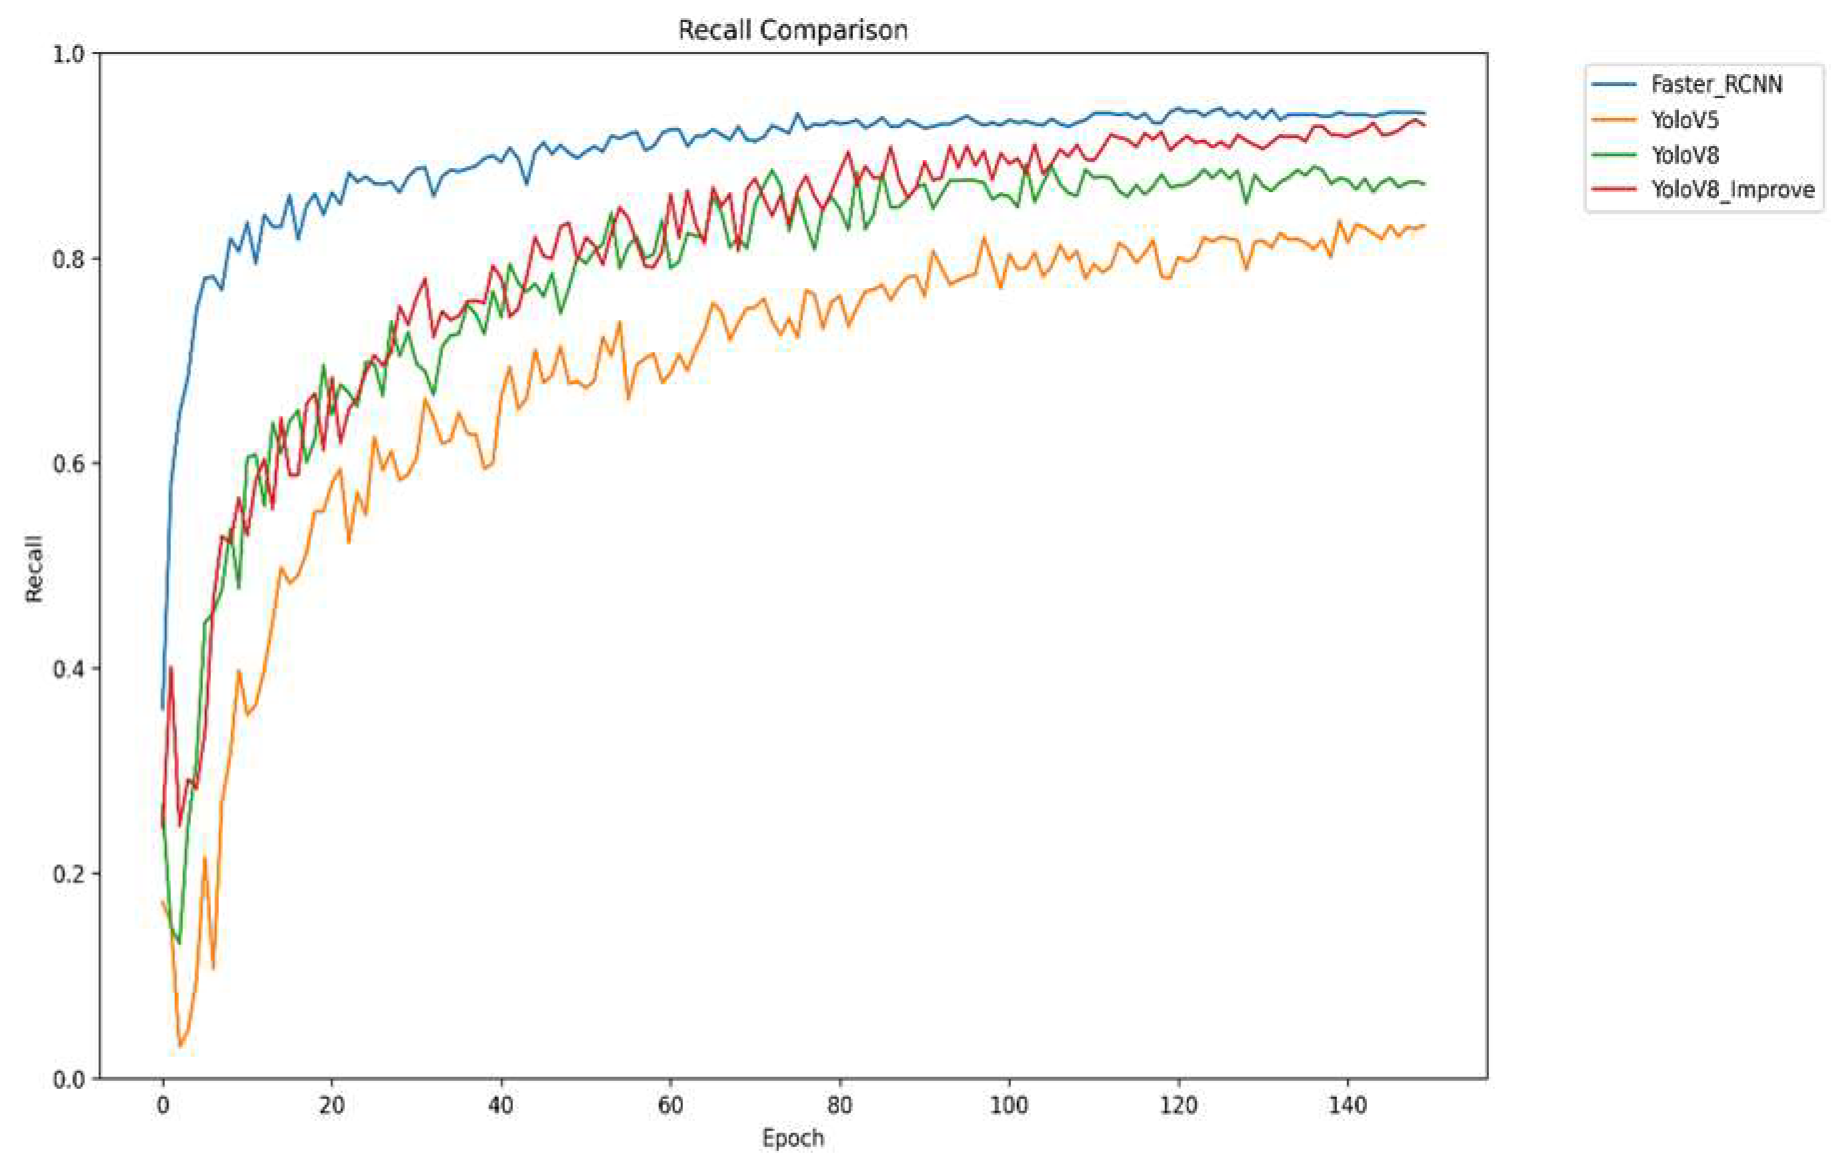
Figure 9 shows the trend of recall of different models during the training process. Recall refers to the proportion of the number of targets accurately detected by the model to the number of targets that actually exist, which is a key indicator for evaluating the comprehensiveness of the model. However, the improved YOLOv8 has significantly improved its recall through a series of improvements, such as optimizing the network architecture and improving the loss function. The improved YOLOv8 provides a more comprehensive coverage of strawberry diseases and reduces the occurrence of missed detection, thus improving the completeness of disease detection.
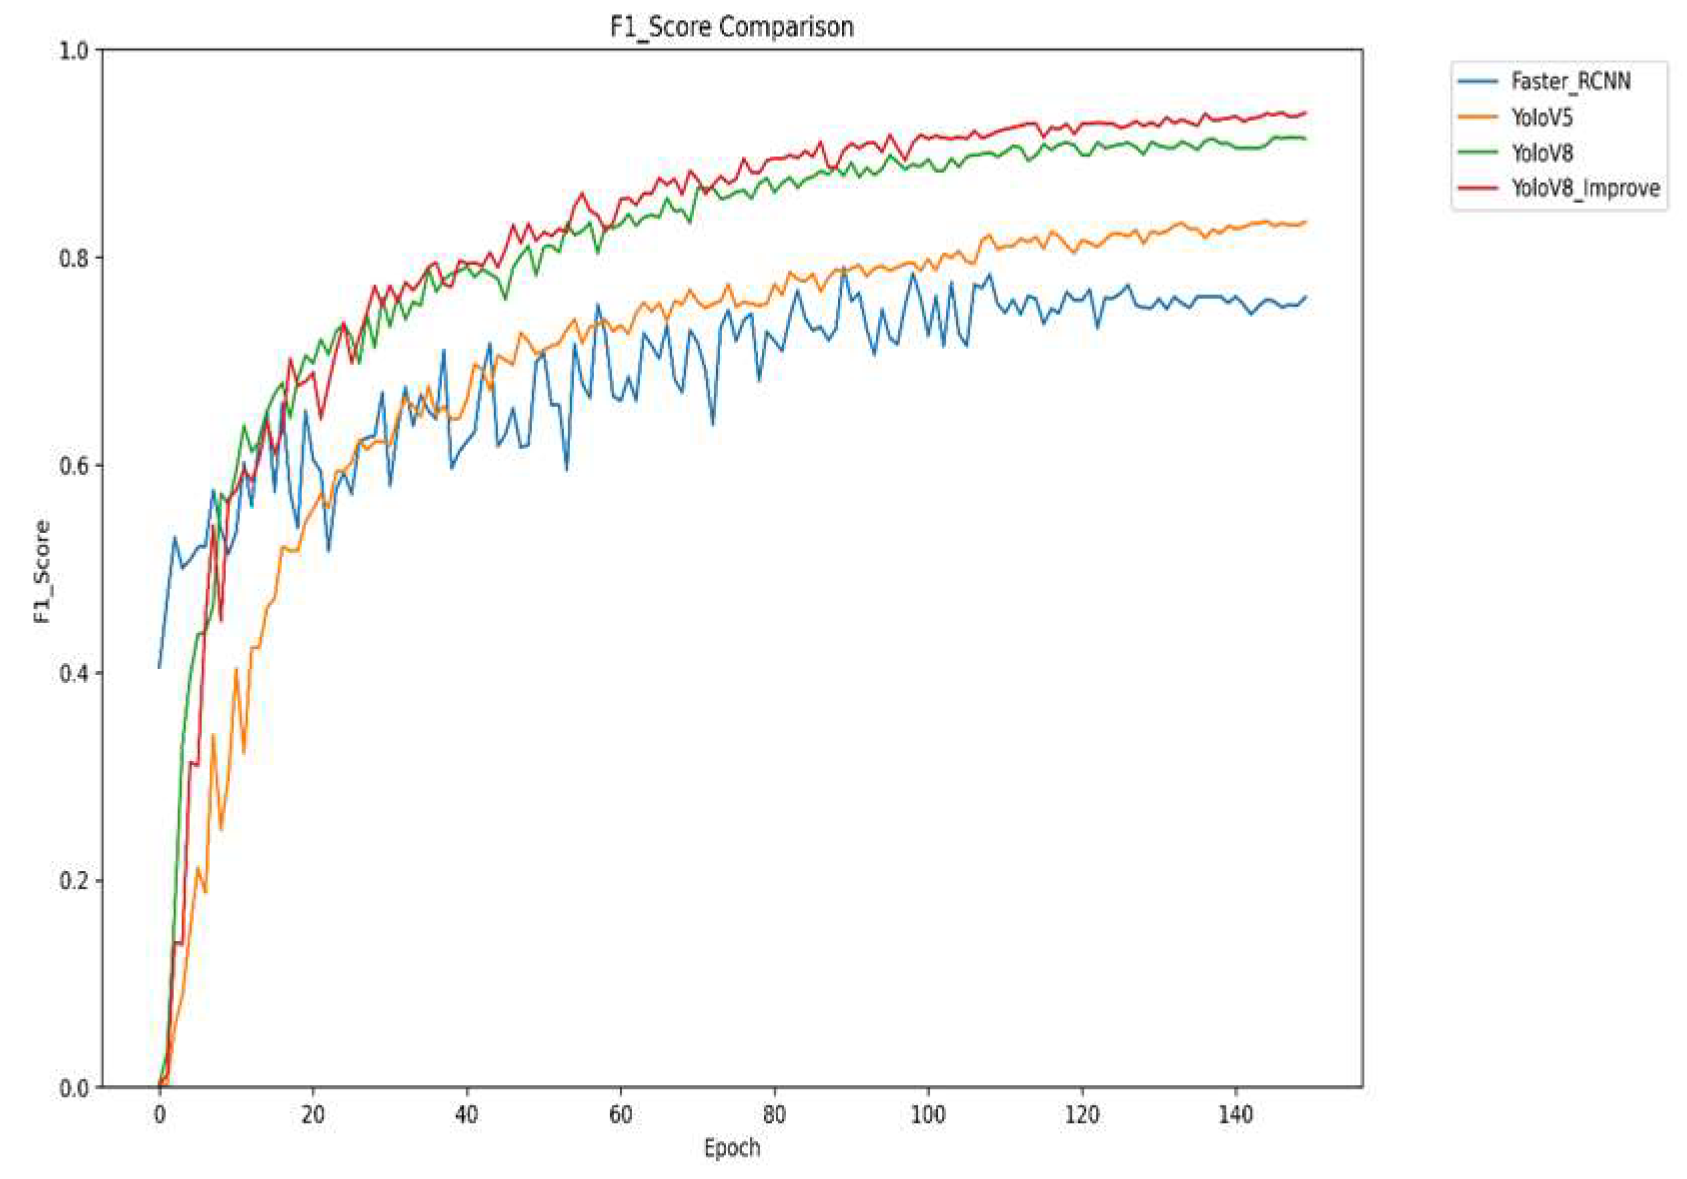
Figure 10 shows a comprehensive evaluation of the changes in F1 scores of different models during the training process. F1 scores, as the reconciled average of precision and recall, can reflect the model performance, taking into account the accuracy and comprehensiveness of the model, and it can be seen from the figure that the improved YOLOv8 performs the best in terms of F1 scores, which means that it strikes a good balance between precision and recall, and its comprehensive performance is in the best state. The improved YOLOv8 has high detection accuracy and can also comprehensively cover the disease area, providing a strong guarantee for the accurate detection of strawberry diseases.
The four graphs compare the performance of Faster R-CNN, YOLOv5, YOLOv8, and the improved YOLOv8 across four key metrics: mAP, precision, recall, and F1 score. The improved YOLOv8 outperforms other models across all metrics. It shows rapid convergence and the highest mAP50 value, indicating superior overall detection accuracy. It also achieves the highest precision in later training stages, reflecting high detection reliability, and significantly improves recall, reducing missed detections. The F1 score demonstrates an optimal balance between precision and recall. Collectively, the results confirm that the improved YOLOv8 offers higher accuracy, better comprehensiveness, and greater stability for strawberry disease detection.
4. Conclusions
This study developed a high-precision strawberry disease detection model based on an improved YOLOv8 algorithm, validated effectively in complex agricultural environments. The optimized model achieved a mAP50 of 0.96 across seven disease types, outperforming original YOLOv8, YOLOv5, and Faster R-CNN by 2.1%, 5.3%, and 11.7%, respectively. The incorporation of an ultra-small-scale detection head and a convolutional attention fusion module (CAFM) significantly reduced missed detections of small lesions and improved robustness in complex backgrounds. A real-time interactive system built with PyQT5 demonstrated practical utility for field applications. Limitations include limited dataset coverage under extreme lighting and growth stages, which affects generalizability, and challenges in lightweight deployment. This work provides valuable insights into implementing deep learning for agricultural disease diagnostics.
Future work will advance along two complementary tracks: technological innovation and practical application. Technologically, we will develop a multi-modal fusion framework that integrates hyperspectral imaging, environmental sensor data, and visual inputs to overcome the limitations of relying solely on RGB images under challenging lighting and weather conditions. To enhance applicability across growth stages, we will construct a comprehensive multi-phase dataset covering the entire strawberry growth cycle—from seedling and flowering to fruiting and maturation—and design adaptive network architectures capable of handling pronounced morphological changes across phenological stages. Concurrently, we will employ lightweight techniques such as knowledge distillation, channel pruning, and neural architecture search to optimize computational efficiency, facilitating real-time deployment on resource-constrained edge devices including drones and field inspection robots. Furthermore, we will explore cross-crop transfer learning to extend model capabilities to diseases affecting grapes, tomatoes, and other high-value crops, aiming to build a universal and scalable platform for agricultural disease detection. Finally, we will incorporate causal inference methods to model the relationships between environmental factors and disease outbreaks, shifting the paradigm from passive detection toward proactive prediction and smarter crop management.
Finally, causal inference methods will be integrated to analyze correlations between environmental factors (temperature, humidity, soil parameters) and disease occurrence, enabling a paradigm shift from “passive detection” to “active prediction”. These efforts will deepen the integration of deep learning with agricultural production, providing systematic technical support for precision agriculture and sustainable development.
Author Contributions
Conceptualization, X.C.; methodology, H.L.; software, H.L.; validation, J.L., K.H. and X.C.; formal analysis, H.L. and J.L.; investigation, K.H.; resources, X.C. and J.L.; data curation, H.L. and X.C.; writing—original draft preparation, H.L.; writing—review and editing, J.L. and X.C.; visualization, H.L. and X.C.; supervision, K.H.; project administration, X.C.; funding acquisition, X.C. All authors have read and agreed to the published version of the manuscript.
Funding
This research was funded by a grant from Key Laboratory for Crop Production and Smart Agriculture of Yunnan Province, Yunnan Provincial Agricultural Basic Research Joint Project (No.202301BD070001-203), Yunnan Provincial Basic Research Project (No. 202101AT070267). The Key Laboratory for Crop Production and Smart Agriculture of Yunnan Province 2024 Open Fund Project (No. 2024ZHNY10), Yunnan Agricultural University Education and Teaching Reform Research Project (No. YNAUKCSZJG2023056), Yunnan Agricultural University University-level First-Class Undergraduate Curriculum Project (Big Data Storage and Processing Technology), the scientific research fund project of Kunming Metallurgy College (No. 2020XJZK01) and the scientific research fund project of Yunnan Provincial Education Department (No. 2021J0943).
Data Availability Statement
The original image dataset utilized in this study was sourced from the public repository Roboflow, available at:
https://universe.roboflow.com/(accessed on 15 February 2025). The initial collection consisted of 3568 strawberry disease images. After data cleaning, a refined dataset of 3146 valid samples was constructed. Due to licensing restrictions, the original image dataset cannot be redistributed but is available at the above link. The processed dataset (annotations, train/val/test splits) and code are available from the corresponding author upon reasonable request for research purposes.
Acknowledgments
The authors want to express our gratitude to The Key Laboratory for Crop Production and Smart Agriculture of Yunnan Province, Yunnan Agricultural University, Kunming Metallurgical College and other parties for their financial support.
Conflicts of Interest
The authors declare no conflicts of interest.
Abbreviations
The following abbreviations are used in this manuscript:
| CAFM | convolution and attention fusion module |
| YOLO | You Only Look Once |
| mAP | mean Average Precision |
References
- Wu, B.Q.; Liu, W.K.; Li, Y. Design of strawberry disease detection and segmentation system based on improved YOLOv8. Chin. J. Stereol. Image Anal. 2025, 30, 1–13. [Google Scholar] [CrossRef]
- Wang, J.Q.; Ma, J.Z.; Shi, L.; Dong, J.; Zhang, W.Q.; Cui, L.G.; Ma, L.; Yang, L.M. Discussion on the integration application and strategy of image recognition technology in strawberry disease control. Digit. Agric. Intell. Agric. Mach. 2025, 217, 81–84. [Google Scholar] [CrossRef]
- Ye, Q.; Wang, L.F.; Ma, M.T.; Zhao, X.; Duan, B.C. Strawberry disease detection method based on improved YOLOv8. Jiangsu Agric. Sci. 2024, 52, 250–259. [Google Scholar] [CrossRef]
- Wang, J.Q.; Shi, L.; Dong, J. Research on the design and application of image recognition model for strawberry disease in facility agriculture. Digit. Agric. Intell. Agric. Mach. 2024, 213, 25–28. [Google Scholar] [CrossRef]
- Liu, C.M. Advancing Strawberry Disease Detection in Agriculture: A Transfer Learning Approach with YOLOv5 Algorithm. Int. J. Adv. Comput. Sci. Appl. (IJACSA) 2024, 15. [Google Scholar] [CrossRef]
- Chen, H.; Chen, H.; Huang, X.; Zhang, S.; Chen, S.; Cen, F.; He, T.; Zhao, Q.; Gao, Z. Estimation of sorghum seedling number from drone image based on support vector machine and YOLO algorithms. Front. Plant Sci. 2024, 15, 1399872. [Google Scholar] [CrossRef] [PubMed]
- Yang, J.W.; Kim, H.I. An overview of recent advances in greenhouse strawberry cultivation using deep learning techniques: A review for strawberry practitioners. Agronomy 2023, 14, 34. [Google Scholar] [CrossRef]
- Li, J.C.; Chen, Z.J.; Xu, H.R. A method for strawberry disease detection in real scenarios based on improved YOLOv8n. J. Chin. Agric. Mech. 2024, 45, 267–274. [Google Scholar] [CrossRef]
- Nie, J.; Zhu, J.Z. Ice disease detection based on improved YOLOv8. Comput. Syst. Appl. 2025, 34, 124–137. [Google Scholar] [CrossRef]
- Wang, Z.A.; Peng, T.L. An Improved Method for Grape Leaf Disease Identification Using the YOLOv8n Model. J. Yibin Univ. 2025, 25, 7–14. [Google Scholar] [CrossRef]
- Lin, Y.B.; Liu, C.Y.; Chen, W.L.; Chang, C.H.; Ng, F.L.; Yang, K.; Hsung, J. IoT-Based Strawberry Disease Detection With Wall- Mounted Monitoring Cameras. IEEE Internet Things J. 2024, 11, 1439–1451. [Google Scholar] [CrossRef]
- Pertiwi, S.; Wibowo, D.H.; Widodo, S. Deep Learning Model for Identification of Diseases on Strawberry (Fragaria sp.) Plants. Int. J. Adv. Sci. Eng. Inf. Technol. 2023, 13, 1342–1348. [Google Scholar] [CrossRef]
- Patel, A.; Lee, W.S.; Peres, N.A.; Fraisse, C.W. Strawberry plant wetness detection using computer vision and deep learning. Smart Agric. Technol. 2021, 1, 100013. [Google Scholar] [CrossRef]
- Zhang, B.; Ou, Y.; Yu, S.; Liu, Y.; Liu, Y.; Qiu, W. Gray mold and anthracnose disease detection on strawberry leaves using hyperspectral imaging. Plant Methods 2023, 19, 148. [Google Scholar] [CrossRef] [PubMed]
- Nie, X.; Wang, L.; Ding, H.; Xu, M. Strawberry Verticillium Wilt Detection Network Based on Multi-Task Learning and Attention. IEEE Access 2019, 7, 170003–170011. [Google Scholar] [CrossRef]
- Saha, R.; Shaikh, A.; Tarafdar, A.; Majumder, P.; Baidya, A.; Bera, U.K. Deep Learning-Based Comparative Study on Multi-Disease Identification in Strawberries. In Proceedings of the 2024 IEEE Silchar Subsection Conference (SILCON 2024), Agartala, India, 15–17 November 2024; pp. 1–6. [Google Scholar] [CrossRef]
- Kim, H.; Kim, D. Deep-Learning-Based Strawberry Leaf Pest Classification for Sustainable Smart Farms. Sustainability 2023, 15, 7931. [Google Scholar] [CrossRef]
- Chen, J.; Zhang, H.; Gong, M.; Gao, Z. Collaborative compensative transformer network for salient object detection. Pattern Recognit. 2024, 154, 110600. [Google Scholar] [CrossRef]
- Liu, Z.; Deng, S.; Wang, X.; Wang, L.; Fang, X.; Tang, B. SSFam: Scribble Supervised Salient Object Detection Family. IEEE Trans. Multimed. 2025, 27, 1988–2000. [Google Scholar] [CrossRef]
- Yelleni, S.H.; Kumari, D. Monte Carlo DropBlock for modeling uncertainty in object detection. Pattern Recognit. 2024, 146, 110003. [Google Scholar] [CrossRef]
| Disclaimer/Publisher’s Note: The statements, opinions and data contained in all publications are solely those of the individual author(s) and contributor(s) and not of MDPI and/or the editor(s). MDPI and/or the editor(s) disclaim responsibility for any injury to people or property resulting from any ideas, methods, instructions or products referred to in the content. |
© 2025 by the authors. Licensee MDPI, Basel, Switzerland. This article is an open access article distributed under the terms and conditions of the Creative Commons Attribution (CC BY) license (https://creativecommons.org/licenses/by/4.0/).

