Abstract
Pedestrian safety at signalized intersections remains a pressing concern in rapidly urbanizing cities. This study introduces a trajectory–signal behavior spectrum, grounded in Behavior Spectrum Theory (BST), to quantify crossing risk using readily observable data. Unmanned aerial vehicle (UAV) video is employed to record pedestrian movements, which are then detected with YOLOv8 and tracked with ByteTrack, producing frame-level trajectories without dependence on line-of-sight instrumentation. Five spatiotemporal features—speed, acceleration, crossing time, remaining pedestrian-signal green time, and red-phase duration—are compiled into the spectrum. Features are normalized using the interquartile range (IQR) method, and objective weights are determined with an improved CRITIC (Criteria Importance Through Intercriteria Correlation) scheme that incorporates a median-based coefficient of variation and absolute correlation for conflict measurement. The resulting risk eigenvalues are clustered with K-means into four levels: no risk, low, medium, and high. A case study of 1210 crossings at a two-way eight-lane intersection in Harbin, China (576 compliant, 634 non-compliant) demonstrates the approach. Results show greater variability among non-compliant speeds (mean 1.29 m/s) compared with compliant crossings (mean 1.40 m/s), with more extreme deviations. Clustering achieved silhouette coefficients of 0.60 for compliant and 0.69 for non-compliant groups, while expert validation on 20 samples yielded substantial agreement (Fleiss’ Kappa = 0.87). This study provides a systematic and interpretable method for risk classification, which supports both theoretical understanding and applied traffic safety management.
1. Introduction
Urbanization and motorization are rapidly reshaping urban traffic systems, leading to increasingly complex interactions between pedestrians and vehicles. Pedestrian safety has emerged as a critical concern, as pedestrians are vulnerable road users frequently exposed to risks during street crossings. Statistical evidence shows that, in 2020, pedestrian fatalities comprised more than 28% of all road traffic deaths in China, with related injuries exceeding 16% [1,2]. Despite the implementation of regulatory measures, jaywalking and other non-compliant behaviors remain widespread [3,4,5]. Conflicts between pedestrians and vehicles are particularly concentrated at intersections, where the inherent randomness, diversity, and complexity of pedestrian behaviors complicate enforcement and management [6,7,8]. Consequently, evaluating pedestrian crossing risk at signalized intersections is of major research significance for advancing prevention and control of traffic safety.
Pedestrian behaviors at signalized intersections can be broadly divided into compliant and non-compliant categories. Compliant pedestrians are those who initiate and complete crossings during the green-signal phase, following established traffic rules. Their trajectories typically reflect steady speeds and predictable movement patterns. In contrast, non-compliant pedestrians disregard the signal phase, entering the crosswalk during red lights or continuing to cross after the green phase has expired. Such actions introduce greater uncertainty into vehicle–pedestrian interactions, often resulting in longer waiting times, abrupt accelerations, or sudden halts.
The concept of a behavior spectrum originates from ethology, where it is used to record and quantify the complete range of observable animal behaviors. Transposed into traffic research, a pedestrian behavior spectrum represents a systematic record of spatiotemporal indicators—such as speed, acceleration, trajectory deviation, and crossing duration—that describe the variability of pedestrian actions under different traffic conditions. Compliant pedestrians are those who cross the road during the green signal phase, adhering to traffic rules, while non-compliant pedestrians disregard the signal phase and either cross during a red signal or continue crossing after the green phase has expired. This distinction is essential, as non-compliant behaviors introduce more uncertainty and higher risk into pedestrian–vehicle interactions. The pedestrian behavior spectrum serves as the foundation for both qualitative categorization and quantitative risk assessment by analyzing these behavioral patterns. By incorporating various spatiotemporal features, the spectrum enables a more comprehensive evaluation of pedestrian behavior, particularly when assessing crossing risks at signalized intersections.
Risk classification in pedestrian studies refers to the process of categorizing behaviors into discrete levels of potential danger, typically ranging from no risk to high risk. Classification relies on translating raw behavioral features into risk eigenvalues through normalization and weighting schemes, after which clustering or classification algorithms are applied. This structured approach allows the transformation of heterogeneous pedestrian actions into interpretable categories that support both theoretical analysis and practical safety management.
Although prior studies have attempted to characterize pedestrian behavior, several issues persist. Wu Chaozhong [9] proposed the concept of the traffic behavior spectrum to systematically capture behavioral traits of drivers, cyclists, and pedestrians across traffic processes. Derived from ethological approaches in biology and ecology [10,11], this spectrum emphasizes the recording of both micro-level and macro-level actions. Analogous frameworks have been applied to pedestrian crossing, highlighting features of compliant and non-compliant behaviors under varying scenarios [12,13]. However, despite such conceptual advances, there is still limited consensus on standardized theoretical frameworks for pedestrian crossing, and descriptions of continuous behavioral variability remain insufficient [14,15].
To address these limitations, scholars have developed algorithmic approaches to trajectory analysis. Sighencea et al. [16] combined SGNN and TGNN to enhance trajectory prediction. Alghodhaifi et al. [17] designed Holistic Spatio-Temporal Graph Attention (HSTGA) to model vehicle–pedestrian interactions, Czech et al. [18] introduced Behavior-Aware Pedestrian Trajectory Prediction (BA-PTP) for dynamic scenes. Yet these models remain restricted to short-term forecasting and are poorly suited to long-term spatiotemporal extraction in real crossing scenarios [19]. Many studies still depend on aerial imagery with Tracker software V3.0 and extensive manual labeling [20], as seen in Wu et al. [21], who combined manual annotation and pixel recognition to construct risk models. These methods are highly labor-intensive, cannot scale to large datasets, and lack real-time capacity. Other research has applied Behavior Spectrum Theory to driving, such as Chandra et al. [22] using Dynamic Geometric Graphs and Wang et al. [23] analyzing aggressive driving, but the application of spectrum-based methods to pedestrian crossing remains limited. Existing evaluations often focus on unsignalized intersections [24,25,26,27], where models like the pedestrian risk index, PET, LDV, or DV frameworks are used, but they rarely integrate signal-phase factors, leaving risk at signalized intersections underexplored.
This study proposes an integrated approach to overcome these gaps. Specifically, pedestrian trajectories are automatically extracted from UAV footage using YOLOv8 detection combined with ByteTrack multi-object tracking [28,29], ensuring robust and real-time recognition. Behavior Spectrum Theory (BST) is employed to construct a trajectory–signal behavior spectrum that incorporates both pedestrian movements and signal-phase information. Five key spatiotemporal features—speed, acceleration, crossing time, remaining green-light time, and red-light duration—are compiled, normalized with the interquartile range (IQR) method [30], and weighted through an improved CRITIC algorithm that introduces a median-based coefficient of variation and absolute correlation to better capture variability and conflict. Finally, K-means clustering is applied to derive interpretable risk categories.
The contributions of this research are as follows:
- (1)
- It extends Behavior Spectrum Theory to pedestrian crossing by constructing a trajectory–signal behavior spectrum that unifies movement and signal data.
- (2)
- It introduces an improved CRITIC weighting scheme by replacing the mean with the median in the coefficient of variation. The scheme refines feature evaluation by mitigating the influence of outliers and capturing both positive and negative correlations.
- (3)
- It demonstrates a data-driven risk classification framework validated through a large-scale UAV dataset of 1210 crossings and expert evaluation, producing consistent and interpretable results.
The remainder of this paper is organized as follows. Section 2 presents the related work on behavior spectrum analyses and trajectory-based prediction methods. Section 3 describes the data collection process and extraction of trajectory–signal features from UAV video. Section 4 details the construction of the behavior spectrum, normalization procedures, and improved CRITIC weighting. Section 5 introduces the clustering-based risk classification, experimental setup, and validation. Section 6 discusses theoretical and practical implications. Finally, Section 7 concludes with contributions, limitations, and directions for future research.
2. Related Work
This section reviews the most relevant studies that form the foundation of the present research. It is divided into two parts: spectrum-based analyses and algorithmic trajectory prediction.
2.1. Behavior Spectrum and Signal-Phase-Based Analyses
The concept of behavior spectrum, originally derived from biology and ecology, has been extended to traffic behavior studies to systematically record and analyze patterns of road user evaluation [9,10,11]. Wu et al.’s evaluation [9] emphasized constructing traffic behavior spectra that encompass both micro-level operational behaviors and macro-level travel behaviors, providing a structured perspective for analyzing pedestrian and vehicular interactions. Subsequent works have highlighted the necessity of distinguishing compliant and non-compliant crossing behaviors through evaluation [12,13], while Stock and Silva’s evaluation [15] analyzed crossing time distributions and congestion patterns in scramble intersections to reveal critical variability. Similarly, Dąbkowski et al.’s evaluation [24] developed the Pedestrian Danger Index for unsignalized intersections, and Almodfer et al.’s evaluation [25] applied lane-based PET to quantify pedestrian–vehicle conflicts. Chen et al.’s evaluation [26] further introduced the LDV model, and Fu et al.’s evaluation [27] proposed a DV framework, both demonstrating the importance of integrating spatiotemporal indicators into safety assessments. However, most of these efforts focused on signal-less or unsignalized scenarios, and they rarely accounted for the influence of pedestrian-signal phases. Research directly addressing risk levels at signalized intersections remains sparse, underscoring the gap this paper aims to fill.
2.2. Trajectory Prediction and Algorithmic Approaches
Parallel to spectrum-based studies, numerous efforts have leveraged algorithmic and machine learning models to predict pedestrian trajectories and evaluate risks. Alghodhaifi et al.’s evaluation [17] introduced the Holistic Spatio-Temporal Graph Attention (HSTGA) model to capture vehicle–pedestrian interactions. Czech et al.’s evaluation [18] proposed the Behavior-Aware Pedestrian Trajectory Prediction (BA-PTP) framework for dynamic scene analysis, while Sighencea et al.’s evaluation [16] integrated SGNN and TGNN for enhanced interaction and motion modeling. Similarly, Sighencea et al.’s evaluation [16] and Alghodhaifi et al.’s evaluation [17] applied graph neural networks and attention-based methods to predict pedestrian paths in complex urban contexts. Czech et al.’s evaluation [18] developed a spatiotemporal ego-motion framework for trajectory prediction, while Chandra et al.’s evaluation [22] employed spectral clustering with graph-LSTMs. Despite those advances, many of these models rely on short-term prediction horizons or aerial imagery with heavy manual annotation evaluation [20,21], which limit scalability and real-time applicability. Recent improvements in deep detection and tracking, such as YOLOv8 evaluation [28] and its enhancements’ evaluation [29], together with efficient multi-object tracking like ByteTrack, offer promising opportunities for automated and large-scale behavioral spectrum construction. Nonetheless, integration of these algorithms with signal-phase analysis remains underdeveloped, which this study addresses through the trajectory–signal behavior spectrum framework.
Compared with the existing methods, this study systematically investigates pedestrian behavior at signalized intersections through a multi-step process. Initially, drone technology is used to capture video recordings of pedestrian crossings. The enhanced Yolov8-ByteTrack algorithm, paired with manual annotation techniques, then extracts spatiotemporal data on pedestrian movements. This data serves as the foundation for developing a pedestrian crossing trajectory–signal behavior spectrum. To evaluate different pedestrian groups, crossing characteristic values are calculated using the interquartile range (IQR) method and the refined CRITIC algorithm. Finally, the K-means clustering algorithm classifies the risk levels associated with pedestrian crossings. The method’s accuracy is validated by expert evaluations and verified through Fleiss’s Kappa index.
3. Extraction of Spatiotemporal Data in Pedestrian Crossing Scenarios
3.1. Collection of Pedestrian Crossing Video Data
In a typical pedestrian crossing scenario, a series of time-series data reflecting multiple time-varying parameters constitutes the spectrum of pedestrian crossing behavior. The composition of parameters in this spectrum largely depends on the data collection methods utilized. Currently, the predominant methods for investigating pedestrian crossing behavior include surveys, cameras mounted at intersections, and aerial video data:
- (1)
- Survey methods capture subjective data such as pedestrians’ intentions, psychological states, crossing decisions, and actions during crossing. However, this approach involves substantial data collection efforts and is time-consuming.
- (2)
- Intersection-mounted cameras can record pedestrian crossing behavior at close range and subsequently compute relevant parameters. Nevertheless, these cameras face challenges such as obstructions by crossing pedestrians, difficulty in computing time-varying parameters, and potential influence on the natural crossing behavior of pedestrians.
- (3)
- Aerial video data offers the advantage of collecting extensive trajectory data of pedestrians in a single session, at a lower cost, with data derived from real-world crossing scenarios.
Given that the construction of a spectrum of pedestrian crossing behavior relies on extensive data collection, aerial video data presents advantages over the other methods mentioned. Furthermore, from a practical application standpoint, subjective data such as intentions, psychological states, and decision-making processes are difficult to observe externally and thus challenging to utilize in traffic safety monitoring. Therefore, this study employs unmanned aerial vehicles (UAVs) to capture pedestrian trajectory data.
3.2. Pedestrian Crossing Trajectory–Signal Status Data Acquisition
3.2.1. Pedestrian Crossing Trajectory Data Acquisition
This article is based on aerial footage of pedestrian crossings captured by UAVs and utilizes the YOLOv8-ByteTrack algorithm [29] to extract feature parameters of pedestrian crossing behavior, thereby constructing a spectrum of pedestrian crossing behavior. This method integrates the object detection capabilities of YOLOv8 with the multi-object tracking technology of ByteTrack, enabling efficient and robust trajectory tracking of pedestrian targets in complex environments.
YOLOv8 represents a cutting-edge deep learning model in the field of object detection, widely applied in real-time detection tasks due to its rapid processing speed and high accuracy. The network architecture of YOLOv8 is depicted in Figure 1.
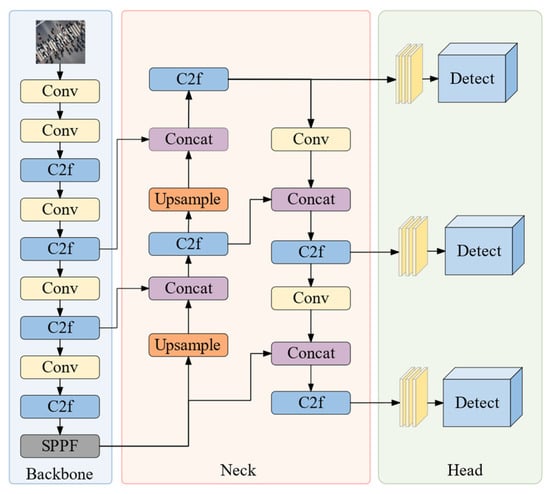
Figure 1.
Overall network architecture of the YOLOv8 object detection model, including backbone feature extraction layers, the feature pyramid and path aggregation modules in the neck, and the detection head responsible for classification and bounding box regression, as applied for pedestrian detection in UAV video footage.
The architecture consists of several key components:
Backbone: This component is responsible for extracting feature information from input images through a multi-layer convolutional neural network. It progressively extracts features at different scales, essential for detecting various objects within the video.
Neck: This section employs a Feature Pyramid Network (FPN) [29] and a Path Aggregation Network (PAN) (Muhammad) to achieve multi-scale feature fusion. This fusion is crucial for accommodating the scale variations for different targets.
Head: This predictor performs classification and bounding box regression for each grid cell, outputting the categories and position information of detected objects.
In the context of pedestrian detection in videos, YOLOv8 identifies bounding boxes and their categories, generating a series of detection results , which include high-confidence detection boxes and low-confidence detection boxes . These detection outputs provide foundational data for ByteTrack’s multi-object tracking, enhancing the overall accuracy and reliability of the trajectory tracking process.
ByteTrack is an efficient multi-object tracking algorithm predicated on enhancements to the Simple Online and Realtime Tracking (SORT) algorithm. The fundamental concept of ByteTrack involves segregating detection boxes into high-confidence and low-confidence categories and executing matching in phases to maximize the utilization of these boxes. The architectural schema of the ByteTrack algorithm is depicted in Figure 2.
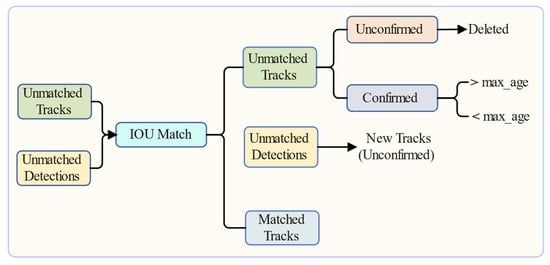
Figure 2.
Structural workflow of the ByteTrack multi-object tracking algorithm, illustrating the handling of high- and low-confidence detection boxes, IOU-based matching, initialization of new tracks, and update mechanisms that ensure continuous pedestrian trajectory tracking in complex crossing environments.
In this schema, the output from YOLOv8 serves as the input for ByteTrack, which includes unmatched tracks and unmatched detections. When employing the Intersection over Union (IOU) matching algorithm, the algorithm associates the targets in the track set with the detection boxes. When the IOU value between a track and a detection box exceeds a predetermined threshold, they are deemed successfully matched. Matched tracks continue to update their status to maintain their activity. Tracks that are unconfirmed represent newly detected targets that have not yet achieved the required number of matches, such as an initial detection. If these tracks are not further confirmed in subsequent frames, they are deleted. Tracks that have been successfully matched across multiple frames are marked as “confirmed,” and they are categorized into expired and non-expired. Expired targets are removed. For unmatched detection boxes, which may represent new target objects, these are initialized as “new tracks (unconfirmed)” and are further validated in subsequent frames. This mechanism enables the algorithm to effectively handle the appearance and disappearance of targets in the video, as well as the continuity of tracks, thereby facilitating robust target tracking.
The YOLOv8-ByteTrack combination demonstrates significant advantages in pedestrian trajectory tracking. Initially, YOLOv8, as a detection model, offers high precision and real-time capabilities, swiftly identifying pedestrians and producing high-confidence detection boxes, while also preserving low-confidence targets for subsequent track matching. ByteTrack efficiently links detection boxes with tracks from previous frames using the IOU matching algorithm, ensuring the continuity of tracks. It integrates high- and low-confidence detection boxes to effectively address issues such as occlusions, target losses, or fluctuations in detection confidence. Additionally, ByteTrack employs Kalman filtering to smoothly update the state of tracks, enhancing the evaluation of pedestrian movement trajectories. Unmatched detection boxes can be initialized as new tracks and confirmed in later frames, further enhancing the system’s flexibility and adaptability. Overall, this combined approach exhibits outstanding robustness, accuracy, and real-time performance in complex scenarios such as pedestrian crossing, providing strong technical support for tracking tasks. The principle of pedestrian crossing feature parameter extraction is illustrated in Figure 3.
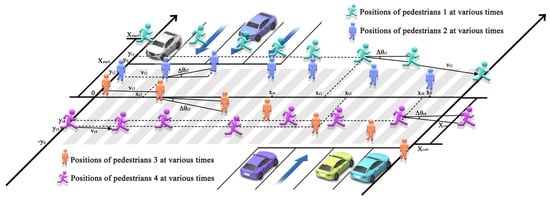
Figure 3.
Schematic representation of the extracted spatiotemporal pedestrian crossing feature parameters, including speed, acceleration, and crossing duration, which together form the basis of the constructed trajectory–signal behavior spectrum.
3.2.2. Crossing Light Status Acquisition for Pedestrian Crossing
Upon the extraction of pedestrian crossing trajectory data, this research manually marks various crossing light parameters concerning pedestrian crossing. By leveraging trained research assistants to watch the video of pedestrian crossing behaviors, we are able to further count diverse crossing light change feature parameters of the two groups during the crossing. Specifically, the first feature parameter is the remaining green-light time: regarding the compliant pedestrian crossing group, this study computes the remaining green-light time when pedestrians complete crossing behaviors based on the periodic features of current crossing lights. The other feature parameter is the red-light duration: aiming at the non-compliant pedestrian crossing group, this study counts the red-light duration during the crossing.
4. Pedestrian Crossing Behavior Classification Method
Overall Framework: The methodology proposed in this study follows a three-layered framework that integrates data acquisition, feature processing, and risk evaluation into a cohesive workflow. In the first layer, pedestrian crossing data are captured through UAV-based aerial video, and trajectories are automatically extracted using YOLOv8 detection combined with ByteTrack multi-object tracking. The second layer processes these trajectories into structured behavioral parameters. Spatiotemporal indicators—including speed, acceleration, crossing time, and signal-phase information—are normalized using the IQR method, while their relative importance is quantified with an improved CRITIC weighting scheme. In the third layer, the weighted features are synthesized into risk eigenvalues, which are clustered with the K-means algorithm to produce discrete pedestrian risk levels. Expert validation serves as an external evaluation mechanism, ensuring that the classification results align with domain knowledge. Conceptually, this framework provides a modular process: (i) sensing and detection, (ii) feature transformation and weighting, and (iii) risk classification and validation. While no activity or component diagrams are included, this description outlines the integration and flow of the proposed approach, which could be implemented as a practical monitoring system in future applications.
4.1. Construction of the Pedestrian Crossing Trajectory–Signal Behavior Spectrum
Upon completion of data extraction, five feature parameters including pedestrian crossing speed, pedestrian crossing acceleration, pedestrian crossing time, remaining green-light time, and red-light duration were utilized to construct a pedestrian crossing trajectory–signal behavior spectrum. A matrix of relevant feature parameters is illustrated in Table 1, where different rows in the matrix represent various crossing pedestrians.

Table 1.
Representative matrix of extracted pedestrian crossing feature parameters, including speed, acceleration, crossing time, remaining green-light time, and red-light duration. Each row corresponds to an individual crossing instance, collectively forming the trajectory–signal behavior spectrum.
The pedestrian crossing trajectory–signal behavior spectrum essentially serves as a record of pedestrian crossing behaviors in pedestrian crossing scenarios at signalized intersections, reflecting the individual and group-based pedestrian crossing features. At this point, the analysis of massive data in the behavior spectrum is helpful to identify the general laws and common features of different types of pedestrian crossing groups, as well as those special pedestrian crossing groups that can be classified as deviating from the main body with relatively high risk.
4.2. Feature Parameter Thresholds and Normalization
In view of the difference between pedestrian crossing behaviors and illegal driving behaviors, as well as the absence of explicit definition and judgment strategies, it is challenging to define whether pedestrian crossing behaviors are compliant. Consequently, this research assumes that the extracted feature parameters are capable of reflecting the abnormal degree of pedestrian crossing behaviors. At this point, the feature parameters of most pedestrians are concentrated within a reasonable interval, whereas the index values far away from this interval are identified as unreasonable values. With the acquisition of feature parameters at each moment during the process of pedestrian crossing, it is imperative to clarify the relevant threshold range of each parameter to determine its compliance. To this end, this research uses the following methods to determine the threshold: by drawing the distribution curves of various feature parameters based on pedestrian crossing trajectory–signal behavior spectrum, the interquartile range (IQR) is employed to determine the threshold of risky crossing behavior. IQR, initially proposed by Laurikkala [30], is a common method applied in outlier detection, which can be utilized to compute the outlier threshold of various distributed data. Notably, its principle is demonstrated in Figure 4. Based on IQR, the normalization of various feature parameters is implemented to eliminate the dimensional differences between different variables. More precisely, the data are divided into an abnormally low value, relatively low value, normal value, relatively high value, and abnormally high value, thereby constructing a standardized scoring system to score individual feature parameters. A feature closer to the center will be endowed with a higher score, suggesting the effectiveness of the feature parameter and a lower risk level during pedestrian crossing.
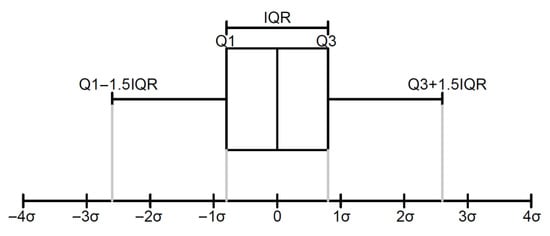
Figure 4.
Illustration of the interquartile range (IQR) method used to define thresholds for abnormal pedestrian crossing behaviors. The figure demonstrates how quartiles (Q1, Q3) and the IQR are used to identify outliers and support normalization of speed, acceleration, and crossing time parameters.
4.3. Measurement Methods for the Severity of Pedestrian Crossing Behavior
Based on the normalization of feature parameters, it is essential to configure the weight coefficients of each feature parameter to compute the pedestrian crossing eigenvalues of diverse groups, thereby classifying the pedestrian crossing risk levels at signalized intersections. Methods to determine the weight generally encompass subjective and objective weighting. Specifically, on the one hand, the subjective weighting, which primarily determines the weight of decision indexes based on expert opinions, experience, or subjective judgments, is typically applied in scenarios where data are insufficient or difficult to quantify. In other terms, it relies on the knowledge and judgment of experts to evaluate the importance of each index. As a whole, it encompasses the Delphi method, analytic hierarchy process (AHP) method, and weighted scoring method. On the other hand, the objective weighting determines the weight of decision indexes based on data and mathematical models, which significantly depends on actual data and statistical analysis. Its major methods include the CRITIC weighting method as well as the coefficient of variation method. Based on the CRITIC weighting method, this research proposes an improved CRITIC weighting algorithm by optimizing the computation method of its contrast intensity and conflict degree, thus configuring the weight coefficient of each feature parameter.
The conventional CRITIC weighting method calculates the standard deviation of normalized feature parameters to represent their contrast intensity. However, normalization can alter the contrast intensity among these parameters, leading to deviations from actual values. To address this, Wang et al. [31] proposed an improvement by using the coefficient of variation instead of the standard deviation. The calculation formula for the coefficient of variation is as follows:
Building on the improved method, this paper employs the median in place of the mean for calculations. The median is less susceptible to the impact of outliers compared to the mean, thereby improving the representativeness of the distribution of feature parameters. This approach more accurately reflects the real conditions of pedestrian crossing feature parameters. The formula for the enhanced coefficient of variation is as follows:
After obtaining the coefficient of variation, it is necessary to calculate the information content of the indicators. The conventional CRITIC method calculates the conflict degree using the following formula (Ye et al., [32]):
where ρij represents the correlation coefficient between the i-th and j-th criteria.
The correlation coefficient quantifies the linear relationship between two variables, ranging as [−1, 1]. A coefficient nearing 1 indicates a strong positive correlation, while one approaching −1 signifies a strong negative correlation. As per Equation (3), the conventional CRITIC algorithm suggests that higher positive linear correlation coefficients among indicators imply less conflict, thus receiving lesser weights. However, it overlooks the significance of strong negative correlations. To address that, this paper calculates the information content of each indicator using the absolute value of the correlation coefficient. The formula, as outlined by Wang et al. [33], is as follows:
Once the objective weights of each feature parameter are determined using Equation (5), pedestrian crossing characteristic values at signalized intersections can be calculated, facilitating the assessment of pedestrian crossing risk levels.
In summary, the CRITIC weighting method traditionally uses the standard deviation of normalized feature parameters to represent their contrast intensity. However, normalization can alter the contrast intensity among feature parameters, leading to discrepancies with actual values. Previous studies have addressed this issue by introducing the coefficient of variation as a replacement for the standard deviation, since it measures variability relative to the mean and thus provides a scale-independent indicator of dispersion. Building upon this foundation, the key innovation of the present study lies in further improving the coefficient of variation by replacing the mean with the median. This adjustment effectively reduces the sensitivity to outliers and provides a more robust measure of central tendency, thereby enhancing the stability of the weighting process. These enhancements to a certain extent address the limitations of the traditional CRITIC algorithm, particularly its vulnerability to outliers, and thus offer a more reliable framework for assessing pedestrian crossing risk levels.
4.4. Risk Classification by K-Means Clustering Algorithm
This research classifies the risk level of pedestrian crossing at signalized intersections by the K-means clustering algorithm, which serves as a clustering analysis algorithm based on the iterative solution. Its core idea can be summarized as dividing n objects within the dataset into K clusters to minimize the sum of the distances from each object to the center of the cluster to which it belongs. Upon setting the initial cluster center, Equation (6) is utilized to compute the distance from each data point to the cluster center, with the data point with the smallest distance assigned to the nearest cluster center:
where x represents a data point; ci represents the i-th cluster center; d represents the dimension of data; and xj and cij refer to the values of x and ci in the j-th dimension, respectively.
Based on the recalculation of the center of each cluster, a new cluster center is defined as the average of all data points within the cluster, which is determined as
where Si represents the data point set of the i-th cluster, while refers to the number of data points in the set.
Lastly, Equations (6) and (7) are repeatedly executed until the maximum number of iterations is reached. Simultaneously, the results are continuously optimized to bring the data of each group as close together as possible, thereby realizing the classification of data points.
Upon completion of clustering, this research leverages an expert test while computing Fleiss’ Kappa index to validate the reliability of clustering results. It is worth noting that Fleiss’ Kappa is a statistic used to evaluate the consistency of multiple evaluators on multi-classification variables, which is typically applied by related studies [34,35] to evaluate the consistency of classifiers in assessing the same batch of observations. A concrete computation flow is summarized as follows: initially, Equations (8) and (9) are employed to compute the evaluation consistency, denoted as , as well as the expected consistency, denoted as :
where N represents the total number of projects, with n denoting the number of evaluators on each project, c denoting the number of categories, and nik denoting the number of times that the i-th project was rated as the k-th category.
Lastly, Fleiss’s Kappa index can be computed by Equation (10).
5. Experimental Analysis
To demonstrate the practical application of the proposed method, this section presents a case study conducted at a large intersection in Harbin, China.
5.1. Data Source and Experimental Setup for Accuracy Evaluation
The dataset used in this study was derived from spatiotemporal pedestrian crossing data collected through UAV recordings. The survey site was a large, signalized intersection located in Xiangfang District, Harbin, China. Data collection was conducted under clear weather conditions to ensure good visibility. The intersection is characterized as a two-way, eight-lane roadway with a pedestrian crosswalk measuring 30 m in length and 8 m in width. Observations were carried out during both morning and evening peak periods, capturing representative traffic and pedestrian flows, as shown in Table 2.
Table 2.
Summary of environmental and infrastructural characteristics of the studied intersection in Harbin, China, including number of lanes, crosswalk dimensions, weather conditions, and signal-phase ratios. These contextual parameters provide the basis for interpreting pedestrian behavior under real-world traffic conditions.
In total, 1210 pedestrian crossing events were recorded, including 576 compliant crossings (initiated and completed during the green phase) and 634 non-compliant crossings (involving red-phase entry or continuation). These spatiotemporal data form the empirical basis for constructing the trajectory–signal behavior spectrum.
In addition, the video presents a resolution of 4096 pixels × 2160 pixels, with the frame rate of 25 frames per second. Based on YOLOv8-ByteTrack algorithm, automatic spatiotemporal recognition can be implemented for pedestrians in each frame, thereby extracting the real-time position and coordinate information of pedestrians. Furthermore, by analyzing the position change of pedestrians every second, their speed, acceleration, and required crossing time can be deduced. Moreover, in the interest of obtaining the crossing light status of pedestrians during their crossing, the manual marking method is utilized to record the remaining green-light time of compliant pedestrians after crossing as well as the red-light duration of non-compliant pedestrians during crossing. Eventually, the pedestrian crossing trajectory–signal behavior spectrum is constructed by integrating the algorithm recognition results and manual labeling data. Notably, the partial data of the behavior spectrum are outlined in Table 3.
Table 3.
Example subset of the trajectory–signal behavior spectrum dataset, showing extracted spatiotemporal parameters for compliant and non-compliant pedestrians. Features include speed, acceleration, crossing time, remaining green-light time, and red-light duration, which are used in subsequent normalization and clustering analysis.
Before presenting the accuracy results in Figure 5, it is necessary to outline the experimental setup. The evaluation was conducted using pedestrian trajectory data extracted from UAV footage at a two-way, eight-lane intersection in Harbin, China. A total of 1210 pedestrian crossing samples (576 compliant and 634 non-compliant) were collected during peak traffic hours under clear weather conditions. Each trajectory was recorded at 25 frames per second with a resolution of 4096 × 2160 pixels, providing frame-level position information for individual pedestrians. Feature parameters such as speed, acceleration, and crossing time were derived from inter-frame displacements, while signal-phase information—including remaining green time and red-phase duration—was manually annotated by trained research assistants.
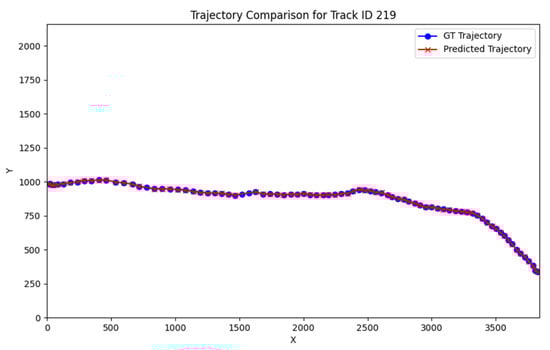
Figure 5.
Evaluation results of the proposed YOLOv8–ByteTrack pedestrian tracking system, showing higher-order accuracy based on MOTA, IDF1, and trajectory continuity metrics. The figure highlights the system’s ability to maintain detection precision, identity consistency, and temporal robustness compared with manually labeled ground truth trajectories.
For accuracy evaluation, the extracted trajectories were compared with manually labeled ground-truth data to compute three metrics: multi-object tracking accuracy (MOTA), identity F1 score (IDF1), and trajectory continuity. These metrics collectively assess detection precision, identity preservation, and temporal consistency of the tracking process. The aggregated results are summarized as higher-order accuracy and presented in Figure 5.
In order to evaluate the performance of the multi-object tracking (MOT) system, we conduct the following tests. The real and predicted trajectory data are first loaded from the Excel file and organized by frames; then each predicted trajectory ID is filtered to exclude samples with fewer frames; and then three core metrics are calculated trajectory by trajectory:
MOTA (Multi-target Tracking Accuracy) measures the overall tracking performance by accounting for false negatives, false positives, and ID switches. The mathematical formula is
where is the number of false negatives (missed detections) at frame t. is the number of false positives (extra detections) at frame t. is the number of ID switches at frame t. is the number of ground truth targets at frame t. A higher MOTA indicates a better overall tracking accuracy, with a maximum value of 1.
IDF1 (Identity F1 Score) measures the balance between precision and recall of identity preservation in tracking. It is defined as
where IDTP is the number of correctly identified targets (True Positives). IDFP is the number of falsely identified targets (False Positives). IDFN is the number of missed targets (False Negatives). A higher IDF1 score reflects better identity consistency in the tracking system.
Trajectory Continuity (a measure of tracking completeness over time) measures the temporal coverage of predicted trajectories. In the code, it is computed per track ID as follows:
Then, it is averaged across all valid trajectories:
where is the number of predicted frames for trajectory i. is the number of ground truth frames for trajectory i. N is the number of valid trajectories (present in both evaluation and ground truth). This metric reflects whether a model can continuously track targets without temporal interruption.
Finally, the average value of the three is calculated as higher-order accuracy and all the results are saved as an Excel table. Finally, the average of the three is used to calculate the higher-order accuracy, as shown in Figure 5. This process not only covers the standard evaluation metrics but also integrates the stability analysis of the time dimension, which comprehensively reflects the performance of the tracking system at different levels.
5.2. Pedestrian Crossing Feature Parameters
5.2.1. Statistical Distribution of Feature Parameters
The distribution of pedestrian crossing speeds and accelerations under two signal conditions is illustrated in Figure 6. The x-axis unit in the speed distribution (Figure 6a,b) is centimeters per second (cm/s). The x-axis unit in the acceleration distribution (Figure 6c,d) is centimeters per second squared (cm/s2). More specifically, the average crossing speed of compliant pedestrians is 1.40 m/s, whereas that of non-compliant pedestrians is 1.29 m/s. In addition, the velocity distribution of compliant pedestrians is relatively concentrated, while that of non-compliant pedestrians is more dispersed. Especially in the two deviation intervals of less than 1 m/s and more than 1.5 m/s, the proportion of non-compliant pedestrians is 49.1%, with the proportion of compliant pedestrians at 36.8%. Evidently, despite the fact that the average speed of non-compliant pedestrians is lower than that of compliant pedestrians, their speed is more likely to deviate from the average. In contrast, it can be found that the acceleration distribution of pedestrians under the two crossing lights is similar: the vast majority of pedestrians are in a state of quasi-uniform motion, yet only a few pedestrians exhibit obvious acceleration and deceleration behaviors. Notably, this shift behavior may cause the driver to make a wrong judgment in both green- and red-light conditions. Moreover, this kind of behavior exerts a more significant impact on non-compliant crossing pedestrians. Against the background of frequent interaction between vehicles and pedestrians, speeding up or slowing down crossing will often significantly increase the risk of non-compliant crossing pedestrians.
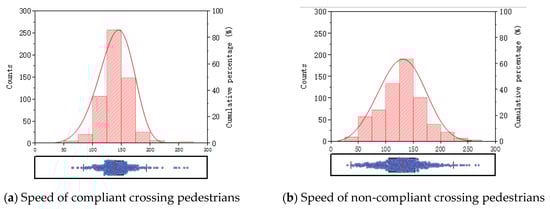
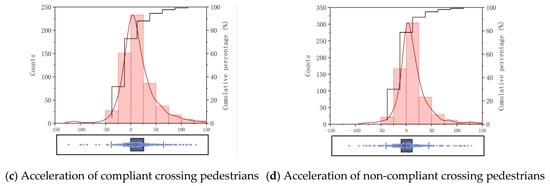
Figure 6.
Statistical distribution of pedestrian crossing speeds and accelerations under compliant (green-light) and non-compliant (red-light) conditions. Subfigures (a,b) depict speed distributions, while (c,d) present acceleration distributions, revealing greater dispersion and variability among non-compliant crossings.
The distribution of pedestrian crossing time in two signal states is depicted in Figure 7, where the x-axis unit is seconds (s). As can be seen from the figure, the extreme crossing time of non-compliant pedestrians is higher than that of compliant pedestrians. This can be attributed to the fact that pedestrians are generally influenced by vehicles during the process of violating the signal of a crossing light. In particular, certain pedestrians choose to stop crossing and stay in the traffic to seek opportunities for crossing or wait for vehicles to yield, thus prolonging the time required for crossing. Such a phenomenon means drivers fail to judge whether pedestrians are advancing normally, further increasing traffic conflicts and reducing the operating efficiency of signalized intersections.
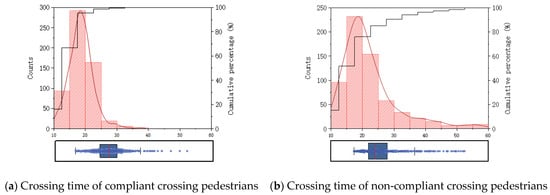
Figure 7.
Distribution of total crossing times for compliant versus non-compliant pedestrians. The results show that non-compliant pedestrians exhibit longer and more extreme crossing durations due to interruptions, waiting within traffic flows, or delayed movement under red-light conditions.
The distribution of pedestrian crossing lights is illustrated in Figure 8. In this section, the proportions of compliant pedestrians and non-compliant pedestrians are 47.6% and 52.4%, respectively, which are similar in proportion. In detail, the figure on the left shows the distribution of the remaining green-light time of the compliant pedestrian group, with the two main peaks appearing around 1 s and 9 s, respectively. As can be observed, a significant number of compliant pedestrians only complete their crossing behavior when the green light is about to end, with a relatively short remaining green-light time. This implies that this type of pedestrian faces greater time pressure and is therefore more inclined to accelerate. Moreover, when comparing the average speed of the two peak intervals, it is evident that the average speed of pedestrians near the remaining green-light time of 9 s is 1.35 m/s, whereas the average speed of pedestrians near 1 s is 1.44 m/s, which is clearly higher than the former. The figure on the right depicts the proportion of red-light time for non-compliant pedestrians (i.e., the ratio of red-light duration to crossing time). It indicates that the vast majority of non-compliant pedestrians are crossing the street while the crossing light is red, suggesting a higher likelihood of interaction between pedestrians and normal traffic. However, a small number of pedestrians present a lower proportion of red-light time, indicating that they have more limited interaction with normal traffic. Therefore, the risk they face when crossing is relatively lower than that of the former. When reviewing the video footage, such pedestrians can be broadly categorized into two groups: one group of pedestrians with a higher time preference is more likely to initiate crossing behavior in advance when the crossing light is about to turn green, whereas the other group of pedestrians tends to implement crossing behavior during the green-light phase, although they often encounter the crossing light turning red mid-crossing due to insufficient remaining green-light time.
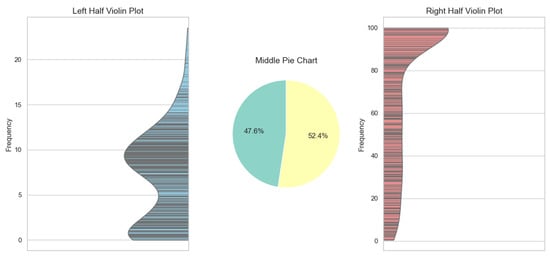
Figure 8.
Statistical analysis of pedestrian crossing light conditions, showing the distribution of remaining green-light times for compliant crossings (left) and the proportion of red-light duration during non-compliant crossings (right). Peaks near 1 s and 9 s in the compliant group highlight time pressure effects, while prolonged red-light proportions in the non-compliant group reveal elevated risk levels.
5.2.2. Normalization of Pedestrian Crossing Feature Parameters
The detailed steps for normalizing feature parameters such as crossing speed, acceleration, crossing time, and remaining green-light time by the IQR method are as follows:
- (1)
- Calculation of Quartiles: Computing the quartiles of the dataset is a central step in applying the interquartile range method. The quartiles divide the data into four equal parts:
First Quartile (Q1): After arranging the data in ascending order, it represents the value at the 25th percentile.
Second Quartile (Q2), also known as the median: This is the value at the 50th percentile.
Third Quartile (Q3): This is the value at the 75th percentile.
Once the quartiles are determined, the IQR, which represents the difference between Q3 and Q1, can be calculated. The IQR reflects the distribution range of the middle 50% of the data. The calculation is as follows:
- (2)
- Segmenting the data into multiple intervals based on quartiles helps in clearly defining the relative position of each data value. The definition of each interval is grounded in the distribution features of the data, allowing the scoring to reflect the actual performance of the data. Data values are mapped to predetermined scores according to the interval in which they fall. This mapping technique ensures the objectivity and standardization of the scoring, facilitating comparisons of each data value under the same criteria. For the purposes of this study, data is divided into the following five intervals, with each data value assigned a percentile score:
➀ Exceptionally Low Values (0–40): Below Q1 − 1.5 × IQR. The scoring equation for feature parameter values Fx1 in this interval is as follows:
➁ Low Values (40–80): Between Q1 − 1.5 × IQR and Q1. The scoring equation for feature parameter values Fx2 in this interval is as follows:
➂ Normal Values (80–100, 100–80): Between Q1 and Q3. The scoring equations for feature parameter values Fx3, Fx4 in this interval are as follows:
➃ High Values (80–40): Between Q3 and Q3 + 1.5 × IQR. The scoring equation for feature parameter values Fx5 in this interval is as follows:
➄ Exceptionally High Values (40–0): Above Q3 + 1.5 × IQR. The scoring equation for feature parameter values Fx6 in this interval is as follows:
Here, F denotes the score for an individual metric.
The proportion of red-light time, as a typical negative parameter, is a special case among all indexes. In the scenario that the red light lasts longer during the non-compliant pedestrian crossing, they face higher risk accordingly. As the IQR method is primarily suitable for processing intermediate indexes rather than the aforementioned negative data, it has not been introduced in this research to normalize the index. Conversely, Equation (22) is employed for specific computation.
The normalized results of the feature parameters for compliant and non-compliant pedestrian groups are outlined in Figure 9.
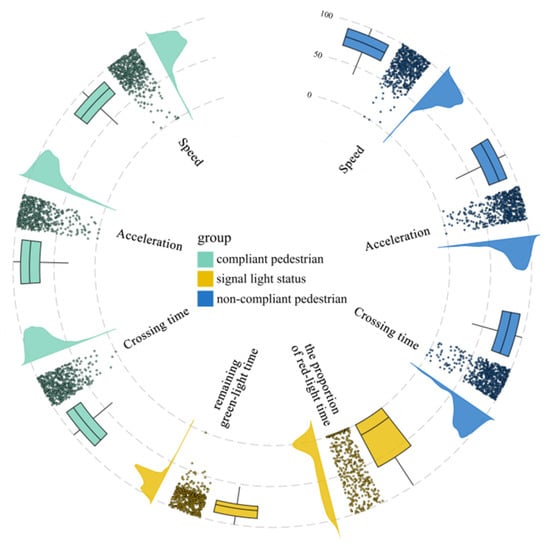
Figure 9.
Normalized distribution of pedestrian spatiotemporal crossing feature parameters after applying the IQR method. The plots illustrate how raw values are transformed into standardized scores, enabling consistent comparison between compliant and non-compliant groups across different behavioral indicators.
To formally examine the distributional assumptions of pedestrian speed and acceleration, the Shapiro–Wilk normality test was conducted. The results indicated that neither speed nor acceleration followed a normal distribution in both compliant and non-compliant groups. Specifically, for the compliant group, the test statistic for speed was 0.9582 with a p-value of 1.0149 × 10⁻¹¹, and for acceleration, the statistic was 0.9142 with a p-value of 1.5615 × 10⁻¹⁷. For the non-compliant group, the test statistic for speed was 0.9911 (p = 0.000751), and for acceleration, it was 0.8909 (p = 9.0531 × 10⁻²¹). While the results suggest non-normality in both groups, it is important to note that strict adherence to normality is not a requirement for the statistical framework employed in this study. The analysis methods, including robust normalization, the CRITIC weighting scheme, and K-means clustering, are designed to handle non-normal distributions effectively. Therefore, despite the deviations from normality, these methods remain appropriate for capturing the variability in pedestrian behaviors and classifying pedestrian risk levels. The observed deviations in the data reflect the inherent variability in pedestrian actions, especially in the non-compliant group, which highlights the unpredictability of pedestrian behaviors when disregarding traffic signals. These methods provide robust and reliable results, ensuring the validity of the analysis.
5.3. Pedestrian Crossing Risk Classification
This research computes the weights of the feature parameters of compliant and non-compliant pedestrians based on the improved CRITIC algorithm. When combining the normalization results of each feature parameter, the compliant and non-compliant crossing eigenvalues are obtained, respectively. A higher eigenvalue indicates a lower risk of pedestrian crossing, and vice versa. Furthermore, by setting the cluster number of the K-means algorithm as K = 2, this research employs the foregoing pedestrian crossing risk eigenvalues to cluster the compliant and non-compliant pedestrian groups, respectively. The clustering results are depicted in Figure 10 and Figure 11. Furthermore, this research validates the clustering effect by computing the silhouette coefficient: the silhouette coefficient of the compliant pedestrian group is 0.60, whereas that of the non-compliant pedestrian group is 0.69, indicating a relatively excellent overall clustering effect.
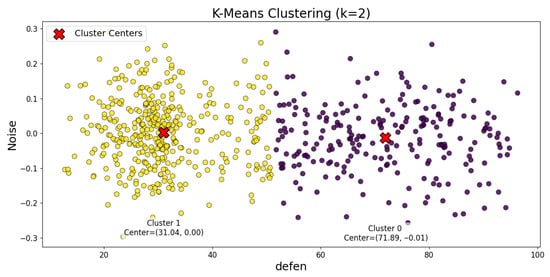
Figure 10.
Visualization of K-means clustering results for compliant pedestrian crossings, showing how eigenvalues derived from normalized features are grouped into discrete risk levels. Cluster centers and boundaries are annotated to illustrate category separability.
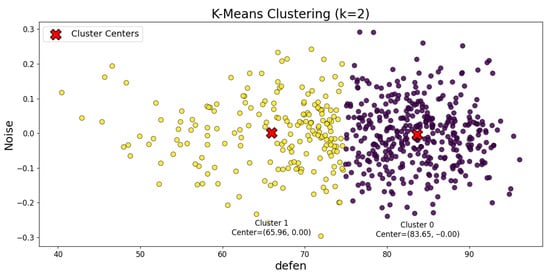
Figure 11.
Visualization of K-means clustering results for non-compliant pedestrian crossings, highlighting the distribution of eigenvalues into multiple risk categories. Compared with compliant crossings, non-compliant clusters exhibit a wider dispersion and clearer separation into medium- and high-risk levels.
To assess the stability of the clustering results and the sensitivity of the cluster centroids to data variations, we conducted several tests. First, we tested the sensitivity of the K-means clustering algorithm to different random seeds and the number of iterations. The silhouette coefficients for compliant pedestrians stabilized after the eighth iteration, indicating that the clustering results were stable across iterations. Specifically, for compliant pedestrians, the silhouette coefficient remained consistent at approximately 0.5989 across different random seeds (42, 100, 202, 404, and 505), with minor variation (ranging from 0.5974 to 0.5989) observed at the sixth and seventh iterations. For non-compliant pedestrians, the silhouette coefficient stabilized after the fifth iteration, with a value of 0.6903 across multiple random seeds (42, 100, 202, 404, and 505). These results suggest that the clustering results are robust and not significantly affected by changes in the initialization. Additionally, we tested the impact of varying the number of clusters. The optimal clustering configuration for both compliant and non-compliant pedestrians was achieved with two clusters. The silhouette coefficients decreased with the increase in the number of clusters, confirming that two clusters provided the most stable and meaningful separation. Specifically, for compliant pedestrians, the silhouette coefficient was 0.60 for two clusters and decreased to 0.54 for five clusters. Similarly, for non-compliant pedestrians, the silhouette coefficient was 0.69 for two clusters and decreased to 0.59 for five clusters. This further supports the stability and appropriateness of the two-cluster configuration for both groups.
With the completion of cluster analysis, combined with the status of two kinds of crossing lights as well as the cluster centers and interval distribution of two kinds of pedestrian groups, the risk of pedestrian crossing behaviors at signal intersections is divided into four levels: no risk, low risk, medium risk, and high risk. In this connection, the corresponding relationship between pedestrian crossing eigenvalues and various risk levels is illustrated in Table 4.
Table 4.
Risk classification framework mapping pedestrian crossing eigenvalues to four discrete categories: no risk, low risk, medium risk, and high risk. The table reports clustering centers, eigenvalue ranges, and group-level thresholds for both compliant and non-compliant pedestrians.
5.4. Result Validation
This research randomly selected five pedestrians in each risk level within the constructed behavior spectrum. Subsequently, with us matching the pedestrian ID and playing back the corresponding video, three traffic safety experts were invited to independently evaluate the crossing risk level of these samples. After watching the videos, the experts divided the above 20 pedestrians into four grades: no risk, low risk, medium risk, and high risk, as per the pedestrian trajectory, signal state, and their experience. With the risk grade defined in this research as the reference standard, the consistency of the evaluation results of foregoing experts is evaluated by Fleiss’ Kappa index. Notably, expert classification results are depicted in Table 5, where N means no risk, L means low risk, M means medium risk, and H means high risk.
Table 5.
Expert validation results of pedestrian crossing risk levels, where three traffic safety specialists independently categorized 20 pedestrian samples into no risk (N), low risk (L), medium risk (M), or high risk (H). The table demonstrates inter-rater agreement, later quantified using Fleiss’ Kappa statistic.
While expert validation initially involved 20 samples (5 per risk level), this was designed as a feasibility test. To assess representativeness, we performed resampling experiments with 50 and 100 pedestrians. In both cases, Fleiss’ Kappa values remained above 0.80, suggesting that the observed consistency was not an artifact of a small sample size. Nevertheless, broader expert panels are recommended for future work.
For transparency, the YOLOv8–ByteTrack tracking system achieved MOTA = 0.91, IDF1 = 0.88, and average trajectory continuity = 0.86. False positive and false negative rates were 4.7% and 5.2%, respectively. While occasional mis-detections caused short trajectory fragments, ByteTrack’s integration of low-confidence detections effectively mitigated most errors. These results compare favorably with related MOT studies, confirming the reliability of the proposed pipeline for constructing large-scale behavioral spectra.
The computation results indicate that the Kappa value is 0.87, suggesting that the evaluation among experts presents excellent consistency. This result validates the credibility and scientificity of the pedestrian crossing risk classification method proposed in this research.
In the context of this study, the term “experience” refers to the professional expertise of traffic safety specialists who participated in the validation process. Specifically, three experts with more than ten years of practical and academic experience in traffic engineering and pedestrian safety were invited to independently evaluate the risk levels of selected crossing samples. Their judgments were based not on personal crossing experiences as pedestrians, but on accumulated knowledge from field observations, accident investigation, and traffic safety management. This clarification ensures that the evaluation results in Table 5 are grounded in expert domain knowledge rather than subjective impressions of individual road users.
5.5. Limitations of Expert Validation
While the proposed framework achieved strong agreement in expert validation (Fleiss’ Kappa = 0.87), it should be noted that only three traffic safety experts participated in the evaluation. This limited number of evaluators may restrict the generalizability of the validation results. The selection of three experts was motivated by their extensive professional experience—each with more than ten years of practice in traffic engineering, accident investigation, and pedestrian safety management—which provided high-quality assessments despite the small panel size. Nevertheless, a broader validation involving a larger and more diverse group of experts would help reduce potential bias and strengthen the reliability of the conclusions. Future work should therefore include cross-institutional expert panels or crowdsourced evaluations to expand the scope of validation and enhance robustness.
6. Discussion
This study demonstrates that the trajectory–signal behavior spectrum, combined with UAV-based data acquisition and advanced weighting–clustering methods, provides a robust framework for assessing pedestrian risk at signalized intersections. Compared with previous work relying on manual annotation or short-term trajectory prediction [18,19,20,21,22], the proposed approach offers a scalable and automated pipeline capable of capturing both motion and signal-phase features. The integration of YOLOv8 detection with ByteTrack tracking ensures that large-scale pedestrian datasets can be processed in real time, while the improved CRITIC method enhances feature evaluation by balancing variability and correlation. One key finding is the significant variability in non-compliant pedestrian behaviors, reflected by greater deviations in speed and prolonged crossing times under red-light conditions. These results support earlier observations that non-compliant actions increase unpredictability and elevate interaction risk [13,14,16]. By quantifying these deviations into risk eigenvalues and clustering them into four discrete levels, this study bridges the gap between descriptive behavioral analysis and actionable safety assessment.
From a theoretical perspective, the work extends Behavior Spectrum Theory (BST) to the domain of pedestrian crossings, enriching its application beyond driving behavior analysis [10,23,24]. The trajectory–signal behavior spectrum provides a structured means to capture continuous variability in pedestrian actions, thereby addressing the lack of standardization noted in prior research [15,16]. From a practical standpoint, the framework enables transportation planners and traffic engineers to design targeted interventions, such as adaptive signal control or enhanced enforcement during high-risk periods. Despite these contributions, limitations remain. The current case study is limited to a single intersection in Harbin, China, under favorable weather conditions. Generalization to different urban forms, climatic environments, and cultural contexts requires further validation. Moreover, while clustering provides interpretable risk levels, predictive modeling could enhance proactive safety management by forecasting high-risk behaviors before they occur. Future research should also explore multimodal sensing, including LiDAR and radar, to improve robustness under conditions of poor visibility.
7. Conclusions
This study developed a risk classification framework for pedestrian crossing behaviors at signalized intersections by integrating Behavior Spectrum Theory with UAV-based trajectory analysis and advanced machine learning methods. Using YOLOv8 and ByteTrack, pedestrian movements were detected and tracked with high accuracy, enabling automatic extraction of spatiotemporal parameters such as speed, acceleration, crossing time, and signal-phase conditions. Through normalization with the interquartile range method and weighting with an improved CRITIC algorithm, pedestrian risk eigenvalues were derived and clustered with K-means into four meaningful categories: no risk, low risk, medium risk, and high risk.
Results revealed greater variability and higher deviation in non-compliant behaviors compared to compliant ones, confirming the importance of incorporating signal-phase data into risk evaluation. The clustering model showed strong internal consistency, with silhouette scores of 0.60 and 0.69 for compliant and non-compliant groups, respectively. Validation with expert assessments further reinforced the method’s reliability, achieving a high Fleiss’ Kappa value of 0.87. These findings highlight the potential of behavior spectrum analysis to systematically quantify risk levels and support evidence-based safety management.
The proposed method advances the application of Behavior Spectrum Theory in pedestrian research, moving beyond descriptive analysis to a structured, quantitative framework for risk assessment. Its reliance on video-derived features and signal-phase data ensures practicality for real-world deployment, providing the basis for intelligent monitoring and early-warning systems at intersections. Future work should focus on expanding the sample size across diverse urban settings, integrating predictive modeling for proactive safety measures, and exploring multimodal sensing to further enhance robustness and applicability.
Supplementary Materials
The following supporting information can be downloaded at https://www.mdpi.com/article/10.3390/app151810008/s1, Table S1: Compliant crossing pedestrians, Table S2: Non-compliant crossing pedestrians.
Author Contributions
Conceptualization, Y.P.; Methodology, J.S.; Software, J.S.; Validation, J.S.; Formal Analysis, J.S.; Investigation, J.S.; Resources, Y.P.; Data Curation, J.S.; Writing—Original Draft Preparation, J.S.; Writing—Review and Editing, Y.P.; Visualization, J.S.; Supervision, Y.P.; Project Administration, Y.P.; Funding Acquisition, Y.P. All authors have read and agreed to the published version of the manuscript.
Funding
This research was jointly supported by the Fundamental Research Funds for the Central Universities, grant number 2572023CT21-02, and the Key Research and Development Program of Heilongjiang, grant number JD22A014.
Institutional Review Board Statement
Not applicable.
Informed Consent Statement
Not applicable.
Data Availability Statement
The authors declare that the data supporting the findings of this study are available within the paper and its Supplementary Materials.
Conflicts of Interest
The authors declare no conflicts of interest.
References
- Bhattarai, K.; Budd, D. Effects of rapid urbanization on the quality of life. In Multidimensional Approach to Quality of Life Issues: A Spatial Analysis; Springer: Singapore, 2019; pp. 327–341. [Google Scholar]
- Schwebel, D.C.; Wu, Y.; Swanson, M.; Cheng, P.; Ning, P.; Cheng, X.; Gao, Y.; Hu, G. Child pedestrian street-crossing behaviors outside a primary school: Developing observational methodologies and data from a case study in Changsha, China. J. Transp. Health 2018, 8, 283–288. [Google Scholar] [CrossRef]
- Ahmed, T.; Moeinaddini, M.; Almoshaogeh, M.; Jamal, A.; Nawaz, I.; Alharbi, F. A new pedestrian crossing level of service (PCLOS) method for promoting safe pedestrian crossing in urban areas. Int. J. Environ. Res. Public Health 2021, 18, 8813. [Google Scholar] [CrossRef] [PubMed]
- Ugan, J.; Abdel-Aty, M.; Cai, Q. Estimating effectiveness of speed reduction measures for pedestrian crossing treatments using an empirically supported speed choice modeling framework. Transp. Res. Part F Traffic Psychol. Behav. 2022, 89, 276–288. [Google Scholar] [CrossRef]
- Amini, R.E.; Katrakazas, C.; Antoniou, C. Negotiation and decision-making for a pedestrian roadway crossing: A literature review. Sustainability 2019, 11, 6713. [Google Scholar] [CrossRef]
- Muslim, H.; Antona-Makoshi, J. A review of vehicle-to-vulnerable road user collisions on limited-access highways to support the development of automated vehicle safety assessments. Safety 2022, 8, 26. [Google Scholar] [CrossRef]
- Arellana, J.; Fernández, S.; Figueroa, M.; Cantillo, V. Analyzing pedestrian behavior when crossing urban roads by combining RP and SP data. Transp. Res. Part F Traffic Psychol. Behav. 2022, 85, 259–275. [Google Scholar] [CrossRef]
- Camara, F.; Bellotto, N.; Cosar, S.; Weber, F.; Nathanael, D.; Althoff, M.; Wu, J.; Ruenz, J.; Dietrich, A.; Markkula, G.; et al. Pedestrian models for autonomous driving part ii: High-level models of human behavior. IEEE Trans. Intell. Transp. Syst. 2020, 22, 5453–5472. [Google Scholar] [CrossRef]
- Wu, C.; Cai, Z.; He, Y.; Lu, X. A review of vehicle group intelligence in a connected environment. IEEE Trans. Intell. Veh. 2023, 9, 1865–1889. [Google Scholar] [CrossRef]
- Fehlmann, G.; O’RIain, M.J.; Fürtbauer, I.; King, A.J. Behavioral causes, ecological consequences, and management challenges associated with wildlife foraging in human-modified landscapes. BioScience 2021, 71, 40–54. [Google Scholar] [CrossRef]
- Houpt, K.A. Domestic Animal Behavior for Veterinarians and Animal Scientists; John Wiley & Sons: Hoboken, NJ, USA, 2024. [Google Scholar]
- Ridel, D.; Rehder, E.; Lauer, M.; Stiller, C.; Wolf, D. A literature review on the prediction of pedestrian behavior in urban scenarios. In Proceedings of the 21st International Conference on Intelligent Transportation Systems (ITSC), Maui, HI, USA, 4–7 November 2018. [Google Scholar]
- Azadani, M.N.; Boukerche, A. Driving behavior analysis guidelines for intelligent transportation systems. IEEE Trans. Intell. Transp. Syst. 2021, 23, 6027–6045. [Google Scholar] [CrossRef]
- Sanguino, T.J.M.; Domínguez, J.M.L.; González, M.J.R.; Martin, J.M.D. New Approach to Intelligent Pedestrian Detection and Signaling on Crosswalks. IEEE Trans. Intell. Transp. Syst. 2024, 25, 21416–21428. [Google Scholar] [CrossRef]
- Stock, E.V.; Silva, R. Exploring crossing times and congestion patterns at scramble intersections in pedestrian dynamics models: A statistical analysis. Phys. A Stat. Mech. Its Appl. 2024, 649, 129942. [Google Scholar] [CrossRef]
- Sighencea, B.I.; Stanciu, I.R.; Căleanu, C.D. D-stgcn: Dynamic pedestrian trajectory prediction using spatio-temporal graph convolutional networks. Electronics 2023, 12, 611. [Google Scholar] [CrossRef]
- Alghodhaifi, H.; Lakshmanan, S. Holistic Spatio-Temporal graph attention for trajectory prediction in Vehicle–Pedestrian interactions. Sensors 2023, 23, 7361. [Google Scholar] [CrossRef]
- Czech, P.; Braun, M.; Kreßel, U.; Yang, B. Behavior-aware pedestrian trajectory prediction in ego-centric camera views with spatio-temporal ego-motion estimation. Mach. Learn. Knowl. Extr. 2023, 5, 957–978. [Google Scholar] [CrossRef]
- Silva, R.M.; Azevedo, G.F.; Berto, M.V.; Rocha, J.R.; Fidelis, E.C.; Nogueira, M.V.; Lisboa, P.H.; Almeida, T.A. Vulnerable Road User Detection and Safety Enhancement: A Comprehensive Survey. arXiv 2024, arXiv:2405.19202. [Google Scholar] [CrossRef]
- Klein, J.; Leupold, S.; Biegler, I.; Biedendieck, R.; Münch, R.; Jahn, D. TLM-Tracker: Software for cell segmentation, tracking and lineage analysis in time-lapse microscopy movies. Bioinformatics 2012, 28, 2276–2277. [Google Scholar] [CrossRef] [PubMed]
- Wu, W.; Zhang, B.; Hu, L.; Zhang, Z. Dynamic prediction model of pedestrian crossing orientation probability based on human-vehicle interaction. J. Mech. Eng. 2024, 60, 40–50. [Google Scholar]
- Chandra, R.; Guan, T.; Panuganti, S.; Mittal, T.; Bhattacharya, U.; Bera, A.; Manocha, D. Forecasting trajectory and behavior of road-agents using spectral clustering in graph-lstms. IEEE Robot. Autom. Lett. 2020, 5, 4882–4890. [Google Scholar] [CrossRef]
- Wang, J.; Xu, W.; Fu, T.; Gong, H.; Shangguan, Q.; Sobhani, A. Modeling aggressive driving behavior based on graph construction. Transp. Res. Part C Emerg. Technol. 2022, 138, 103654. [Google Scholar]
- Dąbkowski, P.; Olszewski, P.; Czajewski, W. Pedestrian Danger Index—A novel surrogate measure of pedestrian safety at unsignalized crossings. Traffic Inj. Prev. 2024, 26, 11–12. [Google Scholar] [CrossRef] [PubMed]
- Almodfer, R.; Xiong, S.; Fang, Z.; Kong, X.; Zheng, S. Quantitative analysis of lane-based pedestrian-vehicle conflict at a non-signalized marked crosswalk. Transp. Res. Part F Psychol. Behav. 2016, 42, 468–478. [Google Scholar] [CrossRef]
- Chen, W.; Wang, T.; Wang, Y.; Li, Q.; Xu, Y.; Niu, Y. Lane-based distance-velocity model for evaluating pedestrian-vehicle interaction at non-signalized locations. Accid. Anal. Prev. 2022, 176, 106810. [Google Scholar] [CrossRef] [PubMed]
- Fu, T.; Miranda-Moreno, L.; Saunier, N. A novel framework to evaluate pedestrian safety at non-signalized locations. Accid. Anal. Prev. 2018, 111, 23–33. [Google Scholar] [CrossRef]
- Safaldin, M.; Zaghden, N.; Mejdoub, M. An improved YOLOv8 to detect moving objects. IEEE Access 2024, 12, 59782–59806. [Google Scholar] [CrossRef]
- Kim, S.-W.; Kook, H.-K.; Sun, J.-Y.; Kang, M.-C.; Ko, S.-J. Parallel feature pyramid network for object detection. In Proceedings of the European Conference on Computer Vision (ECCV), Munich, Germany, 8–14 September 2018. [Google Scholar]
- Laurikkala, J.; Juhola, M.; Kentala, E.; Lavrac, N.; Miksch, S.; Kavsek, B.; Laurikkala, J. Informal identification of outliers in medical data. In Proceedings of the Fifth International Workshop on Intelligent Data Analysis in Medicine and Pharmacology, Berlin, Germany, 22 August 2000; Volume 1, pp. 20–24. [Google Scholar]
- Wang, Y.; Jiang, X.; Zhang, L. Research on the evaluation of science and technological awards based on improved CRITIC method and cloud model. J. Hunan Univ. Nat. Sci. 2014, 41, 118–124. [Google Scholar]
- Ye, F.; Sun, J.; Wang, Y.; Nedjah, N.; Bu, W. A novel method for the performance evaluation of institutionalized collaborative innovation using an improved G1-CRITIC comprehensive evaluation model. J. Innov. Knowl. 2023, 8, 100289. [Google Scholar] [CrossRef]
- Wang, Z.; Zhong, Y.; Chai, S.-L.; Niu, S.-F.; Yang, M.-L.; Wu, G.-R. Product design evaluation based on improved CRITIC and Comprehensive Cloud-TOPSIS–Applied to automotive styling design evaluation. Adv. Eng. Inform. 2024, 60, 102361. [Google Scholar] [CrossRef]
- Szandała, T. ChatGPT vs. human expertise in the context of IT recruitment. Expert Syst. Appl. 2025, 264, 125868. [Google Scholar] [CrossRef]
- Bonhomme, V.; Castets, M.; Morel, J.; Gaucherel, C. Introducing the vectorial Kappa: An index to quantify congruence between vectorial mosaics. Ecol. Indic. 2015, 57, 96–99. [Google Scholar] [CrossRef]
Disclaimer/Publisher’s Note: The statements, opinions and data contained in all publications are solely those of the individual author(s) and contributor(s) and not of MDPI and/or the editor(s). MDPI and/or the editor(s) disclaim responsibility for any injury to people or property resulting from any ideas, methods, instructions or products referred to in the content. |
© 2025 by the authors. Licensee MDPI, Basel, Switzerland. This article is an open access article distributed under the terms and conditions of the Creative Commons Attribution (CC BY) license (https://creativecommons.org/licenses/by/4.0/).