Article

A Tunnel Secondary Lining Leakage Recognition Model Based on an Improved TransUNet

1
School of Civil Engineering, Central South University, Changsha 410075, China
2
National Engineering Laboratory for Construction Technology of High-Speed Railway, Central South University, Changsha 410075, China
3
Shandong Provincial Communications Planning and Design Institute Group Co., Ltd., Jinan 250101, China
*
Author to whom correspondence should be addressed.
Appl. Sci. 2025, 15(18), 10006; https://doi.org/10.3390/app151810006
Submission received: 14 August 2025 / Revised: 5 September 2025 / Accepted: 10 September 2025 / Published: 12 September 2025
(This article belongs to the Section Civil Engineering)

Abstract

Manual inspection methods traditionally used for tunnel lining leakage suffer from high subjectivity and low efficiency. At the same time, existing detection models do not perform well in terms of accuracy when faced with complex scenarios; this makes it essential to develop an intelligent leakage identification model that can adjust to varying background conditions. This study integrates a Vision Transformer (ViT) into UNet and constructs CBAM-TransUNet by embedding CBAMs into skip connections between the encoder-decoder structure and ViT outputs. Ablation experiments validate the efficacy of the CBAM and the ViT, while Score-CAM heatmaps analyze the model’s attention mechanism toward leakage features. The research results are as follows: (1) CBAM-TransUNet achieves average performance across metrics: 0.8143 (IoU), 0.8433 (Dice), 0.9518 (recall), 0.8482 (precision), 0.9837 (accuracy),0.9746 (AUC), 0.8568 (MCC), and 0.8970 (F1-score). These results indicate that the model performs excellently, even with dent shadows, stain interference, or faint traces. (2) Ablation experiments validate the pivotal roles of the CBAM and the ViT module: the IoU of the baseline model is 6.10% higher than that of the variant without the CBAM and 7.79% higher than that of the variant with both modules removed. (3) Through Score-CAM heatmap analysis, it is observed that the CBAM broadens the model’s attention coverage over leakage regions, strengthens feature continuity, and consequently enhances the model’s anti-interference performance in complex environments. This research could provide valuable reference insights for related fields.

1. Introduction

During the construction of tunnel secondary linings, quality defects, such as vault voids, often occur. As the operation period increases, these initial issues may gradually evolve into various forms of lining damage after the tunnel is put into use [1,2,3,4,5]. Among the various diseases that occur in tunnels, water leakage has a relatively high incidence rate. It accelerates the corrosion process of the lining structure and internal steel bars, reduces the bearing capacity of the tunnel, and ultimately has an adverse impact on operational safety [6,7,8]. Timely detection of water leakage in tunnel linings and implementation of precise treatment measures are crucial in tunnel safety management.
Existing water leakage detection methods mainly rely on onsite manual visual inspection by technical personnel and regular monitoring. Although traditional detection methods are easy to implement, they still have several limitations: poor lighting conditions in tunnels and obstructions on the lining surface, for instance, often interfere with the distinction between leaking areas and occluded areas. In long-term and large-scale inspection work—taking the headrace tunnel of Nepal’s Upper Tamakoshi Hydroelectric Project (UTHP) as an example, with a total length of approximately 7960 m—technicians are required to record geological logs at intervals of 5–15 m. This requirement poses challenges for inspectors in ensuring accuracy [9]. Manual visual inspection relies on the experience of inspectors, which often renders the detection results highly subjective [10,11]. With the continuous expansion of tunnel construction scales and the increasing improvement of monitoring requirements, traditional detection methods are becoming less capable of meeting the accuracy and efficiency requirements of modern detection work. Compared with manual visual inspection, a variety of novel sensors for tunnel water leakage detection have been developed by scholars in recent years [12,13,14]. These sensors, which adopt new materials, such as graphene, and are based on different principles, have ensured high accuracy in tunnel water leakage detection. Additionally, some scholars have used 3D laser scanning to acquire tunnel internal data. Through performing different forms of data processing (e.g., converting 3D point cloud models into 2D formats [15] and using multi-level encoders to generate fused images [16]) and by training and testing classical machine learning models, such as Mask R-CNN [17] and the YOLO series [18], they have also achieved high accuracy [19,20,21].
Recent advancements in deep learning within the field of medical image segmentation have provided a strong impetus for its application in structural defect detection [22,23,24,25,26]. Currently, neural-network-based semantic segmentation methods have been widely applied in the identification of tunnel water leakage. A CNN can effectively integrate multi-level features for object recognition. Relevant studies have indicated that it tends to focus more on local textures rather than global shapes [27,28]. This tendency may compromise detection accuracy in complex tunnel environments. Due to the lack of inductive biases similar to those in a CNN, models based solely on Transformers perform poorly in local feature representation [29]. Under complex circumstances, the majority of current leakage detection models struggle to segment the fine contours of targets effectively, with their capability in this aspect being quite limited.
To address the aforementioned issues, this study integrates a Vision Transformer (ViT) into the UNet architecture and constructs a CBAM-TransUNet model by embedding the CBAM into the skip connections between the encoder-decoder structure and the output layer of the ViT. For model training, a mixed leakage dataset is used, which includes data from both mountain drill-and-blast tunnels and shield tunnels. Ablation experiments and Score-CAM heatmap analysis verify the effectiveness and roles of the CBAM and the ViT module. The tunnel leakage recognition method proposed in this study integrates leakage images of tunnel linings constructed using two common methods during the training phase, thereby enhancing the model’s universality. The integration of the ViT and the embedding of the CBAM enable the model to extract features from lining images more comprehensively. This not only improves the model’s recognition accuracy but also provides methodological references for research on tunnel leakage identification.

2. CBAM-TransUNet Water Leakage Detection Model

This section elaborates on the technique for detecting leakage in tunnel linings. A CBAM is a lightweight attention mechanism module that applies weighting to the global semantic features produced by the ViT with respect to channel and spatial dimensions using two distinct sub-modules, respectively, targeting the channel dimension and spatial dimension of the feature map. These weighted features are then merged in the skip connections between the encoder and the decoder. Therefore, the network architecture consists of three core components: (1) an encoder specialized in water leakage identification with a TransUNet foundation, (2) a decoder dedicated to water leakage identification grounded in TransUNet, and (3) skip connections optimized through the CBAM.

2.1. Overall Architecture of the Water Leakage Identification Model

TransUNet [30], which acts as the core foundational architecture, integrates the advantages of UNet in feature extraction of leakage regions, with the capability of a ViT in positional encoding of global features of tunnel lining images. This dual mechanism enables TransUNet to precisely acquire global contextual information. Three essential elements (encoder, decoder, skip connections) form its architecture, and their specific structures are illustrated in Figure 1. In terms of technical characteristics, a Transformer excels in global feature extraction by virtue of its self-attention mechanism, but essentially, it only possesses unidirectional position-aware capability and fails to take into account multi-dimensional perspectives of local features. The encoder sequentially processes images through downsampling operations, which comprise convolutional blocks and pooling layers, with a focus on capturing local detailed features, such as organ edges, textures, and local structures. Concurrently, it retains multiple sets of intermediate local feature maps at different resolutions. Subsequently, the output low-resolution local feature maps undergo image patch embedding to be segmented into multiple feature units with unified dimensions; this is followed by the integration of positional encoding to preserve the spatial positional relationships among these units. The resulting sequence is then fed into stacked Transformer encoder layers, where the multi-head self-attention mechanism enables the capture of global correlations between feature units. Ultimately, the processed sequence is converted back into a 2D feature map, generating a feature representation that fuses local and global information. This representation is subsequently transmitted to the bottleneck layer. The bottleneck layer further integrates and optimizes the global feature map output by the encoder. It adjusts feature dimensions and enhances effective feature information through operations such as convolution and normalization. The decoder achieves upsampling via transposed convolution to gradually restore the resolution of the feature map. Through skip connections, it concatenates the high-resolution intermediate local feature maps retained during the encoding phase with the upsampled feature maps, effectively supplementing the detailed information lost during downsampling. Feature fusion is then accomplished via convolution operations, and finally, a convolutional layer adjusts the number of channels to match the category count required for the segmentation task. In contrast, the traditional UNet architecture based on a CNN exhibits strong professionalism in local feature extraction, yet it has limitations in the comprehensive capture of fine-grained details. TransUNet, by fusing the technical features of both, effectively compensates for their respective limitations.
To address the aforementioned limitations, this study constructs the TransUNet architecture by integrating ViT layers with the UNet framework. This integration method optimizes the leakage feature maps inside the Transformer module, in turn allowing for more detailed and precise extraction of global features. Additionally, the CBAM embedded in the skip connections optimizes the feature transmission process of the encoder, and this improvement facilitates more precise reconstruction of leakage feature maps during the decoding phase.
Based on this, the CBAM-TransUNet architecture achieves a synergistic effect of the advantages of the Vision Transformer and the UNet framework. By strengthening the capability to handle local and global information, the architecture builds a thorough leakage identification model, which can efficiently extract features from leakage images.

2.2. Convolutional Block Attention Module

A convolutional block attention module (CBAM), proposed by Woo et al. [31] in 2018, is a simple yet effective attention module. A CBAM sequentially infers attention maps along two distinct dimensions (channel and spatial) and then multiplies them with the input. Taking F ∈ RC×H×W as input, a CBAM generates a one-dimensional channel attention map Mc∈RC×1×1 and a two-dimensional spatial attention map Ms∈R1×H×W (Figure 2). The entire process is as follows:
F′ = MC (F) ⊗ F,
F″ = MS (F′) ⊗ F′,
where ⨂ denotes element-wise multiplication. F″ is the final refined output. It mainly consists of two types of attention mechanisms, and the overall structure of a CBAM is illustrated in Figure 2.

2.2.1. Channel Attention Mechanism

Average pooling and max-pooling are used to aggregate the spatial information of the feature map, generating two distinct spatial context descriptors: F a v g c (average-pooled features) and F m a x c (max-pooled features). These descriptors are then input into a shared network, which computes and outputs the channel attention map M c     R C × 1 × 1 . The shared network is a Multi-Layer Perceptron (MLP) containing a single hidden layer. The activation size of the hidden layer is set to R C / r × 1 × 1 , where r is the reduction ratio [31]. In brief, the channel attention is calculated as:
M C ( F )   =   σ ( MLP ( AvgPool ( F ) )   +   MLP ( MaxPool ( F ) ) )   =   σ ( W 1 ( W 0   ( F a v g C ) ) + W 1 ( W 0 ( F m a x C ) ) ) ,
where σ represents the sigmoid function, with W0 ∈ RC/r×C and W1 ∈ RC×C/r.

2.2.2. Spatial Attention Mechanism

Two pooling operations aggregate the feature map’s channel information, generating two 2D maps: F a v g s R C × H × W and F m a x s R 1 × H × W . F a v g s is average-pooled along channels, and F m a x s is max-pooled along channels. The two maps are concatenated, and then a standard convolutional layer performs convolution, yielding the 2D spatial attention map [31]. In brief, the spatial attention is calculated as:
M s ( F )   =   σ   ( f 7 × 7   ( [ AvgPool(F) ;   MaxPool(F) ] ) ) =   σ   ( f 7 × 7   ( [ F a v g S ; F m a x S ] ) ) ,
where σ is the sigmoid function and f7×7 is the convolution operation with a filter size of f7×7.

2.3. Encoder of the Water Leakage Identification Model

The encoder part of the model is mainly made up of ResNet50 [32] and the ViT [33]. Being a standard residual network architecture, ResNet50 realizes hierarchical feature extraction via the sequential stacking of Residual Blocks. Upon input of an image into the model, initial local feature extraction is performed through the first three convolutional layers of ResNet50, followed by deep-level feature processing executed by the ViT module. This sequential processing mechanism ultimately constructs an encoding paradigm characterized by multi-scale local feature extraction via ResNet and global semantic feature extraction via the ViT.
In the encoder of the water leakage identification model, ResNet is decomposed into 4 sub-modules (denoted as encoder1 to encoder4, respectively). Taking a color image with an input size of 512 × 512 pixels as an example, with each sub-module iteration, the original image undergoes size reduction and channel increment. Ultimately, the feature map with a size of 32 × 32 × 1024 (pixels × channels) is transmitted to the ViT module.
The ViT receives high-level features output by ResNet in the encoder and generates globally semantically enhanced features through operations such as patch partitioning, embedding, Transformer encoding, and upsampling. ViT processing includes four steps: First, for the input feature map, ResNet’s output size must match the ViT’s input size, with additional upsampling if mismatched. Second, patch partitioning uses 8 × 8 patches. Third, global semantic enhancement leverages the Transformer’s self-attention to capture long-range dependencies among the 16 patches. Fourth, resolution adaptation adjusts the feature size to narrow the resolution gap with decoder shallow features, facilitating subsequent splicing and fusion.

2.4. Decoder of the Water Leakage Recognition Model

The decoder module of the model is primarily composed of an upsampling layer, a CBAM, and a VGGBlock convolutional block. Specifically, the upsampling layer uses bilinear interpolation with a scaling factor of 2 (scale_factor = 2) to progressively upsample the feature map dimensions; the CBAM serves to suppress redundant channels, while enhancing the representational capacity of key semantic channels; and the VGGBlock convolutional block undertakes the fusion of concatenated multi-scale features and further extraction of local detailed information. Let the four-level feature layers output by the encoder be denoted as x1 (derived from encoder1), x2 (derived from encoder2), x3 (derived from encoder3), and xvit (derived from ViT), respectively. The decoder has five processing steps: First, apply the CBAM to each feature layer for attention enhancement; second, upsample xvit and fuse it with x3 via VGGBlock (Layer 1 Decoding); third, upsample Layer 1’s output and fuse it with x2 using VGGBlock (Layer 2 Decoding); fourth, upsample Layer 2’s output and fuse it with x1 through VGGBlock (Layer 3 Decoding); finally, process the feature with upsampling and convolution via VGGBlock, and then output via the segmentation head.

3. Construction of the Tunnel Water Leakage Dataset

3.1. Collection of Tunnel Water Leakage Images

The water leakage dataset mainly includes field-collected data from the Pingtang Experimental Base of Central South University and the public metro tunnel water leakage dataset (https://data.mendeley.com/datasets/xz2nykszbs/1, accessed on 11 July 2024) [34]. This multi-source data collection method is conducive to obtaining diverse and comprehensive image samples, thereby improving the generalization performance of the model. Figure 3 presents examples of water leakage images and their labeled leakage regions. In the labeled images, the white regions represent the water leakage regions, whereas the black regions serve as the background. The collected water leakage images cover various types, such as point-like leakage, linear leakage, and large-area leakage. Among them, the images of the Pingtang Tunnel have many factors that affect image segmentation, such as blurred edges of water leakage, large-area shadow coverage, uneven lining surfaces, and strong light interference. The images of the metro tunnel are accompanied by interference objects, such as pipes, bolt holes, lighting lamps, wires, and cables, and the overall light distribution is uneven. All these factors will affect the effect of image segmentation.

3.2. Data Enhancement Method

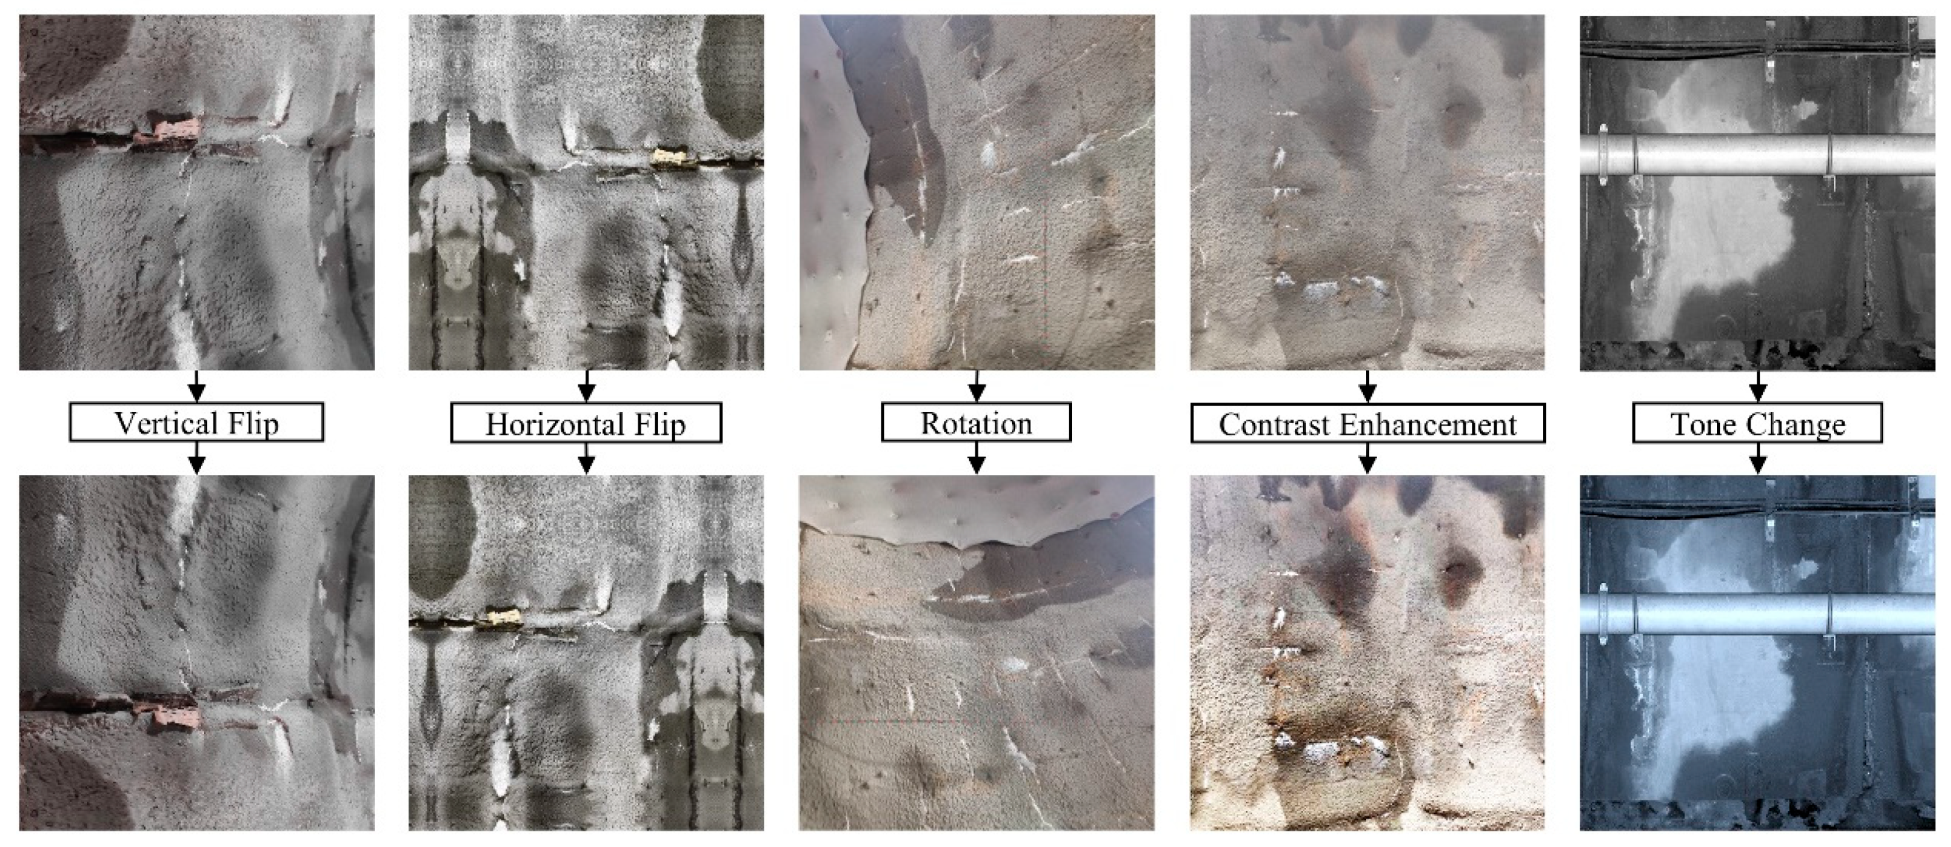
Data augmentation is performed using Python’s albumentations [35] library through methods such as random flipping, rotation, cropping, scaling, contrast enhancement, and hue adjustment. This aims to enable the model to achieve better generalization ability and robustness, generating 1340 images during the data augmentation process. It should be noted that derivative images generated from the same original image through data augmentation will be included in the dataset, together with the original image. The dataset is divided into a training set, a validation set, and a test set in an 8:1:1 ratio. The specific data augmentation methods adopted are shown in Figure 4.

3.3. Image Annotation

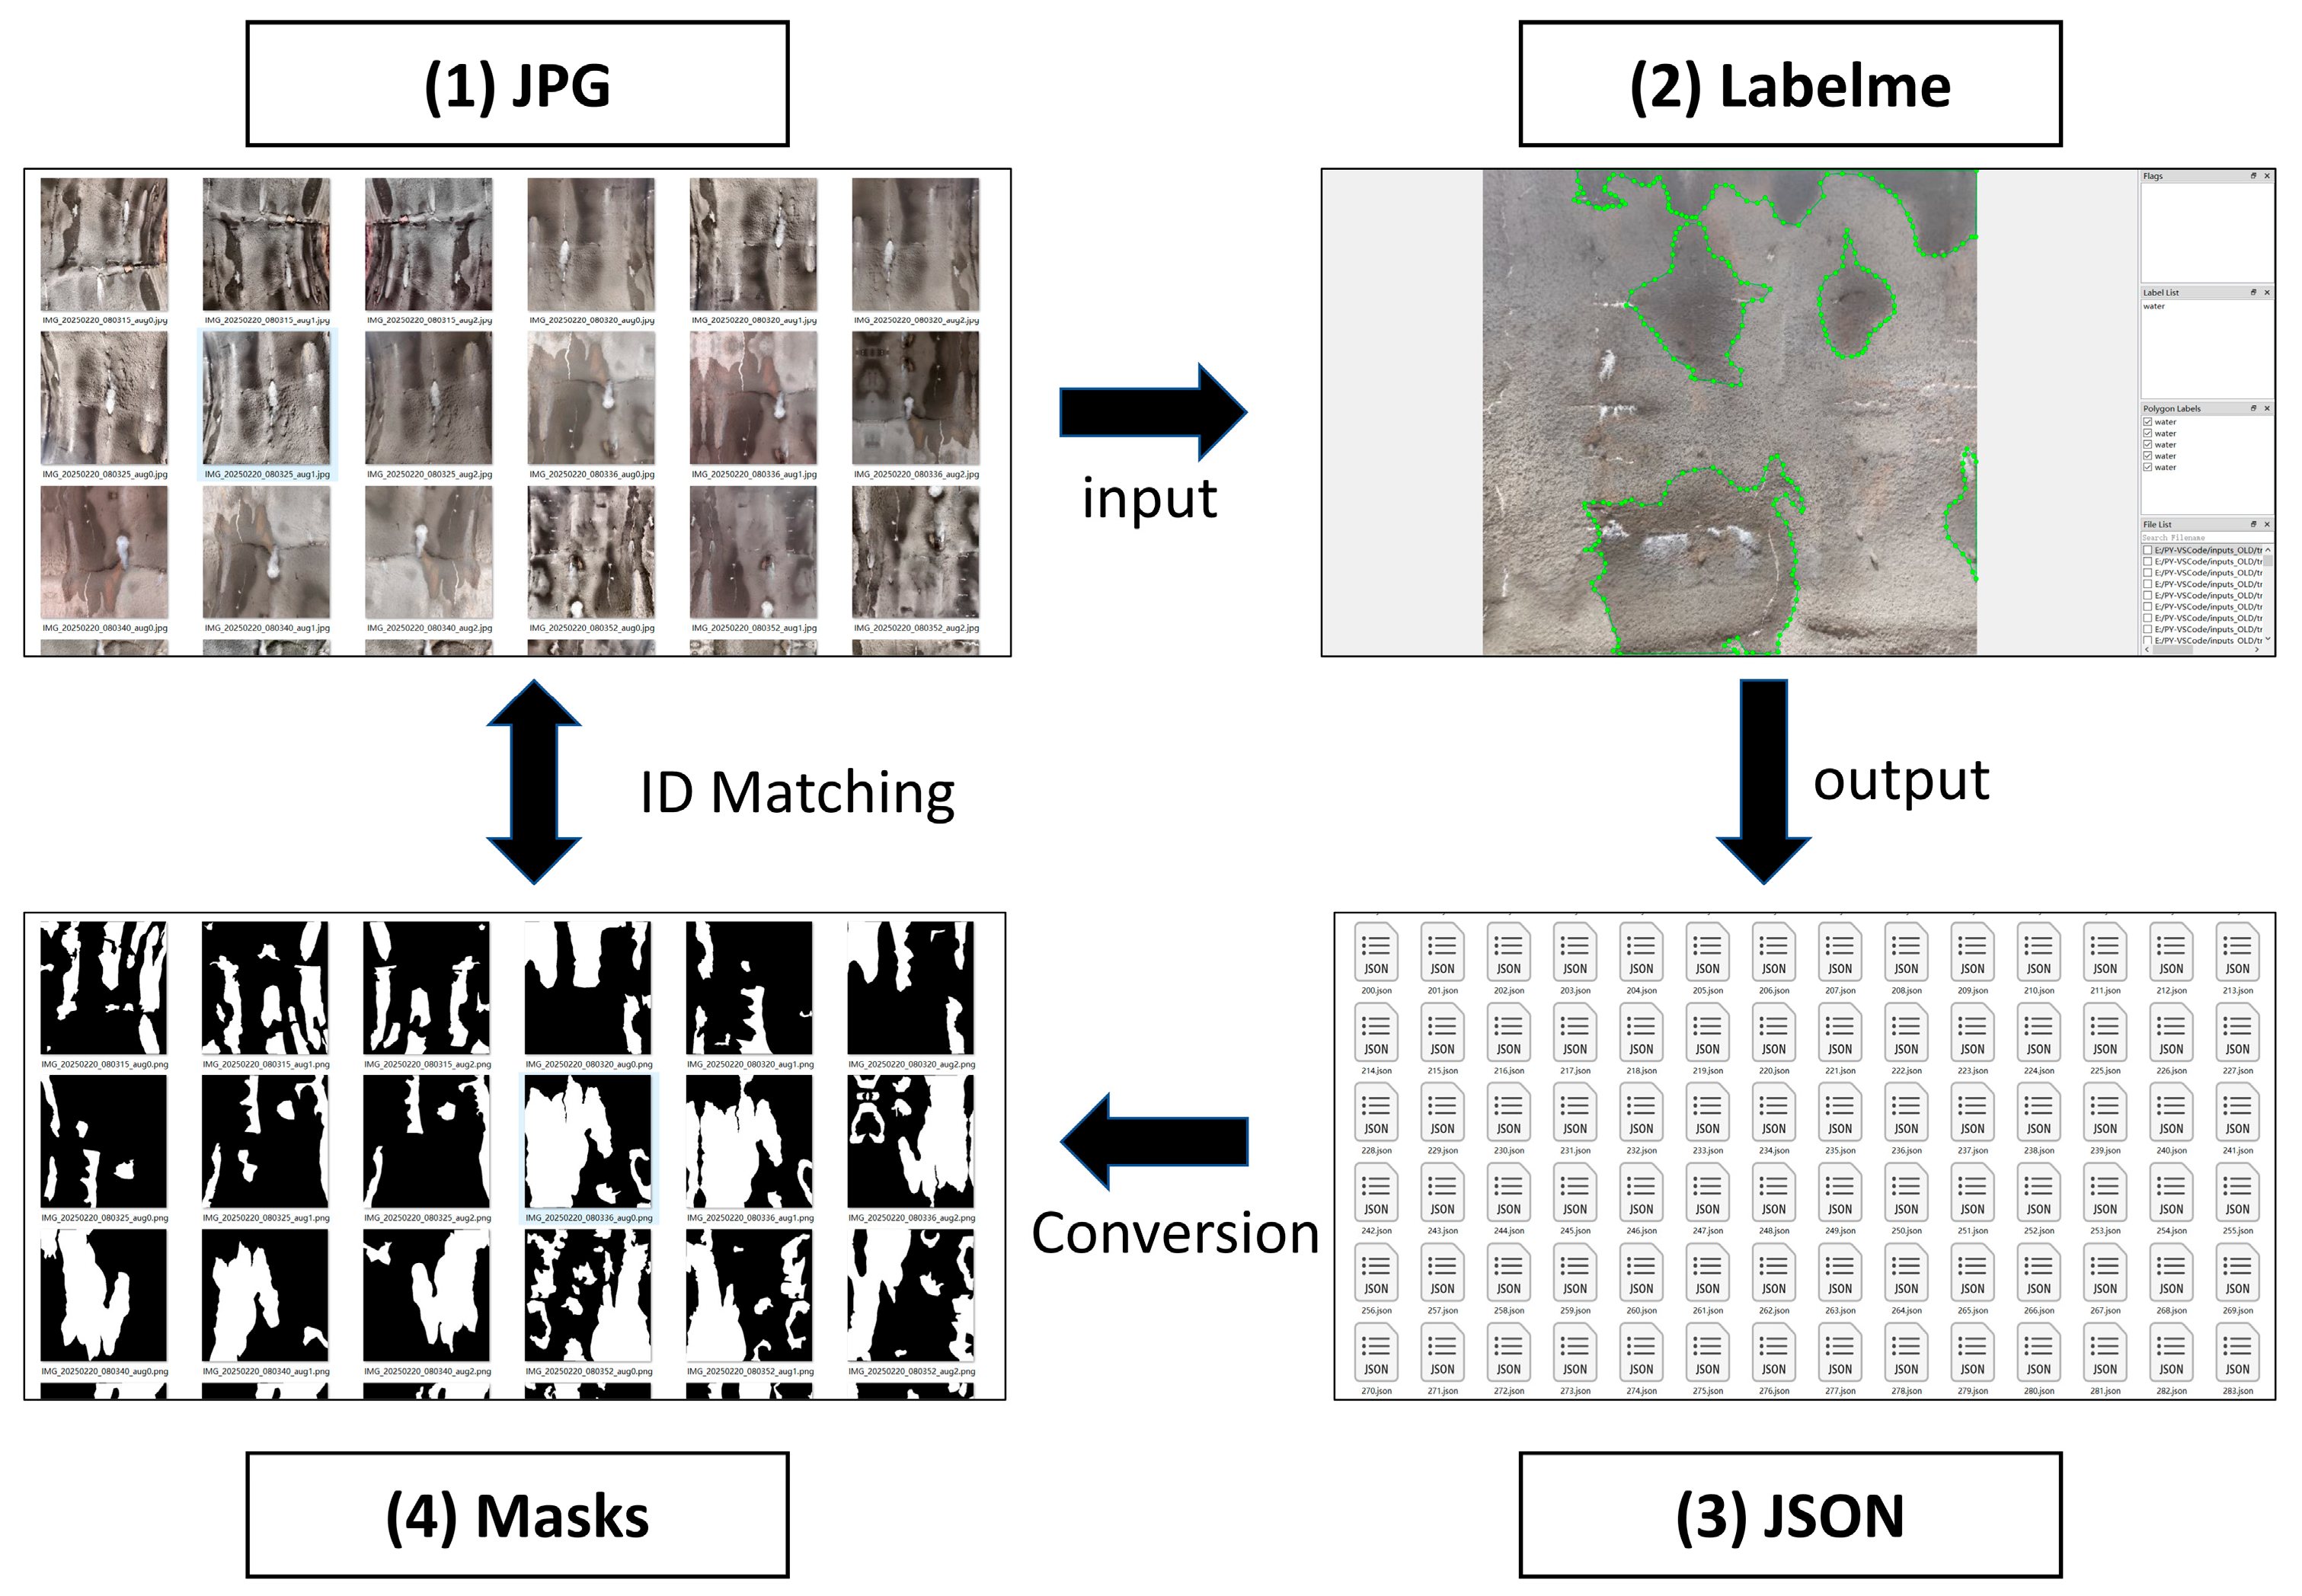
Images after augmentation are imported into the Labelme [36] tool in JPG format for annotation. Upon completion of annotation, Labelme generates corresponding JSON files. A self-developed Python program is used to convert the format of these JSON files, ultimately obtaining Mask files that can be directly used for model training. The specific conversion process of the aforementioned original images is shown in Figure 5.

4. Model Training

4.1. Training Environment

This study was conducted on the Windows 10 64-bit operating system, using Python 3.8.20 and CUDA 11.6. Experiments were performed within the PyCharm 2024.3.6 (Community Edition) integrated development environment (IDE), with model training and testing implemented based on the PyTorch 2.4.1 deep learning framework. The computer was configured with 32 GB of running memory operating at 2667 MHz, a 12th Gen Intel(R) Core(TM) i7-12700KF CPU (3.60 GHz), and an NVIDIA GeForce RTX 4090-24G graphics processing unit (GPU).

4.2. BCE-Dice Loss Function

In this study, the loss function is constructed by combining Binary Cross-Entropy (BCE) loss and Dice loss. BCE loss, focusing on per-pixel classification accuracy, robustly supervises foreground and background predictions. Dice loss emphasizes predicted-ground-truth region overlap, exhibiting stronger robustness when addressing class imbalance issues. For a single sample, the definition of LossBCE is as follows:
LossBCE(p,t) = − [t · log(p) + (1 − t) · log(1 − p)],
where p stands for the predicted probability. The sigmoid function is applied to logits to convert them into the [0, 1] range; t is the target label, with possible values of 0 or 1 only.
As an indicator for assessing the overlap between two sets, the Dice coefficient is defined as follows:
Dice   =   2 | X Y | X + | Y | ,
where X is the predicted region, and Y is the ground-truth region.
The Dice coefficient can be expressed as follows:
Dice   =   2 i p i · t i + ε i p i + i t i + ε ,
where ε is set to 1 × 10⁻⁵.
The Dice loss is then defined as follows:
LossBCE-Dice = 1 − Dice,
The BCE-Dice loss function is defined as follows:
LossBCE-Dice(p,t) = α · LossBCE(p,t) + β · LossDice(p,t),
where α stands for the weight of BCE, taking a value of 0.5; β represents the weight of Dice, with its value being 1. Configured with weight parameters α = 0.5 and β = 1, the system works to synergize Dice loss’s benefits (like its effectiveness in dealing with class imbalance) and the robust pixel-level supervision from BCE loss. This combined strategy caters to the specific demands of tunnel leakage identification, including small-target detection, resistance to strong interference, and accurate boundary delineation, thus boosting the segmentation performance of the model.

4.3. Evaluation Indicators

To conduct a quantitative analysis of the lining leakage segmentation results, this study uses model evaluation metrics and calculates each metric based on the test set samples. The primary evaluation metrics used are the IoU, Dice, recall, precision, accuracy, AUC, MCC, and F1-score. The specific formula for the IoU is as follows:
IoU   =   | A B | | A B | ,
where A stands for the region derived from the model’s predicted results, and B denotes the region defined by the ground-truth labels.
The specific calculation formula for the AUC is as follows:
AUC   =   1 2 i 1 n ( F P R i F P R i 1 ) ( T P R i + T P R i 1 )
where the false-positive rate (FPR) is the abscissa of the ROC curve, and the true-positive rate (TPR, i.e., recall) is the ordinate of the ROC curve.
The specific calculation formulas for the remaining metrics are as follows:
Recall   =   T P T P + F N ,
Precision = T P T P + F P ,
Accuracy = T P + T N T P + T N + F P + F N ,
MCC = T P × T N F P × F N ( T P + F P ) ( T P + F N ) ( T N + F P ) ( T N + F N ) ,
F 1 - Score = 2 × P r e c i s i o n × R e c a l l P r e c i s i o n + R e c a l l ,
where TP is correctly classified positive samples, TN is correctly classified negative samples, FP is incorrectly classified negative samples, and FN is incorrectly classified positive samples.

5. Analysis of Training Results

5.1. Performance Analysis of the CBAM-TransUNet Model

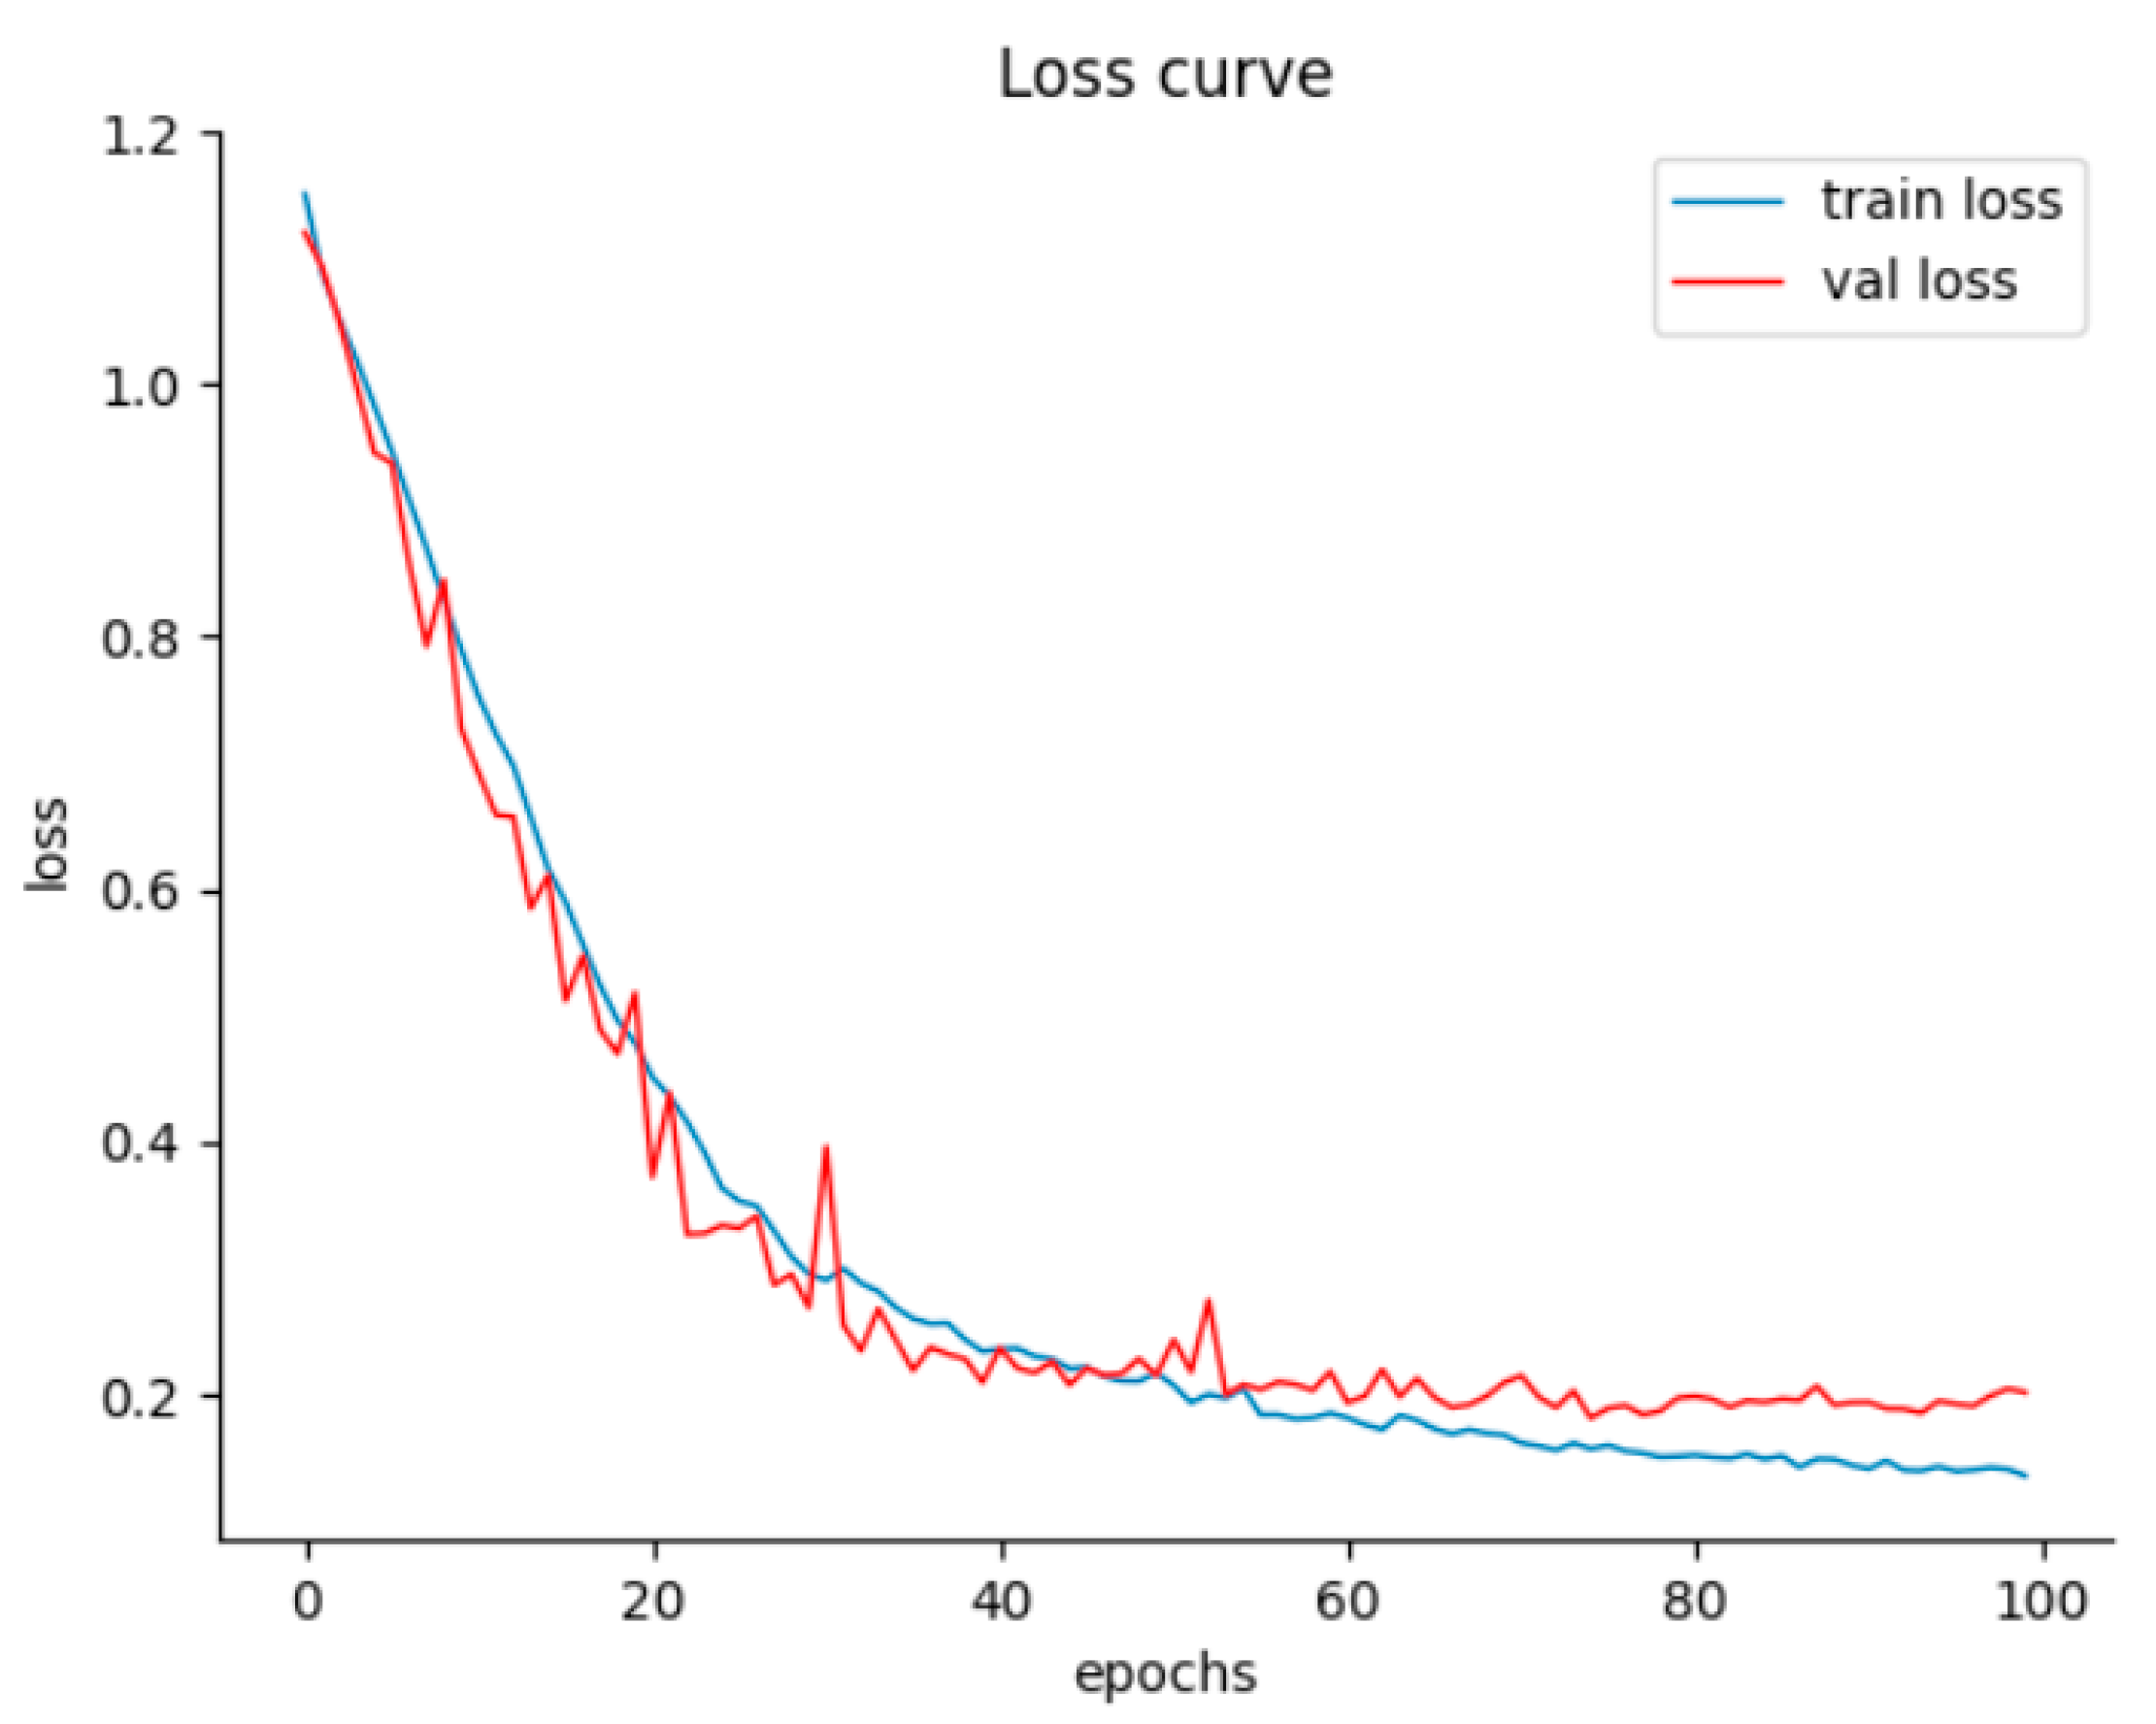
In the process of setting experimental parameters, model complexity and the characteristics of training data are core considerations. The goal is to ensure that the parameters not only promote rapid convergence of the model but also guarantee its favorable generalization ability. Specifically, in this experiment, the number of iterations is set to 100 to ensure that the model can eventually reach a state of sufficient convergence. Within the allowable range of memory capacity, the batch size is adjusted to the largest possible value, which is finally determined as 16. During the training phase, the Adam optimizer is adopted, along with a cosine annealing decay strategy. The initial learning rate is set to 1 × 10⁻⁴, and the weight decay coefficient is 1 × 10⁻³. The learning rate gradually decays along a cosine curve as the training progresses, with the minimum value dropping to 1 × 10⁻⁵. The experiment also introduces an adaptive learning rate adjustment mechanism: when the validation set loss does not decrease for 3 consecutive epochs, the learning rate is automatically halved. As can be observed from the model loss function curve shown in Figure 6, the loss value basically stabilizes after approximately 80 training epochs, indicating that the model has entered a stable state at this point.

5.2. Comparison of Results of Various Models

To verify the performance metrics of CBAM-TransUNet, it was compared with commonly used semantic segmentation models: TransUNet [30], UNet [37], DeeplabV3plus [38], SegNet [39], BiSeNetV2 [40], FPN [41], DoubleUNet [42], NestedUNet [43], and Swin-Unet [44]. The evaluation indices of various water leakage detection models on the test set are presented in Table 1 next.
Analysis of Table 1 reveals that CBAM-TransUNet slightly lags behind an FPN in terms of recall and marginally underperforms TransUNet in accuracy and specificity, while outperforming all other comparative models in the remaining metrics. Based on a comprehensive evaluation across all indices, the proposed CBAM-TransUNet model for tunnel water leakage identification exhibits the optimal overall performance, with an IoU of 0.8143, a Dice of 0.8433, a recall of 0.9518, a precision of 0.8482, an accuracy of 0.9837, and an F1-score of 0.8970.

5.3. Analysis of Visual Segmentation Results

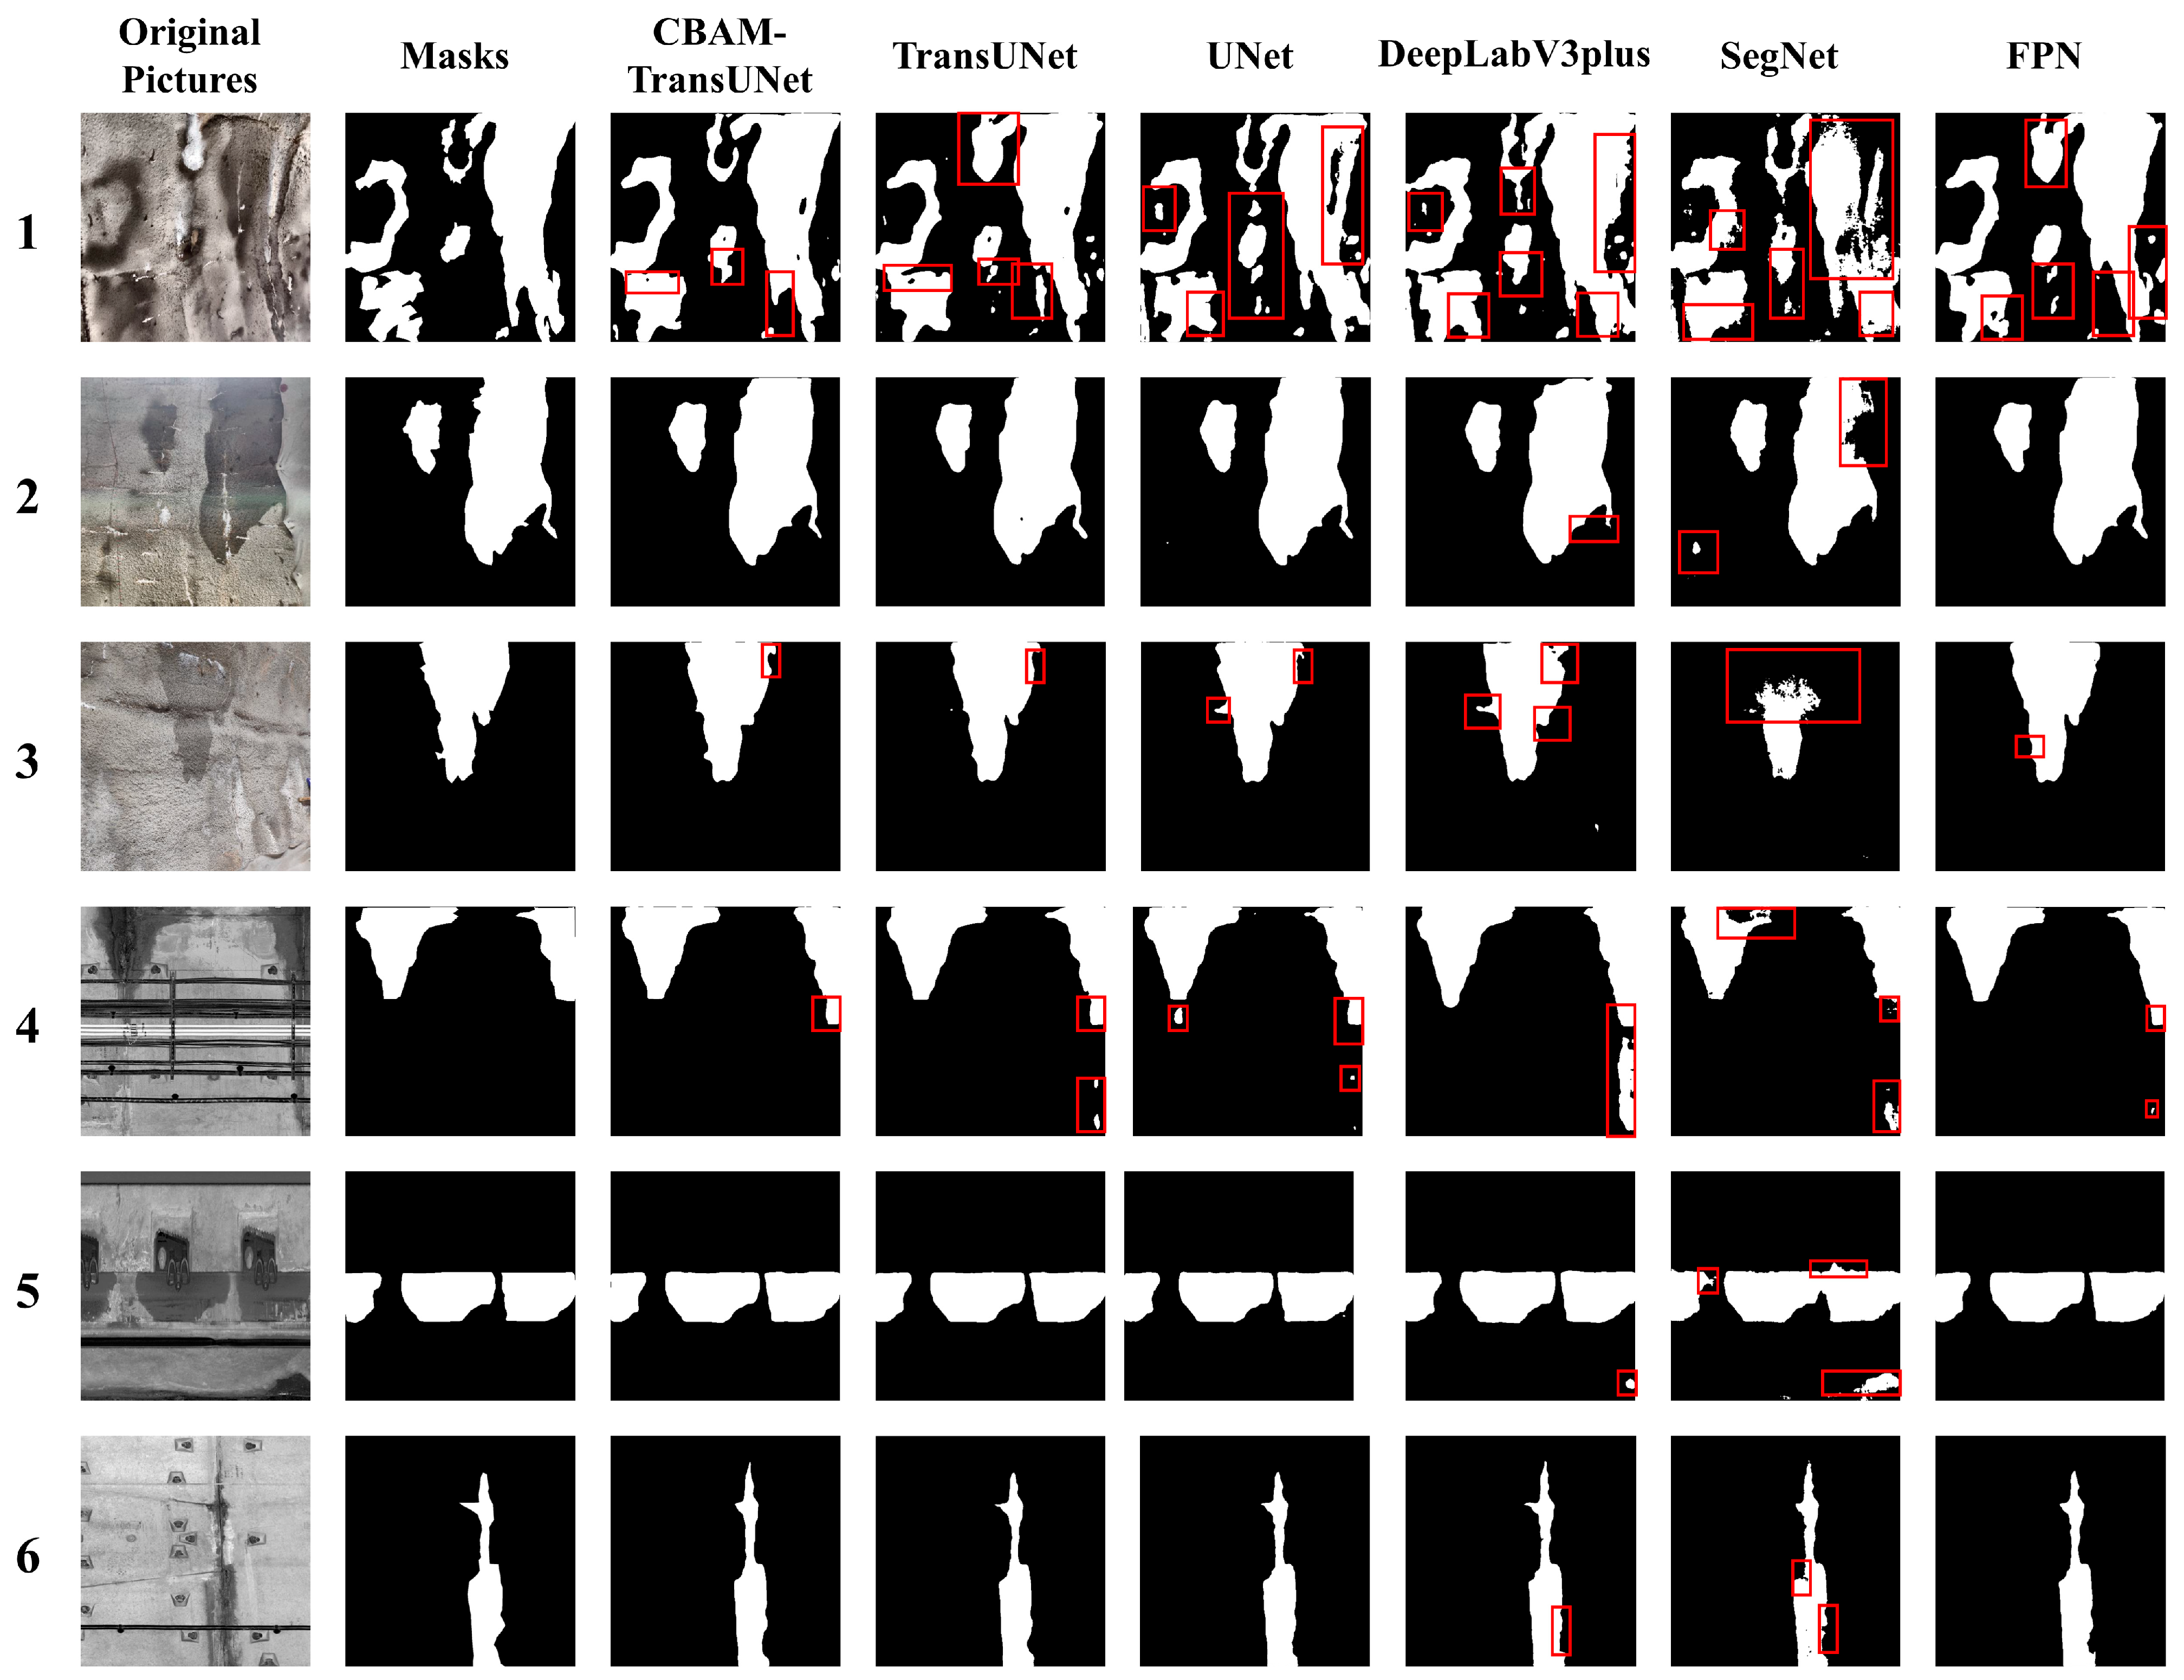
To visually compare CBAM-TransUNet with commonly used semantic segmentation algorithms, multiple representative tunnel water leakage images and several frequently used models were selected for semantic segmentation testing. The results were visualized as shown in Figure 7.
In the case of no. 1, where water leakage on the lining surface is scattered and irregularly shaped, all models exhibit inaccurate segmentation in certain regions, along with missed or false detections of details. Among them, CBAM-TransUNet, UNet, and the FPN all demonstrate relatively better segmentation results, with CBAM-TransUNet achieving the most comprehensive and accurate restoration of details, while the remaining models show more instances of inaccurate segmentation. For no. 3, where water stains on the lining surface are relatively faint and the segmentation region has low distinguishability from the background, CBAM-TransUNet, TransUNet, and the FPN generally segment the designated regions and depict details to a certain extent. Other models have relatively weaker detail processing capabilities, and SegNet shows obvious missed detections. In the presence of interference in no. 4, all models exhibit missed and false detections, but CBAM-TransUNet yields the smallest errors and the best segmentation performance. For the linear water leakage in no. 5, CBAM-TransUNet, TransUNet, and UNet produce better segmentation results in terms of shape and details, and these results are generally closer to the original label map. In summary, compared with all the aforementioned models, the CBAM-TransUNet model constructed in this study achieves the highest accuracy in image segmentation, with results closest to the original label map.

6. Ablation Experiments

To verify the performance of the CBAM added to CBAM-TransUNet, an ablation experiment was conducted on the CBAM-TransUNet model constructed in this study. The CBAMs in the model were gradually reduced, and finally the ViT module was removed, aiming to verify the improvement effect of the CBAM-TransUNet tunnel water leakage model compared with the original model. The CBAM skip connection between the corresponding encoder and decoder is referred to as Skip-CBAM. Specifically, the CBAM skip connection between encoder2 and decoder3 is named Skip-CBAM1, and so on. The CBAM directly connecting the ViT and the decoder is termed Deep-CBAM.

6.1. Analysis of Ablation Experiment Results

In the ablation experiment, the evaluation metrics of the complete CBAM-TransUNet model and the models with various modules ablated (tested on the test set) are presented in Table 2 next.
Analysis of Table 2 indicates that as the ablation experiment proceeded stepwise, all key performance metrics of the model showed an overall downward trend. After removing all CBAMs and the ViT module, the performance metrics of the resulting model exhibit significant gaps compared to those of CBAM-TransUNet, with differences in the IoU and precision reaching 5.63% and 8.26%, respectively.

6.2. Analysis of Heatmaps from Ablation Experiments

Score-CAM is a visualization technique used to interpret the decision-making process of neural networks [45]. It generates heatmaps by precisely locating the regions in the image that contribute the most to the model’s predictions, thereby highlighting the critical areas influencing the model’s predictions. Compared with the traditional Class Activation Mapping (CAM) method, Score-CAM replaces gradient calculation with weighted feature map combination, reducing reliance on gradients [46]. This enables it to more accurately reflect the basis of model decisions and exhibit superior performance in terms of visual effectiveness and fairness. Its calculation principle is shown in Equation (16):
H l k   =   σ ( UP ( A l k ) C l k   =   f X · H l k     f X ,
where A l k represents the size-related attributes of the output feature map; l marks the level of the output feature; k represents the number of channels that each individual feature layer possesses; the sigmoid activation function, denoted as σ ( · ) , acts to normalize the value distribution of the feature map, ensuring its range is standardized; H l k denotes the size of the original output image; f X stands for the input feature map; and f X · H l k refers to the input feature map after being weighted. C l k is the area within the input image that the model focuses its attention on.
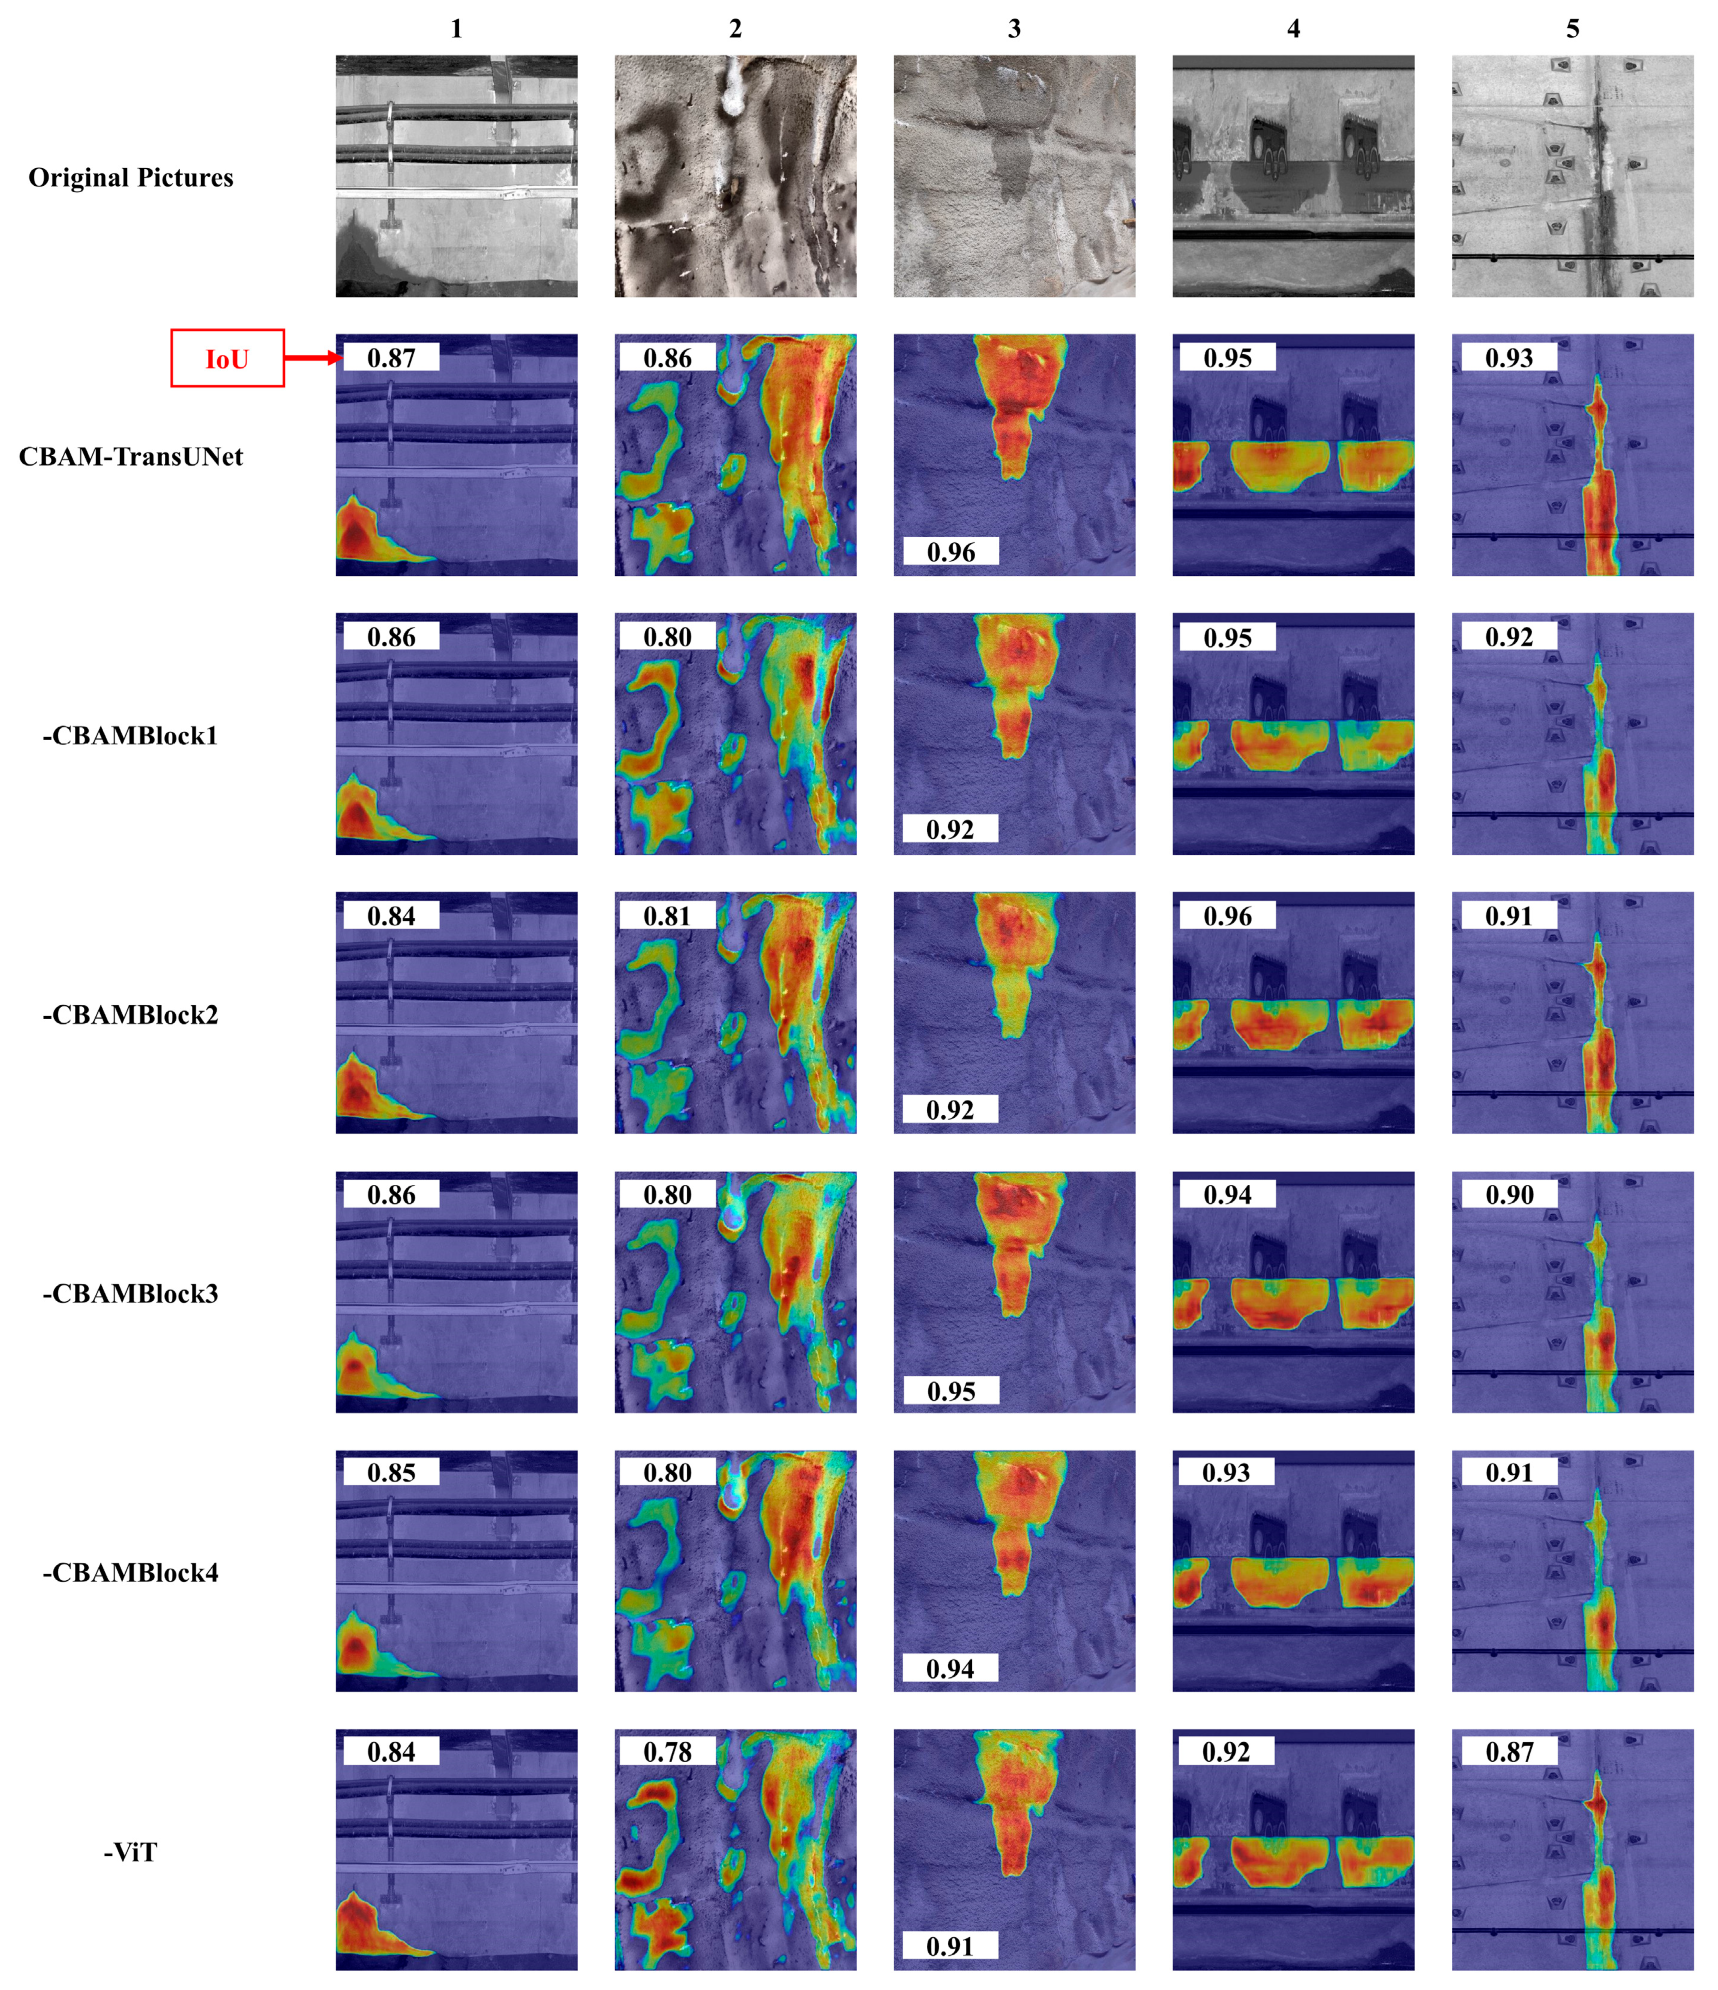
Finally, the Score-CAM heatmaps of the baseline CBAM-TransUNet model are illustrated in Figure 8. The values within the white boxes correspond to the IoU scores associated with each heatmap. In every heatmap, a deeper red hue in a region signifies a more prominent contribution to the prediction during the model’s recognition process, indicating a higher level of attention from the model.

6.2.1. Heatmap Analysis of Image 1: Corner-Type Leakage

In this scenario, the water leakage is located at the corner of the image and is irregularly shaped. The leakage point is adjacent to other dark-colored tunnel structures at the bottom, and this adjacency may cause certain interference to detection. The CBAM-TransUNet model achieves an IoU of 0.87. In the heatmap, the leakage point is clearly segregated from the background, and the dark background at the bottom does not cause significant interference, indicating that the model can distinguish leakage features in regions with similar colors. After removing CBAMBlock1, the IoU drops to 0.86, with some red activation points disappearing. When the ViT module is removed, the IoU decreases to 0.84, and the bottom of the leakage area in the heatmap becomes somewhat confused with the dark background.

6.2.2. Heatmap Analysis of Image 2: Mixed-Type Leakage

This scenario involves mixed leakage in the tunnel haunch area, characterized by patchy leakages of varying sizes, irregular shapes, and scattered distribution, with tortuous and blurred boundaries of the leakage regions. The CBAM-TransUNet model achieves an IoU of 0.86 in this case. In the heatmap, the leakage regions are mainly displayed continuously in red and yellow. This visual representation generally reflects the actual leakage positions well, with clear and accurate segmentation boundaries. During the gradual removal of the CBAM, the red and yellow areas in the large leakage region on the right side of the heatmap are significantly reduced and more concentrated, failing to clearly identify the complete leakage area. The boundaries of the scattered patchy leakage regions in the middle gradually blur, exhibiting missed detections. After removing the ViT module, the large leakage region on the right side of the heatmap completely loses its true shape, and multiple false-positive responses appear between other patchy leakage regions.

6.2.3. Heatmap Analysis of Image 3: Area-Type Leakage

In this scenario, the leakage area is continuous and complete, with a light color and blurred boundaries, showing high similarity to the background. The background has a rough surface with rich textures, and there are obvious strip-shaped depressions traversing the leakage area. The baseline CBAM-TransUNet model achieves an IoU of 0.86; in its heatmap, the leakage area is accurately covered by red and dark-yellow regions, with clear segmentation boundaries not disturbed by the background, indicating that the model can distinguish the leakage area from the light-colored rough background in this case. After removing the CBAM, the high-confidence regions in the heatmap gradually shrink, and red areas turn to light green. When the ViT module is removed, the edges of the heatmap are slightly expanded compared to the actual situation, and false-detection deviations occur at the junction between the leakage area and background depressions.

6.2.4. Heatmap Analysis of Image 5: Linear Leakage

This case involves linear water leakage at the joints of concrete blocks. Its path is narrow, long, and continuous, with rough and blurred boundaries, making accurate distinction difficult. The CBAM-TransUNet model achieves an IoU of 0.93. In the heatmap, the linear leakage area is generally covered by red strips, with narrower sections connected by dark-yellow regions, accurately distinguishing the boundaries from the background. After removing all CBAMs, the high-confidence regions in the heatmap shrink significantly; after removing the ViT module, the IoU drops to 0.87.
In summary, CBAM-TransUNet demonstrates robust recognition capabilities for tunnel water leakage scenarios, including corner-type, mixed-type, overall area-type, and linear leakage regions. In the ablation experiments, the heatmaps of the model exhibit more accurate boundary segmentation and more complete area coverage compared to its variants. The high-response regions are more aligned with the annotated boundaries, showing better spatial continuity, and can more precisely describe the spatial morphology of different forms of water leakage.

7. Discussion

Although the CBAM-TransUNet model proposed in this paper achieved high detection accuracy on the constructed mixed dataset, it still has several limitations that require further exploration and optimization in subsequent studies.

7.1. Limitations of the Dataset and Annotations

The dataset used in this research primarily comprises images of two tunnel types: drill-and-blast tunnels and shield tunnels. Most of the samples within this dataset center on typical leakage forms, including independent regional leakage and linear leakage. However, for rare leakage forms (e.g., honeycomb-shaped leakage, complex mixed leakage, and intermittent dripping), the sample representation is significantly insufficient, which may restrict the model’s generalization performance to some extent. In addition, the manual annotation process involves subjective biases. Particularly in leakage scenarios where the lining surface is highly weathered or interfered with by other tunnel components, the IoU among annotators shows significant discrepancies, which may adversely affect the accuracy of model training. Accordingly, the primary focus of future research should lie in dataset scaling, encompassing the collection and creation of image data from varied regional and environmental settings. Concurrently, a multi-expert inspection and recommendation mechanism should be assigned and deployed in the image annotation process to ensure the reliability of annotation results.

7.2. Constraints on Computational Resources and Real-Time Performance

The CBAM-TransUNet model has a parameter volume of 240 million, a value that is greater than that of the majority of the comparison models noted earlier. Traditional segmentation models, such as UNet (23 million parameters) and SegNet (14 million parameters), have less than one-tenth the number of parameters of CBAM-TransUNet; even compared with similar Transformer-based models (e.g., TransUNet with 176 million parameters), CBAM-TransUNet’s parameter size is approximately 35% larger. This characteristic directly leads to a significant increase in model training time and higher requirements for GPU memory.
CBAM-TransUNet can indeed meet the accuracy standards for tunnel leakage detection; however, its excessive parameters and slow inference speed result in increased training costs and hinder real-time deployment. The direction of future research should involve exploring ways to lightweight the model so as to balance accuracy and computational efficiency more effectively and further enable its use in practical engineering.

7.3. Improvement of Model Interpretability and Functionality

Although heatmap visualization can assist in leakage region analysis, the model’s decision-making logic still lacks sufficient transparency. For example, no direct correlation has been established between the weight adjustment mechanism of the CBAM for specific channels and physical parameters, such as the porosity of lining concrete and the humidity gradient on the lining surface—parameters that are critical for engineers to identify hidden leaks. This limitation, to some extent, restricts engineers’ ability to interpret the model’s reasoning process for detecting hidden leaks. In addition, the current model does not yet possess a comprehensive function for evaluating leakage severity; quantitative analysis of key indicators, such as leakage volume estimation and water volume trend prediction, remains absent. Therefore, future research should aim to integrate computational fluid dynamics models or Internet of Things (IoT) sensor data to construct an end-to-end tunnel damage management system, thereby enhancing the model’s interpretability and functional completeness in practical engineering applications.

7.4. Limitations in Experimental Designs

The model proposed achieves a slight lead in core metrics over other common classical models under the mixed dataset. Among the following metrics (IoU, Dice, Precision, AUC, MCC, and F1-score), the proposed model attains the highest values, outperforming the second-ranked model by 0.79%, 2.45%, 3.80%, 0.13%, 1.06%, and 2.49%, respectively. When all metrics are considered comprehensively, the proposed model demonstrates overall optimality. This study did not investigate the impact of different lighting conditions (e.g., backlit environments, low-light scenarios) and air conditions (e.g., dust diffusion, smoke-filled conditions) on detection accuracy, which limits the evaluation of the model’s environmental adaptability and the diversification of its application scenarios. When the surface of the tunnel lining is contaminated by non-water-seepage liquids (e.g., engine oil, hydraulic oil), the detection model tends to misidentify such contamination as water seepage features, thereby generating erroneous judgment results. Meanwhile, if the tunnel interior is in an environment with poor lighting or a complete lack of effective illumination, the accuracy of the data acquired by the image acquisition system will be significantly reduced. This issue will further lead to misjudgments by the detection model and may even render it unable to perform its normal detection functions. In such scenarios, identifying water seepage and leakage areas solely via visual image acquisition is manifestly inadequate for engineering needs, requiring the integration of additional methods for collaborative determination. Specifically, data from 3D laser scanning can support prediction and assessment [47], while advanced sensors enable more direct localization of seepage/leakage points [48], and these approaches can ensure detection accuracy in environments with poor illumination or unfavorable air conditions, an attribute that vision-based models rarely achieve. To address these limitations, future research will expand the experimental design by, on the one hand, incorporating more mainstream architectures for comparative analysis and, on the other hand, conducting model stability tests under diverse environmental conditions to more comprehensively verify the model’s performance boundaries and applicability in real-world scenarios.

8. Conclusions

(1)
This paper proposes the CBAM-TransUNet model suitable for tunnel lining leakage detection. After training on the constructed mixed leakage dataset, the model achieves average values of 0.8143 (IoU), 0.8433 (Dice), 0.9518 (recall), 0.8482 (precision), 0.9837 (accuracy), 0.9746 (AUC), 0.8568 (MCC), and 0.8970 (F1-score). Experimental verification demonstrates that the model exhibits strong generality and robustness, capable of effectively handling complex and diverse scenarios, such as the presence of other components on the lining surface, rough textures, surface contamination, low distinguishability between leakage traces and background, and partial occlusion of traces.
(2)
To validate the performance of the core modules, ablation experiments involved progressively stripping the CBAM and the ViT module away from the CBAM-TransUNet model. The results show that all evaluation metrics decrease to varying degrees. Specifically, the variant model with all CBAMs and ViT modules removed exhibits a significant performance gap compared to the original CBAM-TransUNet, with a difference of up to 7.79% in the IoU metric. Additionally, disparities are observed across other evaluation metrics: The difference in the Dice coefficient is 1.03%; in recall, 2.40%; in precision, 6.20%; in accuracy, 0.96%; and in the F1-score, 4.53%, further confirming the necessity of these two modules in the model.
(3)
Analysis of Score-CAM heatmaps for different leakage patterns reveals that CBAM-TransUNet performs stably in detecting corner-type, linear, overall area-type, and mixed-type tunnel leakages. For the aforementioned leakage pattern categories, the differences in the IoU metric before and after the ablation experiments are 3.44%, 6.45%, 5.20%, and 9.30%, in sequence. In contrast to the heatmaps of ablated variant models, the ones generated by CBAM-TransUNet cover leakage areas more completely. The high-activation regions align more closely with real leakage boundaries, and they exhibit stronger spatial continuity. This enables the model to more accurately characterize the spatial distribution features of different leakage forms.
Although the CBAM-TransUNet model achieves high detection accuracy in leakage-related tasks, this study retains limitations in key domains, including the quality of the dataset and its annotations, the matching of computational resource demands with real-time performance, the interpretability and functional scope of the model, and the systematic design of experiments. These constraints will be further refined and resolved in subsequent research studies.

Author Contributions

Conceptualization, R.S. and S.S.; methodology, Z.L. and L.W.; software, Z.L.; validation, S.S. and R.S.; formal analysis, R.S. and H.W.; investigation, Y.W. and L.W.; resources, Z.L. and R.S.; data curation, L.W., S.S. and H.W.; writing—original draft preparation, Z.L.; writing—review and editing, Z.L.; visualization, Z.L.; supervision, L.W.; project administration, L.W. and Y.W.; funding acquisition, L.W. and Y.W. All authors have read and agreed to the published version of the manuscript.

Funding

This research was supported by Shandong Provincial Communications Planning and Design Institute Group Co., Ltd., through the Shandong Provincial Enterprise Technology Innovation Program (grant no. 2024537010000680) and the Science and Technology Project of Shandong Provincial Communications Planning and Design Institute Group Co., Ltd. (grant no. KJ-2023-SJYJT-16).

Institutional Review Board Statement

Not applicable.

Informed Consent Statement

Not applicable.

Data Availability Statement

Data are available from the corresponding author upon reasonable request.

Acknowledgments

The authors express special thanks to the editors and anonymous reviewers for their constructive comments.

Conflicts of Interest

Author Li Wan was employed by the company Shandong Provincial Communications Planning and Design Institute Group Co., Ltd. The authors declare that this study received funding from Shandong Provincial Communications Planning and Design Institute Group Co., Ltd. The funder was not involved in the study design; collection, analysis, and interpretation of data; the writing of this article; or the decision to submit it for publication. The remaining authors declare that the research was conducted in the absence of any commercial or financial relationships that could be construed as a potential conflict of interest.

References

  1. Zhai, J.; Wang, Q.; Wang, H.; Xie, X.; Zhou, M.; Yuan, D.; Zhang, W. Highway Tunnel Defect Detection Based on Mobile GPR Scanning. Appl. Sci. 2022, 12, 3148. [Google Scholar] [CrossRef]
  2. Wang, L.; Guan, C.; Wu, Y.; Feng, C. Impact Analysis and Optimization of Key Material Parameters of Embedded Water-Stop in Tunnels. Appl. Sci. 2023, 13, 8468. [Google Scholar] [CrossRef]
  3. Jin, Y.; Yang, S.; Guo, H.; Han, L.; Su, S.; Shan, H.; Zhao, J.; Wang, G. A Novel Visual System for Conducting Safety Evaluations of Operational Tunnel Linings. Appl. Sci. 2024, 14, 8414. [Google Scholar] [CrossRef]
  4. Attard, L.; Debono, C.J.; Valentino, G.; Di Castro, M. Vision-Based Tunnel Lining Health Monitoring via Bi-Temporal Image Comparison and Decision-Level Fusion of Change Maps. Sensors 2021, 21, 4040. [Google Scholar] [CrossRef] [PubMed]
  5. Li, C.; Li, J.; Luo, C.; Xu, Q.; Wan, X.; Yang, L. Diagnosis and Monitoring of Tunnel Lining Defects by Using Comprehensive Geophysical Prospecting and Fiber Bragg Grating Strain Sensor. Sensors 2024, 24, 1749. [Google Scholar] [CrossRef]
  6. Tan, L.; Hu, X.; Tang, T.; Yuan, D. A Lightweight Metro Tunnel Water Leakage Identification Algorithm via Machine Vision. Eng. Fail. Anal. 2023, 150, 107327. [Google Scholar] [CrossRef]
  7. Liu, S.; Sun, H.; Zhang, Z.; Li, Y.; Zhong, R.; Li, J.; Chen, S. A Multiscale Deep Feature for the Instance Segmentation of Water Leakages in Tunnel Using MLS Point Cloud Intensity Images. IEEE Trans. Geosci. Remote Sens. 2022, 60, 5702716. [Google Scholar] [CrossRef]
  8. Wu, X.; Bao, X.; Shen, J.; Chen, X.; Cui, H. Evaluation of Void Defects behind Tunnel Lining through GPR Forward Simulation. Sensors 2022, 22, 9702. [Google Scholar] [CrossRef]
  9. Panthi, K.K.; Basnet, C.B. Fluid Flow and Leakage Assessment Through an Unlined/Shotcrete Lined Pressure Tunnel: A Case from Nepal Himalaya. Rock Mech. Rock Eng. 2021, 54, 1687–1705. [Google Scholar] [CrossRef]
  10. Gong, C.; Cheng, M.; Ge, Y.; Song, J.; Zhou, Z. Leakage Mechanisms of an Operational Underwater Shield Tunnel and Countermeasures: A Case Study. Tunn. Undergr. Space Technol. 2024, 152, 105892. [Google Scholar] [CrossRef]
  11. Zhang, S.; Xu, Q.; Yoo, C.; Min, B.; Liu, C.; Guan, X.; Li, P. Lining Cracking Mechanism of Old Highway Tunnels Caused by Drainage System Deterioration: A Case Study of Liwaiao Tunnel, Ningbo, China. Eng. Fail. Anal. 2022, 137, 106270. [Google Scholar] [CrossRef]
  12. Yang, Q.; Hong, C.; Yuan, S.; Wu, P. Development and Verification of a Vertical Graphene Sensor for Tunnel Leakage Monitoring. ACS Appl. Mater. Interfaces 2025, 17, 3962–3972. [Google Scholar] [CrossRef] [PubMed]
  13. Guo, J.-Y.; Fang, J.-H.; Shi, B.; Zhang, C.-C.; Liu, L. High-Sensitivity Water Leakage Detection and Localization in Tunnels Using Novel Ultra-Weak Fiber Bragg Grating Sensing Technology. Tunn. Undergr. Space Technol. 2024, 144, 105574. [Google Scholar] [CrossRef]
  14. Wang, H.; Zhang, D.; Ren, K.; Shi, B.; Guo, J.; Sun, M. The Sensing Performance of a Novel Optical Cable for Tunnel Water Leakage Monitoring Based on Distributed Strain Sensing. IEEE Sens. J. 2023, 23, 22496–22506. [Google Scholar] [CrossRef]
  15. Chen, Q.; Kang, Z.; Cao, Z.; Xie, X.; Guan, B.; Pan, Y.; Chang, J. Combining Cylindrical Voxel and Mask R-CNN for Automatic Detection of Water Leakages in Shield Tunnel Point Clouds. Remote Sens. 2024, 16, 896. [Google Scholar] [CrossRef]
  16. Zhao, L.; Wang, J.; Liu, S.; Yang, X. An Adaptive Multitask Network for Detecting the Region of Water Leakage in Tunnels. Appl. Sci. 2023, 13, 6231. [Google Scholar] [CrossRef]
  17. He, K.; Gkioxari, G.; Dollár, P.; Girshick, R. Mask r-cnn. In Proceedings of the IEEE International Conference on Computer Vision, Venice, Italy, 22–29 October 2017; pp. 2961–2969. Available online: https://openaccess.thecvf.com/content_iccv_2017/html/He_Mask_R-CNN_ICCV_2017_paper.html (accessed on 4 September 2025).
  18. Wang, C.-Y.; Bochkovskiy, A.; Liao, H.-Y.M. YOLOv7: Trainable Bag-of-Freebies Sets New State-of-the-Art for Real-Time Object Detectors. In Proceedings of the 2023 IEEE/CVF Conference on Computer Vision and Pattern Recognition (CVPR), Vancouver, BC, Canada, 18–22 June 2023; IEEE: Piscataway, NJ, USA, 2023; pp. 7464–7475. Available online: https://openaccess.thecvf.com/content/CVPR2023/html/Wang_YOLOv7_Trainable_Bag-of-Freebies_Sets_New_State-of-the-Art_for_Real-Time_Object_Detectors_CVPR_2023_paper.html (accessed on 4 September 2025).
  19. Chen, J.; Xu, X.; Jeon, G.; Camacho, D.; He, B.-G. WLR-Net: An Improved YOLO-V7 with Edge Constraints and Attention Mechanism for Water Leakage Recognition in the Tunnel. IEEE Trans. Emerg. Top. Comput. Intell. 2024, 8, 3105–3116. [Google Scholar] [CrossRef]
  20. Huang, H.; Cheng, W.; Zhou, M.; Chen, J.; Zhao, S. Towards Automated 3D Inspection of Water Leakages in Shield Tunnel Linings Using Mobile Laser Scanning Data. Sensors 2020, 20, 6669. [Google Scholar] [CrossRef]
  21. Li, P.; Wang, Q.; Li, J.; Pei, Y.; He, P. Automated Extraction of Tunnel Leakage Location and Area from 3D Laser Scanning Point Clouds. Opt. Lasers Eng. 2024, 178, 108217. [Google Scholar] [CrossRef]
  22. Xu, Y.; Li, D.; Xie, Q.; Wu, Q.; Wang, J. Automatic Defect Detection and Segmentation of Tunnel Surface Using Modified Mask R-CNN. Measurement 2021, 178, 109316. [Google Scholar] [CrossRef]
  23. Wu, J.; Zhang, X. Tunnel Crack Detection Method and Crack Image Processing Algorithm Based on Improved Retinex and Deep Learning. Sensors 2023, 23, 9140. [Google Scholar] [CrossRef] [PubMed]
  24. Ouyang, A.; Di Murro, V.; Daakir, M.; Osborne, J.A.; Li, Z. From Pixel to Infrastructure: Photogrammetry-Based Tunnel Crack Digitalization and Documentation Method Using Deep Learning. Tunn. Undergr. Space Technol. 2025, 155, 106179. [Google Scholar] [CrossRef]
  25. Maeda, K.; Takada, S.; Haruyama, T.; Togo, R.; Ogawa, T.; Haseyama, M. Distress Detection in Subway Tunnel Images via Data Augmentation Based on Selective Image Cropping and Patching. Sensors 2022, 22, 8932. [Google Scholar] [CrossRef] [PubMed]
  26. Li, S.; Li, S.; Li, H.; Zhou, Z. Data Enhancement and Feature Extraction Optimization in Tunnel Surface Defect Detection: Combining DCGAN-RC and Repvit-YOLO Methods. Eng. Fail. Anal. 2025, 177, 109715. [Google Scholar] [CrossRef]
  27. Liu, R.; He, Z.; Zhang, J.; Chen, P.; Quan, W.; Liu, S.; Liu, Y. An Improved U-Net Based Method for Predicting Cable Tunnel Cracks. Array 2025, 27, 100421. [Google Scholar] [CrossRef]
  28. Bono, F.M.; Radicioni, L.; Cinquemani, S.; Conese, C.; Tarabini, M.; Meyendorf, N.G.; Niezrecki, C.; Farhangdoust, S. Development of soft sensors based on neural networks for detection of anomaly working condition in automated machinery. In Proceedings of the NDE 4.0, Predictive Maintenance, and Communication and Energy Systems in a Globally Networked World, Long Beach, CA, USA, 6–10 March 2022; SPIE: Long Beach, CA, USA, 2022; pp. 56–70. [Google Scholar] [CrossRef]
  29. Tong, J.; Xiang, L.; Zhang, A.A.; Miao, X.; Wang, M.; Ye, P. Fusion of Convolution Neural Network and Visual Transformer for Lithology Identification Using Tunnel Face Images. J. Comput. Civ. Eng. 2025, 39, 04024056. [Google Scholar] [CrossRef]
  30. Chen, J.; Lu, Y.; Yu, Q.; Luo, X.; Adeli, E.; Wang, Y.; Lu, L.; Yuille, A.L.; Zhou, Y. TransUNet: Transformers Make Strong Encoders for Medical Image Segmentation. arXiv 2021, arXiv:2102.04306. [Google Scholar]
  31. Woo, S.; Park, J.; Lee, J.-Y.; Kweon, I.S. CBAM: Convolutional Block Attention Module. In Computer Vision—ECCV 2018; Ferrari, V., Hebert, M., Sminchisescu, C., Weiss, Y., Eds.; Lecture Notes in Computer Science; Springer International Publishing: Cham, Switzerland, 2018; Volume 11211, pp. 3–19. ISBN 978-3-030-01233-5. [Google Scholar] [CrossRef]
  32. He, K.; Zhang, X.; Ren, S.; Sun, J. Deep Residual Learning for Image Recognition. In Proceedings of the IEEE Conference on Computer Vision and Pattern Recognition, Boston, MA, USA, 11–12 June 2015; pp. 770–778. Available online: https://openaccess.thecvf.com/content_cvpr_2016/html/He_Deep_Residual_Learning_CVPR_2016_paper.html (accessed on 4 September 2025).
  33. Dosovitskiy, A.; Beyer, L.; Kolesnikov, A.; Weissenborn, D.; Zhai, X.; Unterthiner, T.; Dehghani, M.; Minderer, M.; Heigold, G.; Gelly, S.; et al. An Image Is Worth 16x16 Words: Transformers for Image Recognition at Scale. arXiv 2021, arXiv:2010.11929. Available online: https://arxiv.org/pdf/2010.11929/1000 (accessed on 4 September 2025).
  34. Xue, Y.; Cai, X.; Shadabfar, M.; Shao, H.; Zhang, S. Deep Learning-Based Automatic Recognition of Water Leakage Area in Shield Tunnel Lining. Tunn. Undergr. Space Technol. 2020, 104, 103524. [Google Scholar] [CrossRef]
  35. Buslaev, A.; Iglovikov, V.I.; Khvedchenya, E.; Parinov, A.; Druzhinin, M.; Kalinin, A.A. Albumentations: Fast and Flexible Image Augmentations. Information 2020, 11, 125. [Google Scholar] [CrossRef]
  36. Russell, B.C.; Torralba, A.; Murphy, K.P.; Freeman, W.T. LabelMe: A Database and Web-Based Tool for Image Annotation. Int. J. Comput. Vis. 2008, 77, 157–173. [Google Scholar] [CrossRef]
  37. Ronneberger, O.; Fischer, P.; Brox, T. U-Net: Convolutional Networks for Biomedical Image Segmentation. In Medical Image Computing and Computer-Assisted Intervention—MICCAI 2015, Munich, Germany, 5–9 October 2015; Navab, N., Hornegger, J., Wells, W., Frangi, A., Eds.; MICCAI 2015, Lecture Notes in Computer Science; Springer: Cham, Switzerland, 2015; Volume 9351. [Google Scholar] [CrossRef]
  38. Chen, L.C.; Zhu, Y.; Papandreou, G.; Schroff, F.; Adam, H. Encoder-Decoder with Atrous Separable Convolution for Semantic Image Segmentation. In Computer Vision—ECCV 2018, 5th European Conference, Munich, Germany, 8–14 September 2018; Ferrari, V., Hebert, M., Sminchisescu, C., Weiss, Y., Eds.; ECCV 2018. Lecture Notes in Computer Science; Springer: Cham, Switzerland, 2018; Volume 11211. [Google Scholar] [CrossRef]
  39. Badrinarayanan, V.; Kendall, A.; Cipolla, R. SegNet: A Deep Convolutional Encoder-Decoder Architecture for Image Segmentation. IEEE Trans. Pattern Anal. Mach. Intell. 2017, 39, 2481–2495. [Google Scholar] [CrossRef]
  40. Yu, C.; Gao, C.; Wang, J.; Yu, G.; Shen, C.; Sang, N. BiSeNet V2: Bilateral Network with Guided Aggregation for Real-Time Semantic Segmentation. Int. J. Comput. Vis. 2021, 129, 3051–3068. [Google Scholar] [CrossRef]
  41. Lin, T.-Y.; Dollar, P.; Girshick, R.; He, K.; Hariharan, B.; Belongie, S. Feature Pyramid Networks for Object Detection. In Proceedings of the 2017 IEEE Conference on Computer Vision and Pattern Recognition (CVPR), Honolulu, HI, USA, 21–26 July 2017; IEEE: Piscataway, NJ, USA, 2017; pp. 936–944. [Google Scholar] [CrossRef]
  42. Jha, D.; Riegler, M.A.; Johansen, D.; Halvorsen, P.; Johansen, H.D. DoubleU-Net: A Deep Convolutional Neural Network for Medical Image Segmentation. In Proceedings of the 2020 IEEE 33rd International Symposium on Computer-Based Medical Systems (CBMS), Rochester, MN, USA, 28–30 July 2020; IEEE: Piscataway, NJ, USA, 2020; pp. 558–564. [Google Scholar] [CrossRef]
  43. Zhou, Z.; Rahman Siddiquee, M.M.; Tajbakhsh, N.; Liang, J. UNet++: A Nested U-Net Architecture for Medical Image Segmentation. In Deep Learning in Medical Image Analysis and Multimodal Learning for Clinical Decision Support; Stoyanov, D., Taylor, Z., Carneiro, G., Syeda-Mahmood, T., Martel, A., Maier-Hein, L., Tavares, J.M.R.S., Bradley, A., Papa, J.P., Belagiannis, V., et al., Eds.; Lecture Notes in Computer Science; Springer: Cham, Switzerland, 2018; Volume 11045. [Google Scholar] [CrossRef]
  44. Cao, H.; Wang, Y.; Chen, J.; Jiang, D.; Zhang, X.; Tian, Q.; Wang, M. Swin-Unet: Unet-like Pure Transformer for Medical Image Segmentation. In Proceedings of the European Conference on Computer Vision Workshops, Tel Aviv, Israel, 23–27 October 2022; Avidan, S., Brostow, G., Cissé, M., Farinella, G.M., Hassner, T., Eds.; ECCVW 2022. Lecture Notes in Computer Science. Springer: Cham, Switzerland, 2022; Volume 13673. [Google Scholar] [CrossRef]
  45. Wang, H.; Wang, Z.; Du, M.; Yang, F.; Zhang, Z.; Ding, S.; Mardziel, P.; Hu, X. Score-CAM: Score-Weighted Visual Explanations for Convolutional Neural Networks. In Proceedings of the 2020 IEEE/CVF Conference on Computer Vision and Pattern Recognition Workshops (CVPRW), Seattle, WA, USA, 14–19 June 2020; IEEE: Piscataway, NJ, USA, 2020; pp. 111–119. [Google Scholar] [CrossRef]
  46. Li, X.; Zhang, H.; Yang, H.; Li, T.-Q. CS-MRI Reconstruction Using an Improved GAN with Dilated Residual Networks and Channel Attention Mechanism. Sensors 2023, 23, 7685. [Google Scholar] [CrossRef]
  47. Guo, Z.; Wei, J.; Sun, H.; Zhong, R.; Ji, C. Enhanced Water Leakage Detection in Shield Tunnels Based on Laser Scanning Intensity Images Using RDES-Net. IEEE J. Sel. Top. Appl. Earth Obs. Remote Sens. 2024, 17, 5680–5690. [Google Scholar] [CrossRef]
  48. Zhang, W.; Cui, K.; Chen, X.; Ran, Q.; Wang, Z. One Novel Hybrid Flexible Piezoresistive/Piezoelectric Double-Mode Sensor Design for Water Leakage Monitoring. ACS Appl. Mater. Interfaces 2024, 16, 1439–1450. [Google Scholar] [CrossRef] [PubMed]
Figure 1. CBAM-TransUNet model architecture for water leakage detection.
Applsci 15 10006 g001
Figure 2. CBAM structure.
Applsci 15 10006 g002
Figure 3. Partial dataset demonstration. (a) Self-made dataset and (b) open-source metro tunnel dataset.
Applsci 15 10006 g003
Figure 4. Example diagram of the data augmentation process.
Applsci 15 10006 g004
Figure 5. The process of converting the original image into a mask.
Applsci 15 10006 g005
Figure 6. Training loss curve of the CBAM-TransUNet model.
Applsci 15 10006 g006
Figure 7. Visual segmentation results of tunnel water leakage images using various models.
Applsci 15 10006 g007
Figure 8. The comparison results of Score-CAM heatmaps for the model after removing the CBAM and the ViT module.
Applsci 15 10006 g008
Table 1. Evaluation metrics for various water leakage detection models.
Model NameIoUDiceRecallPrecisionAccuracySpecificityAUCMCCF1-Score
CBAM-TransUNet0.81430.84330.95180.84820.98370.98660.97460.85680.8970
TransUNet0.77560.81570.93970.81600.98550.98820.97330.84770.8726
Swin-Unet0.80790.82260.94880.81120.98710.98590.95120.84570.8747
UNet0.75080.83460.92900.79560.97420.98420.96840.83090.8564
DeepLabV3plus0.68020.79920.93020.71930.98110.98310.96810.80650.8112
SegNet0.66220.78590.92220.70390.97900.98130.93110.79340.7983
BiSeNetV20.61110.73160.85350.68740.97600.98090.92510.75110.7614
FPN0.79960.82960.95600.74710.98400.98520.97100.83510.8387
DoubleUNet0.69480.81110.94490.72770.98260.98440.96960.81800.8221
NestedUNet0.69440.80980.94610.72530.98130.98260.96260.81720.8211
Table 2. Various evaluation indicators of the tunnel water leakage model in the ablation experiment.
Step NumberAblation ModuleIoUDiceRecallPrecisionAccuracyF1-Score
0None0.81430.84330.95180.84820.98370.8970
1Skip-CBAM10.79700.77480.91640.85670.97090.8848
2Skip-CBAM20.79220.80730.90810.85790.97290.8818
3Skip-CBAM30.77330.76850.95330.80390.98500.8711
4Deep-CBAM0.76460.79710.93260.79790.98410.8589
5ViT0.75080.83460.92900.79560.97420.8564
Disclaimer/Publisher’s Note: The statements, opinions and data contained in all publications are solely those of the individual author(s) and contributor(s) and not of MDPI and/or the editor(s). MDPI and/or the editor(s) disclaim responsibility for any injury to people or property resulting from any ideas, methods, instructions or products referred to in the content.