Abstract
A systematic and highly efficient current commands generator for an interior permanent magnet synchronous motor (IPMSM) in electric vehicles is proposed. This paper integrates maximum torque per ampere (MTPA), maximum power control (MPC), and maximum torque per voltage (MTPV) criteria for optimal efficiency, and systematically establishes an optimal current control commands workflow. A rapid current commands mapping technique and an automatic high efficiency of all speed range current command generator are proposed. The automatically generated commands table can be effectively applied in a motor controller to reduce the energy consumption of an electric vehicle for all operating speed range. A graphical user interface (GUI) tool for the generator, which can automatically produce the current command (look-up tables, LUT) in an Excel format, is designed. High-speed field-weakening and zero-torque cruising (ZTC) in electric vehicles are also thoughtfully considered. By using the proposed method, motor controller designers can more rapidly adjust required motor current command tables and speed up the development period. Both GUI simulation and experimental results show the effectiveness and feasibility of the proposed method.
1. Introduction
The electrification of vehicles is an important trend for the future, and electric drive motors and controllers can be seen as emerging products that replace internal combustion engines. For this reason, electric drive technology has become a competitive field among major automakers and tier 1 suppliers. It is well known that DC motors have simple control and low costs, but their reliability and efficiency are relatively poor. Induction motors have the longest development history and are widely adopted in the industry, with mature control technology and good reliability, but their overall average efficiency and power density are lower. In contrast, permanent magnet synchronous motors are currently applied in many cases requiring high efficiency and high power density. Their controller costs and technical thresholds are intermediate among various motors, but due to their high efficiency characteristics, permanent magnet synchronous motors have gradually become the mainstream type of motor for electric vehicles in recent years.
For the above reasons, interior permanent magnet synchronous motors currently represent high-efficiency and high-power density drive motors, which have been widely applied in popular electric vehicles, industrial automation, and intelligent equipment [1,2,3]. Particularly, IPMSM is very suitably applied for high efficiency and a wide speed range in electric vehicles under quickly changing loads. Thus, how to ensure an IPMSM operates in optimal efficiency for the full speed range is very important. The results also greatly improve energy consumption and extend cruising range for an electric vehicle.
In the field of IPMSM control, three control strategies, MTPA, MPC, and MTPV, are usually used to enhance the efficiency and performance of motor systems. The MTPA strategy focuses on generating maximum torque at a given current, thereby reducing copper losses and improving efficiency, making it especially suitable for the medium to low-speed range. There are off-line methods such as linear flux–current relationships, nonlinear flux–current relationships, formulation from torque measurement, etc., and on-line MTPA from motor parameter estimation, extremum seeking, etc. Ideally, linear flux–current relationships are the simplest; nonlinear flux–current relationships still need to omit the current dependences of the apparent inductances and PM flux linkage for the sake of space reduction, and another method is based on torque measurement [4,5]. In refs. [6,7], they track the MTPA trajectory by using adaptive laws and sensorless control with load varying. In addition, signal injection [8] and parameter identification for online MTPA [9,10] were proposed. However, the dynamics are typically slower.
On the other hand, MPC aims to maximize output power and is commonly found in applications requiring high power output. MTPV maximizes torque output under voltage limit conditions in the high-speed range to extend the operating range of the motor [11,12]. Algorithms can automatically determine the parameters of the machine and use them to auto-tune the controllers, considering the flux-weakening (FW) control in [13]. In ref. [14], the authors developed an FW algorithm that is capable of working in the MTPV region without switching algorithms. In addition, the authors implemented an FW algorithm with torque reference and the speed limit in a unified scheme, which can be applied in a low-level microcontroller. It achieved a smooth transition among all possible trajectories [15].
To summarize, there is a great number of approaches to the individual implementation of MTPA, MPC, and MTPV algorithms. However, there are a few studies that integrate all strategies and produce an overall current command map. Herein, the goal of this paper is to seamlessly switch the MTPA, MPC, and MTPV current command strategies for an electric vehicle. In order to rapidly integrate these strategies, the simplest MTPA, MPC, and MTPV [16] are introduced in this paper. There is no complicated computation. These methods can be easily implemented and also fine-tuned quickly in look-up tables, which satisfies the goal of this research.
In ref. [17], the previous conference paper showed how to draw torque–speed curves and d-q axes current curves. However, it does not have complete functions such as the following. There are not (a) automatically generated look-up tables; (b) zero-torque cruising control; (c) verified in a real E-bus system; and (d) improved GUI parameters input and marked boundary points. Additionally, the literature [18] indicates that these weak magnetic strategies each have their applicable scenarios and performance advantages; there is a key challenge in current research and engineering practice, which remains how to effectively integrate these strategies and automatically switch between them based on different operating conditions.
To achieve efficient operation of motors under various working conditions, practical applications often establish pre-defined current command look-up tables, storing the optimal current parameters corresponding to different speed and torque conditions in the controller [19,20,21,22]. This approach not only shortens the system response time but also avoids complex instantaneous calculations, enhancing the real-time performance of the controller. Most of the existing practical applications indicate that the establishment of the look-up tables is based on motor characteristic testing and mathematical modeling, combined with a large amount of experimental data for parameter calibration. In addition, using look-up tables to assist nonlinear modeling was applied [19]. A model-parameter-free (MPF) method [23] using a look-up table or ultralocal model was presented. A current prediction model without any motor parameters is constructed, and it only contains the current difference and voltage difference. Additionally, a look-up table model is established, which realizes the high-precision observation of the torque [24], and a look-up table is formed to indicate the occurrence of different faults in PMSMs [25], respectively. Most research, as the above studies focused on, uses look-up tables to accurately model systems, reduce the parameter sensitivity of current control, save hardware cost, etc. However, how to effectively and rapidly establish optimal look-up tables of d-q current commands is rarely discussed, especially in electric vehicle applications. However, the accuracy and coverage of the look-up tables directly affect the overall performance of the system. Relying solely on a limited number of sampling points may lead to errors in control commands under certain working conditions; thereby, it will affect the motor’s efficiency and stability.
To further optimize the accuracy of these performance tables, an interpolation algorithm is strategically employed [26,27]. Common interpolation methods include nearest, linear, natural spline interpolation [28,29,30], etc. Nearest neighbor interpolation is simple to compute but can easily produce a step effect. Linear interpolation generally provides smoother results under most conditions but may still introduce errors in nonlinear regions. Natural spline interpolation can further enhance the continuity and precision of curves, but it requires significantly more computational effort. The literature indicates that the choice of interpolation methods should be balanced based on motor characteristics and system requirements to achieve the best trade-off between accuracy and computational efficiency. Herein, linear interpolation is the most popular and is used in this research.
Although the look-up table method has been widely used in many applications, there is no integrated tool with a standard operation process (SOP) to deeply integrate optimization of the three core methods (MTPA, MPC, MTPV) and the zero-torque cruising (ZTC) strategy so far. Many motor controller designers for EV powertrain development have to spend a lot of time establishing optimal look-up tables and fine-tuning the tables. On the other hand, some engineers may also use the rule of thumb and trial-and-error methods to save development time. These reasons mentioned above have motivated this research.
The research focuses on seamless switching of optimal current command strategies in an electric vehicle and on developing a technique for automatically producing current commands based on theoretical derivation. The research aims to establish a rapid and optimal current commands generator, which is with systematically integrates various command strategies and automatically produces current command look-up tables in full speed range for high efficiency operation. The detailed works are illustrated as follows.
This paper allows a more comprehensive mapping of motor characteristics. It can provide a more continuous representation of the motor’s performance across various operating conditions. Additionally, a graphical user interface is developed for providing motor design developers with more efficient and intelligent development tools. This paper focuses on two parts. The first part highly integrates the efficiency distribution of the current control. The second part is to develop a GUI with SOP, which can easily provide high-efficiency control of current commands at different operating speeds and torques. The GUI offers intuitive parameter configuration, characteristic curve display, and performance analysis. MTPA, MPC, MTPA, and ZTC strategies are systematically embedded into the GUI software, and corresponding look-up tables will be automatically generated in an xlsx file. For these reasons, it greatly saves engineers’ tuning and calibration time and associated development costs of an IPMSM system.
This paper is organized as follows. Section 2 describes a dynamic equation of an IPMSM powertrain. Section 3 illustrates a current commands map generator, including optimal current curves, GUI design, data management, and a look-up table generator. Section 4 shows simulation and experimental results. Finally, the conclusion is given in Section 5.
2. PMSM in the Powertrain of an Electric Vehicle
In an electric vehicle application, the throttle command represents the torque command. Then, the torque of an IPMSM is generated from three-phase currents. In order to obtain high operating efficiency for a wide speed range, optimal current commands of an IPMSM at different speeds are necessary. Firstly, consider the d-q dynamic model of an IPMSM in the synchronous reference as
where and are the d-q axes stator voltages, and are the d-q axes stator currents, is the stator inductance of the q axis, is the stator inductance of the d axis, is the stator resistance, is the electrical angular velocity, and is the permanent flux linkage. The electromagnetic torque can be represented as
where is the number of poles, peak current amplitude , and the current angle between the stator current vector and the q axis . The magnitude of the angle represents a ratio between and , which directly affects the torque in (2). In other words, the electromagnetic torque can also be represented as
In general, is smaller than . Let be negative and be positive. Thus, there is additional reluctant torque plus Lorentz torque under an optimal set of and . At different speeds, an optimal set of and will be changed accordingly to obtain maximum torque. In the past many years, motor controller designers usually used the rule of thumb and trial and error methods to obtain suitable look-up tables of and , which provide high efficiency characteristics. However, these methods will require much tuning and calibration time, and further increase development cost. For this reason, a systematic and automatic look-up table generation technique is necessary and illustrated in the following sections.
3. Current Commands Map Generator
This section presents a combined MTPA, MPC, and MTPV algorithm, which is used to develop a graphical user interface tool and an automatic look-up table generator. In addition, the look-up tables also consider a strategy of zero-torque cruising in an electric vehicle.
3.1. Description of MTPA/MPC/MTPV
3.1.1. Maximum Torque per Ampere
In an IPMSM application, there are several kinds of losses, including copper loss, iron loss, mechanical loss, and stray loss. In order to achieve optimal motor performance, it is necessary to minimize these losses. In a low speed range, copper loss is the major loss contribution, which occupies approximately 70~80% of total losses. A well-known technology, “Maximum Torque Per Ampere (MTPA)”, is a very useful strategy to reduce copper losses and generate the required torque using the minimum magnitude current. According to the current limit circle contours, a current limit circle represents a maximum current set in the d-q axes plane. A constant torque curve has a tangent intersection at a constant current curve, which represents a maximum torque point at this current limit. In order to find out this point, take the differentiation of torque with respect to current between and from (2), one obtains [16]
Equivalently,
Then,
Since and in an IPMSM for optimal operation quadrant, using (6), it can obtain the d-axis current as
Then, the q-axis current can be obtained accordingly: . The solved d-q axes currents ensure that the motor operates with the lowest possible copper loss while maintaining the required torque.
3.1.2. Maximum Power Control
Typically, motors are designed to utilize the maximum available voltage at rated speed. However, beyond this point, field-weakening control is necessary to be applied to maintain operation at a higher speed. The method is to increase the magnitude of the d-axis current and reduce the magnitude of the q-axis current. The most important thing is to effectively manage d-axis and q-axis currents to sustain efficient performance while minimizing torque reduction. Thus, the power maximization in the field-weakening region will be considered. For this reason, the voltage limit is described as , where is the peak magnitude voltage. The rotor flux can be seen as a virtual current source , i.e., . In the steady-state model with lossless, Equation (1) can be represented as and . Then, one obtains [16]
This is a voltage equation of an ellipse. With lossless of the motor model as mentioned above, the electric power is given as
To obtain maximum electric power in the field-weakening region, the two curves and need to be less than or equal to zero, where
where . The maximum power point can be found at an intersection of the two curves when and equals zero according to the geometric viewpoint. These intersection points form a locus that represents the maximum achievable power across different speeds. Specifically, substituting into , thus:
To obtain from solving (12) in the second quadrant is meaningful in a practical IPMSM system. Then, negative and positive are ensured, and the d-axis current command can be solved as
and q-axis current command can be solved as , respectively. As a result, this approach is commonly named maximum power control (MPC).
3.1.3. Maximum Torque per Voltage
For the current limits and voltage limits in the second quadrant, it is well known that there are three cases, including , , and . In the MTPV, this control strategy represents a scenario where the current limit circle encompasses the center of the voltage limits, which means . Under this scenario, infinite speed operation becomes theoretically possible without reducing power to zero. Therefore, there is only one condition , which is valid in the high speed range of an IPMSM. Once , the current magnitude of and will be gradually reduced by the speed increase. Finally, , and .
On the other hand, there is a break speed point, named . As , the maximum torque point is located at a tangential intersection with the voltage limit curve. In contrast, as , maximum torque is at the intersection between the current limit circle and the voltage limit circle.
From (8), the flux equation can be represented as [16]
where is the d-axis flux linkage. Substituting (14) into (2), and taking the differentiation of the obtained torque equation with respect to , and making it equal to zero. Then, one obtains
By using (15), and can be determined as
As a result, this approach is commonly named maximum torque per voltage (MTPV). It is particularly useful in high-speed operation.
3.2. Combination of MTPA/MPC/MTPV
Intersection Speed Determination
To achieve full speed range control in an IPMSM for electric vehicle applications, the basic combination of MTPA, MPC, and MTPV strategies is necessary. Through seamless and smoother control in the three kinds of strategies, high efficiency of the full speed range in an IPMSM can be guaranteed. For a constant maximum magnitude current, and as the motor speed increases, the IPMSM gradually approaches the maximum feasible speed as , which is the highest speed at which the motor can maintain maximum torque without exceeding voltage limits.
The first step is to determine the intersection speed between MTPA and MPC strategies. MTPA is a fundamental and critical control method, particularly effective in low-speed regions, optimizing current distribution to achieve maximum torque output. According to (14), when , the base speed can be solved as
After the base speed, field-weakening control must be introduced. Then, the curve is in the MPC region. The second step is to determine the intersection between MPC and MTPV. Define , , , and . Substitute , , , and into (15), and then in MTPV (16) can be represented as
The can be solved when the derived from both MPC (13) and MTPV (19) control strategies are equivalent. Thus,
Equation (20) can be represented as a quadratic equation, , where . By direct computation, it can get , the intersection speed point between MPC and MTPV.
3.3. Zero-Torque Cruising (ZTC)
Generally, there are forward driving mode, reverse driving, and regenerating mode in electric vehicle applications. As mentioned in Section 3.2, a combination of MTPA/MPC/MTPV can be effectively used in the different modes. According to (3), controlling an optimal set of and can produce optimal efficiency for positive or negative torque under different motor speeds. However, there is still a special operation scenario, which is zero-torque cruising. When motor speed exceeds the base speed, the back EMF is larger than the DC voltage limit, which causes an uncontrolled regenerative energy even though there is no torque command. For this reason, high-speed cruising without torque output is necessary to be considered. From (1), with lossless, the steady-state dynamic equation is given as
It is known that back EMF at base speed is . In other words, the back EMF is larger than the three-phase voltage provided by a DC power source after the base speed. Thus, let us define an inequality as
Substitute (21) and (22) into (23) and let to ensure zero torque according to (3). Equation (23) can be rewritten as
Once exceeds the base speed , and power switches without control, the back EMF will cause an unexpected braking phenomenon in an electric vehicle. In order to eliminate the back EMF effect, the power switches have to be controlled. Equation (24) has to be satisfied by choosing the smallest magnitude of negative . Therefore, the negative magnitude of can be obtained accordingly, and the magnitude of is becoming large when increasing motor speed. Thus, the zero-torque cruising strategy will be implemented.
3.4. Graphical User Interface Design
A key goal of this paper is to develop a graphical user interface (GUI) of this system, which is specifically customized for motor control design. It provides an intuitive, efficient, and professional operational experience for engineers. The proposed GUI supports an electrical drive system in parameter setting, control strategy switching, and performance analysis during the research and application development process. The interface is structured into three core functionalities and ZTC, including parameter configuration, performance curves, and data management. Figure 1 shows the GUI usage process. Firstly, motor parameters are inputs of the GUI. Then, the proposed GUI can automatically draw performance curves, including speed versus torque, speed versus iq current, and speed versus id current. Then, look-up tables can also be established. Users can enter the desired torque at a specific speed, and then the GUI can output the corresponding d-q current commands. The detailed contents are illustrated in the following sub-sections.
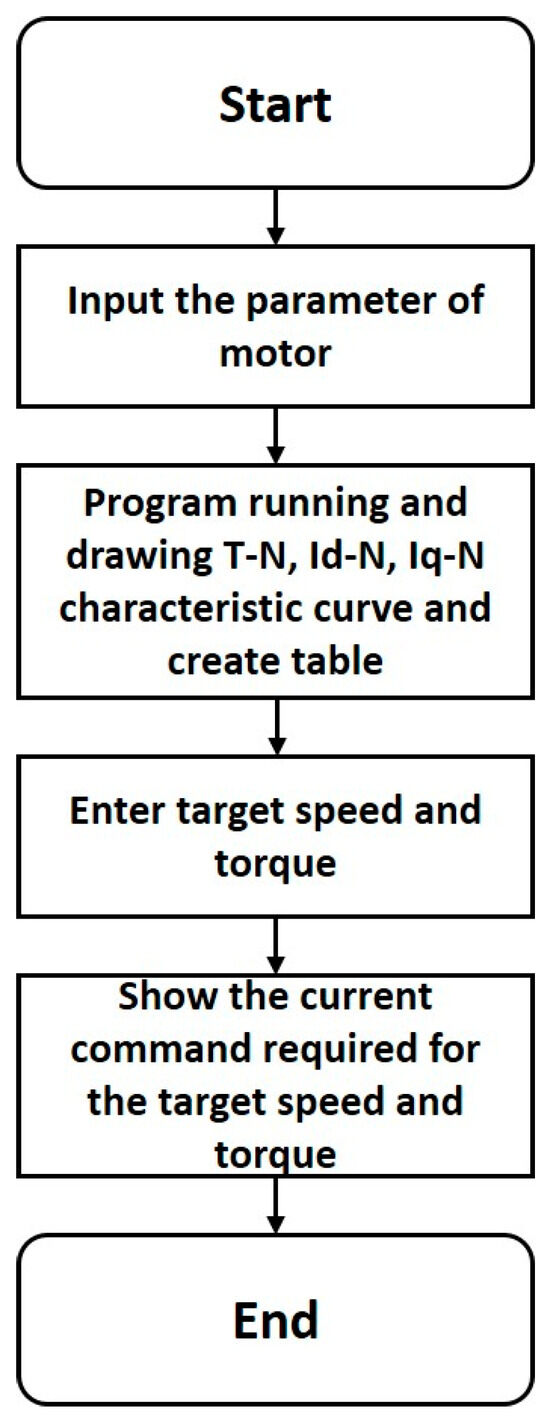
Figure 1.
GUI usage process.
3.4.1. Parameters Configuration
In Figure 2 (Tab1 page), the basic parameters of the motor and control conditions are divided into two columns, providing users with complete and flexible settings. The left column is the input area for the physical characteristics of the motor, where users need to input key parameters such as d-axis and q-axis inductances (, ), stator resistance (), permanent magnet flux linkage (), number of poles (), as well as maximum magnitude voltage () and maximum magnitude current (). The right column serves as the setting area for control calculation conditions, including current decrement step (I_step), speed increment step (N_step), torque increment step (T_step), maximum speed and maximum torque limits (rpm limit, T limit), and current display selection (select I), respectively.
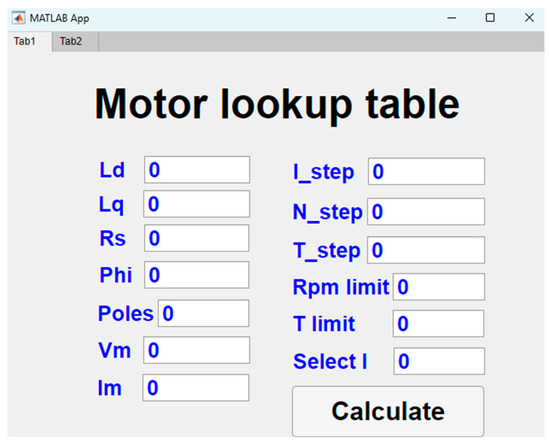
Figure 2.
Initial screen of the designed GUI.
3.4.2. Performance Curves
The system automatically calculates the d-q axis current distribution based on the motor parameters input by the user, combining the mathematical algorithms of the control strategies (MTPA, MPC, MTPV) established previously in Section 3.1, Section 3.2 and Section 3.3. It also plots the torque–speed (T-N) curves, d-axis current–speed (id-N) curves, and q-axis current–speed (iq-N) curves. Through this visualization, users can grasp the efficiency performance of the motor under various operating conditions, leading to a performance comparison and identification of the optimal efficiency region.
Torque–speed (T-N) curves can show the corresponding maximum output torque achievable under different speed conditions for a fixed current magnitude. This graph clearly reflects the characteristic behavior of a permanent magnet synchronous motor across the entire speed range, particularly in the mid-to-high-speed area, where the torque curve significantly drops as the voltage limit is approached. It indicates the need to enter the field-weakening control region. The system can automatically plot the corresponding T-N curves based on the maximum current and current step values input by the user, serving as a foundational reference for look-up tables and subsequent controller parameter comparison.
In q-axis current–speed (iq-N) curves, the horizontal axis represents motor speed (rpm) and the vertical axis represents q-axis current (Iq). Each curve in the figure represents the variation in the required Iq current at different speeds under fixed magnitude current output conditions. These curves are used to assist in analyzing the distribution behavior of current control strategies across the entire speed range, particularly to observe the attenuation trend of Iq with speed in the field-weakening region.
Similarly, in d-axis current–speed (id-N) curves, the horizontal axis represents motor speed (rpm) and the vertical axis represents d-axis current (Id). Each curve in the figure represents the variation in the required Id current at different speeds under fixed magnitude current output conditions. Compared to the iq-N curves, the id-N curves can more directly reflect the characteristics of the control strategy switching point, such as and . The above curves have been demonstrated in the next simulation and experimental results.
3.4.3. Data Management and Look-Up Tables Generator
Users can directly save the current command data generated automatically by the system to create corresponding look-up tables. Using the look-up tables, users can quickly obtain the corresponding optimal d-q axis current combination based on any given torque and speed conditions to achieve real-time control command generation. Further, look-up tables can be exported as an xlsx file, which facilitates being implemented into an embedded motor controller. Figure 3 shows the dynamic look-up function of the table module in the tool page Tab2. Users can specify the operation points they want to inquire about through the input fields in the left block, including specific torque (N·m) and speed (rpm) conditions. Then, the system will perform interpolation calculations in real-time using the data tables created in Tab1, and display the corresponding d-axis and q-axis current command values in the right side output area. The detailed software flow chart is shown in Figure 4. The software logically judges which strategy will be used according to decided , , and . By decreasing the current magnitude with a specific current step, corresponding performance curves will be produced, and related data will be saved as look-up tables.
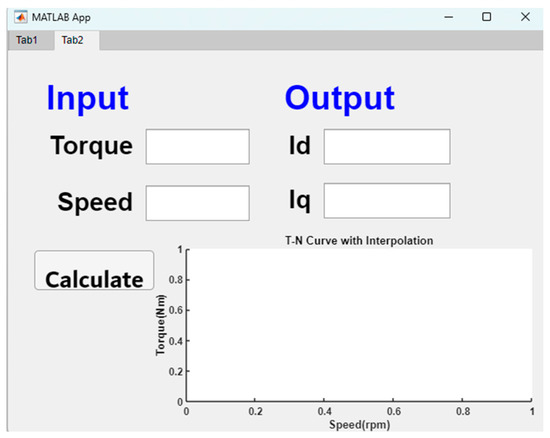
Figure 3.
The function of look-up table.
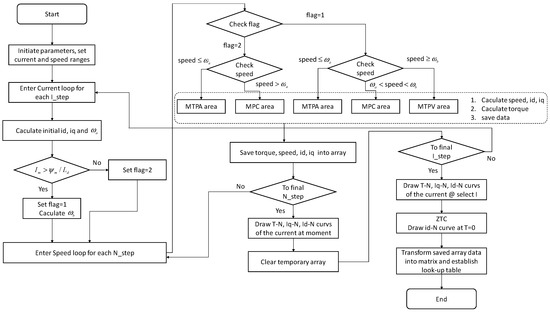
Figure 4.
Software flow chart.
4. Simulation and Experimental Results
In this section, an electric bus motor system is considered. The specification of an electric bus IPMSM is given in Table 1. In the electric bus motor system, the DC voltage from a high-voltage power supplier is set to 600 V.

Table 1.
Specification of an E-Bus IPMSM.
Figure 5a shows the GUI with parameters input according to Table 1. Since the motor is a Y connection type, the peak magnitude voltage is . In addition, the current decrement step (I_step), speed increment step (N_step), and torque increment step (T_step) are set as −20 A, 100 rpm, and 20 N.m, respectively. Engineers can decide these steps by themselves according to their design requirements for sure. Note that the smaller the step is, the more curves there are. In other words, a large dimension of look-up tables will be exported as an xlsx file. The other inputs of rpm limit and T limit mean display ranges of speed and torque in the figures, which do not affect the calculation results.
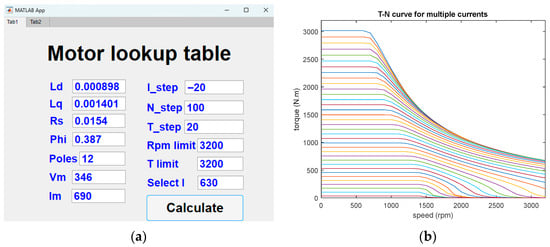
Figure 5.
(a) GUI with parameter input; (b) T-N curves for different currents .
Figure 5b shows speed versus curves according to different magnitudes of current in each set of steps. It shows the overall switching behavior of the three-stage control strategy in the tool. It can be observed that the calculated maximum torque is roughly 3000 N. m, while the specification limits the maximum speed to 3000 rpm; hence, there are no calculated values above 3000 rpm. In the low-speed constant torque range, the curve smoothly maintains the maximum torque according to each individual current. When the speed exceeds the MTPA → MPC boundary derived from voltage limits, the torque begins to slowly decrease with increasing speed, corresponding to the process of dynamic optimization considering voltage and current constraints in the MPC algorithm. In the higher speed range, the torque continuously decays after reaching the MPC → MTPV switching point .
This tool integrates the offline calculation results for each fixed current into a look-up table grid and connects each speed sampling point with linear interpolation to generate a continuous and smooth T–N curve. The seamless connection of the curve, the absence of jumps, and only minor deviations from the theoretical analysis solution demonstrate that the offline simulation and interpolation implementation of the tool successfully show the expected characteristics of the three-stage control strategy.
.
The corresponding curves of iq versus speed and id versus speed are shown in Figure 6a and 6b, respectively. In the MTPA mode, iq and id are constant because MTPA focuses on generating the maximum torque, which is called the constant torque region. Entering the MPC region, iq needs to be adjusted to balance voltage and current constraints, which is represented by slight upward or downward adjustments of the curve to obtain maximum power. Ultimately, entering MTPV, to maintain maximum efficiency, the variation in iq becomes more obvious with respect to the speed ratio. These offline curves read the pre-calculated Iq values from the tool mesh, and then linear interpolation is performed in 2D space using MATLAB 2020a ‘scatteredInterpolant’, converting discrete data into smooth curves. Comparing with actual measurement data provides evidence that the offline calculations and interpolation mechanism can accurately reflect the current distribution strategy under different operating conditions.
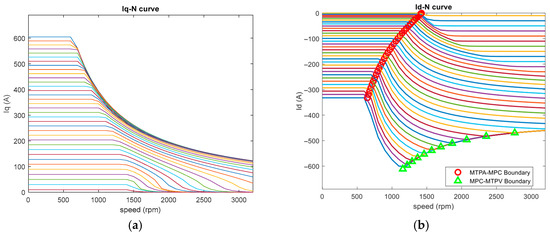
Figure 6.
(a) Q-axis current for different ; (b) D-axis current for different .
Figure 6b combines the switching boundaries marked in red circles (○) and green triangular (△) symbols, clearly revealing the positioning accuracy of MTPA to MPC and MPC to MTPV. D-axis current maintains a minimal negative value during the MTPA stage to reduce copper loss. When the speed reaches the first switching point indicated by the red circle, the tool reads and marks the corresponding speed from the offline rpmA_values, then recalculates the next id using the MPC model. At the second switching point marked by the green triangle, the calculation switches to MTPV. These boundary points are derived throughout by the analytical and numerical solving modules within the tool, imported into an offline grid, and annotated with interpolation curves to indicate positions. The marked points remain clearly focused amid multiple curves, indicating that the tool not only correctly calculates id under various modes but also exactly identifies and displays the speed conditions for switching control strategies. These diagrams comprehensively present the offline simulation capability and interpolation accuracy of the look-up table interpolation tool, which was developed in this research for high-efficiency control strategies of an IPMSM.
In order to enhance users’ understanding of the characteristics of control strategy switching, this system also provides a relationship diagram of q-axis current (iq) and speed (rpm) under the condition of a specific total current , as shown in Figure 7a. This diagram depicts the iq values required at different speeds when = 630 A, and clearly labels two points of key control strategy switching boundaries in the figure. Figure 7b illustrates the curve of d-axis current (id) versus speed (rpm) under a fixed magnitude current = 630 A. It can be observed that to meet the requirements for MTPV use, the magnitude current has to be greater than the magnetic flux linkage divided by the d-axis inductance value as ( = 424.28).
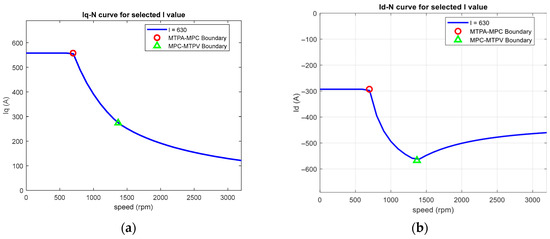
Figure 7.
(a) Q-axis current for constant ; (b) D-axis current for constant .
This visualization not only helps users understand the logic of strategic changes at a specific current operating point, but also provides a graphical control boundary recognition mechanism, which has high auxiliary value for data table arrangement, operating point selection, and control strategy development. Additionally, the graphs in Figure 7 also demonstrate that the system can automatically draw complete iq-N curves and id-N curves, respectively, and determine the control area transition points according to any current setting. It shows highly integrated real-time computing and interactive features. Figure 8a shows the output torque versus speed for a constant current = 630 A, accordingly.
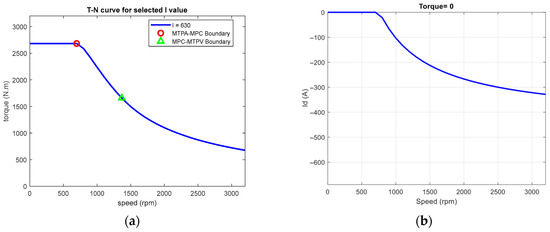
Figure 8.
(a) Torque–speed curve for constant ; (b) D-axis current for zero-torque requirement.
Figure 8b is in the zero-torque cruising mode. It shows the d-axis current characteristic curve automatically plotted by the system under zero-torque (torque = 0) operation, which intuitively presents the behavior of id as the motor speed changes. In this control mode, the q-axis current must be set to zero to ensure zero torque. Then, a negative d-axis current is required for flux weakening in order to suppress the back EMF when speed exceeds 750 rpm and avoid unexpected energy regeneration, which will cause abrupt braking for an electric vehicle. The theoretical analysis is given in Section 3.3. In addition, the result can serve as the foundational data for tool look-up tables and one-dimensional interpolation calculations using MATLAB’s “griddedInterpolant”. It demonstrates that this system fully implements the mathematical model on the simulation platform.
In summary, these figures not only demonstrate the high integration capability of the system’s graphical interface in visual output but also provide users with a basis for reviewing and judging control strategies under specific boundary conditions, which significantly enhances the efficiency of research analysis.
As mentioned before, optimal id/iq current commands in an xlsx file will be automatically produced after inputting parameters into the GUI, as shown in Figure 5a. Smaller current decrement step (I_step), speed increment step (N_step), and torque increment step (T_step) mean that there are larger dimension look-up tables, accordingly. Larger dimension look-up tables can provide more precise commands, but they need larger memory for storing tables. Therefore, the dimension can be decided by engineers themselves, who should consider the real situation, such as program size. Herein, to just show this function of automatically producing optimal id/iq current commands in an xlsx file, larger steps are set as N_step = 400 rpm, and T_step = 200 N.m. Then, Table 2 and Table 3 can be automatically produced as follows, which are 9 16 in dimension. Note that the current decrement step affects the data accuracy of the tables, but it does not determine the dimension of automatically generated tables. The table’s dimension is still decided by the speed increment step (N_step) and torque increment step (T_step).
Table 2.
Look-up table of optimal id command.
Table 3.
Look-up table of optimal iq command.
Experimental Results:
Figure 9 shows the experimental architecture, including a high-voltage power supplier, a low-voltage power supplier, a dynamometer, a power meter, a cooling system, and a calibration PC. The motor specification is shown in Table 1. The motor controller is based on a DSP TI TMS 570LS1114 core, and 1200V IGBTs are used for the inverter, which can provide 800 A peak current. The DC voltage is set as 600 V. A calibration tool PC can input id-iq current commands by CAN communication to the motor control, and perform a closed-loop current control in the DSP. By using optimal current id-iq command tables, which are automatically generated according to the settings shown in Table 1, the tables have been used in the DSP to test the motor performance.
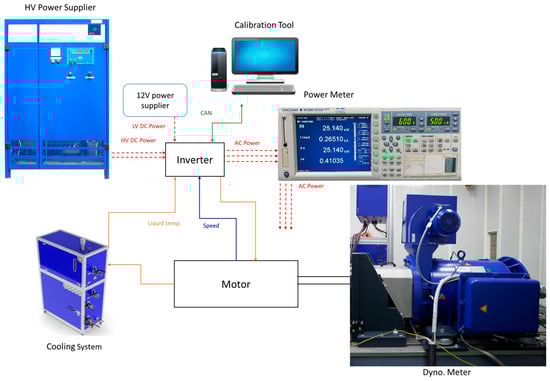
Figure 9.
Testing architecture of the electric powertrain.
Figure 10 shows the experimental efficiency map of the motor. In the rated power, the efficiency can achieve 95~96%. In addition, the efficiency map also shows a wide high efficiency zone (>91%) from 500 rpm to 2800 rpm. Due to the facility limitation, the testing is under 2900 rpm. Compared to the simulation curve of speed versus torque in Figure 5b, the performance curve is also very similar.
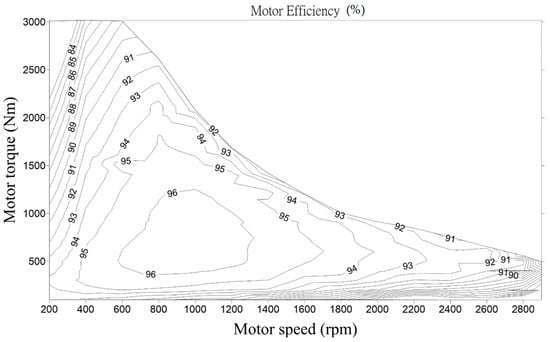
Figure 10.
Experimental efficiency map of the motor.
In addition, once the look-up tables are established as an xlsx file, engineers can use another function of the GUI to rapidly obtain an optimal control current for specific operation conditions, such as a fixed torque and speed. The function is shown in Figure 11. It can be observed that the optimal id and iq commands are −218.13 A and 223.67 at 1000 N. m and 1500 rpm conditions, respectively. In summary, the simulation and experimental results demonstrate that the automatically generated look-up tables of id-iq current commands are successfully used in an E-bus motor system to satisfy optimal operating current. Finally, the specification performance is achieved, and the results show that the proposed strategy tool is indeed useful to motor control engineers for saving development time.
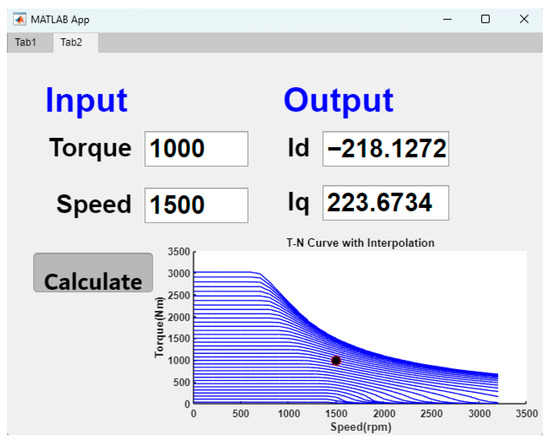
Figure 11.
Optimal current commands for a specific operation point.
In future work, the proposed development process and tools can be extended to use other specific MTPA, MPC, FW, and MTPV algorithms to intensify optimal accuracy under different operation zones. A consideration of parameter identification and adaptive laws under parametric variations to integrate look-up tables can be based on simple look-up tables (without complicated computation) to obtain more precise current commands.
5. Conclusions
This paper develops an optimal d-q axes current command generator of an IPMSM for the highest efficiency application. Particularly, it is very helpful and significant in recent popular electric vehicles. Full speed range for high efficiency can be achieved. A novel tool of graphical user interface (GUI) for the generator, which can automatically produce current command maps (look-up tables) in an Excel format, is exported.
The advantages include the following: (1) The proposed standard operation process guarantees a high efficiency powertrain system and effectively reduce energy consumption in an electric vehicle; (2) a GUI interaction provides a more convenient and intuitive operation to assist engineers for controlling an IPMSM, and to replace trail and error in general; (3) automatically produced look-up tables provide an alternative method to integrate an embedded motor control system, which can save calibration time; and (4) a kook-up table is still a good method in real industrial or automotive fields, since it can greatly reduce computation time.
Although most microprocessors can handle and real-time compute complex algorithms nowadays, effectively applying look-up tables can release more capacity of a microprocessor to implement other advanced techniques. In addition, the automatic current commands generator also considers a zero-torque cruising strategy in electric vehicles, which is rarely involved in a look-up table generator. In summary, the proposed method has been successfully implemented in an E-bus powertrain system and indeed saves engineers’ calibration time.
Author Contributions
Conceptualization, S.-H.C. Chang; methodology, S.-H.C. Chang; software, H.-Y.Y. Yeh; validation H.-Y.Y. Yeh; formal analysis, S.-H.C. Chang; investigation, S.-H.C. Chang and H.-Y.Y. Yeh; resources, S.-H.C. Chang; data curation, H.-Y.Y. Yeh.; writing—original draft preparation, S.-H.C. Chang; writing—review and editing, S.-H.C. Chang; visualization, H.-Y.Y. Yeh; supervision, S.-H.C. Chang; project administration, S.-H.C. Chang; funding acquisition, S.-H.C. Chang and H.-Y.Y. Yeh. All authors have read and agreed to the published version of the manuscript.
Funding
This research was funded by the Industrial Technology and Research Institute in Taiwan (R.O.C.), under Grant G353CC1100 and the National Science and Technology Council of Taiwan (R.O.C.), under Grant 114-2221-E-033-038.
Institutional Review Board Statement
Not applicable.
Informed Consent Statement
Not applicable.
Data Availability Statement
Data is contained within the article.
Acknowledgments
The authors of this work would like to thank the Industrial Technology Research Institute, Mechanical and Mechatronics Systems Research Labs, Intelligent Mobility Technology Division, Hsinchu, Taiwan, for the use of their experimental facilities.
Conflicts of Interest
The authors declare no conflicts of interest.
References
- Liao, G.; Zhang, W.; Cai, C. Research on a PMSM Control Strategy for Electric Vehicles. Adv. Mech. Eng. 2021, 13, 16878140211051462. [Google Scholar] [CrossRef]
- Özçiflikçi, O.K.; Koç, M.; Bahçeci, S.; Emiroğlu, S. Overview of PMSM Control Strategies in Electric Vehicles: A review. Int. J. Dyn. Control 2024, 12, 2093–2107. [Google Scholar] [CrossRef]
- Zhu, Z.Q.; Chu, W.Q.; Guan, Y. Quantitative comparison of electromagnetic performance of electrical machines for HEVs/EVs. CES Tran. Electr. Mach. Syst. 2017, 1, 37–47. [Google Scholar] [CrossRef]
- Zuo, K.; Wang, F.; Li, Z.; Ke, D.; Kennel, R.; Heldwein, M.L. A Robust Unified Strategy for Maximum Torque per Ampere and Field Weakening in Permanent Magnet Synchronous Motor. IEEE Trans. Power Electron. 2024, 39, 5286–5297. [Google Scholar] [CrossRef]
- Dianov, A.; Tinazzi, F.; Calligaro, S.; Bolognani, S. Review and Classification of MTPA Control Algorithms for Synchronous Motors. IEEE Trans. Power Electron. 2022, 37, 3990–4007. [Google Scholar] [CrossRef]
- Dianov, A.; Anuchin, A. Adaptive Maximum Torque per Ampere Control of Sensorless Permanent Magnet Motor Drives. Energies 2020, 13, 5071. [Google Scholar] [CrossRef]
- Dianov, A.; Anuchin, A. Adaptive Maximum Torque per Ampere Control for IPMSM Drives with Load Varying Over Mechanical Revolution. IEEE J. Emerg. Sel. Top. Power Electron. 2022, 10, 3409–3417. [Google Scholar] [CrossRef]
- Sun, T.; Wang, J.; Koc, M. On Accuracy of Virtual Signal Injection based MTPA Operation of Interior Permanent Magnet Synchronous Machine Drives. IEEE Trans. Power Electron. 2017, 32, 7405–7408. [Google Scholar] [CrossRef]
- Phowanna, P.; Boonto, S.; Konghirun, M. Online Parameter Identification Method for IPMSM Drive with MTPA. In Proceedings of the 18th International Conference on Electrical Machines and Systems (ICEMS), Pattaya, Thailand, 25–28 October 2015. [Google Scholar] [CrossRef]
- Zhang, Y.; Liu, K.; Hu, Y.; Yang, S. MTPA Control of IPMSM with Aiding from Estimation of dq-axis Inductances. In Proceedings of the IEEE Student Conference on Electric Machines and Systems, Huzhou, China, 14–16 December 2018. [Google Scholar] [CrossRef]
- Miguel-Espinar, C.; Heredero-Peris, D.; Villafafila-Robles, R.; Montesinos-Miracle, D. Review of Flux-Weakening Algorithms to Extend the Speed Range in Electric Vehicle Applications with Permanent Magnet Synchronous Machines. IEEE Access 2023, 11, 22961–22981. [Google Scholar] [CrossRef]
- Chen, Y.Z.; Fang, Y.T.; Huang, X.Y.; Zhang, J. Torque and Flux Weakening Control with MTPV for Interior Permanent Magnet Synchronous Motor. In Proceedings of the IEEE Vehicle Power and Propulsion Conference (VPPC), Hangzhou, China, 17–20 October 2016. [Google Scholar] [CrossRef]
- Nguyen, L.; Pham, T.C. Optimal Tracking Control for PMSM with Partially Unknown Dynamics, Saturation Voltages, Torque, and Voltage Disturbances. IEEE Trans. Ind. Electron. 2022, 69, 3481–3491. [Google Scholar] [CrossRef]
- Sepulchre, L.; Fadel, M.; Pietrzak-David, M.; Porte, G. MTPV Flux-weakening Strategy for PMSM High Speed Drive. IEEE Trans. Ind. Appl. 2018, 54, 6081–6089. [Google Scholar] [CrossRef]
- Miguel-Espinar, C.; Heredero-Peris, D.; Gross, G.; Llonch-Masachs, M.; Montesinos-Miracle, D. Maximum Torque per Voltage Flux-Weakening Strategy with Speed Limiter for PMSM Drives. IEEE Trans. Ind. Electron. 2021, 68, 9254–9264. [Google Scholar] [CrossRef]
- Nam, K.H. AC Motor Control and Electrical Vehicle Applications, 2nd ed.; CRC Press: Boca Raton, FL, USA, 2019; pp. 246–261. [Google Scholar]
- Chang, S.H.; Yeh, H.Y. High Efficiency Current Commands Generator for Full Speed Range in a Permanent Magnet Synchronous Motor. In Proceedings of the National Symposium on System Science and Engineering, Taichung, Taiwan, 16–18 May 2025. [Google Scholar]
- Sepulchre, L.; Fadel, M.; Pietrzak-David, M.; Porte, G. Flux-weakening strategy for high speed PMSM for vehicle application. In Proceedings of the International Conference on Electrical Systems for Aircraft, Railway, Ship Propulsion and Road Vehicles & International Transportation Electrification Conference (ESARS-ITEC), Toulouse, France, 2–4 November 2016. [Google Scholar] [CrossRef]
- Lyu, W.W.; Yin, W.; Ma, Y.L.; Yang, H.; Zhao, R.X.; Wang, H.B. Nonlinear Modeling of PMSM Based on LUT in Electrical Drive Real-time Simulation. In Proceedings of the IEEE 7th Student Conference on Electric Machines and Systems (SCEMS), Macao, China, 6–8 November 2024. [Google Scholar] [CrossRef]
- Trancho, E.; Ibarra, E.; Arias, A.; Salazar, C.; Lopez, I.; Diaz de Guereñu, A.; Peña, A. IPMSM Torque Control Strategies based on LUTs and VCT Feedback for Robust Control under Machine Parameter Variations. In Proceedings of the IECON—42nd Annual Conference of the IEEE Industrial Electronics Society, Florence, Italy, 23–26 October 2016. [Google Scholar] [CrossRef]
- Hassan, M.; Ge, X.; Woldegiorgis, A.T.; Mastoi, M.S.; Shahid, M.B.; Atif, R.; Shaikh, M.S.; Kumar, S. A Look-up Table-based Model Predictive Torque Control of IPMSM Drives with Duty Cycle Optimization. ISA Trans. 2023, 138, 670–686. [Google Scholar] [CrossRef] [PubMed]
- Kim, D.Y.; Lee, J.H. Low Cost Simple Look-Up Table-Based PMSM Drive Considering DC-Link Voltage Variation. Energies 2020, 13, 3904. [Google Scholar] [CrossRef]
- Zhang, X.G.; Zhang, C.G.; Wang, Z.W.; Rodríguez, J. Motor-Parameter-Free Model Predictive Current Control for PMSM Drives. IEEE Trans. Ind. Electron. 2024, 71, 5443–5452. [Google Scholar] [CrossRef]
- Song, Q.Y.; Ji, F.F.; Li, Y.J. A High-accuracy Torque Control Strategy of PMSM for Electric Vehicles. In Proceedings of the IEEE 1st International Power Electronics and Application Symposium (PEAS), Shanghai, China, 13–15 November 2021. [Google Scholar] [CrossRef]
- Jin, L.H.; Wang, X.Q.; Mao, Y.; Lu, L.L.; Wang, Z. Online Attribute Matching Based Few-Sample Data-Driven Diagnosis of Electrical Faults in PMSM Drive. IEEE Trans. Power Electron. 2024, 39, 2620–2631. [Google Scholar] [CrossRef]
- Ko, A.Y.; Kim, D.Y.; Won, I.K.; Kim, Y.R.; Won, C.Y. Interpolation Error Compensation Method for Look-up Table based IPMSM Drive. In Proceedings of the IEEE Conference and Expo Transportation Electrification Asia-Pacific (ITEC Asia-Pacific), Beijing, China, 31 August–3 September 2014. [Google Scholar] [CrossRef]
- Ren, Z.; Lei, Y. The Influence of Look-Up Table Setting and Interpolation Algorithm on Power Amplifier Behavioural Modeling. In Proceedings of the IEEE 6th International Conference on Computer and Communications (ICCC), Chengdu, China, 11–14 December 2020. [Google Scholar] [CrossRef]
- Fattorini, L.; Fattorini, M.; Pisani, C.; Pratelli, L. Design-based Properties of the Nearest Neighbor Spatial Interpolator and Its Bootstrap Mean Squared Error Estimator. Biometrics 2022, 78, 1454–1463. [Google Scholar] [CrossRef] [PubMed]
- Niedzielski, T.; Halicki, M. Improving Linear Interpolation of Missing Hydrological Data by Applying Integrated Autoregressive Models. Water Resour. Manag. 2023, 37, 5707–5724. [Google Scholar] [CrossRef]
- Kozera, R.; Wilkołazka, M. A Natural Spline Interpolation and Exponential Parameterization. In Proceedings of the International Conference on Numerical Analysis and Applied Mathematics (ICNAAM), Rhodes, Greece, 22–28 September 2015. [Google Scholar] [CrossRef]
Disclaimer/Publisher’s Note: The statements, opinions and data contained in all publications are solely those of the individual author(s) and contributor(s) and not of MDPI and/or the editor(s). MDPI and/or the editor(s) disclaim responsibility for any injury to people or property resulting from any ideas, methods, instructions or products referred to in the content. |
© 2025 by the authors. Licensee MDPI, Basel, Switzerland. This article is an open access article distributed under the terms and conditions of the Creative Commons Attribution (CC BY) license (https://creativecommons.org/licenses/by/4.0/).