Abstract
Carbon dioxide (CO2) fracturing and acid treatment are currently considered promising approaches to overcome the challenge of excessively high initiation pressure during conventional hydraulic fracturing in tight sandstone gas reservoirs. However, the mechanisms of these methods weaken the reservoir rock’s mechanical properties, remain unclear. Using a machine learning approach, we elucidate the differences in initiation mechanisms between CO2 fracturing and hydraulic fracturing under acid-treated conditions, thereby providing a mechanistic explanation for the lower initiation pressure observed in CO2 fracturing compared to conventional hydraulic fracturing. The tensile fractures, shear fractures, and acid-modified fractures have been identified by a specially trained AI model, which achieved exceptional accuracy (95.4%). Acoustic emission source locations show that CO2 fracturing mainly causes shear fracture along acid-weakened planes, which promotes the propagation of composite tensile-shear fractures in untreated reservoir areas. Due to the significantly lower diffusivity of water compared to CO2, hydraulic fracturing predominantly induces non-acidic mixed-mode (tensile-shear) fractures. This fundamental difference in fracture patterns accounts for the higher initiation pressure observed in hydraulic fracturing compared to CO2 fracturing. These findings offer crucial insights into pressurized fluid-driven fracturing mechanisms and propose an optimized technical pathway for enhancing hydrocarbon recovery in low-permeability sandstone formations.
1. Introduction
The formation of fluid-induced complex fracture networks is an important factor in enhancing production in tight sandstone gas extraction engineering [1,2]. Tight sandstone gas reservoirs, characterized by significant burial depths and ultra-low permeability, exhibit abnormally high fracture initiation pressure (FIP), often exceeding 85 MPa, which poses critical challenges for fracture initiation and propagation [3]. The current strategies focus on two main approaches: matrix acidizing and CO2 fracturing, each reducing the FIP through distinct mechanisms [4,5,6].
Acid treatment not only alters the mechanical properties of reservoir rocks to reduce fracturing pressure, but also increases the number and size of effective pore throats by dissolving the rock matrix, thereby enhancing fluid intake capacity and enabling greater treatment volume and fracture width [7,8]. Static acid saturation treatments on shale specimens reveal time-dependent geo-mechanical alterations under triaxial stress conditions [9]. These findings indicate a progressive reduction in peak strength and elastic modulus, along with a transition from brittle to ductile failure: an essential condition for the formation of complex fracture morphologies [10]. CO2 fracturing takes advantage of unique fluid-rock interactions to overcome the limitations of conventional methods. The low viscosity and high compressibility of supercritical CO2 allow it to infiltrate nanoscale pore networks more effectively, creating expansive pressurized zones that reduce tangential stress concentrations by 18–22% compared to water-based fracturing fluids [11]. Micro-CT imaging further reveals that CO2 penetration into microfracture tips to alter local stress states via adsorption-induced swelling, reducing FIP by 30–35% compared to hydraulic fracturing [4]. Despite notable individual advancements, a significant knowledge gap persists in understanding the synergistic effects of acid preconditioning and CO2 fracturing on the tight sandstone reservoirs. Most existing studies examine these techniques independently, failing to account for their potential interactive influence on fracture initiation mechanisms and the development of complex fracture networks.
During hydraulic fracturing, fluctuations in reservoir geo-stress generate discrete fracture types, with their propagation trajectories primarily controlled by the local stress states. Based on the maximum circumferential stress criterion, predictive models have been developed for hydraulic fracture initiation and propagation [12]. However, the propagation mechanisms of CO2-induced fractures remain poorly understood due to the fluid’s low viscosity and high diffusivity. Moreover, acid-induced dissolution of soluble minerals enhances the spatial heterogeneity of pore structures across multiple scales [13], leading to multidirectional fracture propagation and complex fracture patterns under CO2 fracturing [14,15]. The high-porosity and high-pressure zone formed around the wellbore under the influence of CO2 significantly affects the evolution of injection pressure, with its temporal changes reflecting microscale fracturing processes [16]. Furthermore, factors such as particle size [17], reservoir heterogeneity [18], and bedding angle [19] significantly affect fracture initiation and propagation. However, there is currently no effective method to capture the stress state on fracture surfaces at different locations during CO2 fracturing. This limitation hinders the accurate identification of fracture propagation paths, which is essential for advancing the mechanistic understanding of CO2 fracturing and the development of complex fracture networks.
To investigate fracture propagation patterns during hydraulic fracturing, researchers have employed a range of techniques. Nuclear Magnetic Resonance (NMR) analyses reveal that CO2 fracturing is predominantly governed by shear activation along interfacial microfractures that penetrate gravel particles, whereas water-based fracturing primarily generates isolated tensile fractures [20]. Studies have shown that the first-motion polarity of P-waves in acoustic emission (AE) signals can effectively differentiate between tensile and shear fracture modes during hydraulic fracturing [21,22]. Low-viscosity fracturing fluids tend to induce shear-dominant fractures, whereas high-viscosity fluids tend to induce tensile-dominant fractures [23]. Microscopic observations reveal that CO2-induced fractures propagate along mineral grain boundaries, producing numerous small fractures inclined to the maximum horizontal stress direction. Fractures induced by high-viscosity fluids tend to penetrate mineral grains directly and propagate preferentially along the direction of maximum horizontal stress [23]. Since shear stress predominantly acts on planes oblique to the maximum horizontal principal stress, shear failure can give rise to inclined fractures. This observation is consistent with AE data indicating that low-viscosity fluids tend to induce shear fractures, whereas high-viscosity fluids primarily generate tensile fractures. However, reliable identification of fracture modes using P-wave first-motion polarity is highly dependent on the accuracy of the velocity model [24]. Moreover, no reliable method is currently available to determine whether fractures have undergone acidification. Existing studies mainly focus on the complexity of CO2-influenced hydraulic fracturing, yet lack in-depth investigation into the microscale initiation and propagation behavior of CO2-induced fractures following acid treatment. To explore the fracture evolution in CO2 acid fracturing, researchers have performed a series of AE experiments on rock failure processes [25,26]. The AE waveform sequences generated during rock fracturing contain abundant latent information, including material properties, fracture mechanisms, and strength [27]. However, owing to the inherent complexity of the fracturing process and the superposition of multiple fracture signals within AE data, conventional analytical methods often fail to extract this information accurately and efficiently.
In recent years, researchers have applied artificial neural networks to recognize AE waveforms using supervised learning [28,29]. However, supervised learning requires a large amount of labeled data, which is difficult to obtain through experiments. For example, it is particularly difficult to distinguish and label fractures as either shear or tensile. Moreover, supervised methods mainly focus on learning classifiable features, rather than fully understanding the structure of the data space [30]. Studying the dynamic evolution of fracturing requires thoroughly parsing and encoding implicit AE waveforms to accurately extract fracture features. Researchers have proposed self-supervised methods capable of learning comprehensive sample information without labeled data [31]. These methods achieve effective waveform feature extraction with minimal labeled data, thereby overcoming the need for large labeled datasets in training large models [32]. Therefore, this study adopts a self-supervised approach using abundant unlabeled data to train an encoder network that extracts robust features while minimizing noise. The encoder is then fine-tuned using labeled data to develop a neural network capable of classifying different types of AE.
The overall workflow of this study is presented as follows. First, AE experiments are performed using three-point bending test and piercing shear test. AE data from the bending tests are labeled as tension-induced fractures, while AE data from shear tests are labeled as shear-induced fractures, establishing a labeled dataset. Second, a Transformer-based neural network is constructed and pre-trained via unsupervised learning on an existing dataset to develop a pre-trained AI model. Third, the pre-trained model is fine-tuned through supervised learning using the labeled dataset, developing a classifier capable of identifying acidization and distinguishing between tension- and shear-induced fractures. Fourth, AE experiments on CO2 and hydraulic fracturing of acid-treated tight sandstone are performed. The well-trained AI model is then applied to monitor the evolution of internal fractures, providing insights into post-acidization fracturing mechanisms in tight sandstone and the dynamic processes of CO2 acid fracturing. This study offers valuable guidance for optimizing acid pretreatment timing and advancing the understanding of fracture propagation during fracturing operations.
2. Methodology
2.1. Transformer AI Model Training Method
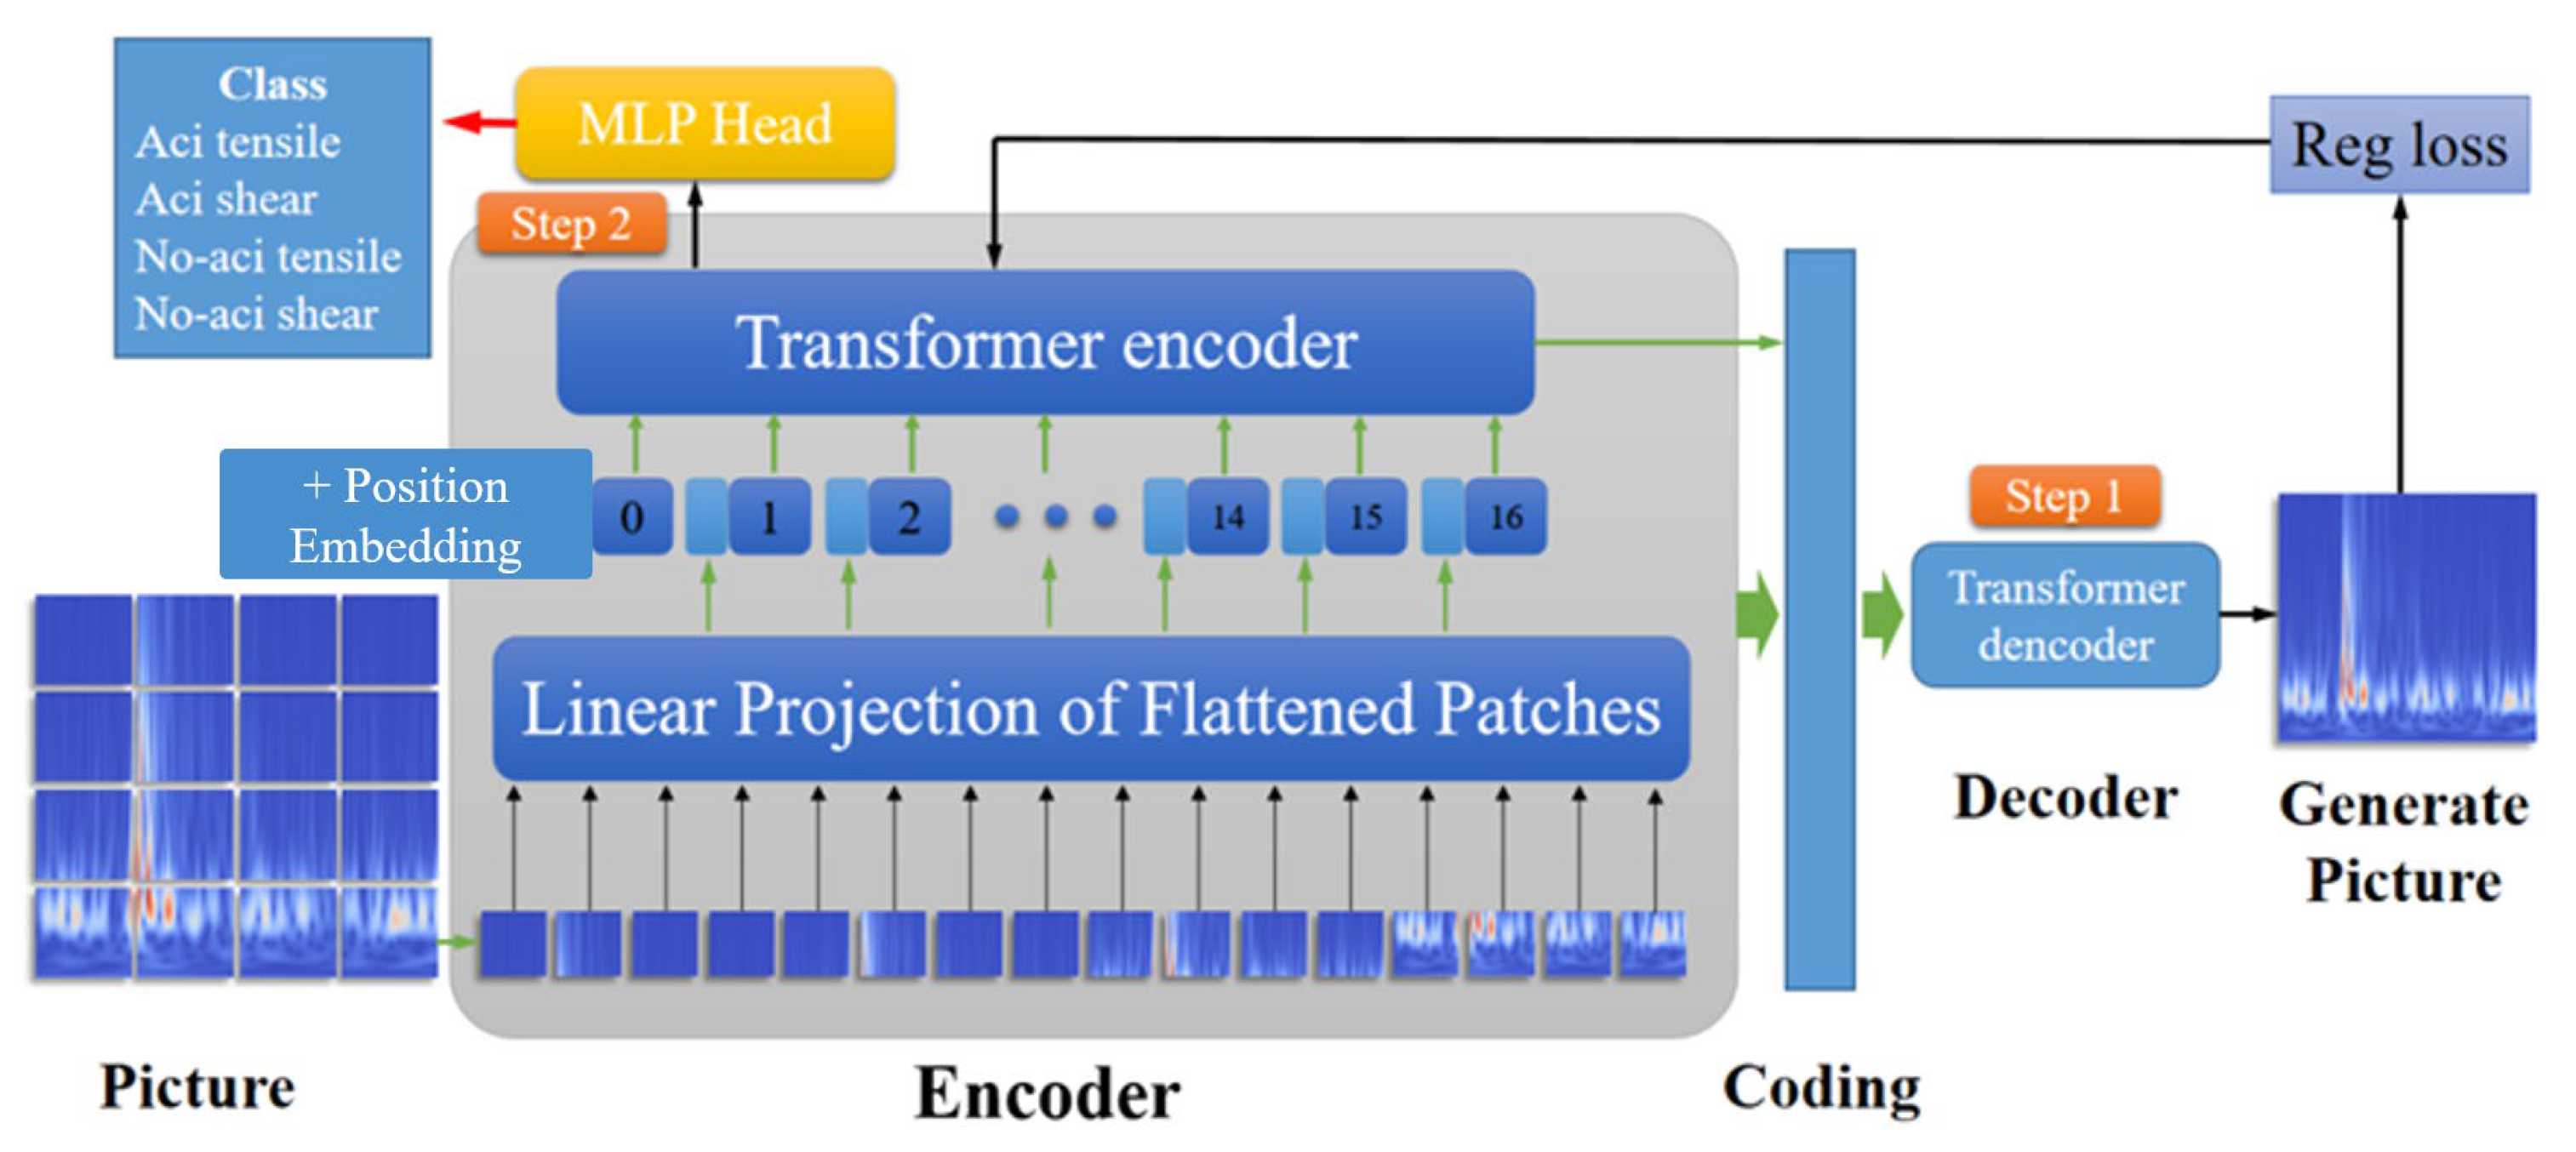
Compared to convolutional neural networks (CNNs), Transformer neural networks utilize self-attention mechanisms that enable global feature extraction. However, due to their large number of parameters, Transformers require substantial AE data to prevent overfitting. To address this, we first pre-train the Transformer AI model using existing sandstone AE dataset and unsupervised learning. Then, we fine-tune the pre-trained AI model using labeled AE data of tension- and shear-induced fractures via supervised learning. A total of 1.2 million AE time-frequency diagrams from sandstone fracturing under true triaxial conditions were used for pre-training, allowing the Transformer AI model to learn comprehensive time-frequency diagram features. Figure 1 illustrates the model’s unsupervised pre-training (Step 1) and subsequent supervised fine-tuning (Step 2). Each time-frequency diagram is first divided into multiple patches (14 × 14 in this study), which are then flattened, encoded, and fused with positional encodings. The resulting embeddings are fed into the Transformer for feature extraction. The decoder reconstructs the input time-frequency diagram based on the extracted features, while the encoder is optimized based on reconstruction accuracy, resulting in a model capable of effective time-frequency diagram feature extraction. Finally, high classification accuracy can be achieved through supervised training using a small labeled dataset based on the pre-trained encoder.
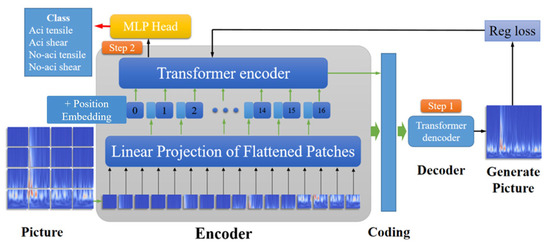
Figure 1.
Schematic diagram of Transformer and its time-frequency diagram recognition.
2.2. Training AE Data Acquisition
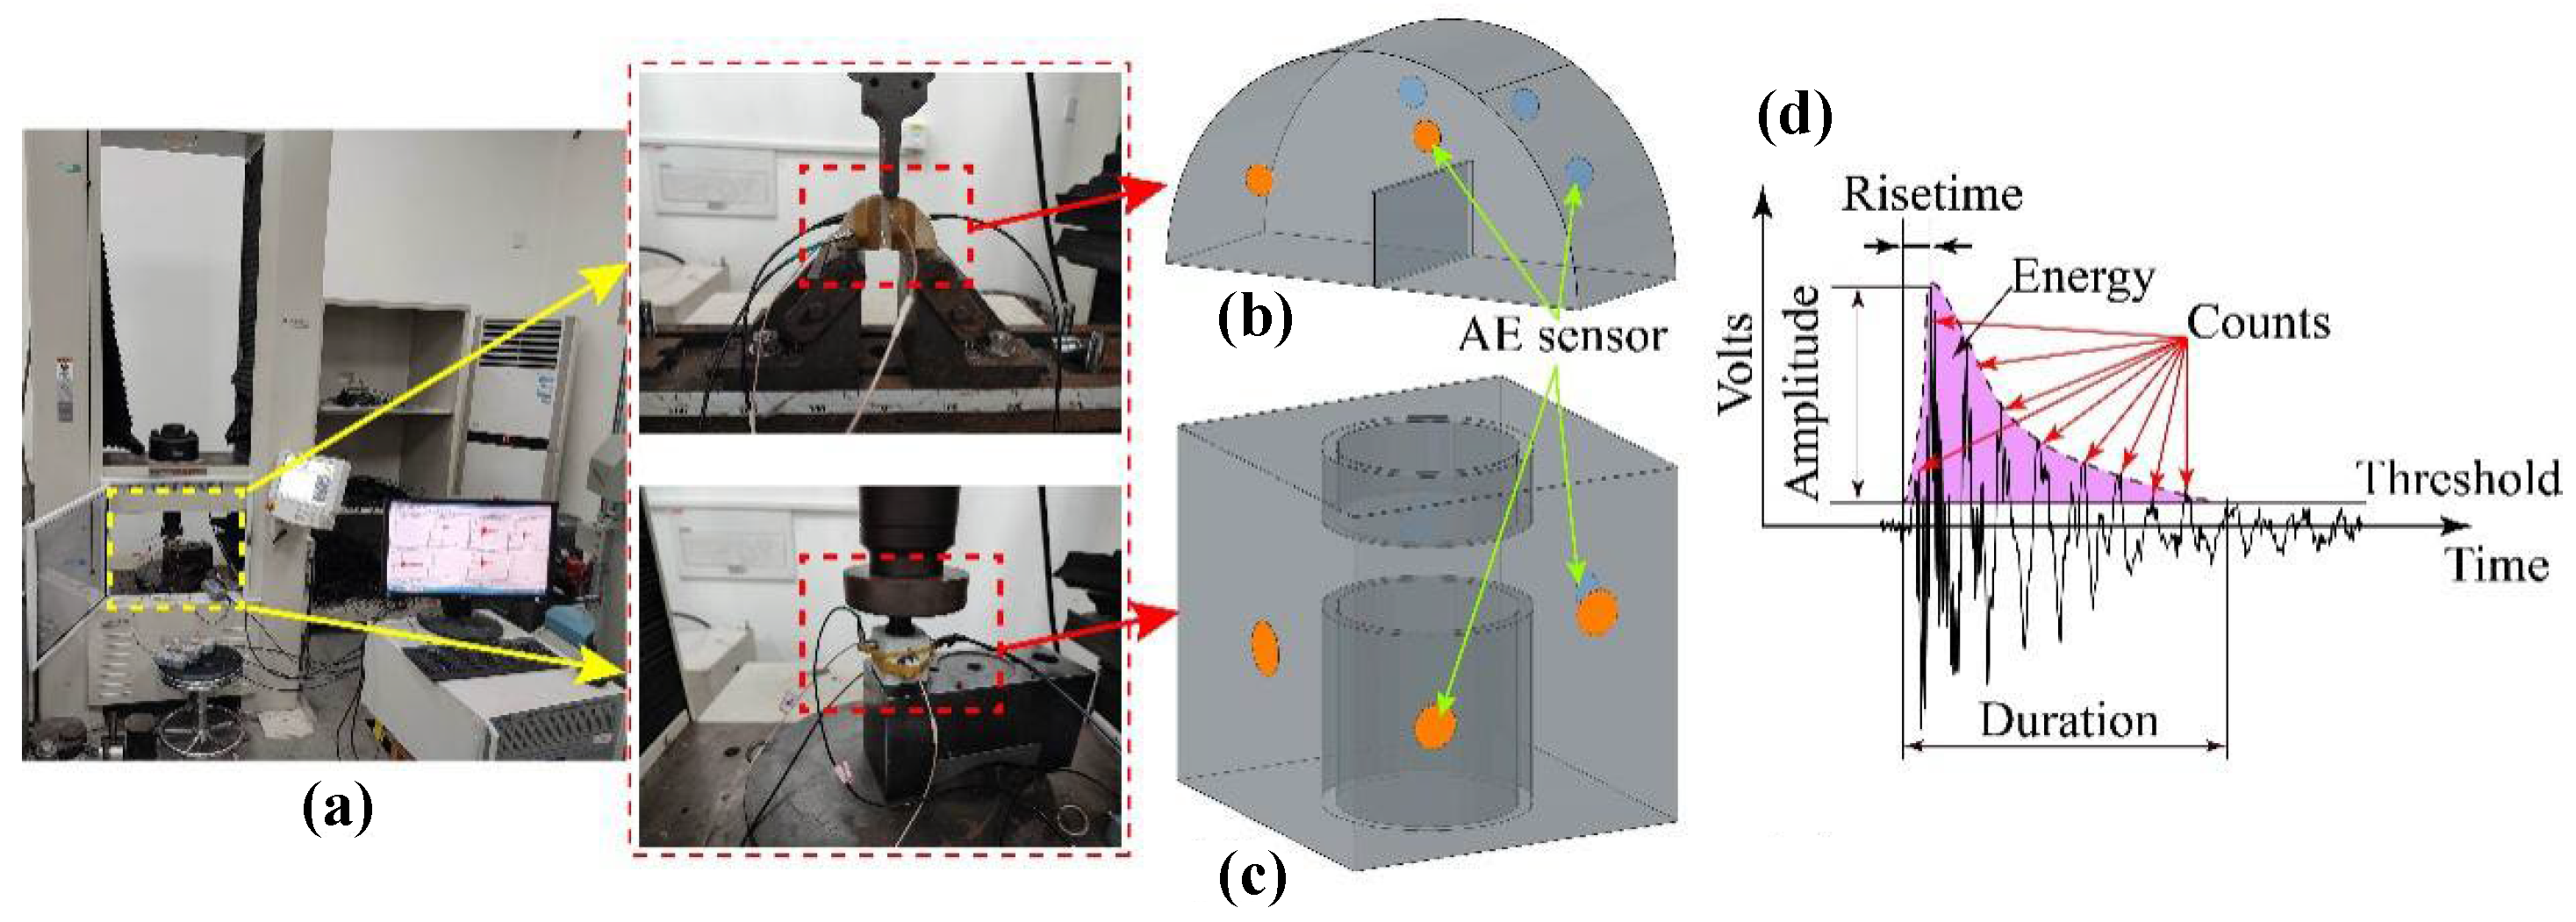
The experimental setup and specimens are shown in Figure 2, while Figure 2d presents a typical schematic of AE waveform parameters. The outcrop tight sandstone was selected from the Xujiahe Formation, which is an important Late Triassic tight gas reservoir located in the Sichuan Basin, China. The density of this sandstone is 2578 kg/m3. The uniaxial compressive and tensile strengths are 68.3 MPa and 4.22 MPa, respectively. The Young’s modulus and Poisson’s ratio are 5.08 GPa and 0.221, respectively. By applying nuclear magnetic resonance, the porosity and permeability of the tight sandstone specimens are determined as 4.68% and 0.45 mD, respectively. The microstructure of this sandstone is characterized by quartz framework grains and pore-filling dolomite cement. This mineralogical assemblage suggests that the reservoir has a high potential positive response to acid treatments, as the widespread soluble dolomite (based on Ca element) and chlorite (based on Mg element) can be effectively dissolved to improve reservoir conductivity. Tight sandstone specimens were prepared for three-point bending tests (Figure 2b) and piercing shear tests (Figure 2c). The specimens underwent a 24-h acid treatment using a solution of 12% HCl and 2% HF. To generate labeled AE data for tension- and shear-induced fractures, we performed three-point bending and piercing shear tests on tight sandstone specimens before and after acid treatment. The testing machine used was a Shimadzu AGI-250, which is located at Chongqing University, Chongqing, China. Labeled AE waveforms were collected for four conditions: acidic tensile, acidic shear, non-acidic tensile, and non-acidic shear. AE signals were collected with the following acquisition parameters: 40 dB preamplification gain, 1 MSPS sampling rate, and 45 dB threshold. The final tensile and shear strengths of the rock before and after acid treatment are summarized in Table 1 and Table 2, respectively. In Table 1, the I-1w and I-2w are original specimens, while I-4a, I-5a, and I-6a are acidified specimens; In Table 2, the II-1 and II-6 are original specimens, II-3, II-4, and II-5 are acidified specimens.
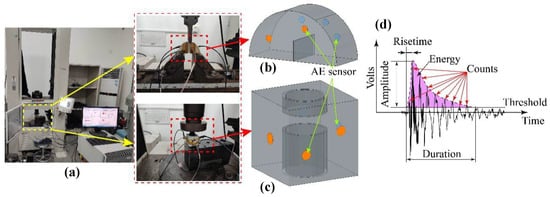
Figure 2.
AE dataset acquisition: (a) Shimadzu AGI-250 testing machine; (b) three-point bending test; (c) piercing shear test; (d) AE waveform and its parameters.

Table 1.
Three-point bending tests.

Table 2.
Piercing shear test.
Using these experimental AE data results and an existing dataset of 1.2 million sandstone fracture AE waveforms, we trained an AI model capable of identifying both the presence of acid treatment and the fracture mode (tensile or shear). The well-trained AI model was subsequently applied to identify the fracture evolution processes in sandstone during hydraulic fracturing.
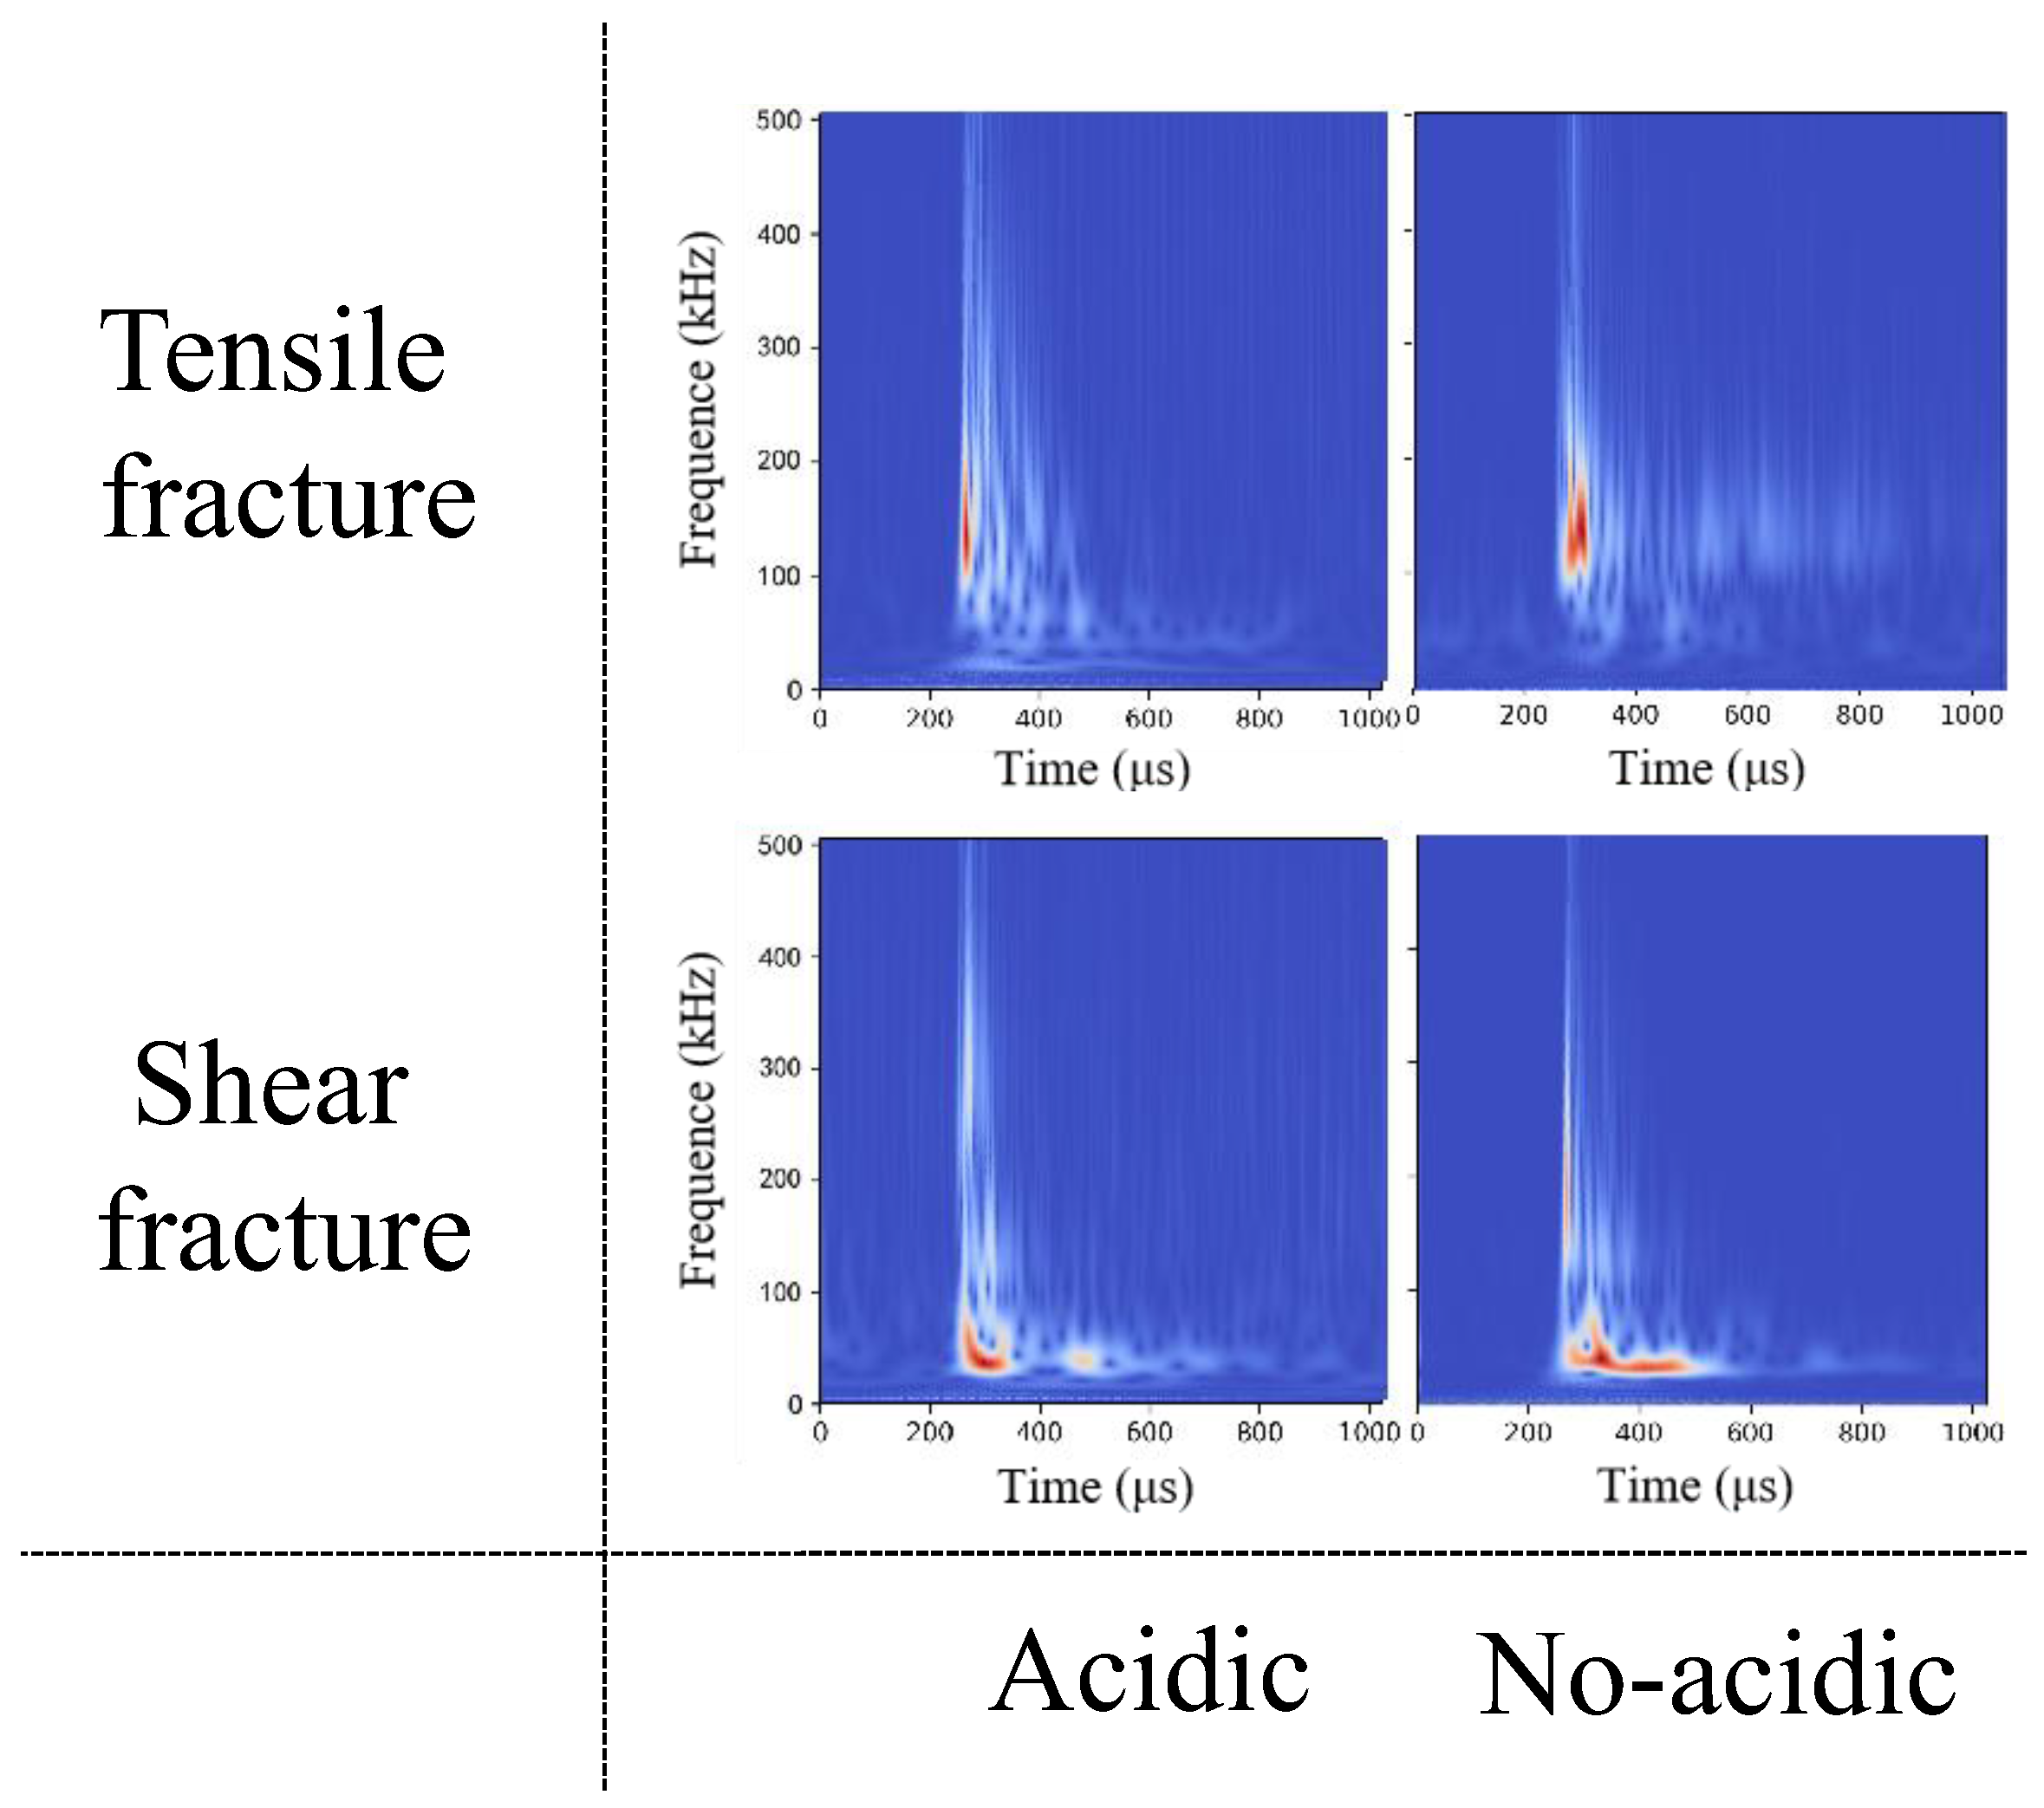
To further analyze AE waveforms and fully leverage the Transformer’s capabilities in image processing, the AE waveforms were converted into time-frequency diagrams using wavelet transformation. This process transforms one-dimensional waveform signals into two-dimensional feature maps, thereby enhancing feature extraction by the neural network of the AI model. The time-frequency diagrams of tension- and shear-induced fractures after transformation are shown in Figure 3, where the x-axis indicates time (totaling 1024 μs) and the y-axis shows frequency (ranging from 0 to 500 kHz).
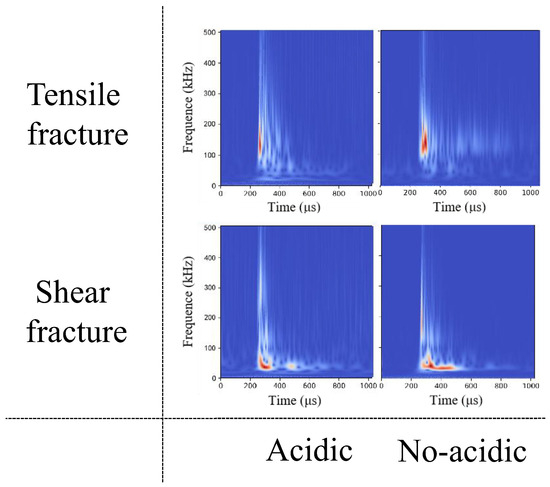
Figure 3.
AE time-frequency diagram.
The time-frequency diagrams of tension- and shear-induced fractures were combined and randomly partitioned, with 80% assigned to the training dataset and the remaining 20% to the testing dataset. A detailed dataset split is provided in Table 3.

Table 3.
Number of obtained AE waveforms.
2.3. Testing Schemes
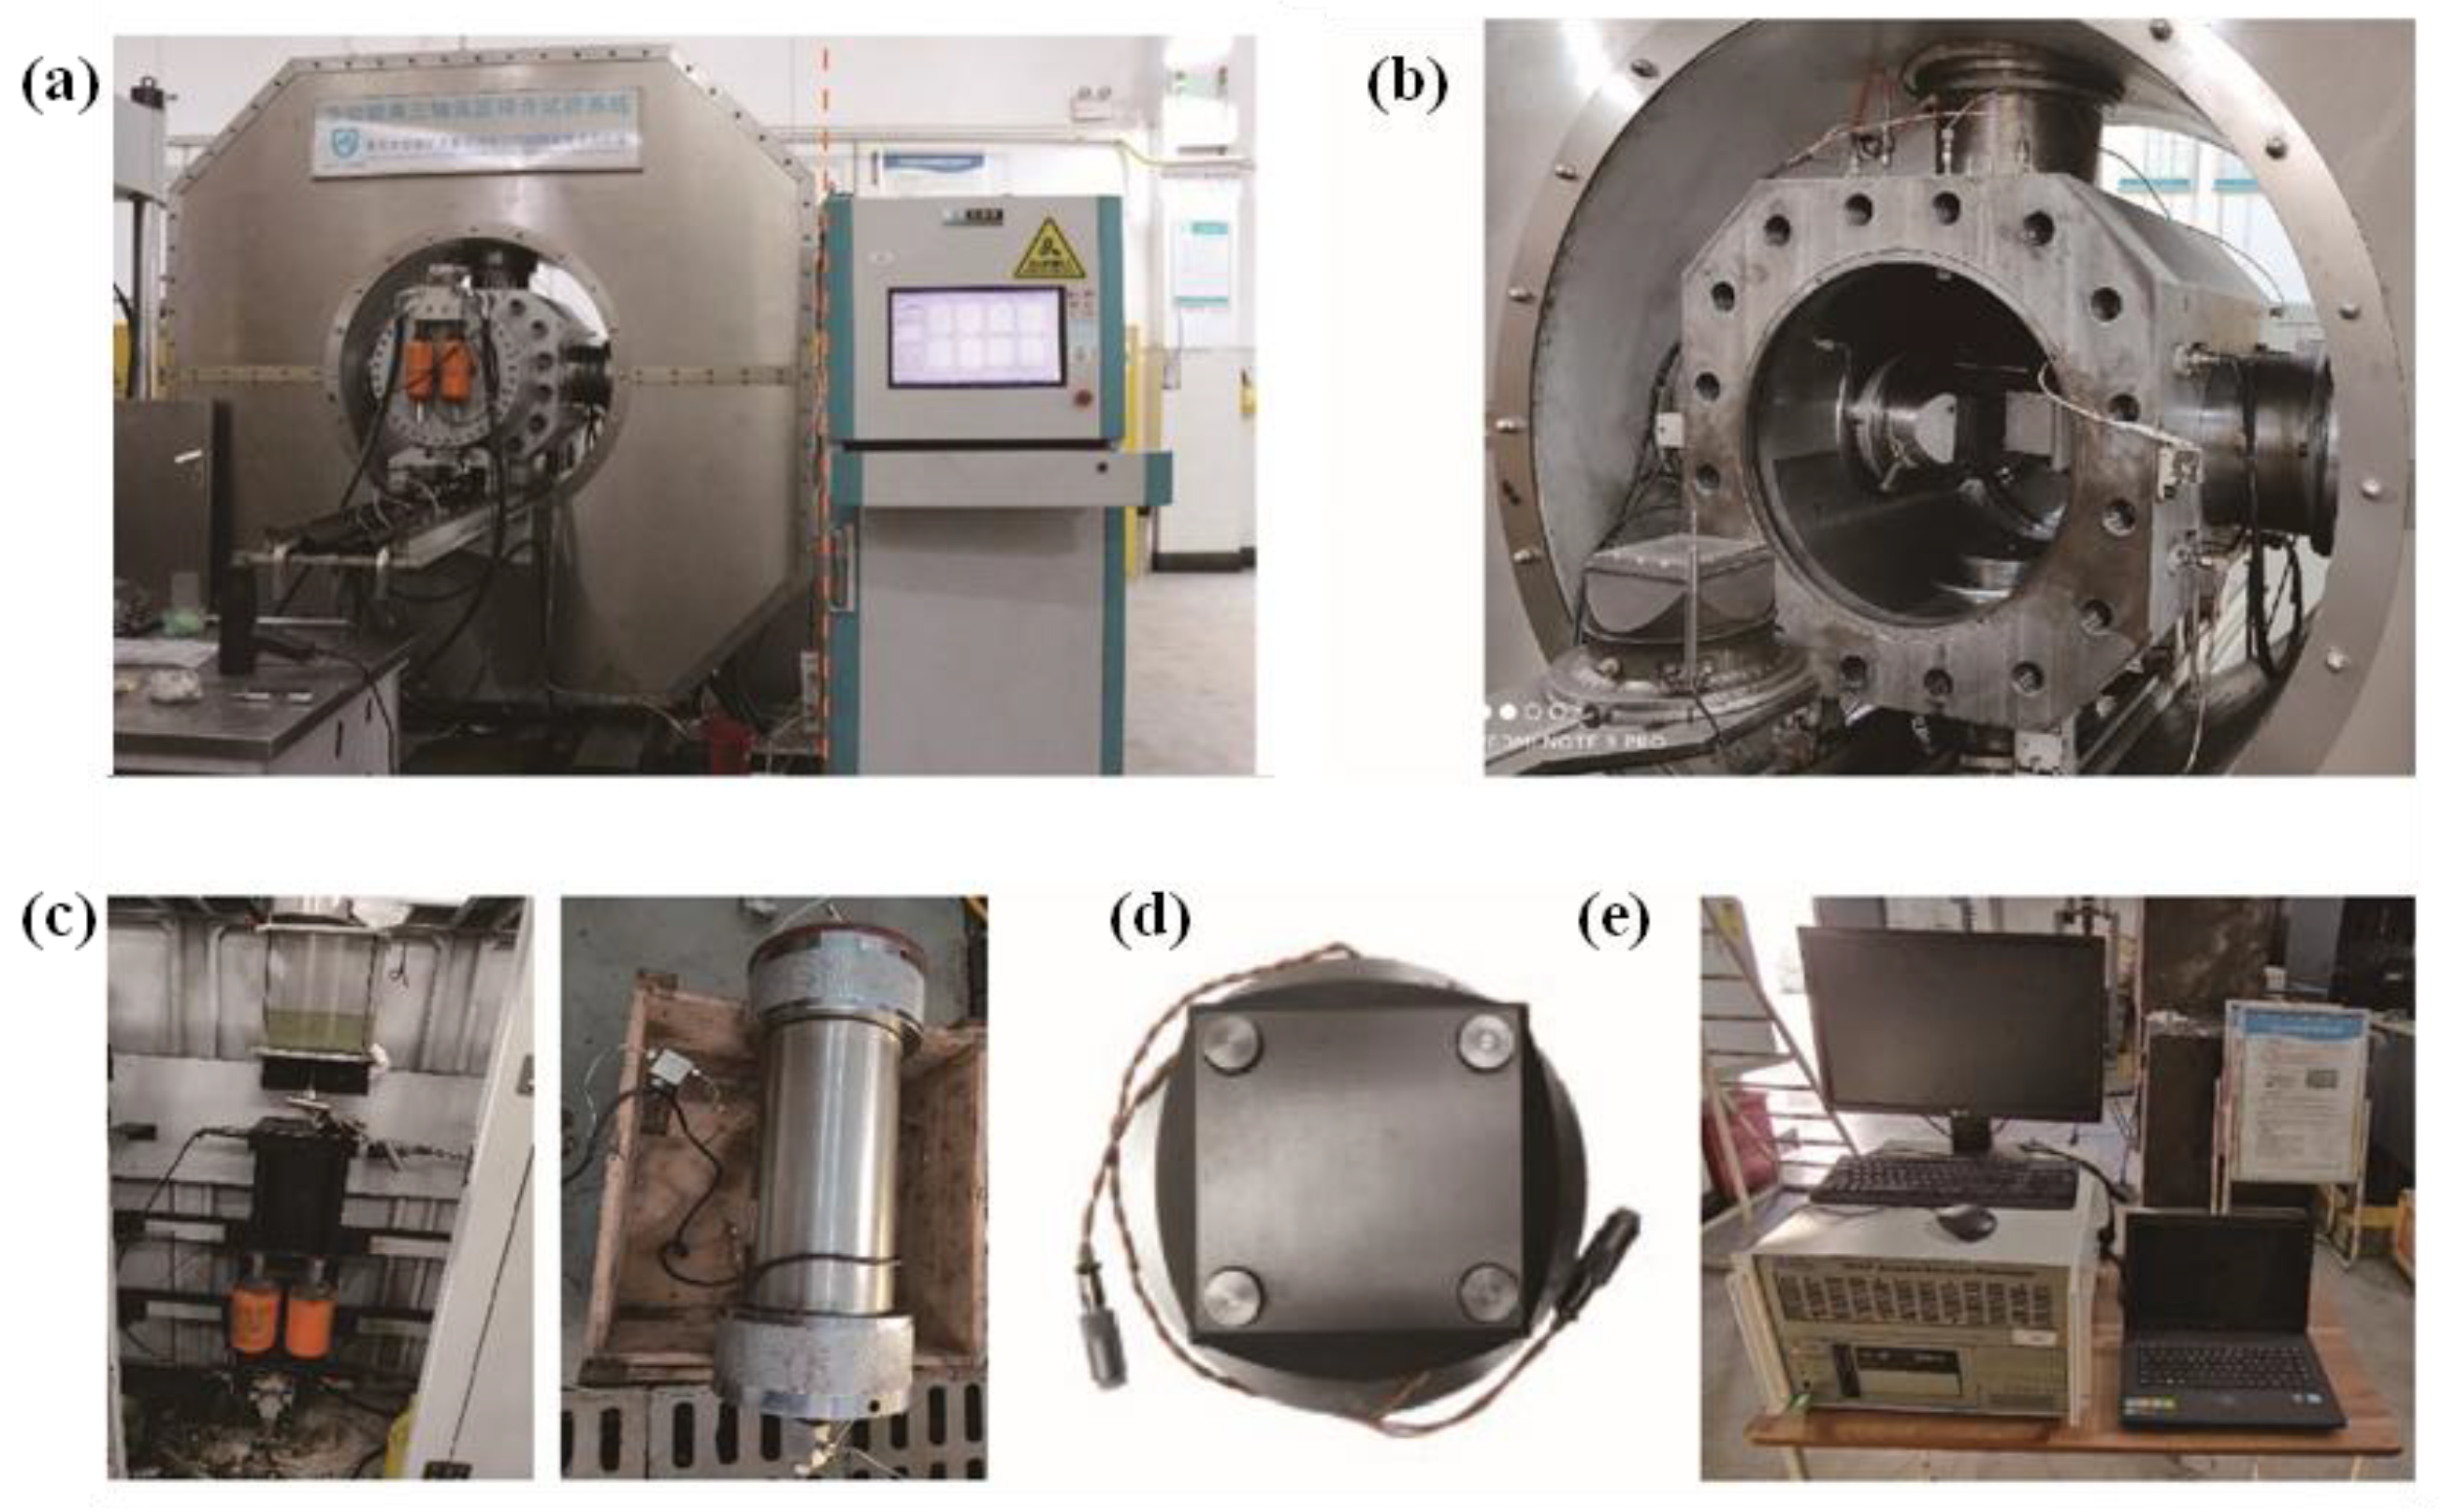
The true triaxial fluid-solid coupling experimental system, self-developed by Chongqing University, was employed to conduct fracturing tests using CO2 and acidified water under 3D stress conditions, as illustrated in Figure 4. The experimental system is self-developed and consists of 3D stress loading unit, data acquisition module, sealed loading chamber, fluid injection unit, AE senior unit, and monitoring system [33]. This system adopts a rigid-flexible combined loading method, capable of applying loads of 6000 kN, 6000 kN, and 4000 kN in the X-, Y-, and Z-axis, respectively. Fracturing tests using different fracturing media (liquid and gas) can be conducted via a high-pressure water pump and an integrated piston-type fluid container, with a maximum injection pressure of 30 MPa. The multifunctional pressure platen, coupled with an external AE system, allows real-time monitoring of AE signals during fracturing and facilitates the 3D localization of fracture propagation within the specimen.
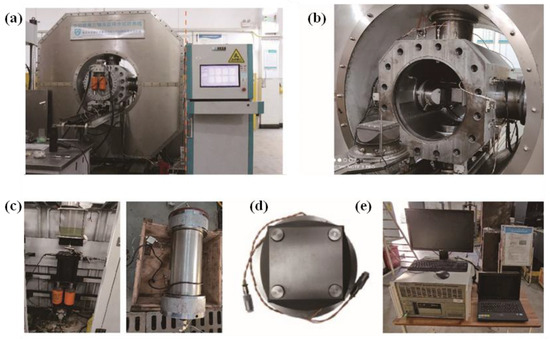
Figure 4.
True triaxial fluid-solid coupling experimental system. (a) 3D stress loading unit and data acquisition module, (b) sealed loading chamber, (c) fluid injection unit, (d) AE sensor unit, and (e) AE monitoring system.
The tight sandstone was machined into a cubic specimen measuring 100 mm × 100 mm × 100 mm. After surface grinding to ensure strict parallelism and perpendicularity, a central borehole with a diameter of 10 mm and a depth of 55 mm was drilled. The borehole was subsequently subjected to acid treatment using a solution of 12% HCl and 2% HF for 24 h. Throughout the treatment, the acid level was maintained flush with the borehole opening. After the treatment, the residual acid was carefully removed using a burette, and the specimen was air-dried under ambient conditions. The prepared specimen and its microstructure are shown as Figure 5. The sandstone materials used are the same as those in the three-point bending and piercing shear tests (Figure 2). This work primarily investigates the effects of CO2 and hydraulic fracturing on fracture initiation pressure and propagation behavior in tight sandstone under constant injection displacement. The testing scheme is detailed in Table 4. When CO2 pressure exceeds 7.38 MPa and the ambient temperature is above 31.1 °C, CO2 enters a supercritical state. Given the deep burial of tight sandstone gas reservoirs in the Xujiahe Formation of the Sichuan Basin, the formation temperature typically exceeds this threshold. Therefore, during CO2 fracturing experiments, the piston intermediate container and high-pressure gas pipeline were preheated for over an hour using resistance heating wires to ensure the CO2 temperature remained above 35 °C, maintaining its supercritical state. CO2 fracturing was conducted by using a high-pressure water pump to drive the piston intermediate container, ensuring a constant injection rate. For hydraulic fracturing, the fracturing fluid consisted of deionized water mixed with a thickening agent at a concentration of 0.4%.

Figure 5.
Sandstone specimen. (a) the prepared specimen, (b) schematic diagram, (c–f) SEM microstructure.

Table 4.
Fracturing testing scheme.
3. AI Model Construction
3.1. AI Model Pre-Training Processes
To enable the AI model to learn features from time-frequency representations, we trained the Transformer using 1.2 million time-frequency diagrams derived from sandstone fracture waveforms. To evaluate the unsupervised AI model’s capability in feature extraction, we employed a “missing-information restoration approach”: the AI model was provided with only partial time-frequency data and tasked with reconstructing the complete time-frequency diagram based on the available features. Higher reconstruction accuracy reflects stronger feature learning performance. The corresponding test results are presented in Figure 6.

Figure 6.
Time-frequency diagram generated by pre-trained model; (a) original diagram, (b) input diagram, (c) reconstructed diagram.
As shown in Figure 6, when 75% of the input image is randomly masked, the pre-trained AI model uses the available information (unmasked regions) and the learned time-frequency features to reconstruct the complete time-frequency diagram. Comparison between the original and reconstructed diagrams indicates that the pre-trained AI model can effectively reconstruct the overall time-frequency diagram. This suggests that the pre-trained AI model has captured the variation patterns of AE waveforms and can infer missing information from partial inputs. However, some details remain imperfectly reconstructed, such as the lower region of the high-energy area shown in Figure 6c. The original diagram exhibits multiple grid-like patterns that are absent in the reconstruction. This discrepancy can be explained by two possible reasons: (1) weak correlation between the unmasked regions and the target area, limiting the AI model’s ability to infer the missing content; or (2) the model has not sufficiently learned the features between this region and the available prior information. This limitation could potentially be addressed by expanding the training dataset and increasing the AI model’s parameter capacity.
3.2. AI Model Fine-Tune Processes
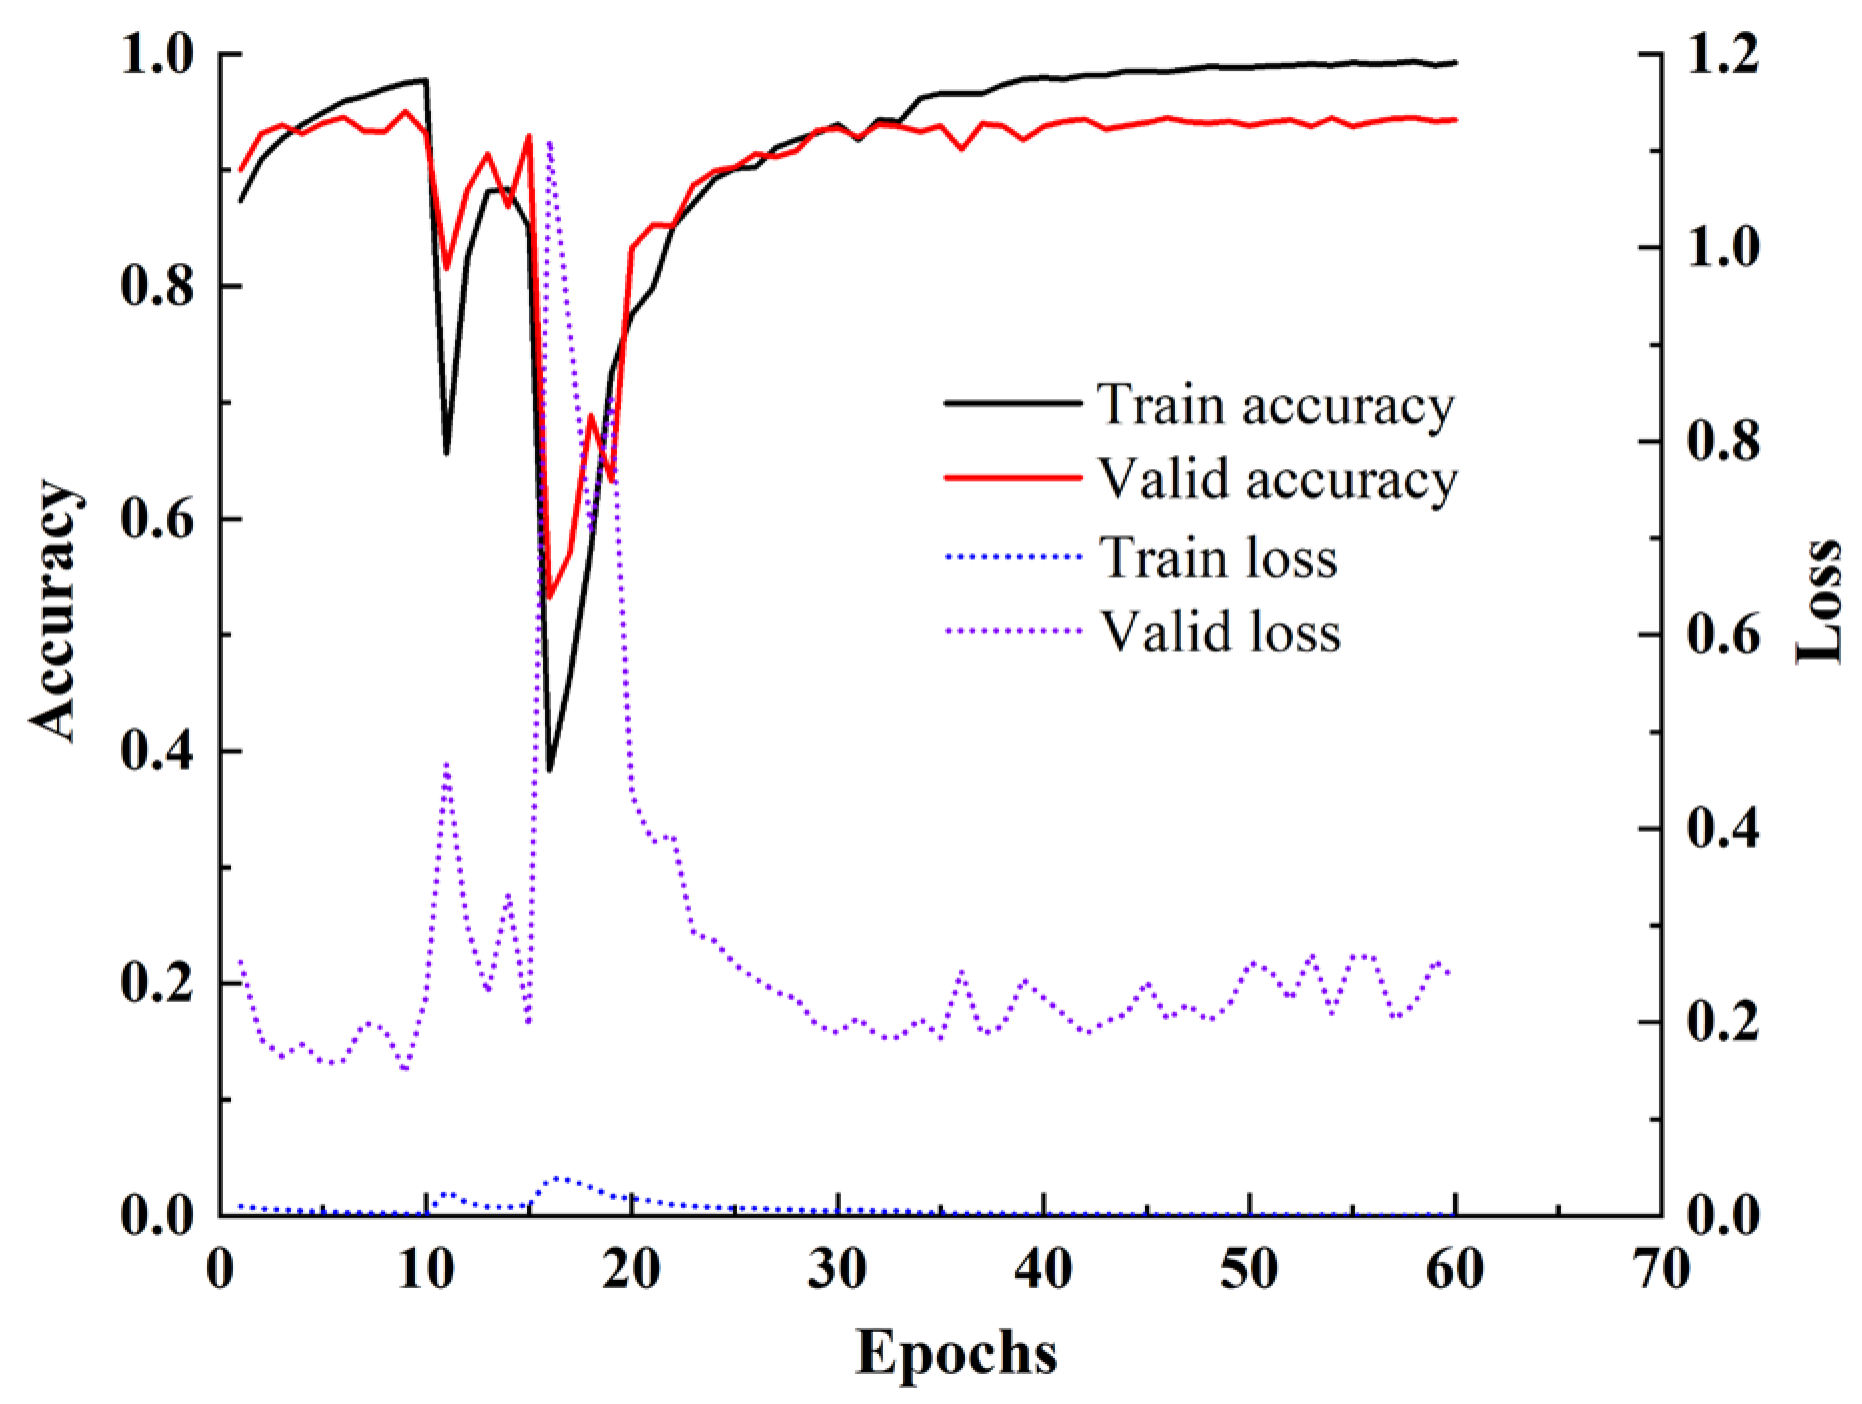
Based on the pre-trained AI model, two fully connected layers followed by a SoftMax layer were added to construct a classification network, as depicted in Step 2 of Figure 1. The SoftMax layer categorizes input AE time-frequency diagrams into four classes: acidic shear, non-acidic shear, acidic tensile, and non-acidic tensile. The AI model was subsequently trained in a supervised learning method for 60 fine-tune epochs using the labeled dataset.
The AI model’s performance was unstable during the initial 30 fine-tune epochs, reflecting ongoing adjustments of feature weights to enhance accuracy (Figure 7). After approximately 35 epochs, the accuracy on the test set stabilized and plateaued at around 95%, while the training dataset accuracy continued to increase. This divergence indicates overfitting, where the AI model begins to leverage unique noise patterns in the time-frequency diagrams to improve training accuracy. Expanding the training dataset size could alleviate this issue. The AI model achieved the highest training accuracy of 95.4%, and was selected as the final AI model and subsequently applied to classify fractures generated during fracturing experiments under 3D stress.
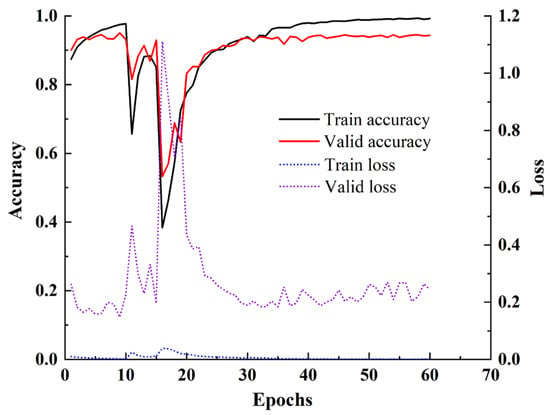
Figure 7.
Evolution of AI model over fine-tune epochs.
3.3. AI Model Performance Evaluation
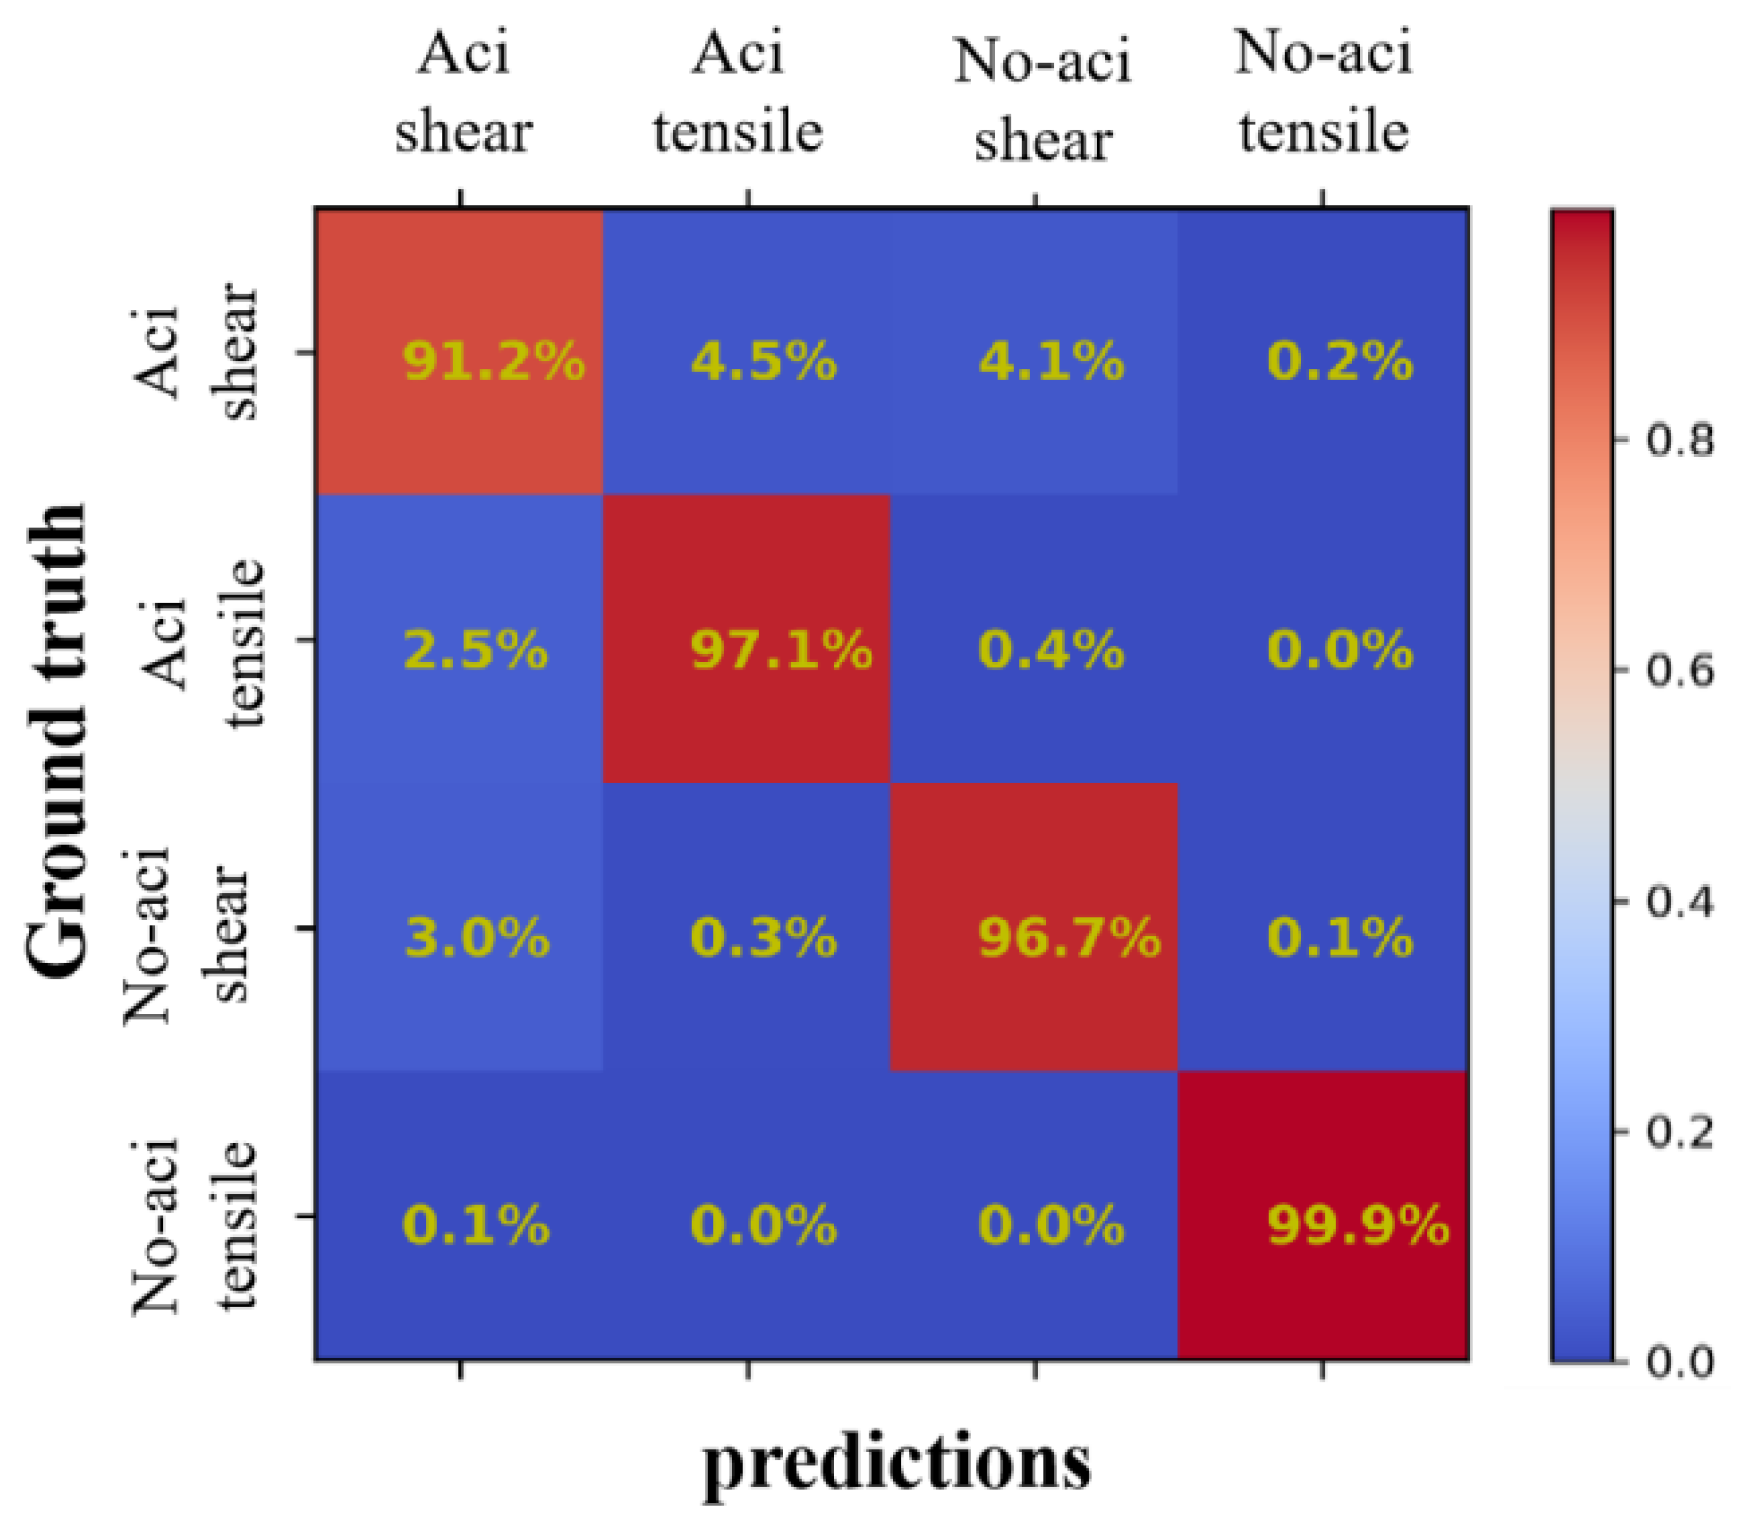
To elucidate the reasons behind the AI model’s misclassification, we first analyzed multi-class ROC plots, presented in Figure 8. In this figure, the y-axis represents the true classification of the time-frequency diagrams, and the x-axis shows the AI model’s classification. In Figure 8, most values lie along the diagonal of the ROC plot, indicating that most of the AI model’s classifications are correct. The classification accuracies are acidic shear (91.2%), non-acidic shear (96.7%), acidic tensile (97.1%), and non-acidic tensile (99.9%), respectively. The classification accuracy for tensile fractures is higher than that for shear fractures, and non-acidic fractures are identified more accurately than acidic fractures. Among all categories, acidic shear fractures show the highest misclassification rate, often being confused with non-acidic shear and acidic tensile fractures. This may be attributed to the presence of tensile fractures within shear fractures, as tensile fractures can occur even under pure shear loading conditions [34]. Misclassification of acidic shear as non-acidic shear may result from incomplete acid treatment in certain regions of the rock. Additionally, shear fractures primarily occur due to sliding friction. While acid pretreatment dissolves certain minerals and cementing materials in sandstone, it significantly affects tensile fractures and has little effect on the AE signals generated by friction between sandstone particles. Furthermore, 4.5% of acidic tensile fractures were misclassified as acidic shear. This may be due to compressive stresses at the support points during the three-point bending test, which can induce shear fractures. Some non-acidic shear fractures were also misclassified as acidic shear, suggesting that acidic shear fractures contain features common to both acidic tensile and non-acidic shear, leading to classification confusion. Finally, non-acidic tensile fractures are rarely misclassified. Acid pretreatment dissolves cementing materials in sandstone, significantly reducing the toughness of tensile fractures. This leads to distinct time-frequency characteristics in AE from acidic pretreated tensile fractures compared to natural specimens, resulting in high recognition accuracy for non-acidic tensile fracture AE waveforms.
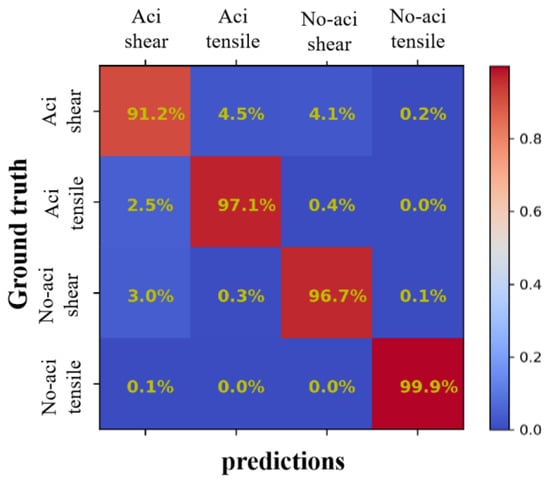
Figure 8.
Reliability evaluation for AI model classification results.
3.4. AI Model Classification Mechanism
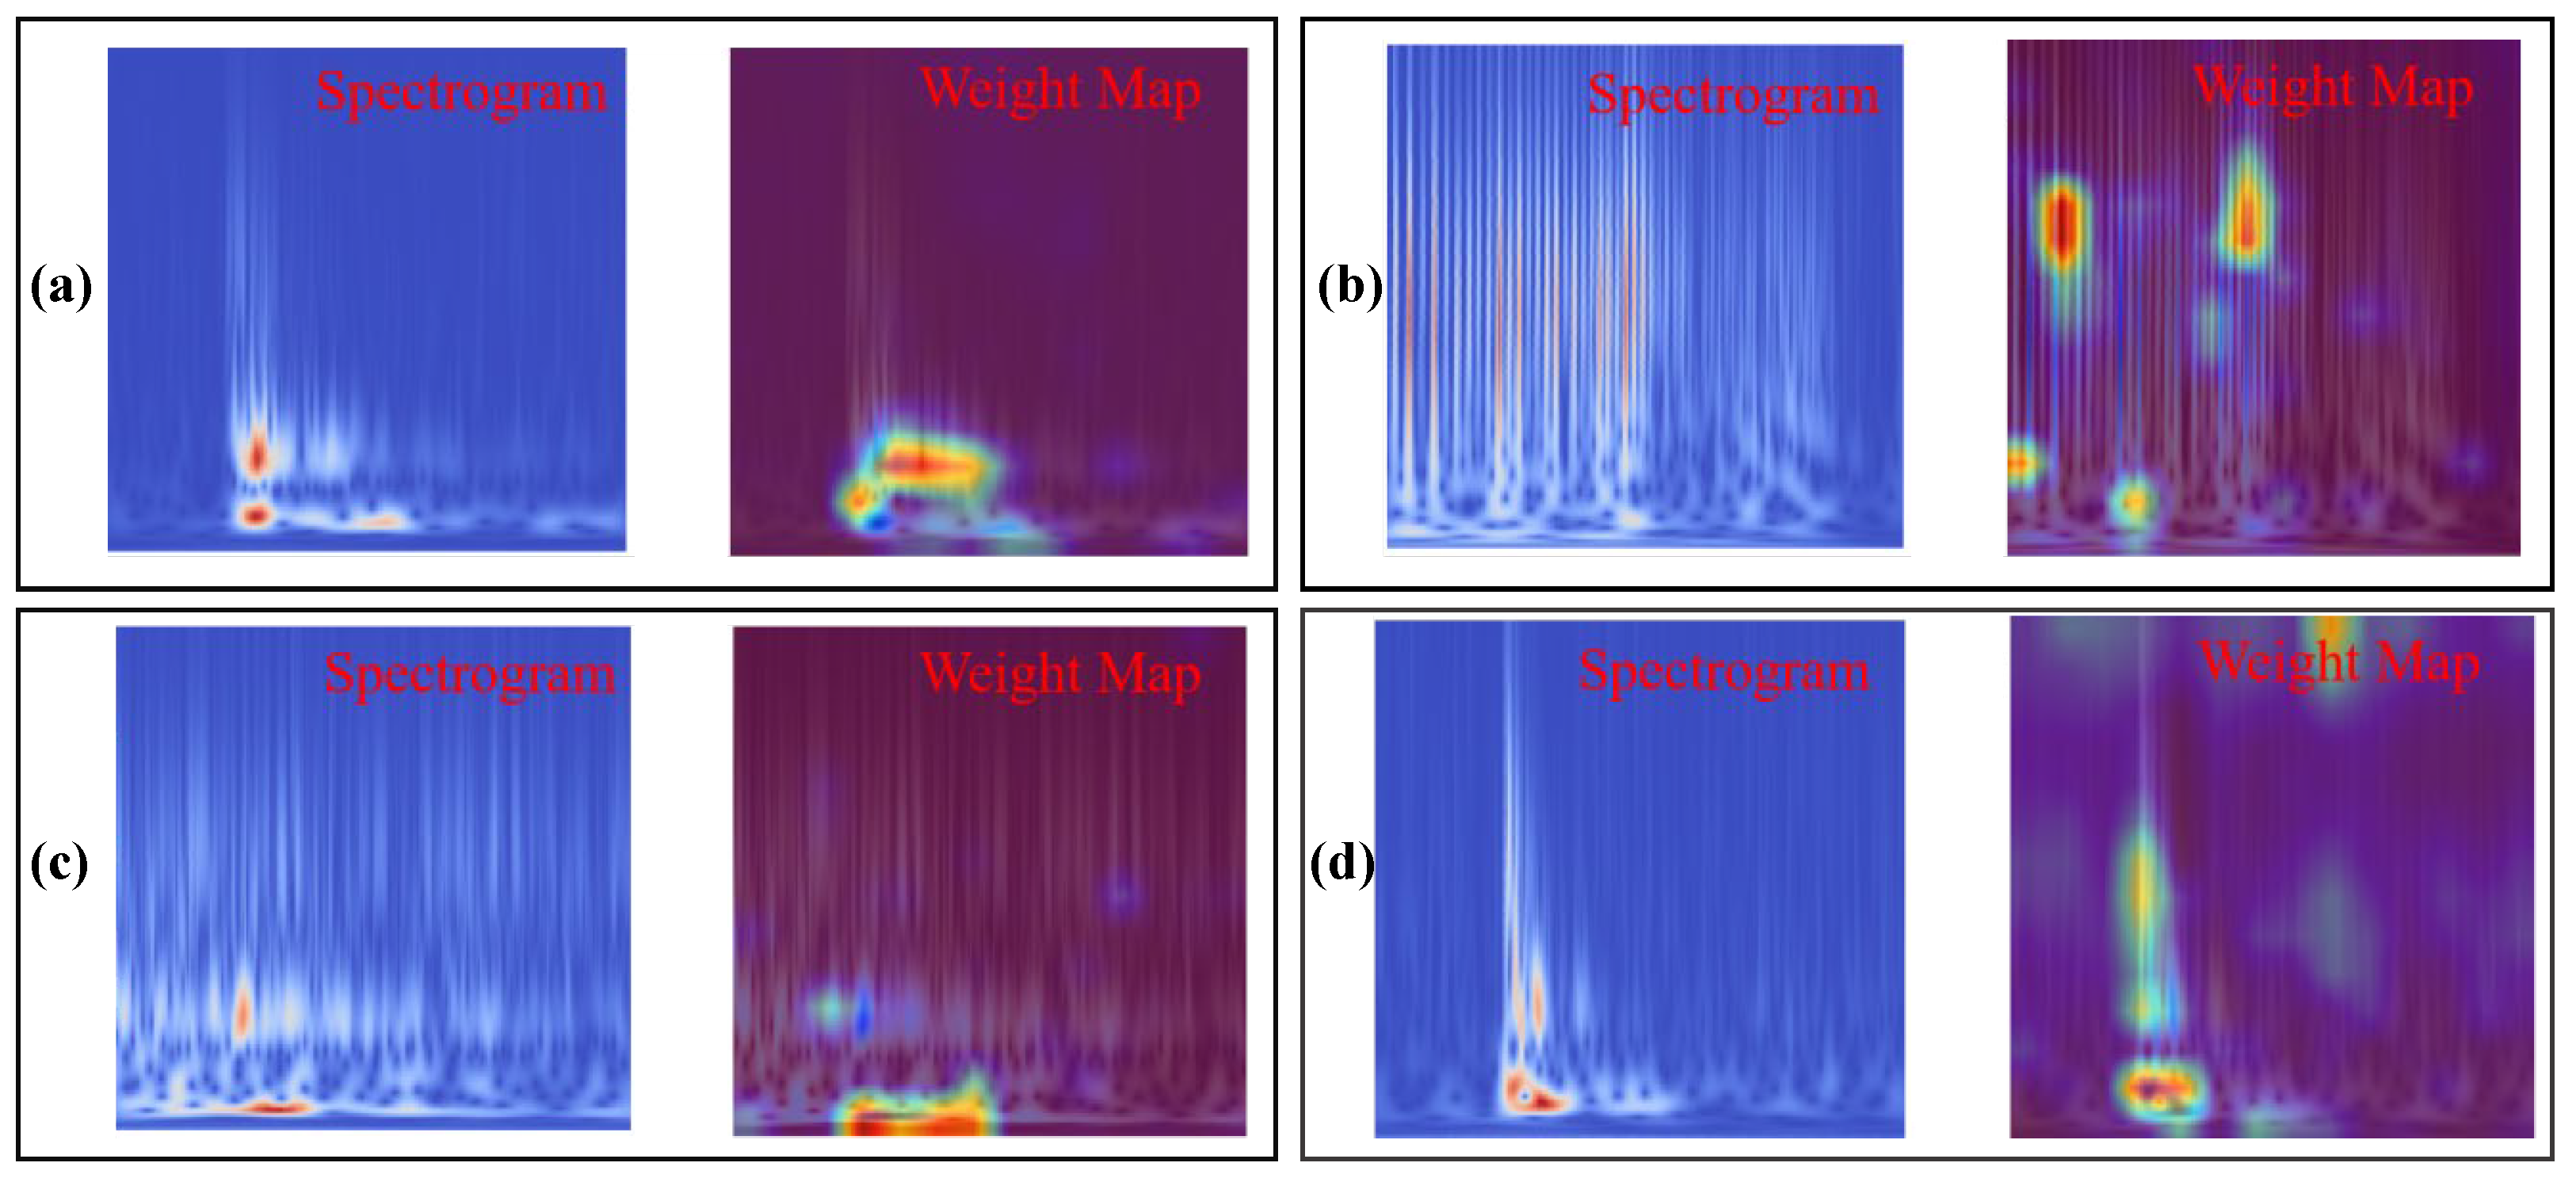
To further analyze these AE waveform features, the neural network’s weight distribution was examined through the attention mechanism of the Transformer AI model. By elucidating the network’s classification basis, distinctions between tensile and shear fracture in sandstone before and after acidification can be identified. The procedure for determining the decision basis is as follows: (1) compute correlation-based scores for each attention layer of the AI model; (2) iteratively mitigate negative influences by integrating correlation and gradient information; (3) incorporate this information into the attention maps to generate class-specific visualizations of the self-attention mechanism; and (4) produce heat maps that visualize the decision basis, highlighting differences in the time-frequency features of sandstone fractures with and without acid treatment.
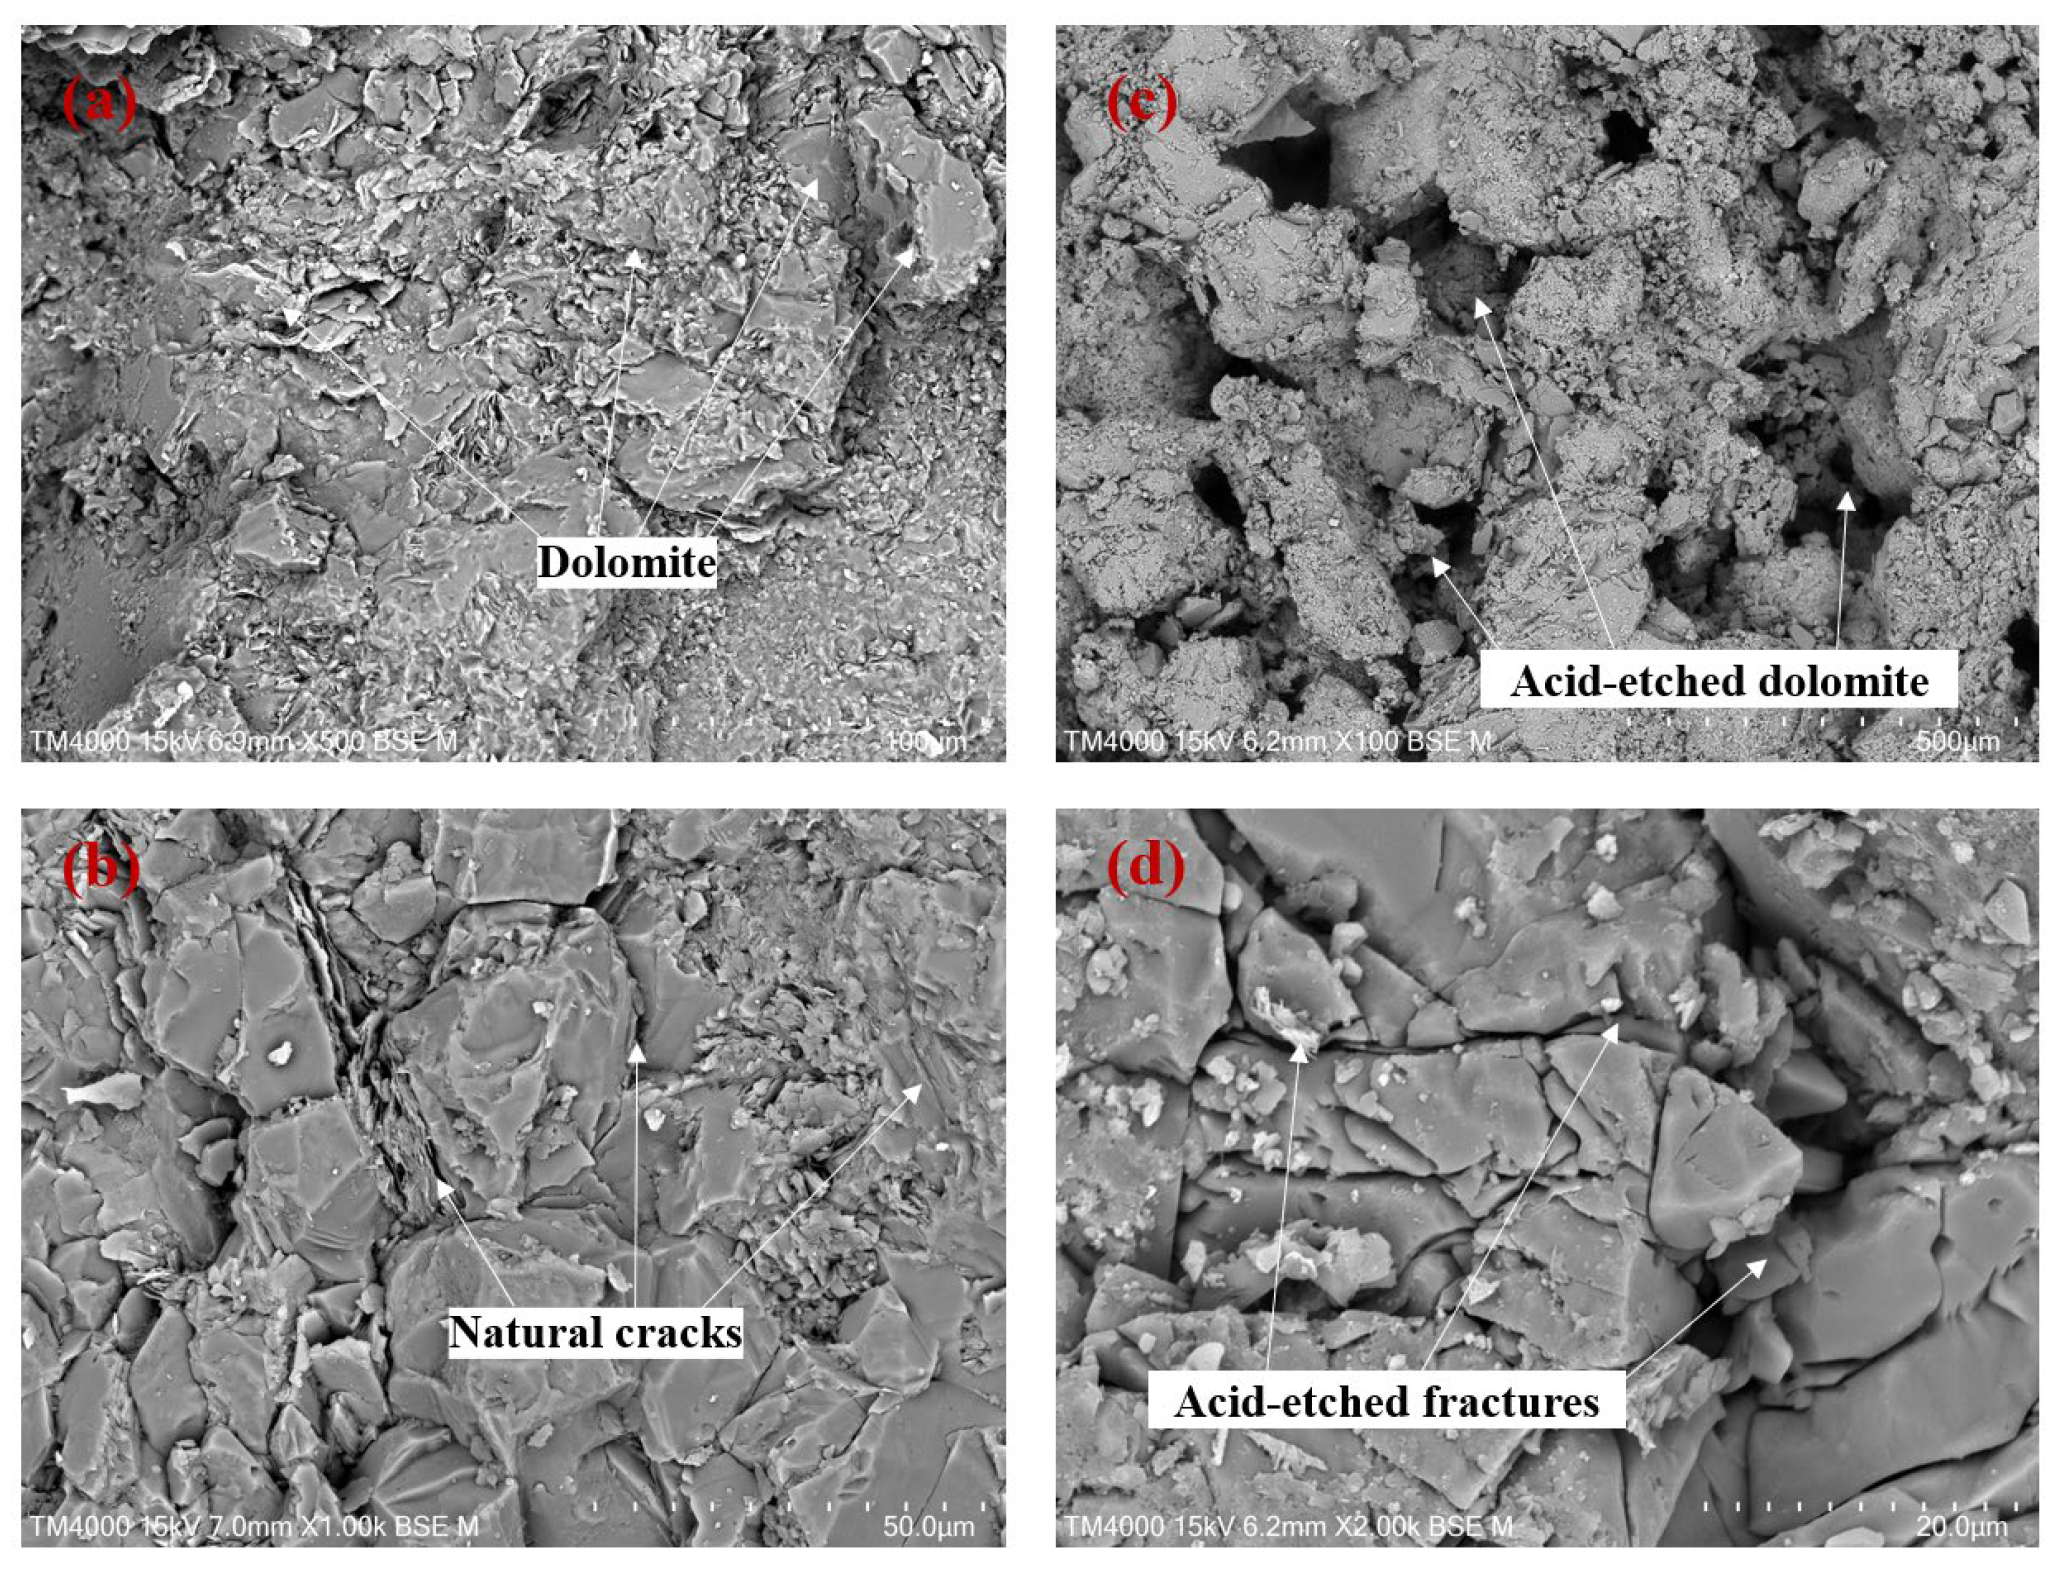
The results obtained using this method are presented in Figure 9. The left panel displays time-frequency diagrams under different conditions, while the right panel illustrates the AI model’s recognition weight distribution. Bright regions highlight the key features leveraged by the AI model. As shown in Figure 9, tensile fractures exhibit greater high-frequency energy concentrations than shear fractures. AE waveforms from acid-treated fractures likewise show enhanced high-frequency energy, likely due to dissolution of cementing materials that increases rock brittleness. In Figure 9a,c, the AI model primarily relies on low-frequency regions to recognize non-acidic tensile and shear fractures, respectively. After acidization, however, the recognition basis shifts to high-frequency regions, especially for tensile fractures. The AI model’s primary recognition frequencies for shear fractures are generally lower than for tensile fractures. Compared with the non-acidic tensile case in Figure 9a, the AI model’s classification basis for non-acidic shear (Figure 9c) is concentrated in the low-frequency and high-energy bands, reflecting shear fractures with larger surfaces, lower-frequency AE waveforms, and greater energy release. In acidic shear fractures (Figure 9d), the key recognition region moves into higher frequencies, which is an effect attributed to cementing material (dolomite) dissolution (Figure 10), which increases brittleness and fracture AE waveform frequency.
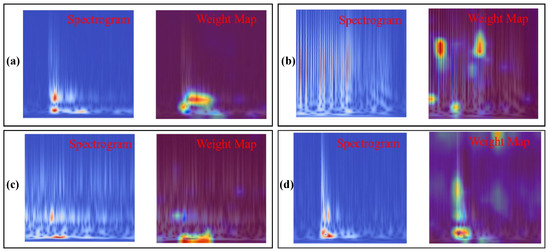
Figure 9.
Identification basis diagram of AI model for different fracture types. (a) non-acidic tensile, (b) acidic tensile, (c) non-acidic shear, (d) acidic shear.
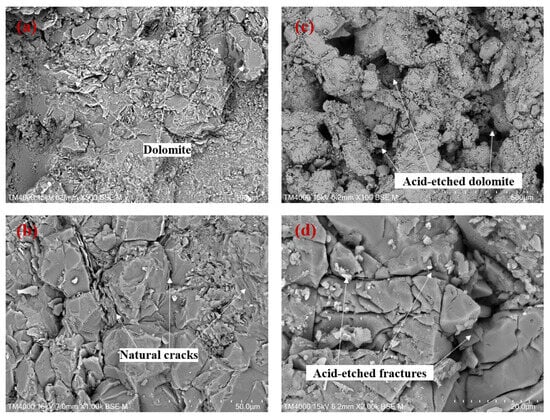
Figure 10.
SEM before and after acid treatment, (a,b) natural specimen; (c,d) acid-treated specimen.
4. Fracturing Propagation Under 3D Stress
4.1. Spatiotemporal Evolution of Fracture Types
The well-trained AI model allows us to accurately identify the types of acoustic emission (AE) generated during sandstone fracturing, thus enabling a detailed investigation into the dynamic interaction and evolution of different fracture types throughout the process. To gain deeper insight into the fracture propagation dynamics during CO2 fracturing, AE data were analyzed. The stress loading scheme is illustrated in Figure 11. Following the experimental protocol, CO2 injection commenced once the target stress level was reached and stabilized. Due to the high compressibility of CO2, the pressure gradually increases after injection.
Considering the high permeability of CO2, as borehole pressure gradually increases, CO2 begins to infiltrate the internal pores of the sandstone. As shown in Figure 11, the first pressure drop occurs at 1310.6 s (CO2 pressure of 9.2 MPa), indicating the initial formation of a fracture within the specimen. With continued pressure buildup, a second pressure drop is observed at approximately 1460.6 s (CO2 pressure of 10.8 MPa), followed by a peak pressure at 1533.7 s (CO2 pressure of 10.9 MPa). The subsequent rapid pressure drop suggests the development of larger internal fractures and the formation of a pressure relief channel. After a period of stabilized CO2 pressure, the fluid is discharged, and the 3D stress is gradually released in all three directions, concluding the experiment. To determine the sequence in which internal fractures occur as fluid pressure increases, AE location events are plotted based on their time of occurrence (color-coded in Figure 12) and fracture type (symbol-coded in Figure 13, Figure 14, Figure 15, Figure 16 and Figure 17). This AE-based method is widely used in laboratory and engineering field analysis of rock fracture locations [35,36,37]. The X-, Y-, and Z-axis correspond to the maximum horizontal principal stress direction, minimum horizontal principal stress direction, and vertical principal stress direction, respectively.
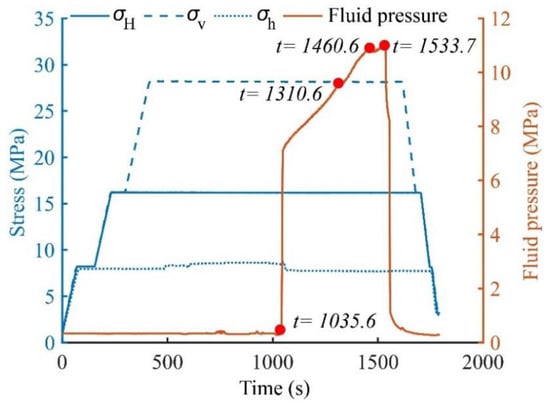
Figure 11.
3D stresses and CO2 fluid injection pressure.
Figure 11.
3D stresses and CO2 fluid injection pressure.
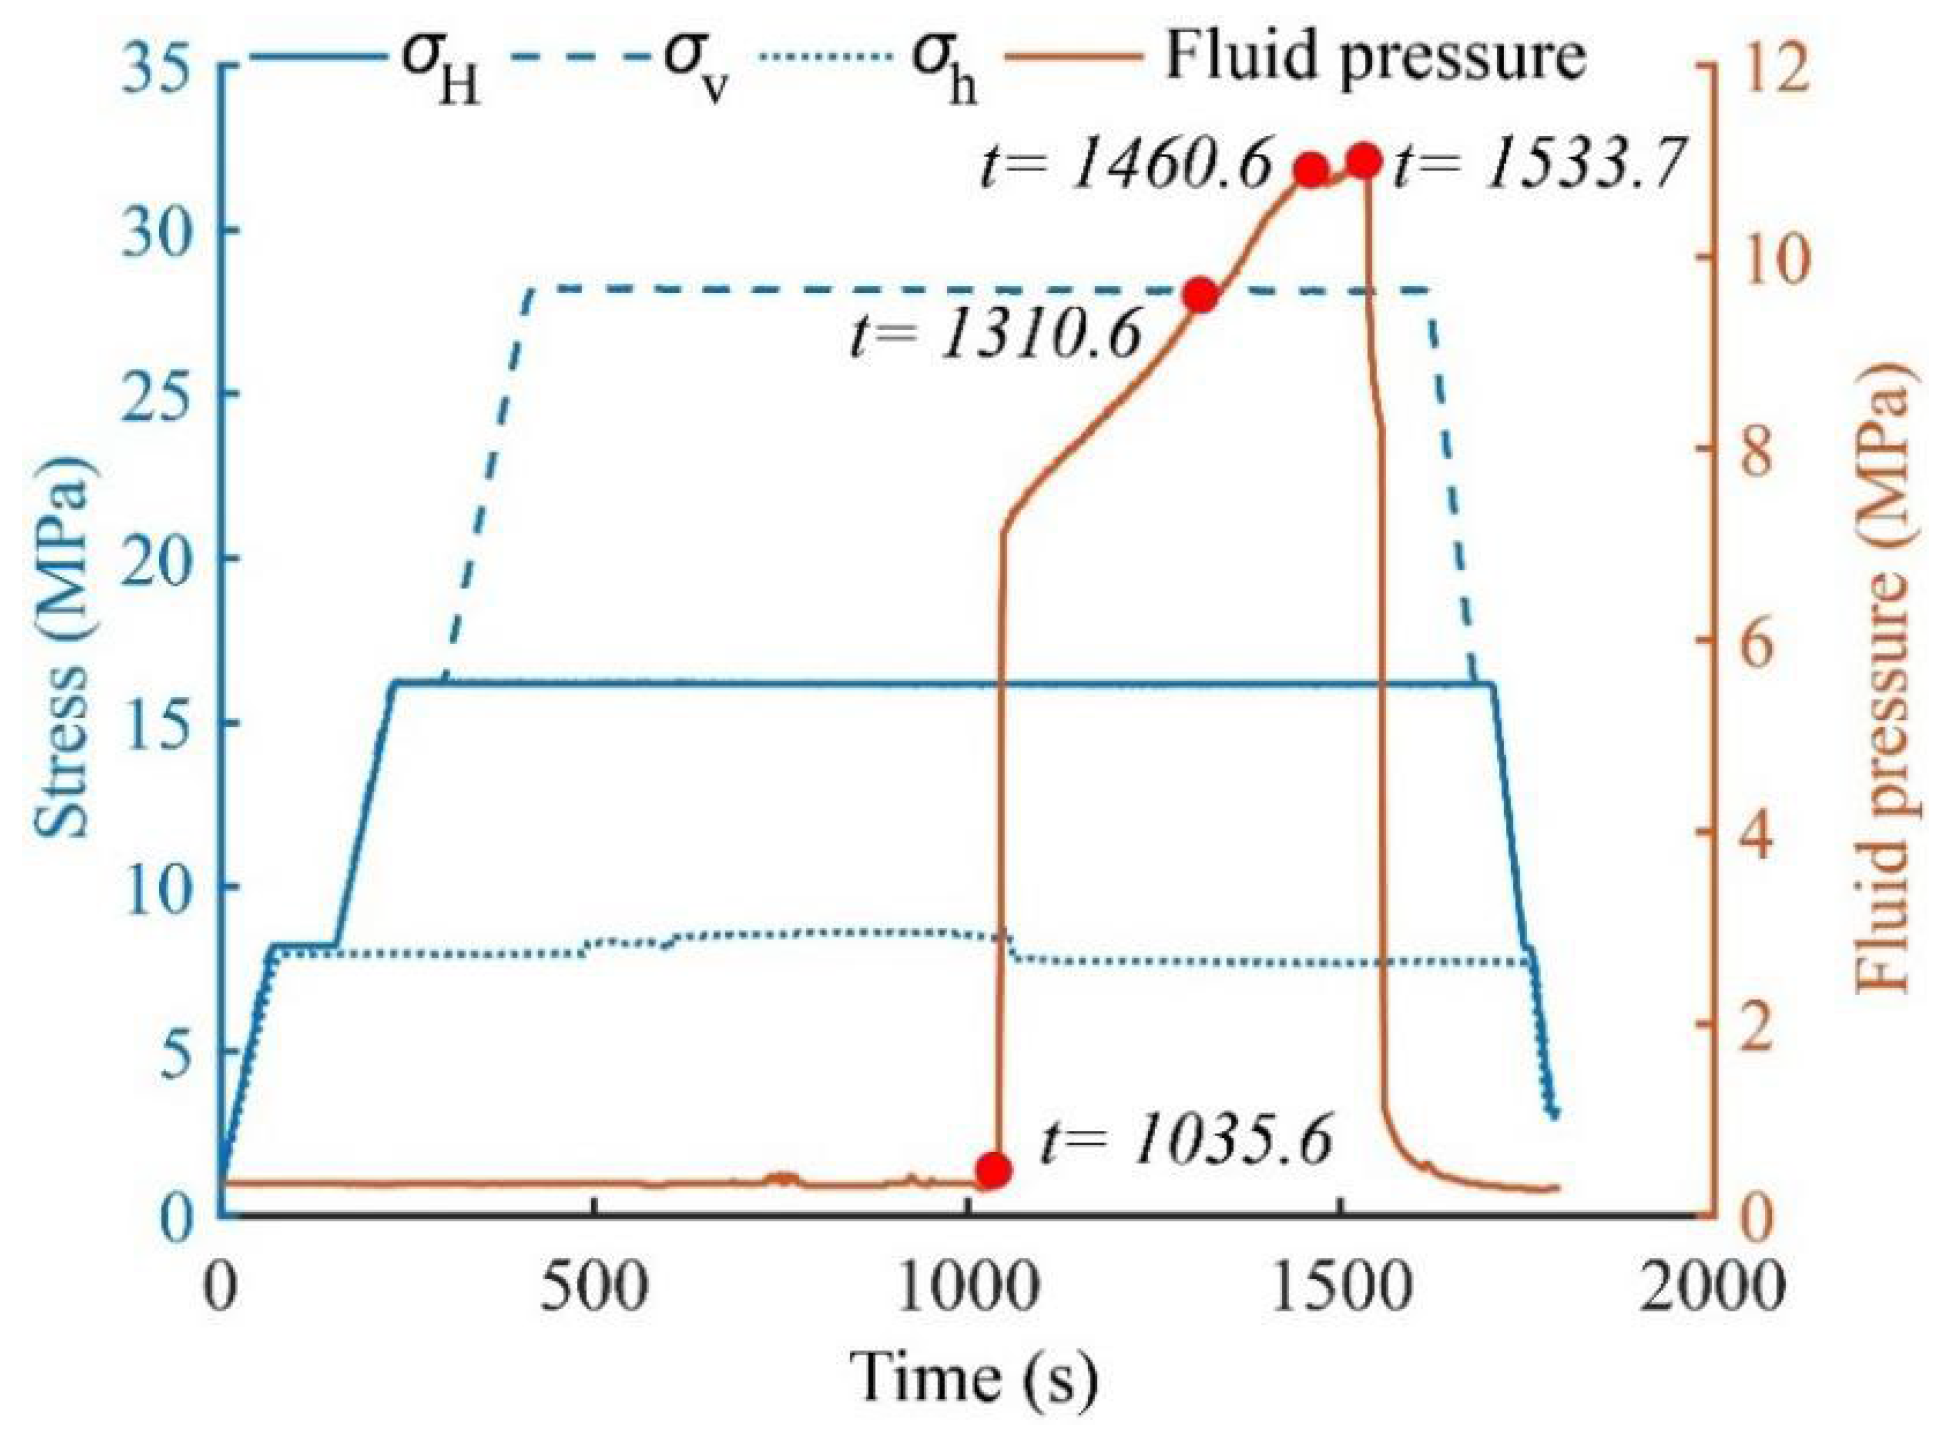
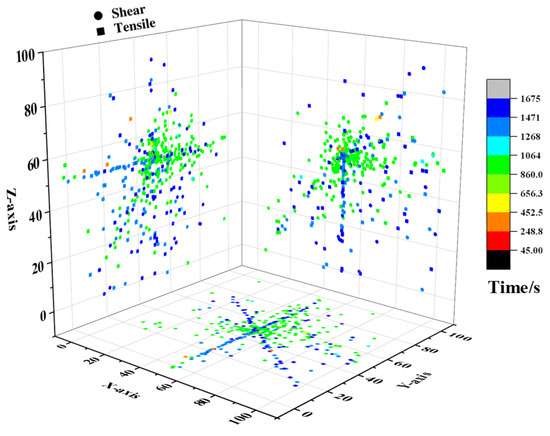
Figure 12.
Fracture evolution of all AE locations.
Figure 12.
Fracture evolution of all AE locations.
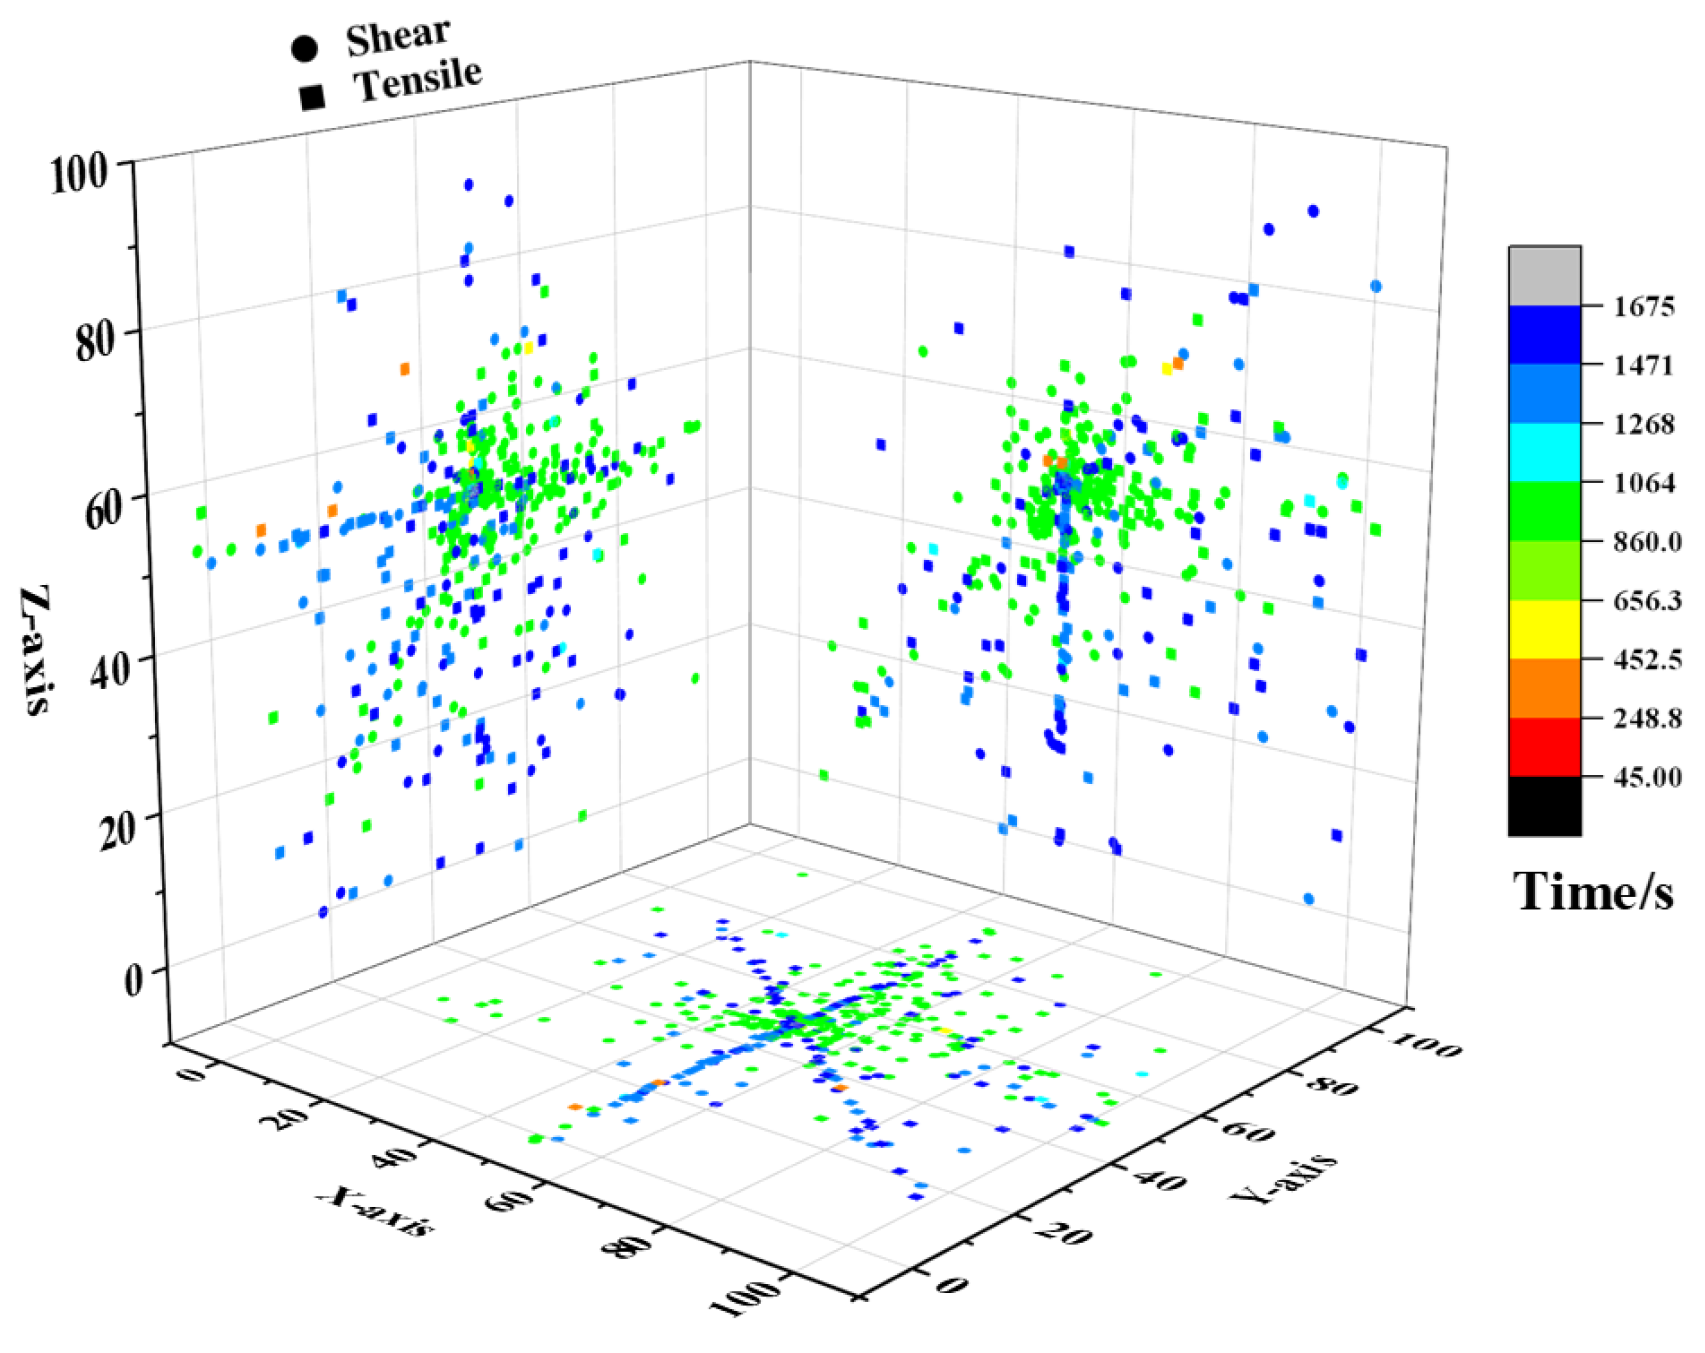
Figure 12 illustrates that fractures predominantly occur during two distinct periods: around 1000 s (cyan region) and 1500 s (blue region). At approximately 1000 s, CO2 injection begins, producing fractures that are randomly distributed around the borehole (cyan area in Figure 13) without forming a dominant fracture network. Figure 13 shows numerous shear fractures generated near the borehole. As CO2 pressure increases, the specimen experiences three pressure drops between 1300 and 1600 s (Figure 11), corresponding to three fracture propagation and failure events in Figure 12. The oblique fracture formed around 1500 s penetrates the entire specimen, leading to a notable CO2 pressure drop.
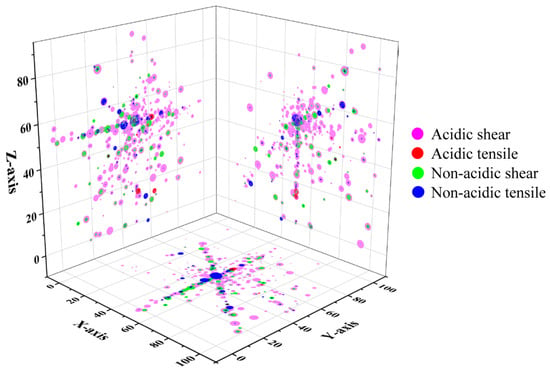
Figure 13.
Fracture distribution of different types of fractures.
Figure 13.
Fracture distribution of different types of fractures.
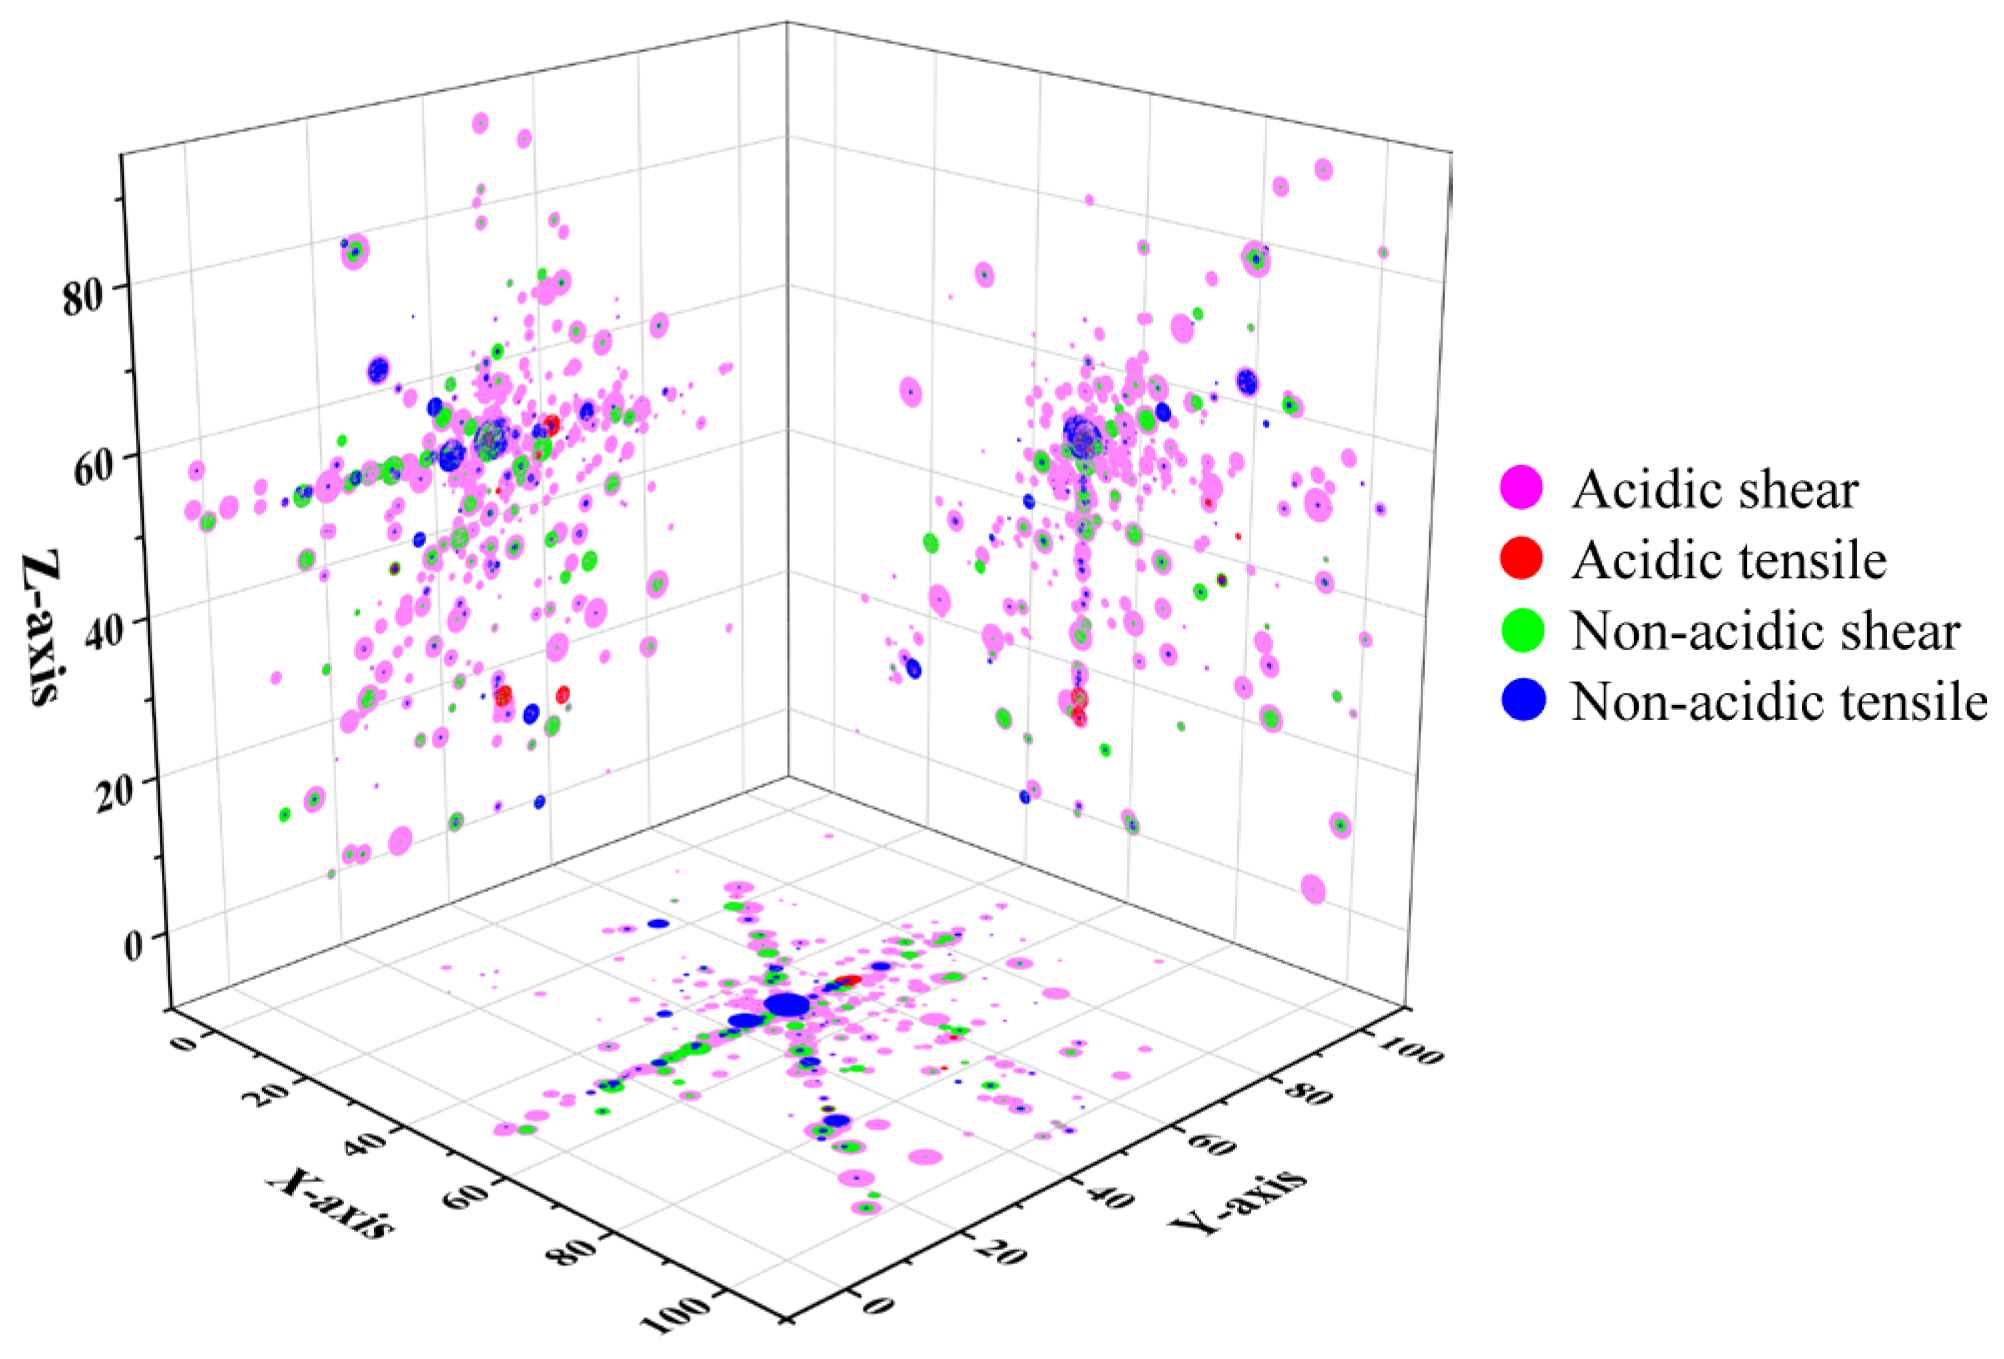
According to Figure 13, this final failure, characterized by a diagonal oblique fracture, is mainly caused by shear failure. This contrasts with fractures aligned parallel to the X-axis. Additionally, the energy released by acidic shear fractures is generally greater than that of non-acidic shear fractures, primarily due to shear stress concentration along the oblique direction.
To further analyze the interaction between different fractures, AE events were classified by fracture type based on pressure fluctuations during fluid injection. Pressure fluctuations during fluid injection served as the basis for this classification. Subsequent analysis explored the relationship between pressure fluctuations and the initiation and propagation of various fracture types. Different fracture types were color-coded to clearly visualize their spatial distribution and relationships.
Before CO2 injection, the specimen was loaded to a predetermined stress state. During this stage, fractures were primarily concentrated near the center of the specimen, causing localized fractures on the YZ-plane around X = 50 mm. These fractures formed a dominant orientation that subsequently influenced the direction of CO2 injection and fracture propagation. As shown in Figure 14, the fractures mainly consisted of acidic shear fractures, with many exhibiting co-occurring tensile-shear characteristics. Tensile and shear occur almost simultaneously at the same location. AE data sequences frequently revealed an acidic shear fracture immediately followed by a non-acidic tensile fracture. This pattern may be attributed to shear fractures induced by shear stress, subsequently leading to tensile fractures caused by grain rotation.
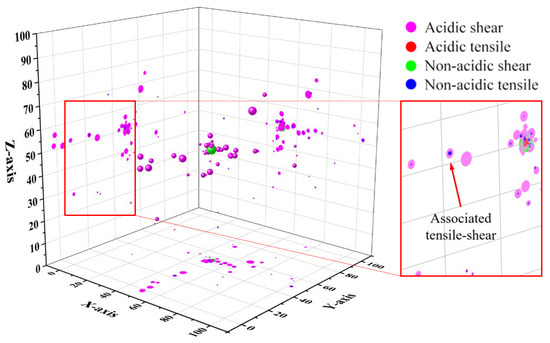
Figure 14.
Fracture distribution before CO2 injection, the point size indicates energy.
Figure 14.
Fracture distribution before CO2 injection, the point size indicates energy.
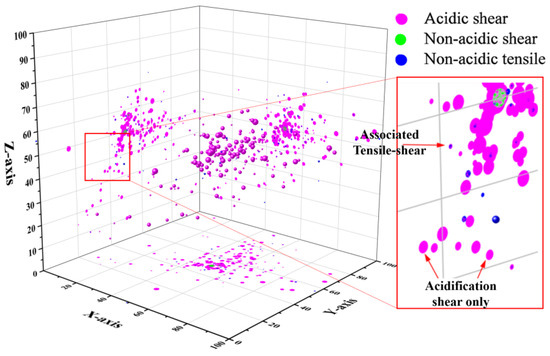
Figure 15.
Fracture distribution during the first pressure drops when CO2 injection.
Figure 15.
Fracture distribution during the first pressure drops when CO2 injection.
When CO2 was injected and its pressure increased, no clear through-going fracture formed inside the specimen at the time of the first pressure drop. Numerous fractures appeared near the central injection port. Acidic shear fractures also developed at the edges, aligned with zones of shear stress concentration. This behavior results from the low viscosity of CO2, which enables rapid diffusion into micro-pores, reducing effective stress and triggering shear fractures along acidized weak surfaces. Unlike earlier fractures, these are primarily acidic shear fractures, with only a few combined shear-tensile fractures. This observation aligns with previous findings that specimen fractures initiate at points inside the specimen, at a certain radial distance from the borehole’s central axis, rather than at the wellbore wall [38].
During the first and second pressure drops, fractures primarily developed along the pre-existing damage direction on the Y-Z plane (Figure 16). These fractures were mainly induced by prior damage and tended to propagate along the initial damage zones, resulting in some non-acidic shear fractures. Additionally, oblique fractures formed within the shear stress concentration areas. Under CO2 pressure, fractures in these concentrated shear zones were predominantly acidic shear fractures, resembling the initial fracture process. This behavior likely results from CO2 diffusing into rock pores, reducing effective rock stress, and causing fractures to preferentially initiate in acidized regions with lower shear strength under high shear stress.
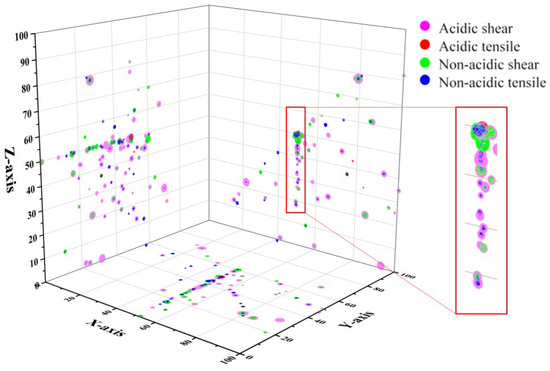
Figure 16.
Fracture distribution during the second pressure drop.
Figure 16.
Fracture distribution during the second pressure drop.
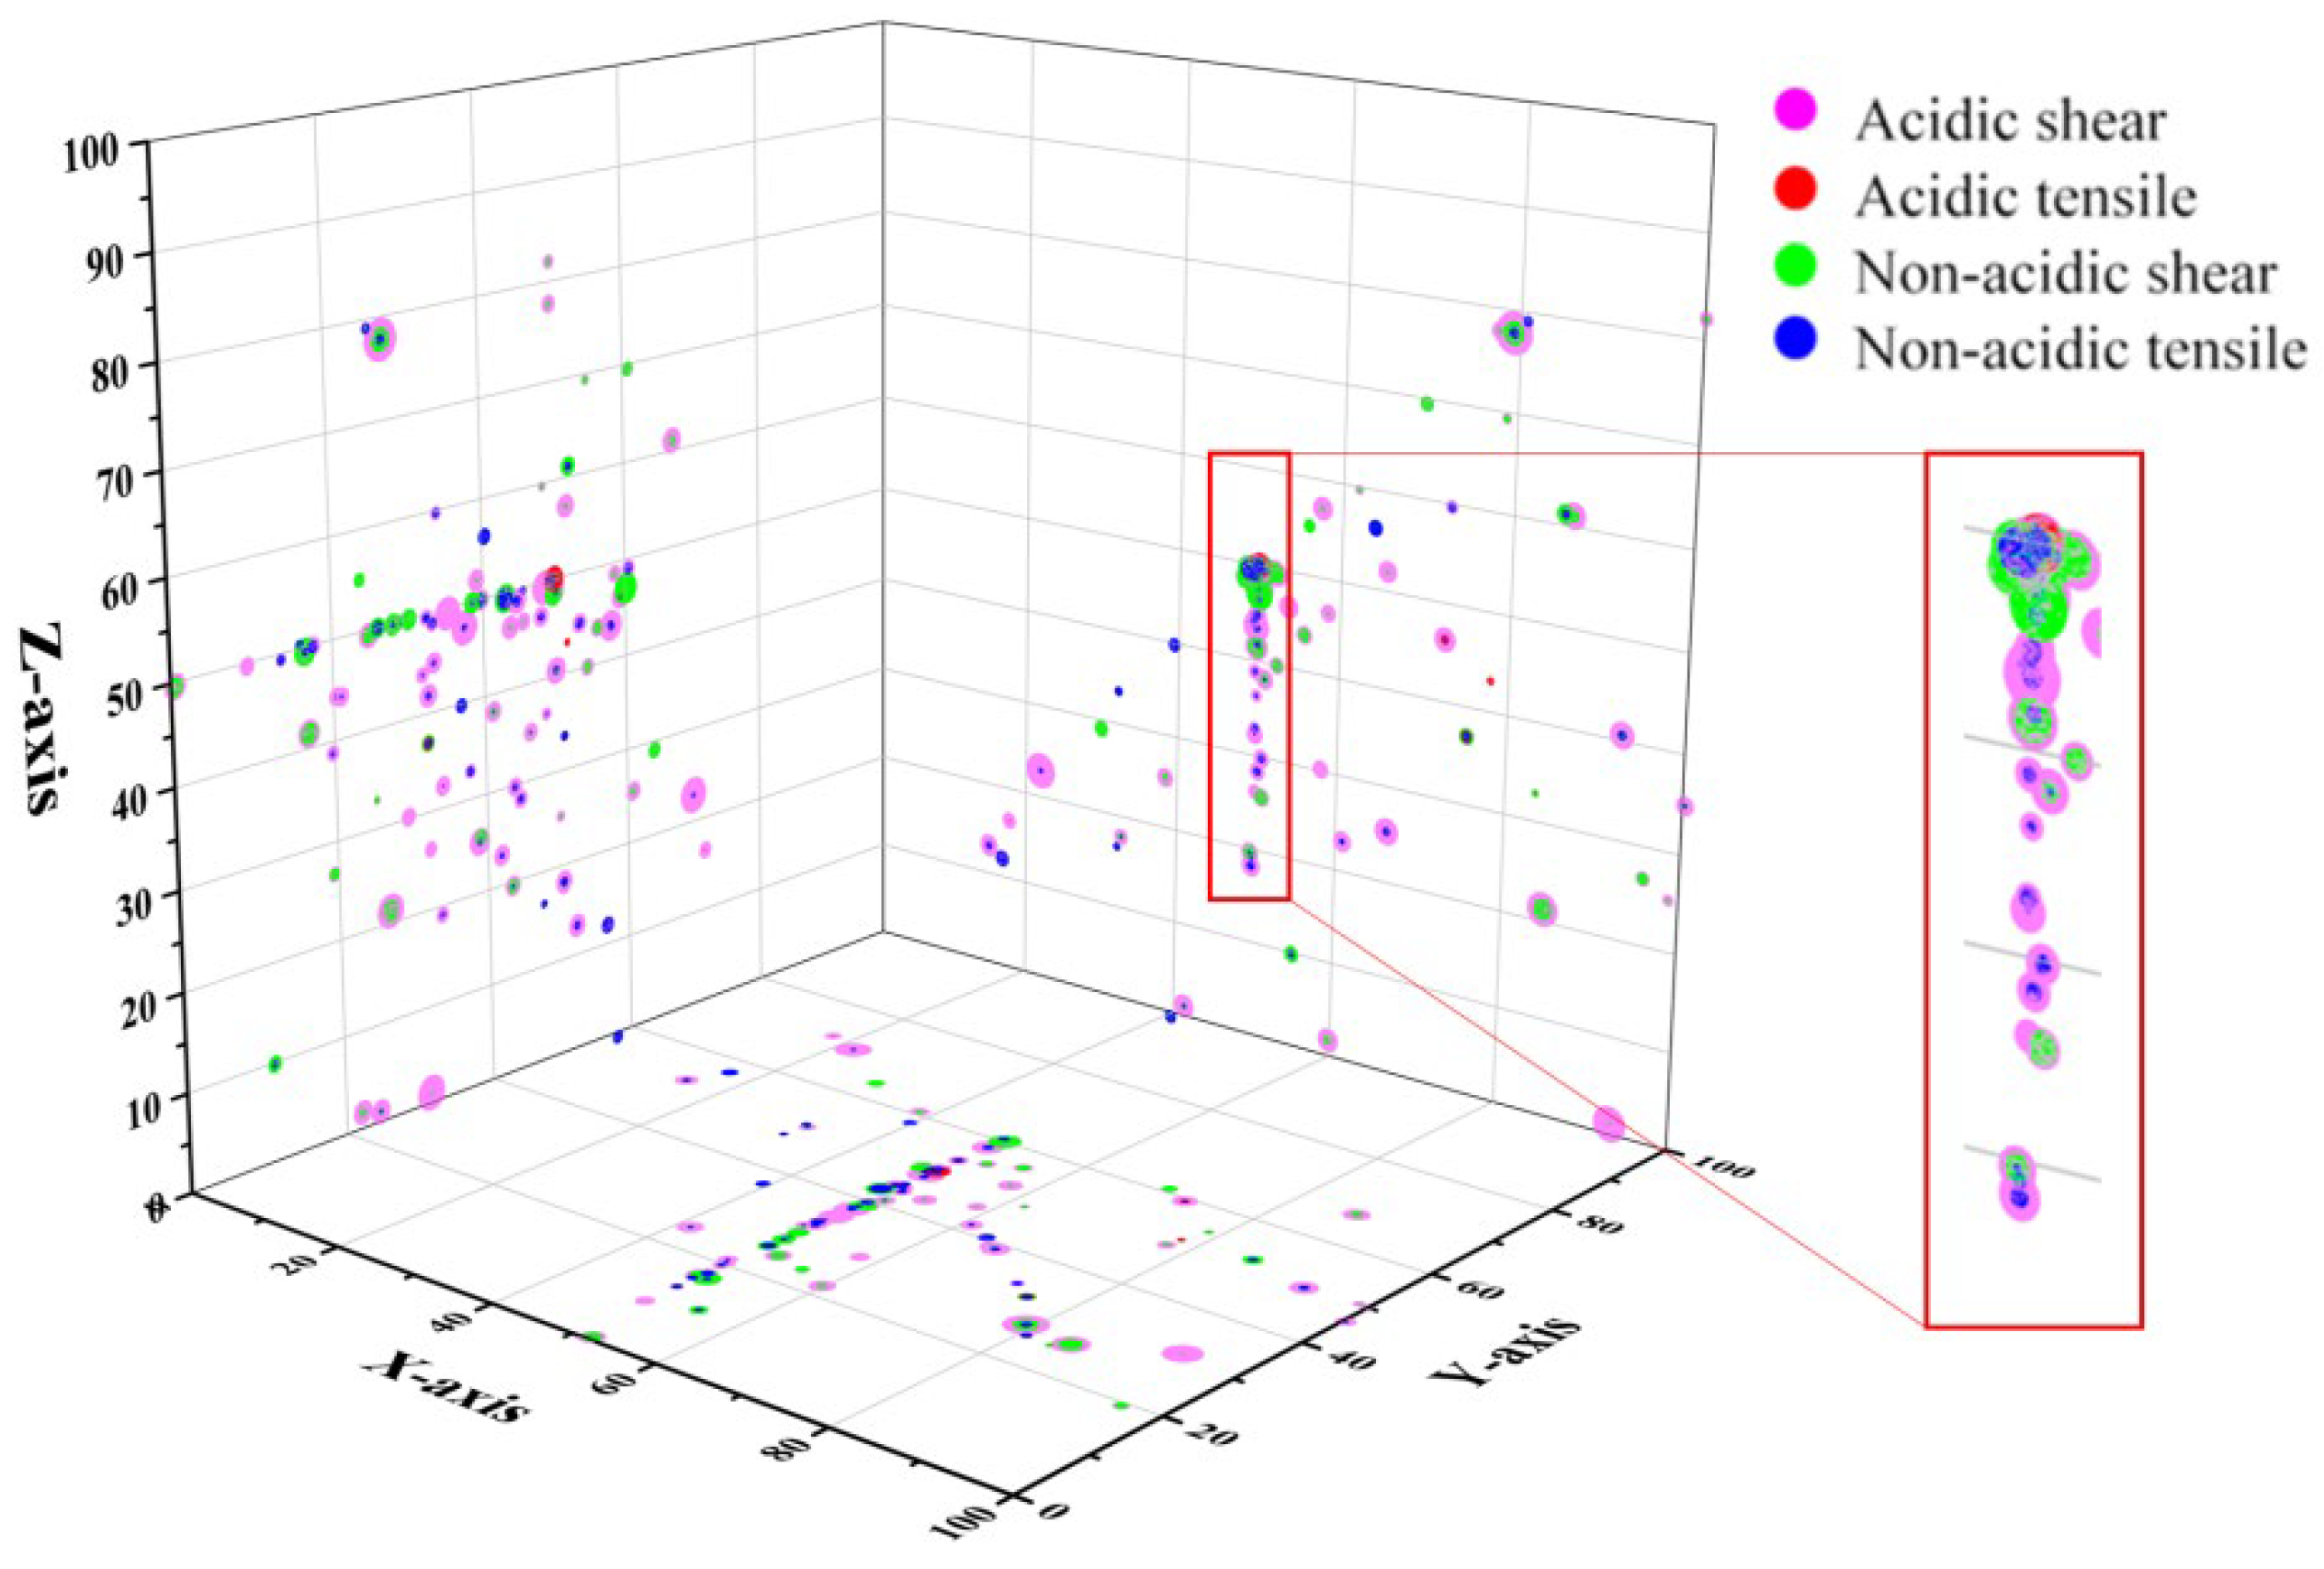
Additionally, we observed that acidic and non-acidic fractures can coexist in the same region. This is likely due to the relatively high viscosity of the acid solution and the acidization being performed at atmospheric pressure, which limits the acid’s penetration to larger pores while failing to reach smaller or closed micro-pores. Consequently, acidization within the specimen is uneven, leaving many micro-pores untreated. In contrast, supercritical CO2 can readily infiltrate these micro-pores and induce tensile fractures in the non-acidic zones. This explains the simultaneous occurrence of both acidic and non-acidic hydraulic fractures within the same area.
As the pressure continued to rise, a through-going fracture formed inside the specimen, causing the injection pressure to drop rapidly after reaching its peak (Figure 11). Figure 17 shows that fractures predominantly developed along the specimen’s diagonal, mainly comprising acidic shear, non-acidic tension, and non-acidic shear fractures. Some non-acidic shear fractures occurred due to incomplete acidification of small pores near the specimen’s edges. Compared to the first pressure drop, the number of non-acidic fractures increased significantly during the second and especially the third pressure drops. This increases likely results from fractures extending along existing cracks (Figure 10a,d), amplifying the development of non-acidic fractures. During CO2 fracturing, the specimen initially developed dispersed acidic shear fractures under shear stress, originating from acidized weak surfaces with lower shear strength. In later stages, fractures propagated preferentially along dominant fracture directions, with both acidized and numerous non-acidic fractures forming.
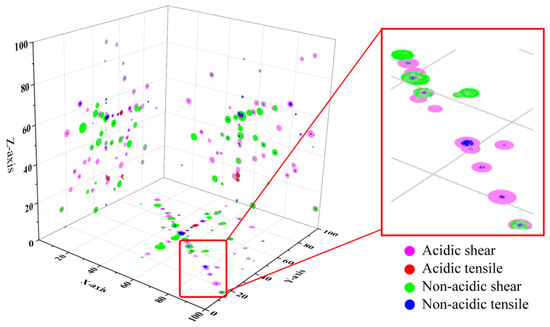
Figure 17.
Fracture distribution between the second pressure drops and third peak.
Figure 17.
Fracture distribution between the second pressure drops and third peak.
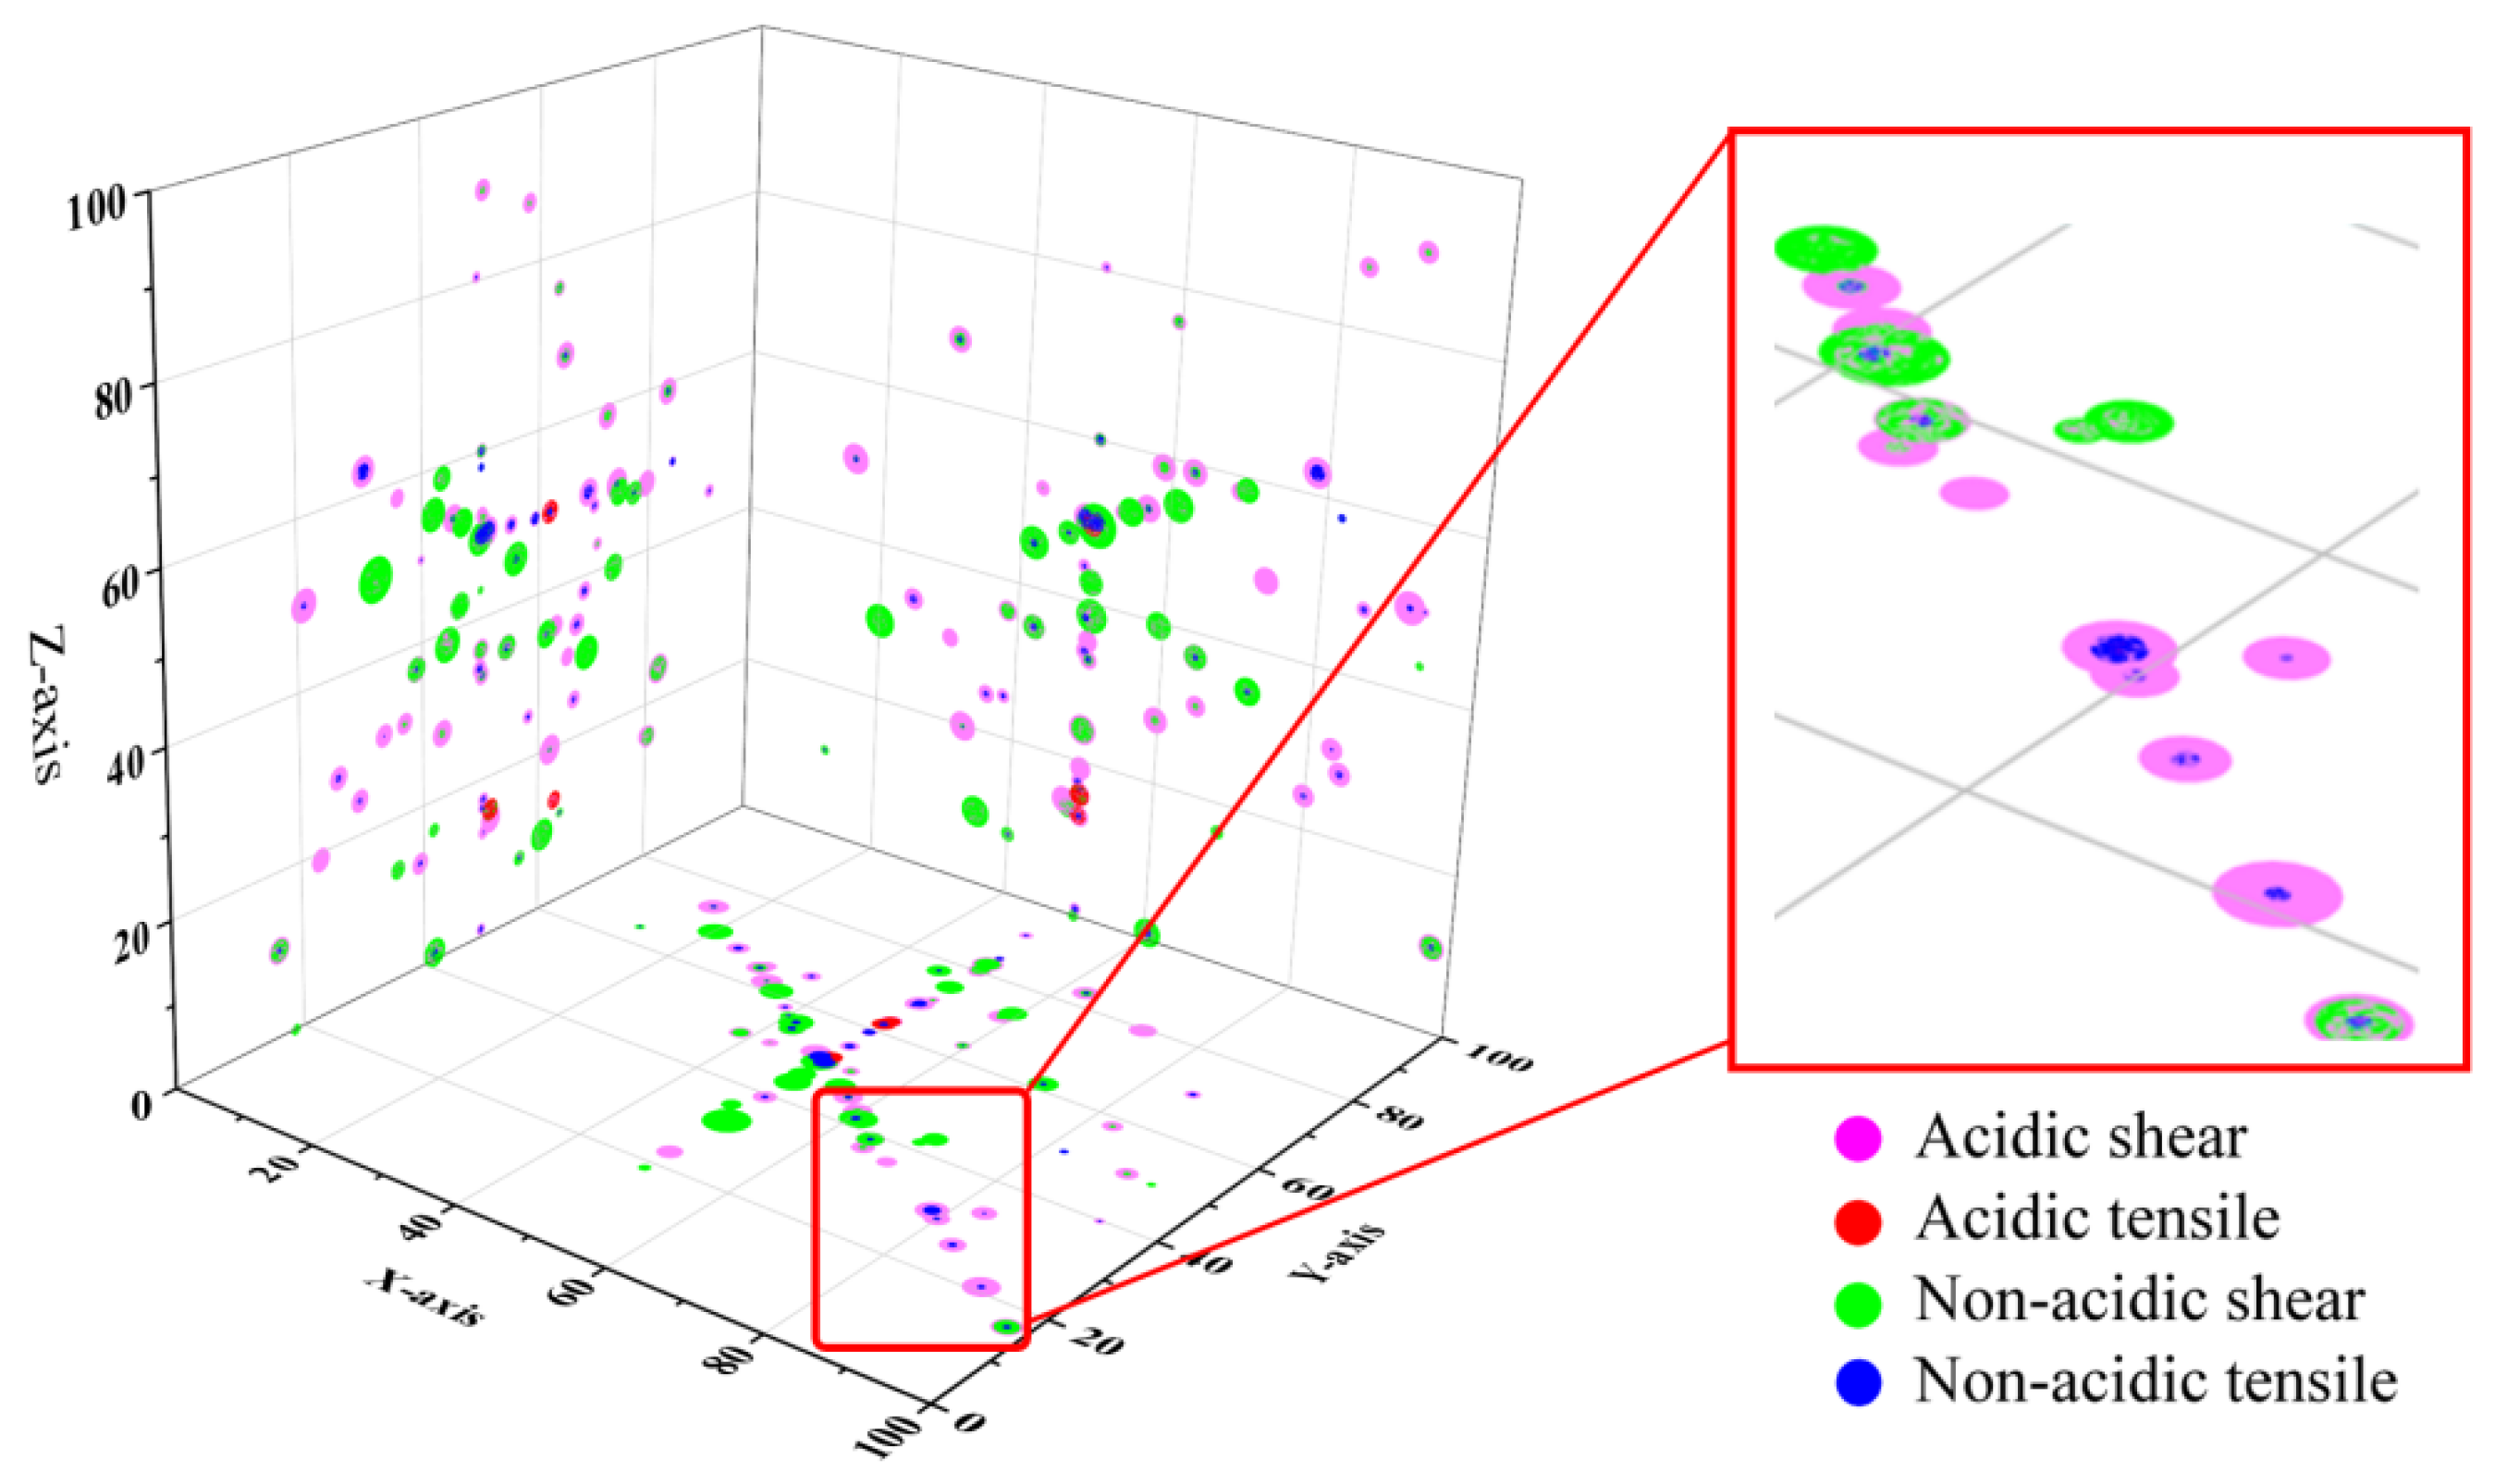
Although there were many non-acidic shear fractures on both the X-Y fracture plane and the cross-diagonal fracture plane, the cross-diagonal fracture plane was dominated by acidic fractures. This is because the cross-diagonal fracture plane happened to be in shear stress concentration and would preferentially exhibit acidic shear. Acidic tensile fractures rarely occurred during the fracturing process. This is mainly because the viscosity of the acidic fluid is large, making it unable to enter small pores. Tensile fractures often occur on small-grain weak surfaces, where only a non-acidic tensile fracture is usually generated. This promotes further expansion of fractures, eventually leading to the development of through-going fractures in the direction of dominant shear stress.
4.2. Fracture Evolution During Acidic Hydraulic Fracturing
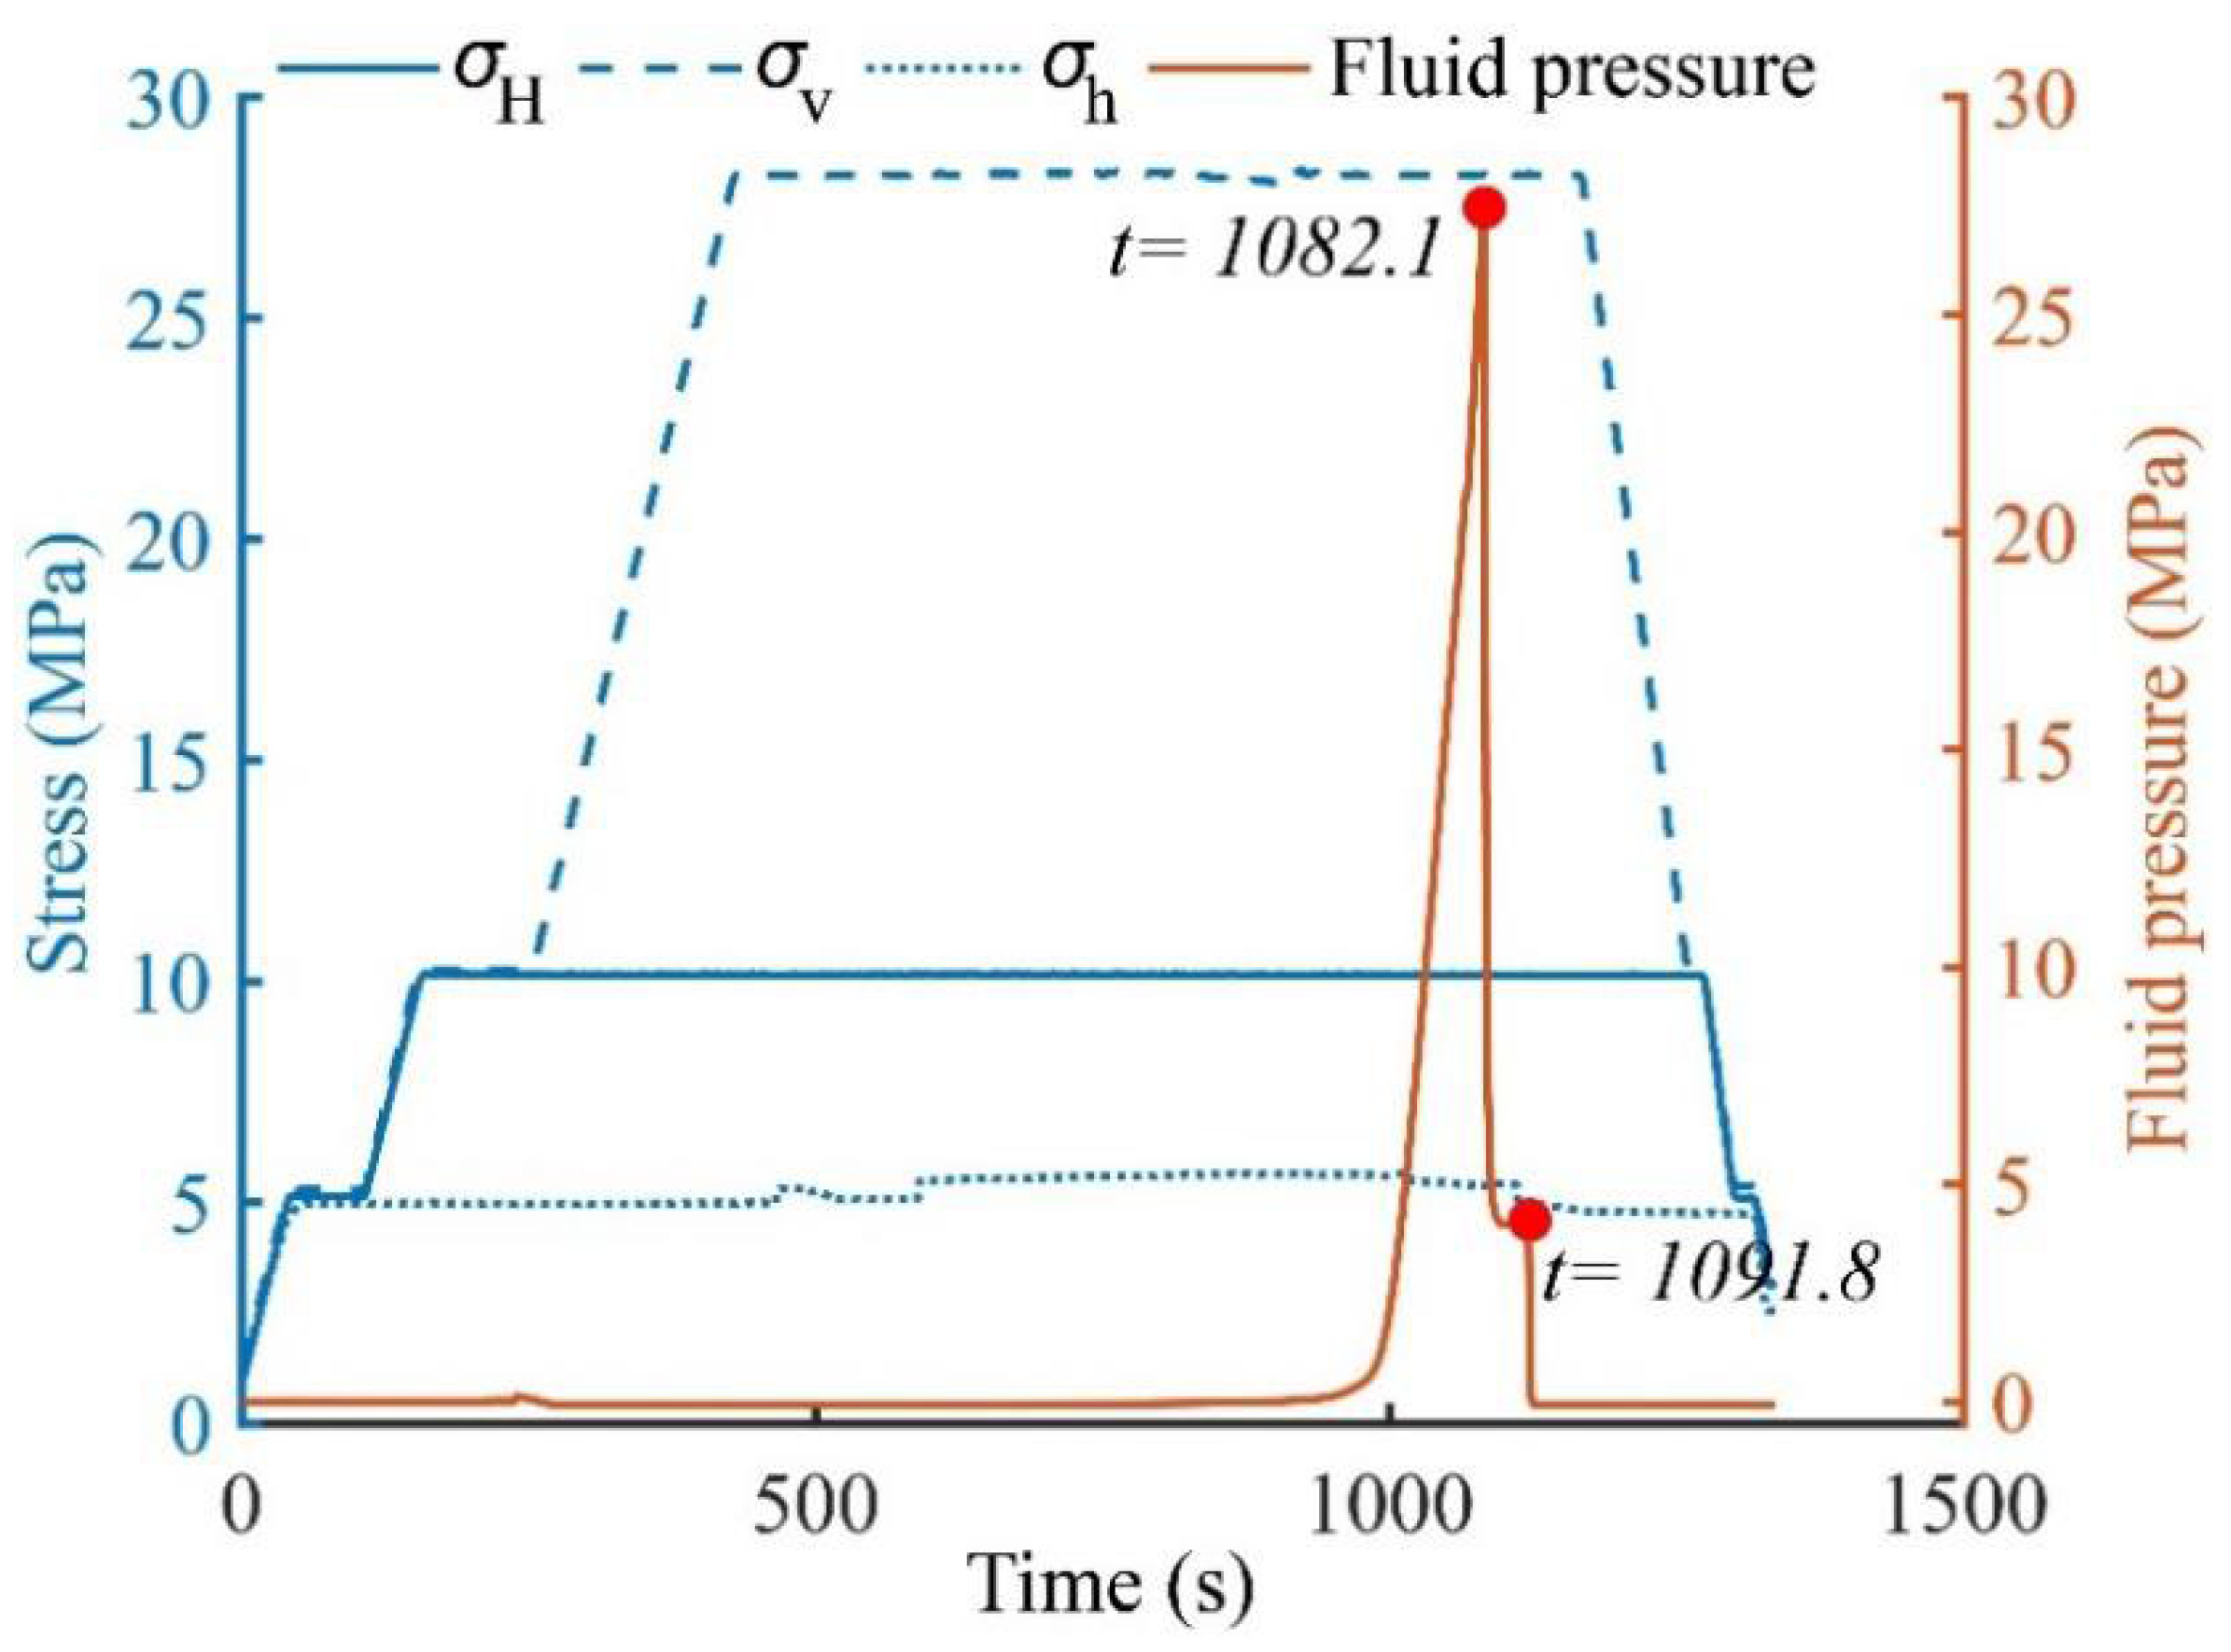
To investigate the differences between CO2 and hydraulic fracturing, this study conducted comparative hydraulic fracturing experiments following acidic treatment. The detailed fracturing conditions and water pressure variations are presented in Figure 18.
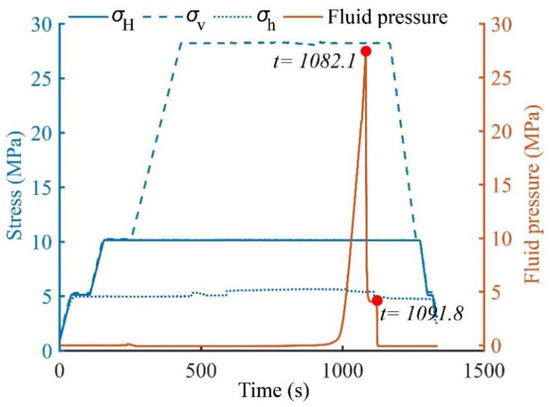
Figure 18.
3D stress and hydraulic fracture injection pressure.
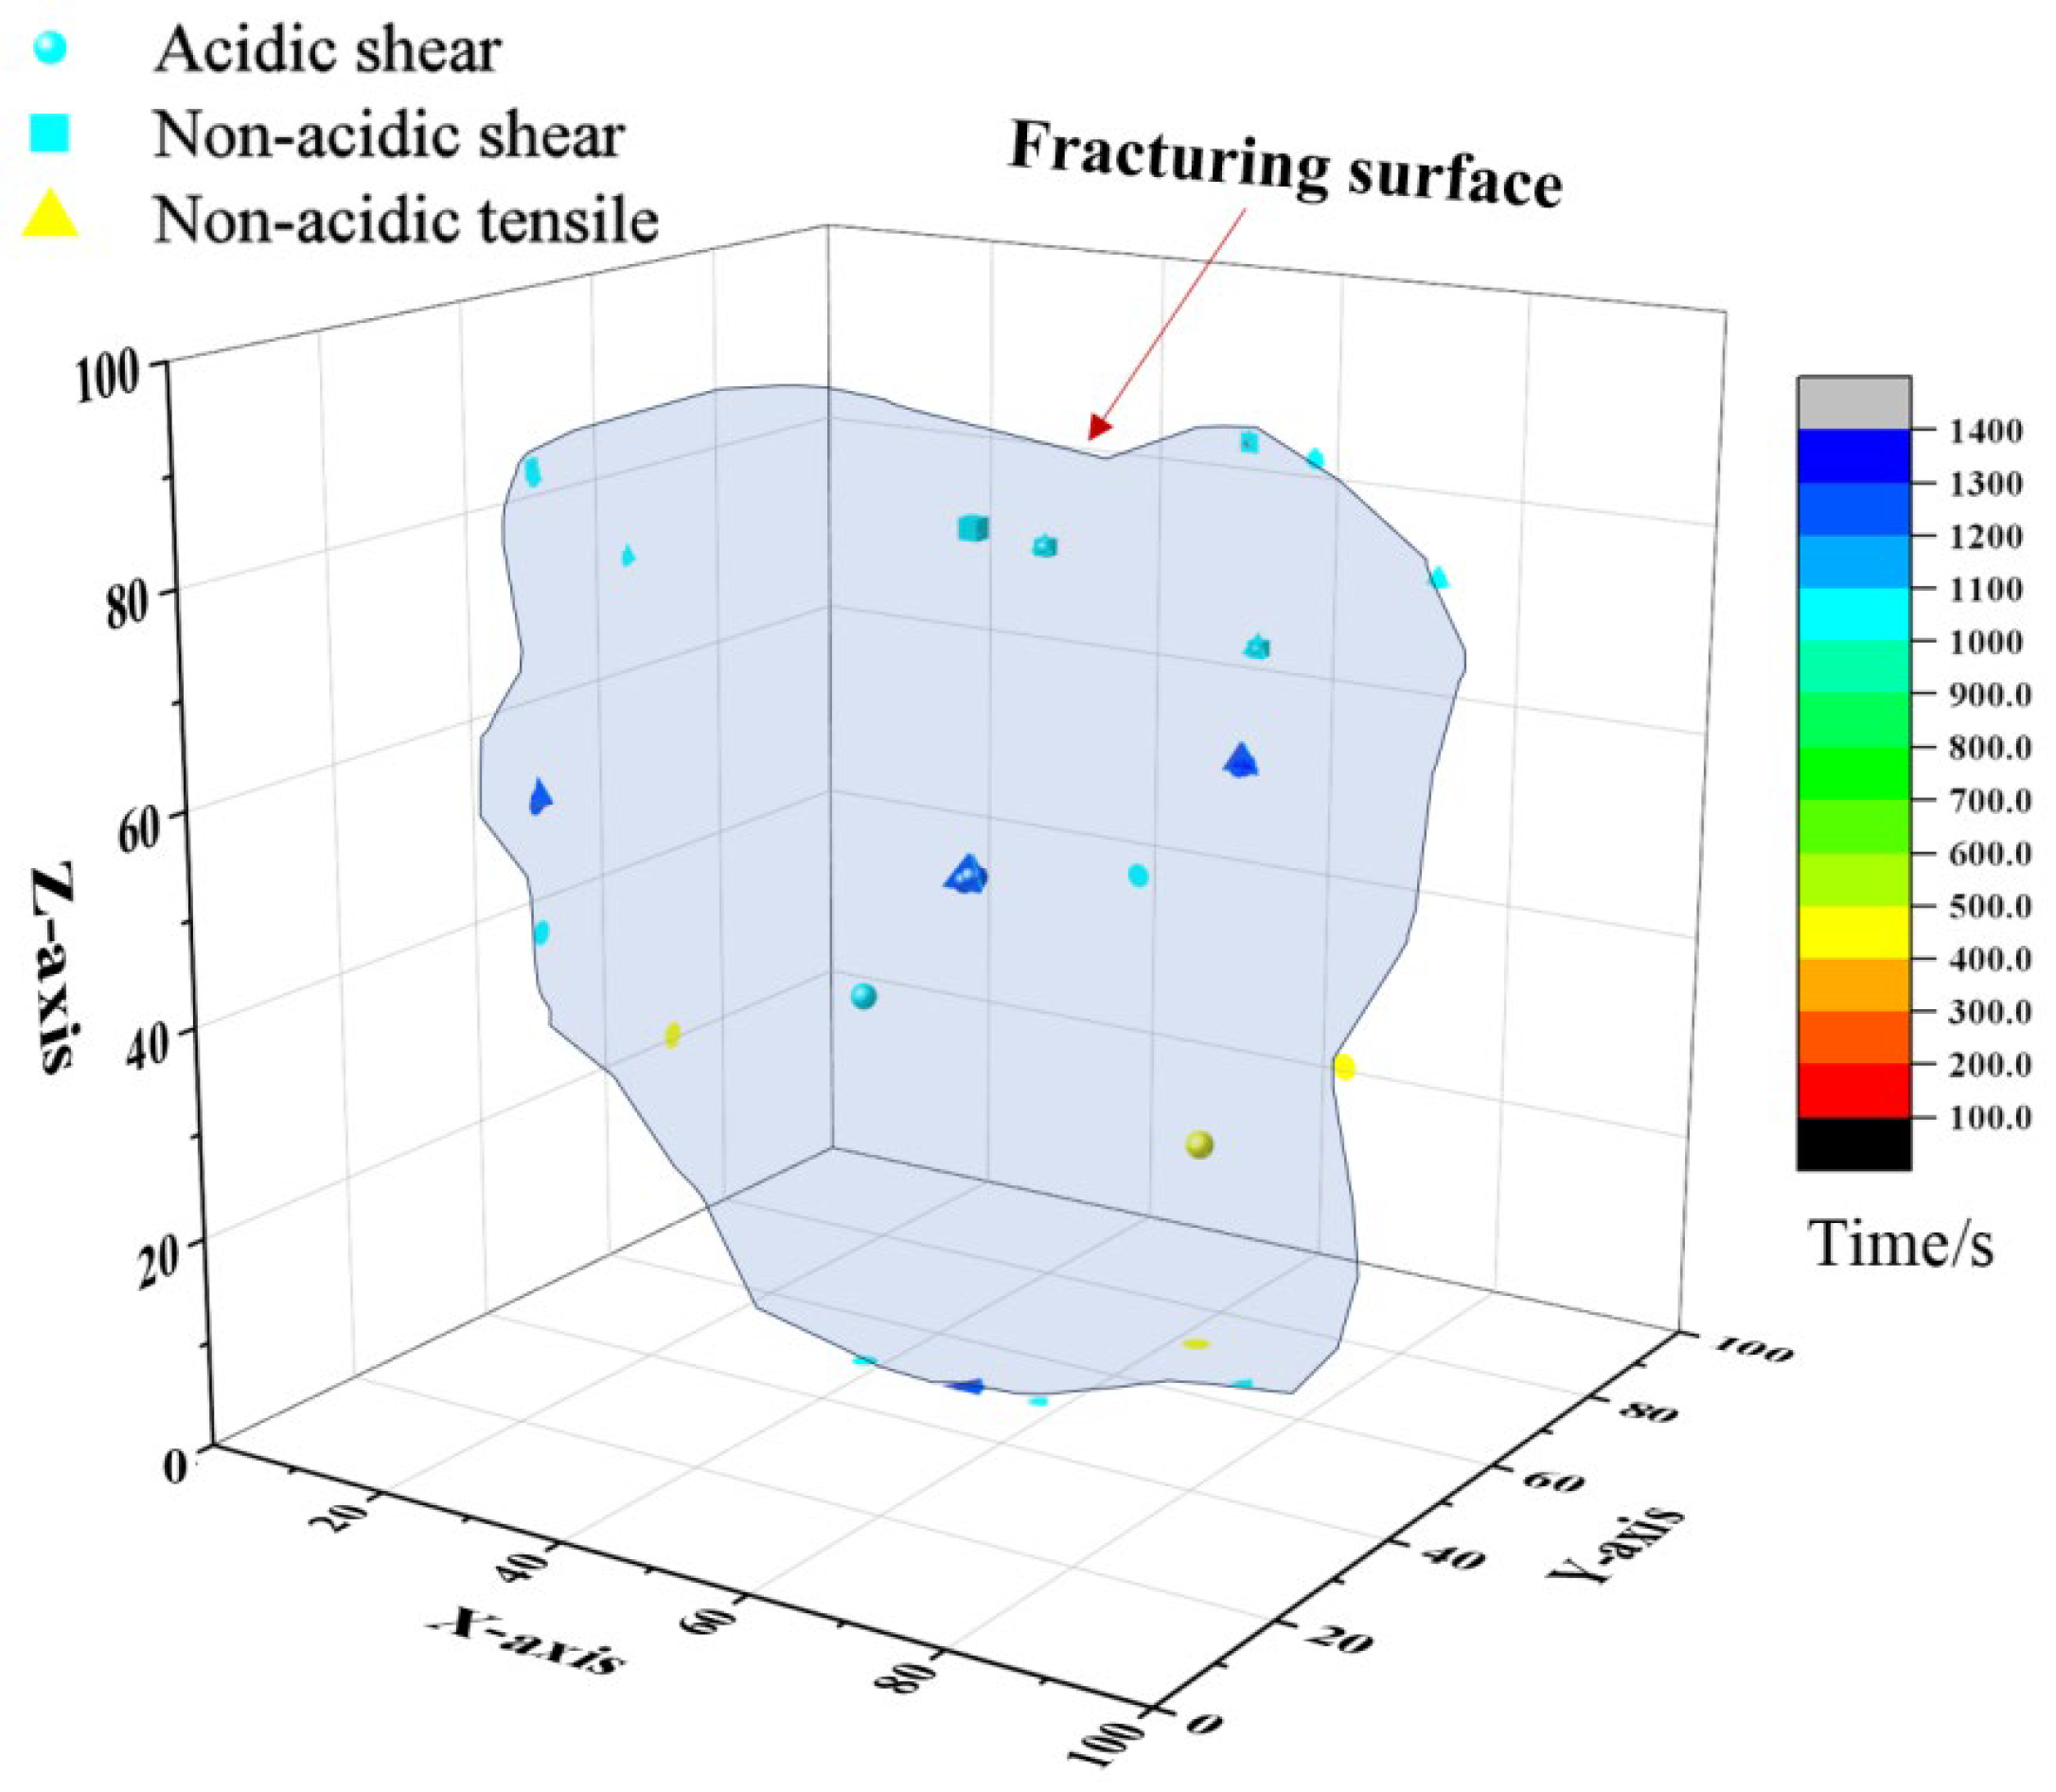
Figure 18 shows that the fluid pressure change during hydraulic fracturing is relatively straightforward. After the fracturing fluid fills the borehole, the pressure rapidly rises, reaching its peak at 1082 s. AE analysis indicates that most fractures occurred between 1000 and 1100 s (Figure 19), aligning with the pressure drop observed in Figure 18.
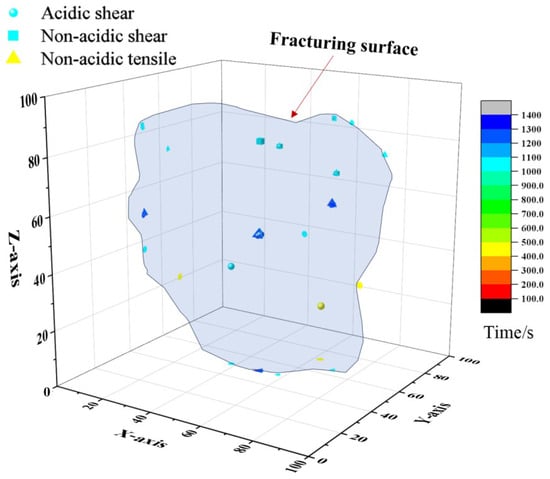
Figure 19.
Fracture evolution during hydraulic fracturing.
Hydraulic fracturing of sandstone predominantly produces shear and non-acidic tensile fractures. Compared to CO2 fracturing, the proportion of non-acidic tensile fractures increases significantly, accounting for approximately 40%. In hydraulic fracturing, shear fractures often develop following tensile fractures, which is the reverse sequence observed in CO2 fracturing, where shear fractures precede tensile ones. This contrast underscores a fundamental difference between the two methods: CO2 fracturing is mainly driven by external stress, whereas hydraulic fracturing is primarily driven by fluid pressure, resulting in higher fracturing pressures. The low viscosity of CO2 enables easy diffusion into the rock matrix, causing more dispersed shear fractures and producing rougher fracture surfaces with increased branching. Conversely, the higher viscosity of water limits its penetration into smaller pores, leading to pressure concentration. As a result, water pressure rises rapidly, inducing a splitting effect that swiftly expands the fracture surface and triggers a rapid pressure drop. The fracture surfaces formed under these conditions tend to be relatively smoother.
Compared to CO2 fracturing, hydraulic fracturing generates fewer AE events but produces more tensile fractures. This is attributed to the high viscosity and low permeability of the fracturing fluid, which restricts rapid infiltration to the crack tip and maintains the local stress field. Consequently, strong tensile stresses easily accumulate at the crack tip, leading to tensile fractures in sandstone. Subsequently, shear cracks develop near these tensile fractures, facilitating further fracture propagation.
Furthermore, this finding has also profound implications for naturally fractured reservoirs, where rock masses are preconditioned by both basin-scale tectonics (macroscopic fractures) and diagenetic processes (micro-scale cracks). We believe that the presence of such a pre-existing fracture network, at any scale, would dramatically amplify the effects observed here. Acid and supercritical CO2 would rapidly infiltrate this network, creating a system of highly conductive, acid-etched weak planes. During subsequent CO2 fracturing, the combined effect of reduced cohesion and elevated pore pressure would lead to shear activation along these planes at significantly lower pressures, resulting in a more complex fracture network than that achieved in intact rock.
5. Discussion
The AE data collected from CO2 fracturing tests on acid-pretreated tight sandstone were analyzed using AI techniques. This analysis revealed the dynamic evolution and underlying mechanisms of crack propagation within the sandstone during the fracturing process. The main findings are summarized as follows:
- (1)
- CO2 proactively weakens the tight sandstone by degrading its cementation (reducing cohesion) and reducing the effective stress counteracting shear failure, leading to complex fracture networks at lower pressures;
- (2)
- A well-trained AI model developed through a combination of unsupervised and supervised learning effectively identified AE waveforms corresponding to different crack types, including acidic tensile, acidic shear, non-acidic tensile, and non-acidic shear, with an accuracy of up to 95.4%;
- (3)
- Acid treatment dissolves part of the cementing material in the sandstone, increasing its brittleness. Consequently, the AE waveforms generated during fracture exhibit higher energy distribution in the high-frequency domain, a characteristic that aligns closely with the AE time-frequency patterns observed in tensile fractures;
- (4)
- During the CO2 fracturing process, the specimen tends to generate acidic shear fractures preferentially along the acidified weak planes under shear stress. When a dominant fracture direction is present, these acidic shear fractures further induce the formation and propagation of non-acidic shear and tensile cracks. Acidification thus reduces the local shear strength of the sandstone and accelerates fracture propagation;
- (5)
- Due to the significantly lower diffusivity of water compared to CO2, hydraulic fracturing predominantly induces non-acidized mixed-mode (tensile-shear) fractures. This fundamental difference in fracture patterns accounts for the higher initiation pressure observed in hydraulic fracturing compared to CO2 fracturing.
Author Contributions
Conceptualization, Z.S. and J.H.; methodology, W.G. and Z.S.; software, Z.S.; validation, J.H.; investigation, Q.L.; resources, Z.S.; data curation, J.H.; writing—original draft preparation, Z.S.; writing—review and editing, Z.S. and J.H.; visualization, Z.S. and J.H.; supervision, Z.S. and J.H.; project administration, Z.S. and J.H.; funding acquisition, Z.S. and J.H. All authors have read and agreed to the published version of the manuscript.
Funding
This research was funded by the National Natural Science Foundation of China (U21A2030, 52104075), the Brain-Gain Plan of New Chongqing—Young Elite Program (Grant No. CSTB2024YCJH-KYXM0046), the Postdoctoral Fellowship Program of CPSF (Grant No. GZC20242132), 75th China Postdoctoral Science Foundation Funded Project (Grant No. 2024MD754008), the Open Funding of State Key Laboratory of Coal Mine Disaster Prevention and Control (Grant No. 2024SKLKF08) and the Key Project for Technological Innovation and Application Development in Chongqing (CSTB2025TIAD-KPX0029).
Institutional Review Board Statement
Not applicable.
Informed Consent Statement
Not applicable.
Data Availability Statement
The data and materials to support the findings of this study are available from the corresponding author upon reasonable request.
Conflicts of Interest
The authors declare no conflicts of interest.
References
- Chen, P.; Hu, C.; Zou, P.; Lin, L.; Lu, S.; Gao, X. Pressure Response of a Horizontal Well in Tight Oil Reservoirs with Stimulated Reservoir Volume. Lithosphere 2021, 2021, 5383603. [Google Scholar] [CrossRef]
- Ibrahim, A.U.; Negash, B.M.; Rahman, M.T.; Suleiman, A.; Kwaku, D.D. A Mathematical Model for Estimating Effective Stimulated Reservoir Volume. J. Petrol. Explor. Prod. Technol. 2022, 12, 1775–1784. [Google Scholar] [CrossRef]
- Zhang, J.; Zheng, H.; Wang, G.; Liu, Z.; Qi, Y.; Huang, Z.; Fan, X. In-Situ Stresses, Abnormal Pore Pressures and Their Impacts on the Triassic Xujiahe Reservoirs in Tectonically Active Western Sichuan Basin. Mar. Pet. Geol. 2020, 122, 104708. [Google Scholar] [CrossRef]
- Ito, T. Effect of Pore Pressure Gradient on Fracture Initiation in Fluid Saturated Porous Media: Rock. Eng. Fract. Mech. 2008, 75, 1753–1762. [Google Scholar] [CrossRef]
- Wang, J.; Huang, Y.; Zhou, F.; Song, Z.; Liang, X. Study on Reservoir Damage during Acidizing for High-Temperature and Ultra-Deep Tight Sandstone. J. Petrol. Sci. Eng. 2020, 191, 107231. [Google Scholar] [CrossRef]
- Zou, Y.; Li, N.; Ma, X.; Zhang, S.; Li, S. Experimental Study on the Growth Behavior of Supercritical CO2-Induced Fractures in a Layered Tight Sandstone Formation. J. Nat. Gas Sci. Eng. 2018, 49, 145–156. [Google Scholar] [CrossRef]
- Azeez, R.S.; Tõnsuaadu, K.; Einard, M.; Kaljuvee, T.; Trikkel, A. Dissolution kinetics of rare earth elements from Estonian phosphate rock using hydrochloric acid treatment. Miner. Eng. 2025, 233, 109641. [Google Scholar] [CrossRef]
- Li, N.; Chen, F.; Yu, J.; Han, P.; Kang, J. Pre-Acid System for Improving the Hydraulic Fracturing Effect in Low-Permeability Tight Gas Reservoir. J. Petrol. Explor. Prod. Technol. 2021, 11, 1761–1780. [Google Scholar] [CrossRef]
- Zhao, X.; Guo, J.; He, E.; Lu, L.; Wang, H. Development of the Coupled Elastoplastic Damage Constitutional Model of Acidized Shale Gas Formation Based on Experimental Study. J. Geophys. Eng. 2019, 16, 332–344. [Google Scholar] [CrossRef]
- Vásárhelyi, B.; Narimani, S.; Davarpanah, S.M.; Mocsár, G. Modeling Brittle-to-Ductile Transitions in Rock Masses: Integrating the Geological Strength Index with the Hoek–Brown Criterion. Appl. Mech. 2024, 5, 634–645. [Google Scholar] [CrossRef]
- Liu, B.; Suzuki, A.; Ito, T. Numerical Analysis of Different Fracturing Mechanisms between Supercritical CO2 and Water-Based Fracturing Fluids. Int. J. Rock Mech. Min. Sci. 2020, 132, 104385. [Google Scholar] [CrossRef]
- Anderson, R.A.; Ingram, D.S.; Zanier, A.M. Determining Fracture Pressure Gradients from Well Logs. J. Petrol. Technol. 1973, 25, 1259–1268. [Google Scholar] [CrossRef]
- Liu, S.; Zhang, L.; Su, X.; Zhao, L.; Wang, Y. Micro-CT Characterization on Pore Structure Evolution of Low-Permeability Sandstone under Acid Treatment. Appl. Geochem. 2023, 152, 105633. [Google Scholar] [CrossRef]
- Deng, B.; Yin, G.; Li, M.; Zhang, D.; Lu, J.; Liu, Y.; Chen, J. Feature of Fractures Induced by Hydrofracturing Treatment Using Water and L-CO2 as Fracturing Fluids in Laboratory Experiments. Fuel 2018, 226, 35–46. [Google Scholar] [CrossRef]
- Li, X.; Lei, X.; Li, Q. Injection-Induced Fracturing Process in a Tight Sandstone under Different Saturation Conditions. Environ. Earth Sci. 2016, 75, 1466. [Google Scholar] [CrossRef]
- Ma, D.; Cheng, C.; Ding, C.; Song, J.; Hu, D.; Zhou, H. Comparisons of Fracturing Mechanism of Tight Sandstone Using Liquid CO2 and Water. J. Nat. Gas Sci. Eng. 2021, 94, 104108. [Google Scholar] [CrossRef]
- Li, S.; Zhang, S.; Ma, X.; Zou, Y.; Li, N.; Chen, M.; Cao, T.; Bo, Z. Hydraulic Fractures Induced by Water-/Carbon Dioxide-Based Fluids in Tight Sandstones. Rock Mech. Rock Eng. 2019, 52, 3323–3340. [Google Scholar] [CrossRef]
- Chen, W.; Konietzky, H.; Liu, C.; Tan, X. Hydraulic Fracturing Simulation for Heterogeneous Granite by Discrete Element Method. Comput. Geotech. 2018, 95, 1–15. [Google Scholar] [CrossRef]
- Zhang, Y.; He, J.; Li, X.; Lin, C. Experimental Study on the Supercritical CO2 Fracturing of Shale Considering Anisotropic Effects. J. Petrol. Sci. Eng. 2019, 173, 932–940. [Google Scholar] [CrossRef]
- Ma, D.-D.; Chen, Q.; Zhou, H.; Teng, Q.; Li, K.; Hu, D.-W. Experimental Study of Liquid CO2 Fracturing Mechanism of Glutenite. Rock Soil Mech. 2020, 41, 3996–4004. [Google Scholar] [CrossRef]
- Li, N.; Zhang, S.; Zou, Y.; Ma, X.; Zhang, Z.; Li, S.; Chen, M.; Sun, Y. Acoustic Emission Response of Laboratory Hydraulic Fracturing in Layered Shale. Rock Mech. Rock Eng. 2018, 51, 3395–3406. [Google Scholar] [CrossRef]
- Majer, E.L.; Doe, T.W. Studying Hydrofractures by High Frequency Seismic Monitoring. Int. J. Rock Mech. Min. Sci. Geomech. Abstr. 1986, 23, 185–199. [Google Scholar] [CrossRef]
- Ishida, T.; Chen, Y.; Bennour, Z.; Yamashita, H.; Inui, S.; Nagaya, Y.; Naoi, M.; Chen, Q.; Nakayama, Y.; Nagano, Y. Features of CO2 Fracturing Deduced from Acoustic Emission and Microscopy in Laboratory Experiments. J. Geophys. Res. Solid Earth 2016, 121, 8080–8098. [Google Scholar] [CrossRef]
- Turhan, F.; Cambaz, M.D.; Zahradník, J. The Significance of Crustal Velocity Model in Moment Tensor Solutions: A Case Study of Yedisu Earthquakes. In Moment Tensor Solutions: A Useful Tool for Seismotectonics; D’Amico, S., Ed.; Springer International Publishing: Cham, Switzerland, 2018; pp. 557–572. [Google Scholar] [CrossRef]
- Grosse, C.; Ohtsu, M. (Eds.) Acoustic Emission Testing; Springer Berlin Heidelberg: Berlin/Heidelberg, Germany, 2008. [Google Scholar] [CrossRef]
- Ohtsu, M. Moment Tensor Analysis. In Acoustic Emission Testing: Basics for Research—Applications in Engineering; Grosse, C.U., Ohtsu, M., Aggelis, D.G., Shiotani, T., Eds.; Springer International Publishing: Cham, Switzerland, 2022; pp. 197–219. [Google Scholar] [CrossRef]
- Shiotani, T.; Ohtsu, M.; Ikeda, K. Detection and evaluation of AE waves due to rock deformation. Constr Build Mater. 2001, 15, 235–246. [Google Scholar] [CrossRef]
- Shiraiwa, T.; Tamura, K.; Enoki, M. Analysis of kinking and twinning behavior in extruded Mg–Y–Zn alloys by acoustic emission method with supervised machine learning technique. Mater. Sci. Eng. A 2019, 768, 138473. [Google Scholar] [CrossRef]
- Ji, H.W.; Lee, H.; Hwang, I. Supervised learning-based classification of acoustic emission and vibration signal for identifying condition change of district heating system. Measurement 2023, 220, 113388. [Google Scholar] [CrossRef]
- Goodfellow, I.; Bengio, Y.; Courville, A. Deep Learning; The MIT Press: Cambridge, MA, USA, 2016. [Google Scholar]
- Bengio, Y.; Courville, A.; Vincent, P. Representation Learning: A Review and New Perspectives. IEEE Trans. Pattern Anal. Mach. Intell. 2013, 35, 1798–1828. [Google Scholar] [CrossRef]
- He, K.; Chen, X.; Xie, S.; Li, Y.; Dollár, P.; Girshick, R. Masked Autoencoders Are Scalable Vision Learners. In Proceedings of the IEEE/CVF Conference on Computer Vision and Pattern Recognition (CVPR), New Orleans, LA, USA, 21–24 June 2022; pp. 15979–15988. [Google Scholar]
- Li, M.; Yin, G.; Xu, J.; Cao, J.; Song, Z. Permeability Evolution of Shale under Anisotropic True Triaxial Stress Conditions. Int. J. Coal Geol. 2016, 165, 142–148. [Google Scholar] [CrossRef]
- Sun, Z.; Qiuhua, R.; Guiyao, W. Study on Determination of Shear Fracture Toughness. J. Rock Mech. Eng. 2002, 21, 199–203. [Google Scholar]
- Rui, Y.; Chen, J.; Du, J.; Peng, X.; Zhou, Z.; Zhu, C. Optimizing Microseismic Sensor Networks in Underground Space Using Cramér-Rao Lower Bound and Improved Genetic Encoding. Undergr. Space 2025, 23, 307–326. [Google Scholar] [CrossRef]
- Rui, Y.; Chen, J.; Pu, Y.; Du, X. An Innovative Analytical Solution of AE/MS Source Location with Singular Value Decomposition and Weight Estimation. Measurement 2025, 253, 117652. [Google Scholar] [CrossRef]
- Chen, J.; Gui, Z.; Rui, Y.; Zhao, X.; Pan, X.; Wang, Q.; Pu, Y.; Li, Z.; Liu, M. A Dual Attention-Based Deep Learning Model for Lithology Identification While Drilling. J. Rock Mech. Geotech. Eng. 2025, in press. [Google Scholar] [CrossRef]
- Ito, T.; Hayashi, K. Physical Background to the Breakdown Pressure in Hydraulic Fracturing Tectonic Stress Measurements. Int. J. Rock Mech. Min. Sci. 1991, 28, 285–293. [Google Scholar] [CrossRef]
Disclaimer/Publisher’s Note: The statements, opinions and data contained in all publications are solely those of the individual author(s) and contributor(s) and not of MDPI and/or the editor(s). MDPI and/or the editor(s) disclaim responsibility for any injury to people or property resulting from any ideas, methods, instructions or products referred to in the content. |
© 2025 by the authors. Licensee MDPI, Basel, Switzerland. This article is an open access article distributed under the terms and conditions of the Creative Commons Attribution (CC BY) license (https://creativecommons.org/licenses/by/4.0/).

