Article

Parametric and Correlation Study of Effusion Cooling Applied to Gas Turbine Blades

Research Institute of Aerospace Technology, Central South University, Changsha 410012, China
*
Author to whom correspondence should be addressed.
Appl. Sci. 2025, 15(17), 9778; https://doi.org/10.3390/app15179778
Submission received: 28 July 2025 / Revised: 23 August 2025 / Accepted: 4 September 2025 / Published: 5 September 2025

Abstract

To pursue higher thermal efficiency in aero gas turbines, the contradiction between extreme high-temperature conditions and material temperature resistance limits has made advanced thermal management technologies crucial. Effusion cooling is a technique that utilizes a large number of small holes (around 0.1 mm in diameter) to cool more effectively. Through numerical simulation, the current research investigates the impact of different parameters on the effectiveness of effusion cooling, including porosities (φ), blowing ratios (Br), height of the porous structure (H), thermal conductivity (λ) of the porous structures, and the ratios of the mainstream temperature to the coolant temperature (Rt). The results show that with the increased porosity, the cooling effectiveness of the porous structure surface first increases and then decreases, while the averaged cooling effectiveness downstream of the mainstream gradually increases. The first two parameters have the greatest influence on the cooling effectiveness. And there is a positive relationship between the blowing ratios and cooling effectiveness, meaning that higher blowing ratios lead to greater cooling effectiveness. A larger height and a smaller thermal conductivity coefficient cause a non-uniform temperature distribution. Different temperature ratios have little influence on coolant coverage pattern. Finally, a correlation is built to predict the cooling effectiveness considering all the parameters which provides fundamental references for the application of effusion cooling.

1. Introduction

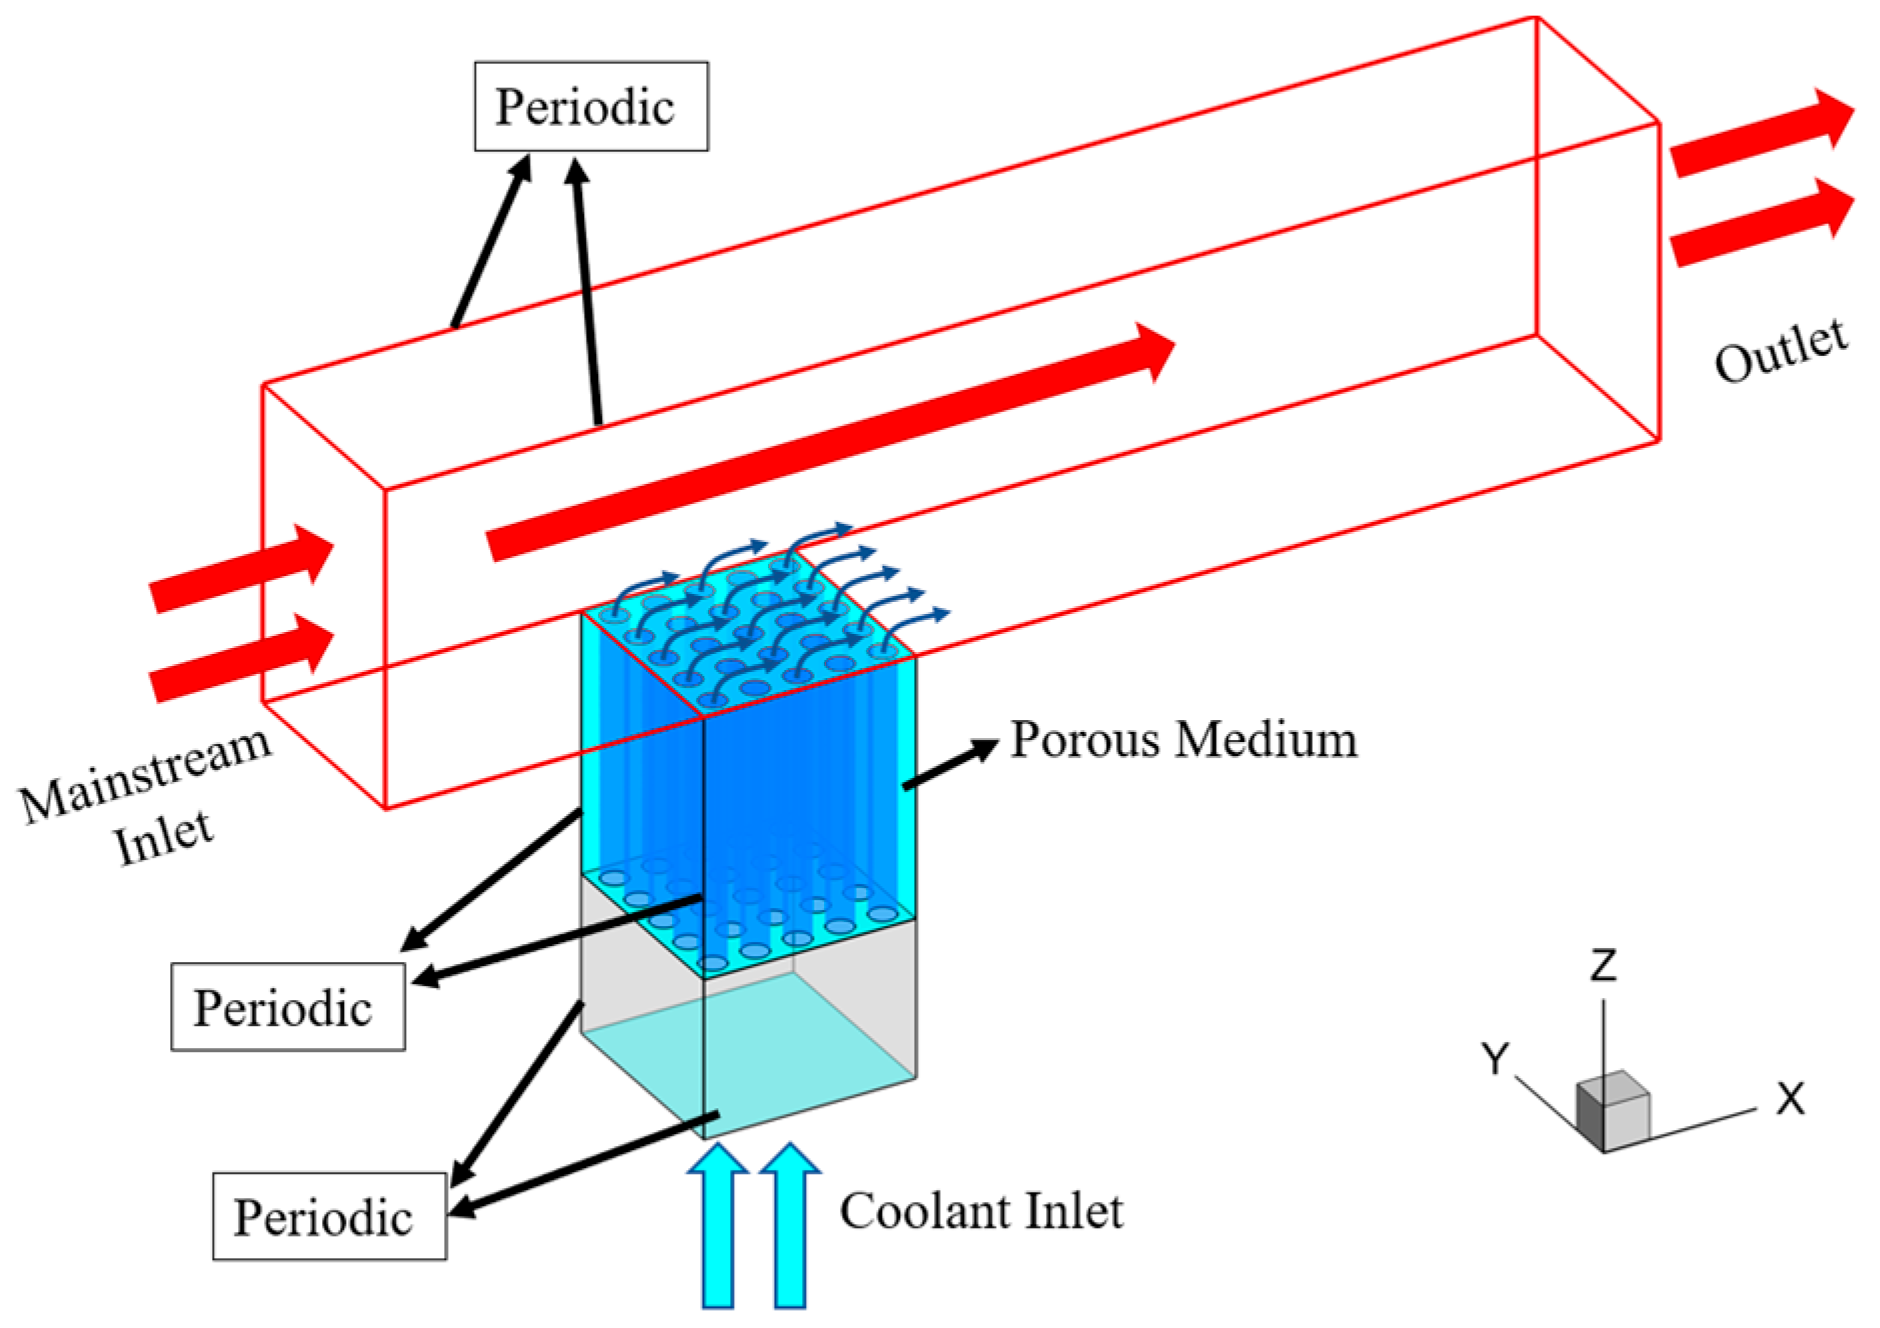
Increasing rotor inlet temperature (RIT) is an essential route to improving gas turbine efficiency [1]. However, the resulting thermal loads often approach or even exceed the allowable limits of blade materials [2,3]. Effective cooling strategies are therefore indispensable. Film cooling employs arrays of 1 mm diameter holes through which coolant is injected tangentially along the blade wall, forming a thin, adherent film that shields the metal surface from the hot mainstream and extends blade life. In contrast, effusion cooling utilizes a larger number of 0.1 mm diameter holes arranged more densely. Figure 1 illustrates this principle: the closely spaced micro-holes generate multiple interacting jets that adhere to the porous surface and establish a continuous protective layer. The enlarged coolant–solid interface enhances heat transfer and yields a more uniform temperature field across the surface [4].
As with film cooling, effusion-cooling performance is governed by numerous parameters, including blowing ratio [5,6,7,8,9,10], porosity [11,12,13,14], hole size [9,15,16,17], hole arrangement [9,15,18], and inclination angle [10,19,20]. Some scholars have performed a large number of investigations on this topic. Lin et al. [21] conducted combined experimental and numerical investigations of full-coverage inclined multi-hole film cooling. Their results indicate that hole arrangement and spacing are the dominant parameters controlling both the spatial distribution and the magnitude of local cooling effectiveness. Yang et al. [10] experimentally demonstrated that both hole arrangement and blowing ratio significantly affect cooling effectiveness and heat transfer. Specifically, increasing the blowing ratio enhances effectiveness but reduces the heat-transfer coefficient. Jun-Hee Kim and Kwang-Yong Kim [22] examined a novel convergent-inlet design for cylindrical film-cooling holes. By optimizing four geometric parameters—streamwise expansion angle, lateral expansion angle, injection angle, and the aspect ratio of the cylindrical section—they achieved a 46.5% improvement in effectiveness relative to conventional cylindrical holes.
Compared with film cooling, effusion cooling differs not only in hole diameter but also in the conjugate heat transfer that occurs within the porous structure [23,24,25,26,27,28]. Ji et al. [25] investigated conjugate heat transfer during effusion cooling of a swirl-stabilized combustor liner in a non-reacting three-nozzle gas turbine model. Their study showed that although main-flow impingement disrupts the cooling film, convection inside the cooling holes still removes substantial heat. Higher cooling-airflow rates improve performance despite the risk of film detachment. Arjun et al. [26] found that a conjugate heat-transfer model accounting for material thermal conduction provides more cooling protection than an adiabatic model and that the optimum cooling-hole angle is 30°. Chen et al. [28] numerically studied coupled heat transfer in impingement–effusion double-wall cooling under various cross-flow arrangements. Their results indicate that the integrated cooling performance of the conjugate system exceeds that of pure impingement cooling by 4.7% to 28.0% because it combines internal impingement with external film protection. Although effusion cooling is regarded as the most effective cooling method, its structural vulnerabilities remain a significant concern [29,30,31,32]. Huang et al. [33] experimentally and numerically examined transpiration cooling of an additively manufactured perforated plate with partition walls. They reported that partition walls have little effect on cooling effectiveness but significantly improve mechanical strength. Addressing the hole uniformity issue inherent in additively manufactured small holes, Huang and He [11] investigated the influence of hole heterogeneity on effusion cooling. They discovered that non-uniform porosity markedly alters both the surface coolant layer and the internal hole cooling performance.
Researchers have investigated combined cooling strategies that integrate effusion cooling with other techniques [24,34,35,36,37,38]. Oguntade [35] predicted the performance of individual effusion and impingement schemes and then compared them with their combined configuration, showing that the hybrid impingement–effusion approach yields synergistic heat-transfer enhancement unattainable by either method alone. Qu et al. [24] evaluated the cooling effectiveness of hybrid slot–effusion systems against isolated slot injection and effusion-only configurations, demonstrating that the combined design surpasses the limitations of each standalone technique. Cho and Rhee [36] experimentally measured heat and mass transfer on a perforated plate with impingement–effusion cooling. For plates with small cavity gaps, neighboring impingement jets interact negligibly, and the gap flow behaves like fully developed pipe flow, resulting in enhanced heat and mass transfer rates.
In the majority of current effusion-cooling studies, the influence of parameters on cooling efficiency has been studied, yet a numerical relationship between these parameters and cooling effectiveness is not established.
Through numerical simulation, this research investigates the effects of porosities (φ), blowing ratios (Br), porous structure heights (H), the thermal conductivity of the porous structure material (λ), and the ratio of the mainstream temperature to the coolant temperature (Rt) on the cooling effectiveness of effusion cooling. Based on the Levenberg–Marquardt algorithm and through successive fittings of individual variables, a correlation between these parameters and the averaged cooling effectiveness is derived.

2. Numerical Setup

2.1. Geometric Model

The geometric model of this study is shown in Figure 2, divided into fluid and solid domains. High-temperature gas flows into the system through the mainstream inlet, and the coolant gas enters through the coolant inlet and passes through the porous structure to mix with the mainstream. Periodic conditions are set on the lateral sides perpendicular to the Y-axis.
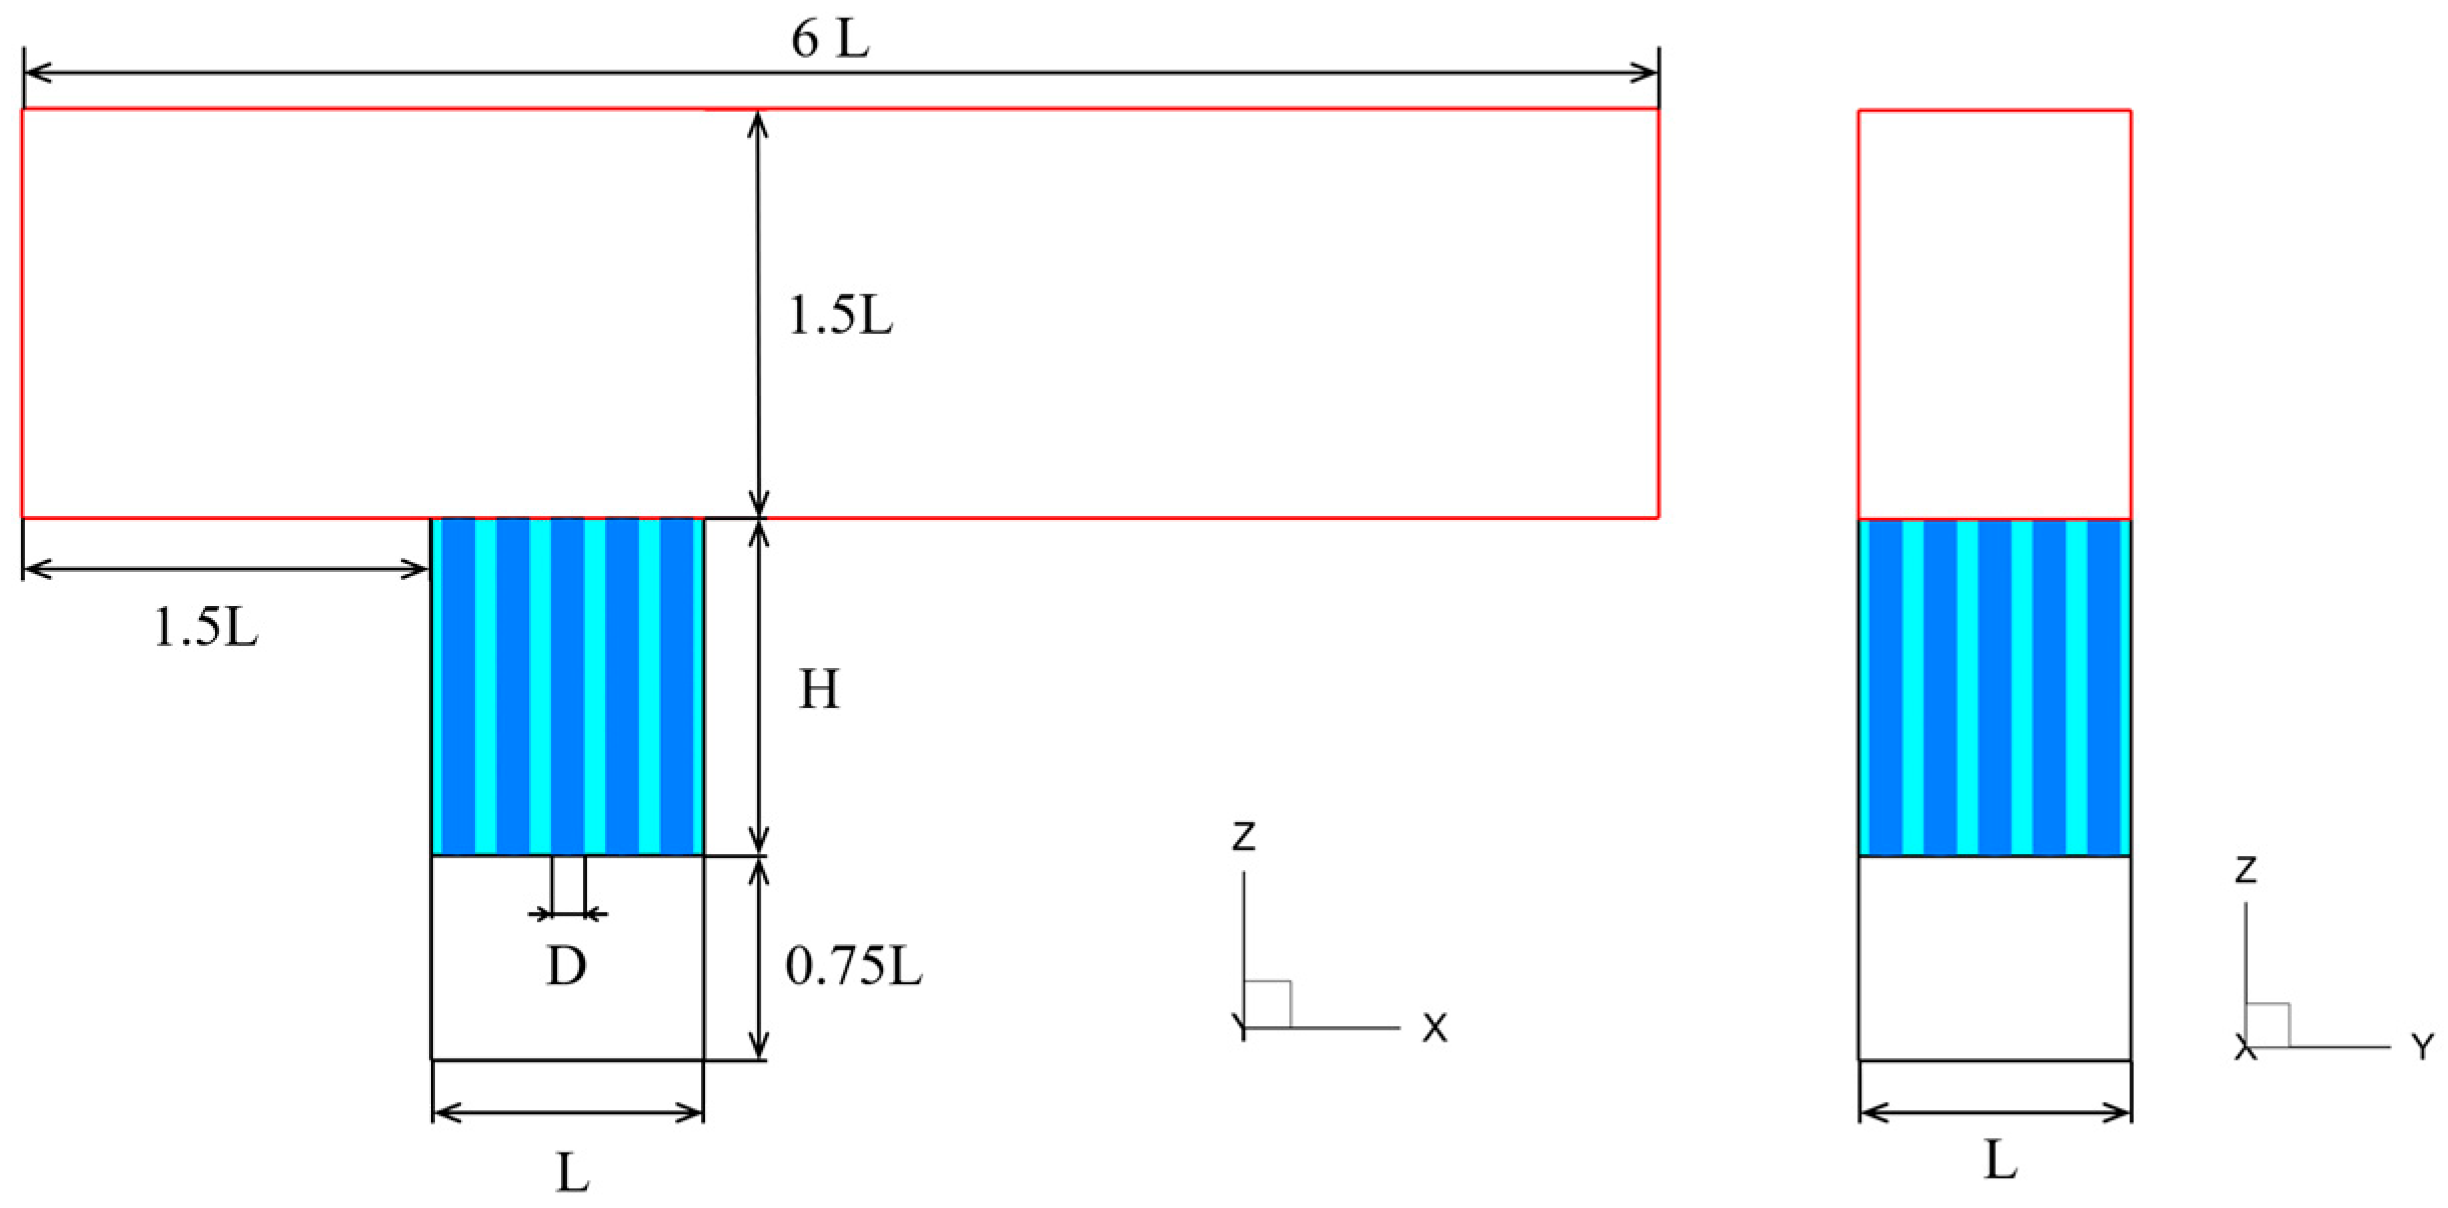
The model dimensions are shown in Figure 3. The coolant channel is rectangular and measures L × L × 0.75 L with L = 1 mm. The mainstream channel is also a rectangular channel, with dimensions of 6 L × L × 1.5 L. The height of the porous structure is H which ranges from 6D to 14D, with hole diameter D. Five heights and five diameters are investigated. In this study, the porosity (φ) is defined as the hole volume (Vh) divided by the solid material volume in the perforated region (Vs, L × L × H), as shown in Equation (1). Each diameter corresponds to a unique porosity.
φ = V h V s
To control the variables, a reference model with 30% porosity, a hole diameter of 0.12 mm, and a porous structure height of 10D is employed. This model is used in all cases to explore the effects of blowing ratios, the thermal conductivity of the porous structure, and the ratios of the mainstream temperature to the coolant temperature on the cooling effectiveness. Keeping porosity at 30%, heights of 6D, 8D, 10D, 12D, and 14D are selected to study the influence of height. Conversely, with height fixed at 10D, porosities of 10%, 20%, 30%, 40%, and 50% are adopted to investigate the influence of porosity.

2.2. Boundary Conditions

Boundary conditions can be referred to in Figure 2. The fluid and solid domains are thermally coupled. The mainstream and the coolant inlet are both set as mass flow inlets, while the outlet is set as a pressure outlet. The fluid is set as an ideal gas with the thermophysical properties of air. Given the mainstream inlet mass flow rate of 0.15 g/s, the blowing ratio (Br) is defined as Equation (2):
Br = ρ C V C ρ M V M
where ρC and VC correspond to the coolant inlet density and velocity, and ρM and VM correspond to the mainstream density and velocity. The coolant was held at a constant 300 K, and the effects of different ratios of temperature (Rt) varying from 1.3 to 5 on cooling effectiveness were explored by setting the mainstream temperatures at 400 K, 600 K, 900 K, 1200 K, and 1500 K.
Based on Equation (2) and to investigate the effect of different blowing ratios on the cooling effectiveness, five blowing ratios of 1%, 2%, 3%, 4%, and 5% were selected. The corresponding coolant mass flow rates at the inlet are 0.001, 0.002, 0.003, 0.004, and 0.005 g/s. The porous structure materials are set to titanium (Ti), steel, nickel (Ni), aluminum (Al), and copper (Cu), with corresponding thermal conductivities (λ) of 7.44 W/(m·K), 16.27 W/(m·K), 91.74 W/(m·K), 202.4 W/(m·K), and 387.6 W/(m·K) respectively, to investigate the effect of different material thermal conductivities on cooling effectiveness. The dimensionless parameter η represents cooling effectiveness, defined as Equation (3):
η = T M T W T M T C
In this study, the dimensionless number θ is used to characterize the temperature distribution of the outer wall of the porous media; θ is defined as Equation (4):
θ = T W T C T M T C
where TM is the temperature of the mainstream inlet, TC is the temperature of the coolant inlet, and TW is the surface temperature of the outer wall of the porous media.
And the averaged cooling effectiveness is defined as Equation (5):
η ˙ = 1 A A η ( x , y ) d x d y
All cases and related parameters set in the current research are shown in Table 1.

2.3. Numerical Method

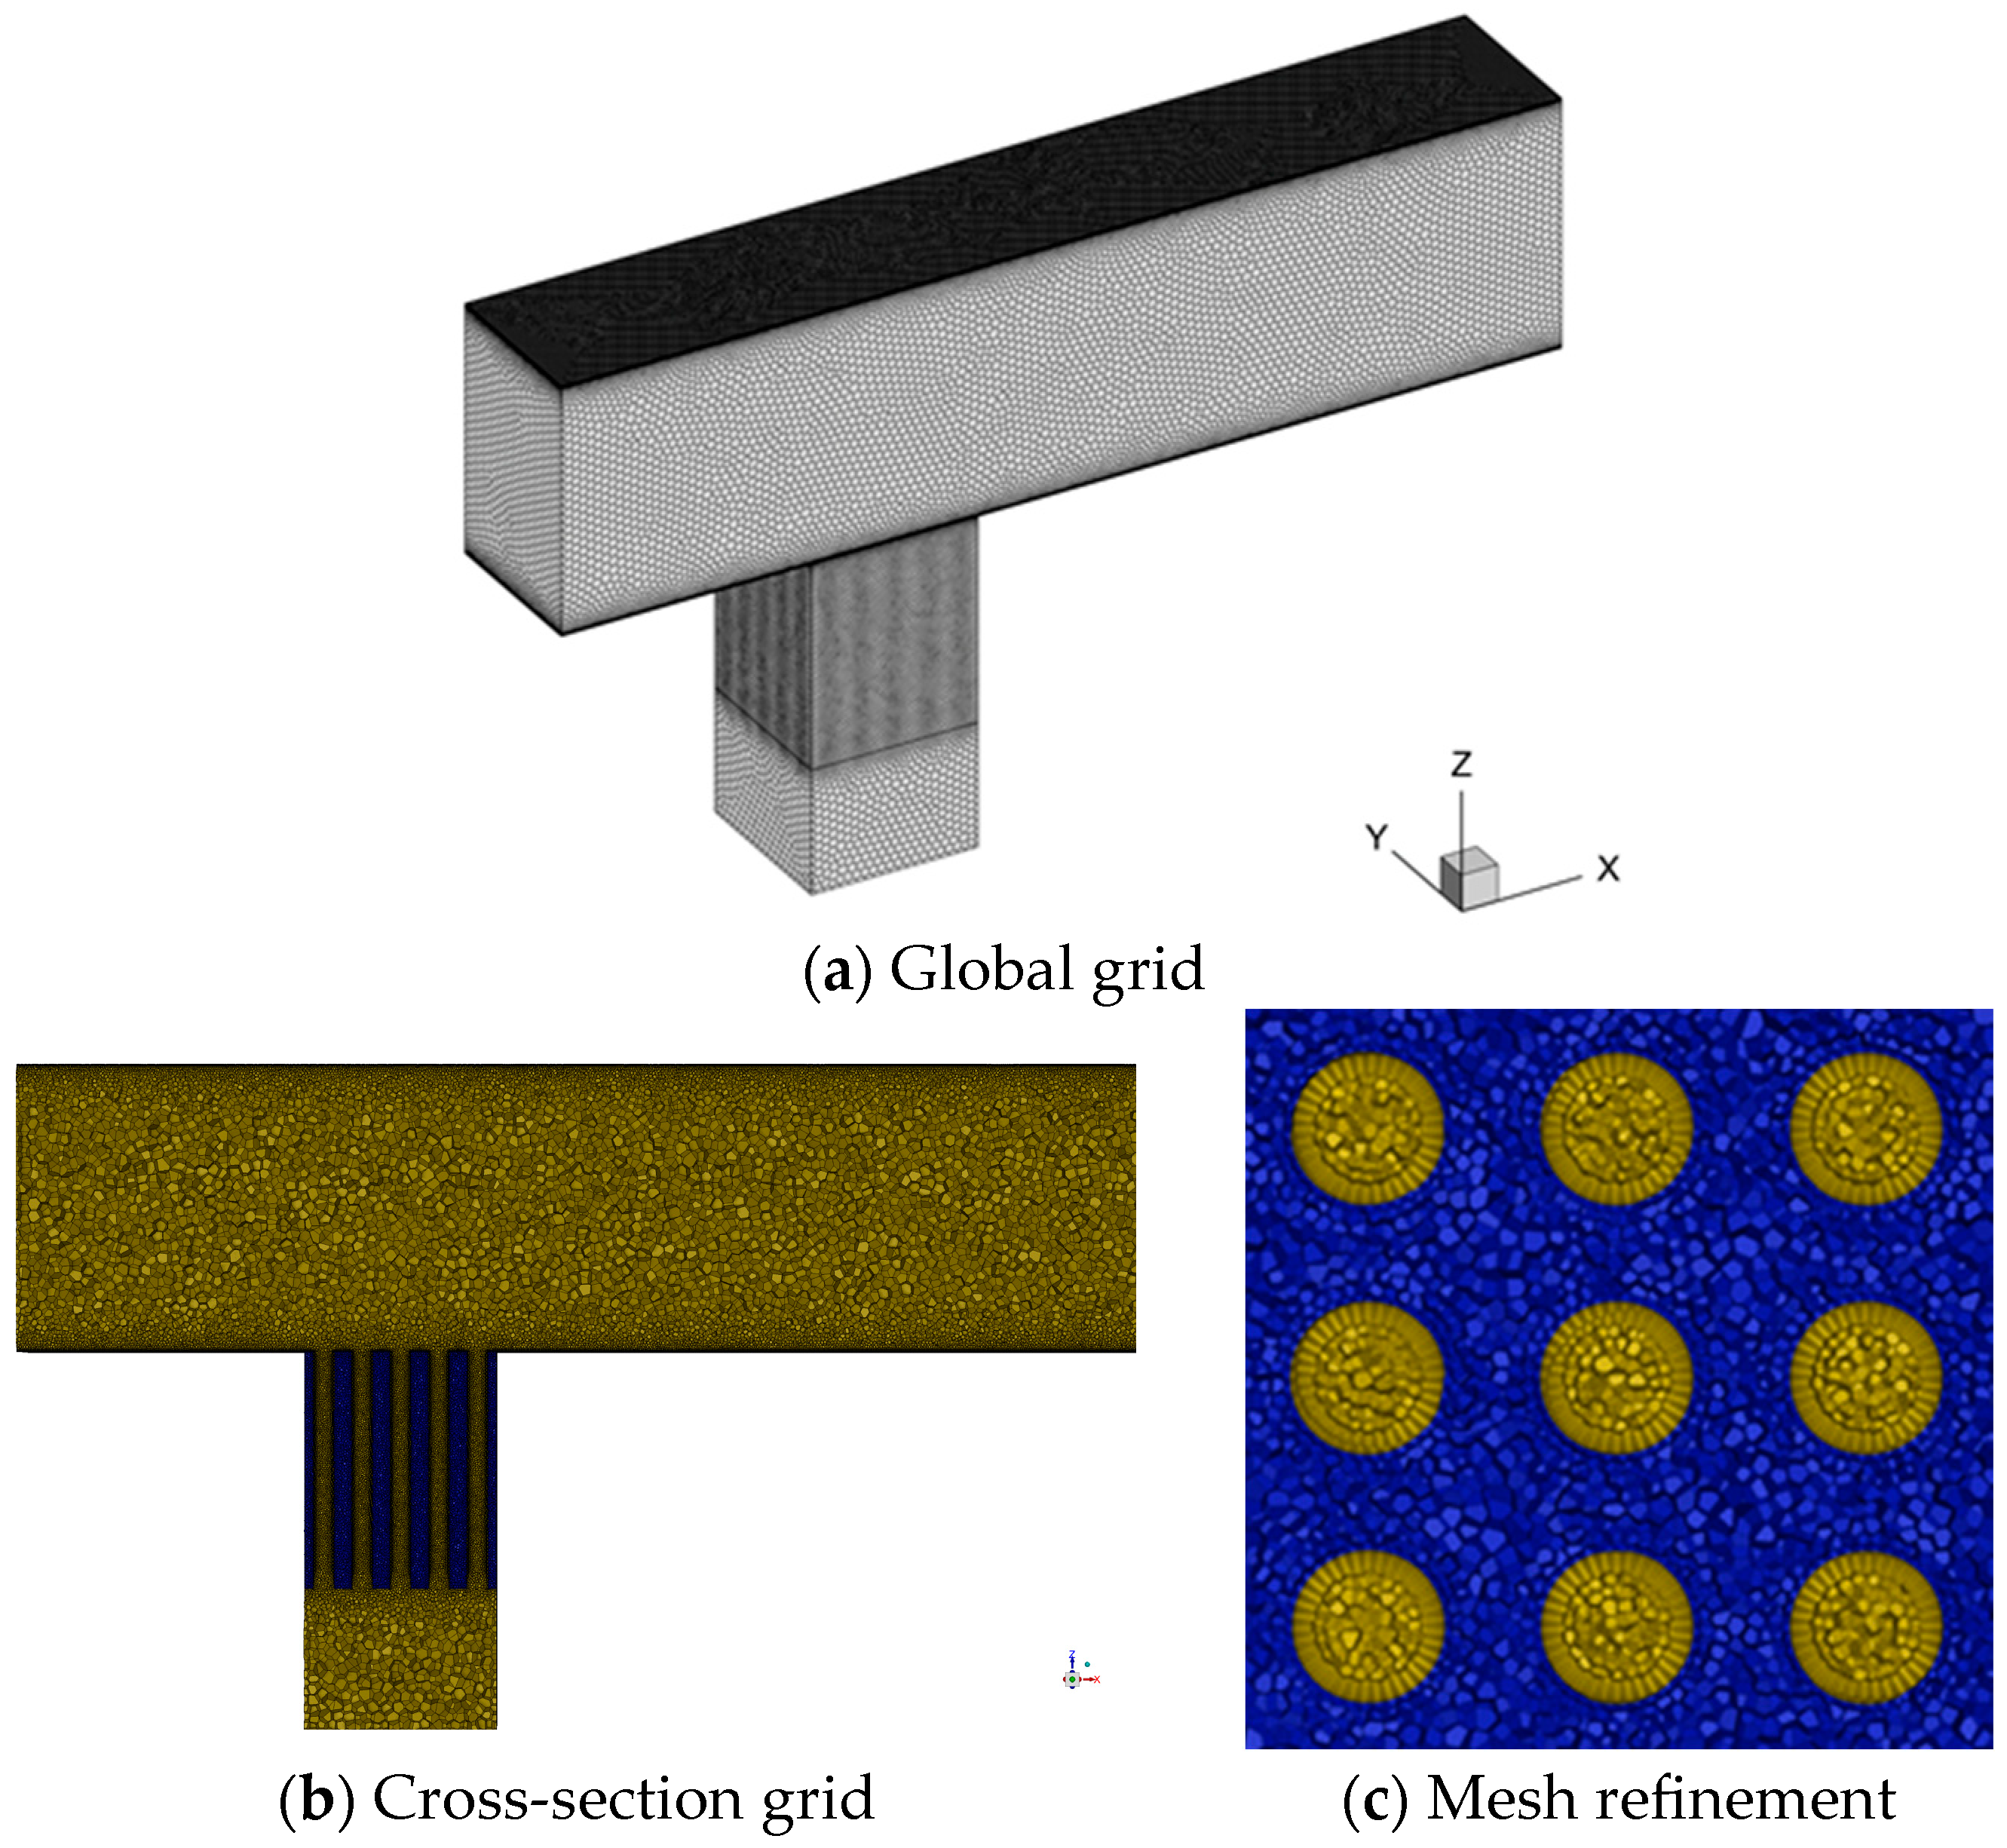
This study employs Fluent Meshing to generate the computational grid illustrated in Figure 4. In the main region, the generated mesh is composed of unstructured polyhedrons, and the boundary layer mesh is a regular prism mesh. All cases presented in Table 1 follow the same methodology. To guarantee calculation accuracy, the mesh at the fluid–solid interface was refined and shared topology was employed to enforce node matching. The simulations were performed with Ansys Fluent 2022 R1.
Three-dimensional (3D) steady-state RANS simulations were conducted in this work. Based on the study reported in [12], the Shear Stress Transport (SST) k-ω turbulence model was employed and pressure–velocity coupling was handled by the SIMPLEC algorithm. The governing equations for density, momentum, turbulence parameters (k and ω), and energy were discretized with a second-order upwind scheme. Convergence was achieved when residuals fell below 10−6 for continuity/momentum/energy and 10−5 for turbulence quantities.

2.4. Turbulence Model Verification

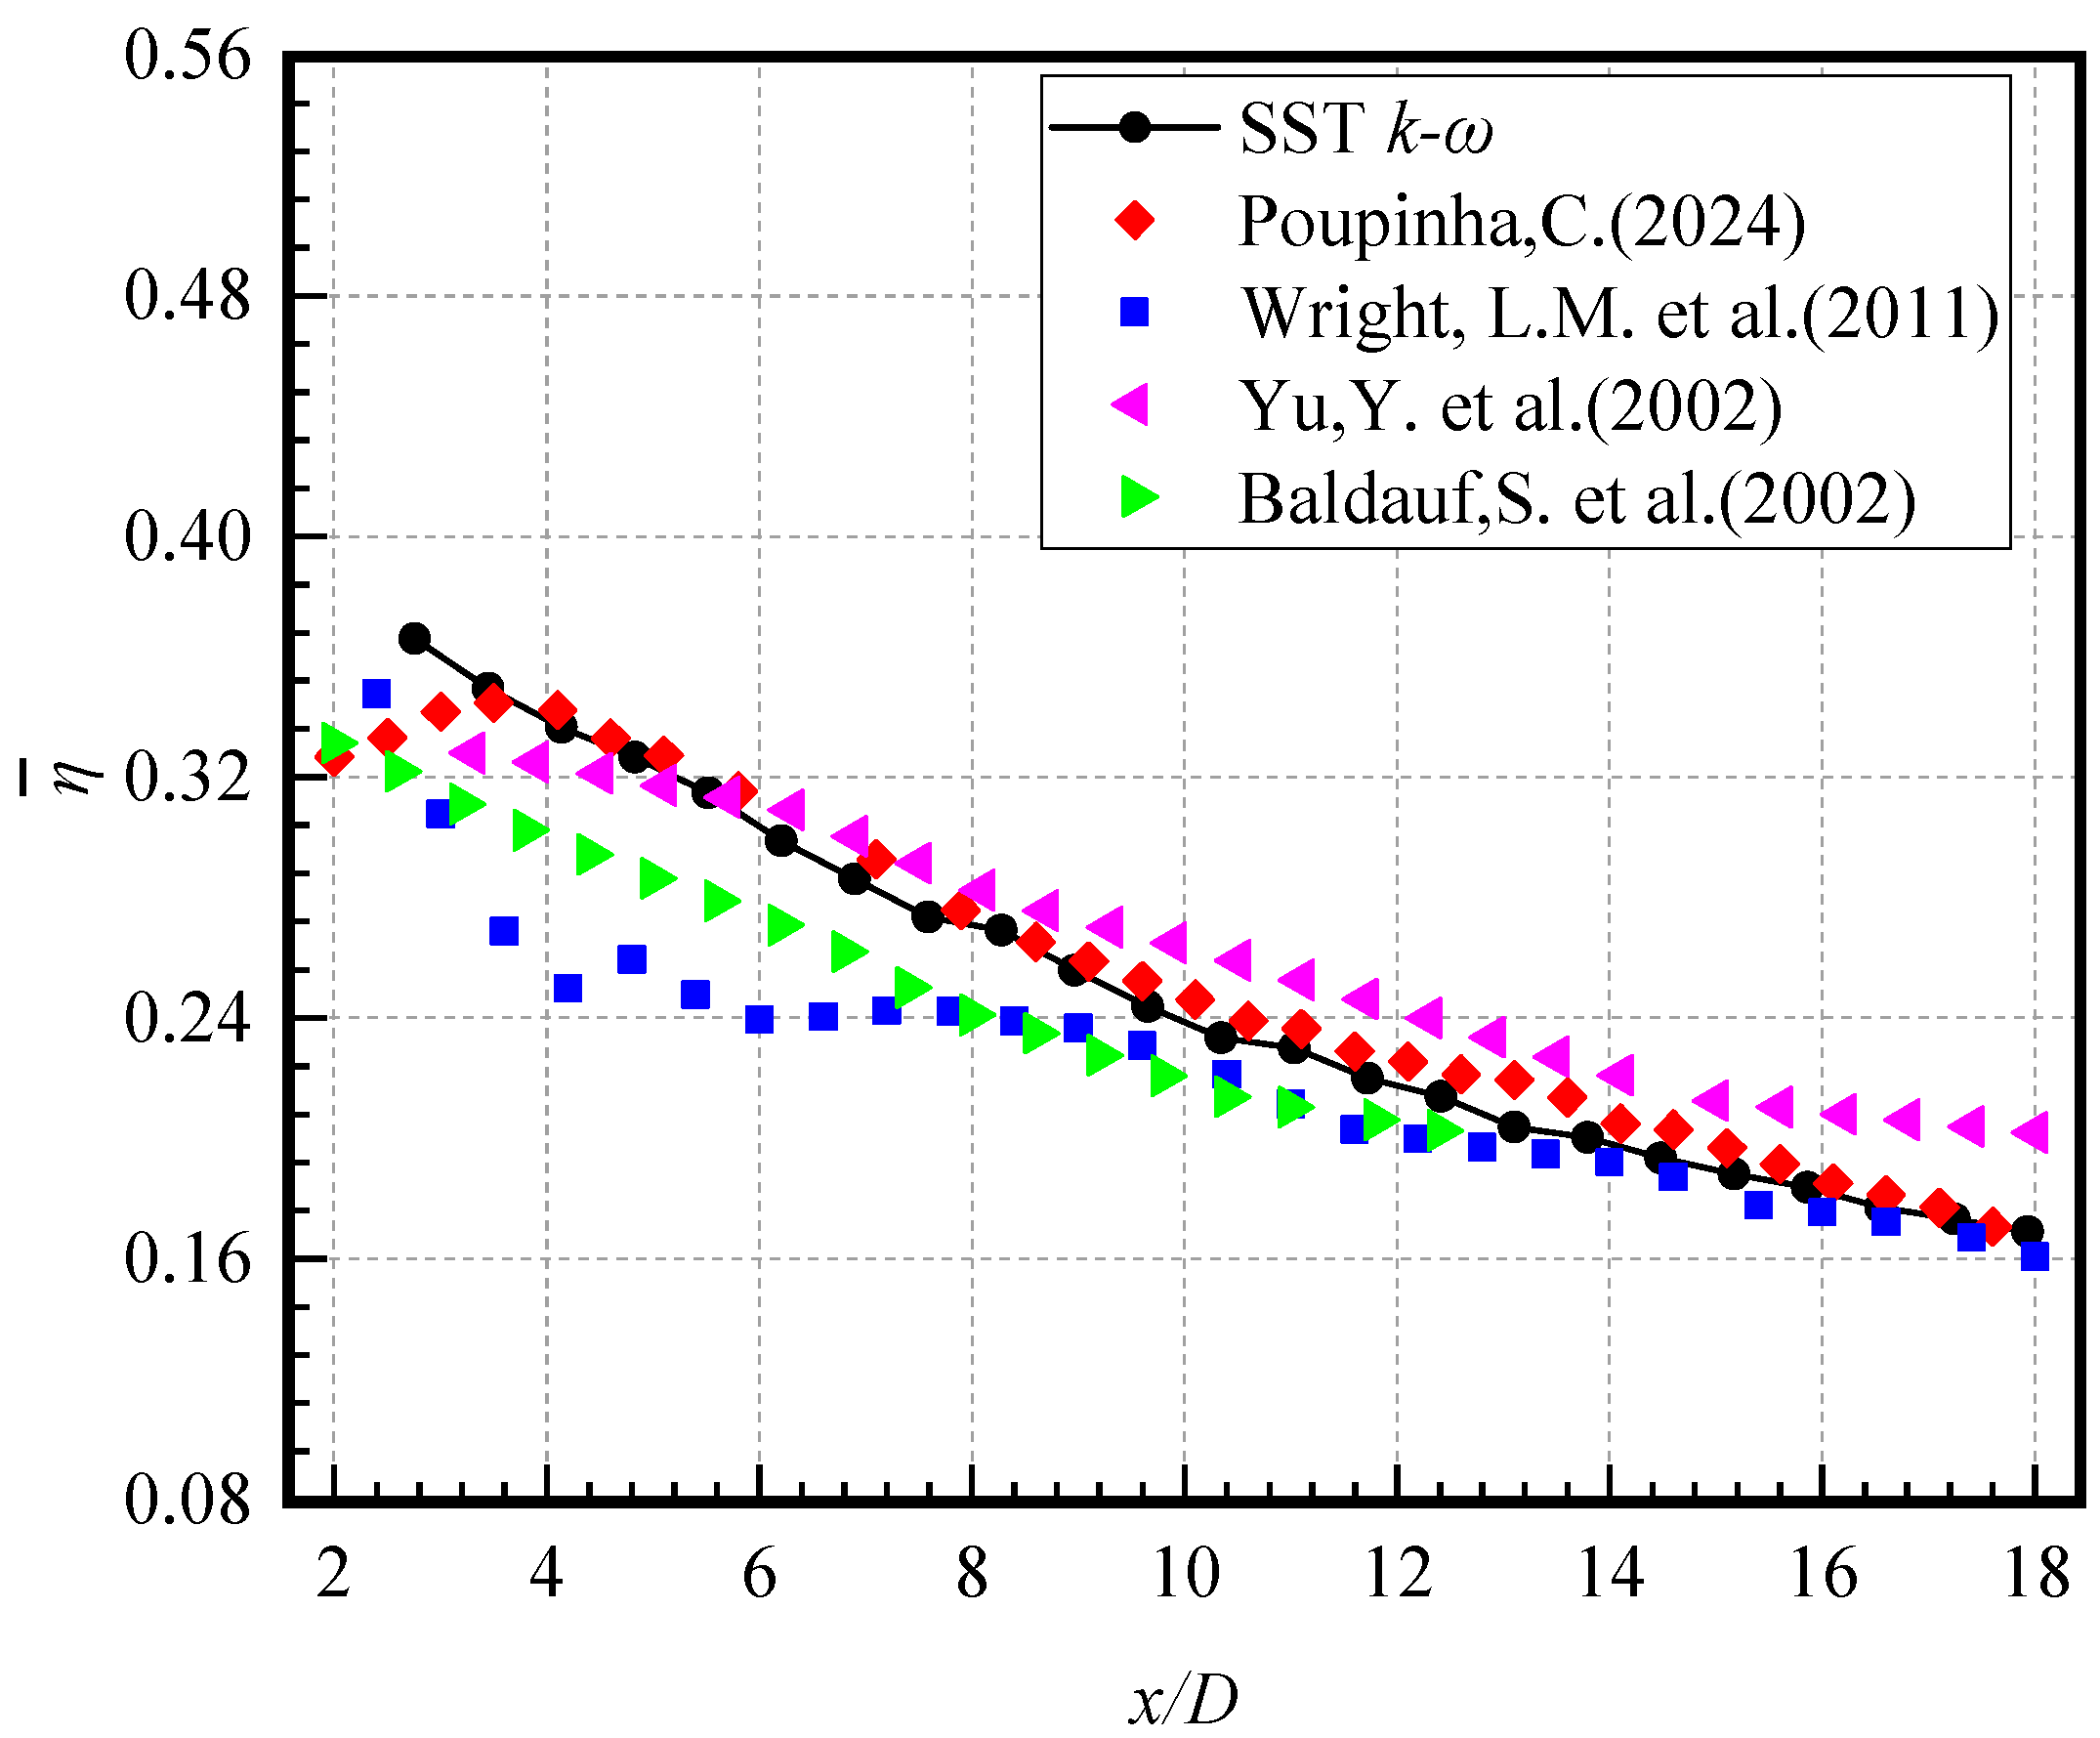
Because film cooling and effusion cooling have certain similarities, this study employs the SST k-ω model, which has been validated against the film-cooling experiments reported in [39,40,41,42]. The cooling effectiveness of the cylindrical film cooling at Br = 0.5 was compared. Figure 5 reflects the simulation and experiment results of the lateral averaged cooling effectiveness ( η ¯ ), which is defined as Equation (6):
η ¯ = 1 L 0 L η ( x , y ) d y
As shown in Figure 5, the results calculated using the SST k-ω model exhibit a trend consistent with other experimental results, with the η ¯ gradually decreasing along the mainstream direction. Furthermore, the error between the simulation results obtained from the SST k-ω model and experimental results is less than 10%. Therefore, the SST k-ω model is appropriate for subsequent simulations in this study.

2.5. Grid Independence Verification

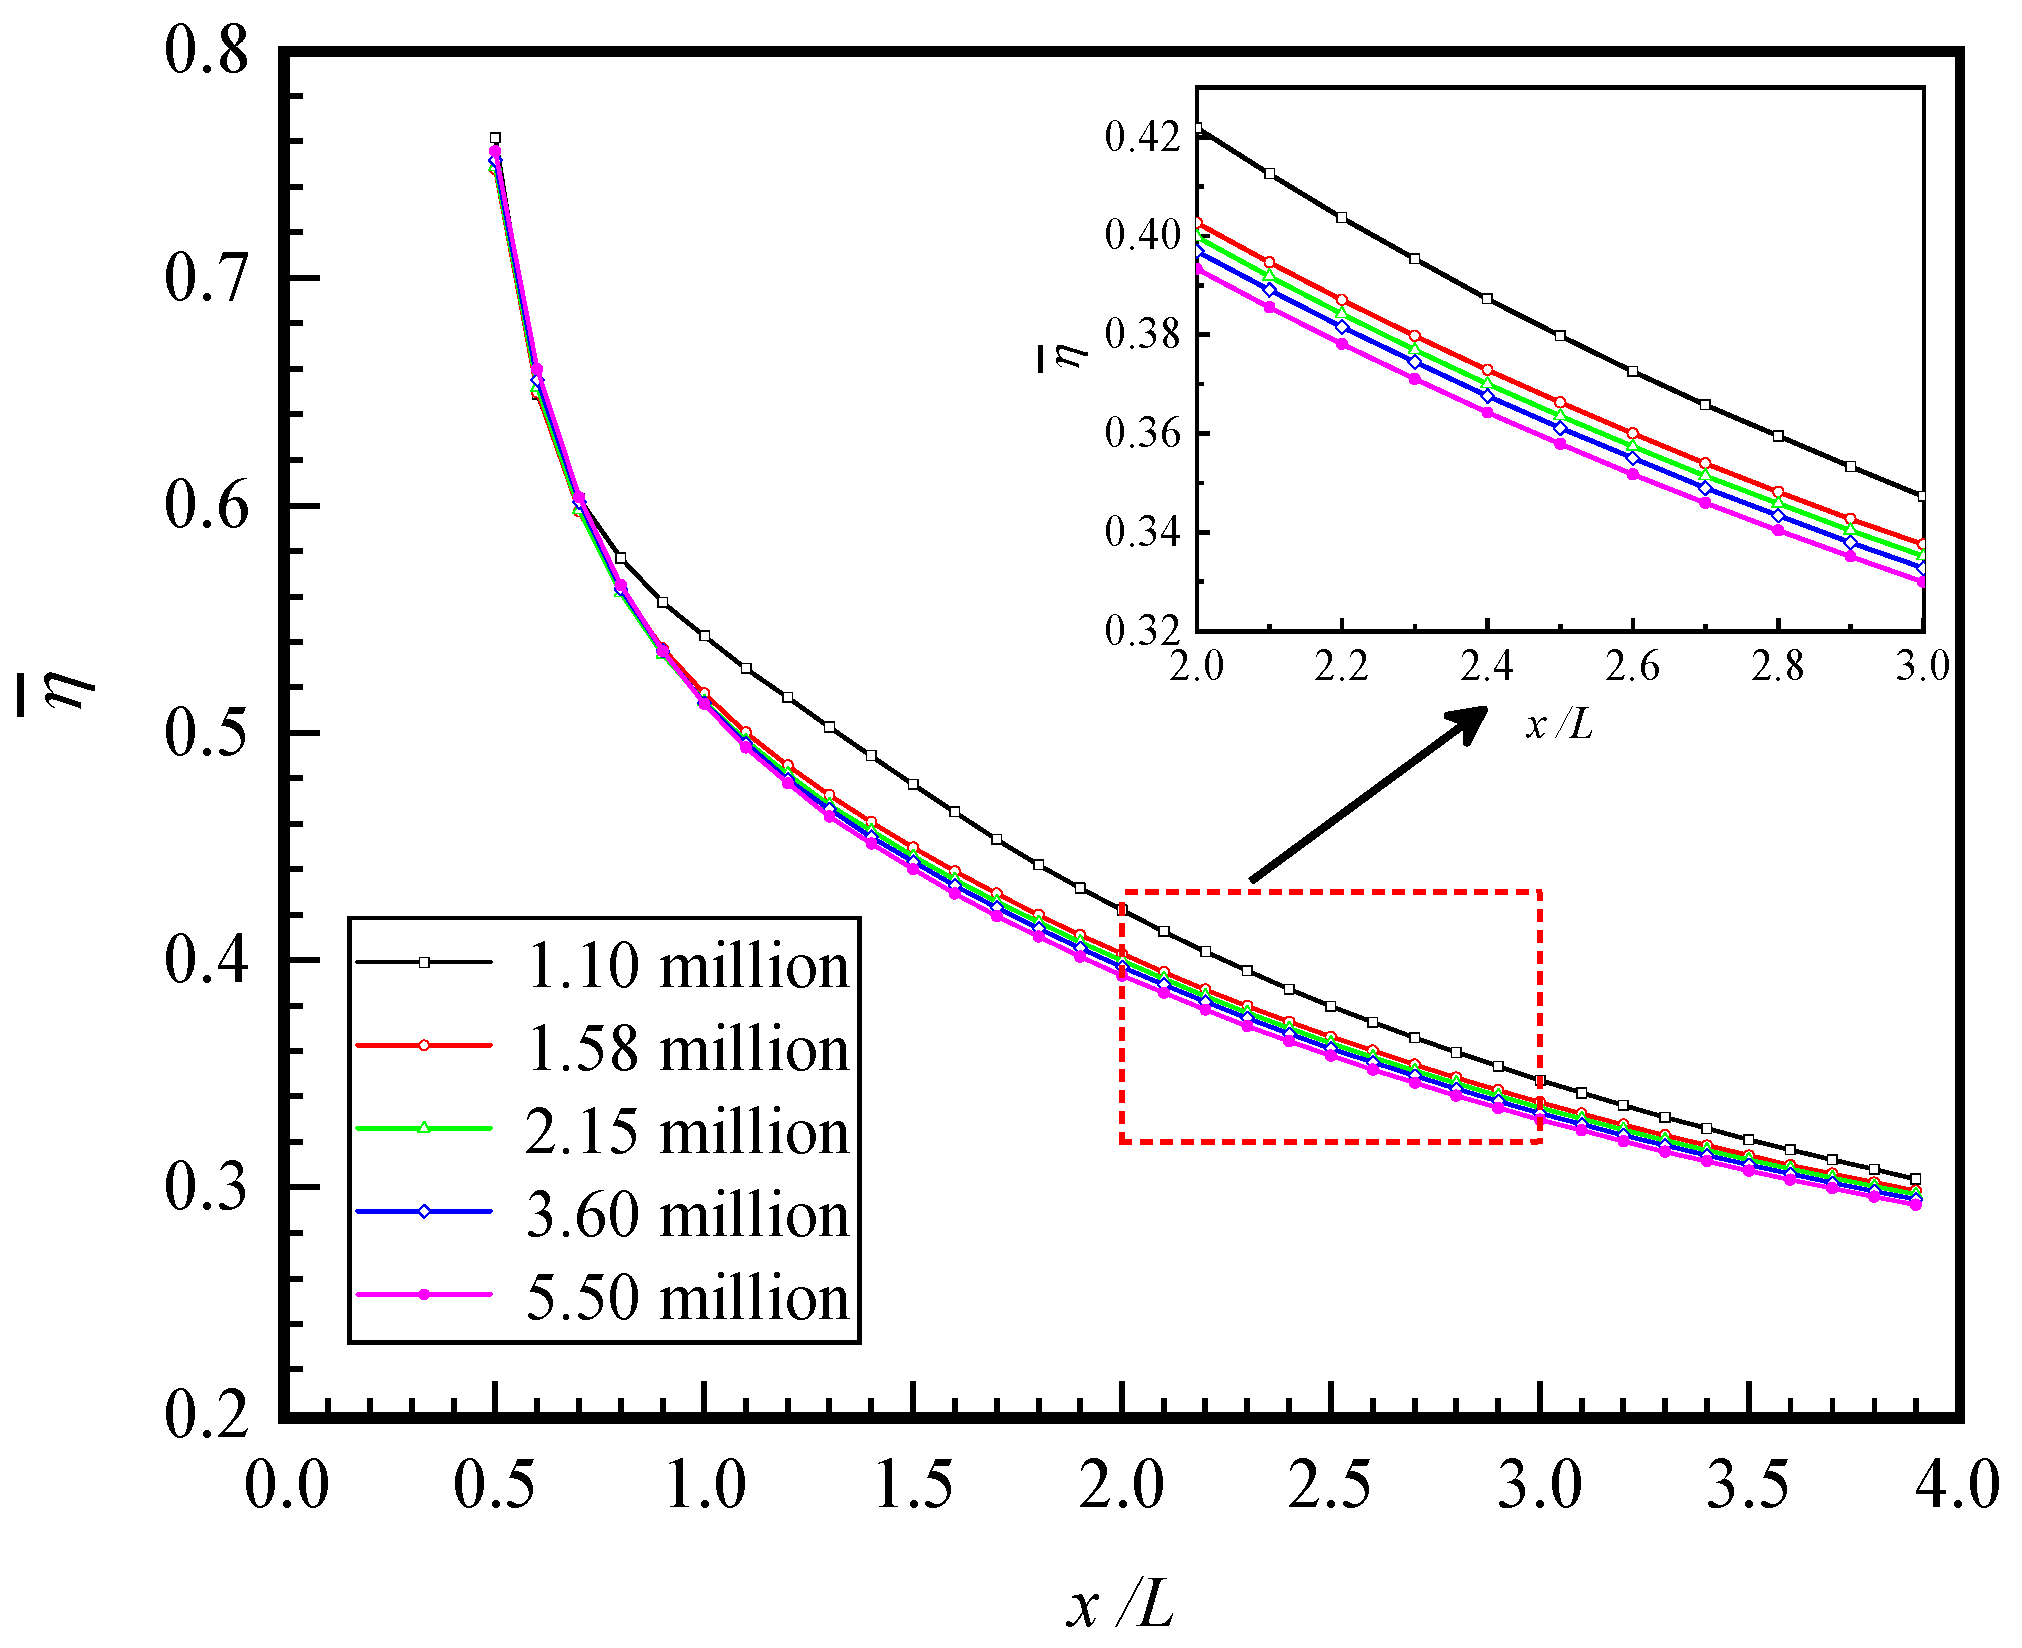
The grid independence verification was conducted with five different meshes: 1.10 million, 1.58 million, 2.15 million, 3.60 million, and 5.50 million elements. Simulations were performed under the boundary conditions of Case A3. The η ¯ downstream of the porous structure on the bottom surface of the mainstream channel is shown in Figure 6. The maximum difference in η ¯ for the 1.10 million grids and 1.58 million grids exceeds 6%. However, the difference in η ¯ for the 1.58 million grids and 2.15 million grids is less than 1%. And with further grid refinement, the difference in η ¯ between the 3.60 million grids and either the 2.15 grids or the 5.50 million grids remains below 1%. These results indicate that a grid comprising 3.60 million elements is sufficient for mesh-independent solutions and is therefore adopted for all subsequent simulations.

3. Results and Discussion

3.1. Effect of Different Porosities

Figure 7a presents the contours of η on the porous structures and the downstream regions for effusion cooling with different porosities, and Figure 7b illustrates the η ¯ downstream of the mainstream at different porosities. The porosities range from 10% to 50% corresponding to Cases A1 to A5 respectively. As shown in Figure 7a, the η of the porous structure exceeds that in the downstream region because the coolant, issuing directly from the porous channel, fully cools the structure. The η is higher in the upper downstream area than in the lower part, and a peak-shaped high-η region appears where the coolant is deflected by the mainstream. It can be observed that as the porosity increases from 10% (Case A1) to 30% (Case A3), the η ˙ of the porous structure surface gradually increases. However, when the porosity increases from 30% (Case A3) to 50% (Case A5), the η ˙ of the porous structure surface shows a decline. This indicates that the benefit of increasing porosity reaches saturation and structural integrity weakens. Figure 7b clearly shows the impact of porosity changes on η. As the porosity continuously increases, the η ¯ downstream of the mainstream also increases. This is because the continuous increase in porosity enlarges the coolant distribution range, resulting in stronger convective cooling effects. However, when the porosity increases from 30% (Case A3) to 50% (Case A5), the increase is relatively slight, indicating that the impact of porosity on η is approaching saturation, and further increasing the porosity cannot bring about significant improvements.
Figure 8 displays the velocity distribution in the middle cross-section at different porosities. In the downstream part of the mainstream, the near-wall layer exhibits significantly lower velocities compared to the mainstream, with a distinct low-velocity zone observed near the coolant channel exit. This results from the orthogonal momentum exchange between coolant injection and the mainstream. Simultaneously, this interaction impedes the downward heat transfer from the mainstream, forming an effective coolant coverage layer along the surface, and along the mainstream direction, a reduction in coolant coverage thickness is observed. As the porosity gradually increases, the velocity within the coolant channels decreases and the coolant coverage layer becomes slightly thinner, which is due to the fact that under a certain coolant mass flow rate, the increase in total flow area results in a reduction in velocity. The velocity of the coolant channels near the mainstream is lower because the high-speed airflow of the mainstream exerts a greater pressure, suppressing the outflow of the coolant. Additionally, with the increase in the porosity, the coolant coverage thickness decreases slightly, which is also caused by the reduction in the velocity of the coolant.
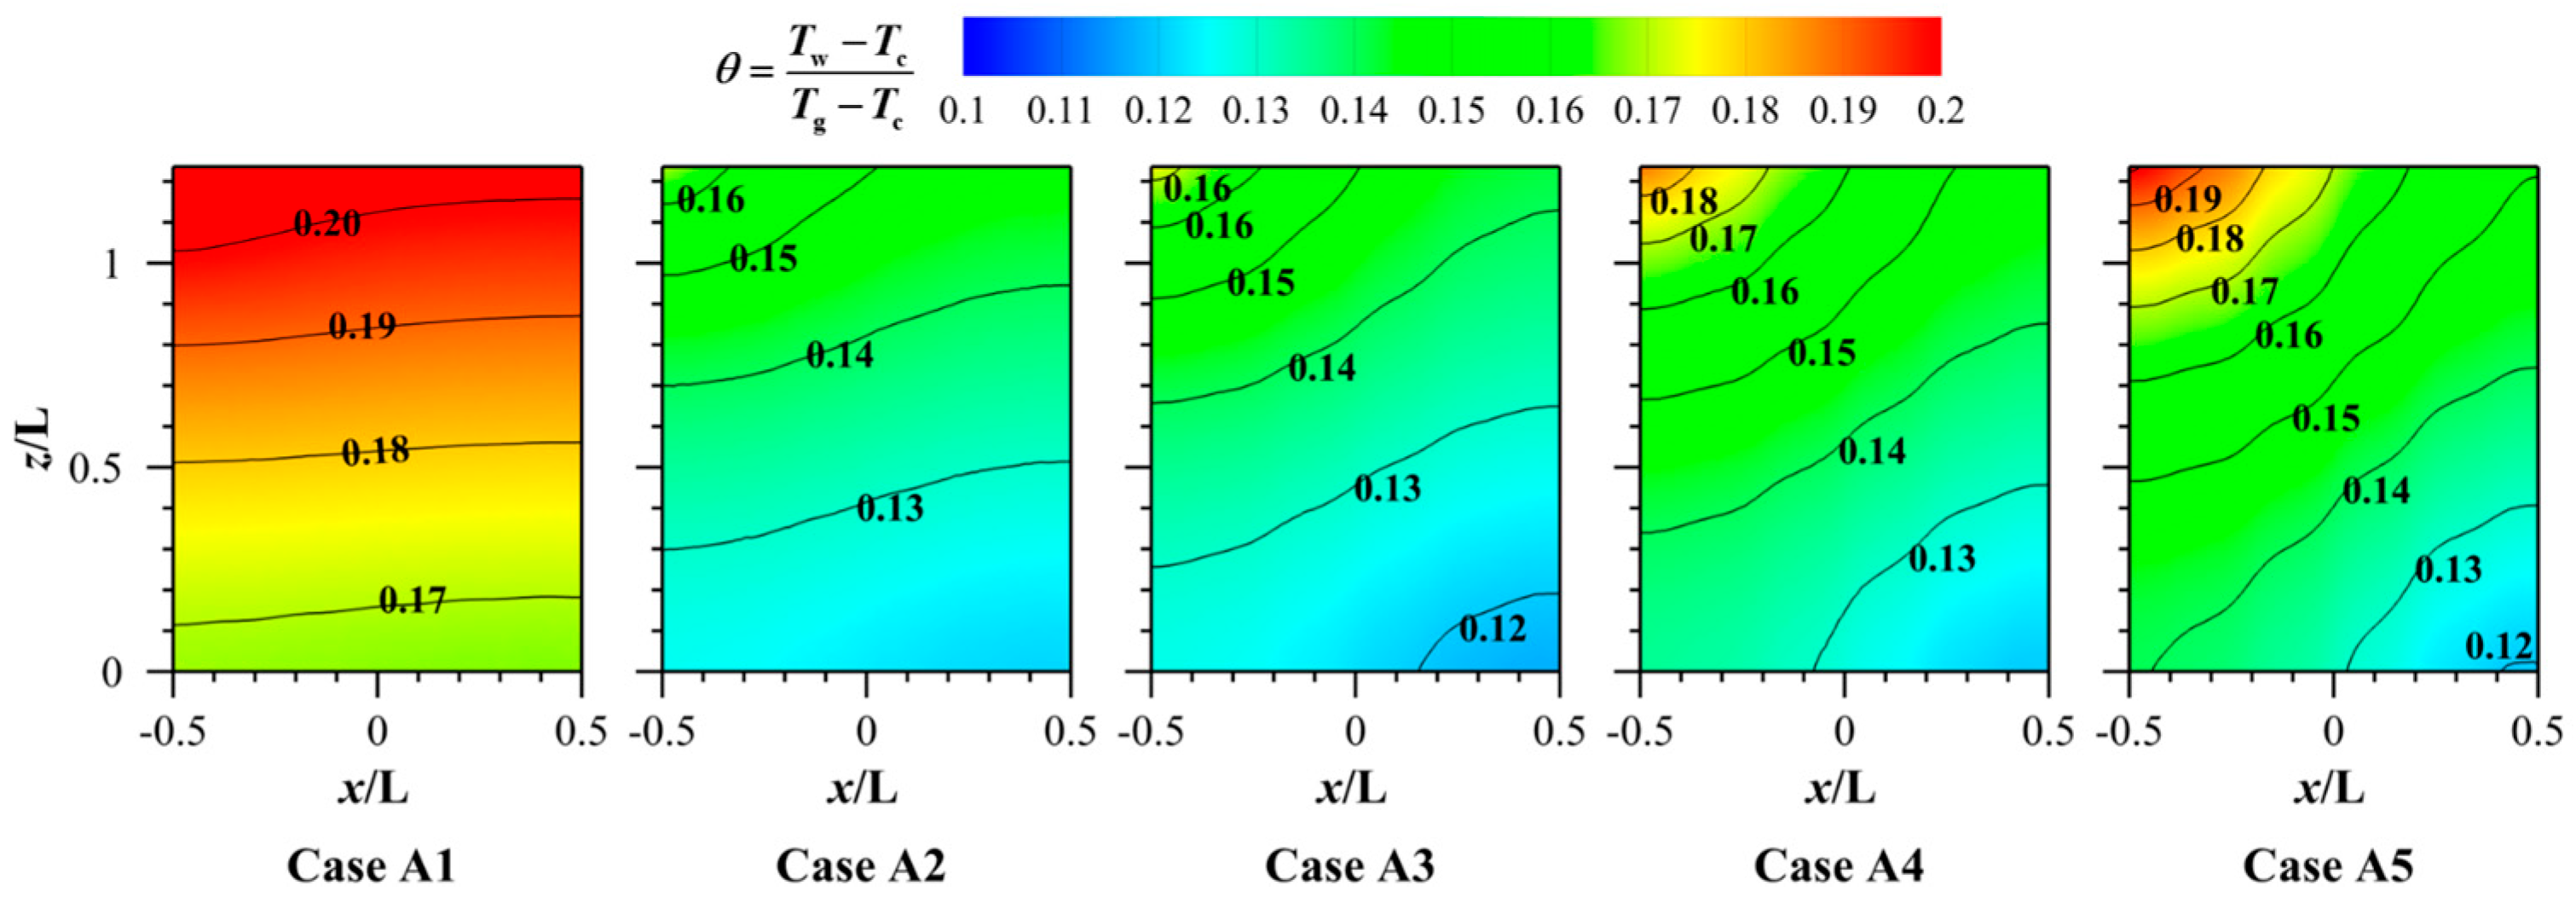
Figure 9 presents the θ distribution on the periodic interface of the porous structure at different porosities. Due to the structure symmetry and steady-state conditions, the temperature distribution at each interface of the porous structure is consistent. There is a significant temperature gradient in the solid porous structure. In Case A1, the lower porosity and smaller contact area limit heat transfer yet produce a relatively uniform temperature. With higher porosity (Case A3–Case A5), the temperature at the bottom near the downstream end is lower, but thermal hotspots persist near the leading edge of the mainstream, resulting in an uneven temperature distribution and a large gradient. This is because the coolant velocities in the channels remain low, and the mainstream pressure forms a certain blockage effect, weakening its heat dissipation performance, thus leading to local high temperatures. As porosity increases, the overall η ˙ of the porous surface improves, yet the reduced velocity in the coolant channels eventually lowers thermal performance. The local high-temperature zone shifts to the outer surface near the upper end of the mainstream and the temperature gradient grows. Nonetheless, the greater porosity allows the injected coolant to cover a wider region, thereby improving downstream η along the mainstream.

3.2. Effect of Different Blowing Ratios

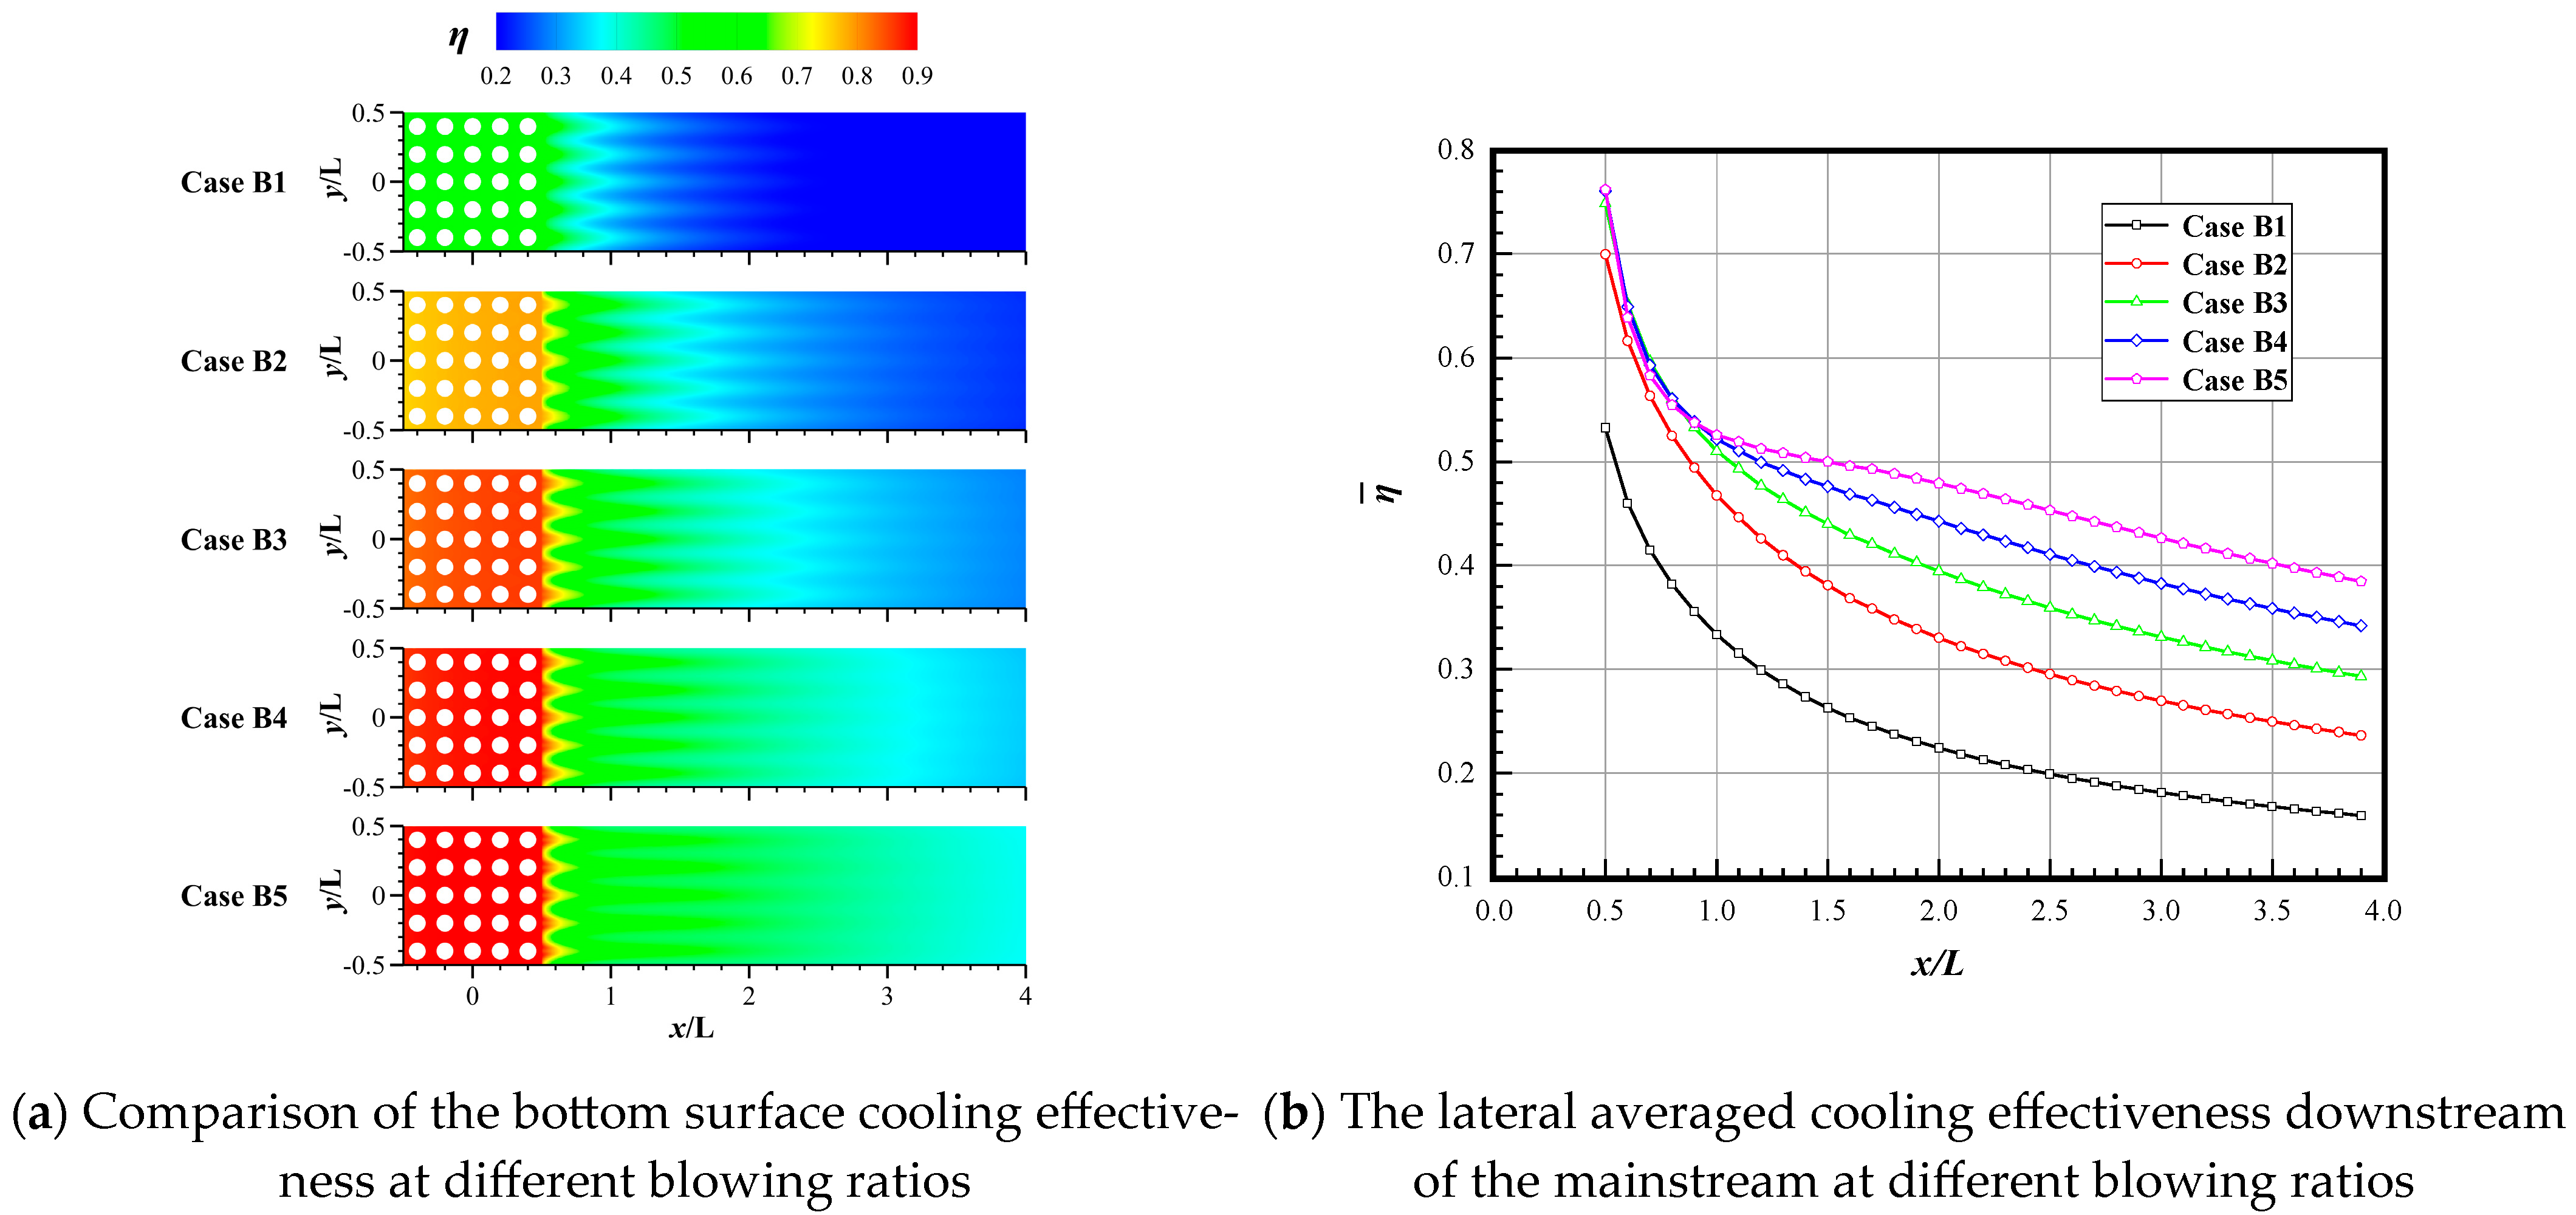
Figure 10a reflects the contours of η on the bottom surface at different blowing ratios that range from 0.1% to 0.5%, corresponding to Cases B1 to B5, respectively. Similar to Figure 7, the porous structure area exhibits a higher and more uniform η than the downstream area. A peak-shaped high-effectiveness cooling zone also appears downstream of the leading edge. In Figure 10a, as the blowing ratio increases, the η ˙ of the porous structure continuously increases. At a blowing ratio of 0.5% (Case B5), the η ˙ of the porous structure surface reaches 0.9. The reason is that higher blowing ratios elevate the coolant mass flow rate, which can carry away more heat, resulting in stronger cooling capacity. Elevated blowing ratios contract the leading-edge peak cooling zone while homogenizing rear-region thermal coverage.
Figure 10b shows the η ¯ downstream of the mainstream at different blowing ratios that range from 0.1% to 0.5%, corresponding to Cases B1 to B5, respectively. The η ¯ along the mainstream downstream direction gradually increases with rising blowing ratio. As the blowing ratio rises from 0.2% (Case B2) to 0.5% (Case B5), the η ¯ remains relatively comparable between x/L = 0.5 and 1.0. Between x/L = 1.0 and 4.0, the η ¯ exhibits an increasing trend. This is because in this area, the effect of the mainstream on the coolant is weakened, and the coolant coverage is more uniform. Increasing the blowing ratio improves cooling performance. This reveals that the blowing ratio plays a positive role in enhancing the η ¯ .
Figure 11 shows the velocity distribution in the middle cross-section at different blowing ratios. A distinct low-velocity zone appears downstream, created by the coolant jet, and forms an effective cooling layer that shields the wall from thermal erosion. Within the proximal zone adjacent to the coolant channel outlet in the downstream section, there is also a distinct low-velocity zone. Because Case B1 has the smallest blowing ratio, its low-velocity zone is noticeably smaller than those in Cases B2–B5, so the η ¯ of Case B1 is lower between x/L = 0.5 and 1.0. As the blowing ratio increases, channel velocity rises and the cooling layer thickens because the higher blowing ratio increases the coolant mass flow. In addition, the velocity in channels near the rear exceeds that in channels near the front because mainstream pressure at the front slows the coolant, whereas the rear remains less affected.
Figure 12 reflects the θ distribution on the periodic interface of the porous structure at different blowing ratios. As θ increases, the temperature also rises. It can be observed that as the blowing ratio increases, the temperature on the outer surface of the porous structure gradually decreases, and the temperature distribution becomes more uniform. From the top-left corner to the top-right corner, the temperature progressively rises. This is also due to the influence of the mainstream pressure, but this effect diminishes as the blowing ratio increases. With the increase in the blowing ratio from Case 1 to Case 5, the θ gradually decreases, indicating a progressive reduction in the temperature of the porous structure. This confirms enhanced thermal protection of the porous structure at higher blowing ratios. Higher blowing ratios thus yield greater cooling effectiveness.

3.3. Effect of Different Porous Structure Heights (H)

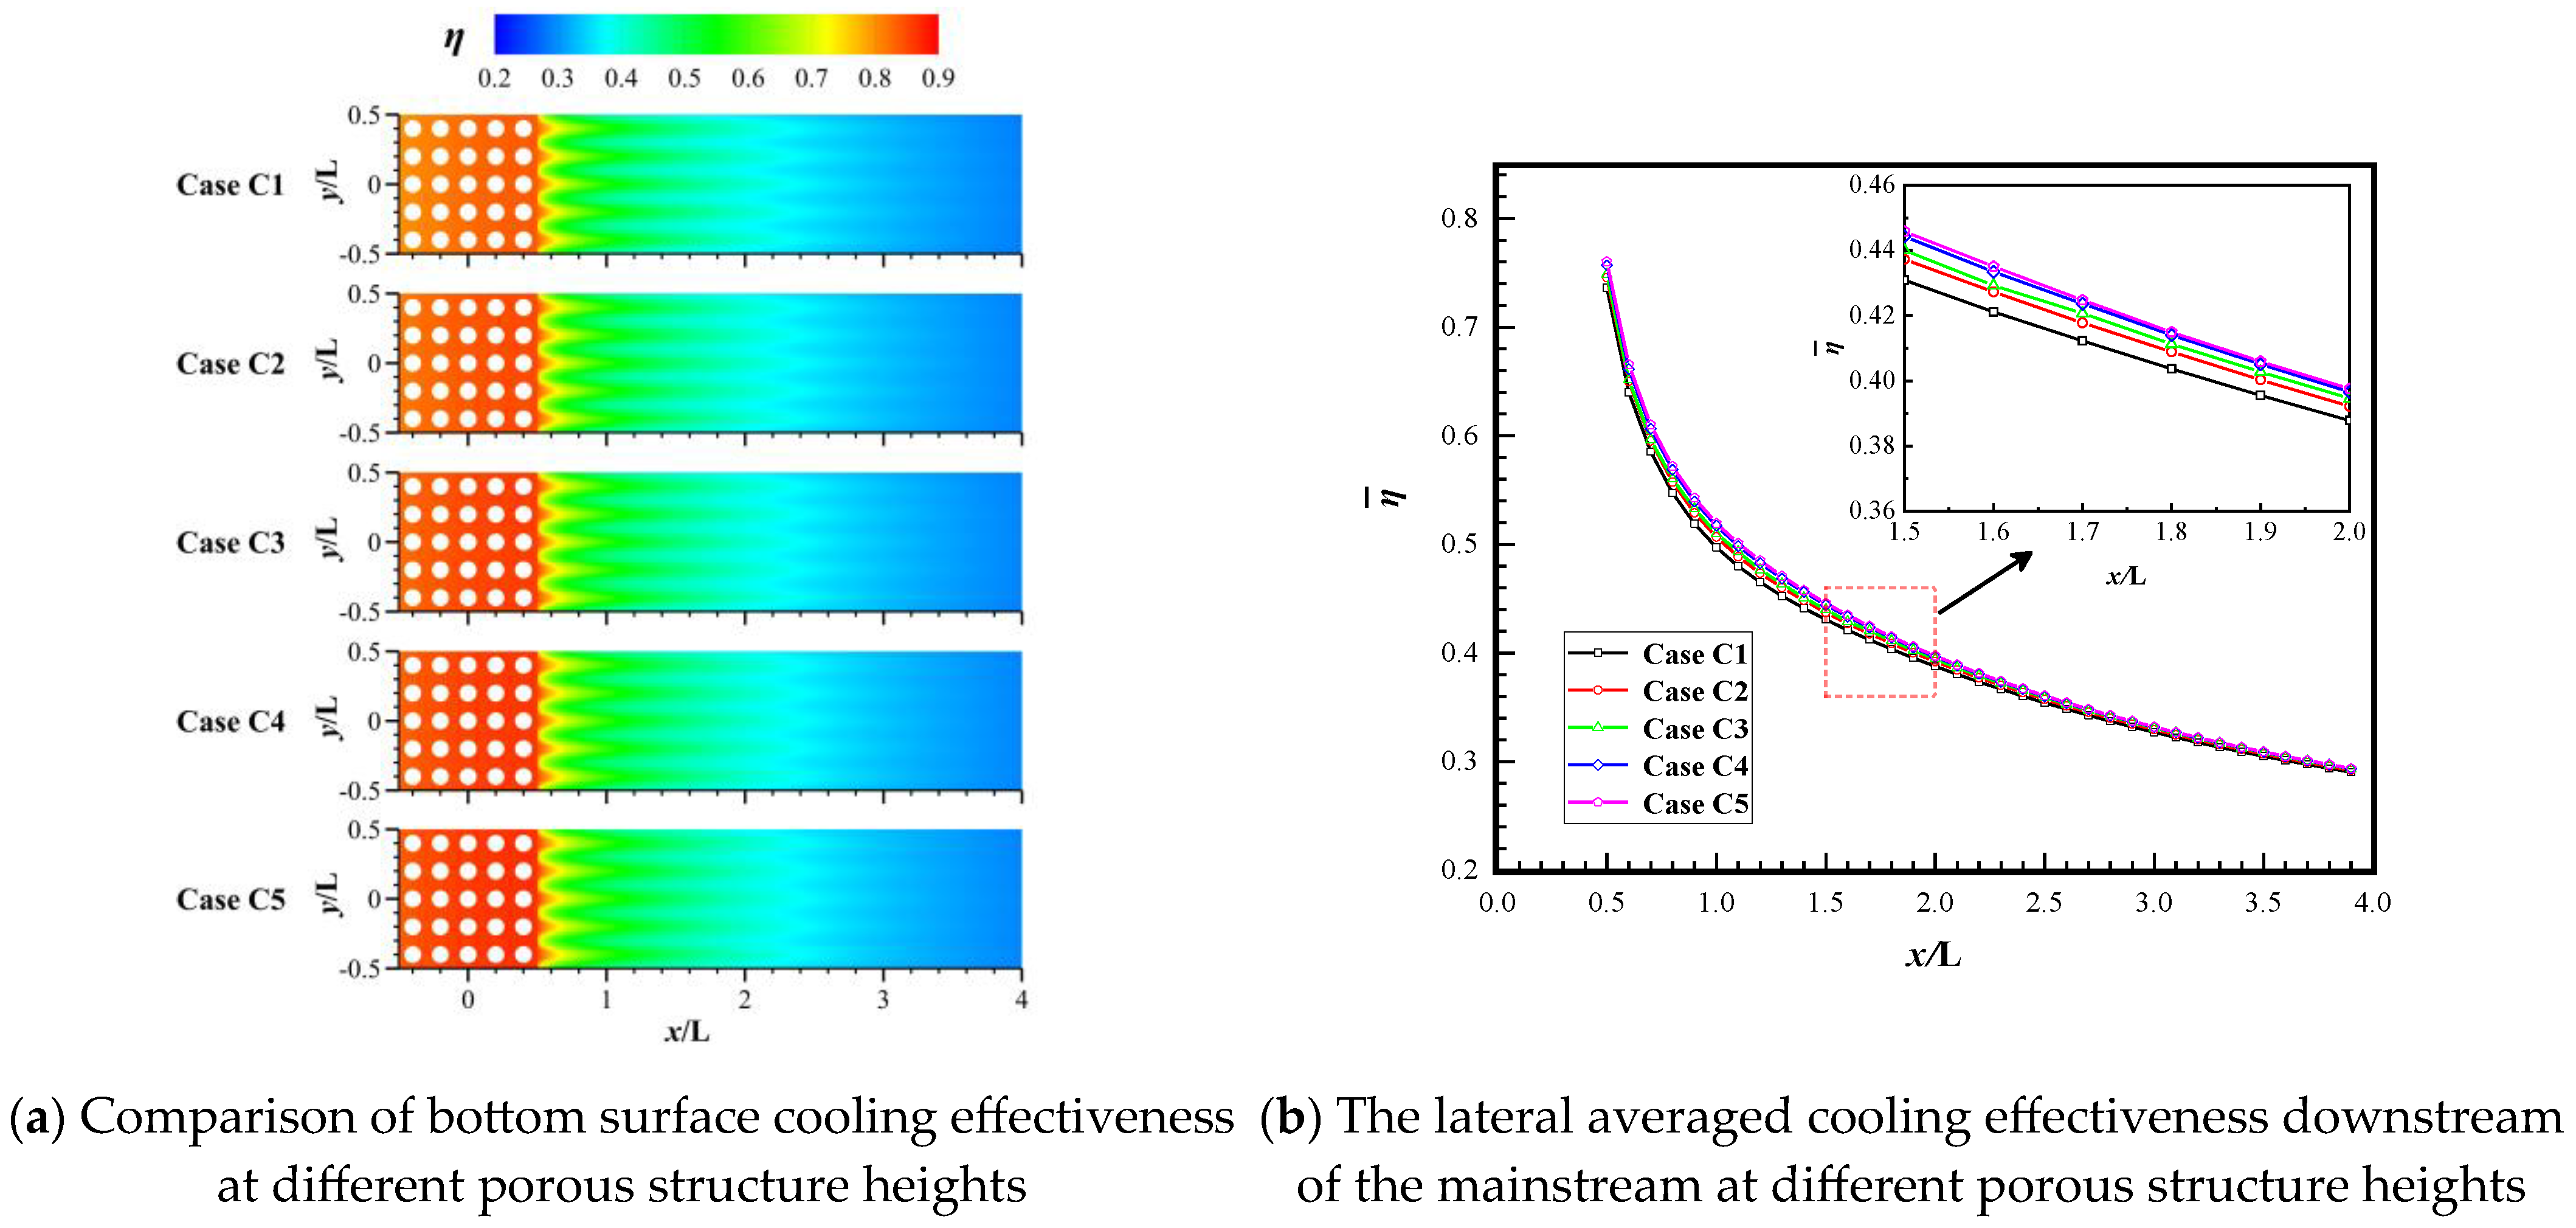
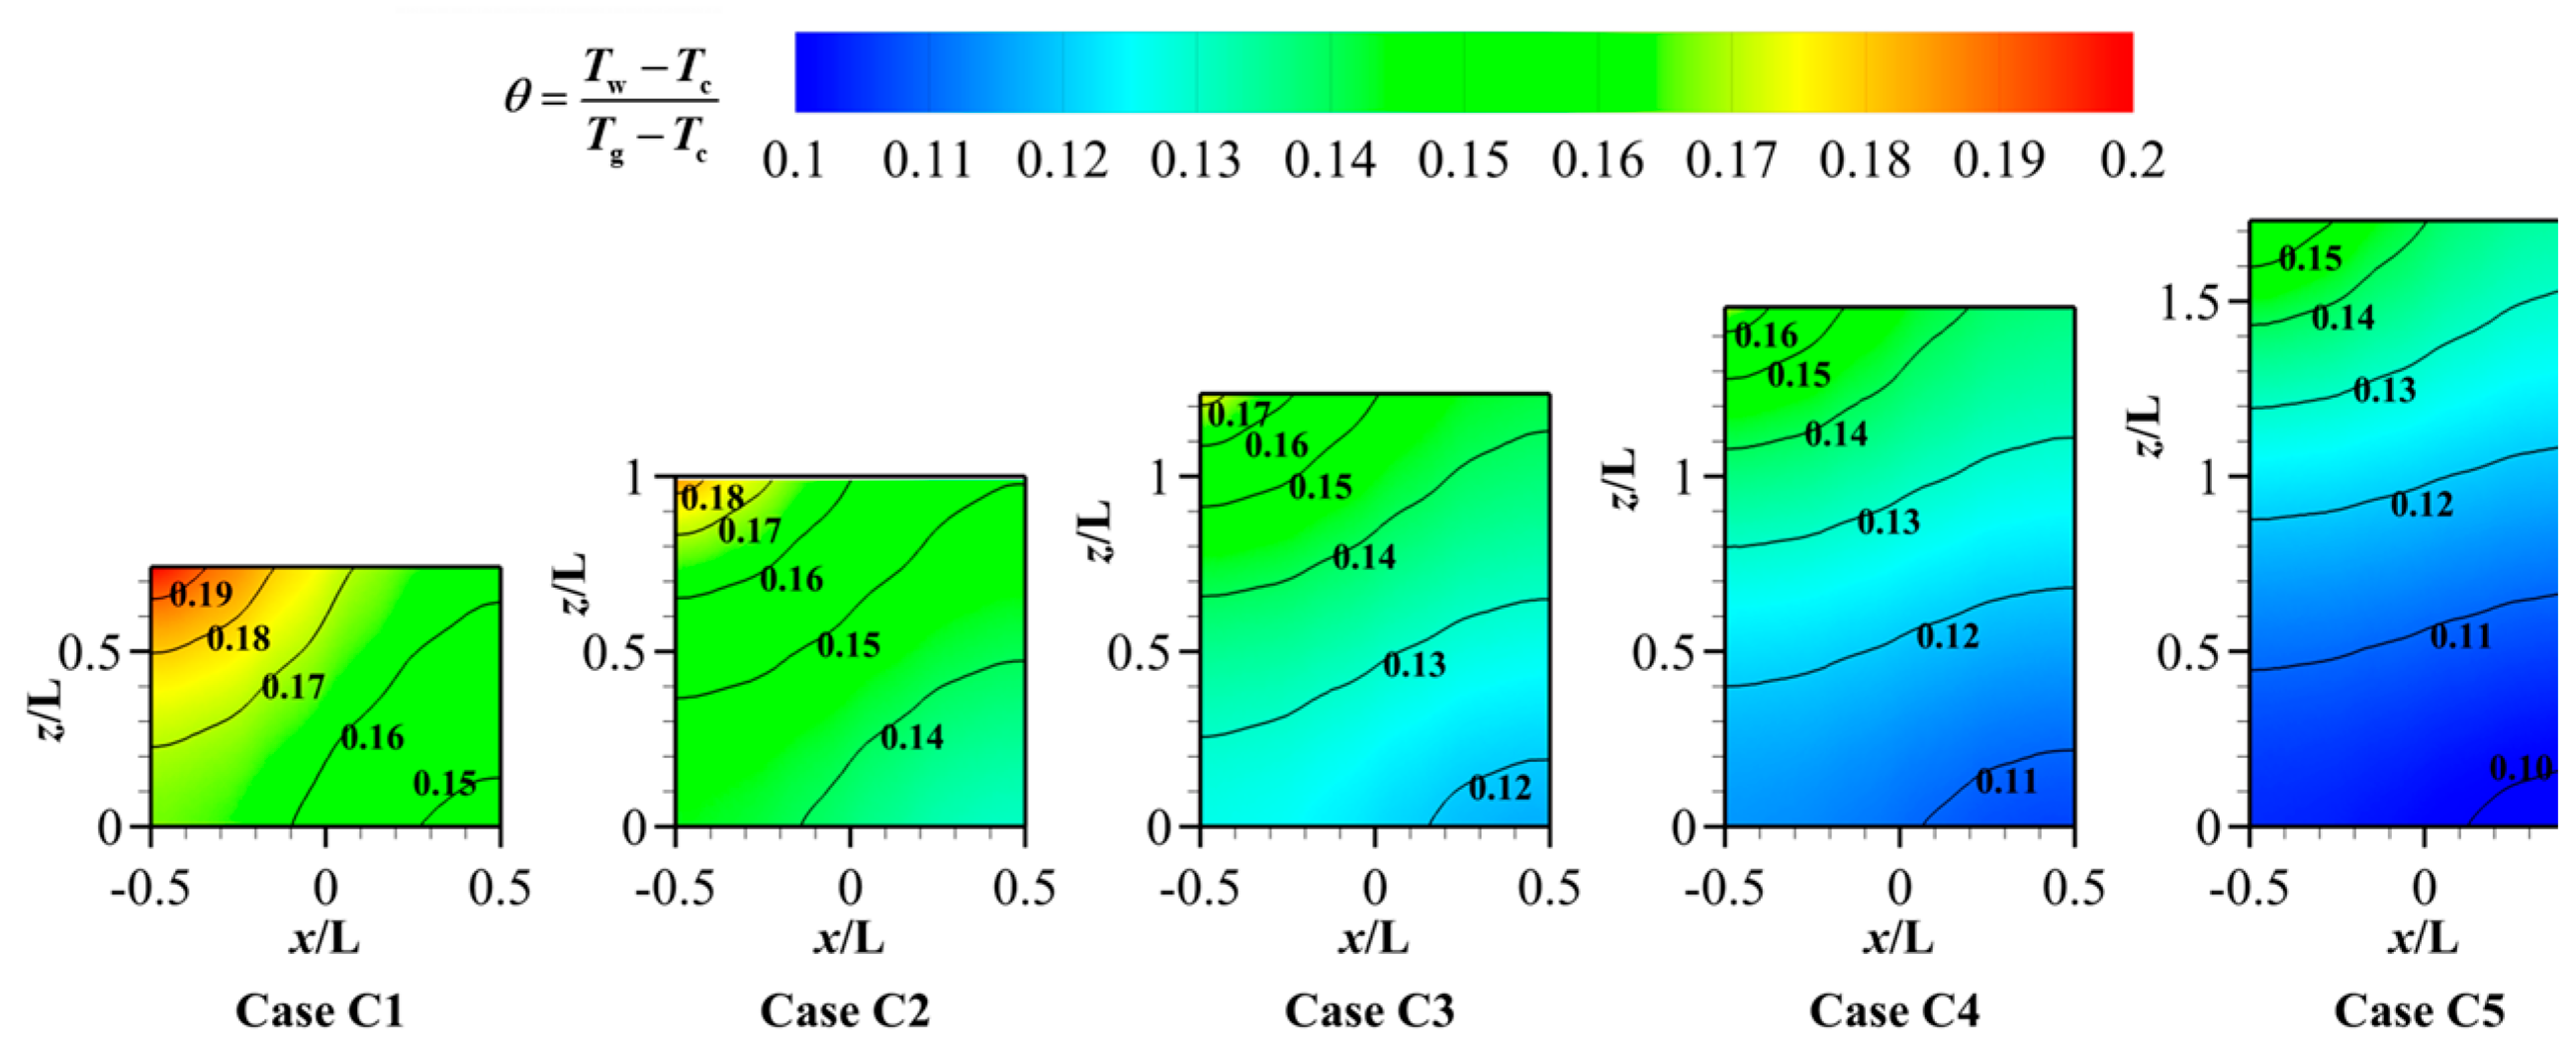
Figure 13 reflects the contours of the bottom surface η and the η ¯ downstream of the mainstream at different porous structure heights that range from 6D to 14D, corresponding to Cases C1 to C5, respectively. Figure 13a shows that η within the porous region exceeds that in the downstream region, and a peak-shaped high-η zone appears near the front edge of the downstream area. The surface η ¯ of the porous structure improves slightly with increasing structure height, yet the gain remains marginal, because taller structures neither alter the flow pattern nor enhance heat transfer. Meanwhile, the η in the downstream region stays almost identical across Cases C1–C5. However, as shown in Figure 13b, with rising height of the porous structure, the η ¯ downstream of the mainstream gradually increases. There is a certain upward trend in the first half of the downstream mainstream, while in the second half of the downstream mainstream, the curves are very close to each other. Thus, structure height influences cooling effectiveness but does not govern it.
Figure 14 indicates the θ distribution of the periodic interface on the porous structure at different porous structure heights (H). Despite the height variations, the θ of the outer surface generally decreases diagonally from the upper-left to the lower-right corner. As H increases, the average temperature on the outer surface gradually decreases and no high-temperature zones appear. A larger low-temperature zone emerges near the coolant inlet on the right because greater height enlarges the coolant–solid contact area and strengthens heat transfer. Hence, increasing H enhances cooling performance.

3.4. Effect of Different Thermal Conductivities (λ) of the Porous Structure Material

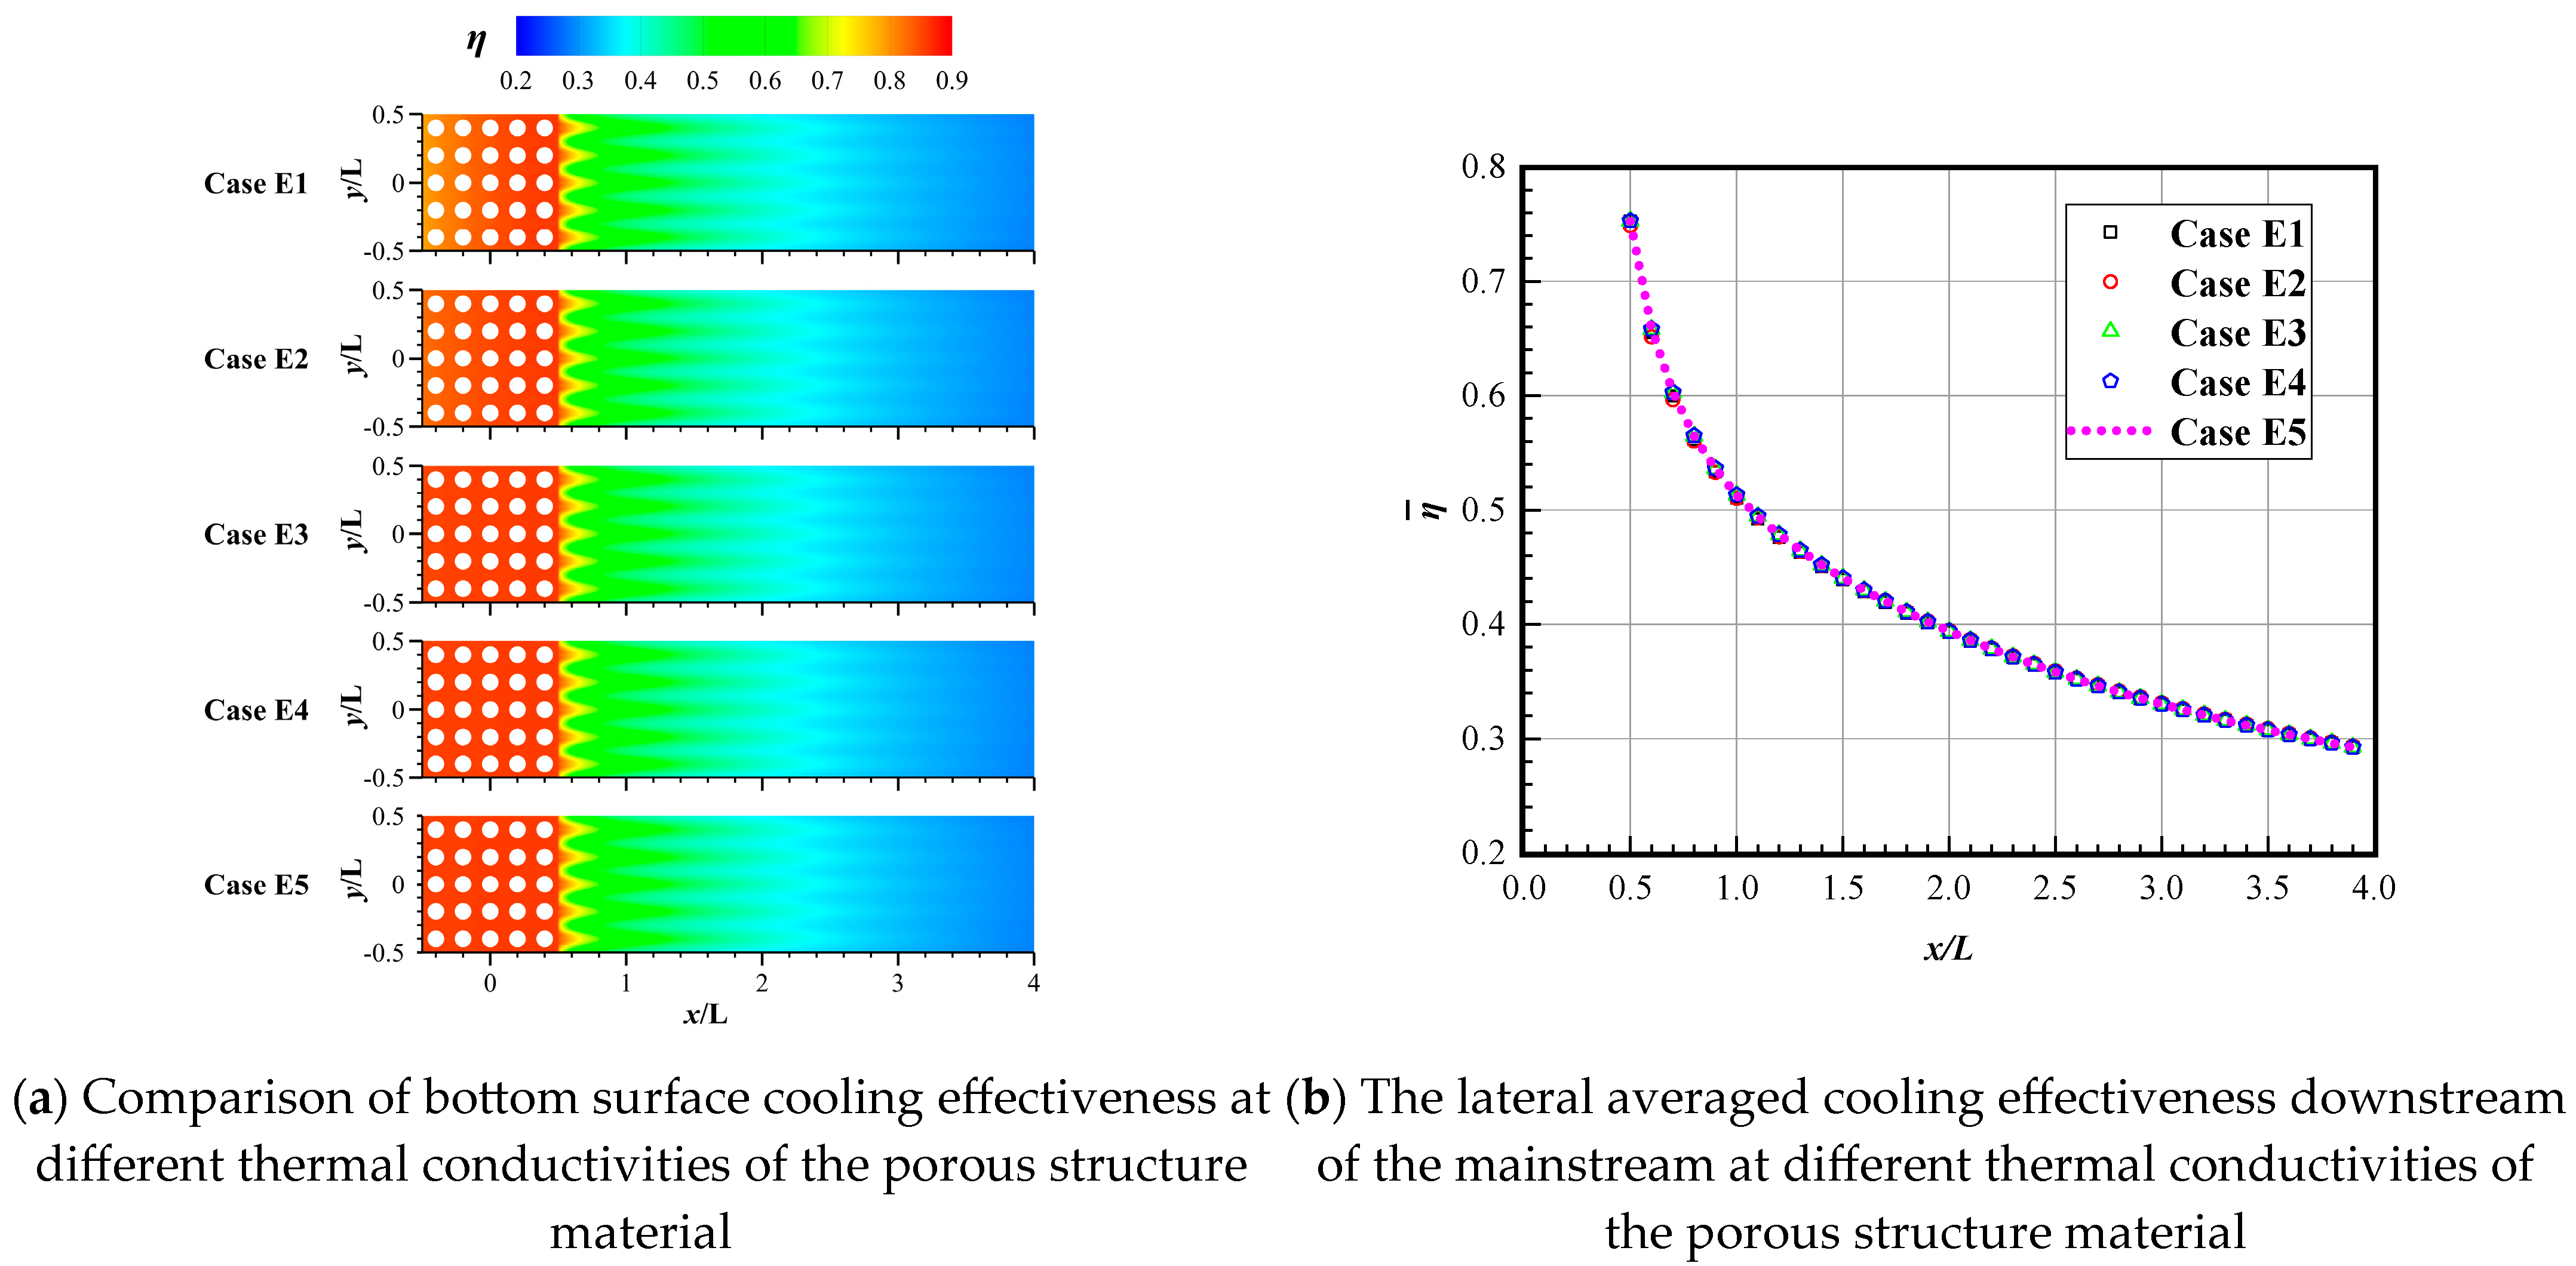
Figure 15 shows the contours of the bottom surface η and the η ¯ downstream of the mainstream at different thermal conductivities (λ) of the porous structure materials—titanium (7.44 W/(m·K)), steel (16.27 W/(m·K)), nickel (91.74 W/(m·K)), aluminum (202.4 W/(m·K)), and copper (387.6 W/(m·K))—corresponding to Cases E1 to E5, respectively. Figure 15a shows that the η within each porous region exceeds that in the downstream mainstream region, and peak-shaped high-effectiveness cooling zones form in all cases. For titanium materials (7.44 W/(m·K)), the porous structure region shows an uneven η, which decreases along the mainstream direction. With increasing λ, the η of the porous surface improves slightly and its distribution becomes more uniform because higher thermal conductivity enhances heat transfer, resulting in faster and more uniform cooling, consistent with the findings of [12]. Figure 15b presents the η ¯ downstream of the mainstream. It is shown that the η ¯ of the downstream region is essentially consistent in Cases E1 to E5. This indicates that changing the λ of materials cannot be a critical influence on the cooling performance.
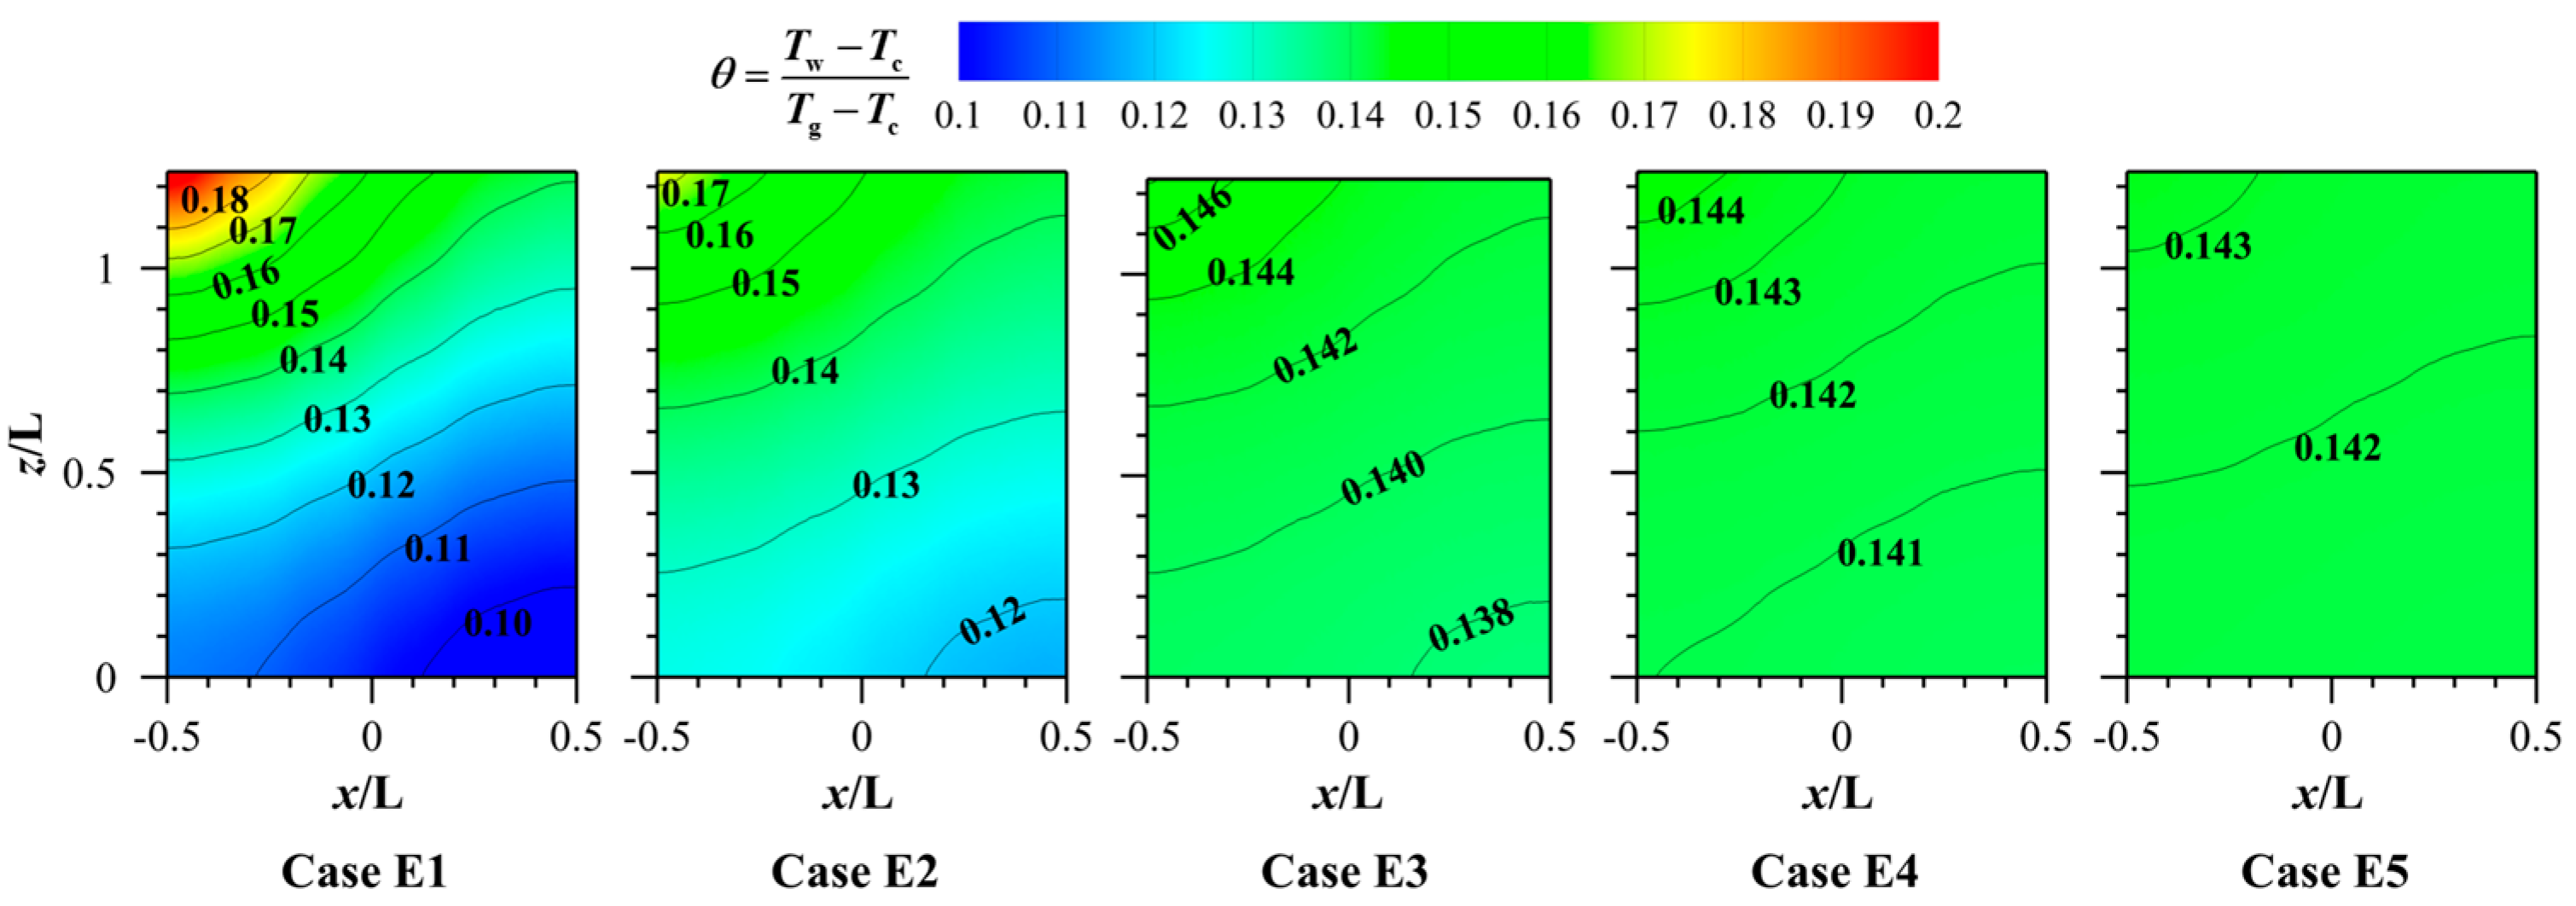
Figure 16 reflects the θ distribution of the periodic interface of the porous structure at different thermal conductivities (λ) of materials. It can be observed that due to the low thermal conductivity of titanium (Case 1, 7.44 W/(m·K)), the θ distribution on the outer surface exhibits significant non-uniformity. Specifically, the θ near the coolant inlet is relatively low, corresponding to lower temperatures. Across all cases, the overall trend demonstrates a gradual decrease in θ from the upper-left to the lower-right corner. It is evident that with increasing λ, the temperature distribution becomes more uniform. As λ increases, the temperature field becomes progressively more uniform, heat transfer is enhanced, and the average outer-surface temperature falls. However, with the increase in λ, the difference in the average temperature of the outer surface becomes significantly reduced, reaching a threshold. Increasing the λ has a certain effect on improving the η of the porous surface, but it cannot markedly enhance the cooling performance downstream of the mainstream. Moreover, increasing the λ to a certain extent can reduce the temperature on the outer surface of the porous structure.

3.5. Effects of Different Temperature Ratios

Figure 17 reflects the contours of the bottom surface η and the η ¯ downstream of the mainstream at different ratios of the mainstream temperature to the coolant temperature. As shown in Figure 17a, the η of the porous structure surface decreases as the temperature ratio increases. This reveals that although η is a relative measure, differences in the mainstream inlet and coolant inlet temperatures also lead to variations in η. Figure 17b clearly demonstrates the η ¯ downstream of the mainstream at different ratios of the mainstream temperature to the coolant temperature. In conjunction with Figure 17a, it is obvious that the η ¯ downstream of the mainstream under various ratios of temperature is relatively close. However, the case with a lower temperature ratio has relatively lower η in the second half.
Figure 18 shows the vorticity contour of Case F1 based on the Q criterion. The boundary conditions of Cases A3, B3, C3, E3, and F1 are consistent. Since the model structures of each case are similar, the difference lies in the boundary conditions. Thus, the flow structures of all cases are similar. Therefore, the vorticity contour of Case F1 can reflect the overall flow situation. As can be seen from Figure 18, at the front end of the coolant outlet, a larger vortex structure can be observed, which is caused by the influence of the coolant jet, lifting the airflow in this area. Between each pair of holes in the coolant channel, a small vortex can be observed; this is because the mainstream and coolant are perpendicular to each other and interact, forming small recirculation zones between the holes. Downstream of the coolant outlet, numerous complex vortices can be clearly observed. These vortices are formed due to the interaction between the mainstream and the coolant jet, resulting in fragmented small-scale vortices that create an effective cooling protective layer near the wall surface. In the middle of the downstream region, a lifted vortex can be observed. This occurs because the coolant jet, after entering the mainstream flow, is pushed downward by the high-speed mainstream, causing the shear layers on both sides of the jet to roll up under the transverse pressure gradient. As a result, a pair of counter-rotating, streamwise-extending tubular vortices is formed.

4. Correlations

According to the simulation results obtained in this study, a correlation relationship between the η ¯ and the porosity (φ), the blowing ratio (Br), the height of the porous structure (H), the thermal conductivity of the porous structure material (λ), and the ratio of the mainstream temperature to the coolant temperature (Rt) was established to predict the η ˙ of the porous structure surface under different parameters.
Table 2 shows the averaged cooling effectiveness of the porous surface under various cases. Correlation fitting was performed using 1stOpt software (Version 15 Pro), which is independently developed by 7D-Soft High Technology Inc., Beijing, China. It is a set of mathematical optimization analysis and synthesis tool software packages with complete independent intellectual property rights. The built-in Levenberg–Marquardt (LM) algorithm in the software was used for fitting. The Levenberg–Marquardt (LM) algorithm is an efficient method for nonlinear least-squares optimization. It combines the stability of the gradient descent method with the fast convergence of the Gauss–Newton method by adaptively controlling the iteration step size through dynamic adjustment of the damping factor. When the parameters approach the optimal solution, the algorithm behaves more like the Gauss–Newton method to accelerate convergence; when the initial guess is poor, it reverts to the gradient descent method to ensure stability. Its core principle involves iteratively adjusting parameters to minimize the sum of squared errors between model predictions and actual data. This algorithm is widely used in curve fitting. Through successive fittings of individual variables using the Levenberg–Marquardt algorithm, the formulation presented in Equation (7) characterizing parameters φ, Br, H, λ, and Rt was established.
η ˙ = ( 0.959063 φ 0.119787 0.0325003 φ ) B r 0.962588 B r + 0.006765 ( 0.845718 0.0040695 H D + 0.084524 ln H D ) [ 0.7913308 + 0.220928 ( λ 16.27 ) 0.05874886 + ( λ 16.27 ) ] ( 1 6.752395747 R t + 4.145872303 + 0.9226068213 )
To verify the effectiveness of the formula, this study compared the results obtained from simulations with those calculated using Equation (7) by changing various parameters and model sizes.
Table 3 compares simulation results with the Equation (7) calculations. The errors are all below 2%, showing that Equation (7) accurately predicts the average cooling effectiveness of the porous structure.

5. Conclusions

This study investigates the impact of various parameters on the performance of effusion cooling, including porosity (φ), blowing ratio (Br), height of the porous structure (H), thermal conductivity (λ), and ratio of temperature (Rt). Additionally, a correlation for the averaged cooling effectiveness of porous structure surfaces is fitted. The key results are as follows:
  • Porosity markedly affects cooling effectiveness. As porosity rises, the η of the porous structure surface first improves and then declines, whereas the averaged downstream η gradually increases. Higher porosity reduces the temperature on the outer surface of the porous structure yet produces a non-uniform temperature distribution.
  • The blowing ratio and η are positively correlated. In general, as the blowing ratio increases, η also improves.
  • Surprisingly, the height of the porous structure and the thermal conductivity of the material exert minimal influence on the cooling effectiveness of both the porous surface and the downstream region. This is because as the ventilation time increases, the temperature of the porous material will eventually reach equilibrium. The height of the porous structure and the material’s thermal conductivity mainly affect the heat conduction performance. In this coupling of convective heat transfer and thermal conduction, the effect of convective heat transfer is more intense, while the influence of thermal conduction is reduced. However, a larger height of the porous structure and a smaller thermal conductivity coefficient can lead to a non-uniform temperature distribution on the outer surface of the porous structure.
  • Although the cooling effectiveness is a relative formula, different temperature ratios between the mainstream inlet and the coolant inlet make the cooling effectiveness change, and a similar coolant coverage pattern is formed.
  • The formula fitted for the cooling effectiveness of the porous surface demonstrates high precision and all errors remain below 2%. The formula is capable of accurately predicting the cooling effectiveness of such surfaces. Future research can conduct correlation fitting between downstream cooling effectiveness and related parameters to predict their cooling effectiveness, providing references and options for design and optimization.

Author Contributions

Conceptualization, J.L. and W.X.; methodology, J.Z.; software, J.Z. and R.L.; investigation, J.Z.; data curation, J.L. and J.Z.; writing—original draft preparation, J.Z. and R.L.; writing—review and editing, W.X.; funding acquisition, J.L. All authors have read and agreed to the published version of the manuscript.

Funding

This work was supported by the Natural Science Foundation of Hunan Province, China (Grant No. 2023JJ40733) and the science and technology Program of the Hunan Provincial Department of Transportation (Grant No. 202403).

Data Availability Statement

The raw data supporting the conclusions of this article will be made available by the authors on request.

Conflicts of Interest

The authors declare no conflicts of interest.

Abbreviations

The following abbreviations are used in this manuscript:
VhVolume of Holes
VsVolume of Solid
LWidth of Inlet
DDiameter of Holes
TTemperature
TMTemperature of Mainstream
TCTemperature of Coolant
TWTemperature of Wall
φPorosity
BrBlowing Ratio
λThermal Conductivity
HHeight of Porous Structure
RtRatio of Temperature
ηCooling Effectiveness
η ¯ Lateral Averaged Cooling Effectiveness
η ˙ Averaged Cooling Effectiveness
θWall Temperature Distribution Coefficient

References

  1. Han, J.C.; Dutta, S. Gas Turbine Heat Transfer and Cooling Technology, 2nd ed.; Taylor & Francis: Oxfordshire, UK, 2013. [Google Scholar]
  2. Facchini, B.; Tarchi, L. Adiabatic and overall effectiveness measurements of an effusion cooling array for turbine endwall application. J. Turbomach.-Trans. Asme 2010, 132, 11. [Google Scholar] [CrossRef]
  3. Gustafsson, K.M.B.; Johansson, T.G. An experimental study of surface temperature distribution on effusion-cooled plates. J. Eng. Gas Turbines Power-Trans. Asme 2001, 123, 308–316. [Google Scholar] [CrossRef]
  4. Krewinkel, R. A review of gas turbine effusion cooling studies. Int. J. Heat Mass Transf. 2013, 66, 706–722. [Google Scholar] [CrossRef]
  5. Fulmer, G.; Ligrani, P. Effects of blowing ratio on surface heat transfer characteristics of a transonic turbine squealer blade tip with a double plenum film cooling supply arrangement. Int. J. Heat Mass Transf. 2024, 221, 125043. [Google Scholar] [CrossRef]
  6. Wu, H.; Cheng, H.C. Effects of side hole position and blowing ratio on sister hole film cooling performance in a flat plate. Appl. Therm. Eng. 2016, 93, 718–730. [Google Scholar] [CrossRef]
  7. Li, H.W.; Han, F. Experimental investigations of the effects of the injection angle and blowing ratio on the leading-edge film cooling of a rotating twisted turbine blade. Int. J. Heat Mass Transf. 2018, 127, 856–869. [Google Scholar] [CrossRef]
  8. Chen, Y.; Wei, H. Experimental study on the conjugate heat transfer of double-wall turbine blade components with/without pins. Therm. Sci. Eng. Prog. 2018, 8, 448–456. [Google Scholar] [CrossRef]
  9. He, K. Investigations of film cooling and heat transfer on a turbine blade squealer tip. Appl. Therm. Eng. 2017, 110, 630–647. [Google Scholar] [CrossRef]
  10. Yang, W.H.; Liu, X. Experimental investigation on heat transfer characteristics of film cooling using parallel-inlet holes. Int. J. Therm. Sci. 2012, 60, 32–40. [Google Scholar] [CrossRef]
  11. Huang, G.; He, L. Influence of inhomogeneous porosity on effusion cooling. Int. J. Heat Mass Transf. 2019, 144, 118675. [Google Scholar] [CrossRef]
  12. Yang, Y.; Mao, J.K. Numerical investigation on transpiration cooling performance with different porosities and mainstream pressure gradients. Int. J. Therm. Sci. 2023, 184, 107991. [Google Scholar] [CrossRef]
  13. Brimacombe, B.J.; Scobie, J.A. Effect of porosity and injection ratio on the performance of transpiration cooling through gyroids. Int. J. Turbomach. Propuls. Power 2023, 8, 50. [Google Scholar] [CrossRef]
  14. Ma, H.F.; Sun, H.O. Numerical investigation on transpiration cooling performance of turbine blades with non-uniform porosity. Appl. Therm. Eng. 2023, 235, 121394. [Google Scholar] [CrossRef]
  15. Rao, Y.; Liu, Y.Y. Multiple-jet impingement heat transfer in double-wall cooling structures with pin fins and effusion holes. Int. J. Therm. Sci. 2018, 133, 106–119. [Google Scholar] [CrossRef]
  16. Wang, J.; Tian, K. Effect of hole configurations on film cooling performance. Numer. Heat Transf. Part A-Appl. 2019, 75, 725–738. [Google Scholar] [CrossRef]
  17. Zhou, J.F.; Wang, X.J. Influences of effusion hole diameter on impingement/effusion cooling performance at turbine blade leading edge. Int. J. Heat Mass Transf. 2019, 134, 1101–1118. [Google Scholar] [CrossRef]
  18. Jiang, D.P.; Chen, Y.J. Effects of blowing ratio and film hole arrangement on cavity blade tip cooling. Phys. Fluids 2024, 36, 075108. [Google Scholar] [CrossRef]
  19. Li, H.W.; Zhang, D.W. Numerical investigation of the effects of the hole inclination angle and blowing ratio on the characteristics of cooling and stress in an impingement/effusion cooling system. Energies 2023, 16, 937. [Google Scholar] [CrossRef]
  20. Zhai, Y.N.; Liu, C.L. Investigation on the film cooling performance of diffuser shaped holes with different inclination angles. Int. J. Turbo Jet-Engines 2017, 34, 123–139. [Google Scholar] [CrossRef]
  21. Lin, Y.; Song, B. Investigation of film cooling effectiveness of full-coverage inclined multihole walls with different hole arrangements. In Proceedings of the ASME Turbo Expo 2003, Collocated with the 2003 International Joint Power Generation Conference, Atlanta, GA, USA, 16–19 June 2003; pp. 651–660. [Google Scholar]
  22. Kim, J.H.; Kim, K.Y. Film-cooling performance of converged-inlet hole shapes. Int. J. Therm. Sci. 2018, 124, 196–211. [Google Scholar] [CrossRef]
  23. Vishal, V.; Sriraam, J. Studies on effusion cooling: Impact of geometric parameters on cooling effectiveness and coolant consumption. Aerosp. Sci. Technol. 2018, 77, 58–66. [Google Scholar] [CrossRef]
  24. Qu, L.H.; Zhang, J.Z. Improvement on film cooling effectiveness by a combined slot-effusion scheme. Appl. Therm. Eng. 2017, 126, 379–392. [Google Scholar] [CrossRef]
  25. Ji, Y.B.; Ge, B. Conjugate heat transfer characteristics of effusion cooling under realistic swirl flow in a three-sector gas turbine model combustor. Appl. Therm. Eng. 2022, 213, 118735. [Google Scholar] [CrossRef]
  26. Arjun, C.K.; Jayakumar, J.S. Experimental and numerical investigation of effusion cooling effectiveness of combustion chamber liner plates. J. Heat Transf.-Trans. Asme 2018, 140, 082201. [Google Scholar] [CrossRef]
  27. Chen, C.L.; Jiang, Y.T. Flow and heat transfer analysis on impingement/effusion cooling configuration including jet orifices with conformal pins. Phys. Fluids 2024, 36, 076122. [Google Scholar] [CrossRef]
  28. Chen, G.J.; Liu, Y.Y. Numerical investigation on conjugate heat transfer of impingement/effusion double-wall cooling with different crossflow schemes. Appl. Therm. Eng. 2019, 155, 515–524. [Google Scholar] [CrossRef]
  29. Bahr, D.W. Gas turbine combustion—Alternative fuels and emissions. J. Eng. Gas Turbines Power 2010, 132, 116501. [Google Scholar] [CrossRef]
  30. Wadia, A. Advanced combustor liner cooling technology for gas turbines. Def. Sci. J. 1988, 38, 363–380. [Google Scholar] [CrossRef]
  31. Gulli, S.; Maddalena, L. Variable transpiration cooling for the thermal management of reusable hypersonic vehicles. Aerosp. Sci. Technol. 2013, 29, 434–444. [Google Scholar] [CrossRef]
  32. Mendez, S.; Nicoud, F. Adiabatic homogeneous model for flow around a multiperforated plate. AIAA J. 2008, 46, 2623–2633. [Google Scholar] [CrossRef]
  33. Huang, G.; Min, Z. Transpiration cooling for additive manufactured porous plates with partition walls. Int. J. Heat Mass Transf. 2018, 124, 1076–1087. [Google Scholar] [CrossRef]
  34. Zhang, J.Z.; Xie, H. Numerical study of flow and heat transfer characteristics of impingement/effusion cooling. Chin. J. Aeronaut. 2009, 22, 343–348. [Google Scholar] [CrossRef]
  35. Oguntade, H.I.; Andrews, G.E. Impingement/effusion cooling with low coolant mass flow. In Proceedings of the ASME Turbo Expo 2017: Turbomachinery Technical Conference and Exposition, Charlotte, NC, USA, 26–30 June 2017. [Google Scholar]
  36. Cho, H.H.; Rhee, D.H. Local heat/mass transfer measurement on the effusion plate in impingement/effusion cooling systems. J. Turbomach.-Trans. Asme 2001, 123, 601–608. [Google Scholar] [CrossRef]
  37. Tan, X.M.; Zhang, J.Z. Experimental investigation on impingement/effusion cooling with short normal injection holes. Int. Commun. Heat Mass Transf. 2015, 69, 1–10. [Google Scholar] [CrossRef]
  38. Xie, G.; Liu, C.L. Effects of impingement gap and hole arrangement on overall cooling effectiveness for impingement/effusion cooling. Int. J. Heat Mass Transf. 2020, 152, 119449. [Google Scholar] [CrossRef]
  39. Poupinha, C.; Kozlowska, S. Experimental study on transpiration cooling through additively manufactured porous structures. Int. J. Heat Mass Transf. 2024, 227, 125532. [Google Scholar] [CrossRef]
  40. Wright, L.M.; McClain, S.T. Effect of density ratio on flat plate film cooling with shaped holes using psp. J. Turbomach.-Trans. Asme 2011, 133, 041011. [Google Scholar] [CrossRef]
  41. Yu, Y.; Yen, C.H. Film cooling effectiveness and heat transfer coefficient distributions around diffusion shaped holes. J. Heat Transf.-Trans. Asme 2002, 124, 820–827. [Google Scholar] [CrossRef]
  42. Baldauf, S.; Scheurlen, M. Heat flux reduction from film cooling and correlation of heat transfer coefficients from thermographic measurements at enginelike conditions. J. Turbomach.-Trans. Asme 2002, 124, 699–709. [Google Scholar] [CrossRef]
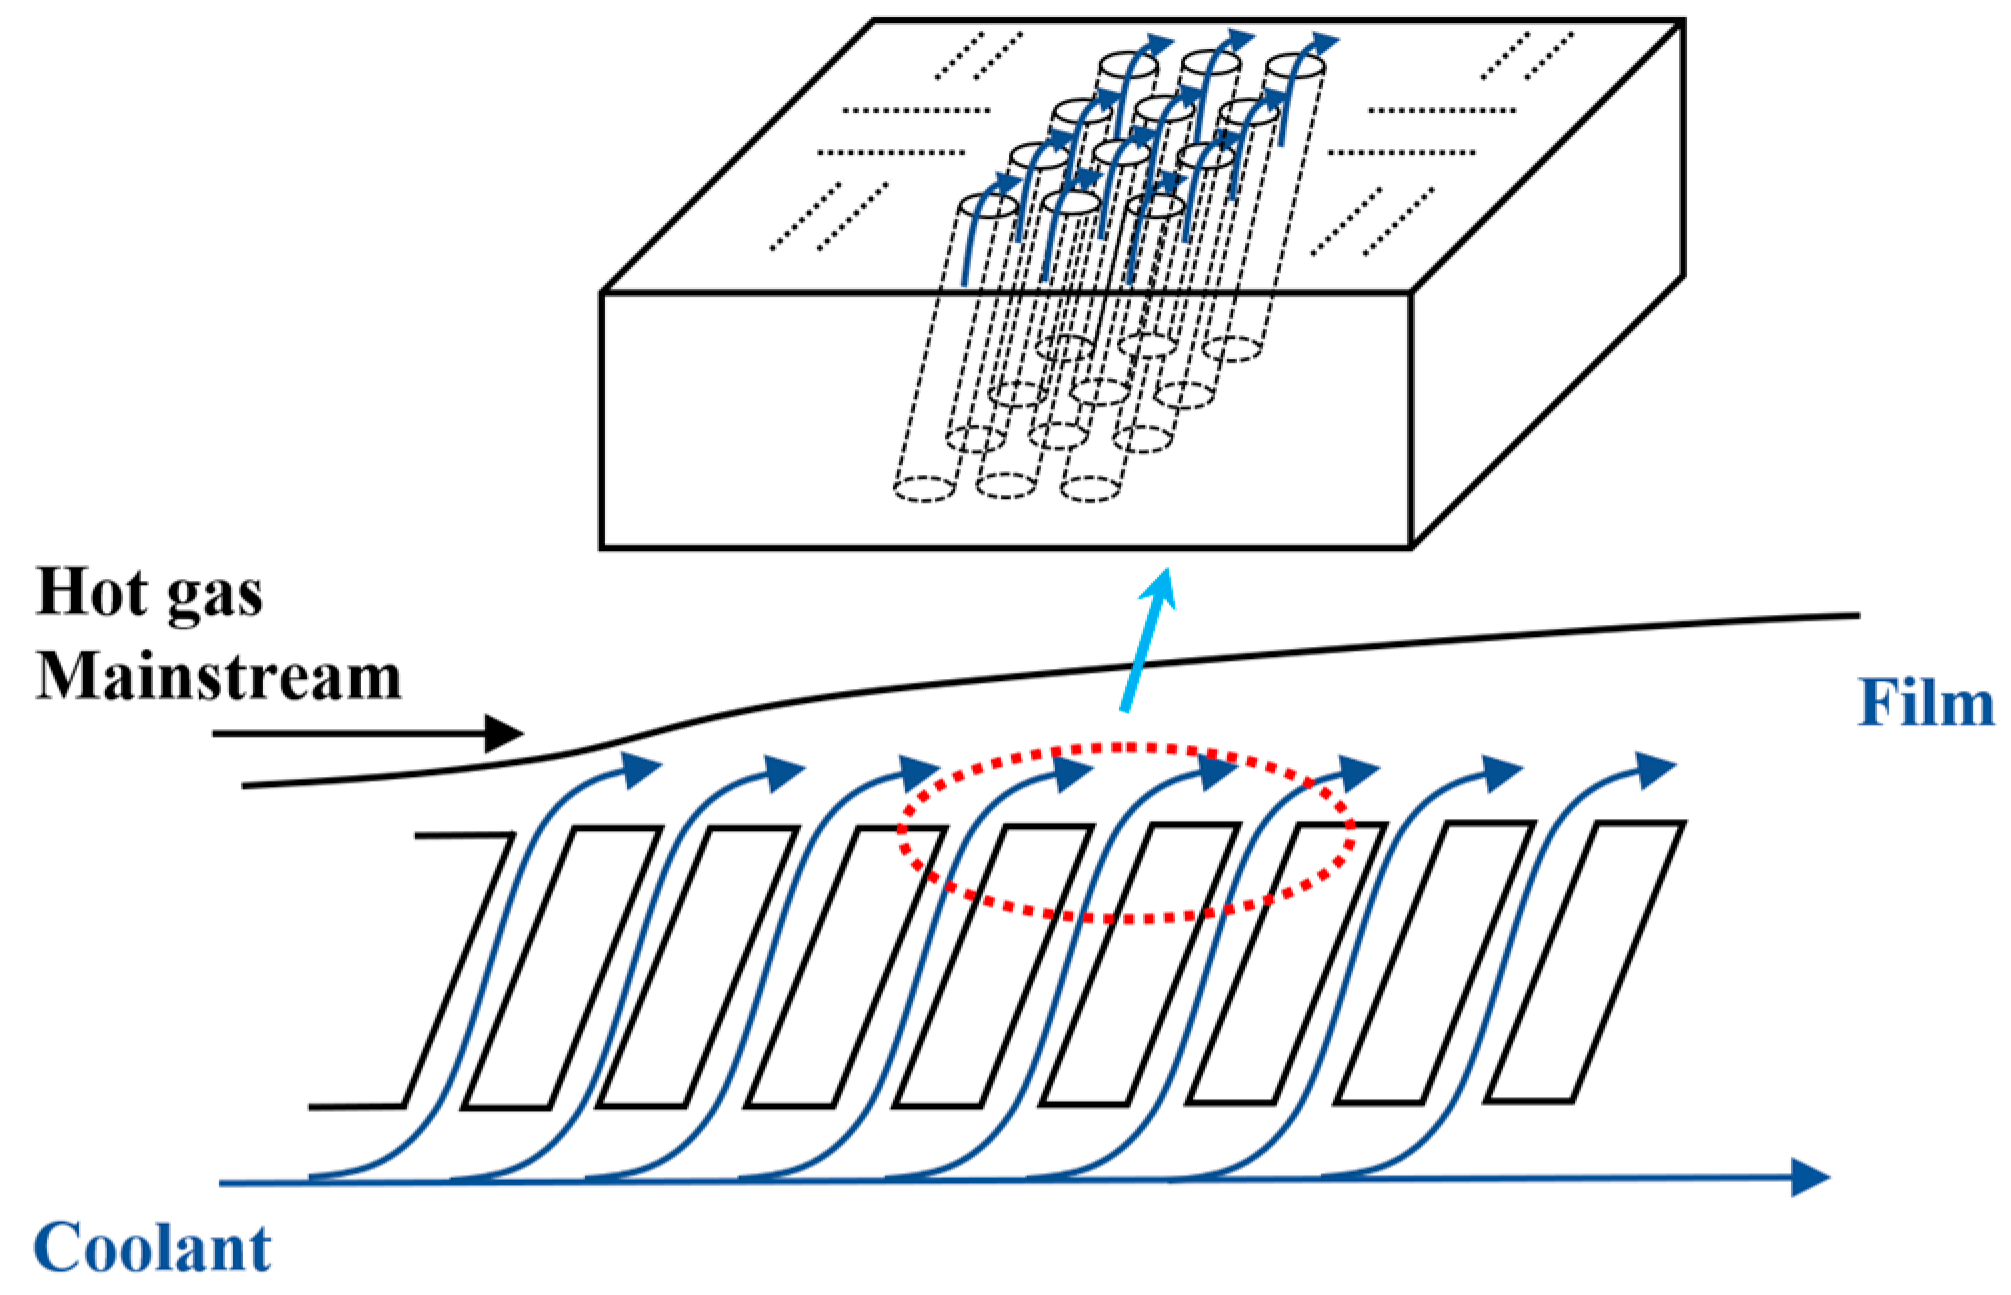
Figure 1. The schematic diagram of effusion cooling.
Applsci 15 09778 g001
Figure 2. Computational domain.
Applsci 15 09778 g002
Figure 3. Geometric parameters and corresponding setting.
Applsci 15 09778 g003
Figure 4. Mesh details.
Applsci 15 09778 g004
Figure 5. Turbulence model validation: lateral averaged cooling effectiveness of the cylindrical film cooling at Br = 0.5 [39,40,41,42].
Applsci 15 09778 g005
Figure 6. Grid independence study: the η ¯ comparisons downstream of the porous structure.
Applsci 15 09778 g006
Figure 7. Comparison of the bottom surface η (a) and the η ¯ (b) downstream of the mainstream at different porosities that range from 10% to 50%, corresponding to Cases A1 to A5, respectively (Br = 0.3%, H = 10D, Rt = 1.3, and the material is steel).
Applsci 15 09778 g007
Figure 8. Velocity distribution in the middle cross-section at different porosities that range from 10% to 50%, corresponding to Cases A1 to A5, respectively (Br = 0.3%, H = 10D, Rt = 1.3, and the material is steel).
Applsci 15 09778 g008
Figure 9. The θ distribution on the periodic interface of the porous structure at different porosities that range from 10% to 50%, corresponding to Cases A1 to A5, respectively (Br = 0.3%, H = 10D, Rt = 1.3, and the material is steel).
Applsci 15 09778 g009
Figure 10. Comparison of the bottom surface η (a) and the η ¯ (b) at different blowing ratios that range from 0.1% to 0.5%, corresponding to Cases B1 to B5, respectively (φ = 30%, H = 10D, Rt = 1.3, and the material is steel).
Applsci 15 09778 g010
Figure 11. Velocity distribution in the middle cross-section at different blowing ratios that range from 0.1% to 0.5%, corresponding to Cases B1 to B5, respectively (φ = 30%, H = 10D, Rt = 1.3, and the material is steel).
Applsci 15 09778 g011
Figure 12. The θ distribution on the periodic interface of the porous structure at different blowing ratios (φ = 30%, H = 10D, Rt = 1.3, and the material is steel).
Applsci 15 09778 g012
Figure 13. Comparison of the bottom surface η (a) and the η ¯ (b) downstream of the mainstream at 9 different porous structure heights that range from 6D to 14D, corresponding to Cases C1 to C5, respectively (φ = 30%, Br = 0.3%, Rt = 1.3, and the material is steel).
Applsci 15 09778 g013
Figure 14. The θ distribution on the periodic interface of the porous structure at different porous structure heights (φ = 30%, Br = 0.3%, Rt = 1.3, and the material is steel).
Applsci 15 09778 g014
Figure 15. Comparison of the bottom surface η (a) and the η ¯ (b) downstream of the mainstream at different thermal conductivities of the porous structure material that includes titanium (7.44 W/(m·K)), steel (16.27 W/(m·K)), nickel (91.74 W/(m·K)), aluminum (202.4 W/(m·K)), and copper (387.6 W/(m·K)), corresponding to Cases E1 to E5, respectively.
Applsci 15 09778 g015
Figure 16. The θ distribution on the periodic interface of the porous structure at different thermal conductivities of the porous structure material that includes titanium (7.44 W/(m·K)), steel (16.27 W/(m·K)), nickel (91.74 W/(m·K)), aluminum (202.4 W/(m·K)) and copper (387.6 W/(m·K)) correspond to Case E1 to E5 respectively.
Applsci 15 09778 g016
Figure 17. Comparison of the bottom surface η (a) and the η ¯ (b) downstream of the mainstream at different ratios of the mainstream temperature to the coolant temperature that range from 1.3 to 5, corresponding to Cases F1 to F5, respectively (φ = 30%, Br = 0.3%, H = 10D, and the material is steel).
Applsci 15 09778 g017
Figure 18. Q-criterion vorticity contour for Case F1.
Applsci 15 09778 g018
Table 1. All cases and related parameters set.
Case NameφBrHMaterial, λRt
A110%0.3%10DSteel, 16.27 W/(m·K)1.3
A220%
A330%
A440%
A550%
B130%0.1%10DSteel, 16.27 W/(m·K)1.3
B20.2%
B30.3%
B40.4%
B50.5%
C130%0.3%6DSteel, 16.27 W/(m·K)1.3
C28D
C310D
C412D
C514D
E130%0.3%10DTitanium, 7.44 W/(m·K)1.3
E2Steel, 16.27 W/(m·K)
E3Nickel, 91.74 W/(m·K)
E4Aluminum, 202.4 W/(m·K)
E5Copper, 387.6 W/(m·K)
F1φ = 30%0.3%10DSteel, 16.27 W/(m·K)1.3
F22
F33
F44
F55
Table 2. The averaged cooling effectiveness of the porous surface under various cases.
CaseφBrHMaterial, λRt η ˙
A110%0.3%10DSteel, 16.27 W/(m·K)1.30.7948708
A220%0.8473646
A330%0.8472585
A440%0.8370339
A550%0.8281744
B130%0.1%10DSteel, 16.27 W/(m·K)1.30.6036934
B20.2%0.7765922
B30.3%0.8472585
B40.4%0.8831263
B50.5%0.9037894
C130%0.3%6DSteel, 16.27 W/(m·K)1.30.8241882
C28D0.8377439
C310D0.8472585
C412D0.8528423
C514D0.8573566
E130%0.3%10DTi, 7.44 W/(m·K)1.30.8363346
E2Steel, 16.27 W/(m·K)0.8472585
E3Ni, 91.74 W/(m·K)0.8557141
E4Al, 202.4 W/(m·K)0.8567652
E5Cu, 387.6 W/(m·K)0.8571849
F130%0.3%10DSteel, 16.27 W/(m·K)1.30.8472585
F220.82963384
F330.81644962
F440.80892233
F550.80399101
Table 3. Formula validation.
CaseφBrHλ, W/(m·K)Rt η ˙ Formula (7)Error
G10.250.0151616.273.330.693203530.6909647790.323%
G20.250.0416297.734.670.87427780.8644003421.13%
G30.250.0359297.732.670.84964290.8444281950.614%
G40.30.01510297.731.670.707583620.706018030.221%
G50.450.031616.2750.81072240.7970011941.69%
Disclaimer/Publisher’s Note: The statements, opinions and data contained in all publications are solely those of the individual author(s) and contributor(s) and not of MDPI and/or the editor(s). MDPI and/or the editor(s) disclaim responsibility for any injury to people or property resulting from any ideas, methods, instructions or products referred to in the content.