Article

The Impact of the Cooling System on the Thermal Management of an Electric Bus Battery

by
Piotr Miś
*,
Katarzyna Miś
and
Aleksandra Waszczuk-Młyńska
Faculty of Automotive and Construction Machinery Engineering, Warsaw University of Technology, Street 84 Ludwika Narbutta, 02-524 Warsaw, Poland
*
Author to whom correspondence should be addressed.
Appl. Sci. 2025, 15(17), 9776; https://doi.org/10.3390/app15179776
Submission received: 21 July 2025 / Revised: 28 August 2025 / Accepted: 2 September 2025 / Published: 5 September 2025
(This article belongs to the Section Transportation and Future Mobility)

Abstract

This paper presents a thermal study of a lithium-ion traction battery with different cooling configurations during simulated city driving and high-power charging. Four liquid cooling configurations—single or triple plates with straight or U-shaped tubes—were evaluated using finite element models in the Q-Bat Toolbox for MATLAB. Simulations were conducted using the Worldwide Harmonized Light Vehicles Test Cycle (WLTC) and a high-current charging profile based on the CHAdeMO standard (up to 400 A). The results indicate that while cooling is not strictly necessary under typical driving conditions, it significantly improves thermal stability and reduces peak temperatures. The best configuration reduced peak cell temperatures by 1.96% during driving and by 16% during fast charging. The cooling system also minimized temperature gradients within the battery, reducing the risk of degradation. Box-plot analysis confirmed that an efficient cooling system stabilizes the temperature distribution and smooths out extreme values. The results highlight the importance of thermal management for extending battery life and ensuring safe operation, particularly during fast charging conditions.

1. Introduction

In recent years, electric vehicles have gained popularity due to their zero emissions at the point of use, unlike combustion engine vehicles. An increasing number of new models are emerging, including new vehicle classes. Initially limited to passenger cars, electric vehicles now include buses, trucks, delivery vans, and smaller vehicles like scooters, bicycles, and e-scooters. This trend creates a growing demand for adequate energy storage systems. These systems must store sufficient energy and provide relatively long driving ranges to remain competitive with conventional vehicles. This imposes a requirement on battery manufacturers to develop devices that meet consumer expectations and ensure long service life and safe usage.
Battery capacity depends on the operating temperature. Many studies highlight the importance of proper thermal management to achieve the desired efficiency. Already in 2011, the authors of study [1] critically described the issues related to the operating temperature of lithium-ion batteries. They concluded that such batteries should operate within a temperature range of −10 °C to 50 °C, and the battery management system should ensure a uniform temperature distribution across the cells. That same year, other authors [2] discussed the development of electric vehicles and their energy storage systems, focusing on thermal behavior and comparing various thermal management techniques. Over time, researchers have paid increasing attention to temperature control, which led to the development of battery modeling techniques and advanced cooling systems.
Modeling requires the adoption of clearly defined physical and mathematical assumptions. For example, numerical or analytical analysis [3] often assumes constant boundary conditions and linear material dependencies. Such simplifications reduce the complexity of calculations, but they can cause differences between the simulation and the observed phenomenon. Model verification is crucial and involves, for example, comparing the results of numerical calculations with experimental data obtained from measurements under controlled laboratory conditions or in situ studies. Therefore, it is worth considering works [4,5] where the authors presented mathematical models for various battery types and validated them experimentally. A well-designed model supports optimal parameter management. Other battery modeling examples include [6]—FEM (finite element method) modeling, [7]—iterative-approximation methods, and [8]—multidomain modeling.
A cooling system is a crucial component of traction batteries because of maintaining a safe temperature range for operation. Battery cooling methods can be divided into active and passive systems according to works [9,10,11,12]. Active cooling requires external energy. Examples of active cooling include liquid cooling, forced air cooling, or thermoelectric cooling. Passive cooling includes phase change materials (PCM) and natural convection systems without mechanical components. Cooling systems are constantly being developed in order to improve their efficiency. In refs. [9,13,14], the authors discuss ideas for improving liquid cooling efficiency by appropriately modeling channels in the cooling plate. Refs. [9,13] propose specially designed microchannels that improve heat dissipation. The ref. [14] described the concept of a cooling plate in which the liquid cooling channels are arranged in a honeycomb pattern. Another noteworthy study [15] proposed two-phase cooling using latent heat from boiling coolant to enhance heat dissipation.
Modern cooling systems often combine methods to leverage their advantages. Many studies focus on combining PCM with liquid cooling [16,17,18,19]. PCM plates placed between cells enhance thermal distribution and water cooling performance. Hybrid approaches also include connecting liquid cooling with air [20] or thermoelectric systems [21]. An interesting development direction in battery cooling is the concept of immersing cells in a dielectric [12,22]. Immersion in a dielectric increases the heat transfer rate, which translates into increased cooling efficiency and maintaining stable thermal conditions for a longer period of time.
An efficient cooling system is essential for safe battery operation. A critical scenario is constant current charging, where significant heat is generated. Fast charging is crucial for electric vehicle usability and is becoming competitive with refueling conventional vehicles. However, high-current charging quickly heats the battery, accelerating degradation and reducing nominal capacity [23]. Therefore, the issue of fast charging has received much attention, as can be read in the review papers [24,25,26].
In the context of electric vehicles, not only energy storage but also recovery and conversion are important. Study [27] proposed converting the kinetic energy of a membrane into electricity. Such innovations may enhance energy efficiency and energy management in the future.
The aim of this study was to conduct thermal simulations of an EV traction battery using various liquid cooling configurations. The work demonstrates changes in battery and cooling system temperature under the influence of a current profile. This work uses the Worldwide Harmonized Light Vehicles Test Cycle [28] to generate the current profile. This approach differs from the cited works. Section 2 presents the main assumptions, theoretical introduction, and battery modeling methodology. Section 3 presents the simulation results, while Section 4 and Section 5 summarize the research.

2. Materials and Methods

This study used parameters of a sample lithium-ion battery made with NMC (nickel–manganese–cobalt) technology. During discharge, lithium ions move from the negative anode to the positive cathode through an organic electrolyte. The anode is made of graphite, while the cathode contains nickel, manganese, and cobalt. The proportions of these elements are varied to emphasize the desired properties: nickel provides high specific energy, and manganese allows spinel structure formation for low internal resistance. This type of battery is suited for high-energy intake and long discharge periods, making it ideal for urban buses. Table 1 presents the technical specifications of the battery used in this study.

2.1. Cell Modeling

The battery was modeled in Matlab (version R2021A) using the Q-Bat (version 0.3.2) toolbox by Quickersim [29]. Q-Bat models objects based on input mechanical and electrical parameters. It employs the Finite Element Method (FEM) to generate temperature field distributions on and within the battery throughout the simulation steps. This helps identify the places where the cells heat up the most and the cooler areas.
Q-Bat represents battery cells as solids with fixed thermal conductivity [30]. The temperature gradient drives heat flux across the cell. The toolbox uses two core models: electrical and thermal [30]. Transient capacitive effects are modeled using an RC equivalent circuit [30], shown in Figure 1.
The equations describing the transient state result from Kirchhoff’s First Law:
U = U O C V I · R o U 1 ,
I = U 1 R 1 + C 1 · d U 1 d t ,
where:
  • U—total cell voltage [V];
  • I—cell current [A];
  • UOCV—open circuit voltage [V];
  • U1—voltage drop on the RC pair [V];
  • I1—resistor R1 current [A];
  • R0, R1—resistance [Ω];
  • C1—capacity [C].
The heat generated in the cell—Joule’s heat—is calculated using the formula below [30]:
P = I 2 · R 0 + I 1 2 · R 1 ,
where:
  • P—heat generated in the cell per unit of time [W].
Heat Q is transferred by thermal conduction inside the cell and is described in differential form according to Fourier’s heat law [31]:
Q t = λ S T · d S
where:
  • Q—heat [ J ];
  • t—time [ s ];
  • λ—thermal conductivity coefficient W m · K ;
  • S—the surface area through which heat transfer occurs [ m 2 ];
  • T—local temperature gradient K m .
The Q-bat program [30] assumes that heat conduction occurs through a thin wall perpendicular to its surface. Then, Equation (4) becomes:
Q t = λ S d T d x .
For steady heat flow, Equation (5) can be simplified to [30]:
q = λ · T ,
where:
  • q—local heat flux density W m 2 ,
  • T—local temperature gradient K m .
The Q-bat program supports anisotropic heat conduction. The user can specify values along three directions. Table 2 shows the values of physical parameters that had to be provided for the tests.

2.2. Cooling System Modeling

The battery was modeled from 4 modules, each containing 6 cells. The cooling system was also modeled in four configurations:
  • A single cooling plate with a straight pipe underneath the battery.
  • Three single cooling plates with straight pipes surrounding three sides.
  • A single cooling plate with a U-shaped pipe underneath.
  • Three single cooling plates with U-shaped pipes surrounding three sides.
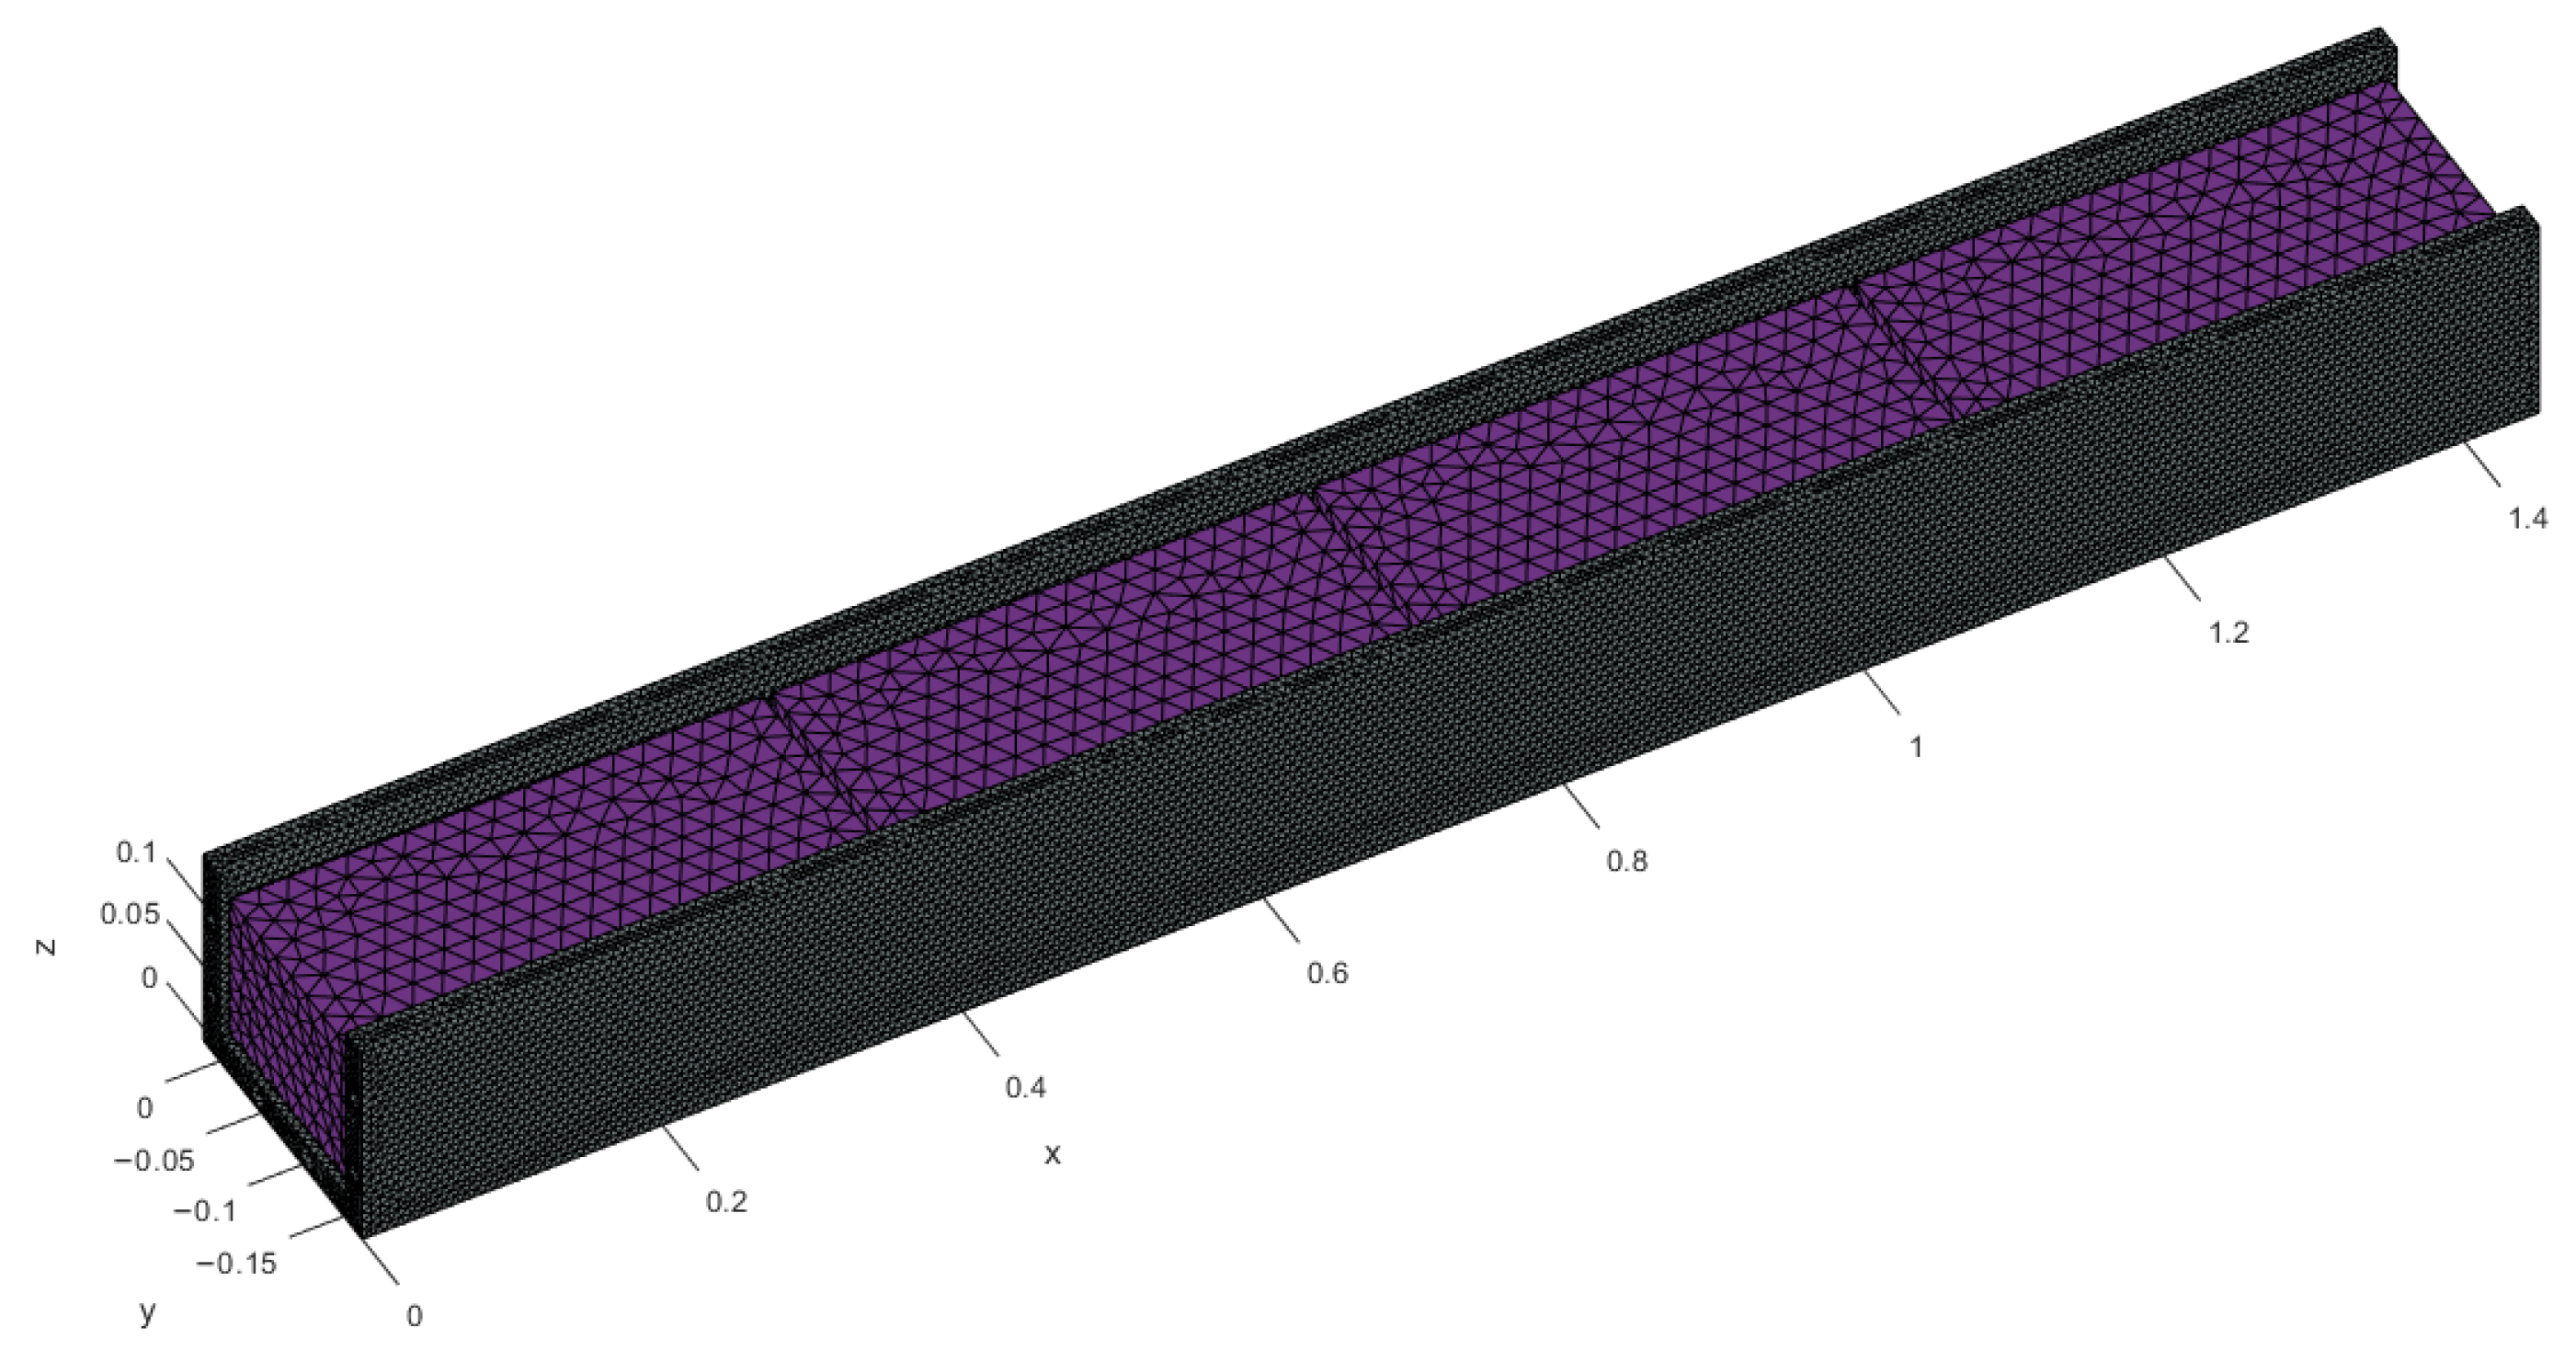
Figure 2 shows the battery model with a cooling system of three plates.
The cooling plate is modeled as a solid with an embedded pipe carrying a cooling fluid. Pipe wall thickness is neglected. Heat transfer within the plate is governed by thermal conduction according to Equation (6). Fluid flow is modeled as one-dimensional. The simulations assume that the medium was injected into the pipes at a given mass flow rate and a given initial temperature.
The heat between the liquid and the cooling tube is transferred by forced convection, quantified by the described equation [30]:
q = α · T ,
where:
  • α—heat transfer coefficient W m 2 K ,
  • ΔT—the difference between the temperature of the wall and the surrounding fluid [K].
The heat transfer coefficient can be determined from the formula [30]:
α = N u · λ d   ,
where:
  • Nu—Nusselt number;
  • λ—thermal conductivity coefficient W m · K ;
  • d—diameter pipe [ m ].
The Nusselt number indicates whether conduction or convection dominates in heat transfer. It can be calculated using the Reynolds number [32]:
  • For Reynolds number Re < 2000, the Nusselt number should be calculated from Michiejew’s equation for laminar flows:
N u = 0.15 · R e 0.33 · P r f 0.43 · P r f P r w 0.25 · E L ,
  • For Reynolds number 2000 < Re < 10,000, the Nusselt number should be calculated from Michiejew’s equation for transitional flows:
N u = K 0 · P r f 0.43 · P r f P r w 0.25 ,
  • For Reynolds number Re > 10,000, the Nusselt number should be calculated from Sieder and Tate’s equation for turbulent flows:
N u = 0.023 · R e 0.8 · P r f 0.33 · P r f P r w 0.14 ,
where:
  • Prf—Prandtl number for fluid;
  • Prw—Prandtl number for wall;
  • EL—correction depending on the ratio of the pipe length to its diameter;
  • K0—correction factor based on the Reynolds number.
Table 3 shows the physical parameters adopted for the cooling plate and the coolant. The coolant is a mixture of water and glycol.

2.3. Current Profiles

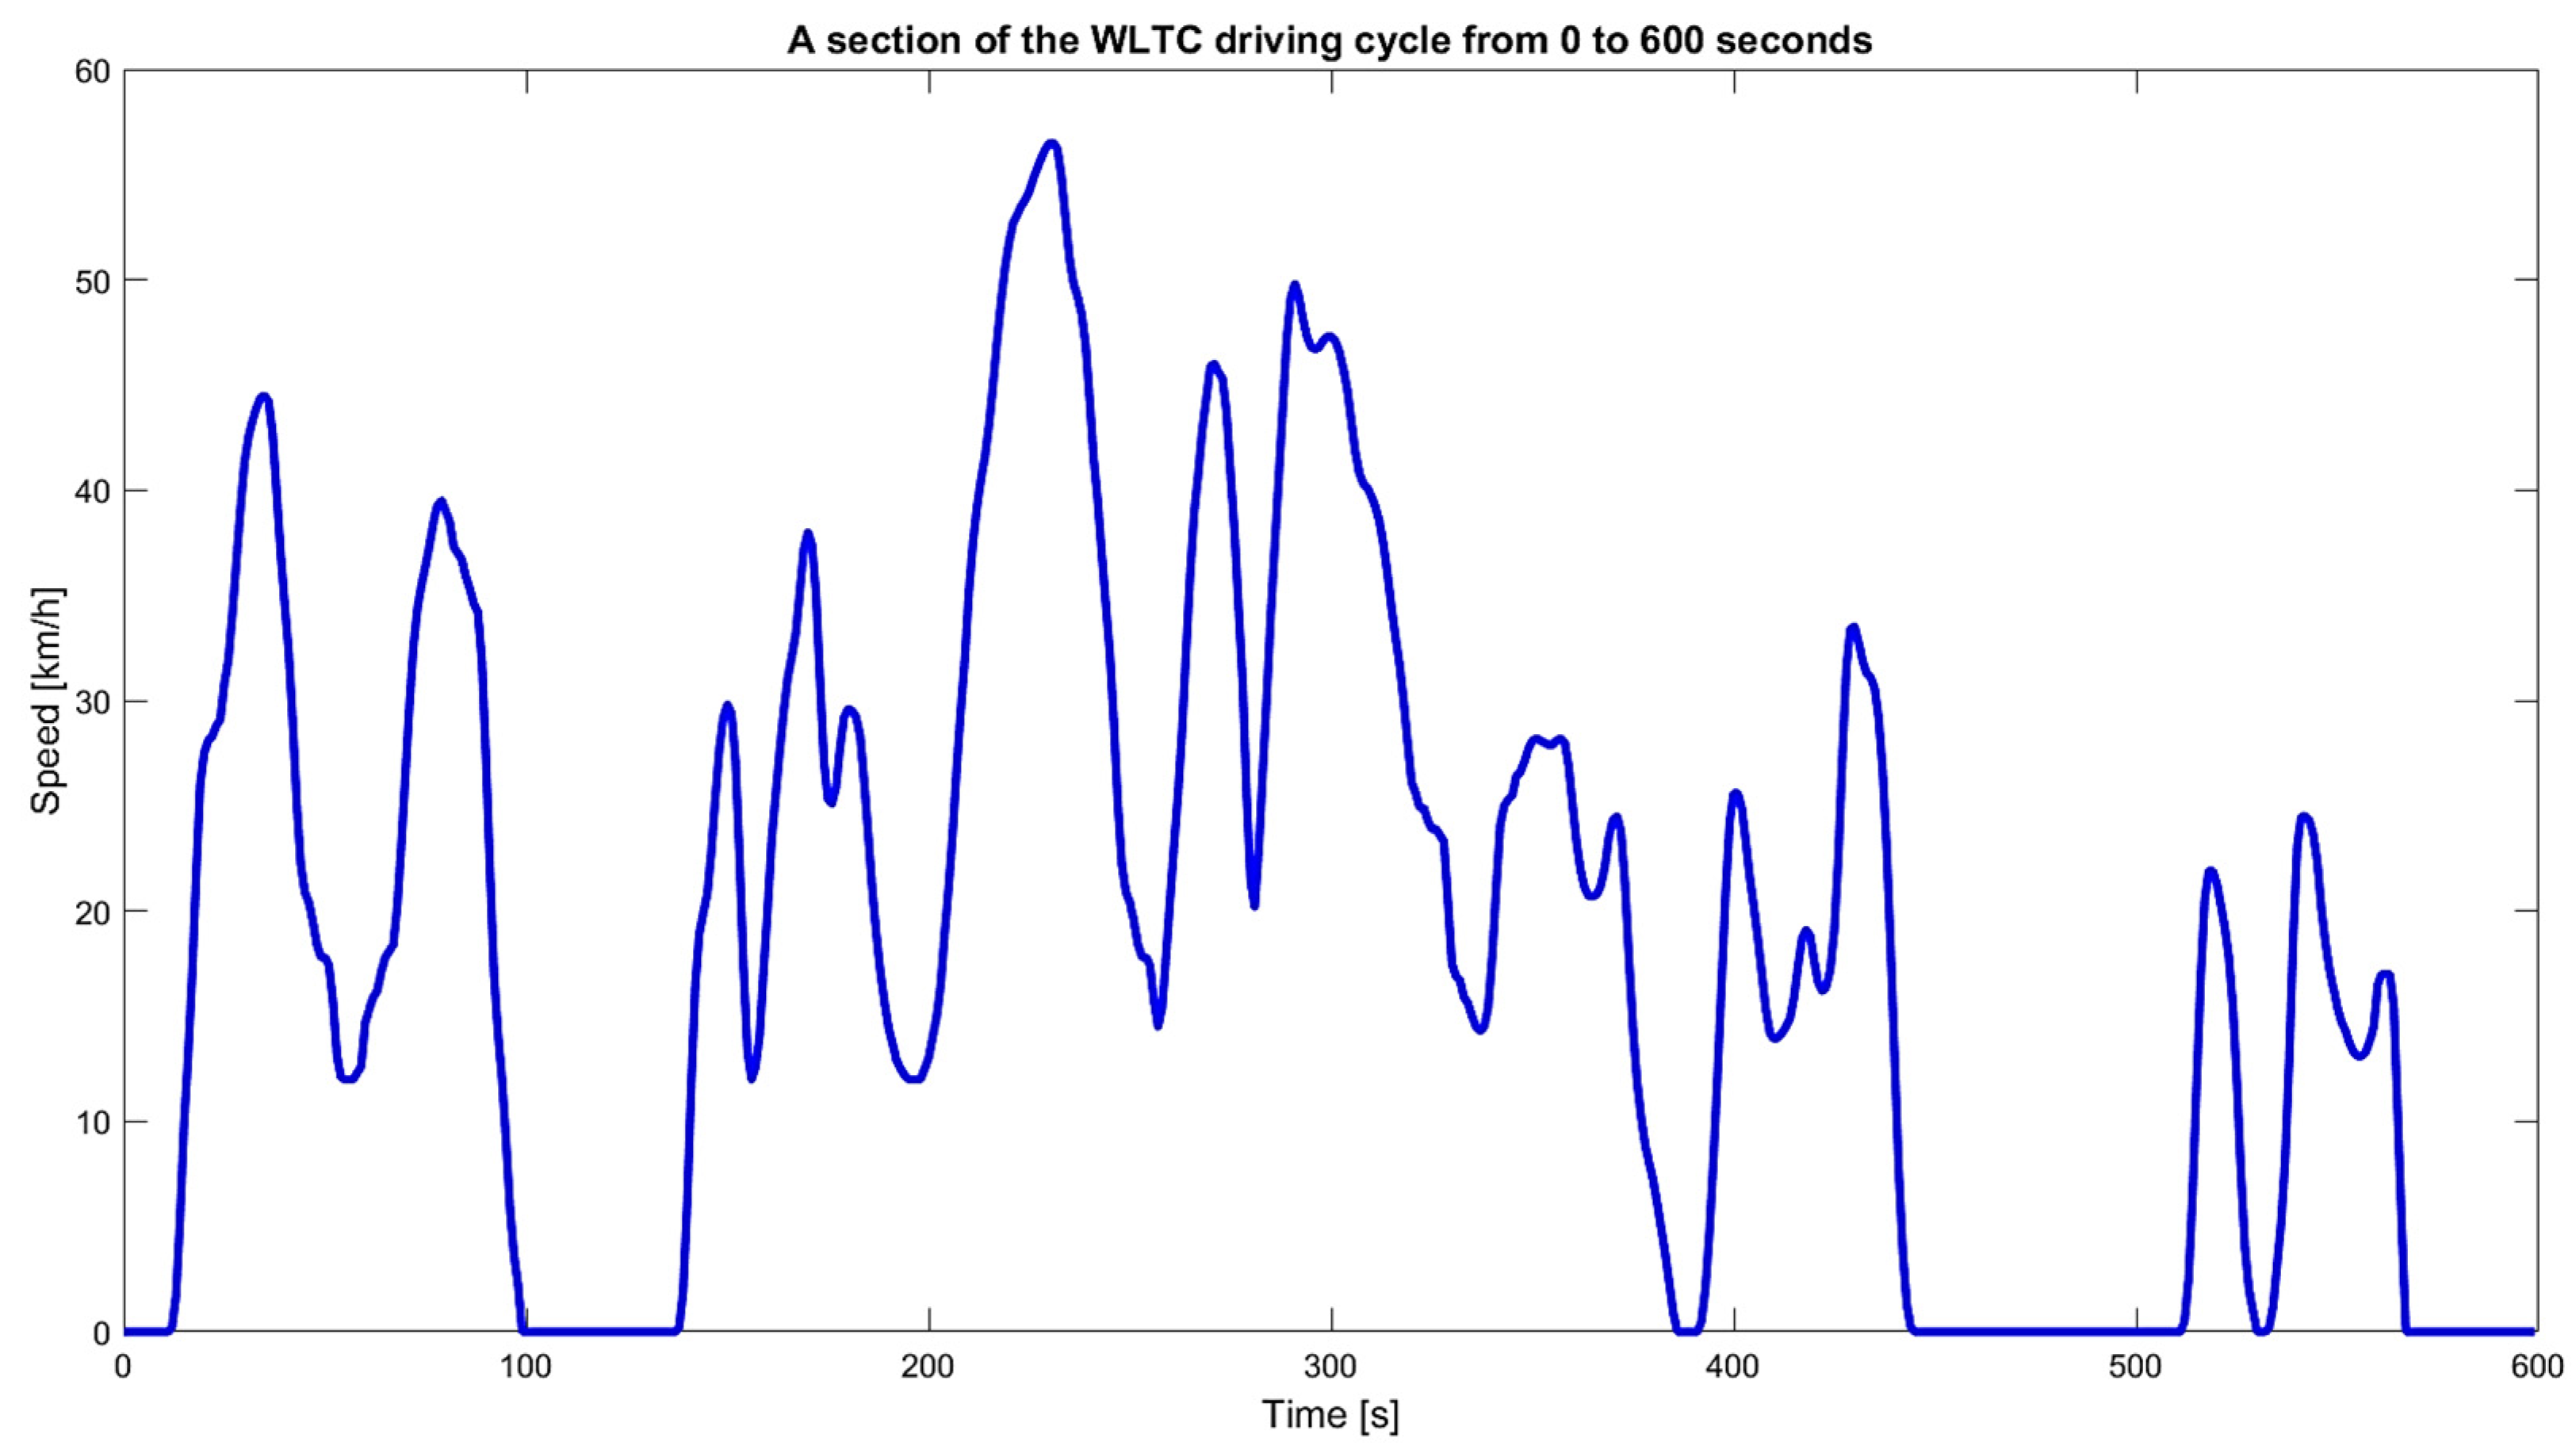
The presented equations and assumptions are the foundation of the Q-bat software and allow for thermal analysis of the battery after modeling the test objects. To perform the study, a current profile is applied, and thermal and electrical parameters are tracked over time. To standardize the test results, the current load for the battery was generated based on the Worldwide Harmonized Light Vehicles Test Cycle (WLTC) [28]. This is the standardized driving cycle used to certify new vehicles sold in the European Union and calculate vehicle emissions. The WLTC cycle determines the vehicle’s speed at a given time. The WLTC cycle is performed in a laboratory and allows for testing conventional, hybrid, and electric vehicles. Figure 3 shows a fragment of the WLTC cycle.
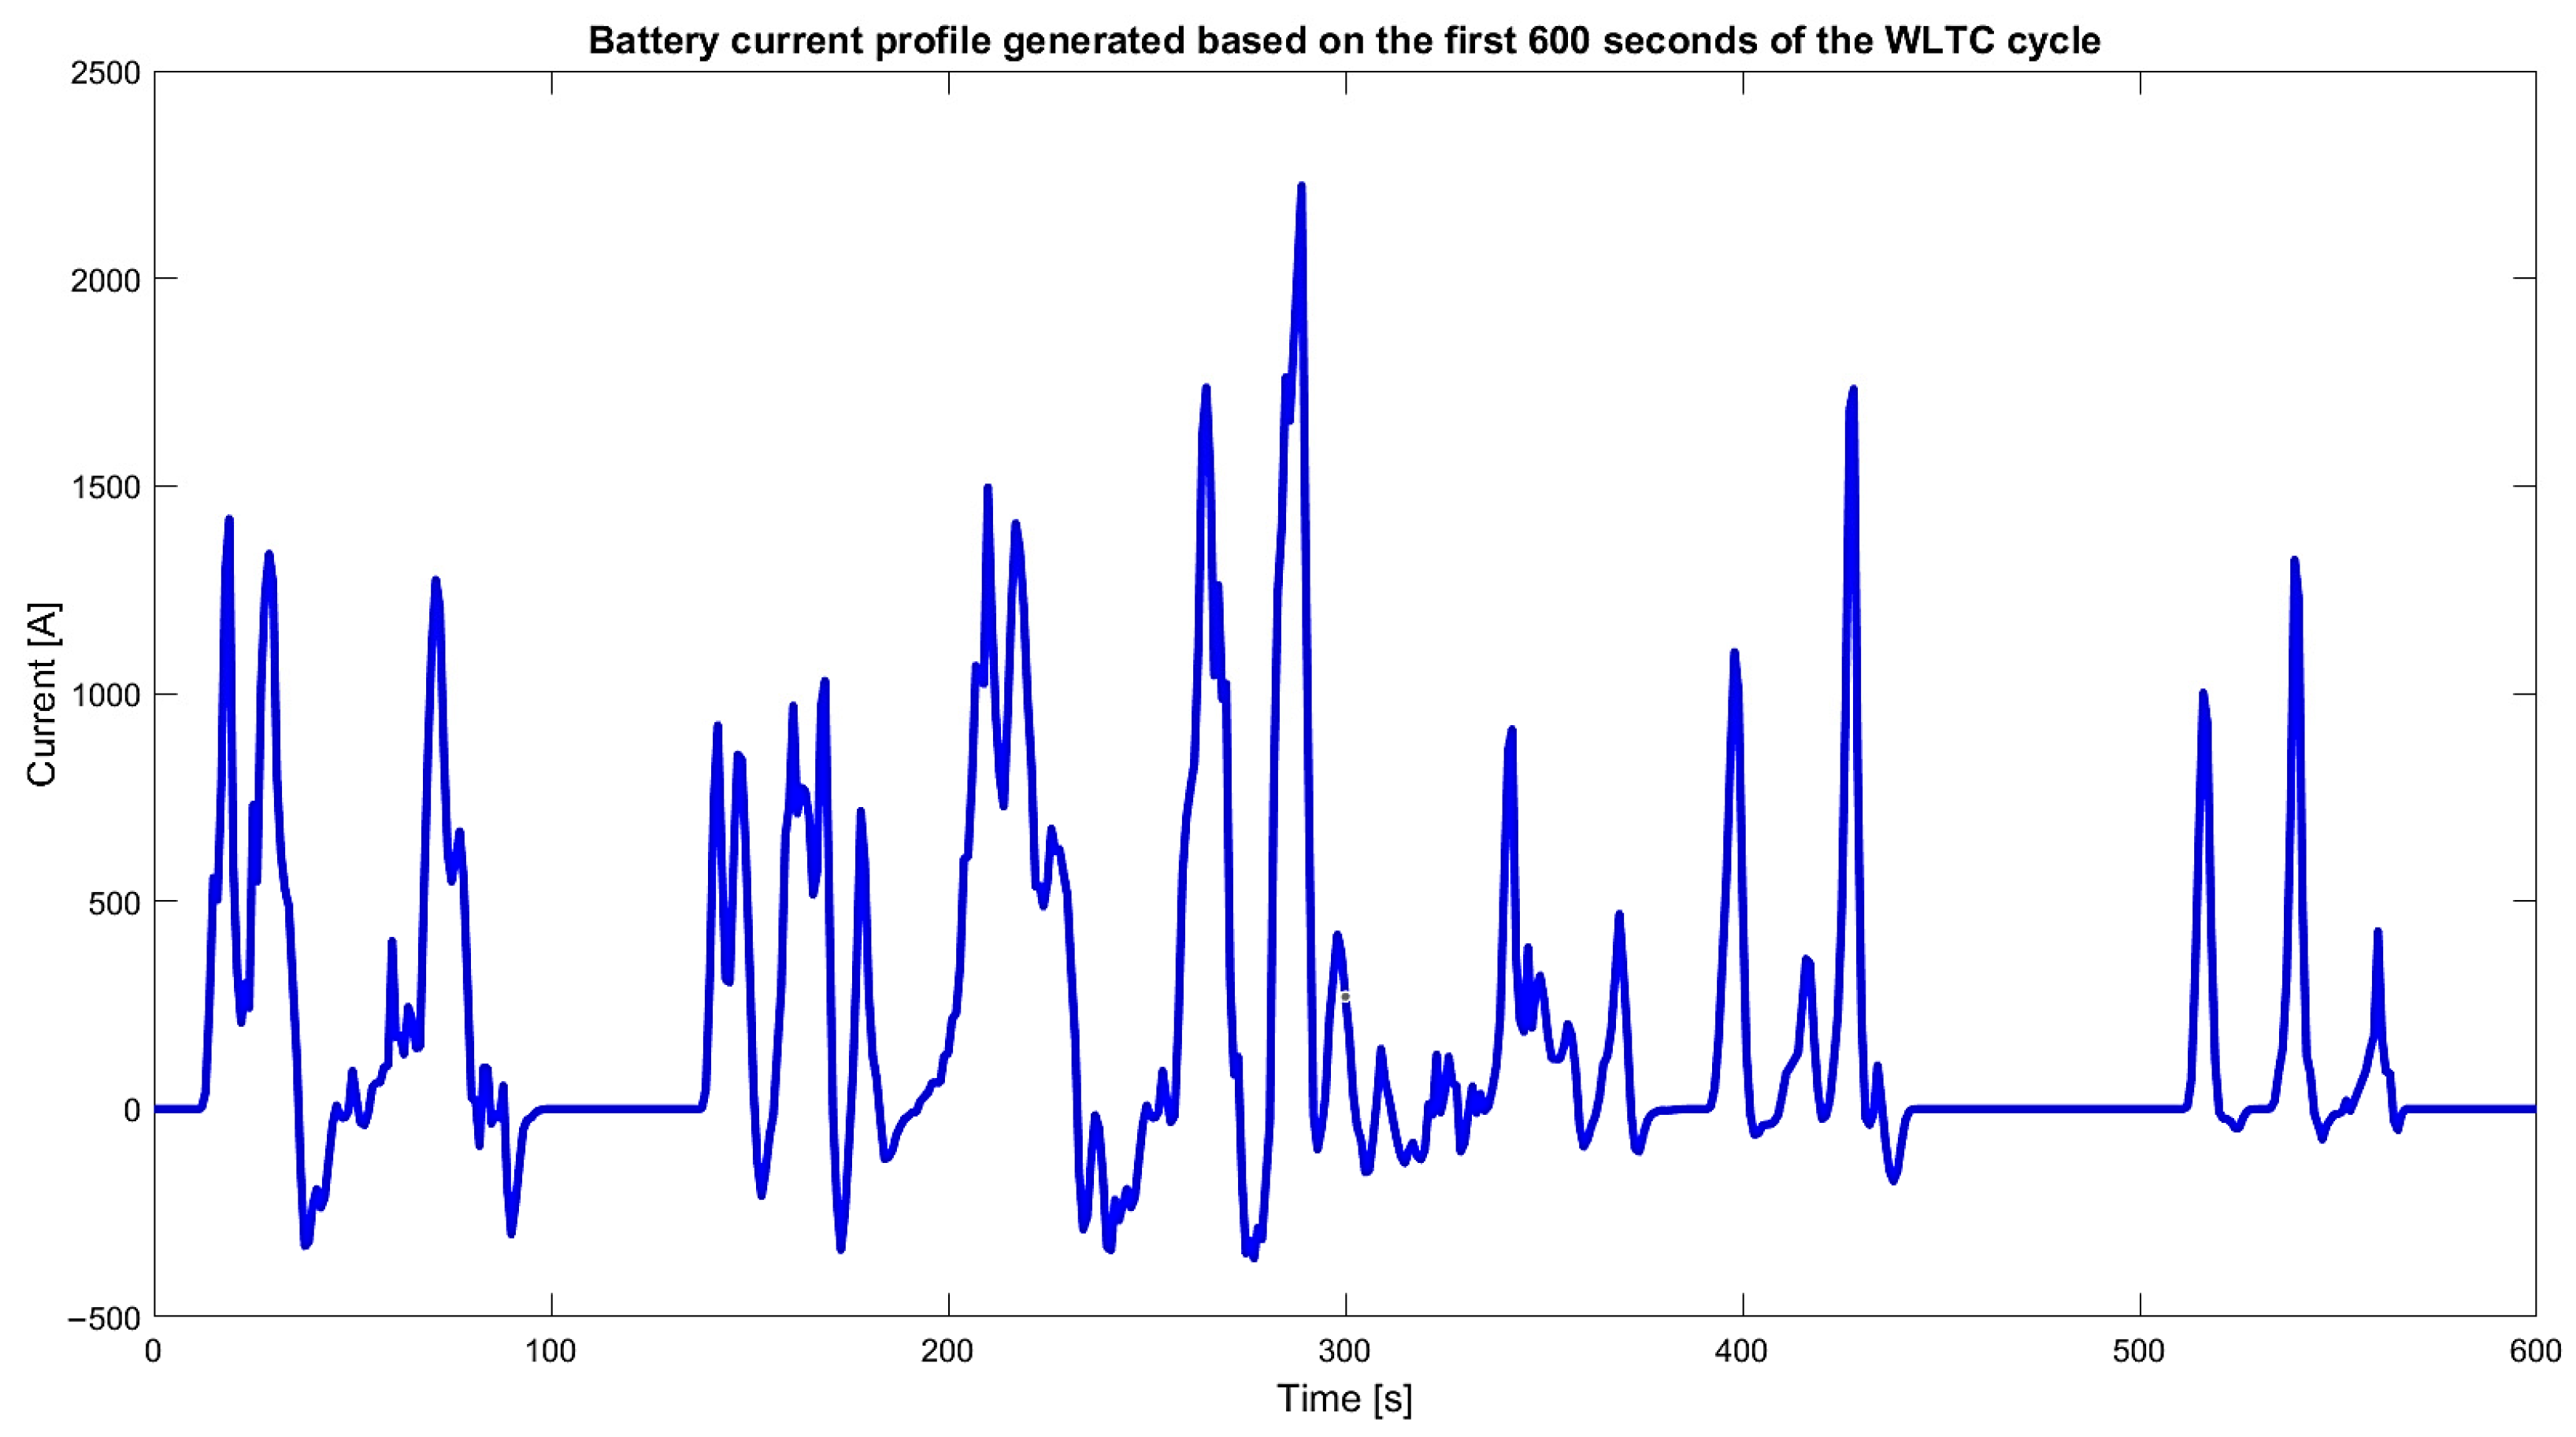
Figure 4 presents the current profile generated for the first 600 s of the WLTC cycle using an electric bus model created in Matlab. The WLTC cycle defines the speed at which a given vehicle is to travel. Knowing the vehicle’s technical parameters, its power requirements can be calculated. The next step is to use the traction battery parameters to calculate the required current. This method was used to determine the charging profile in Figure 4.
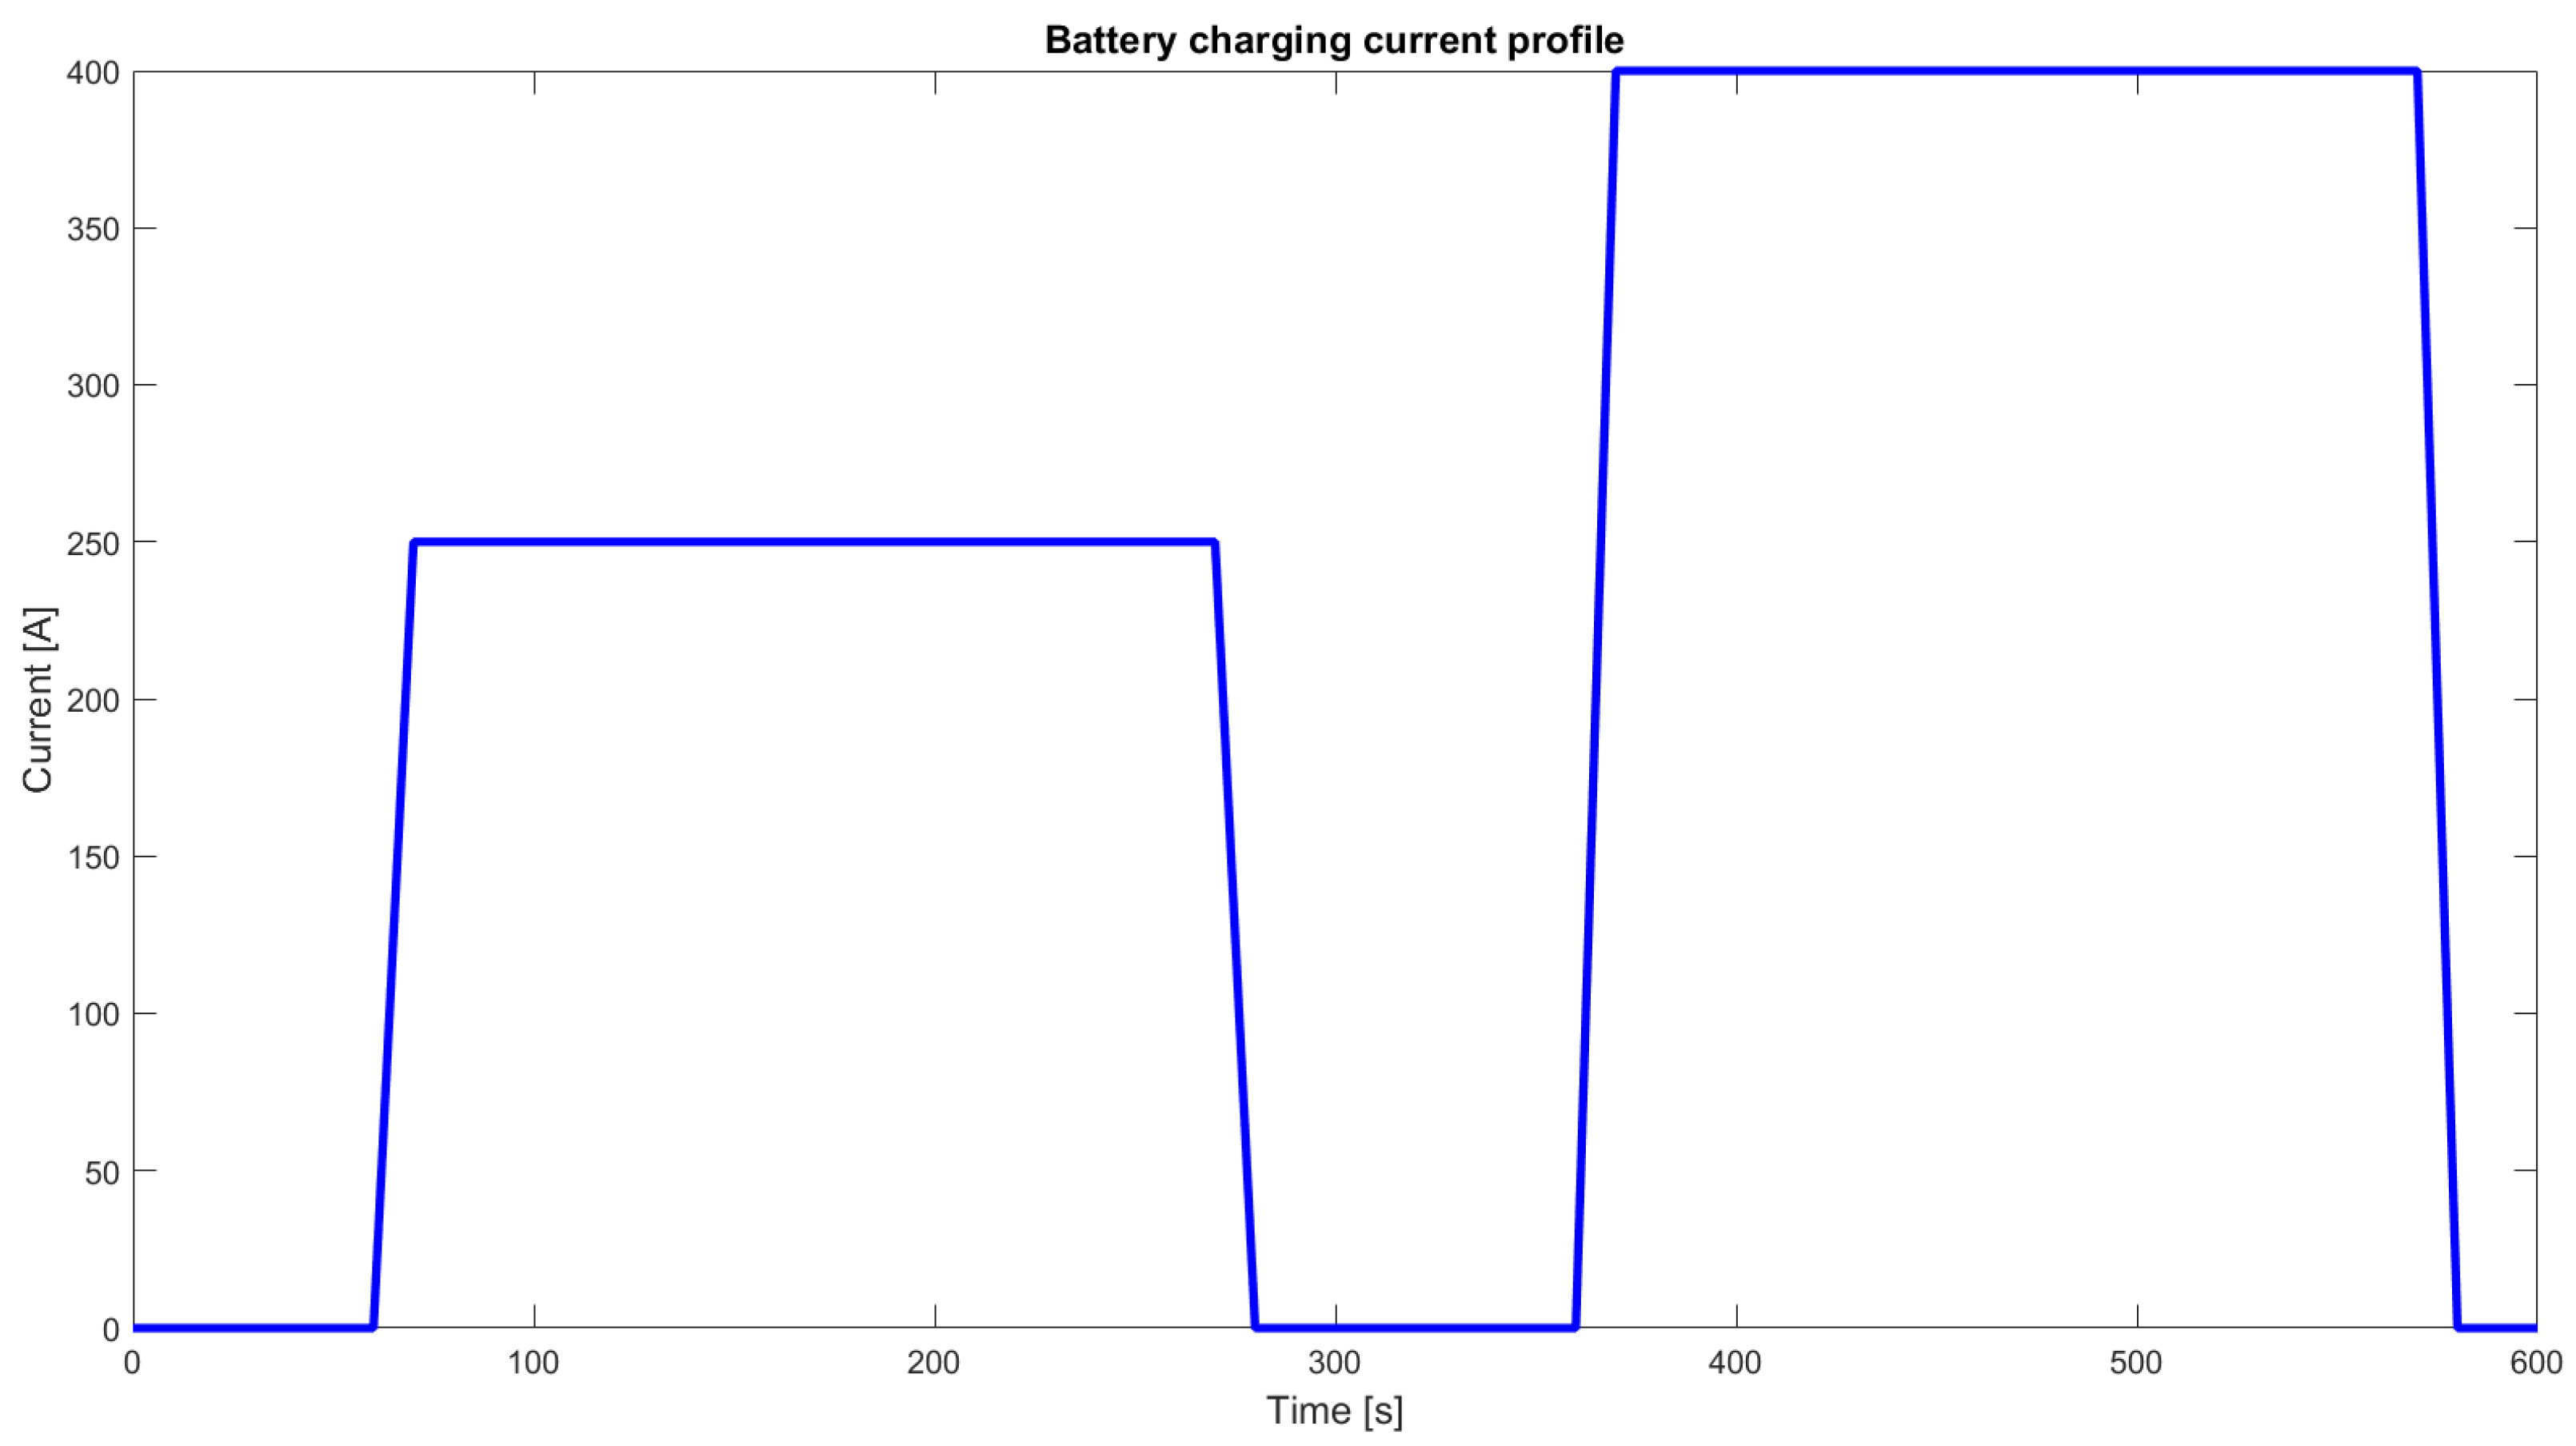
Additionally, thermal simulations were conducted for high-DC current charging, simulating real-world fast-charging scenarios. This profile is shown in Figure 5. The presented current profile lasts 10 min and is not sufficient to charge the battery. However, it is sufficient to test the battery’s thermal response to applied current loads, first 250 A and then 400 A. The bigger peak current was based on the CHAdeMO fast-charging standard [33], which allows for DC charging up to 400 A.

3. Results

3.1. Current Profile Based on WLTC Cycle

The results of simulation tests for the current profile from Figure 4 are presented in the summary Table 4. This current profile is based on the first 600 s of the WLTC cycle.
To build the model, 24 cells were used. Each cell was modeled using the finite element method. Therefore, each cell consisted of a number of elements, for which temperature values were calculated at a given simulation time point. The mean minimum/maximum temperature is the arithmetic mean of the minimum/maximum temperatures determined in the cell at a given time point. Table 4 was calculated for the last time point (at the end of the simulation).
Based on the obtained data, the mean values of the maximum and minimum temperatures for all 24 cells were calculated. For each of these temperatures, a confidence interval at the 95% significance level was also determined using the standard confidence interval formula [34]:
X ¯ t 1 α 2 ,   n 1 S n 1 < μ < X ¯ + t 1 α 2 , n 1 S n 1   ,
where:
  • X ¯ —mean value;
  • t 1 α 2 ,   n 1 —quantile of Student’s t-distribution;
  • S —standard deviation;
  • 1 α = 95 % —adopted significance level;
  • n = 24 —number of cells.
In the presented simulation, it was assumed that the coolant is injected by the pump in accordance with the mass flow rate from Table 3 (0.2   k g s ). At the starting point of the simulation, the battery and cooling system had a temperature of 20 °C. The mass flow rate was constant for each case. Additionally, it was assumed that the fluid, after leaving the cooling plate pipes, is conducted to the cooler, which is to lower the coolant temperature to 10 °C. The fluid temperature was measured at the outlet of the cooling plate pipe.
The purpose of this study was to compare the effectiveness of different battery cooling system configurations. Table 4 includes average initial and final cell temperatures with 95% confidence intervals and cooling fluid temperatures for each configuration. The results show that under normal driving conditions, the battery does not overheat and operates around 20 °C. This is a very safe operating temperature for the battery. Figure 6, Figure 7, Figure 8 and Figure 9 show the temperature distributions in the battery and cooling plates for four cases of the cooling system.
The data in Table 4 indicate that the configuration of a single plate with a single pipe reduced the average minimum and maximum temperatures by 0.78 °C (3.9%) and 0.19 °C (0.94%), respectively. Figure 6 shows that battery and plate edge temperatures hover around 19.5 °C. Only areas near the cooling pipe are significantly cooler.
The average minimum and maximum temperatures were reduced by 0.97 °C (4.83%) and 0.38 °C (1.89%), respectively, in the case of a single plate with a U-shaped pipe. These results are better than for the single pipe because this cooling plate provides a larger surface area for heat transfer between the coolant and the battery. The larger cooling surface is also visible when comparing the temperature distributions in Figure 6b and Figure 7b. The cooling plate with a U-shaped pipe exhibits a large area with a lower temperature relative to the battery temperature, approximately 16 °C.
The simulation results presented in Table 4 show that tripling the number of cooling plates with a single pipe reduced the average minimum and maximum temperatures by 0.86 °C (4.6%) and 0.14 °C (0.59%), respectively. Compared to the first case with a single cooling plate (Figure 6), the minimum temperature was reduced more significantly. However, the maximum battery temperature increased by 0.05 degrees Celsius compared to the single-tube cooling case. This temperature increase is very small and will not impact battery performance. Compared to the cooling plate with a U-shaped pipe, this system was less effective, suggesting that simply increasing the number of straight pipes is not as beneficial as optimizing the pipe shape.
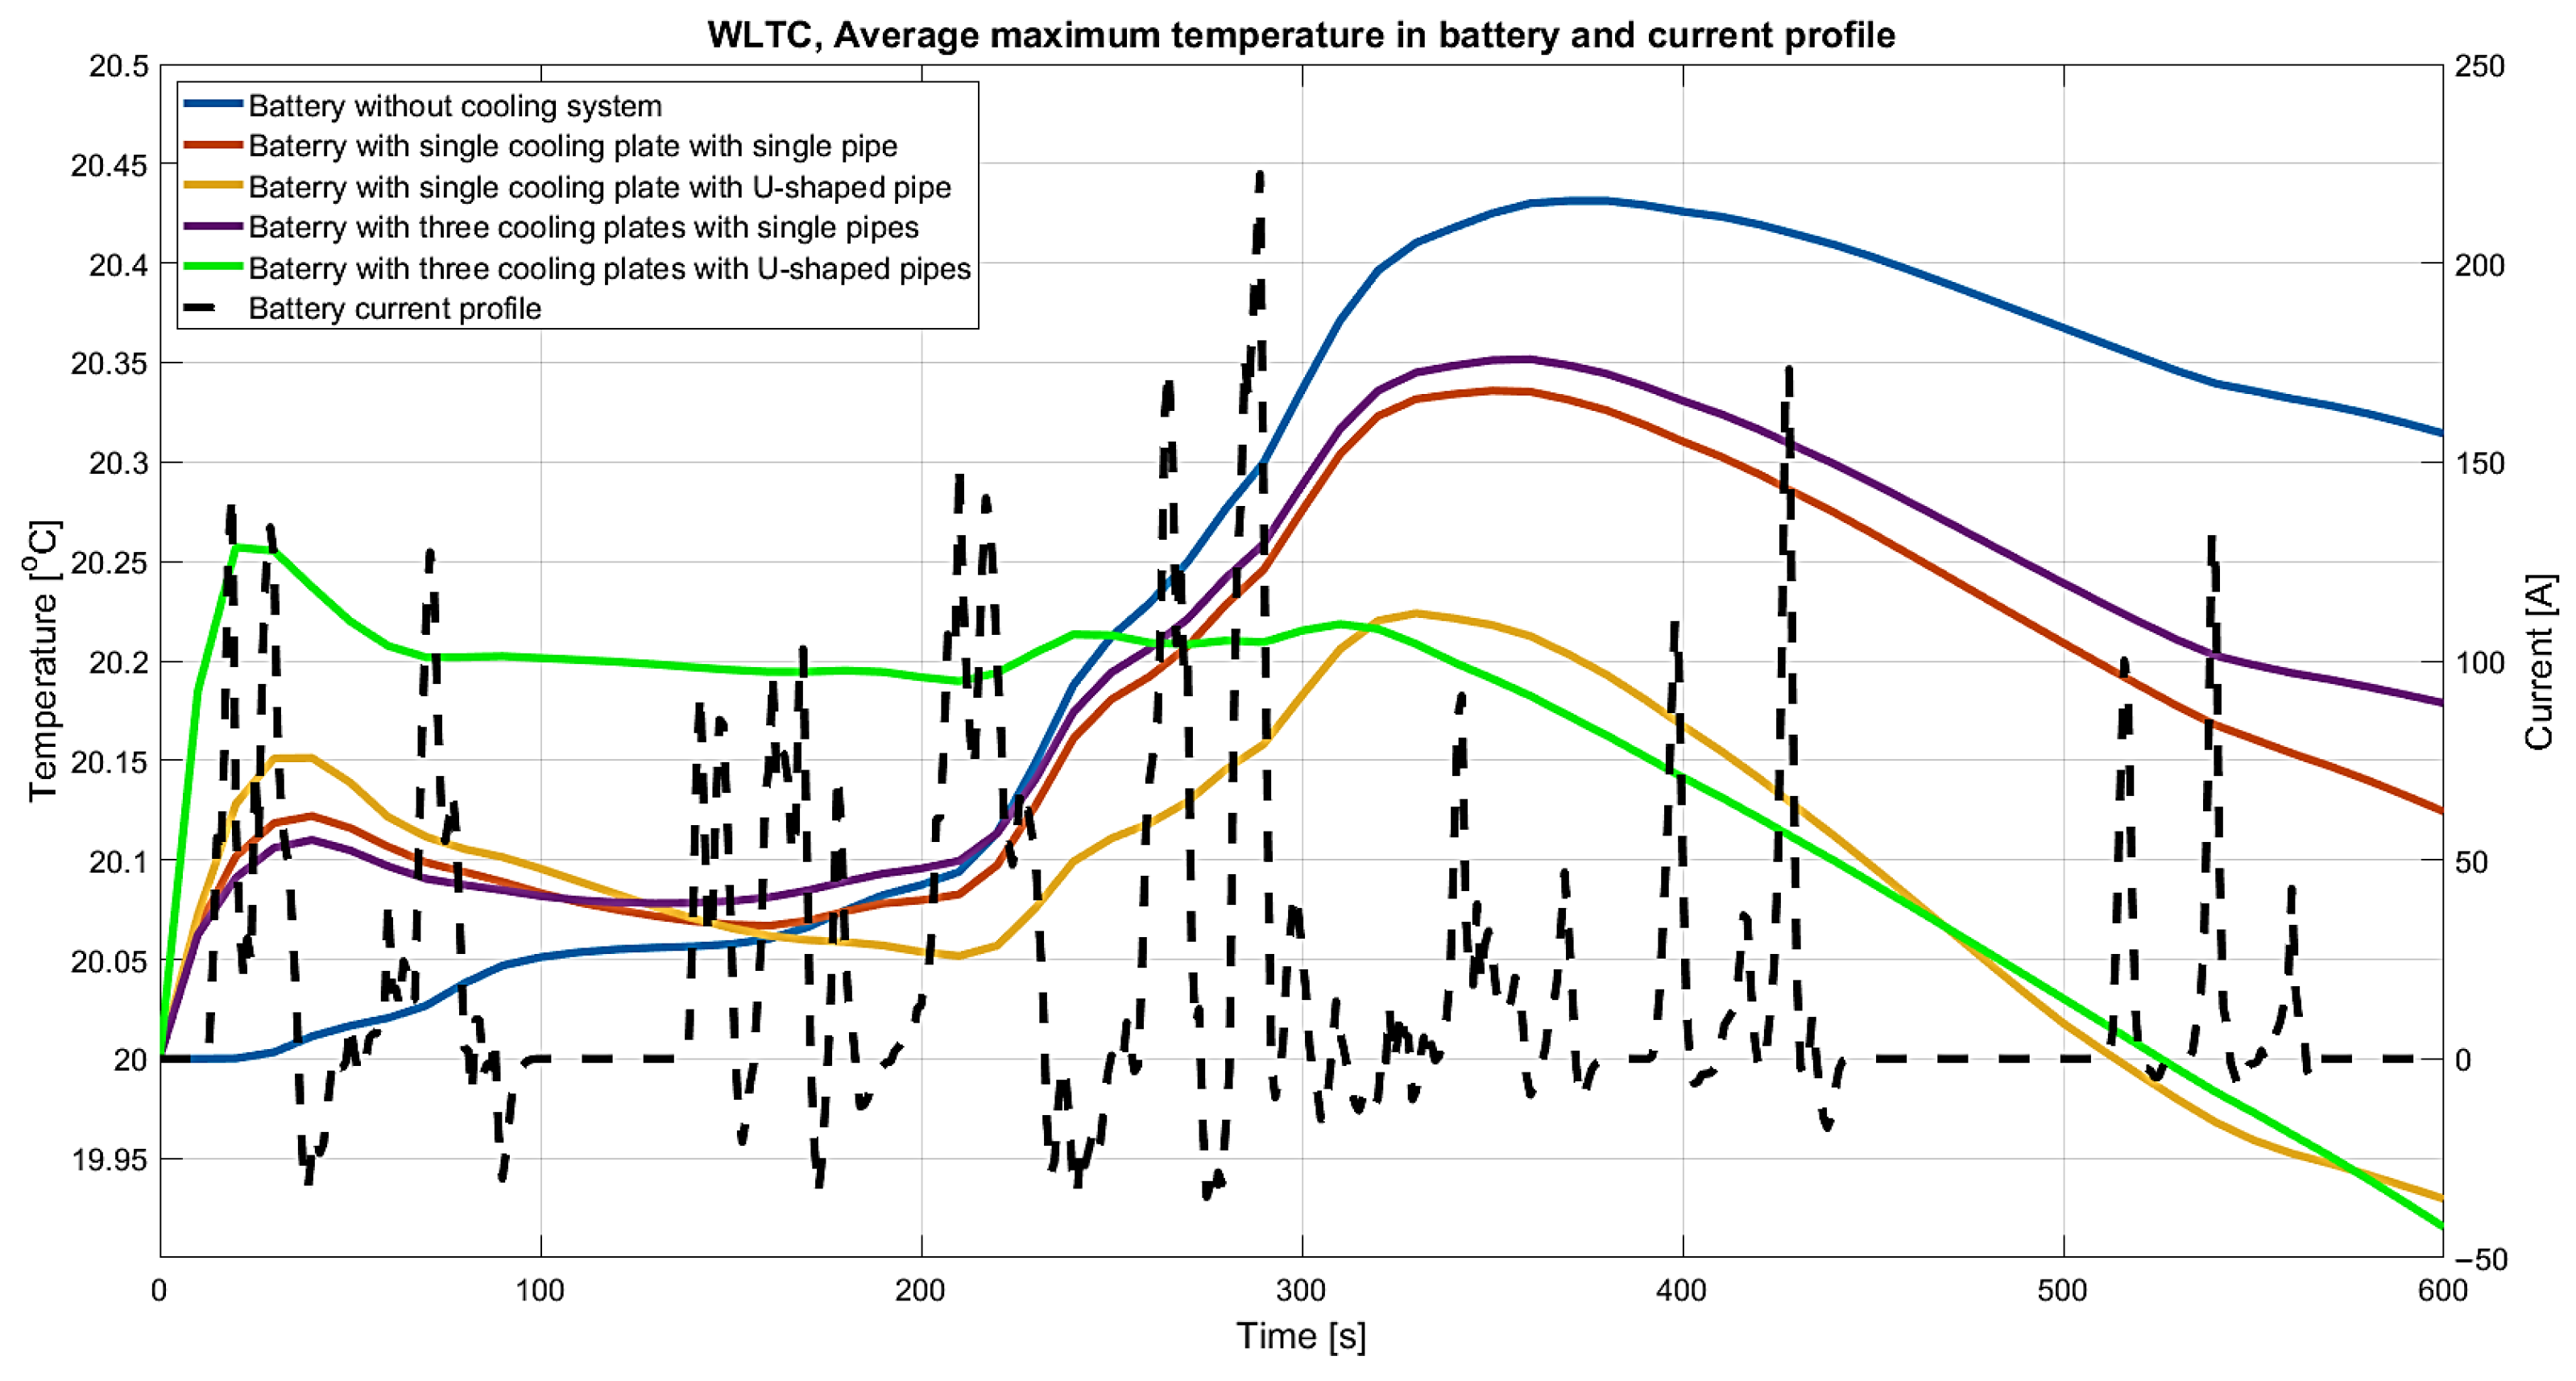
The best mean temperature reduction was achieved by tripling the cooling plates with U-shaped pipes. The data in Table 4 indicate that the average minimum and maximum temperatures were reduced by 1.41 °C (7.01%) and 0.40 °C (1.96%), respectively. The 3D temperature distribution in Figure 9 shows that these plates remained below 19 °C in most of their volume because of the increased effective cooling surface area. The average maximum battery operating temperature curves were compared to further illustrate the differences between the cooling cases. This comparison is presented in Figure 10.
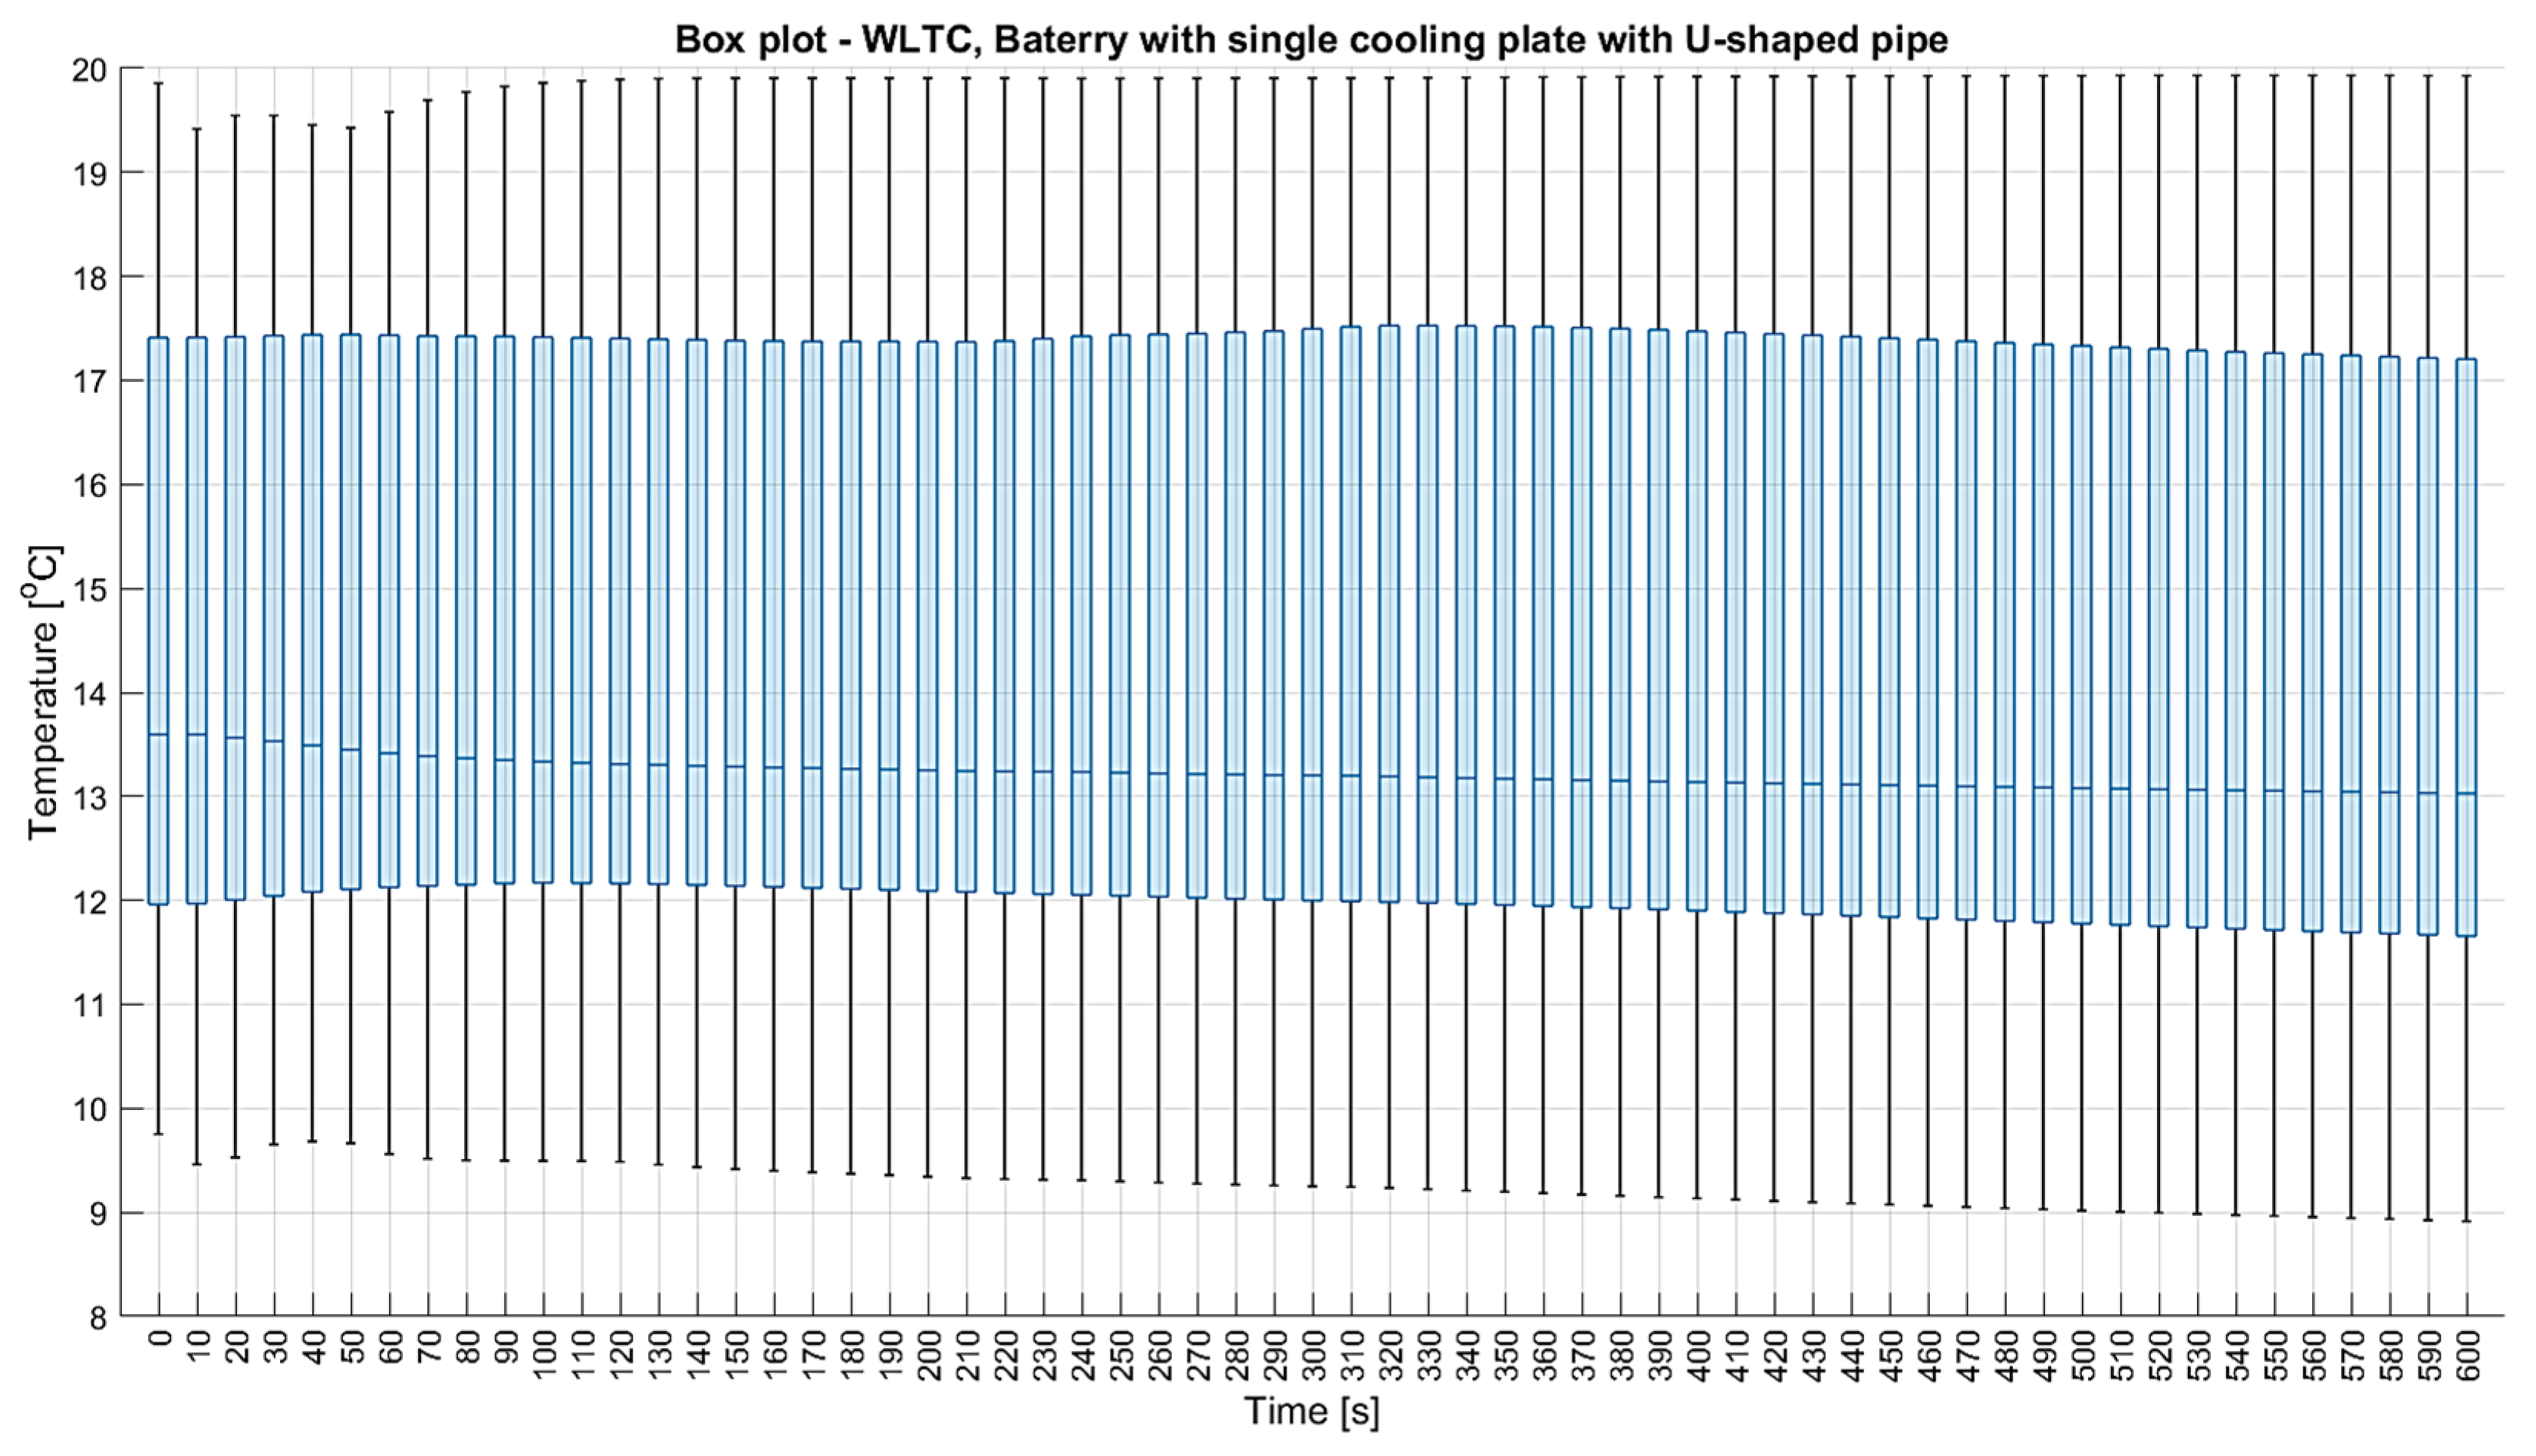
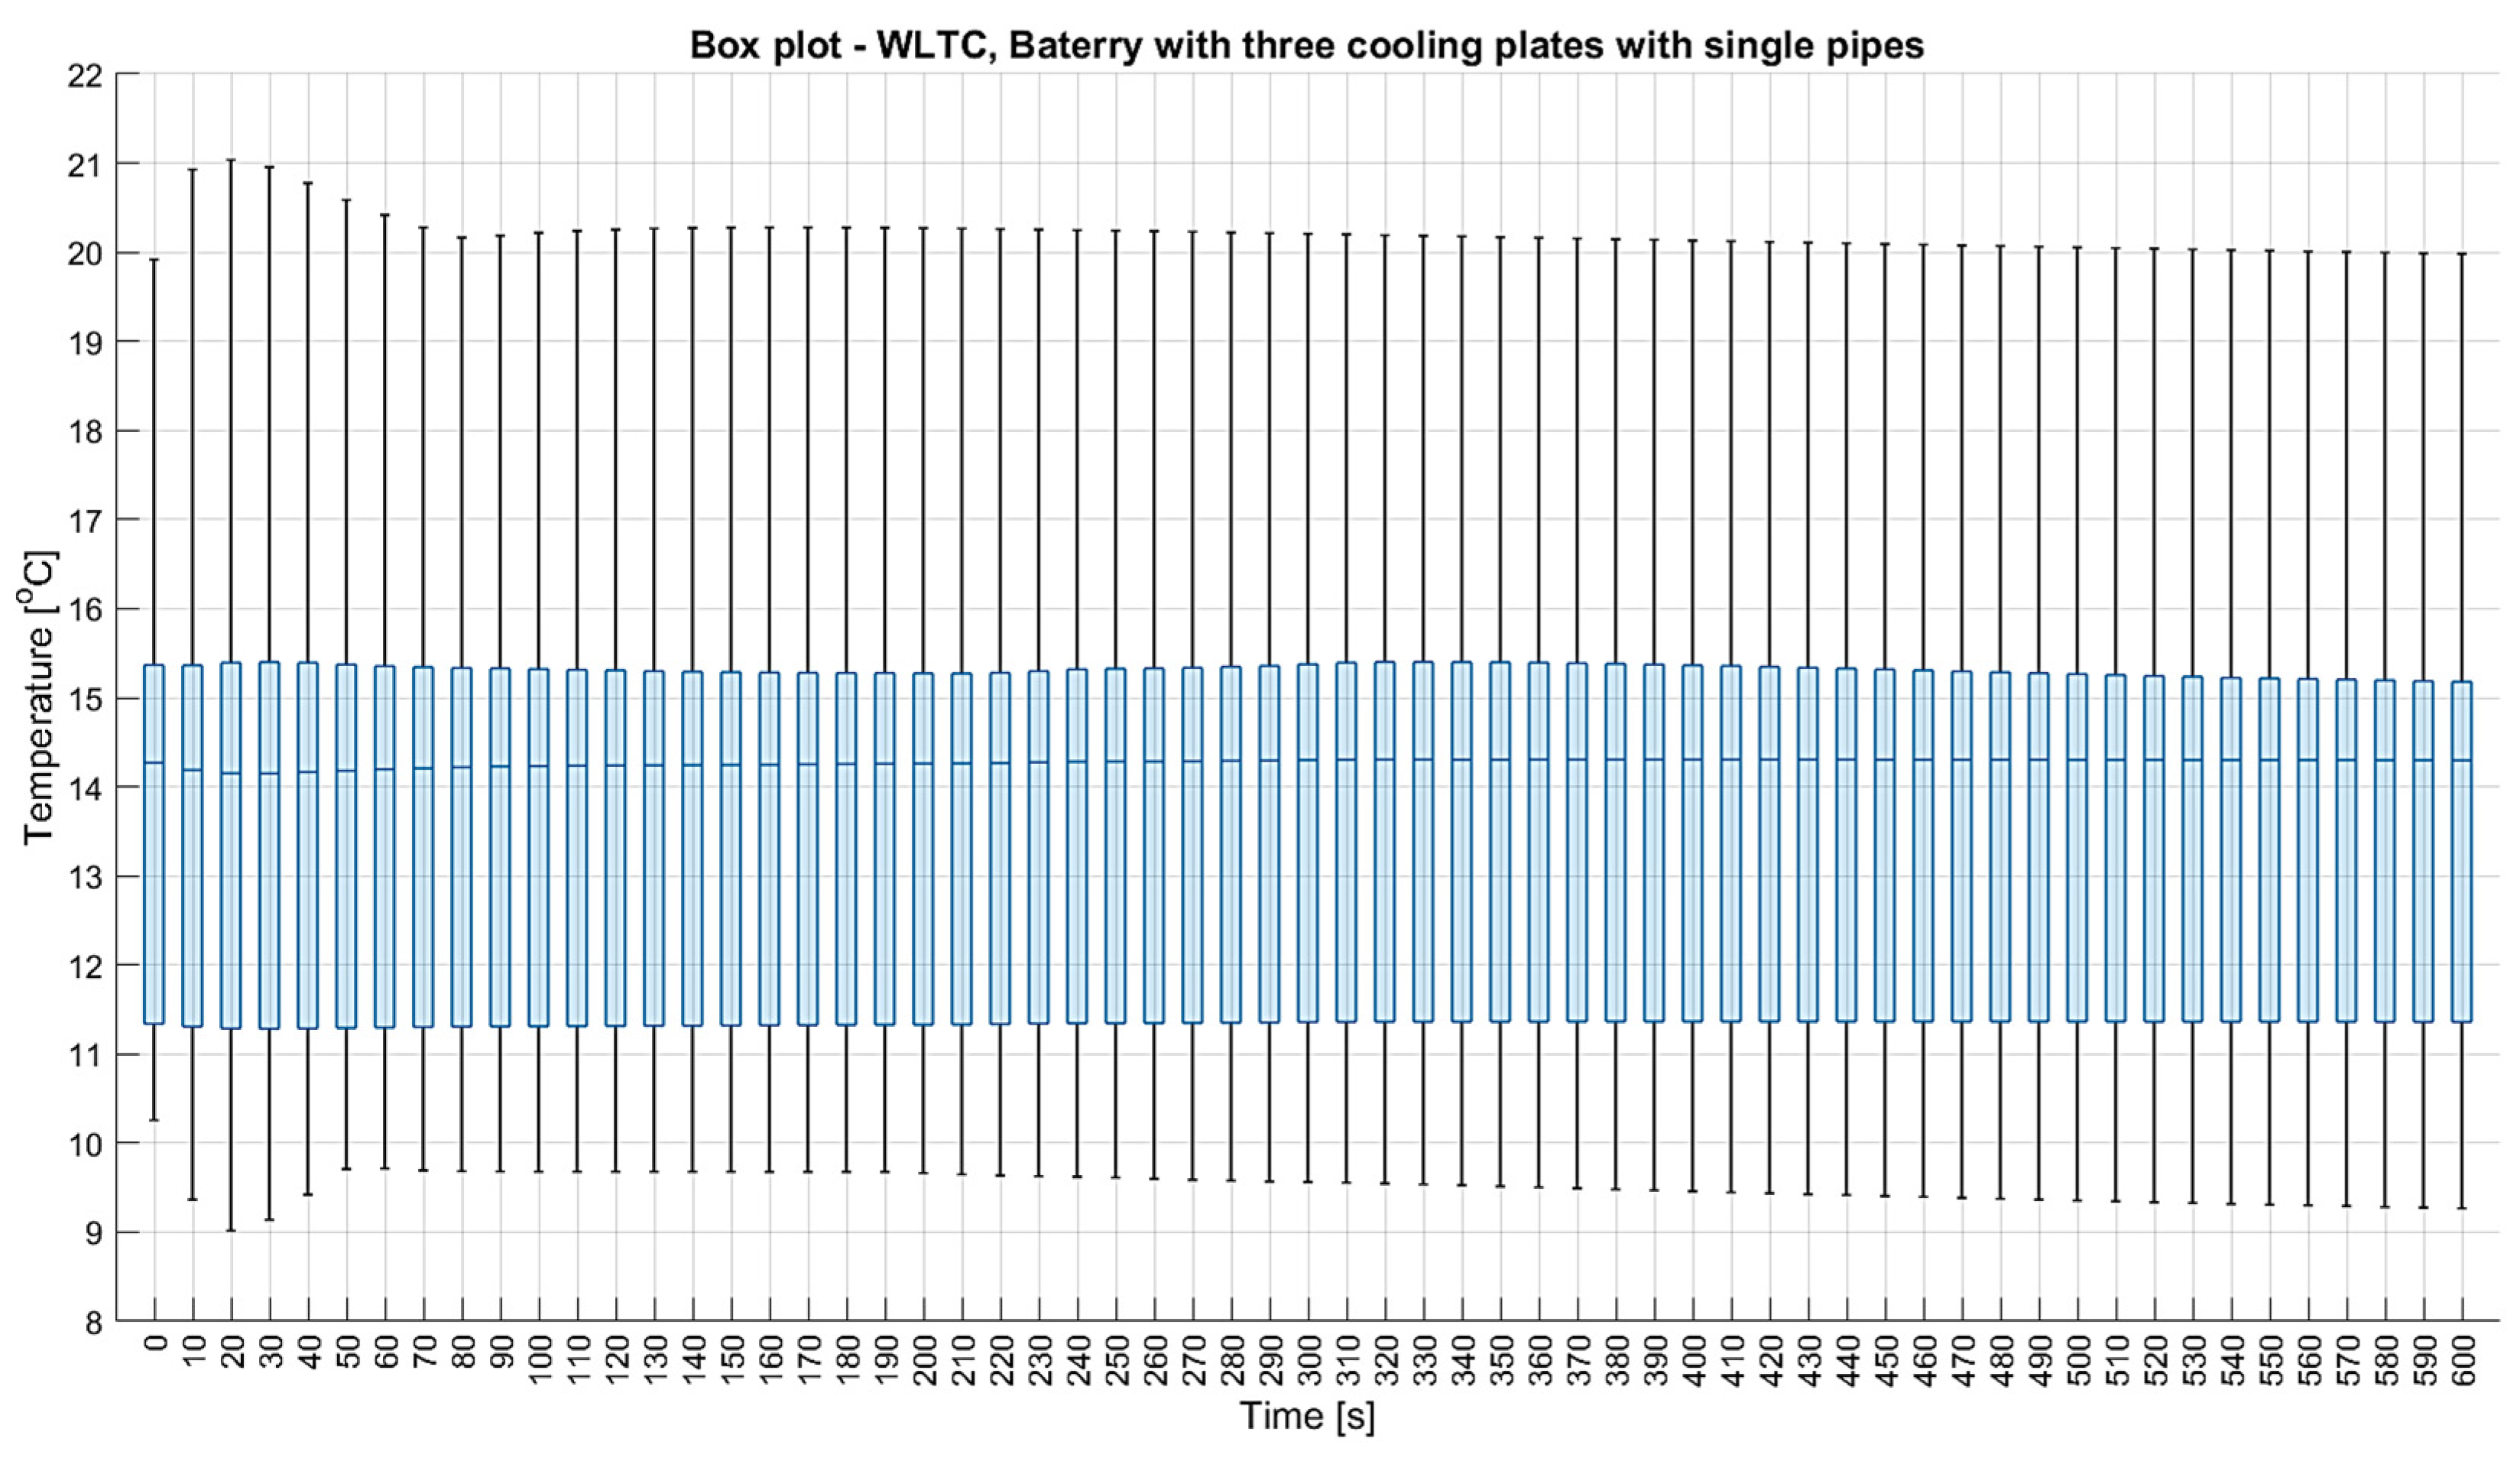
The presented characteristic was calculated as the arithmetic mean value from 24 cells’ temperatures for each time point and for each case of cooling system. The comparison clearly shows that the cooling systems constructed with U-shaped pipe plates performed better at cooling the battery. Additionally, the average maximum temperature graphs were presented against the current profile acting on the battery. It is worth noting that increases in battery temperature are associated with high-current peaks. Mild current increases did not cause sudden temperature spikes. These current peaks are the result of sudden acceleration in accordance with the WLTC driving cycle. Sudden acceleration, but also braking, generates high current, which translates into an increase in battery operating temperature. Figure 11, Figure 12, Figure 13 and Figure 14 presented box plots of the temperature distribution for each cooling system. The box plot shows the distribution of average temperatures, the median, and the interquartile range for each second of the simulation. The use of box plots represents a different approach to analyzing the results compared to the previous works in the introduction. This graph provides a different perspective on the temperature distribution compared to the 3D distribution and the mean value. The presented box plots include the temperatures of modules and cooling plates.
Temperature points from the battery and cooling plate models were used to generate box plots. The blue rectangles represent the interquartile range. Its lower edge is defined by the first quartile, while the upper edge is defined by the third quartile [35]. Of the dataset used to generate the box plot, 50% of them fall within this rectangle. This means that half of the temperature values of the model points are located within the center of the rectangle. The maximum and minimum values of the dataset are located at the ends of the segments extending from the rectangle, respectively. Values extending from the lower edge of the rectangle should fall within the range [35]:
< Q 1 1.5 · Q 3 Q 1   ; Q 1 >
while the values above the rectangle should be within the range [35]:
< Q 3   ;   Q 3 + 1.5 · ( Q 3 Q 1 ) >
where:
  • Q 1 —first quartile;
  • Q 3 —third quartile.
  • Additionally, the center value is marked with a thick line within the rectangle itself.
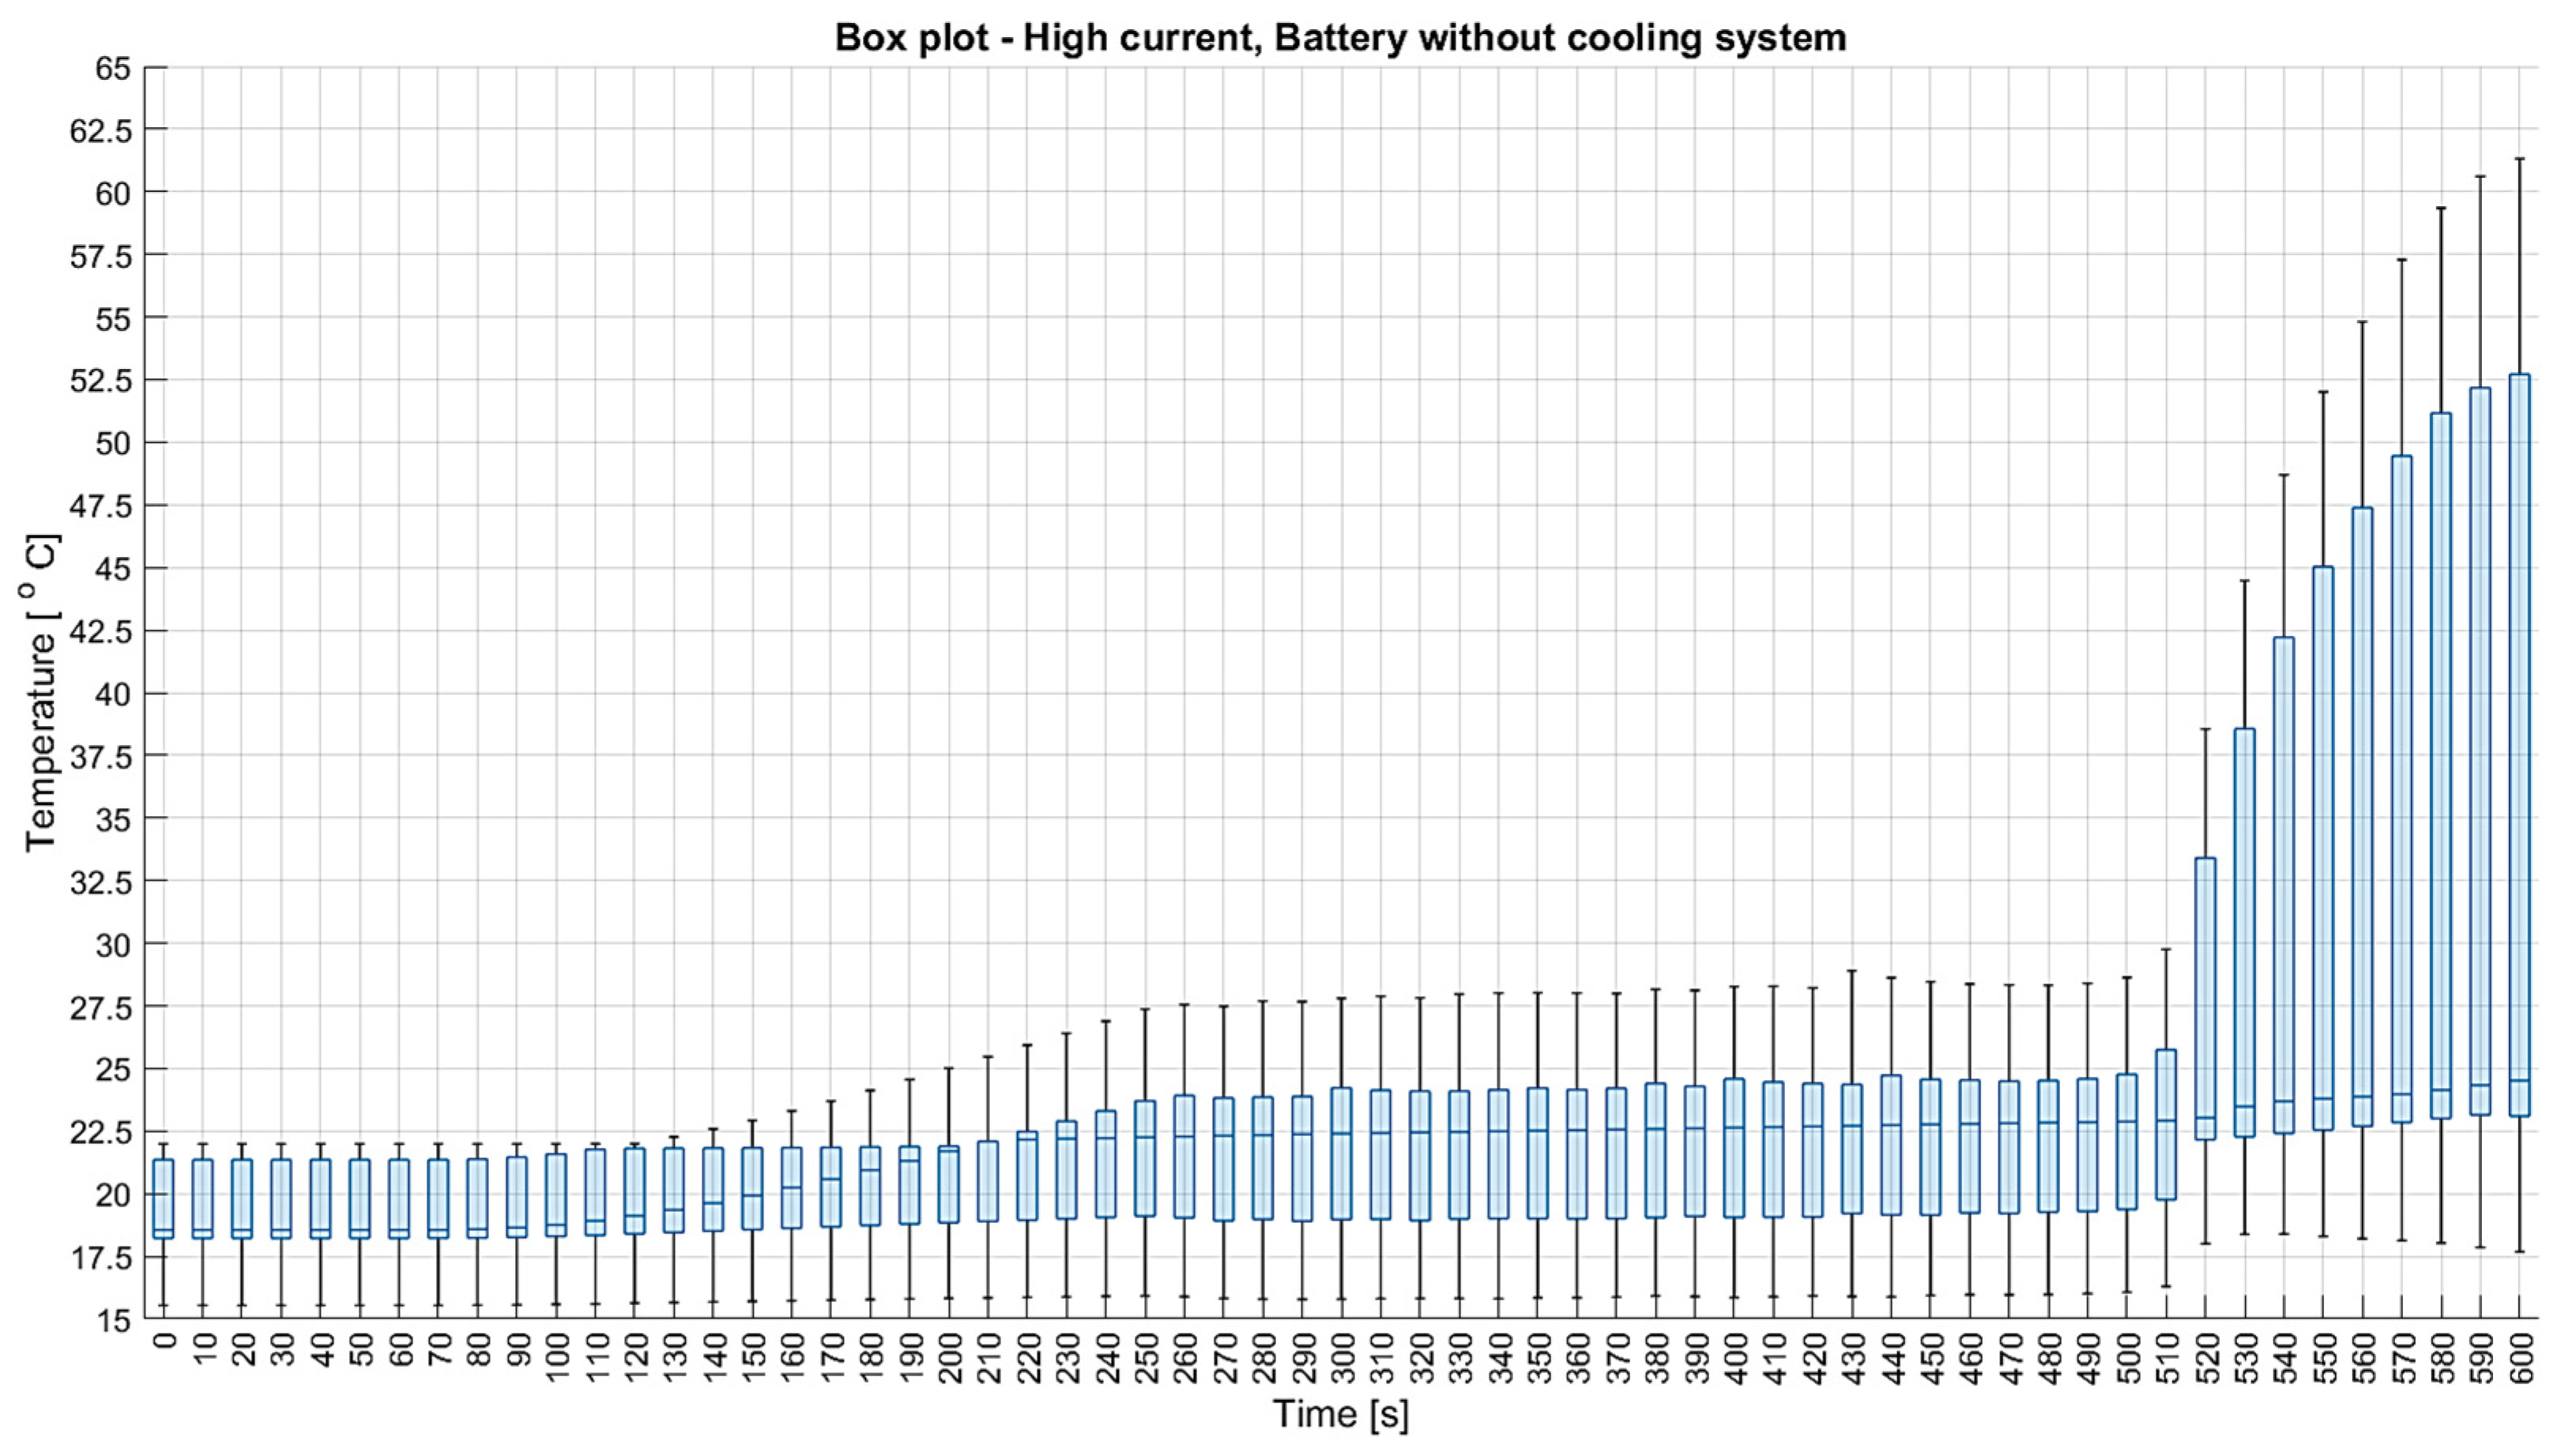
The box plots show that the maximum battery temperature is not the dominant value. Half of the temperature points are at least 2 °C lower than the maximum value. The cooling system reduces temperature and ensures stable conditions. A constant operating temperature has a significant impact on slowing down the battery degradation process. Battery capacity depends on its operating temperature. Frequent underheating or overheating of the battery can accelerate the degradation process, resulting in a decrease in capacity and nominal cell voltage.
Based on the above results, the cooling system consisting of three U-shaped plates was selected for further analysis because it achieved the best results in reducing the battery operating temperature.

3.2. High-DC Current Profile

Table 5 presents results for the simulation of high-power DC charging following the CHAdeMO standard [33]. This table includes mean values with their 95% confidence intervals, as well as the percentage decrease in battery temperature achieved with the cooling system. The method of calculating the presented results was the same as in Table 4 and is described in Section 3.1.
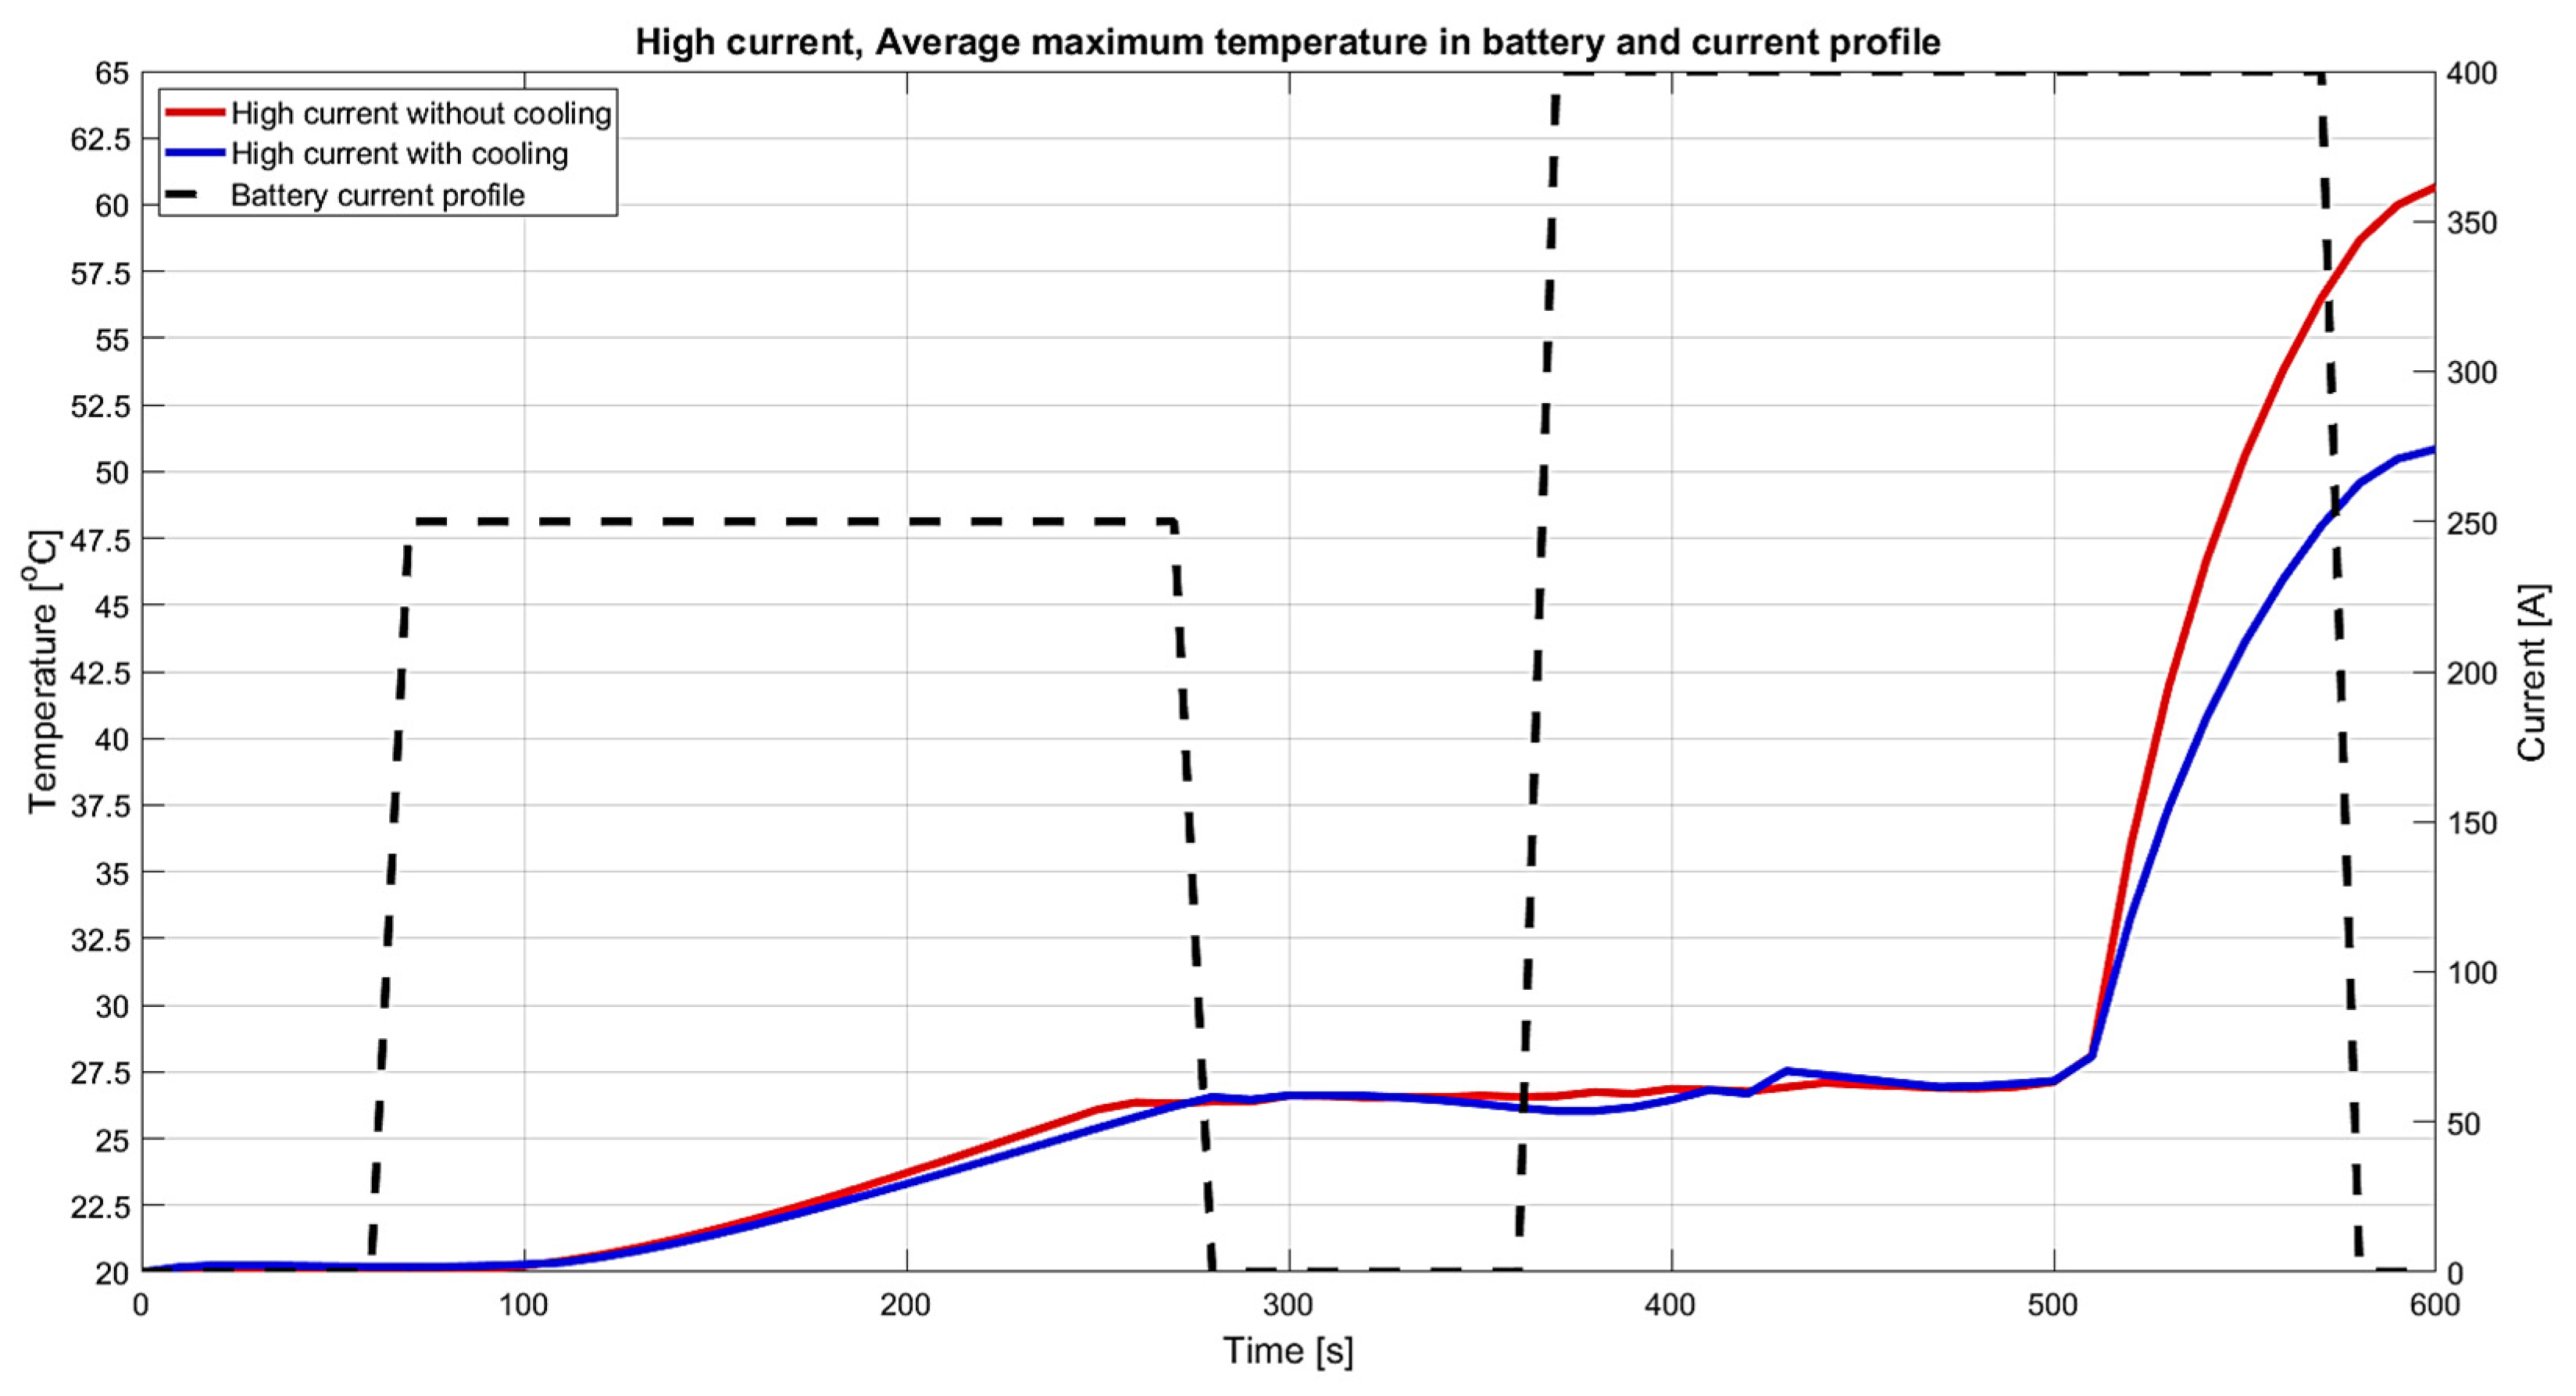
At a high-current profile without cooling, the mean battery’s maximum temperature exceeded 60 °C. The publication [1] defines a safe battery operating range of −10 °C to 50 °C. Therefore, the presented mean value is outside the safe range. Frequent exposure to such temperatures accelerates battery degradation. Applying a cooling system reduced the battery’s peak temperature by 16%, bringing it below 51 °C. This is close to the safe threshold defined in [1]. Figure 15 illustrates the battery’s average maximum temperature under high-current charging. It was calculated as the arithmetic mean of the cells’ temperatures. It clearly shows that the cooling system with three plates with U-shaped pipes effectively reduced the battery’s thermal rise.
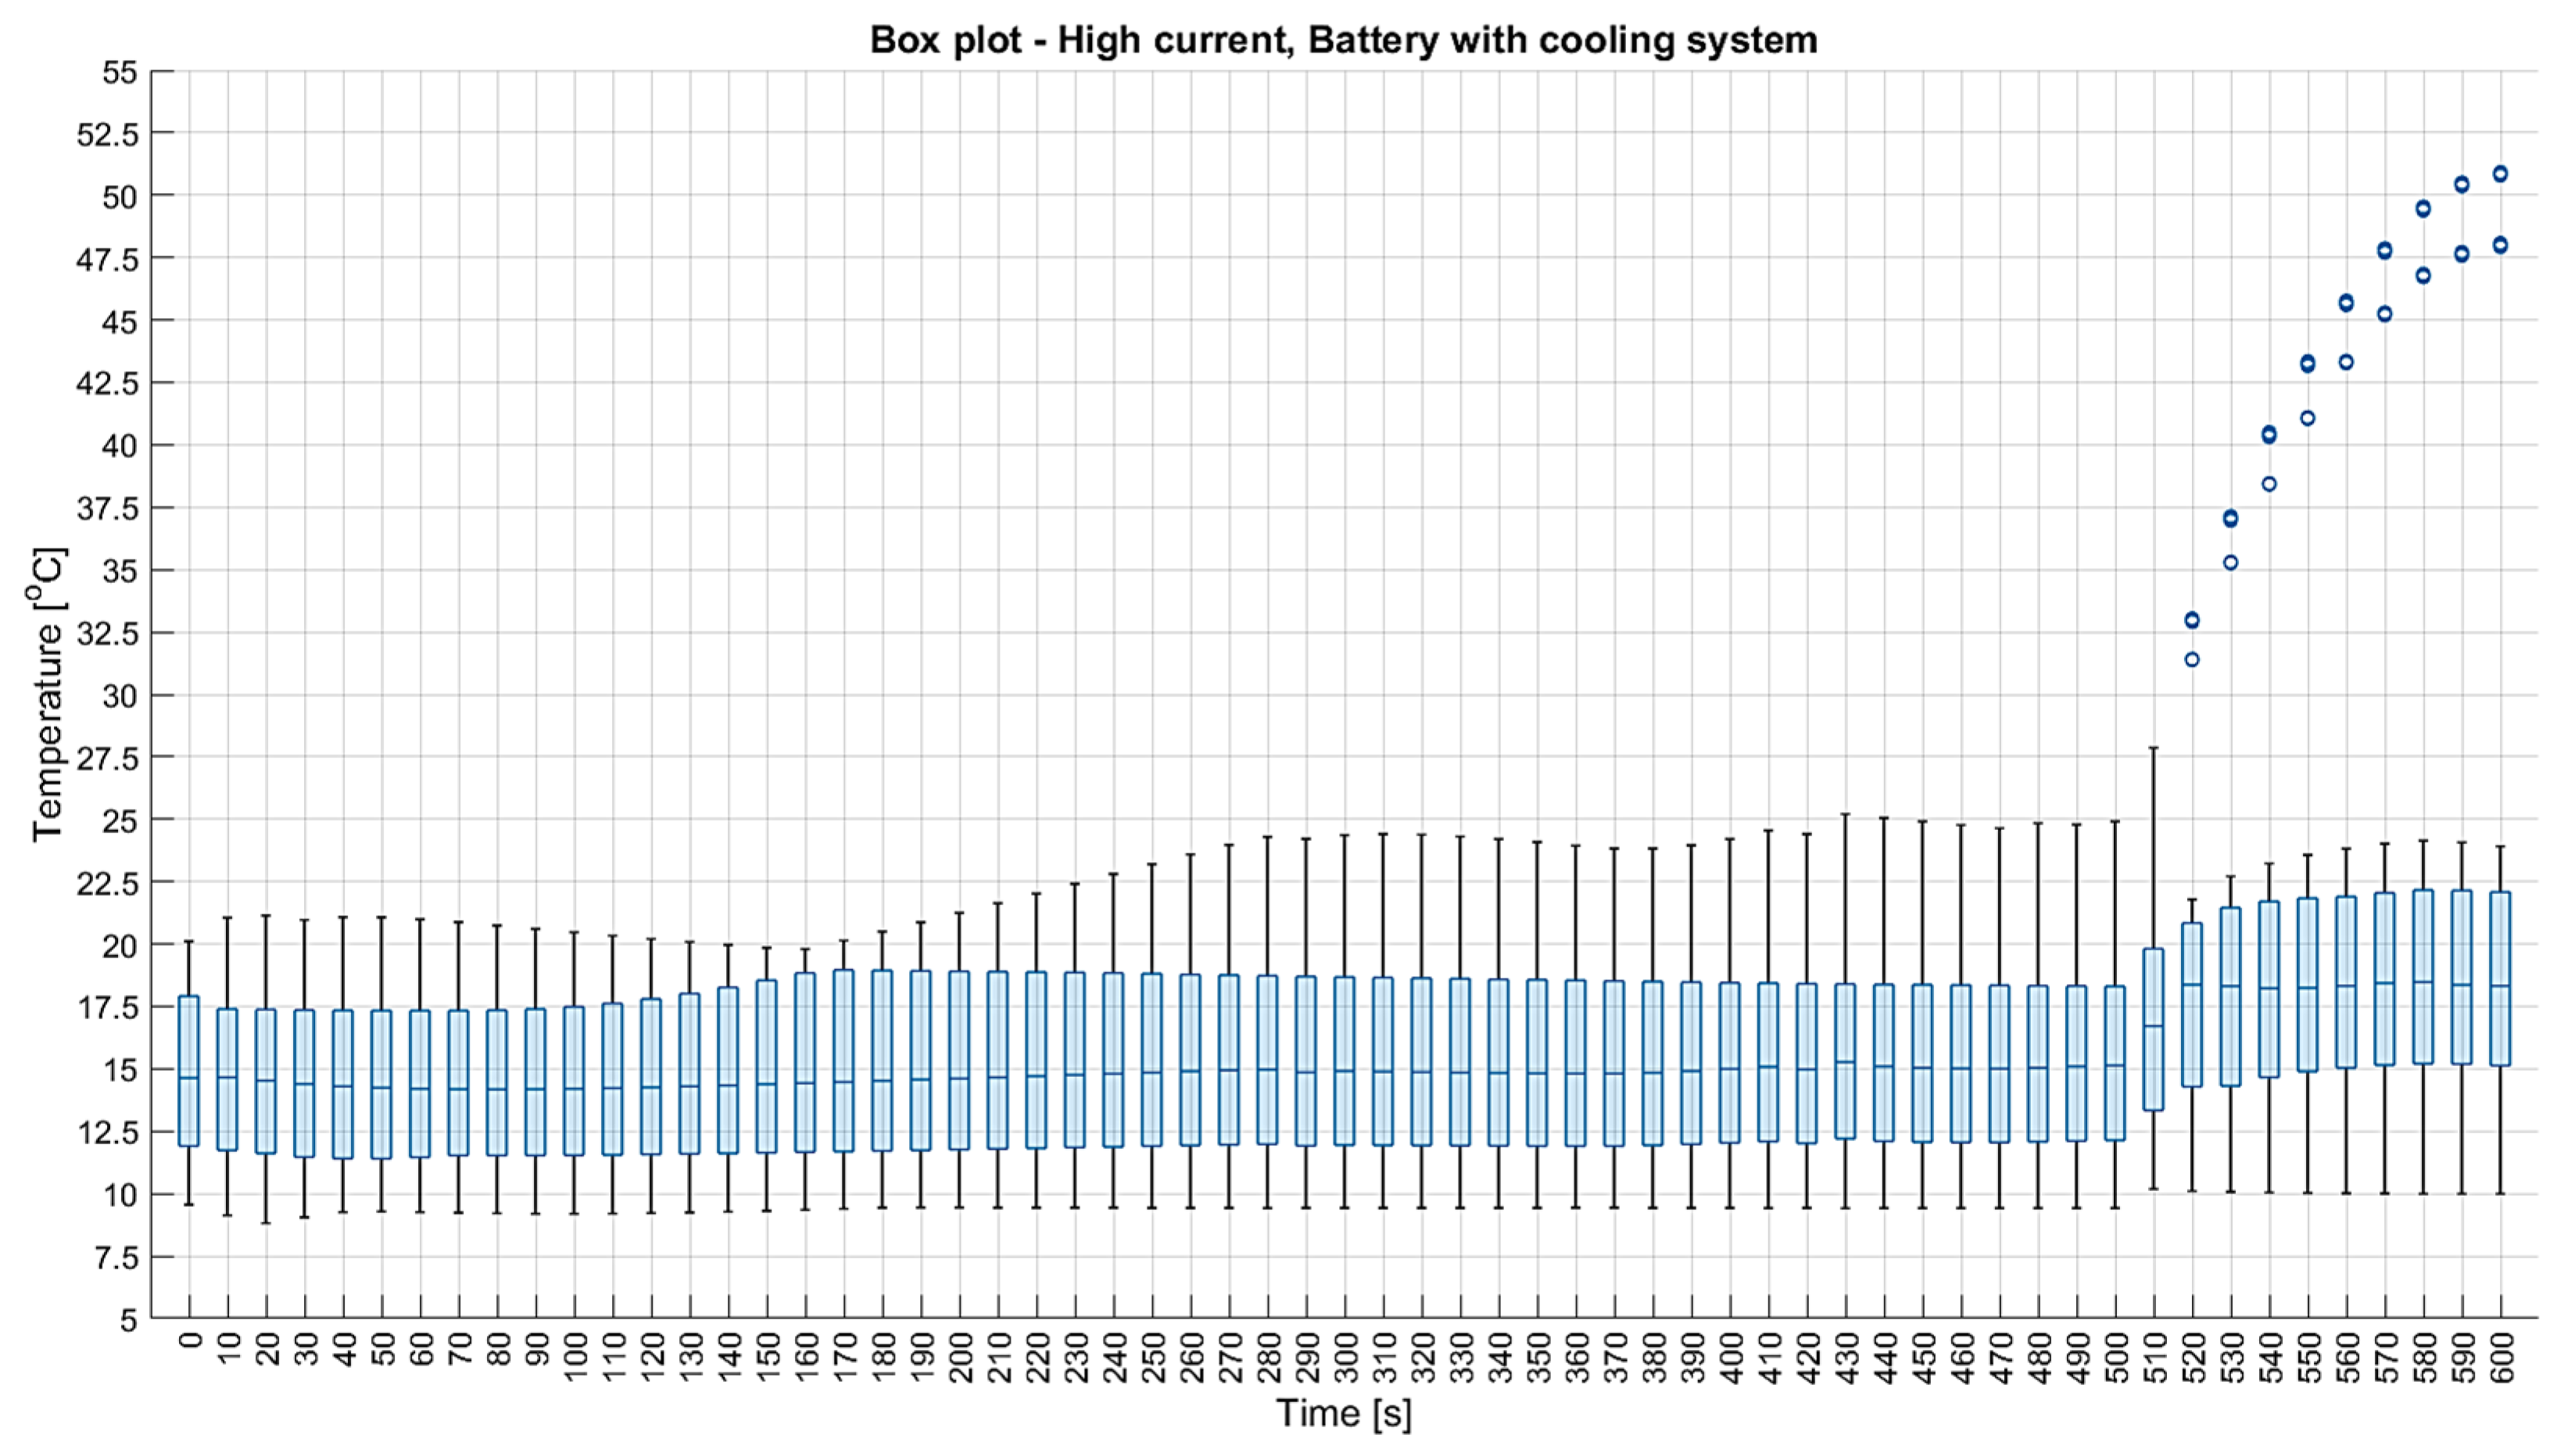
Figure 16 and Figure 17 show the average temperature distributions using box plots. The ends of these plots reflect rising peak temperatures. In Figure 17, the maximum values appear as isolated points above the upper range defined in Equation (13), indicating outliers. This means that, against the background of the dataset of temperature points, the maximum values are outliers.
This is a conclusion because most temperature points are clustered near the median, which lowers the battery’s overall average temperature—directly contributing to longer service life. Figure 18 shows 3D temperature distributions of the battery and cooling system under a high-current profile. Figure 18a displays the average battery temperature, ranging between 20 °C and 25 °C. Figure 18b presents a cross-section, where cell temperatures climb to around 50 °C but drop to 37–40 °C near the cooling plates. These temperatures are acceptable according to [1]. Figure 18b shows two vertical blue bands between the cells. Section 2.2 mentioned that the battery consists of 24 cells, divided into four modules. The visible bands are the module walls, which have a lower temperature than the cells themselves. Therefore, the visible bands are blue.

4. Discussion

For the WLTC current profile, maximum battery temperature was reduced by 0.59% to 1.96% and minimum temperatures by 3.9% to 7.01% compared to a battery without a cooling system. An active cooling system is not necessary under typical city driving because the battery does not heat up to levels that could cause damage. However, there are exceptions in which the battery should be thermally protected. These include cases of operation in extreme weather conditions such as summer heat (especially when the batteries are mounted on a roof). In such a situation, a high ambient temperature occurs, which hinders the passive cooling. The cooling system also helps maintain a stable temperature distribution within the battery, as evident in the box plots (Figure 11, Figure 12, Figure 13 and Figure 14). This prevents the battery from overheating in any specific location, reducing the risk of degradation.
Sudden acceleration and braking generate high-current spikes, increasing the battery’s operating temperature. Figure 10 highlights this relationship. A cooling system can mitigate the thermal effects of this phenomenon. Additionally, supercapacitors could be used to protect the battery against such impulses. An example of research on supercapacitor-battery interaction can be found in [36].
Table 4 presents the simulation results for five cases: a battery without a cooling system and a battery with four different cooling plate configurations. The best setup for the WLTC current profile was the system with three cooling plates with U-shaped pipes. This arrangement provided the largest effective heat exchange surface, which best reduced the maximum operating temperatures of the battery. Therefore, this cooling system was selected for the next simulation.
In a real-world scenario, the proposed cooling system, consisting of three plates with U-shaped pipes, should thermally stabilize the battery’s operating conditions and reduce local temperature spikes. The cooling systems with plates with a single pipe cannot be suitable in a real-world scenario due to their smaller heat exchange surface area.
In a high-DC current profile, cell temperatures are significantly higher than during typical city driving. This can be linked to the ability to fast charge electric vehicles. Users of such vehicles prioritize safe, fast, and efficient charging. A correct cooling system is necessary in this case. The examined cooling system reduced peak temperatures from over 60 °C to approximately 51 °C. Sustained exposure to 60 °C increases the risk of electrolyte degradation. LiPF6 is the dominant salt in the battery market that is used to produce electrolytes. This salt undergoes thermal decomposition above 70 °C. The warning against overheating the battery above 60 °C is important in order to avoid damaging the crucial component. Electrolyte breakdown leads to reduced battery capacity and accelerated degradation. Therefore, applying an effective cooling system is essential for extending battery lifespan.
The data were presented using box plots in all cases. It offers clear visualizations of temperature distribution and enables the identification of outliers, medians, and data dispersion. Additionally, this form of visualization facilitates the comparison of individual results.

5. Conclusions

This study’s simulations allowed the thermal analysis of the battery for various cooling systems. The presented results indicate that the heat transfer surface area is crucial for battery cooling. Therefore, the shape of the pipe in which the coolant flows is very important. The single plate with a U-shaped pipe achieved better cooling results than the three-plate system with a single pipe. The average maximum temperature for the single-plate system with a U-shaped pipe was approximately 0.25 °C lower than for the three-plate system with a single pipe.
Loading the battery with a current profile generated from the WLTC driving cycle showed that typical city driving should not excessively increase the battery temperature. In each of the four cooling system cases, the battery temperature at the end of the simulation did not deviate by more than 1.5 °C from the initial temperature of 20 °C.
However, the cooling system is more important when charging the battery with high current. The conducted simulations showed that high-current loading, even for a short period of time, can cause a sudden increase in cell temperature. Figure 15 shows that applying a 400 A current (CHAdeMO standard) for only about 4 min increased the battery temperature above 60 °C, which is too high. The use of a cooling system reduced this temperature by about 10 °C.
Furthermore, the cooling system ensures that the temperatures within the battery cells do not differ significantly. This is visible in the box plots in Figure 16 and Figure 17. The interquartile range is significantly smaller for the battery with the cooling system than for the battery without it.

Author Contributions

Conceptualization, P.M. and K.M.; methodology, K.M. and A.W.-M.; software, P.M., K.M. and A.W.-M.; validation, P.M., K.M. and A.W.-M.; formal analysis, A.W.-M.; investigation, K.M.; data curation, P.M. and A.W.-M.; writing—original draft preparation, P.M., K.M. and A.W.-M.; writing—review and editing, P.M. and A.W.-M.; visualization, P.M. and A.W.-M.; supervision, A.W.-M.; All authors have read and agreed to the published version of the manuscript.

Funding

This research received no external funding.

Institutional Review Board Statement

Not applicable.

Informed Consent Statement

Not applicable.

Data Availability Statement

The data presented in this study are available on request from the corresponding author. The data are not publicly available due to privacy restrictions.

Conflicts of Interest

The authors declare no conflict of interest.

References

  1. Bandhauer, T.M.; Garimella, S.; Fuller, T.F. A Critical Review of Thermal Issues in Lithium-Ion Batteries. J. Electrochem. Soc. 2011, 158, R1. [Google Scholar] [CrossRef]
  2. Rao, Z.; Wang, S. A Review of Power Battery Thermal Energy Management. Renew. Sustain. Energy Rev. 2011, 15, 4554–4571. [Google Scholar] [CrossRef]
  3. Waszczuk-Młyńska, A.; Radkowski, S. Circular Membrane with a Centrally-Located Opening—Analytical Model Using Parameterisation of the Non-Empty Torus. ZAMM Z. Angew. Math. Mech. 2019, 99, e201800167. [Google Scholar] [CrossRef]
  4. Chmielewski, A.; Mączak, J.; Szulim, P. Experimental Research of Electrochemical Energy Storage. In Automation 2017; Advances in Intelligent Systems and Computing; Springer: Berlin/Heidelberg, Germany, 2017; Volume 550, pp. 227–235. ISBN 21945357 (ISSN). [Google Scholar]
  5. Chmielewski, A.; Mączak, J.; Szulim, P. Experimental Research and Simulation Model of Electrochemical Energy Stores. In Automation 2017; Advances in Intelligent Systems and Computing; Springer: Berlin/Heidelberg, Germany, 2017; Volume 550, pp. 236–246. ISSN 21945357. [Google Scholar]
  6. Mei, N.; Xu, X.; Li, R. Heat Dissipation Analysis on the Liquid Cooling System Coupled with a Flat Heat Pipe of a Lithium-Ion Battery. ACS Omega 2020, 5, 17431–17441. [Google Scholar] [CrossRef]
  7. Chmielewski, A.; Mozaryn, J.; Bogdziński, K.; Piórkowski, P.; Mydłowski, T.; Gumiński, R.; Mączak, J. Selected Properties of the Hybrid Micro-Installation Model Based on Electrochemical Battery and PV Module. Int. J. Struct. Stab. Dyn. 2019, 19, 1941005. [Google Scholar] [CrossRef]
  8. Adeniran, A.; Park, S. Optimized Cooling and Thermal Analysis of Lithium-Ion Pouch Cell under Fast Charging Cycles for Electric Vehicles. J. Energy Storage 2023, 68, 107580. [Google Scholar] [CrossRef]
  9. Kalkan, O.; Celen, A.; Bakirci, K.; Dalkilic, A.S. Experimental Investigation of Thermal Performance of Novel Cold Plate Design Used in a Li-Ion Pouch-Type Battery. Appl. Therm. Eng. 2021, 191, 116885. [Google Scholar] [CrossRef]
  10. He, L.; Gu, Z.; Zhang, Y.; Jing, H.; Li, P. Review on Thermal Management of Lithium-Ion Batteries for Electric Vehicles: Advances, Challenges, and Outlook. Energy Fuels 2023, 37, 4835–4857. [Google Scholar] [CrossRef]
  11. Koundal, S.; Sharma, S.L.; Debbarma, A. Battery Thermal Management Systems for Electric Vehicles: An Overview of Cooling Techniques and Performance Optimization. J. Therm. Anal. Calorim. 2025, 150, 5855–5882. [Google Scholar] [CrossRef]
  12. Wahab, A.; Najmi, A.-U.-H.; Senobar, H.; Amjady, N.; Kemper, H.; Khayyam, H. Immersion Cooling Innovations and Critical Hurdles in Li-Ion Battery Cooling for Future Electric Vehicles. Renew. Sustain. Energy Rev. 2025, 211, 115268. [Google Scholar] [CrossRef]
  13. Mao, S.; An, Z.; Du, X.; Shi, T.; Zhang, D. Coupling Analysis on the Thermophysical Parameters and the Performance of Liquid Cooling-Based Thermal Management System for Lithium-Ion Batteries. Energies 2022, 15, 6865. [Google Scholar] [CrossRef]
  14. An, Z.; Gao, W.; Zhang, J.; Liu, H.; Gao, Z. Enhancing Heat Dissipation of Thermal Management System Utilizing Modular Dual Bionic Cold Plates for Prismatic Lithium Batteries. J. Energy Storage 2024, 87, 111541. [Google Scholar] [CrossRef]
  15. Li, R.; Gan, Y.; Luo, Q.; Yan, Y.; Li, Y. Research Progress on Efficient Thermal Management System for Electric Vehicle Batteries Based on Two-Phase Transformation. Appl. Therm. Eng. 2023, 234, 121270. [Google Scholar] [CrossRef]
  16. Choi, H.; Lee, H.; Han, U.; Jung, J.; Lee, H. Comparative Evaluation of Liquid Cooling-Based Battery Thermal Management Systems: Fin Cooling, PCM Cooling, and Intercell Cooling. Int. J. Energy Res. 2024, 2024, 5395508. [Google Scholar] [CrossRef]
  17. Zhang, Y.; Fu, Q.; Liu, Y.; Lai, B.; Ke, Z.; Wu, W. Investigations of Lithium-Ion Battery Thermal Management System with Hybrid PCM/Liquid Cooling Plate. Processes 2023, 11, 57. [Google Scholar] [CrossRef]
  18. Behi, H.; Karimi, D.; Kalogiannis, T.; Van Mierlo, J.; Berecibar, M. New Concept of Hybrid Cooling System for Fast Charging of Electric Vehicles. J. Energy Storage 2024, 97, 112994. [Google Scholar] [CrossRef]
  19. Zeng, X.; Men, Z.; Deng, F.; Chen, C. Optimization of the Heat Dissipation Performance of a Lithium-Ion Battery Thermal Management System with CPCM/Liquid Cooling. Materials 2022, 15, 3835. [Google Scholar] [CrossRef] [PubMed]
  20. Guo, H.; Li, J.; Zhu, Z.; Lv, P. Numerical Investigation on Thermal Performance of Battery Module with LCP-AFC Cooling System Applied in Electric Vehicle. Energy Sci. Eng. 2022, 10, 4431–4446. [Google Scholar] [CrossRef]
  21. Panmuang, P.; Photong, C.; Soemphol, C. Experimental Investigation of Batteries Thermal Management System Using Water Cooling and Thermoelectric Cooling Techniques. Int. J. Power Electron. Drive Syst. 2024, 15, 201–212. [Google Scholar] [CrossRef]
  22. Roe, C.; Feng, X.; White, G.; Li, R.; Wang, H.; Rui, X.; Li, C.; Zhang, F.; Null, V.; Parkes, M.; et al. Immersion Cooling for Lithium-Ion Batteries—A Review. J. Power Sources 2022, 525, 231094. [Google Scholar] [CrossRef]
  23. Steingart, D.; Chang, W.; Bommier, C.; Mohr, R. Impact of Non-Arrhenius Temperature Behavior on the Fast-Charging Capabilities of LiCoO2−Graphite Lithium-Ion Batteries. J. Phys. Chem. C 2021, 125, 1731–1741. [Google Scholar] [CrossRef]
  24. Thakur, A.K.; Ahmed, M.S.; Kang, H.; Prabakaran, R.; Said, Z.; Rahman, S.; Sathyamurthy, R.; Kim, J.; Hwang, J.-Y. Critical Review on Internal and External Battery Thermal Management Systems for Fast Charging Applications. Adv. Energy Mater. 2023, 13, 2202944. [Google Scholar] [CrossRef]
  25. Lokhande, I.K.; Tiwari, N.; Sharma, A. A Review on Fast Charging/Discharging Effect in Lithium-Ion Batteries for Electric Vehicles. In Renewable Energy: Accelerating the Energy Transition; Energy Systems in Electrical Engineering; Springer: Berlin/Heidelberg, Germany, 2024; Volume Part F2145, pp. 209–233. ISSN 21998582. [Google Scholar]
  26. Tai, L.D.; Garud, K.S.; Hwang, S.-G.; Lee, M.-Y. A Review on Advanced Battery Thermal Management Systems for Fast Charging in Electric Vehicles. Batteries 2024, 10, 372. [Google Scholar] [CrossRef]
  27. Waszczuk-Młyńska, A.; Radkowski, S. About a Certain Way of the Membrane Kinetic Energy Transformation into Electric Energy. Adv. Intell. Sys. Comput. 2015, 352, 303–312. [Google Scholar] [CrossRef]
  28. Commission Regulation (EU) 2017/1151 of 1 June 2017—WLTC Test and Cycle Modification—Sub Annex 1. Available online: https://eur-lex.europa.eu/legal-content/PL/TXT/?uri=CELEX:32017R1151/ (accessed on 4 July 2025).
  29. QuickerSim—CFD Analysis|Battery Simulation|Engineering Consulting. Available online: https://www.quickersim.com/ (accessed on 3 July 2025).
  30. Theory Guide|Quickersim. Available online: https://emobility.quickersim.com/theory-guide/ (accessed on 3 July 2025).
  31. Halliday, D.; Resnick, R.; Walker, J. Fundamentals of Physics; PWN: Warszawa, Poland, 2013; Volume 2, ISBN 978-83-01-14107-3. (In Polish) [Google Scholar]
  32. Wiśniewski, S.; Wiśniewski, T.S. Wymiana Ciepła, 6th ed.; WNT: Warszawa, Poland, 2017; ISBN 978-83-01-19443-7. (In Polish) [Google Scholar]
  33. High Power (ChaoJi)|CHAdeMO. Available online: https://www.chademo.com/technology/high-power (accessed on 4 July 2025).
  34. Schervish, M.J. Theory of Statistics; Springer: Berlin/Heidelberg, Germany, 1995; ISBN 978-1-4612-4250-5. [Google Scholar]
  35. Kornacki, J.; Mielniczuk, J. Statystyka Dla Studentów Kierunków Technicznych i Przyrodniczych, 3rd ed.; WNT: Warszawa, Poland, 2006; ISBN 83-204-3242-1. (In Polish) [Google Scholar]
  36. Piórkowski, P.; Chmielewski, A.; Bogdziński, K.; Możaryn, J.; Mydłowski, T. Research on Ultracapacitors in Hybrid Systems: Case Study. Energies 2018, 11, 2551. [Google Scholar] [CrossRef]
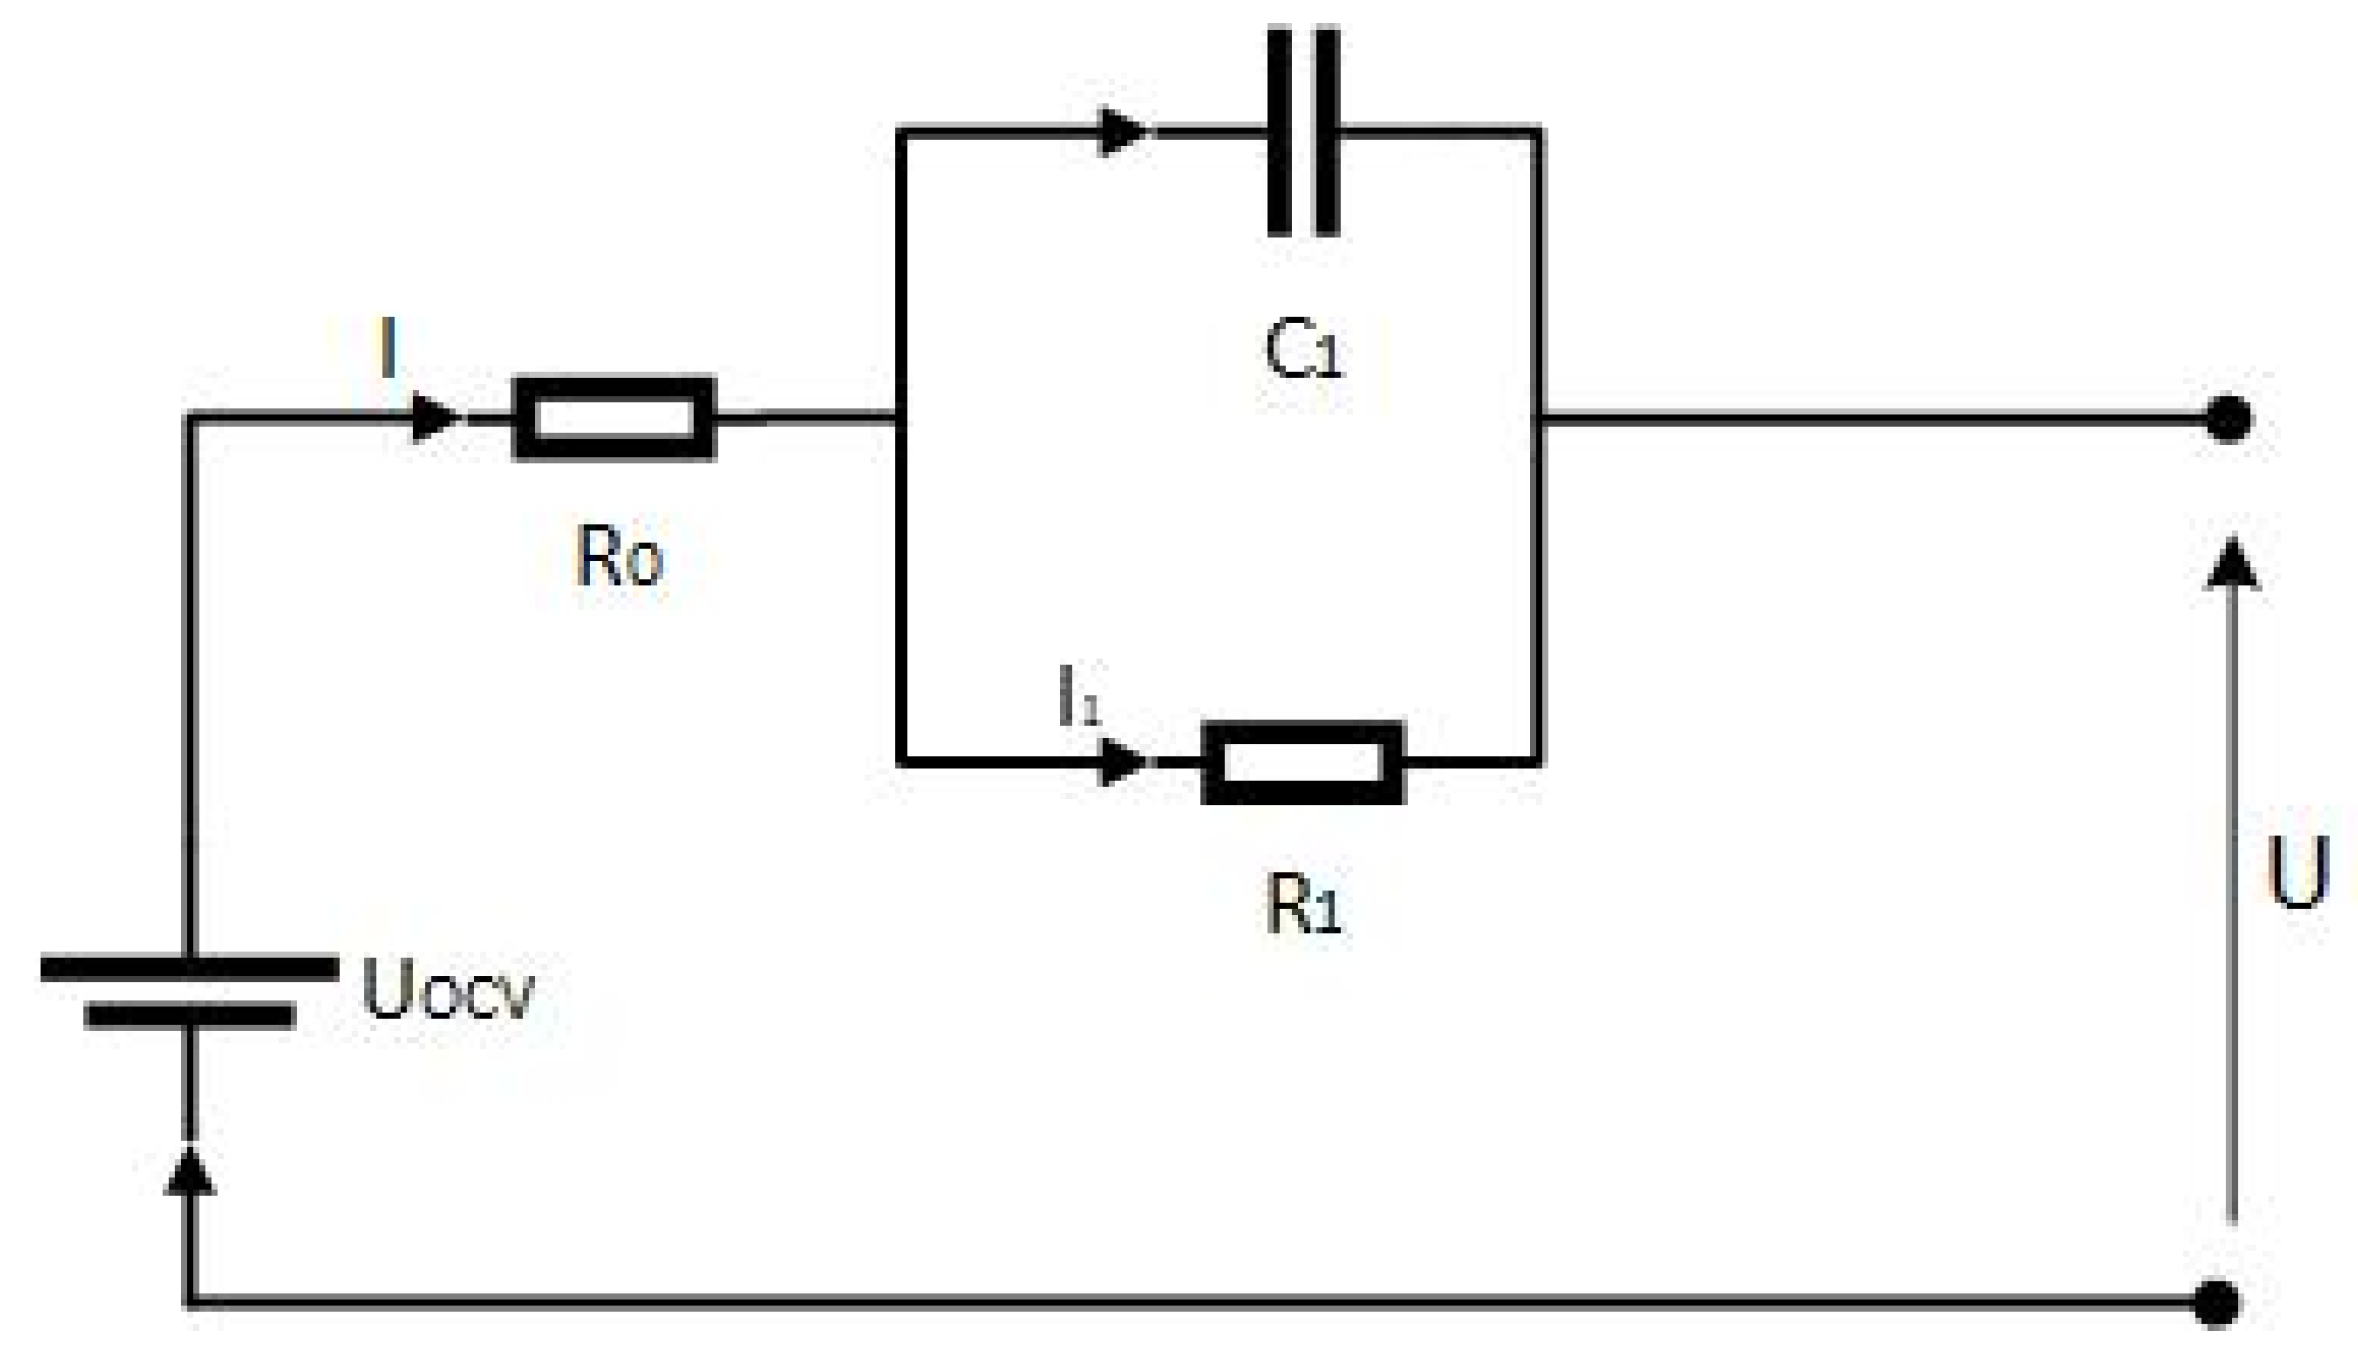
Figure 1. RC equivalent circuit diagram [30].
Applsci 15 09776 g001
Figure 2. View of the battery model with 3 cooling plates. Dimensions are in meters.
Applsci 15 09776 g002
Figure 3. Fragment of the WLTC driving cycle from 0 to 600 s.
Applsci 15 09776 g003
Figure 4. Current profile based on the WLTC cycle.
Applsci 15 09776 g004
Figure 5. Current profile for high-DC current charging.
Applsci 15 09776 g005
Figure 6. Temperature distribution of a battery with a single cooling plate with a single pipe at the end of the simulation: (a) top view and (b) bottom view.
Applsci 15 09776 g006
Figure 7. Temperature distribution of a battery with a single cooling plate with a U-shaped pipe at the end of the simulation: (a) top view and (b) bottom view.
Applsci 15 09776 g007
Figure 8. Temperature distribution of a battery with three cooling plates with a single pipe at the end of the simulation: (a) top view and (b) bottom view.
Applsci 15 09776 g008
Figure 9. Temperature distribution of a battery with three cooling plates with a U-shaped pipe at the end of the simulation: (a) top view and (b) bottom view.
Applsci 15 09776 g009
Figure 10. Maximum temperatures of a battery without cooling and with different cooling methods for the WLTC current profile.
Applsci 15 09776 g010
Figure 11. Temperature distribution for the WLTC current profile in the case of a battery with a single cooling plate with single pipes.
Applsci 15 09776 g011
Figure 12. Temperature distribution for the WLTC current profile in the case of a battery with a single cooling plate with U-shaped pipes.
Applsci 15 09776 g012
Figure 13. Temperature distribution for the WLTC current profile in the case of a battery with three cooling plates with single pipes.
Applsci 15 09776 g013
Figure 14. Temperature distribution for the WLTC current profile in the case of a battery with three cooling plates with U-shaped pipes.
Applsci 15 09776 g014
Figure 15. The average maximum temperature for the high current profile in the case of a battery without a cooling system and with cooling using three cooling plates with U-shaped pipes.
Applsci 15 09776 g015
Figure 16. Temperature distribution for the high-current profile in the case of a battery without a cooling system.
Applsci 15 09776 g016
Figure 17. Temperature distribution for the high-current profile in the case of a battery with three cooling plates with U-shaped pipes.
Applsci 15 09776 g017
Figure 18. Temperature distribution of a battery with three cooling plates with U-shaped pipes at the end of the simulation: (a) top view and (b) bottom view with close-up of the cells.
Applsci 15 09776 g018
Table 1. Technical parameters of the lithium-ion battery used for research.
ParameterValue
Nominal voltage222 V
Capacity180 Ah
Energy40 kWh
Charging current180 A
Charging temperature0–55 °C
Discharge current180 A
Discharge temperature−25 ÷ 55 °C
Table 2. Cell parameters included in the simulations.
ParameterValue
Minimal capacity100 Ah
Nominal voltage3.66 V
Resistivity2000 nΩm
Thermal conductivity in the x direction 9   W m · K
Thermal conductivity in the y direction 21   W m · K
Thermal conductivity in the z direction 21   W m · K
Specific heat capacity 898   J k g · K
Table 3. Cooling plate and coolant parameters included in simulations.
ParameterValue
Pipe diameter of a plate with a single pipe8 mm
Pipe diameter of a plate with U-shaped pipe8 mm
Thermal conductivity of the plate 2   W m · K
Resistivity of the fluid at 0 °C1070 nΩm
Thermal conductivity of the fluid at 0 °C 0.45   W m · K
Specific heat of the fluid at 0 °C 3320   J k g · K
Heat transfer coefficient 2000   W m 2 · K
Mass flow rate 0.02   k g s
Fluid inlet temperature20 °C
Table 4. Final battery and coolant temperature values for the current profile from Figure 4.
ParameterBattery Without Cooling SystemBattery with Single Cooling PlateBattery with Three Cooling Plates
With Single PipeWith U-Shaped PipeWith Single PipesWith U-Shaped Pipes
Initial temperature of cells [°C]2020202020
Mean value and confidence interval for minimum temperatures [°C]20.093
(20.091; 20.095)
19.31
(19.291; 19.329)
19.123
(19.089; 19.156)
19.237
(19.214; 19.259)
18.684
(18.612; 18.756)
Mean value and confidence interval for maximal temperatures [°C]20.314
(20.313; 20.315)
20.124
(20.121; 20.128)
19.93
(19.920; 19.939)
20.179
(20.176; 20.182)
19.915
(19.912; 19.919)
Initial temperature of cooling fluid [°C]-10101010
Final temperature of cooling fluid [°C]-11.2813.31Bottom plate11.28Bottom plate10.50
Left plate11.23Left plate10.44
Right plate11.23Right plate10.44
Table 5. Resulting battery temperature values for the high-current charging.
ParameterBattery Without Cooling SystemBattery with Three Cooling Plates and U-Shaped PipesDifference Between Temperatures [%]
Initial temperature of cells [°C]2020-
Mean value and confidence interval for minimum temperatures [°C]32.178
(32.075; 32.280)
28.077
(28.029; 28.126)
12.74%
Mean value and confidence interval for maximal temperatures [°C]60.679
(60.332; 61.025)
50.844
(50.771; 50.918)
16.21%
Disclaimer/Publisher’s Note: The statements, opinions and data contained in all publications are solely those of the individual author(s) and contributor(s) and not of MDPI and/or the editor(s). MDPI and/or the editor(s) disclaim responsibility for any injury to people or property resulting from any ideas, methods, instructions or products referred to in the content.