Abstract
Fuel with a tight lattice structure in the reactor core is an important design direction for high-performance water reactors. Due to the dispersed flow characteristic, research on post-dryout heat transfer is limited. However, a better understanding of post-dryout heat transfer characteristics under accident conditions is significantly important for fuel design and safety analysis. This study experimentally investigates the characteristics of post-dryout dispersed flow heat transfer in a 3-rod tight-lattice bundle with a pitch-to-diameter ratio of 1.2. The working conditions are as follows: system pressure ranging from 6 to 10 MPa, mass flux between 65 to 200 kg/(m2s), and heat flux varying from 75 to 200 kW/m2. Circumferentially non-uniform heat transfer is obviously observed. The wall temperature is higher in the narrow gaps between rods, while lower in the vicinity of the subchannel center. The specific mechanisms of the above phenomena are analyzed. Parametric effects on post-dryout heat transfer are discussed and illustrated. Using the experimental data, commonly utilized correlations for transition boiling and film boiling are evaluated. In order to improve the prediction accuracy, new heat transfer correlations for transition boiling and film boiling in the tight-lattice under low mass flux and low heat flux are developed based on the experimental data and mechanistic analysis.
1. Introduction
The important goals for the future development of nuclear reactors are high economy, ease of use, and intrinsic safety, and for this reason, reactors are constantly being optimized and improved. The development of advanced light water reactors (ALWRs) based on existing technologies is currently one of the most practical ways to improve reactor performance. Tight lattice fuel assemblies, with smaller rod gaps and water-to-uranium ratios than normal fuel assemblies [1,2], can reduce the core size, harden the neutron energy spectrum, increase the conversion ratio, and thus increase fuel utilization, which has good potential for application, such as in small modular reactors [3]. When a reactor suffers a loss of coolant accident (LOCA), the coolant is lower than usual, and the heat transfer performance decreases dramatically. The critical heat transfer phenomenon may occur on the fuel rod surface, with the upstream of the critical position being in the annular flow region, and the downstream being in the region of dispersed flow of vapor-entrained droplets. The post-dryout heat transfer directly affects the integrity of the fuel rod cladding. However, dispersed-flow heat transfer is complicated, especially in tight lattice fuel assemblies, where the inter-rod slit structure and the grid spacer have a significant influence on the dispersed-flow heat transfer characteristics, and the heat transfer models obtained in round tubes are difficult to apply directly, which brings a great challenge to the safety assessment of the core under loss of coolant accidents.
Plenty of experimental studies have been carried out on dispersed-flow heat transfer under simplified structures [4,5,6]. Heinemann et al. [7] carried out dispersed-flow heat transfer experiments in a rectangular channel and discussed the influence of the inlet effect on the applicability of the prediction correlations. It was concluded that the correlation should be used with caution when the non-heated section is larger than 16 times the hydraulically equivalent diameter. Swenson et al. [8] performed experiments on dispersed flow heat transfer and achieved heat transfer data for the full range of nucleate boiling, transition boiling, and film boiling. It was found that the high thermal conductivity of the vapor at high pressure ensures a good heat transfer coefficient after drying out. Polomik et al. [9] conducted experiments on dispersed flow in a circular tube. The results showed that increasing the pressure or decreasing the heat flux can effectively reduce the wall temperature oscillations during the transition boiling regime right before the dryout point. Bennett et al. [10] carried out dispersed flow heat transfer experiments in a vertical upward electrically heated annulus tube and found that the wall temperature in the post-dryout regime of the experiment was higher than that using thermal equilibrium assumptions. Subsequently, Bennett et al. [11] carried out a study at 6.9 MPa using a round tube. The wall temperature at the dryout point was found to increase sharply, but the change in wall temperature in the post-dryout area was obviously affected by the flow rate. Keeys et al. [12] investigated the heat transfer characteristics of dry out and post dryout in a round tube. It was found that the location of the dry-out point was very sensitive to changes in heat flux at high flow rates (>2.7 × 10³ kg/m2s). Groeneveld et al. [13] carried out experiments on dispersed flow and explored the effects of pressure, heat flux, and other factors on post-dryout heat transfer. A heat transfer correlation applicable to dispersed flow in circular tubes was proposed based on the experimental data.
The above studies mainly focus on simple geometries; however, in rod bundle structures, there is an intermixing of vapor phase and liquid droplets between subchannels when it is in a dispersed flow regime, and the heat transfer behavior is more complicated. However, limited by the technical difficulty of high temperature and high-pressure experiments in rod bundles, related research is less frequently carried out. Morris et al. [14] carried out transient and steady post-dryout heat transfer experiments in an 8 × 8 rod bundle. The experimental data were analyzed and found that the difference in heat transfer characteristics between the rod bundle and the circular tube could almost be characterized by the difference in heat transfer of the vapor. Unal et al. [15,16] claimed that the share of heat flux attributed to evaporating droplets is independent of the magnitude of the wall heat flux, but increases with increasing mass flow rate and decreasing inlet quality. Kumamaru et al. [17] carried out dryout and post-dryout dispersed flow heat transfer experiments in a 5 × 5 rod bundle. It was found that the dryout position of the side rods was slightly in front of the center rods, and the wall temperature after dryout was higher than that of the center rods. Validations showed that the Varone-Rohsenow correlation [18], which takes into account the thermal imbalance effect, had the best prediction over the full range of test conditions. Actually, a review by Shi et al. [19] on post-dryout heat transfer in circular tubes established that the direct cause of heat transfer deterioration is the drying out of the liquid film, leading to direct contact between the heated wall and vapor. Xia et al. [20] suggested there are significant differences in droplet evaporation rates between the near-wall and core regions during post-dryout heat transfer, and proposed a dual-region model for interfacial heat transfer calculation. This model separately computes droplet evaporation and droplet interactions within each region to optimize the prediction of post-critical heat transfer. However, under tight structures, like rod bundle configurations, the liquid film thickness and droplet interaction mechanisms are likely altered, consequently modifying the post-dryout boiling heat transfer process. This introduces greater complexity in predicting post-dryout boiling heat transfer in rod bundles.
It can be noticed that most of the existing studies of post-dryout heat transfer in rod bundles are conducted with widely spaced rod bundles used in pressurized water reactors or boiling water reactors. Möller et al. [21] have reported that the reduction in rod pitch will increase the turbulence intensity between the rods, thus directly affecting the heat transfer characteristics of the subchannels in the rod bundle. However, there is a lack of research on the heat transfer behavior of dispersed flow in tight lattice rod bundles, which would restrain the design and safety analysis of tight-lattice fuel assemblies to some extent. There is a need for further research.
In this work, post-dryout heat transfer experiments in a 3-rod tight-lattice rod bundle are carried out. Circumferentially non-uniform heat transfer in various heat transfer regions is observed and analyzed. Parametric effects on post-dryout heat transfer are discussed. New correlations are proposed to predict post-dryout heat transfer in tight-lattice rod bundles under low mass flux and low heat flux.
2. Experimental Facility
Figure 1 shows the schematic diagram of the experimental apparatus (Supercritical WAter MUltiPurpose loop, SWAMUP-II) at Shanghai Jiao Tong University. Details of the experimental apparatus have been presented in our previous study [22], and the scope of the test parameters is given in Table 1.
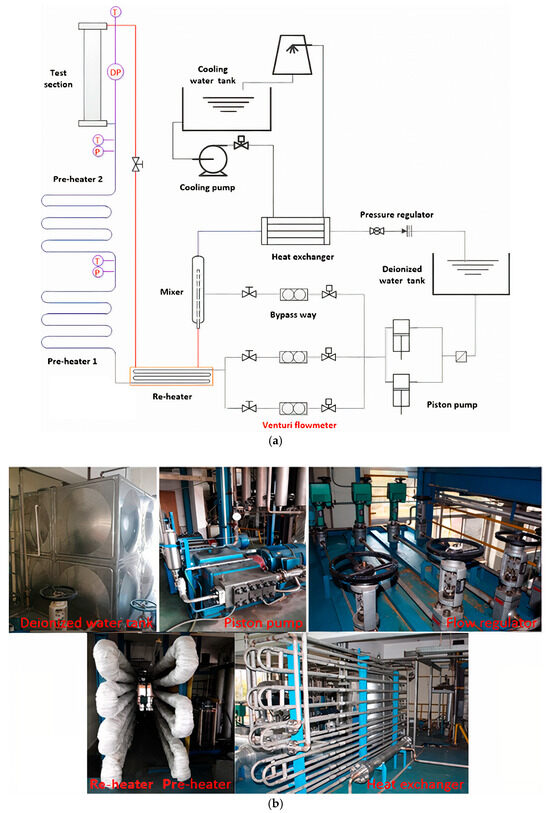
Figure 1.
Schematic diagram and picture of experimental apparatus: (a) Schematic diagram of experimental loop; (b) Picture of the experimental facility.

Table 1.
Scope of experimental parameters.
As displayed in Figure 2a, the experimental section consists of three heating rods and three semi-circular ceramic rods, which are arranged in a triangular pattern and placed in a ceramic flow channel. The heating rod is made of alloy 625, of which the inner diameter is 12 mm and the outer diameter is 15 mm. The pitch-to-diameter ratio is 1.2. The effective heating length is 1960 mm. As shown in Figure 2b, five spacer grids made of 304 stainless steel are evenly spaced at 470 mm intervals along the axial direction to fix the rod bundle. The honeycomb structure and detailed dimensions of the spacer grid can be observed in Figure 2c.
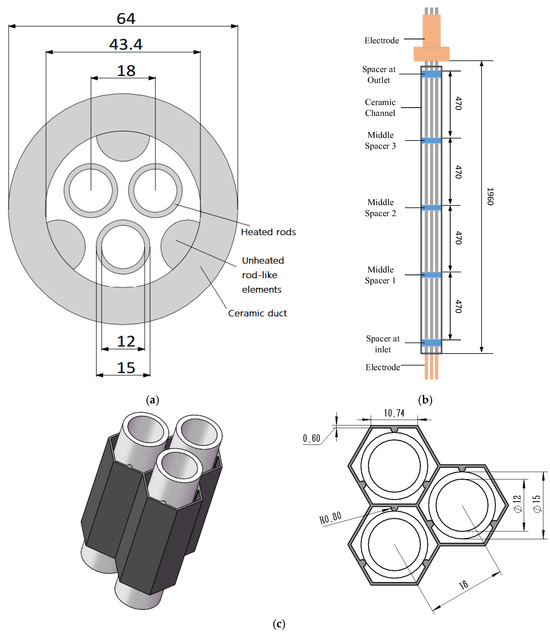
Figure 2.
Structure of test section [22]. (a) Cross section (Top view); (b) Test section (Front view); (c) Spacer grid.
Details of the temperature-measuring device have been presented in our previous study [22]. The temperature-measuring points are shown in Figure 3a,b; each heating rod cross-section has four evenly distributed temperature measurement points, with each point at a different angular position. Taking into account the symmetrical structure of the channel, all the temperature measurement points could correspond to the 0–180° direction of the rod. As depicted in Figure 3c, there are 10 temperature measuring sections between adjacent spacer grids, totalling thirty-three measuring sections in the axial direction.
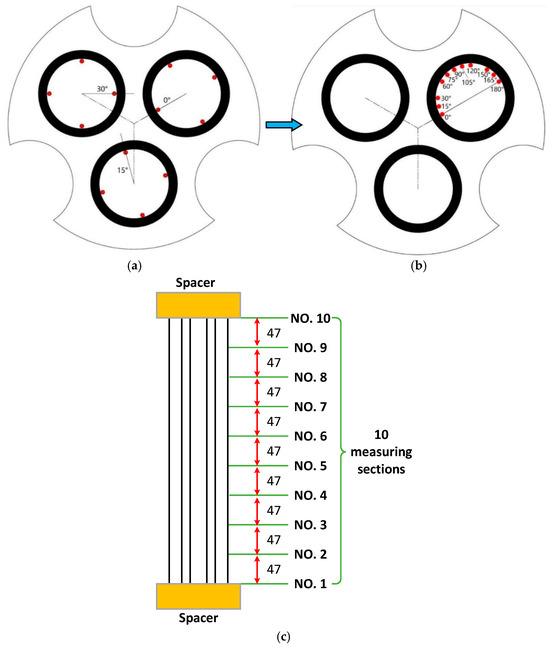
Figure 3.
Schematic diagram of thermocouple measurement scheme: (a) Thermocouple locations in the horizontal section; (b) Projection positions of the thermocouples; (c) Arrangements of measuring sections in the vertical direction.
3. Data Reduction
The experimental heating rod is made of Inconel 625 alloy, and its thermal and electrical properties are shown in Table 2. It can be observed that within a wide range of temperature variations, the resistivity of this material remains essentially constant. Therefore, the difference in heating power along the length of the rod due to changes in resistivity is negligible. The 3-rod bundle could be regarded as a uniformly heated test section, and the heat flux q is calculated as:
Table 2.
Thermal and electrical properties of Alloy 625.
Here, U and I denote the DC voltage and current applied to the rod bundle, respectively, while d is the rod’s outer diameter and L is the effective heating length.
Due to the uniform heating of the test section, the fluid enthalpy increases linearly, resulting in the local fluid enthalpy h being expressed as:
where z represents the axial distance from the inlet of the test section, W is the mass flow rate, η is the heating efficiency, and hin is the fluid enthalpy at the inlet. If the inlet fluid is in a single-phase state, hin can be obtained from the inlet pressure and temperature using the NIST properties database [23]. If the inlet fluid is in a two-phase state, hin should be derived from the heating power and efficiency of the accurately calibrated pre-heater. The inlet quality is expressed as:
where h′ denotes the water enthalpy in the saturation state, and hlg is the latent heat. The local bulk quality of the fluid can be calculated as:
Eter et al. [24] conducted a comparative analysis of one-dimensional and three-dimensional methods for calculating the outer wall temperature of heating rods. They found that the results from both approaches differed very little. Considering that the heating rod used in this experiment has a relatively thin wall, axial and circumferential heat conduction can be neglected. Therefore, the heating rod was divided radially into 100 layers, and the outer wall temperature Tw was derived from the measured inner wall temperature Twi using the one-dimensional heat conduction equation. The calculation method is as follows:
where qv represents the volumetric heat source, Twj and dj are the outer wall temperature and outer diameter of the jth layer, respectively. Correspondingly, Twj−1 and dj−1 are the inner wall temperature and inner diameter of the jth layer. kw represents the thermal conductivity. Based on the physical properties of Inconel 625 alloy provided in Table 2, the thermal conductivity data were fitted to establish the relationship between thermal conductivity and temperature (The temperature T was taken as the average of the inner and outer wall temperatures):
Given the outer wall temperature of the heating rod, the fluid temperature, and the heat flux, the heat transfer coefficient can be calculated using Newton’s cooling equation as follows:
In a dispersed flow state, the quality is high, and the vapor phase fraction is significant, approximating a single-phase steam condition. Therefore, the Nusselt number calculated using vapor phase properties is commonly used to characterize fluid heat transfer:
where kg is the thermal conductivity of the vapor phase, and Dh is the hydraulic diameter of the flow channel cross-section.
where Ac is the flow area of the channel, and Pw is the wetted perimeter of the channel. The Reynolds number is an important parameter used to characterize the turbulent state of the fluid. The Reynolds numbers for the full vapor phase and partial vapor phase are calculated as follows:
where G is the mass flow rate of the test section, μg is the dynamic viscosity of the vapor phase, and Re is the Reynolds Number.
The experimental physical quantities are divided into two categories: directly measured and indirectly measured parameters. The uncertainties of the directly measured parameters (e.g., diameter, pressure, mass flow rate, temperature) can be determined from the instrument manual. In contrast, the uncertainties of the indirectly measured parameters (e.g., heat flux, fluid quality) are derived from the directly measured parameters using methods reported by Liu et al. [25]. Table 3 lists the uncertainties of the main test parameters.
Table 3.
Uncertainties of main test parameters.
For indirectly measured parameters, the relative error could be calculated according to the error propagation analysis:
where is the relative error of the root mean square of the derived parameter y, is the uncertainty of parameter y, and ni is the measured parameter. Hence, the relative errors of the heat efficiency η, the HTC, and the Nusselt number Nu could be calculated as follows:
4. Result Discussions
4.1. Determination of Different Heat Transfer Regimes
The test section entrance is characterized by a two-phase state, which evolves into downward flow development with continuous heating. The fluid will subsequently experience nuclear boiling, drying out, transition boiling, and film boiling until it reaches the outlet superheated steam state. Figure 4 illustrates the change of wall temperature along the axial direction at different angles in a specific working condition, revealing that the trend in wall temperature variation with respect to position is similar across all angles. Therefore, this study will employ average wall temperatures to capture turning points in various heat transfer regimes and separately investigate heat transfer characteristics within each regime.
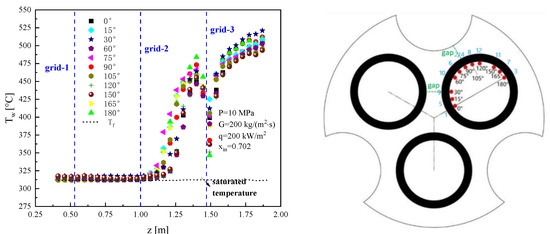
Figure 4.
Variation of wall temperatures at different angles with axial height.
The average wall temperature variation along the heating rod is depicted in Figure 5. In the high-quality nuclear boiling regime within an annular flow region, the convective heat transfer through the liquid film is extremely effective, and the wall temperature approaches the saturation temperature. With the development of the flow, the liquid film gradually dries out, exposing part of the heating rod surface, resulting in the sudden rise in wall temperature. Downstream of the dryout point within the tight-lattice bundle, the narrow channel geometry significantly amplifies the influence of surface tension. This leads to a temporary rewetting phenomenon where liquid, driven by surface tension overcoming transient flow inertia, adheres to the wall surface. Consequently, the wall temperature decreases. Subsequently, this liquid film evaporates, causing the wall temperature to rapidly escalate again. This region is thus characterized by transition boiling. This process continues until the wall temperature exceeds the minimum limit of film boiling, at which point droplets within the gas core can no longer wet the heating rod, and it becomes completely dry.
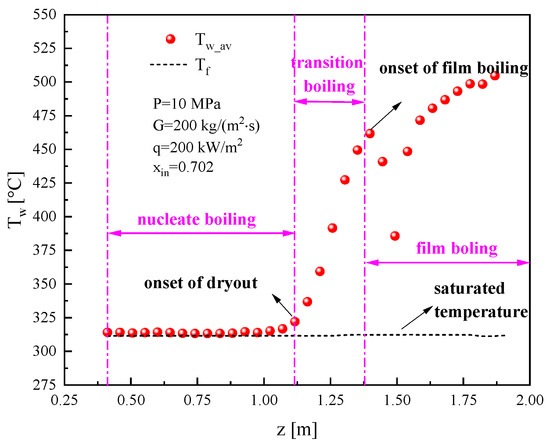
Figure 5.
Determination of different heat transfer regions.
According to this analysis, we decided to select the first point where the wall temperature rapidly increases as the dryout point and the first point where the trend of rising wall temperatures slows down as the film boiling onset. The boundary between film boiling and single-phase vapor heat transfer is determined by comparing the saturation temperature at the current pressure with the bulk temperature. These points will be used to divide different heat transfer regimes in the following sections. It is worth mentioning that dispersed flow is a characteristic of the post-dryout heat transfer regime. In this work, the flow characteristic is used to mark the corresponding heat transfer regime.
4.2. Circumferentially Non-Uniform Heat Transfer
The surface wall temperature of the heating rod will exhibit different circumferential distribution characteristics under the influence of geometric structure and fluid parameters, as opposed to a single pipe. Figure 6 shows the circumferential wall temperature distribution at P = 8 MPa, G = 150 kg/(m2s), q = 150 kW/m2, and xin = 0.729 in the tight lattice, with the x-axis representing the angular direction (0–180°) and the y-axis representing the axial height and average quality. It can be observed that the heating rod experiences drying out at z = 1.164 m in all directions, followed by a rapid increase in wall temperature as quality increases. Additionally, it is found that the spacer grid has little impact on wall temperature before drying out, but significantly reduces wall temperature after drying out. This suggests that heat transfer during nucleate boiling primarily relies on phase change, while the enhanced heat transfer effect due to turbulence downstream of the spacer grid is relatively weak. In contrast, in regions with poor thermal conductivity after drying out, direct contact between droplets and the heated surface plays a crucial role in heat transfer enhancement. The reduced wall temperature at z = 1.164 m indicates that the spacer grid has an enhanced effect on reducing wall temperature due to increased turbulence downstream.
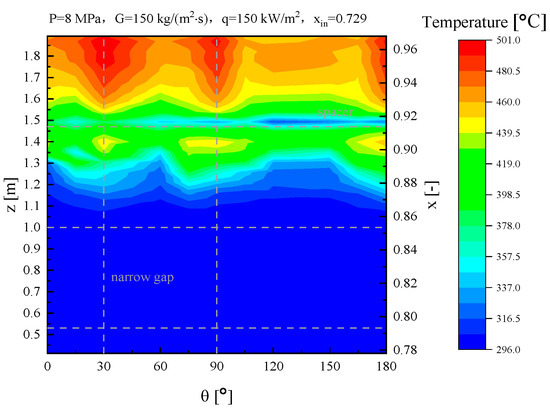
Figure 6.
Contour plot of circumferential wall temperature distributions in the tight-lattice rod bundle.
Upon examining a cross-sectional slice at a fixed axial height, it is readily apparent that the circumferential wall temperature distribution before drying out exhibits uniformity. However, following drying out, localized hot spots emerge near the 30°, 90°, and 180° directions. There are two reasons for this phenomenon. One is that these angular orientations are towards the narrow gaps, where the flow areas are small. The high flow resistance leads to low flow velocity. The other one is that vapor entrapment is prone to occur in the narrow gap; the high thermal resistance of the vapor plug would reduce the heat transfer. As a result, the localized hot spots appear in the narrow gaps.
The wall temperature data obtained at z = 0.929 m, 1.258 m, and 1.728 m can be used to quantitatively investigate the changes in circumferential wall temperature distribution across different heat transfer regimes, as shown in Figure 7. In the nucleate boiling regime, the rod bundle’s circumferential wall temperatures are similar, with a maximum temperature difference of 2.3 °C. In the transition boiling regime, the wall temperature exhibits significant fluctuations along the circumference, with non-uniformity reaching its peak and a maximum temperature difference of up to 79.3 °C. Conversely, in the film boiling regime, except for localized regions where temperatures are significantly higher due to narrow gaps, other angular directions exhibit relatively small temperature differences, with the highest wall temperature being 489.2 °C and the lowest being 450.5 °C, resulting in a reduced circumferential temperature difference of 38.7 °C and diminished heat transfer non-uniformity.
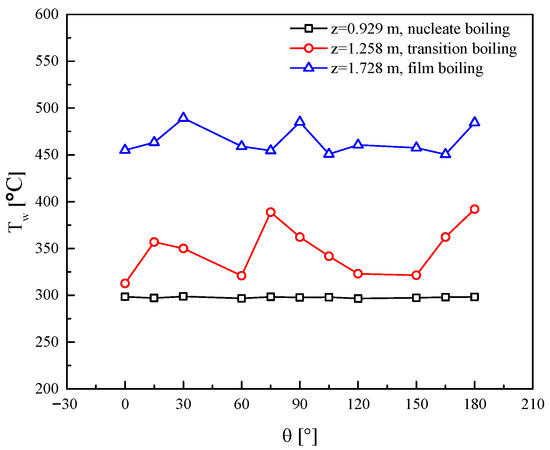
Figure 7.
Distribution of circumferential wall temperatures in different heat transfer regions.
4.3. Heat Transfer Characteristics in Regions Without Grid Effects
4.3.1. Determination of the Regions Without Grid Effects
Figure 8 illustrates the circumferential average wall temperature variation with axial height for a specific operating condition, characterized by P = 8 MPa, G = 200 kg/(m2s), q = 200 kW/m2, and xin = 0.729. Before drying out, the intermediate grid (grids 1 and 2) has a relatively weak influence on wall temperature, with little change in the overall trend of wall temperature variation. Following drying out, it is observed that when the fluid flows through grid 3, there is a significant reduction in wall temperature, which reaches its minimum value at the outlet and then gradually returns to its original trend. At this point, the grid effect is considered to have been eliminated. It should be noted that due to the lack of noticeable grid effects before drying out, we will use the same distance for determining the unaffected region as in the dispersed flow.
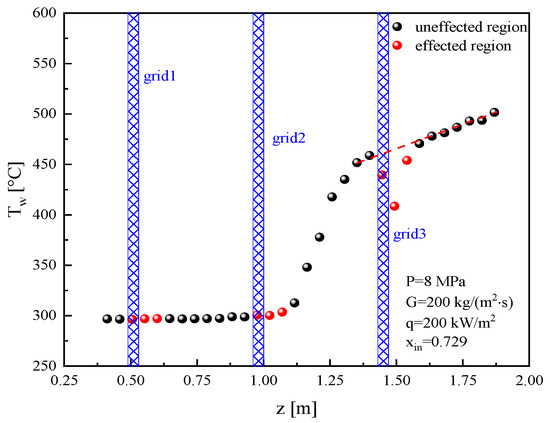
Figure 8.
Method for determining the regions without grid effects.
4.3.2. Analysis of Factors Affecting Post-Dryout Heat Transfer
Following drying out, the dispersed flow state is characterized by a uniform distribution of droplets in the gas phase mainstream. The system thermal-hydraulic parameters directly influence the dispersed flow heat transfer characteristics through their effects on droplet size, gas-phase velocity, and fluid properties. The following sections will examine the individual impacts of mass flow rate, heat flux, and pressure on dispersed flow heat transfer in the tight lattice rod bundle.
- Effect of mass flux
Figure 9a compares wall temperature at P = 6 MPa, q = 200 kW/m2, and different mass flow rates. The superheat of wall temperature is defined as the difference between the wall temperature and the saturation temperature. It can be seen that in the post-dryout heat transfer regime, the superheat of wall temperature exhibits a negative correlation with mass flow rate across various heat transfer regimes. It is shown that in the regime of severe heat transfer degradation, increasing the mass flow rate is an effective means of protecting the safety of the heated wall.
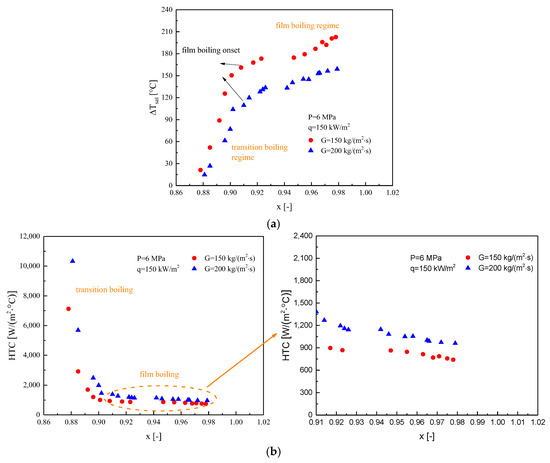
Figure 9.
Effect of mass flow rate on post-dryout heat transfer: (a) superheat of wall temperature; (b) heat transfer coefficient.
As shown in Figure 9b, the influence of mass flow rate on the convective heat transfer coefficient is significant. After drying out, the convective heat transfer coefficients for all operating conditions decrease sharply as a function of quality, reaching a stable value in the nucleate boiling regime, where fluid thermal performance is extremely poor and there is a risk of overheating leading to wall damage. It was observed that regardless of whether it is in the transition or nucleate boiling regimes, at the same quality, higher mass flow rate operating conditions correspond to larger convective heat transfer coefficients. The analysis of post-dryout thermal mechanisms reveals two primary reasons for this phenomenon: (a) At high mass flow rates, the convective heat transfer between vapor and droplets is strengthened, resulting in increased evaporation absorption by droplets, lower vapor temperature, and thus a higher convective heat transfer coefficient. (b) The convective heat transfer between vapor and heated wall contributes increasingly to the wall heat flux as the quality increases. Therefore, an increase in mass flow rate will significantly enhance fluid thermal performance.
- Effect of heat flux
Using P = 8 MPa, G = 150 kg/(m2s), and q = 75, 100, and 150 kW/m2 as examples, the influence of heat flux on the superheat of wall temperature is analyzed. As shown in Figure 10a, the trends of wall temperature excess variation with liquid fraction are similar for each operating condition; however, it is evident that at higher heat flux, convection heat transfer transfers earlier from transition boiling to film boiling regimes. Moreover, it is observed that within the film boiling regime, the superheat of wall temperature increases more rapidly in high-heat-flux conditions, rising by 31.7 °C over a quality increasing range of 0.059. This is closely related to the higher and sustained vapor superheating characteristic of these operating conditions.
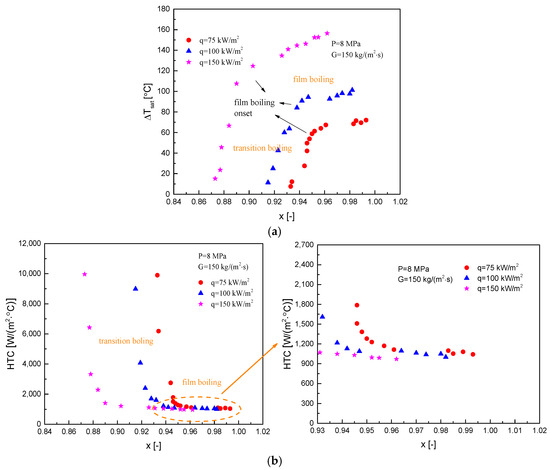
Figure 10.
Effect of heat flux on post-dryout heat transfer: (a) superheat of wall temperature; (b) heat transfer coefficient.
Figure 10b illustrates the variation of the heat transfer coefficient with steam quality under different heat fluxes, exhibiting distinct impact characteristics across various heat transfer regimes. In the transition boiling regime, higher heat fluxes lead to lower heat transfer coefficients. This phenomenon arises from the intensified evaporation of the newly deposited liquid film on the heated surface at higher heat fluxes, resulting in reduced surface wetting and consequently poorer heat transfer performance. Conversely, in the film boiling regime, heat transfer is primarily governed by steam convection, rendering the heat transfer coefficient insensitive to changes in heat flux.
- Effect of system pressure
Figure 11a presents the variation of superheat of wall temperature along the flow path at different pressure conditions, with G = 200 kg/(m2s) and q = 100 kW/m2. It can be observed that the onset quality of film boiling slightly increases with increasing pressure. The influence of pressure on superheat of wall temperature remains consistent across different heat transfer regimes, indicating that at the same quality, higher pressures correspond to lower superheat of wall temperature. Under the experimental conditions studied, it is noted that at higher pressures, the impact of further pressure increase on the superheat of wall temperature becomes more pronounced. For instance, in the film boiling regime, when the pressure rises from 6 MPa to 8 MPa, the superheat of the wall temperature decreases by approximately 7 °C. However, with a further increase in pressure to 10 MPa, the reduction in superheat becomes more significant, decreasing by approximately 15 °C. This trend suggests that during a heat rod rupture accident in a reactor, as the upper portion of the core gradually becomes uncovered and enters into dispersed flow heat transfer, during the rapid pressure decrease of the initial accident stage, the surface temperature of components will increase rapidly, requiring special attention in safety analysis.
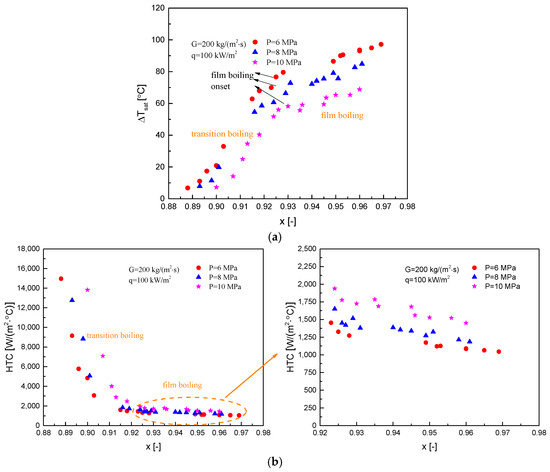
Figure 11.
Effect of system pressure on post-dryout heat transfer: (a) superheat of wall temperature; (b) heat transfer coefficient.
The influence of pressure on dispersed flow heat transfer coefficients can be observed in Figure 11b. In the film boiling regime at various pressures, the heat transfer coefficients slightly decrease as the quality increases. While the heat transfer capability continues to weaken, the degradation rate is significantly lower compared to the transition boiling regime. Comparing heat transfer coefficients at different pressures but the same quality reveals a monotonically increasing trend with pressure. Two reasons contribute to this positive effect: firstly, with increasing pressure, the vapor phase density increases while the liquid phase density remains nearly unaffected due to incompressibility, resulting in a reduction in surface tension and a decrease in the size of liquid droplets. At the same quality, the total surface area of all droplets, hence the heat transfer area, increases, enhancing convective heat transfer between vapor and liquid droplets. Secondly, higher pressure leads to higher vapor thermal conductivity, improving the heat transfer performance between the vapor and the heated surface. With the combined effect of these two mechanisms, the heat transfer coefficient in the dispersed flow heat transfer region after dryout always increases with increasing system pressure.
4.3.3. Evaluation and Development of Correlations for Post-Dryout Heat Transfer
The accurate prediction of heat transfer performance in the transition boiling and film boiling regimes experienced by the heated surface of rod bundles after dryout is crucial for analyzing the safety of core fuel elements following loss-of-flow accidents. Therefore, various researchers have proposed heat transfer coefficient calculation equations for these two heat transfer regimes. This section evaluates the applicability of these correlations under current low-flow and low-heat-flux conditions and will propose new heat transfer correlations with enhanced predictive accuracy based on available experimental data.
Transition Boiling Correlations
Transition boiling, also known as unstable film boiling, involves intermittent occurrences of nucleate boiling and film boiling, resulting in unstable heat transfer. This instability adds certain difficulties to experimental investigations, leading to relatively scarce experimental data and limited available heat transfer correlations related to transition boiling. The detailed forms of the correlations for transition boiling in the literature are summarized in Table 4.
Table 4.
Transition boiling correlations used for comparison.
The experimental data for a certain operating condition were selected to compare the predictive performance of different transition boiling correlations, as illustrated in Figure 12. It can be observed from the figure that there are significant differences among the predictions of the various correlations. The Tong correlation predicts a relatively constant transition boiling heat transfer coefficient over the given range of quality, failing to reflect the trend observed in the experimental results, indicating its limited applicability. The Mattson correlation, while able to capture the rapid decline in the heat transfer coefficient after dryout, generally overestimates the values, especially near the dryout point, where it significantly overestimates the contribution of liquid film evaporation, resulting in higher heat transfer coefficients. In contrast, the Condie-Bengtson correlation accurately predicts the heat transfer coefficient in the initial stages of transition boiling, but as the quality increases and approaches film boiling, it considerably underestimates the heat transfer capability, demonstrating its limited applicability at higher superheat of wall temperatures. The Nguyen-Moon correlation provides accurate predictions for the later stages of transition boiling heat transfer coefficients but significantly underestimates the coefficients in the earlier stages.
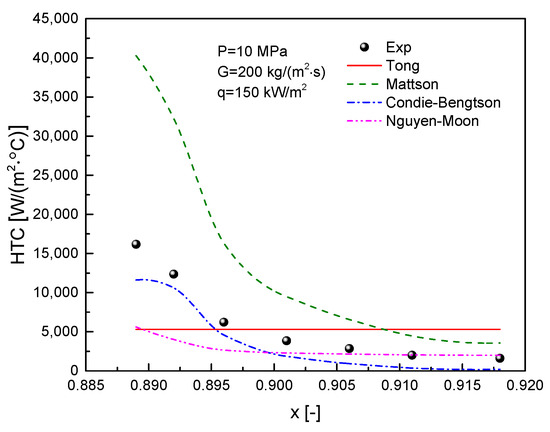
Figure 12.
Comparison of different transition boiling correlations.
To comprehensively evaluate the effectiveness of various transition boiling correlations, Figure 13 presents a comparison of the predicted results from all correlations against experimental data for all operating conditions. The mean deviation and root mean square (RMS) deviation are summarized in Table 5. It is evident that each correlation exhibits substantial deviations from the experimental results. For heat transfer coefficients greater than 5000 W/(m2·°C, the Tong correlation maintains a prediction error within −80%. However, for lower heat transfer coefficients, the deviation can reach up to +500%, indicating a very limited range of applicability. The Mattson correlation similarly overpredicts the experimental results, and its high RMS deviation suggests significant scatter in the calculated values, indicating suboptimal applicability. The Condie-Bengtson correlation achieves prediction errors within ±25% for most data points where the heat transfer coefficient exceeds 7500 W/(m2·°C). However, as the heat transfer coefficient decreases, the error increases linearly, resulting in an overall underprediction across the entire range of conditions tested in this study, with an average deviation of −45.0%. In contrast, the Nguyen-Moon correlation demonstrates relatively better predictive capability. Except for a few data points, its prediction errors range from −80% to +50%, with comparatively lower mean and RMS deviations. However, it is also observed that the correlation shows significant deviations in regions with high heat transfer coefficients, where the absolute error remains substantial.
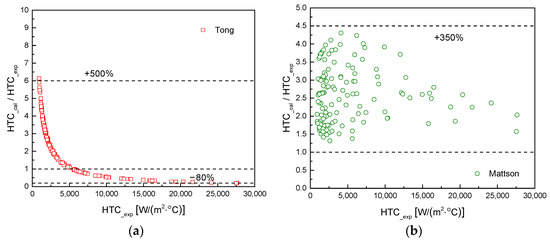
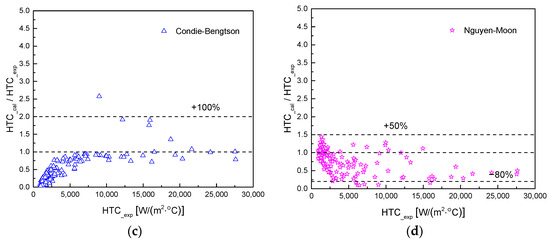
Figure 13.
Comparison of predictions by various transition boiling correlations and experimental data: (a) Tong correlation; (b) Mattson correlation; (c) Condie-Bengtson correlation; (d) Nguyen-Moon correlation.
Table 5.
Estimation of the prediction accuracies of transition boiling correlations.
In conclusion, the existing transition boiling correlations in the literature are not suitable for low-flow, low-heat-flux conditions. Therefore, there is a need to develop new predictive correlations for these conditions.
Considering the heat transfer mechanisms of transition boiling, nucleate boiling occurs when the surface is wetted. During this regime, the superheat of the wall temperature affects vapor nucleation and the evaporation phase transition process. Therefore, the nucleate boiling heat transfer can be characterized using a function of the superheat of the wall temperature. When the surface dries out, film boiling occurs, and vapor convection becomes the primary heat transfer mechanism. Consequently, the Dittus-Boelter equation form can be referenced by incorporating the Reynolds and Prandtl numbers. However, since the vapor superheat is influenced by the wall temperature, the vapor Prandtl number used in the convective heat transfer term will be referenced to the wall temperature. Additionally, the superheat of the wall temperature will be introduced for correction. By fitting the experimental data, the following new transition boiling correlation was obtained:
The predictive results of the new transition boiling correlation are illustrated in Figure 14. The new correlation aligns well with the majority of the experimental data, with deviations within ±25%. The mean deviation of the predicted values is 1.7%, and the root mean square (RMS) error is 15.3%, demonstrating a strong correlation with the experimental results.
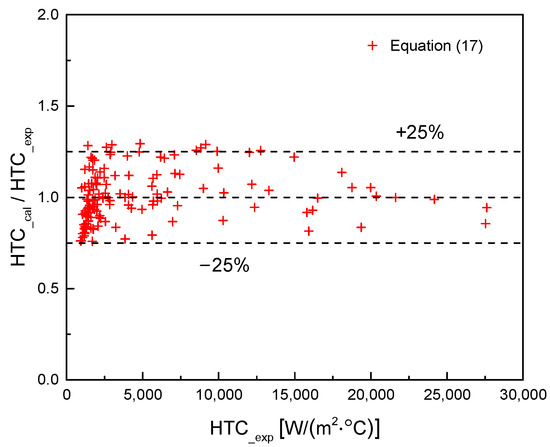
Figure 14.
Comparison of predictions by the new transition boiling correlation and experimental data.
Film Boiling Correlations
Over the past several decades, numerous predictive correlations for film boiling heat transfer have been developed by scholars, primarily focusing on circular tubes. However, there are very few correlations developed specifically for rod bundles. It is well known that the presence of subchannels in rod bundles complicates heat transfer, and the applicability of existing film boiling correlations for circular tubes remains to be further evaluated. Since film boiling closely resembles single-phase vapor convective heat transfer, most correlations proposed by scholars are similar in form to the Dittus-Boelter correlation, modified by factors such as quality and the two-phase density ratio. The related correlations are listed in Table 6.
Table 6.
Film boiling correlations used for comparison.
The film boiling heat transfer correlations were applied to the same operating condition, and the results are shown in Figure 15. Different correlations exhibit varying predictive capabilities when compared to the experimental data. The experimentally measured film boiling heat transfer coefficient monotonically decreases with increasing quality. However, the Miropolskiy and Collier correlations show an opposite trend, with the Collier correlation significantly overpredicting the heat transfer coefficient for the current condition, and the Miropolskiy correlation slightly overestimating the heat transfer capability in this region. The predictions from the Slaughterbeck, Polomik, and Bishop correlations are not sensitive to changes in quality. The Bishop correlation, which uses liquid-phase properties for calculations, is overly optimistic in its prediction of film boiling heat transfer, whereas the Slaughterbeck and Polomik correlations yield more conservative results.
Figure 15.
Comparison of various film boiling correlations.
For the current conditions, the Groeneveld correlation provides the closest match to the experimental values. However, it still falls short of accurately predicting the trend of the heat transfer coefficient decreasing with increasing quality.
Figure 16 presents the predictive results of various film boiling correlations against all experimental data points to evaluate the overall applicability of each correlation.
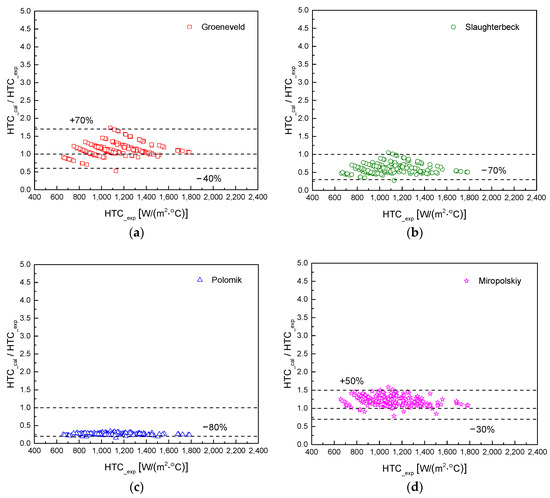
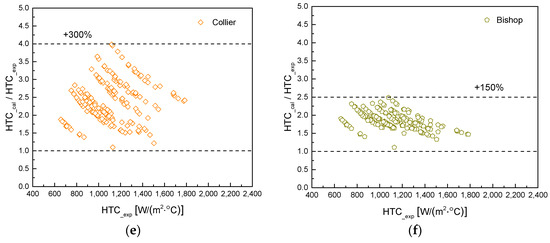
Figure 16.
Comparison of predictions by different film boiling correlations and experimental data: (a) Groeneveld correlation; (b) Slaughterbeck correlation; (c) Polomik correlation; (d) Miropolskiy correlation; (e) Collier correlation; (f) Bishop correlation.
Table 7 quantitatively lists the prediction errors for each correlation. It can be observed that the predictions of the Collier and Bishop correlations significantly exceed the experimental results, especially in the low heat transfer coefficient region, rendering their predictions highly unsatisfactory. The average deviations for these two correlations are as high as 139.1% and 85.7%, respectively, with less than 6% of the data points having prediction errors within ±50%, indicating poor conservatism when using these correlations. The Polomik correlation consistently shows prediction errors around −80%, making its overly conservative estimates of the film boiling heat transfer coefficient inadequate for accurately characterizing and predicting the heat transfer characteristics in the post-dryout film boiling region within rod bundles. Although the Slaughterbeck and Miropolskiy correlations exhibit lower scatter in their predictions, they also show varying degrees of deviation, with only about 19% and 75% of the experimental data points having prediction errors within ±30%, respectively. Comparatively, the Groeneveld correlation has the smallest average deviation. However, it is evident that as the heat transfer coefficient decreases, the prediction error shifts from negative to positive and increases up to +70%. This indicates that the Groeneveld correlation loses its applicability as film boiling transitions to single-phase vapor convective heat transfer.
Table 7.
Estimation of the prediction accuracies of film boiling correlations.
The above discussion highlights that existing film boiling correlations for circular tubes are not fully applicable to rod bundle structures, particularly under the low-flow, low-heat-flux conditions investigated in this study. Therefore, it is necessary to develop new film boiling heat transfer correlations.
The new correlation is similarly based on the single-phase convective heat transfer equation, incorporating parameter correction terms from both the Miropolskiy and Groeneveld correlations. By fitting the film boiling data for all experimental conditions, the newly derived correlation is as follows:
As shown in Figure 17, the discrepancy between the Nusselt numbers calculated using the new film boiling correlation and the experimental Nusselt numbers is within ±10%, indicating excellent agreement. The average deviation of the predicted values from the experimental results is 0.2%, with a root mean square (RMS) error of 4.8%.
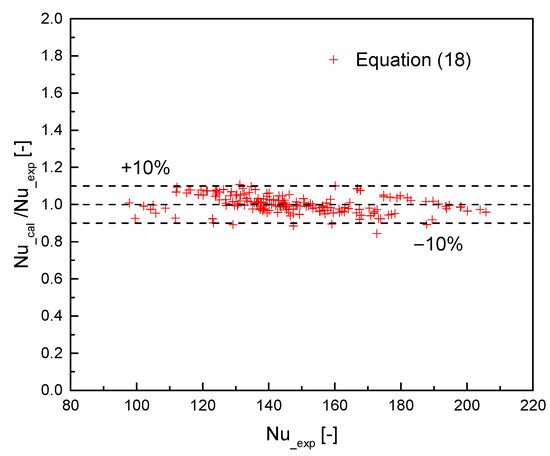
Figure 17.
Comparison of predictions by the new film boiling correlation and experimental data.
5. Conclusions
This paper presents an experimental study on the heat transfer characteristics in different regimes of a tight-lattice fuel assembly after dryout. The main conclusions are as follows:
- (1)
- The circumferential wall temperature distribution in the heat transfer regimes after dryout is significantly non-uniform. The temperature is higher in the narrow gaps and lower in the subchannel center. Additionally, the non-uniformity of wall temperature in the transition boiling region is the largest, while that in the nucleate boiling region is the least.
- (2)
- The thermal parameters have significant effects on the dispersed flow heat transfer in the no-grid effect region, and the heat transfer coefficient increases with increasing pressure and mass flow rate and decreases with increasing heat flux (except in the film boiling regime). The specific mechanisms have been discussed in detail.
- (3)
- From the comparison with the experimental data, it is found that the existing transition boiling and film boiling correlations show significant deviations. Hence, to meet the predictive needs for dispersed flow heat transfer in tight-lattice rod bundles, this study has developed more accurate heat transfer correlations. The prediction deviations are within ±25% for the transition boiling region and within ±10% for the film boiling region.
Author Contributions
Conceptualization, S.C.; Methodology, S.C.; Software, X.W.; Validation, W.Z. and X.W.; Formal analysis, S.C. and W.Z.; Investigation, S.C. and W.Z.; Resources, S.C.; Data curation, W.Z. and X.W.; Writing—original draft, S.C.; Supervision, S.C.; Project administration, S.C.; Funding acquisition, S.C. All authors have read and agreed to the published version of the manuscript.
Funding
This research was funded by the National Natural Science Fund of China (No. 12305188).
Data Availability Statement
The data presented in this study are available on request from the corresponding author due to the sharing policy limitations of the supporting fund.
Conflicts of Interest
The authors declare no conflicts of interest.
Correction Statement
This article has been republished with a minor correction to the Data Availability Statement. This change does not affect the scientific content of the article.
Nomenclature
The following abbreviations are used in this manuscript:
| d | outer diameter, m |
| Dh | hydraulic diameter, m |
| G | mass flux, kg/(m2s) |
| hin | enthalpy of inlet fluid, J/kg |
| I | current, A |
| k | thermal conductivity, W/(m·°C) |
| L | effective heating length, m |
| ni | the directly measured parameter |
| Nu | Nusselt number, dimensionless |
| P | Pressure, MPa |
| Pw | the wetted perimeter of the channel |
| Pr | Prandtl number, dimensionless, Pr = μ·cp/k |
| q | heat flux, W/m2 |
| qv | volumetric heat source, W/m3 |
| Re | Reynolds number, dimensionless |
| Tb | bulk temperature, °C |
| Twi | inner wall temperature, °C |
| Two | outer wall temperature, °C |
| U | voltage, V |
| W | mass flow rate, kg/s |
| x | quality |
| y | the indirectly measured parameter |
| z | axial distance from the inlet, m |
| Greek symbols | |
| η | heat efficiency |
| μ | dynamic viscosity, Pa·s |
| ρ | density, kg/m3 |
| relative error of the root mean square error | |
| uncertainty of the parameter | |
| θ | the angular direction |
| Subscripts | |
| exp | experimental |
| l | liquid |
| g | gas |
| in | inlet |
| j | index |
| out | outlet |
| sat | saturation state |
| sub | subcooled |
| tp | two-phase |
| Acronyms | |
| ALWR | Advanced Light Water Reactor |
| CHF | Critical Heat Flux, W/m2 |
| DNB | Departure of Nucleate Boiling |
| DO | Dry-Out |
| HTC | Heat Transfer Coefficient, W/(m2·°C) |
| LOCA | Loss of Coolant Accident |
| SCWR | SuperCritical Water Reactor |
| SWAMUP | Supercritical WAter MUltiPurpose loop |
| MAE | Mean Absolute Error |
| RMSE | Root Mean Squared Error |
References
- Boyd, W.A. Thermal-Hydraulic Analysis of Tight Lattice Light Water Reactors; Massachusetts Institute of Technology: Cambridge, MA, USA, 1977. [Google Scholar]
- Iwamura, T.; Uchikawa, S.; Okubo, T.; Kugo, T.; Akie, H.; Nakano, Y.; Nakatsuka, T. Concept of innovative water reactor for flexible fuel cycle (FLWR). Nucl. Eng. Des. 2006, 236, 1599–1605. [Google Scholar] [CrossRef]
- Karahan, A. Possible design improvements and a high power density fuel design for integral type small modular pressurized water reactors. Nucl. Eng. Des. 2010, 240, 2812–2819. [Google Scholar] [CrossRef]
- Chen, J.C. A short review of dispersed flow heat transfer in post-dryout boiling. Nucl. Eng. Des. 1986, 95, 375–383. [Google Scholar] [CrossRef]
- Groeneveld, D. Post-dryout heat transfer: Physical mechanisms and a survey of prediction methods. Nucl. Eng. Des. 1975, 32, 283–294. [Google Scholar] [CrossRef]
- Shah, M.M. Comprehensive correlation for dispersed flow film boiling heat transfer in mini/macro tubes. Int. J. Refrig. 2017, 78, 32–46. [Google Scholar] [CrossRef]
- Heineman, J. An Experimental Investigation of Heat Transfer to Superheated Steam in Round and Rectangular Channels; Argonne National Lab: Lemont, IL, USA, 1960.
- Swenson, H.S.; Carver, J.R.; Szoeke, G. The effects of nucleate boiling versus film boiling on heat transfer in power boiler tubes. J. Eng. Power 1962, 84, 365. [Google Scholar] [CrossRef]
- Polomik, E.E.; Levy, S.; Sawochka, S.G. Film boiling of steam-water mixtures in annular flow at 800, 1100, and 1400 psi. J. Heat Transf. 1964, 86, 81. [Google Scholar] [CrossRef]
- Bennett, A.; Kearsey, H.; Keeys, R. Heat Transfer to Mixtures of High Pressure Steam and Water in an Annulus. Part VI. A Preliminary Study of Heat Transfer Coefficient and Heater Surface Temperature at High Steam Qualities; United Kingdom Atomic Energy Authority: Abingdon, UK, 1964.
- Bennett, A.W.; Hewitt, G.F.; Kearsey, H.A.; Keeys, R.K.F. Heat transfer to steamwater mixtures flowing in uniformly heated tubes in which the critical heat flux has been exceeded. Proc. Inst. Mech. Eng. 1967, 182, 258–267. [Google Scholar]
- Keeys, R.; Ralph, J.; Roberts, D. Post-burnout heat transfer in high pressure steam–water mixtures in a tube with cosine heat flux distribution. In Proceedings of the International Symposium on Two-Phase Systems, Haifa, Israel, 29 August–2 September 1971. [Google Scholar]
- Groeneveld, D.; Moeck, E. An Investigation of Heat Transfer in the Liquid Deficient Regime; Atomic Energy of Canada Ltd., Chalk River Nuclear Labs: Chalk River, ON, Canada, 1969. [Google Scholar]
- Morris, D.G.; Mullins, C.B.; Yoder, J.G.L. An experimental study of rod bundle dispersed-flow film boiling with high-pressure water. Nucl. Technol. 1985, 69, 82–93. [Google Scholar] [CrossRef]
- Unal, C.; Tuzla, K.; Badr, O.; Neti, S.; Chen, J. Parametric trends for post-CHF heat transfer in rod bundles. J. Heat Transf. 1988, 110, 721–727. [Google Scholar] [CrossRef]
- Unal, C.; Tuzla, K.; Badr, O.; Neti, S.; Chen, J. Convective boiling in a rod bundle: Transverse variation of vapor superheat temperature under stabilized post-CHF conditions. Int. J. Heat Mass Transf. 1991, 34, 1695–1706. [Google Scholar] [CrossRef]
- Kumamaru, H.; Koizumi, Y.; Tasaka, K. Investigation of pre-and post-dryout heat transfer of steam-water two-phase flow in a rod bundle. Nucl. Eng. Des. 1987, 102, 71–84. [Google Scholar] [CrossRef]
- Varone, J.A.F.; Rohsenow, W.M. Post dryout heat transfer prediction. Nucl. Eng. Des. 1986, 95, 315–327. [Google Scholar] [CrossRef]
- Shi, J.X.; Yu, X.; Sun, B.Z.; Wu, W.Z.; Zhang, X.; Zhao, Z.R. A review on dryout and Post-dryout heat transfer inside tubes and tube bundles. Appl. Therm. Eng. 2023, 218, 119300. [Google Scholar] [CrossRef]
- Xia, Z.H.; Cheng, X. A new mechanistic model for post-dryout heat transfer based on two-region approach. Int. J. Heat Mass Transf. 2025, 245, 127035. [Google Scholar] [CrossRef]
- Möller, S.V. On phenomena of turbulent flow through rod bundles. Exp. Therm. Fluid Sci. 1991, 4, 25–35. [Google Scholar] [CrossRef]
- Chen, S.; Gu, H.; Liu, M.; Xiao, Y.; Cui, D. Experimental investigation on heat transfer to supercritical water in a three-rod bundle with spacer grids. Appl. Therm. Eng. 2020, 164, 114466. [Google Scholar] [CrossRef]
- Lemmon, E.; Huber, M.; McLinden, M. NIST Standard Reference Database 23: Reference Fluid Thermodynamic and Transport Properties-REFPROP; version 9.1.; National Institute of Standards and Technology: Gaithersburg, MD, USA, 2013.
- Eter, A.; Groeneveld, D.; Tavoularis, S. An experimental investigation of supercritical heat transfer in a three-rod bundle equipped with wire-wrap and grid spacers and cooled by carbon dioxide. Nucl. Eng. Des. 2016, 303, 173–191. [Google Scholar] [CrossRef]
- Liu, D.; Gu, H. Study on heat transfer behavior in rod bundles with spacer grid. Int. J. Heat Mass Transf. 2018, 120, 1065–1075. [Google Scholar] [CrossRef]
- Tong, L. Heat transfer in water-cooled nuclear reactors. Nucl. Eng. Des. 1967, 6, 301–324. [Google Scholar] [CrossRef]
- Mattson, R.; Condie, K.G.; Bengston, S.; Obenchain, C. Regression analysis of post-CHF flow boiling data. In Proceedings of the International Heat Transfer Conference Digital Library, Tokyo, Japan, 3 September 1974. [Google Scholar]
- Basile, D.; Beghi, M.; Chierici, R.; Salina, E.; Brega, E. COBRA-EN: An Upgraded Version of the COBRA-3C/MIT Code for Thermal Hydraulic Transient Analysis of Light Water Reactor Fuel Assemblies and Cores; Radiation Safety Information Computational Center, Oak Ridge National Lab: Oak Ridge, TN, USA, 1999.
- Nguyen, N.H.; Moon, S.-K. An improved heat transfer correlation for developing post-dryout region in vertical tubes. Nucl. Eng. Technol. 2015, 47, 407–415. [Google Scholar] [CrossRef]
- Groeneveld, D. Post-Dryout Heat Transfer at Reactor Operating Conditions; Atomic Energy of Canada Ltd.: Chalk River, ON, USA, 1973. [Google Scholar]
- Myint, A.; Tian, W.; Li, Z.; Qiu, S.; Jia, D.; Su, G. Experimental study on post-dryout heat transfer of dispersed flow in vertical narrow annuli. In Proceedings of the International Conference on Nuclear Engineering, Arlington, VA, USA, 25–29 April 2004; pp. 571–576. [Google Scholar]
- Polomik, E. transition boiling heat transfer program. Final Summary Report on Program for February 1963--October 1967; General Electric Co., Atomic Power Equipment Department: Schenectady, NY, USA, 1967. [Google Scholar]
- Miropolskiy, Z. Heat transfer in film boiling of a steam-water mixture in steam-generator tubes. Teplonergetika 1963, 10, 49–52. [Google Scholar]
- Collier, J. Heat Transfer and Fluid Dynamic Research as Applied to Fog Cooled Power Reactors; Atomic Energy of Canada Ltd.: Chalk River, ON, Canada, 1962. [Google Scholar]
Disclaimer/Publisher’s Note: The statements, opinions and data contained in all publications are solely those of the individual author(s) and contributor(s) and not of MDPI and/or the editor(s). MDPI and/or the editor(s) disclaim responsibility for any injury to people or property resulting from any ideas, methods, instructions or products referred to in the content. |
© 2025 by the authors. Licensee MDPI, Basel, Switzerland. This article is an open access article distributed under the terms and conditions of the Creative Commons Attribution (CC BY) license (https://creativecommons.org/licenses/by/4.0/).