Article

Study on Fatigue Damage Characteristics of Sandstone with Different Inclination Angles Under Freeze–Thaw Cycle Conditions

1
College of Civil Engineering & Architecture, Qingdao Agricultural University, Qingdao 266109, China
2
Ansteel Group Mining Co., Ltd., Anshan 114001, China
3
School of Resources and Safety Engineering, University of Science & Technology Beijing, Beijing 100083, China
*
Authors to whom correspondence should be addressed.
Appl. Sci. 2025, 15(17), 9757; https://doi.org/10.3390/app15179757
Submission received: 20 July 2025 / Revised: 26 August 2025 / Accepted: 4 September 2025 / Published: 5 September 2025

Abstract

Fractured rock masses in cold regions are subject to long-term seasonal freeze–thaw cycles. To investigate the fatigue damage characteristics of sandstone with different fracture inclinations under freeze–thaw cycling conditions, samples containing fractures of varying inclinations were prepared using sandstone from Altay, Xinjiang. After vacuum saturation and freeze–thaw cycling treatment (−30 °C to 30 °C), uniaxial cyclic loading tests were conducted to analyze strain, elastic modulus, Poisson’s ratio, and damage variables. The results showed that under cyclic loading, the strain of the sandstone exhibited a “stepwise accumulation” characteristic, with peak and residual strain increasing with the progression of the cycle. Among them, the specimen with a fracture angle of 45° exhibited the fastest strain increase before failure. The peak elastic modulus showed a “continuous decrease within each stage and an initial increase followed by a decrease between stages,” while the residual elastic modulus continued to decrease, with both experiencing a sudden, sharp drop at the end of the cycle. The peak Poisson’s ratio decreases with the number of cycles in the early stage, then transitions to logarithmic growth in the later stage, rapidly increases near failure, and finally, the residual Poisson’s ratio in the final cycle exceeds the peak Poisson’s ratio; the evolution of damage variables exhibits an S-shaped three-stage characteristic, with the initial stage showing an irreversible deformation growth rate exceeding 10% due to compaction. In the middle stage, it grows steadily due to microcrack propagation, and in the final stage, it approaches 1. Samples with steep inclination angles exhibit earlier damage initiation and faster growth rates. The study reveals that crack inclination angle influences the evolution rhythm by regulating the proportion of compaction and shear damage, providing a theoretical basis for assessing the engineering stability of fractured rocks in cold regions.

1. Introduction

In natural environments, freeze–thaw cycling is a prevalent physical process that significantly impacts rock materials. This phenomenon is particularly frequent in high-latitude, high-altitude, and seasonally variable temperature regions [1,2]. As a primary component of the Earth’s crust, rocks undergo complex internal structural changes under repeated freeze–thaw cycles, leading to material property degradation. This degradation not only affects the mechanical properties of the rock but also has significant implications for rock-related engineering fields such as hydraulic engineering [3], transportation infrastructure [2], and mining [4].
The damage mechanism of freeze–thaw cycles on rocks primarily stems from phase changes in water within rock pores and fractures. When temperatures drop below freezing, water in pores and fractures freezes into ice, expanding by approximately 9% in volume, generating substantial internal expansive pressure. As temperatures rise, the ice melts back into water, releasing the pressure [5,6,7]. This repetitive freeze–thaw process acts like repeated “internal impacts,” causing the initiation, propagation, and coalescence of microcracks within the rock, ultimately reducing its strength and compromising its integrity [8]. Engineering practices indicate that rock structures affected by freeze–thaw cycles, such as dam foundations, tunnel linings, and slope rock masses, are prone to instability and failure, posing significant threats to project safety and longevity while incurring substantial economic losses and potential safety risks [9,10,11,12].
Fractures, as ubiquitous defects in rocks, critically influence their mechanical properties [13,14]. The dip angle of fractures is a key parameter, altering internal stress distribution and thus affecting the damage evolution under external loading [15]. In the fatigue damage process under combined freeze–thaw cycles and external loading, the influence of fracture dip angle becomes more complex. On one hand, the expansive pressure and tensile forces from freeze–thaw cycles propagate along fracture planes, with different dip angles leading to varied transmission paths and stress distributions [16,17,18]. On the other hand, under the coupled effects of external and freeze–thaw-induced loading, fracture dip angles influence the degree and location of stress concentration, resulting in distinct fatigue damage characteristics [19,20]. However, research on the fatigue damage characteristics of fractured sandstone under freeze–thaw cycles, particularly considering different dip angles, remains limited.
Extensive studies have explored the effects of freeze–thaw cycles on rock mechanical properties [21,22,23]. Research indicates that as freeze–thaw cycle frequency increases, rock density and wave velocity decrease, porosity increases, and mechanical properties such as compressive and tensile strength significantly decline [24,25,26]. For instance, laboratory freeze–thaw tests have revealed varying sensitivities to freeze–thaw cycles among different rock types, such as granite, sandstone, and shale [27,28,29,30]. In the field of fractured rock mechanics, researchers have focused on the impact of fracture geometry (e.g., length, width, spacing, and dip angle) on rock strength and deformation [31,32,33]. Numerical simulations and laboratory tests have elucidated failure modes and mechanical responses under uniaxial and triaxial compression [34,35,36]. However, most studies focus on rock behavior under either freeze–thaw cycles or single loading conditions, with limited research on the coupled effects of freeze–thaw cycles and fatigue loading, particularly concerning the influence of fracture dip angles.
With the ongoing expansion of infrastructure projects in China, rock engineering increasingly faces the combined effects of freeze–thaw environments and complex loading conditions [37,38]. For example, in highway and railway construction in the Qinghai–Tibet Plateau, tunnel linings and slope rock masses are subject to prolonged freeze–thaw cycles while enduring vehicle and seismic loads [39]. In Northern China’s hydraulic projects, dam foundations and reservoir slopes face stability challenges under freeze–thaw cycles and water pressure. Thus, a thorough investigation into the fatigue damage characteristics of fractured sandstone with varying dip angles under freeze–thaw cycles is essential. Understanding damage evolution and mechanical mechanisms is critical for accurately assessing the stability and safety of rock engineering in cold regions, optimizing design and construction, and ensuring long-term operational stability.
This study combines laboratory testing and numerical simulation to systematically investigate the fatigue damage characteristics of fractured sandstone with different dip angles under freeze–thaw cycles and cyclic loading. By analyzing stress–strain relationships, fatigue life, and damage variable evolution, it elucidates the influence mechanism of fracture dip angle, providing theoretical and technical support for the design, construction, and maintenance of rock engineering in cold regions.

2. Materials and Methods

2.1. Sample Preparation and Processing

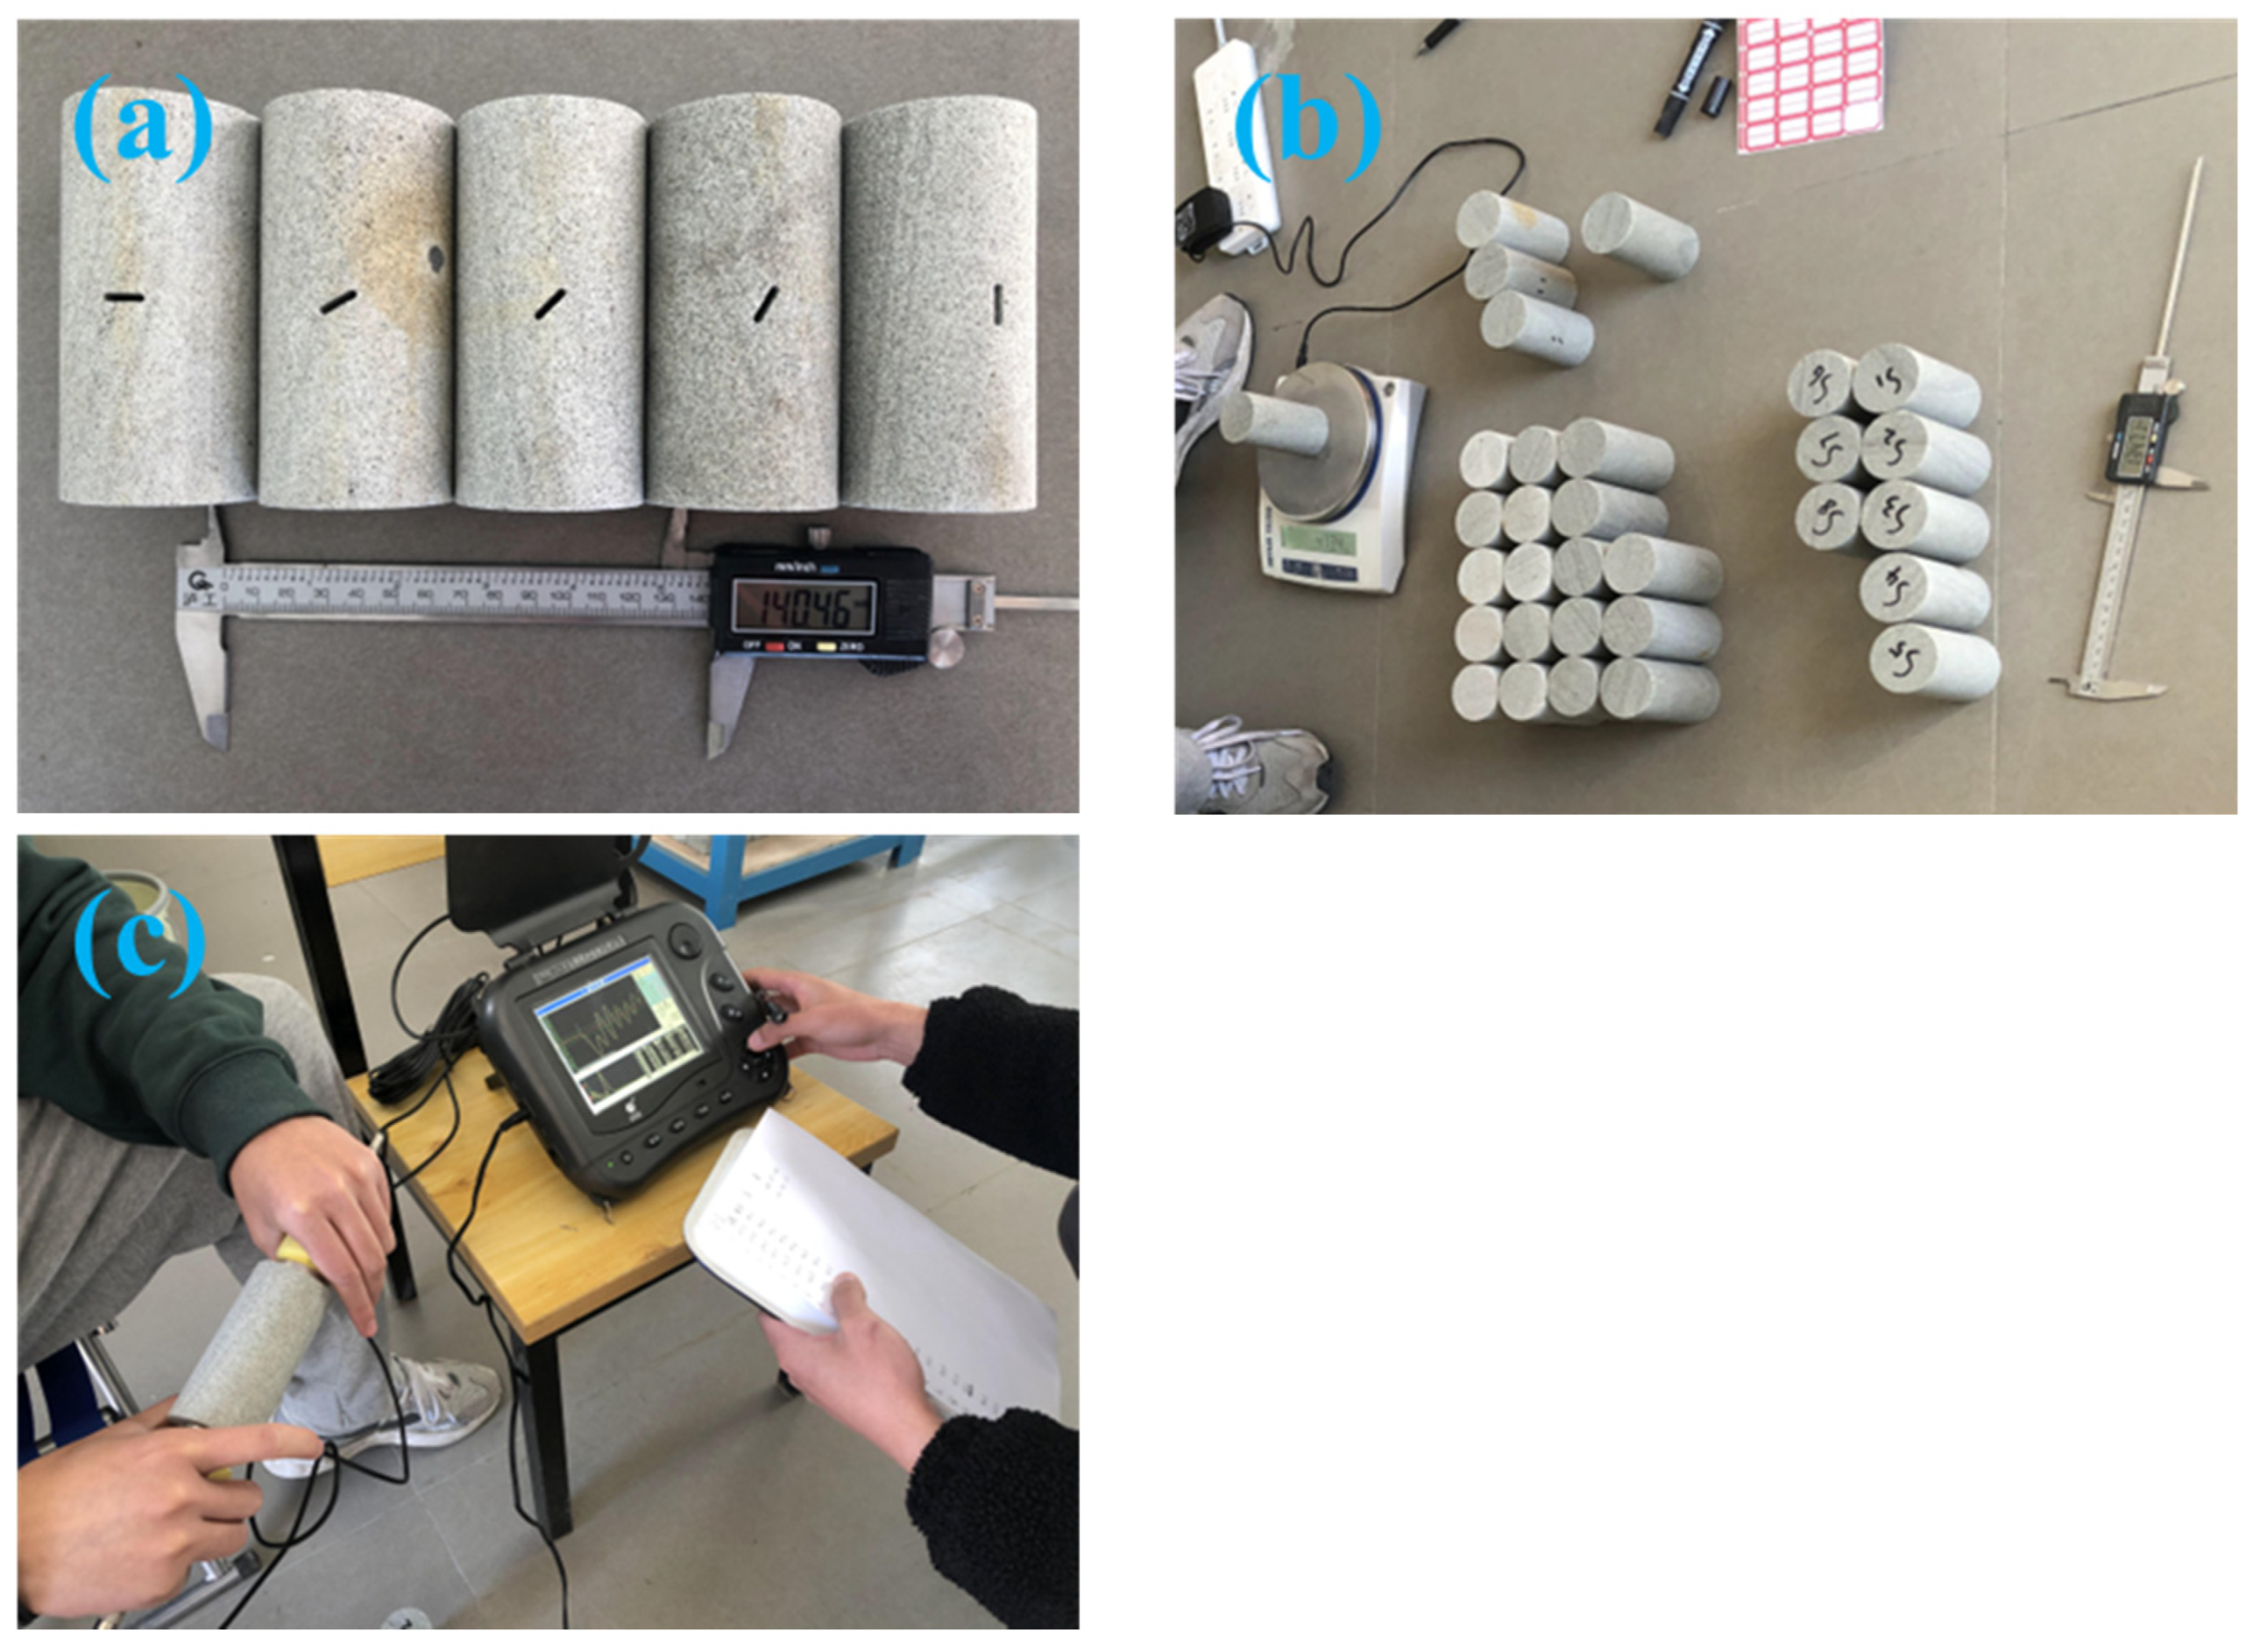
This study selected sandstone from a typical area in Qiemuerqike Town, Altay City, Xinjiang, as the research object. The sampling locations and geological conditions of the area are shown in Figure 1. During sampling, the preparation and processing of samples strictly followed the rock mechanics testing specifications (ISRM). The specific process is as follows: select intact sandstone blocks with no obvious macroscopic cracks and uniform rock properties at the site. After transporting the collected sandstone blocks to the laboratory, a diamond saw machine was used for preliminary cutting to obtain rock cores meeting the standard dimensions for rock mechanics testing (cylinders with a diameter of 50 mm and a height of 100 mm). Pre-fabricate cracks with different inclination angles at the center of the sample, with dimensions of 50 mm in length, 10 mm in width, and 2 mm in height. Five pre-fabricated crack inclination angles are used, corresponding to S4 (0°), S5 (30°), S6 (45°), S7 (60°), and S8 (90°), as shown in Figure 2a. During cutting, the saw’s feed rate and cooling water supply were carefully controlled to prevent localized overheating that could damage the internal structure and affect test results. The core ends were polished using a surface grinder to ensure flatness within 0.05 mm, guaranteeing uniform stress distribution during mechanical testing.
To ensure the scientific validity of subsequent freeze–thaw and fatigue tests, the physical properties of the sandstone samples were precisely measured to select homogeneous samples. As shown in Figure 2, density was measured, and wave velocity was determined using an ultrasonic wave velocity tester with Vaseline as a coupling agent. Transducers were placed tightly against the sample ends, and multiple measurements were averaged. Samples with significant wave velocity variations, indicating internal heterogeneity, were excluded, while those with consistent velocities were retained for testing. Wave velocity data also served as a baseline for monitoring freeze–thaw damage evolution. The physical parameters of the sample are shown in Table 1.
To determine the mineral composition, microscopic analysis was conducted [40]. Cut the sandstone blocks into 10 mm × 10 mm × 3 mm thin slices as rough blanks, perform coarse grinding (using 400-grit sandpaper) and fine grinding (800-grit and 1200-grit sandpaper), and then bond them to glass slides using epoxy resin. The samples were polished using diamond polishing paste (particle size 1 μm) to achieve standard rock thin sections with a thickness of 30 μm, ensuring the thin sections were free of bubbles and scratches. Using a Leica DM4 P (Manufactured by Leica, Wetzlar, Germany) upright metallographic polarizing microscope equipped with a 5-megapixel CCD camera (Figure 3a), the thin section of the sandstone sample was observed, clearly identifying the main mineral components such as quartz (Q), feldspar (F), and rock fragments (D). Quartz particles are irregular in shape and distributed among feldspar and rock fragment particles, forming the basic skeletal structure of the sandstone. Feldspar particles often exhibit cleavage characteristics, with some showing signs of weathering on their surfaces. Rock fragments exhibit diverse morphological and compositional characteristics, reflecting the complexity of the sandstone’s parent rock.
Grind the sandstone samples into powder with a particle size of less than 200 mesh (particle size < 75 μm), place them in a vacuum drying oven at 60 °C for 24 h to remove moisture, and take 3 g of the dried powder for testing. At the same time, use the PANalytical X’Pert Pro MPD X-ray (Manufactured by PANalytical B.V., Almelo, The Netherlands) diffractometer to perform quantitative analysis of the mineral composition of the sandstone samples (Figure 3b). Quartz, as the primary rigid mineral, significantly influences the sandstone’s mechanical properties. Clay minerals like kaolinite, due to their hydrophilicity and expansiveness, exacerbate internal damage during freeze–thaw cycles. Berlinite’s presence relates to the sandstone’s diagenetic environment and subsequent alteration, with its impact on mechanical properties requiring further exploration under freeze–thaw and loading conditions. This mineralogical analysis provides a foundation for understanding damage mechanisms.

2.2. Testing Equipment

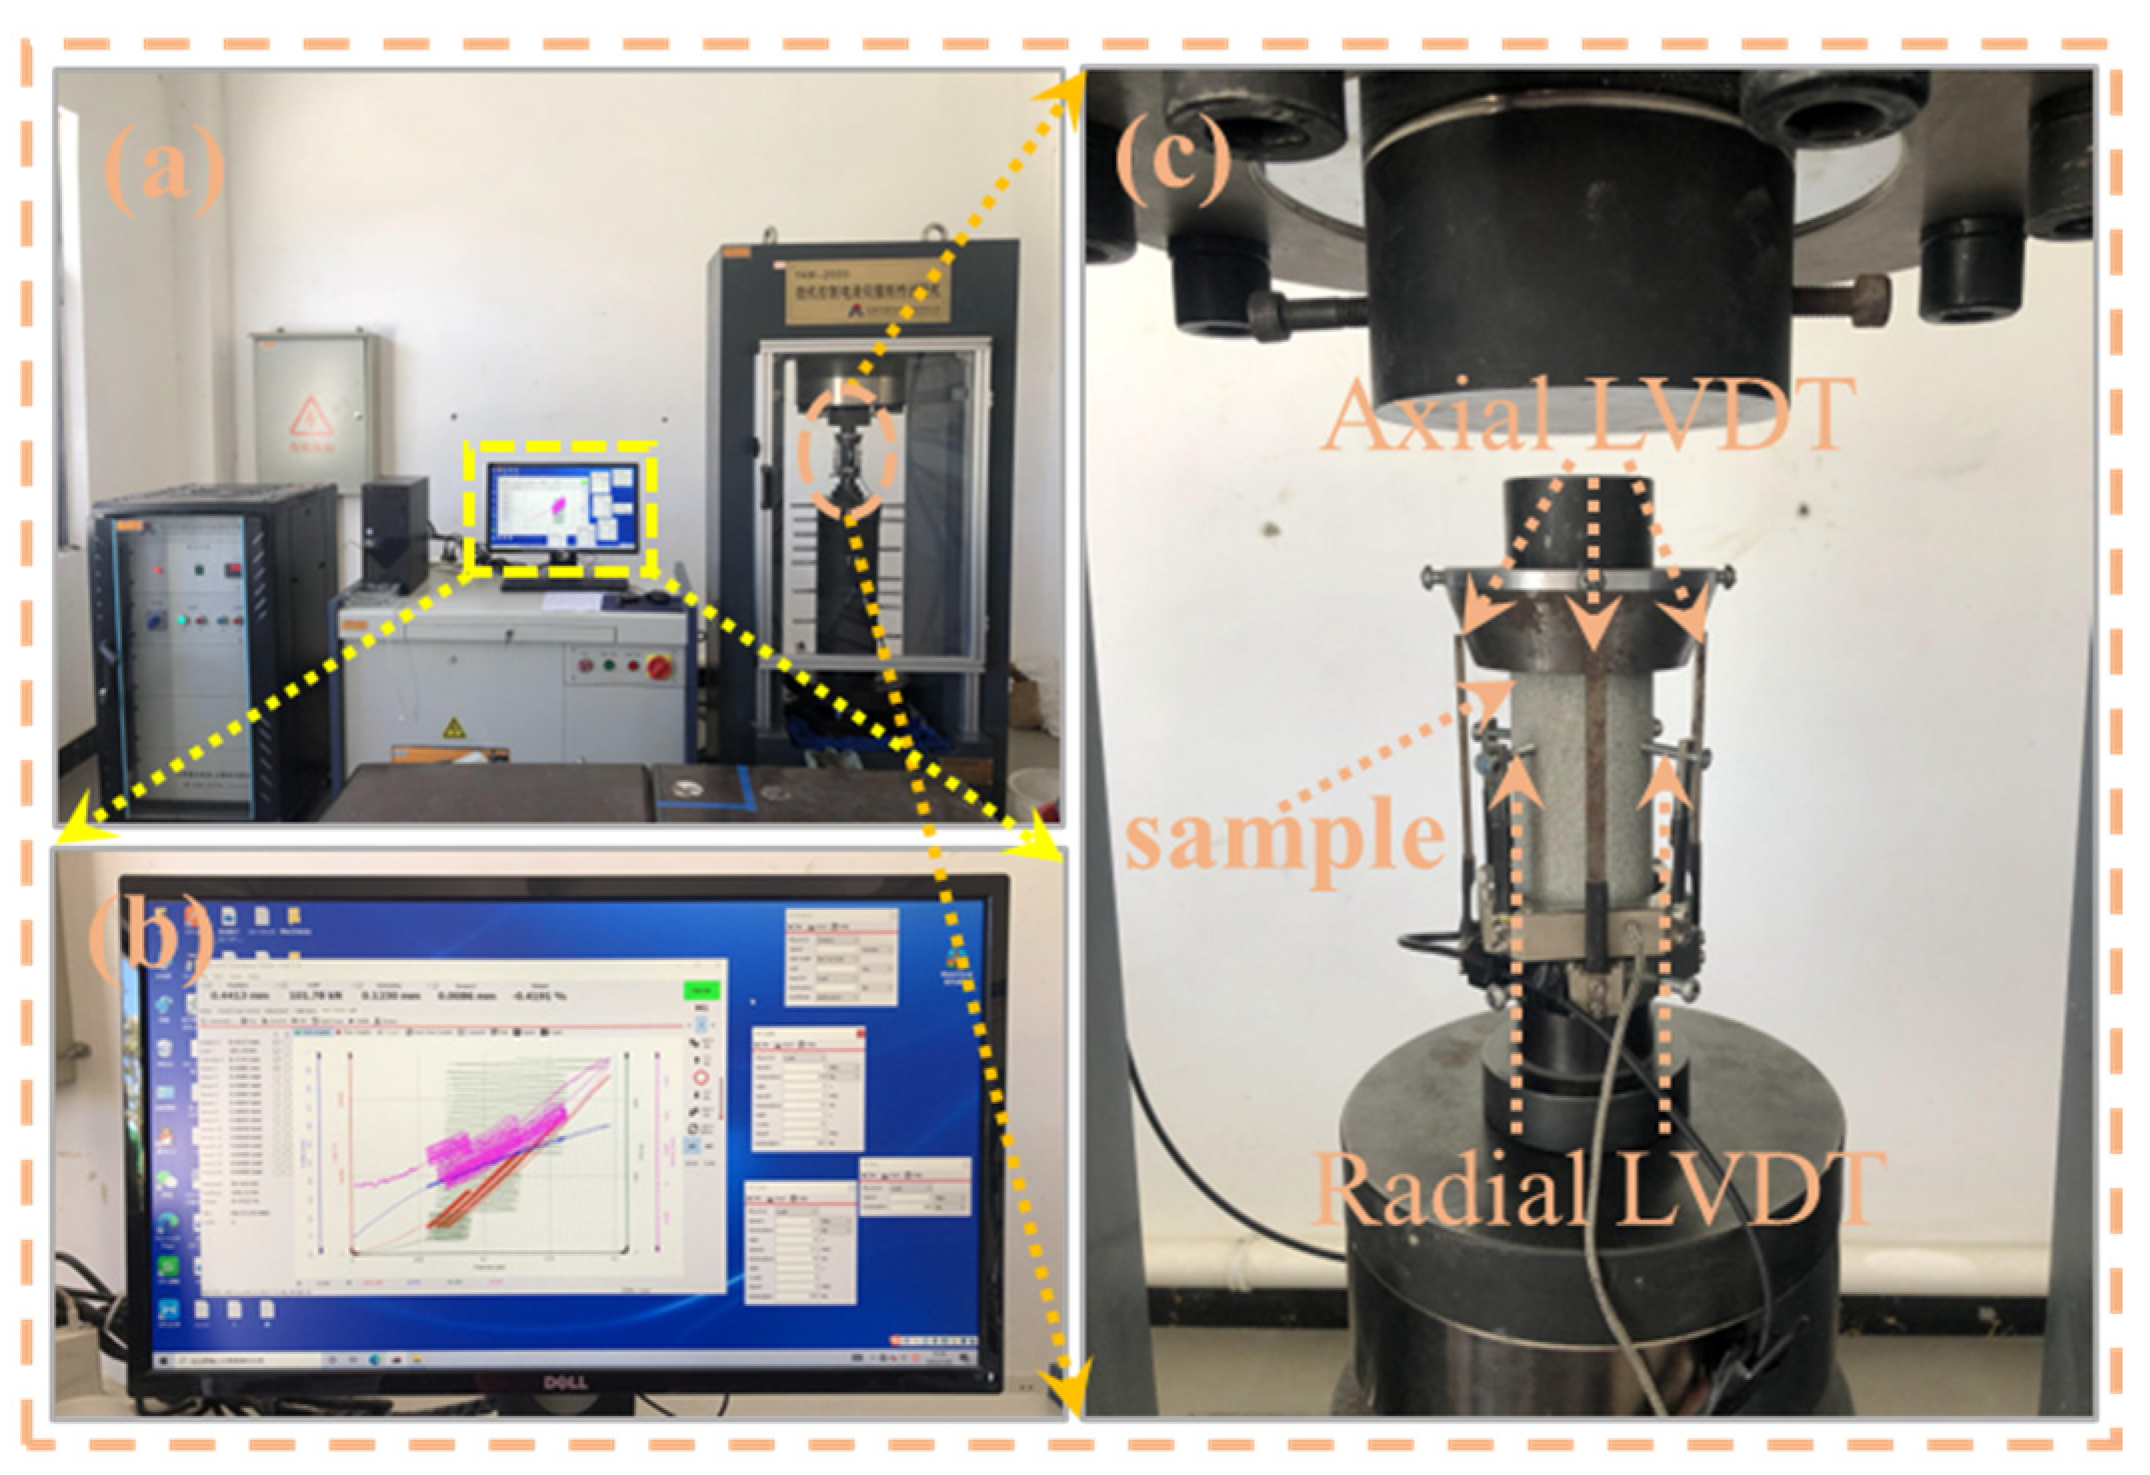
The performance of testing equipment is critical for rock mechanics tests due to the high strength of rock materials. The testing machine must have sufficient rigidity to avoid deformation under peak rock stresses [41]. As shown in Figure 4, this study used a YAW-2000 servo-controlled rigid testing machine (ChaoyangTesting Machine Co., Ltd., Changchun, China) with a frame stiffness exceeding 10 GN/m and a maximum load capacity of 2000 kN, meeting rock testing requirements. To accurately observe rock failure modes, the machine’s load capacity exceeds the expected rock strength. In addition, high-precision sensors and data acquisition systems can accurately capture the minute deformation and stress response of rock samples during the loading process, providing reliable data support for analyzing rock mechanical behavior. The YYSJ50 extensometer (Beijing Zhongxi HuadaScience and Technology Co., Beijing, China) is used to measure axial and radial deformation. The YAW-2000, equipped with a German DOLI electronic control system, ensures precise test path control and data accuracy. For dynamic or cyclic loading tests simulating complex stress states, the electro-hydraulic servo-controlled machine is preferred for its high precision and stability.

2.3. Testing Procedure

(1)
Freeze–Thaw Cycling Test
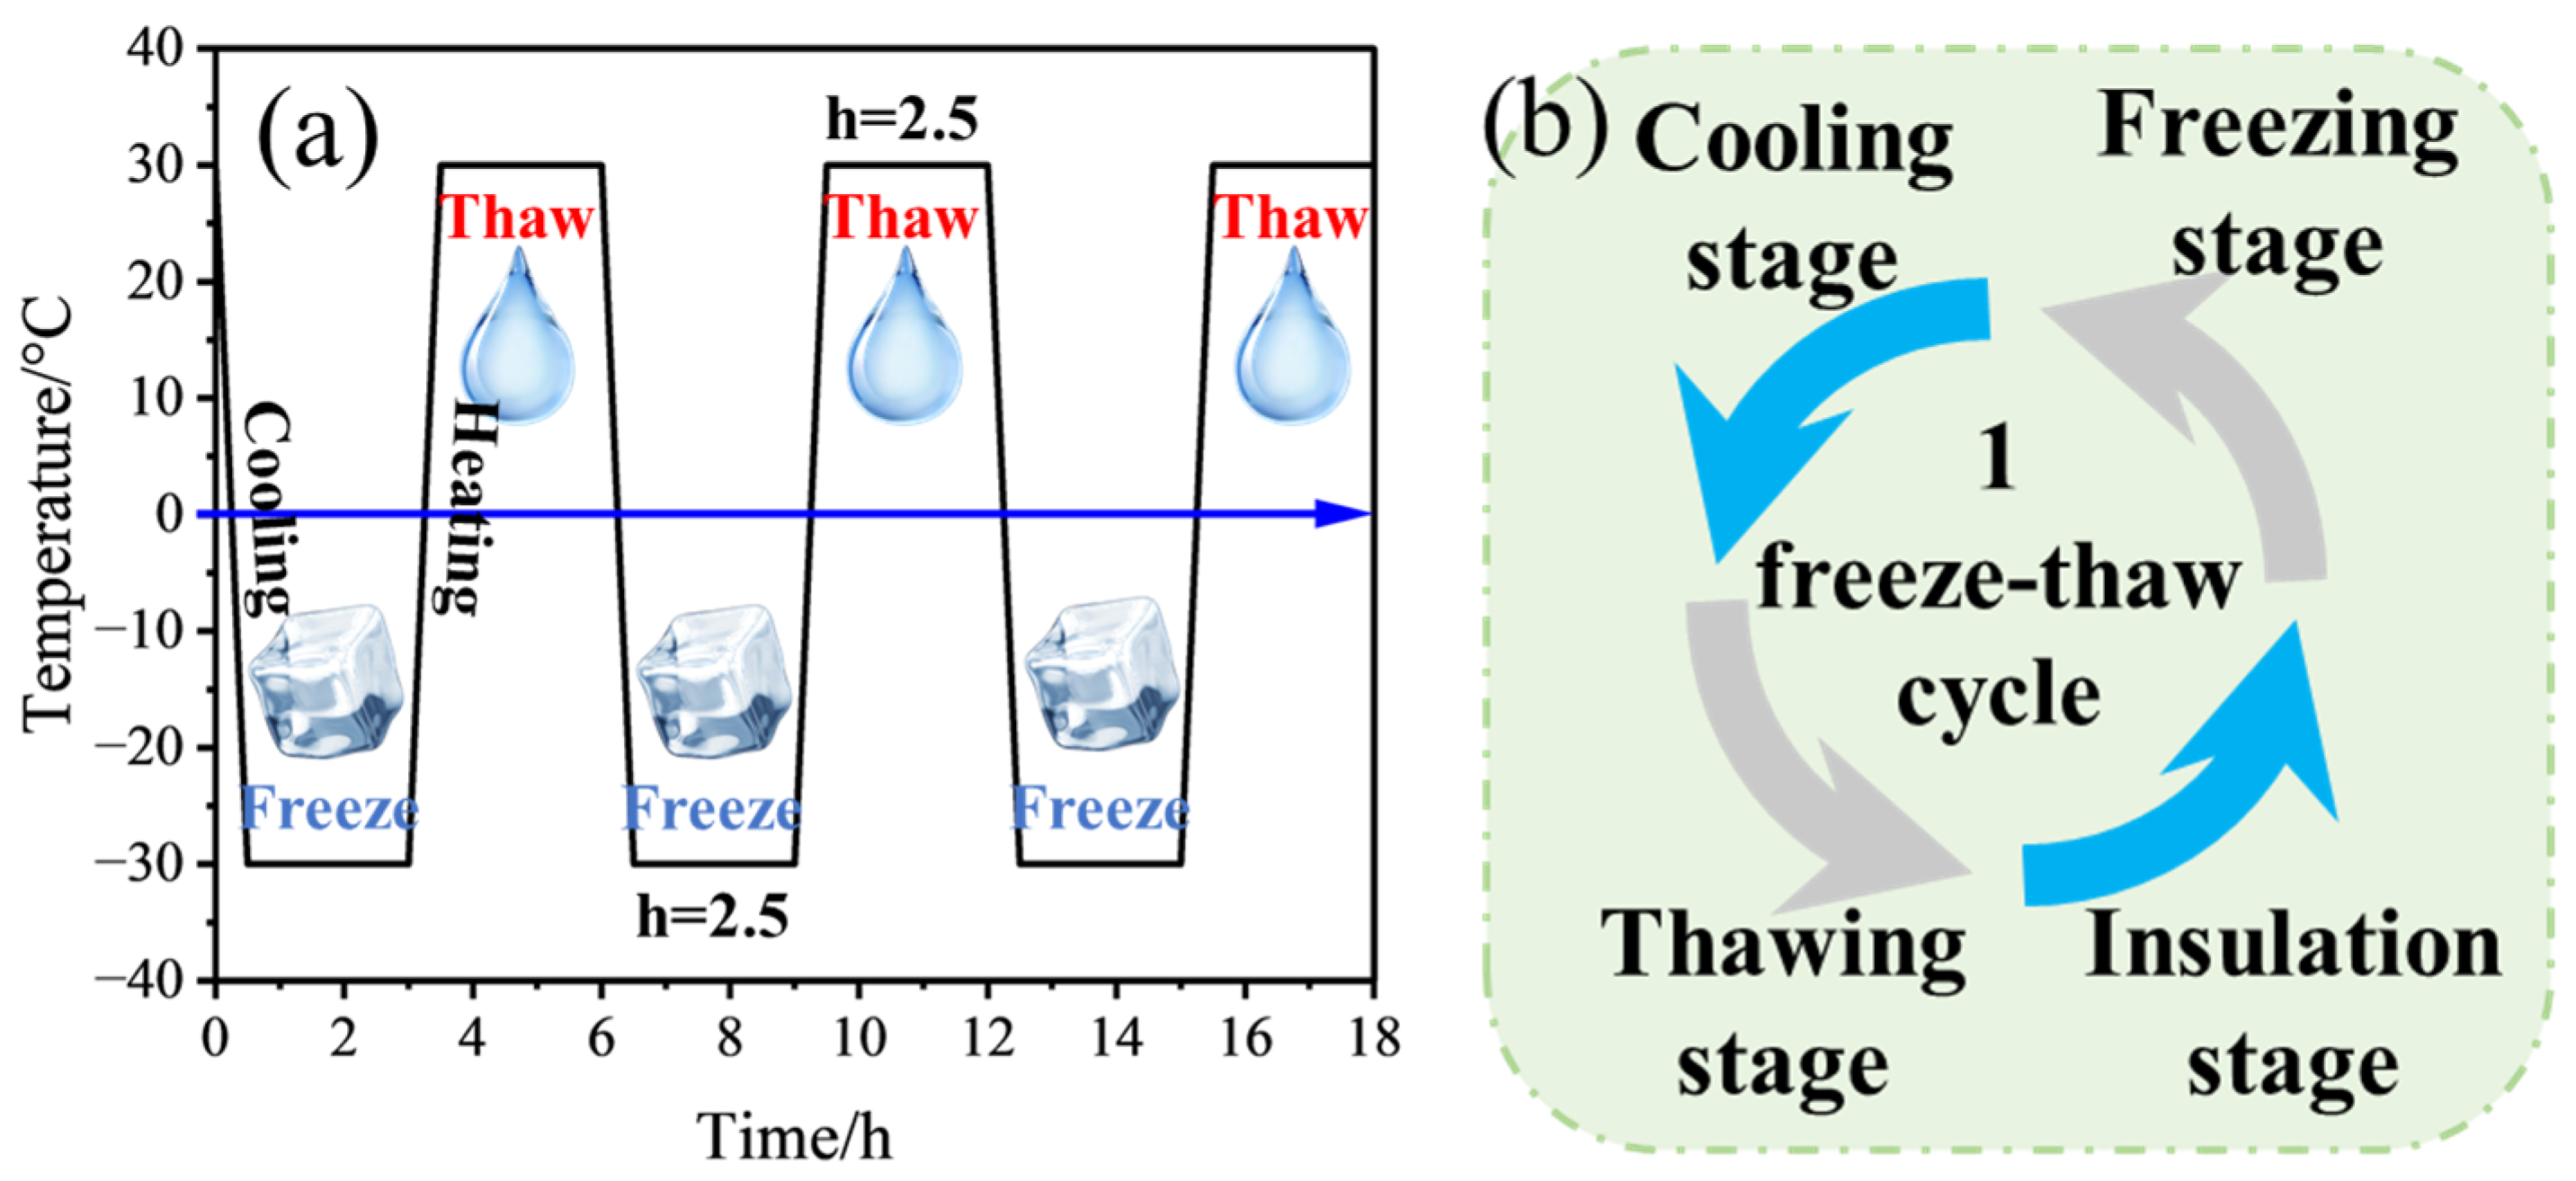
Before freeze–thaw cycling, all samples underwent vacuum saturation to fill pores with water, effectively removing air and achieving approximately 97% saturation. Sample height, diameter, and saturated mass were measured to calculate water-saturated density [42]. P-wave transit times were measured using a ZBL-U5200 (Produced by Xi’an Qinling Tiancheng Intelligent Technology Co., Ltd. in Xi’an, China) rock acoustic parameter tester, and water-saturated P-wave velocities were calculated based on sample height. Freeze–thaw cycling was performed using a TDS-300 (Produced by Nanjing Anai Testing Equipment Co., Ltd. in Nanjing, China) freeze–thaw testing machine, with freezing at −30 °C and thawing at +30 °C. Each cycle included 2.5 h of freezing, 0.5 h of temperature transition, and 2.5 h of thawing, as shown in Figure 5.
(2)
Mechanical Testing
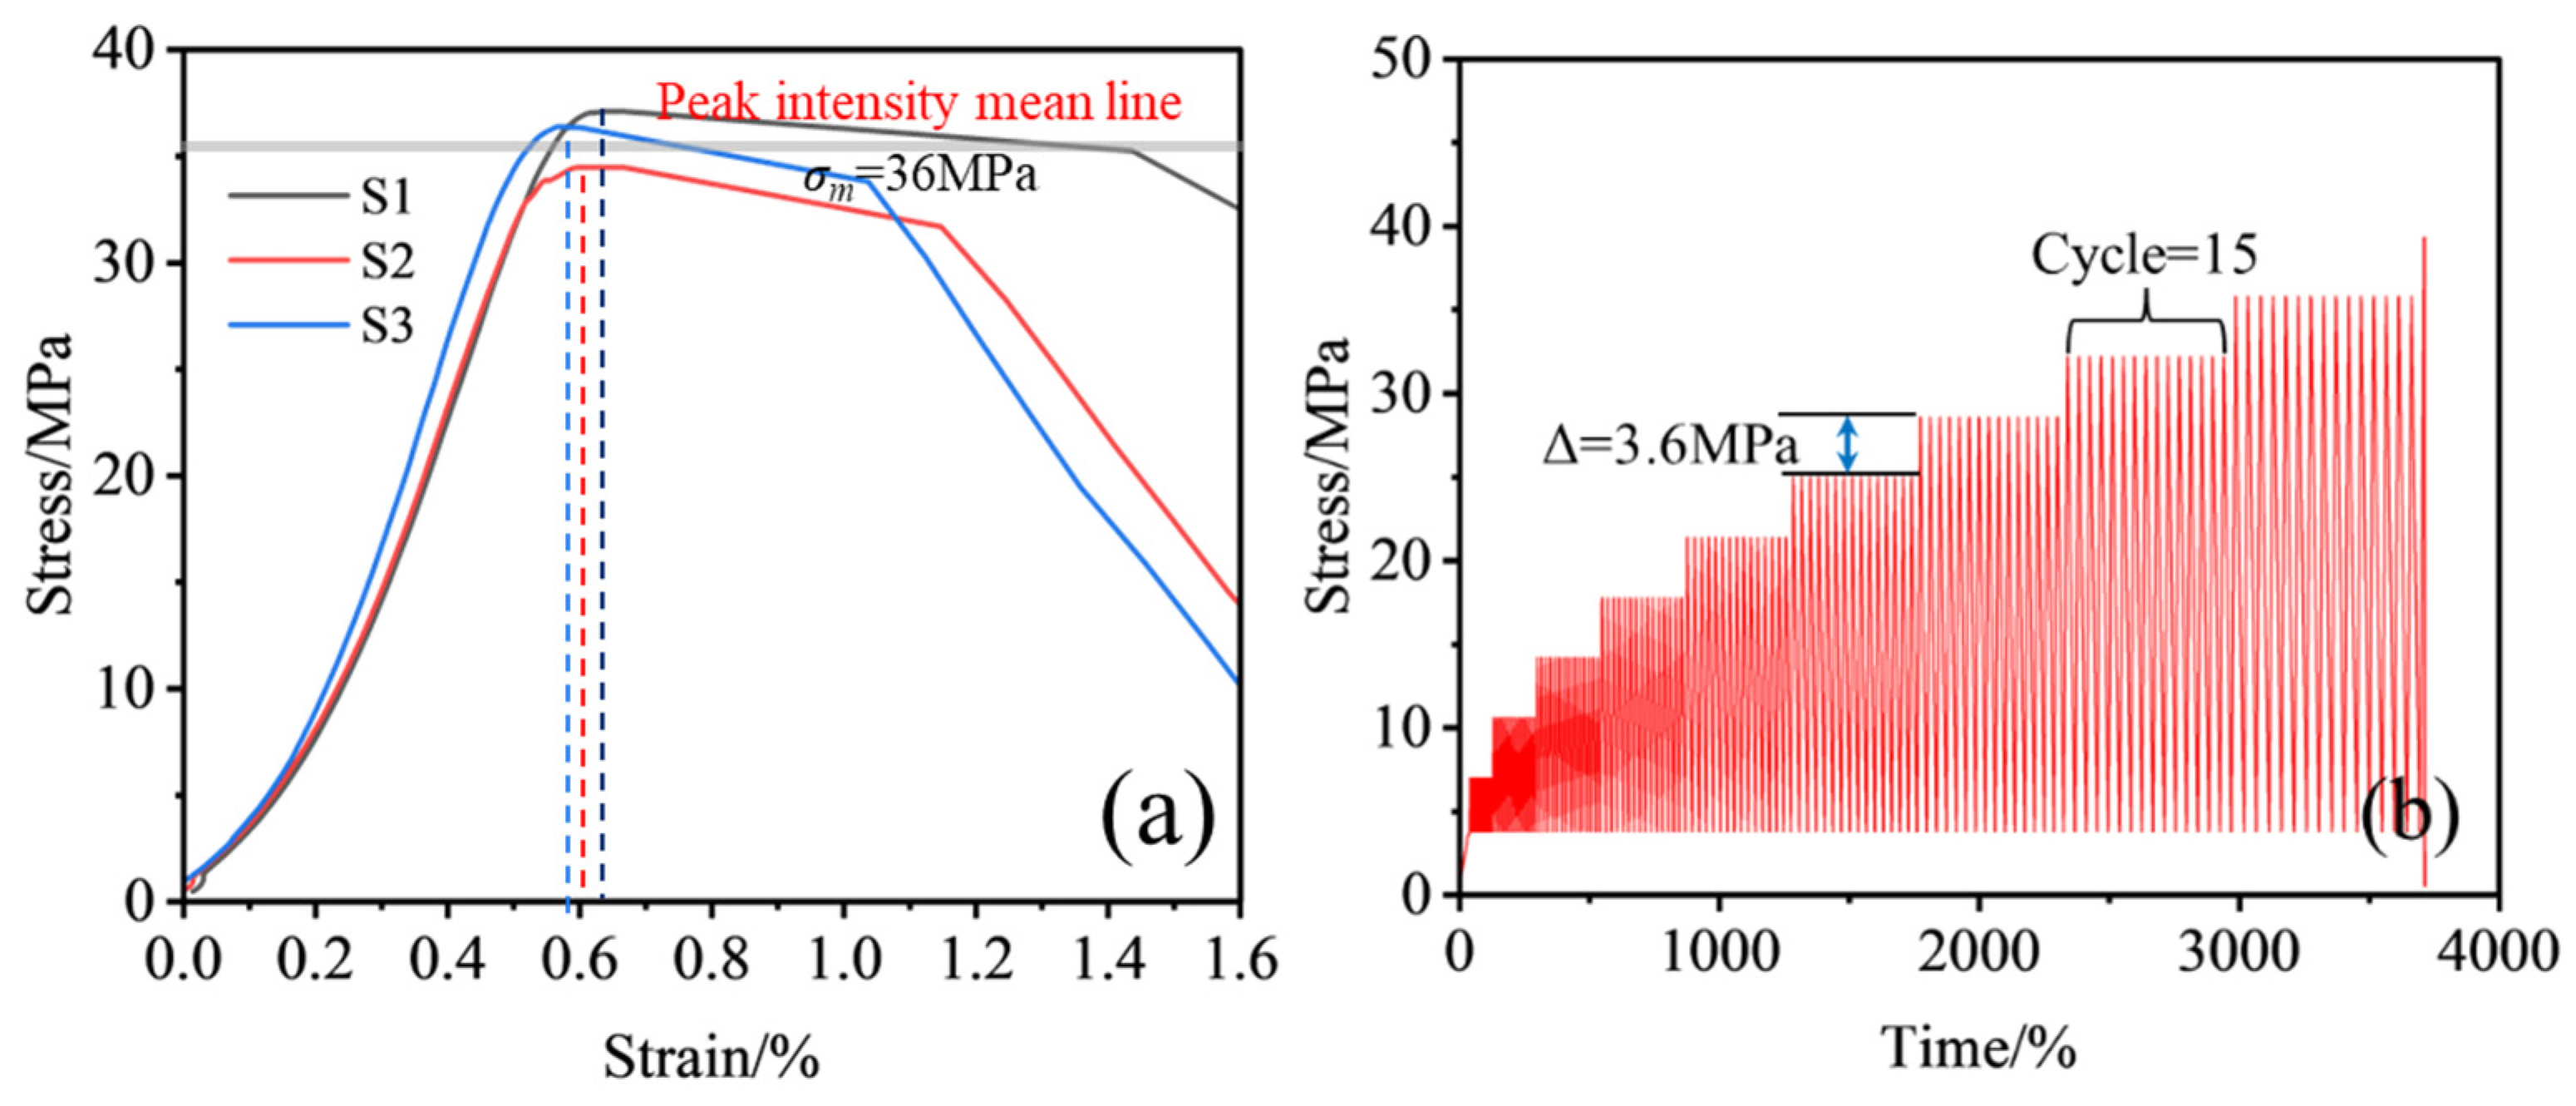
To establish baseline peak strength for cyclic loading tests, three samples (S1, S2, S3) were randomly selected for uniaxial compression tests. A constant loading rate of 0.2 kN/s was applied until failure, ensuring stable and reliable data. The average peak strength was 36 MPa, serving as a reference for cyclic loading tests (results shown in Figure 6a).
For cyclic loading tests, considering real-world rock loading conditions, the lower limit of cyclic loading was set at 10% of the uniaxial peak strength. To study mechanical responses at different load levels, each cycle level included 15 loading cycles, with a load increment of 3.6 MPa between levels. Loading continued until significant macroscopic failure occurred, at which point the test was terminated, and data were recorded.

3. Results and Analysis

3.1. Deformation Characteristics

In underground excavation, tunnel construction, slope engineering, and pile foundation projects, rocks are often subjected to cyclic loading. Analyzing deformation characteristics is crucial for assessing structural stability under such conditions [43,44]. Unlike static loading tests, which capture only monotonic loading behavior, cyclic loading tests reveal deformation characteristics under dynamic, repetitive loading, enhancing understanding of rock mechanical behavior and response patterns. Rock deformation is closely tied to its internal microstructure, and cyclic loading induces changes in fractures and pores. Analyzing deformation characteristics indirectly reveals microstructural evolution, such as crack initiation, propagation, and coalescence. Thus, studying deformation under cyclic loading is key to understanding damage accumulation and failure mechanisms.
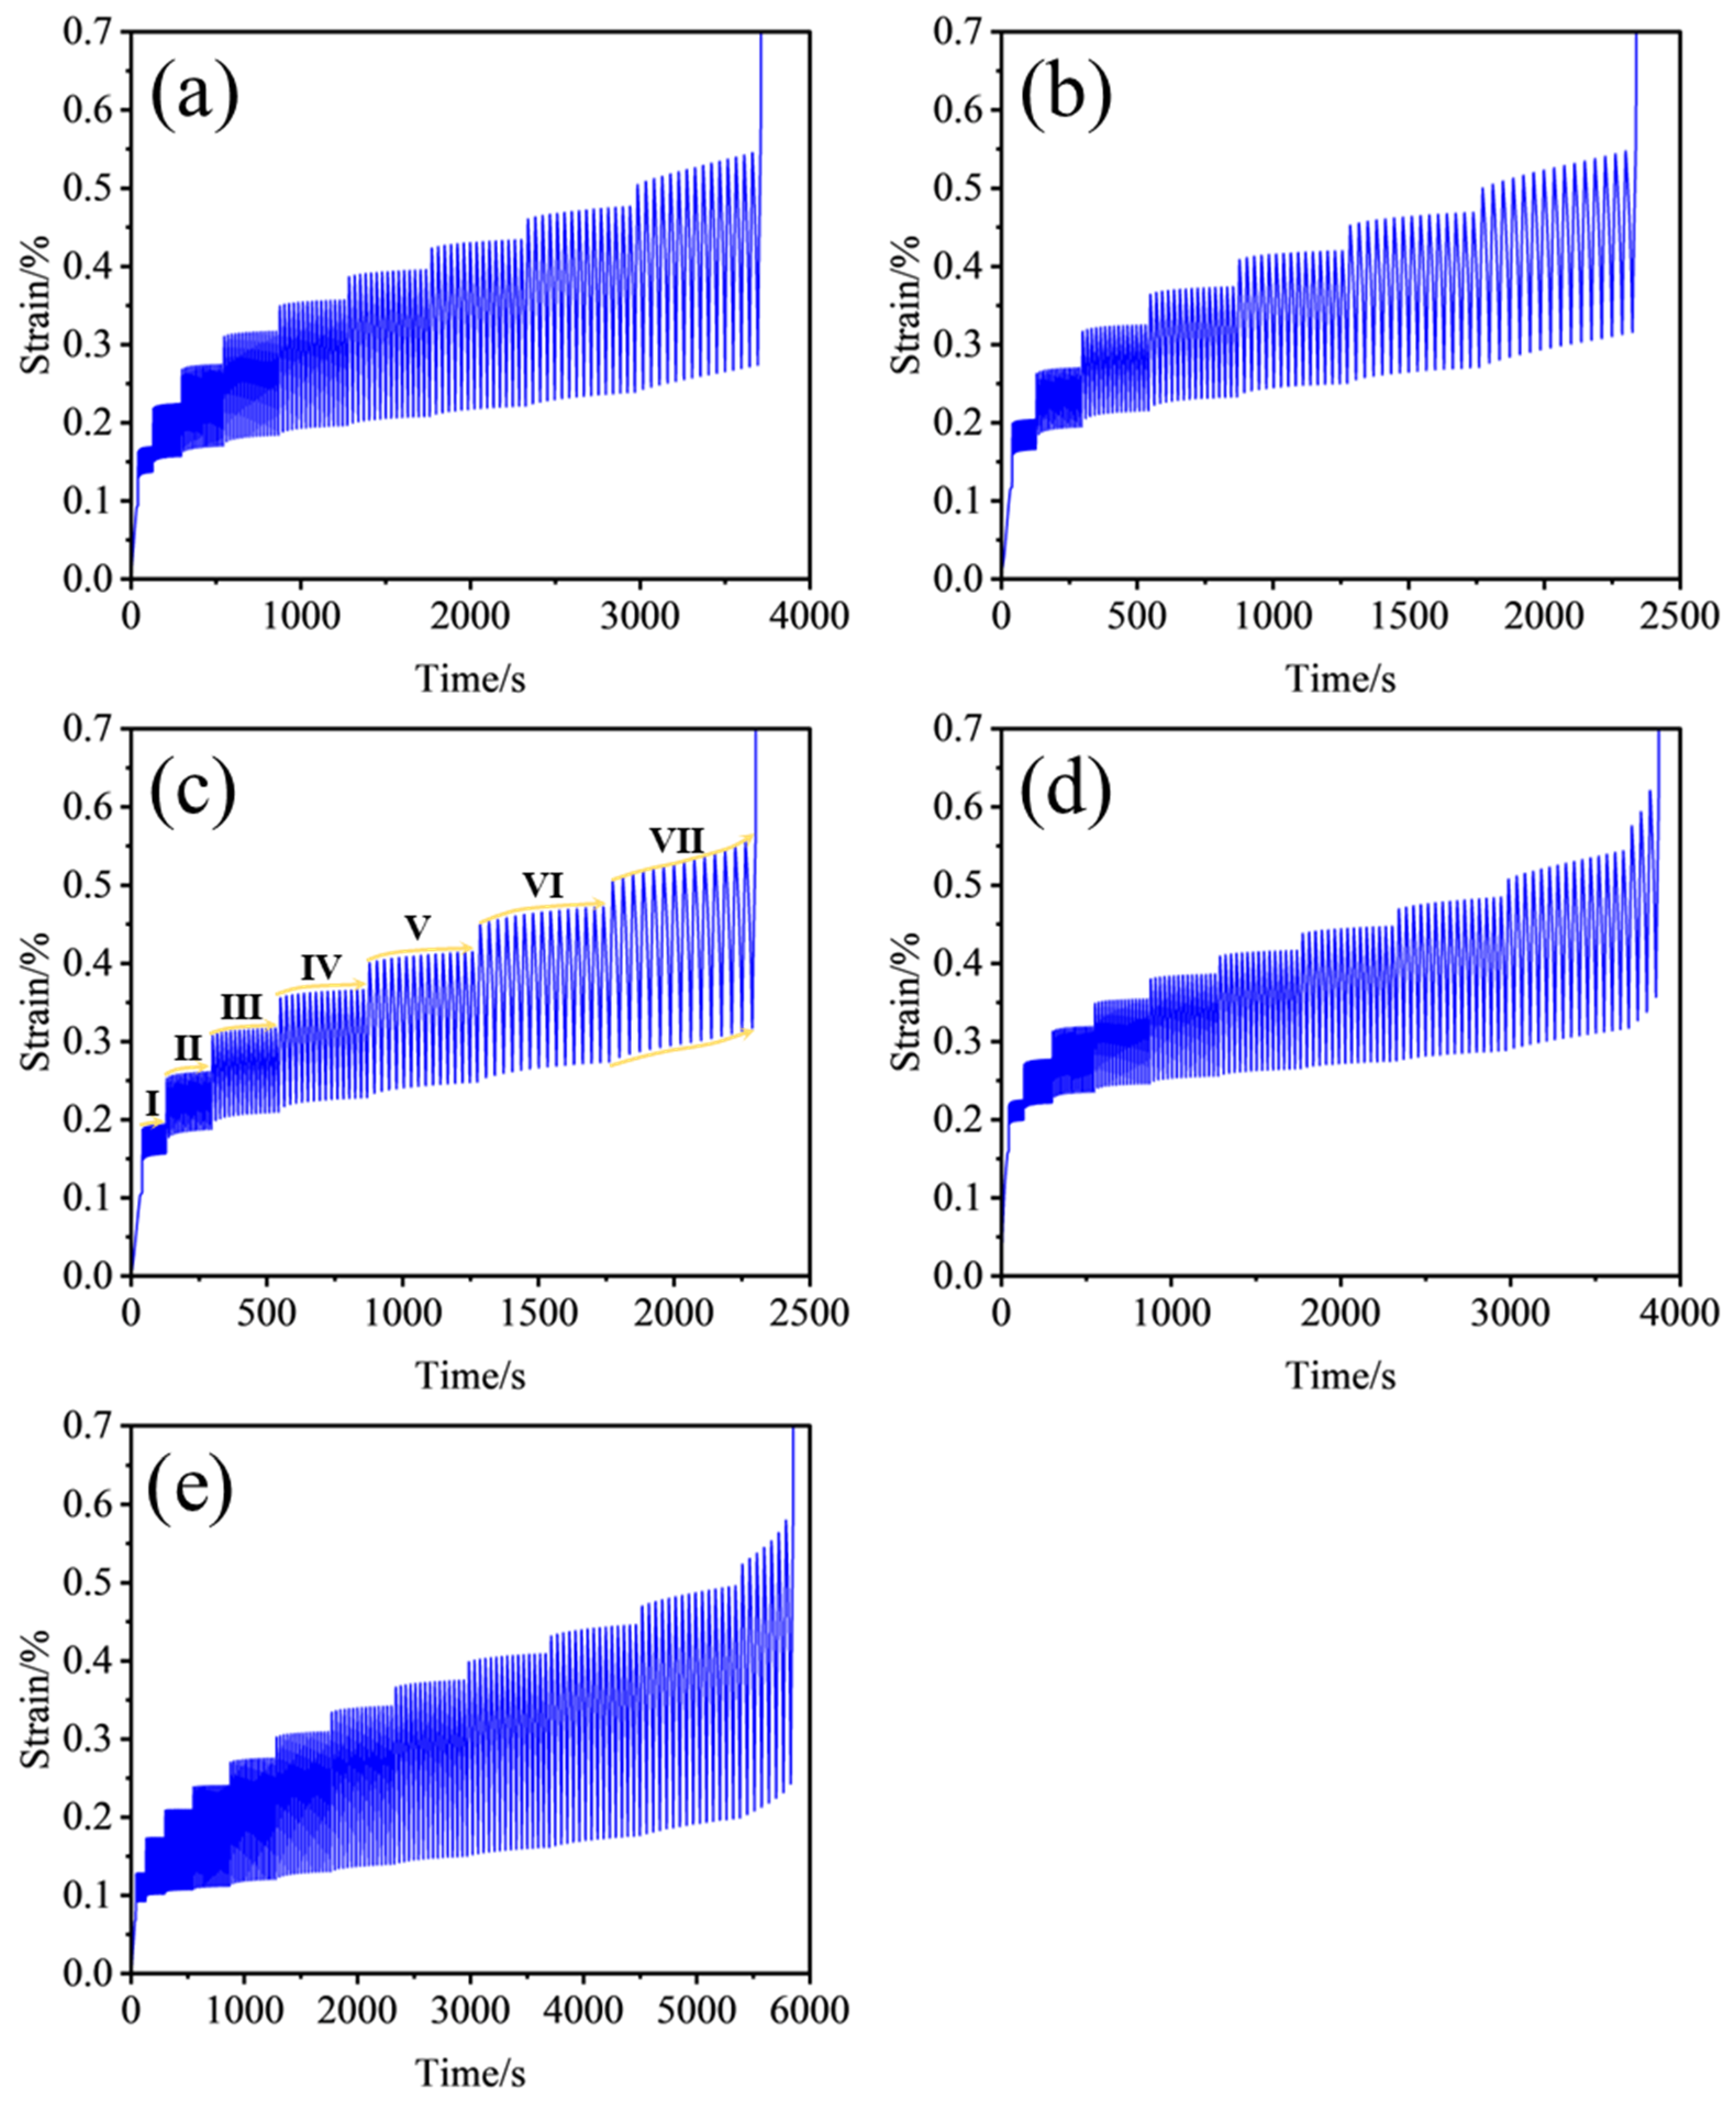
Figure 7 shows the strain–time curves for samples S4–S8, exhibiting a stepped increase in strain over time. In the initial low-load cycle stage, strain growth is gradual, dominated by elastic deformation and initial fracture adjustments. As cyclic loading progresses, strain increments become more pronounced, with internal cracks initiating, propagating, and coalescing, leading to plastic deformation accumulation. The step height in the curves reflects the deterioration of rock deformation resistance. Differences in strain growth rates and deformation amplitudes among samples indicate material heterogeneity due to initial defects. Overall, hard rock deformation under cyclic loading exhibits a “stepped accumulation” pattern, reflecting progressive internal damage evolution.
The mechanical responses vary significantly with pre-fabricated fracture dip angles. Samples with a 90° dip angle exhibit the highest peak strength, followed by those with a 0° dip angle. Sample S8 underwent 12 cycle levels, with peak and residual strains showing logarithmic growth before failure, transitioning to exponential growth in the final cycle level due to rapid crack propagation and damage accumulation. Sample S4, with nine cycle levels, showed linear strain growth in the final cycle level, similar to most samples. Sample S6, with a 45° dip angle, experienced only six complete cycle levels, transitioning from logarithmic to exponential strain growth in the seventh cycle level’s first fourteen cycles, failing before reaching the designed peak strength in the fifteenth cycle due to internal structural instability.
According to the stress decomposition theory of the crack surface under complex stress states, the axial stress σ1 can be decomposed into normal stress σn and tangential stress τ on the crack surface. The peak strength of the 90 ° crack sample is the highest: when θ = 90 °, σn = σ1 (maximum normal stress), τ = 0 (tangential stress is 0), and the crack surface only bears normal pressure and is not prone to shear sliding or expansion. Therefore, the sample can withstand higher axial loads, showing the highest peak strength. The strain growth of the 45 ° crack sample is the fastest: when θ = 45 °, τ = 1/2 σ1 (the tangential stress reaches its maximum value) and the crack surface is prone to shear deformation, leading to rapid initiation, propagation, and penetration of microcracks, resulting in the fastest strain growth rate and the least number of cycles before failure (only six complete cycle levels). These results highlight the significant influence of fracture dip angle on deformation characteristics, damage accumulation rates, and failure modes under cyclic loading, providing critical experimental evidence for studying fractured rock behavior under dynamic loading.
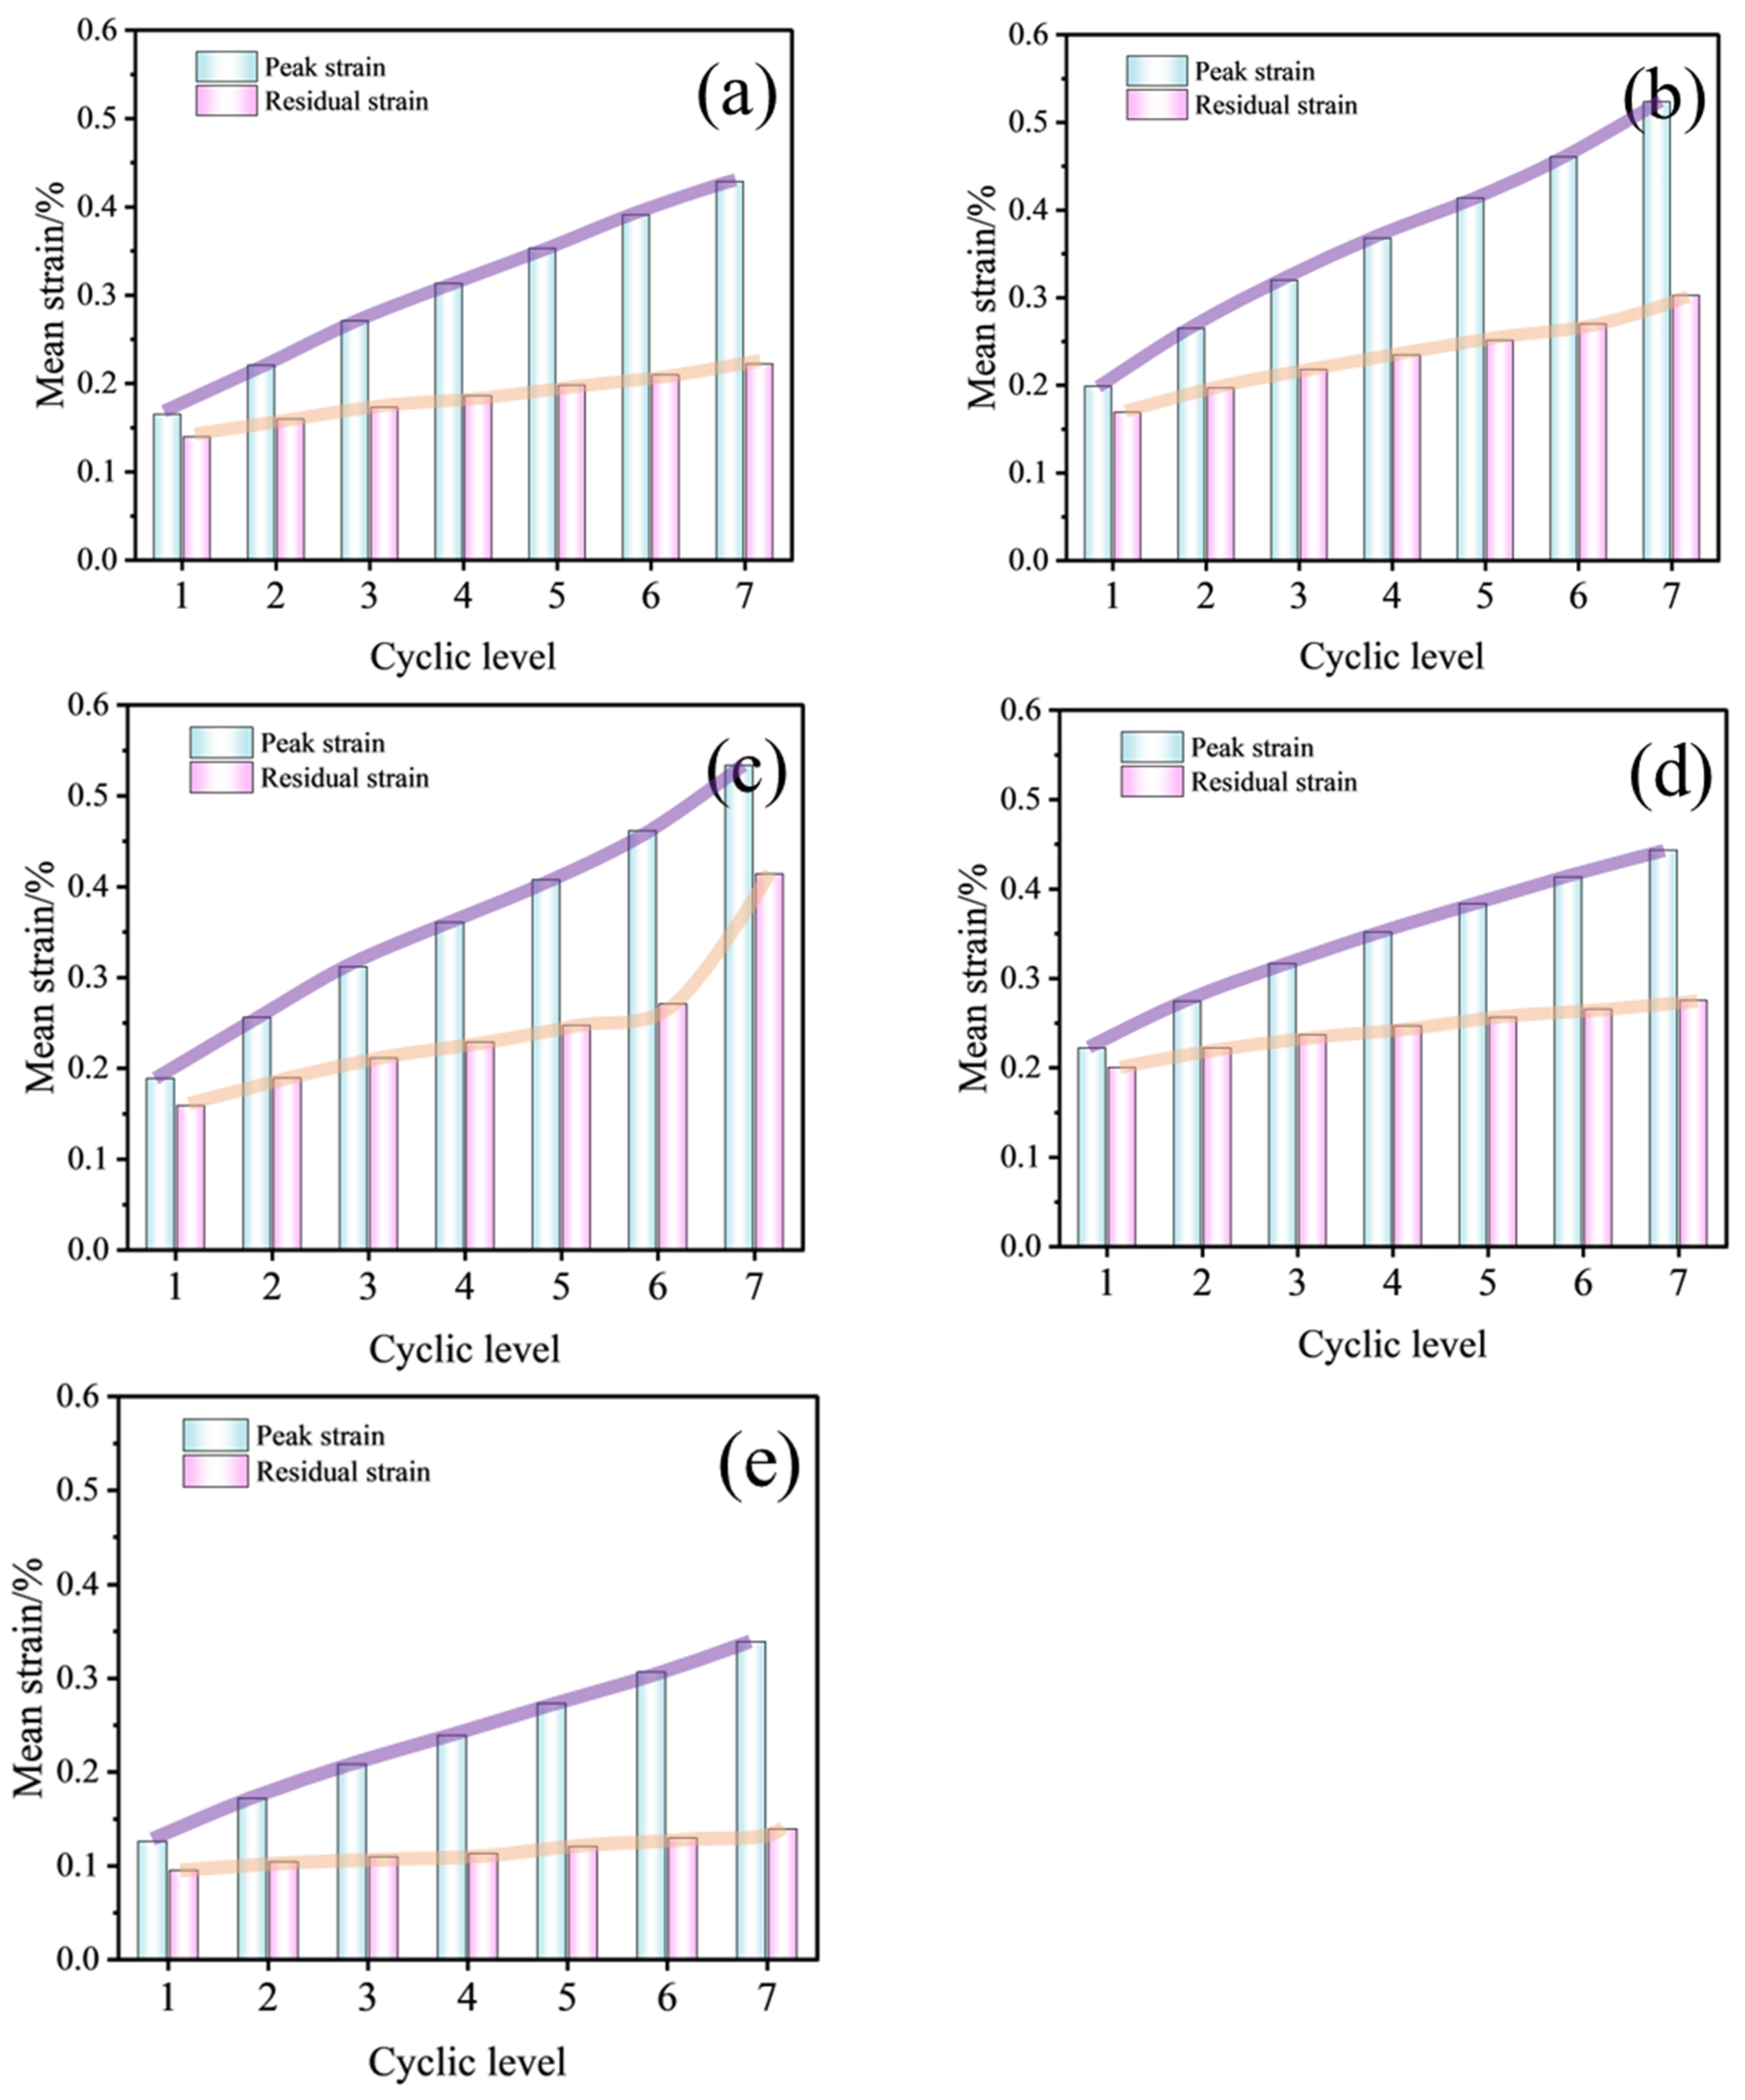
Figure 8 shows the mean peak strain (strain at peak stress in each cycle) and residual strain (strain at minimum stress after unloading) trends for individual cycle levels. Overall, both peak and residual strains increase with cycle level, with peak strain showing a larger increase, reflecting a “cumulative strengthening” characteristic where internal damage accumulates, elevating peak strain, while residual strain, as a “residual manifestation” of damage, grows slowly.
Peak strain (light blue bars) shows a linear increase across cycle levels, with sample S5 (Figure 8b) exhibiting particularly significant growth in higher cycle levels (e.g., 6th-7th), suggesting accelerated crack propagation and coalescence. Sample S6 (Figure 8c) shows a smaller difference between peak and residual strains in the seventh cycle level, indicating reduced elastic deformation and increased plastic damage, likely related to stress concentration and damage evolution paths influenced by fracture inclination.
Residual strain (pink bars) grows more gradually, but sample S6 (Figure 8c) shows a sudden increase in the seventh cycle level, coupled with a significant peak strain rise, indicating a “destabilizing expansion” stage where structural load-bearing capacity deteriorates rapidly. Samples S4 (Figure 8a) and S8 (Figure 8e) show more stable residual strain growth, reflecting a more “gradual” damage evolution linked to initial structure and stress redistribution under cyclic loading.
Mechanistically, in the early low-cycle stage, elastic deformation dominates, with a gentle peak and residual strain growth, the latter stemming from minor irreversible deformations (e.g., microcrack closure, mineral interface sliding). As cycle levels increase, microcrack initiation, propagation, and coalescence intensify plastic damage, with peak strain rising due to higher stress levels and damage softening, and residual strain accumulating due to irreversible crack closure-opening processes. In high cycle levels (e.g., 6th-7th for S5, S6), rapid strain growth indicates a “critical damage state,” with crack network coalescence transitioning deformation from “gradual accumulation” to “destabilizing failure,” serving as a key indicator of damage evolution stages and failure precursors.
In summary, Figure 8 provides a quantitative basis for evaluating cyclic dynamic response and predicting critical failure states by statistically analyzing peak and residual strain trends, deepening the understanding of cyclic mechanical behavior through further analysis of deformation modulus and damage variables.

3.2. Stiffness Evolution

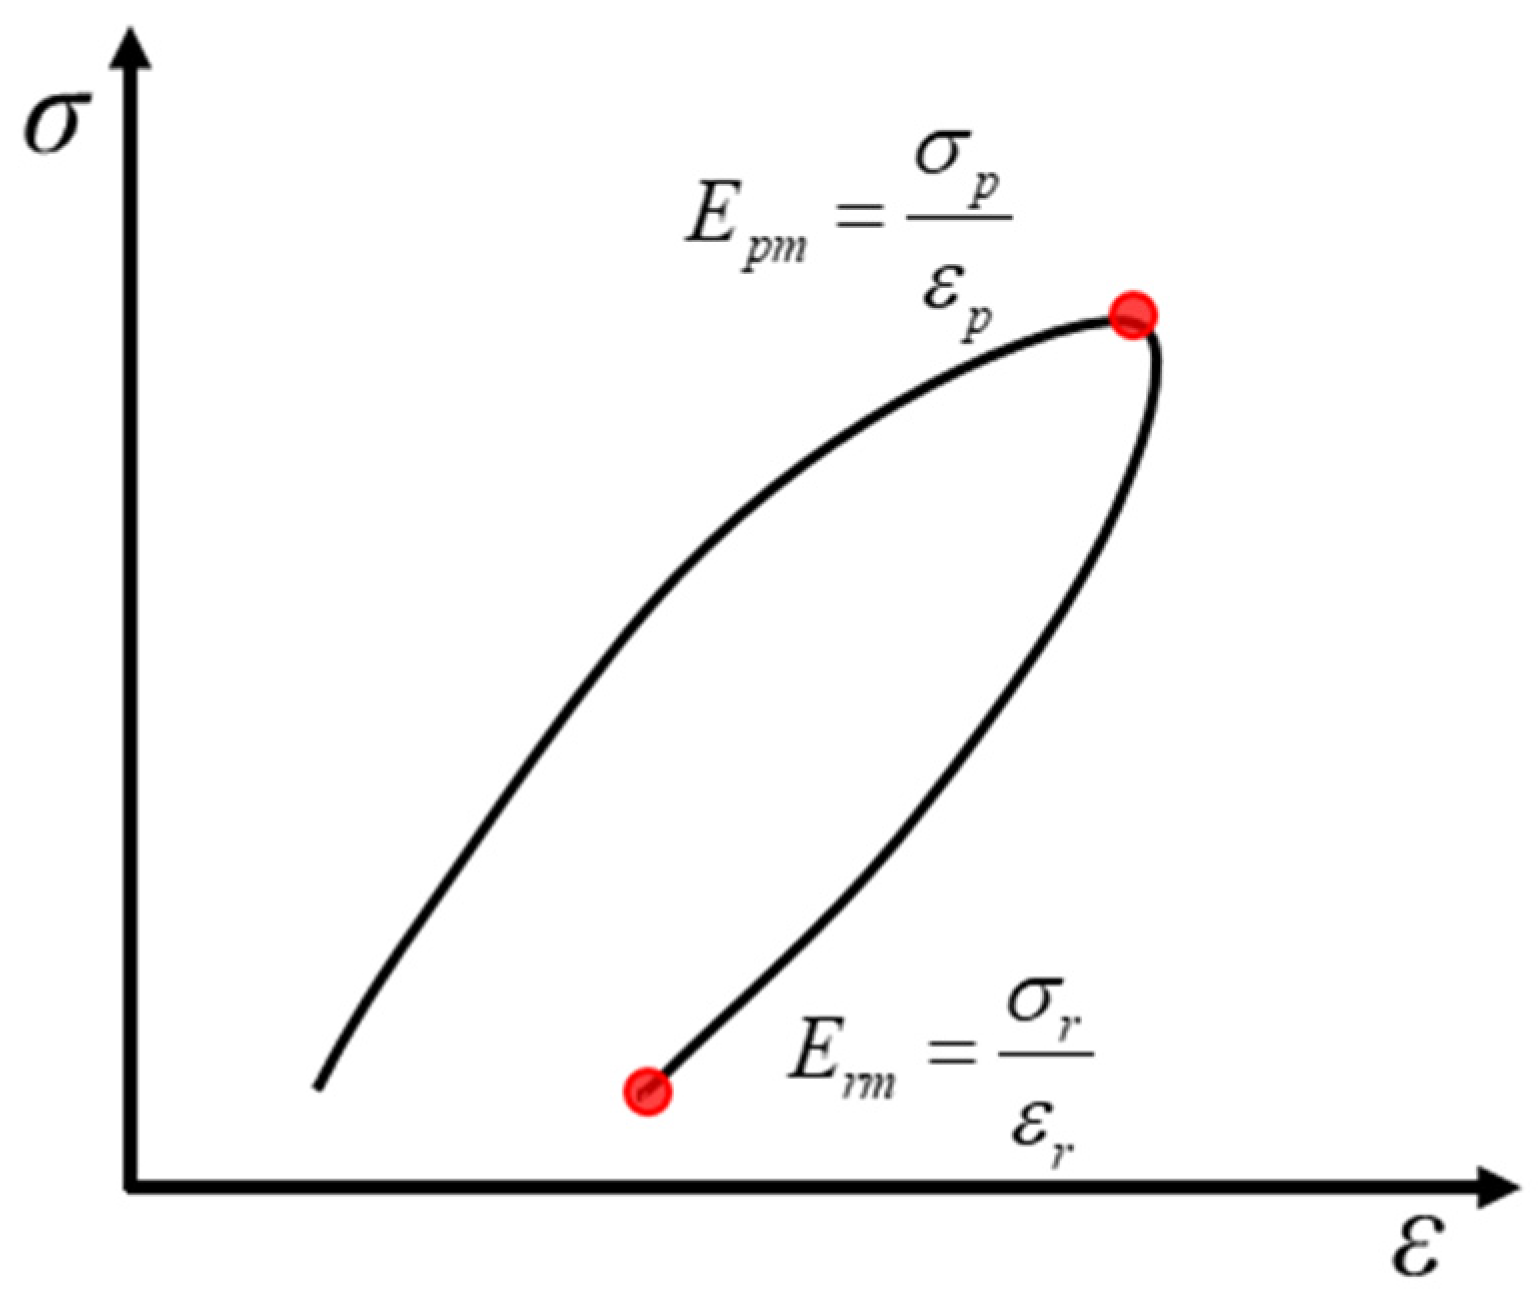
In rock mechanics, stiffness evolution under cyclic loading can be defined based on stress–strain curves. As shown in Figure 9, peak stiffness (Epm) is determined by the stress (σp) and strain (εp) at the cycle’s peak, i.e., Epm = σp/εp, reflecting the instantaneous deformation resistance. Residual stiffness (Erm) is calculated from the stress (σr) and strain (εr) at the residual point after unloading, i.e., Erm = σr/εr, indicating stiffness corresponding to residual deformation after a cycle.
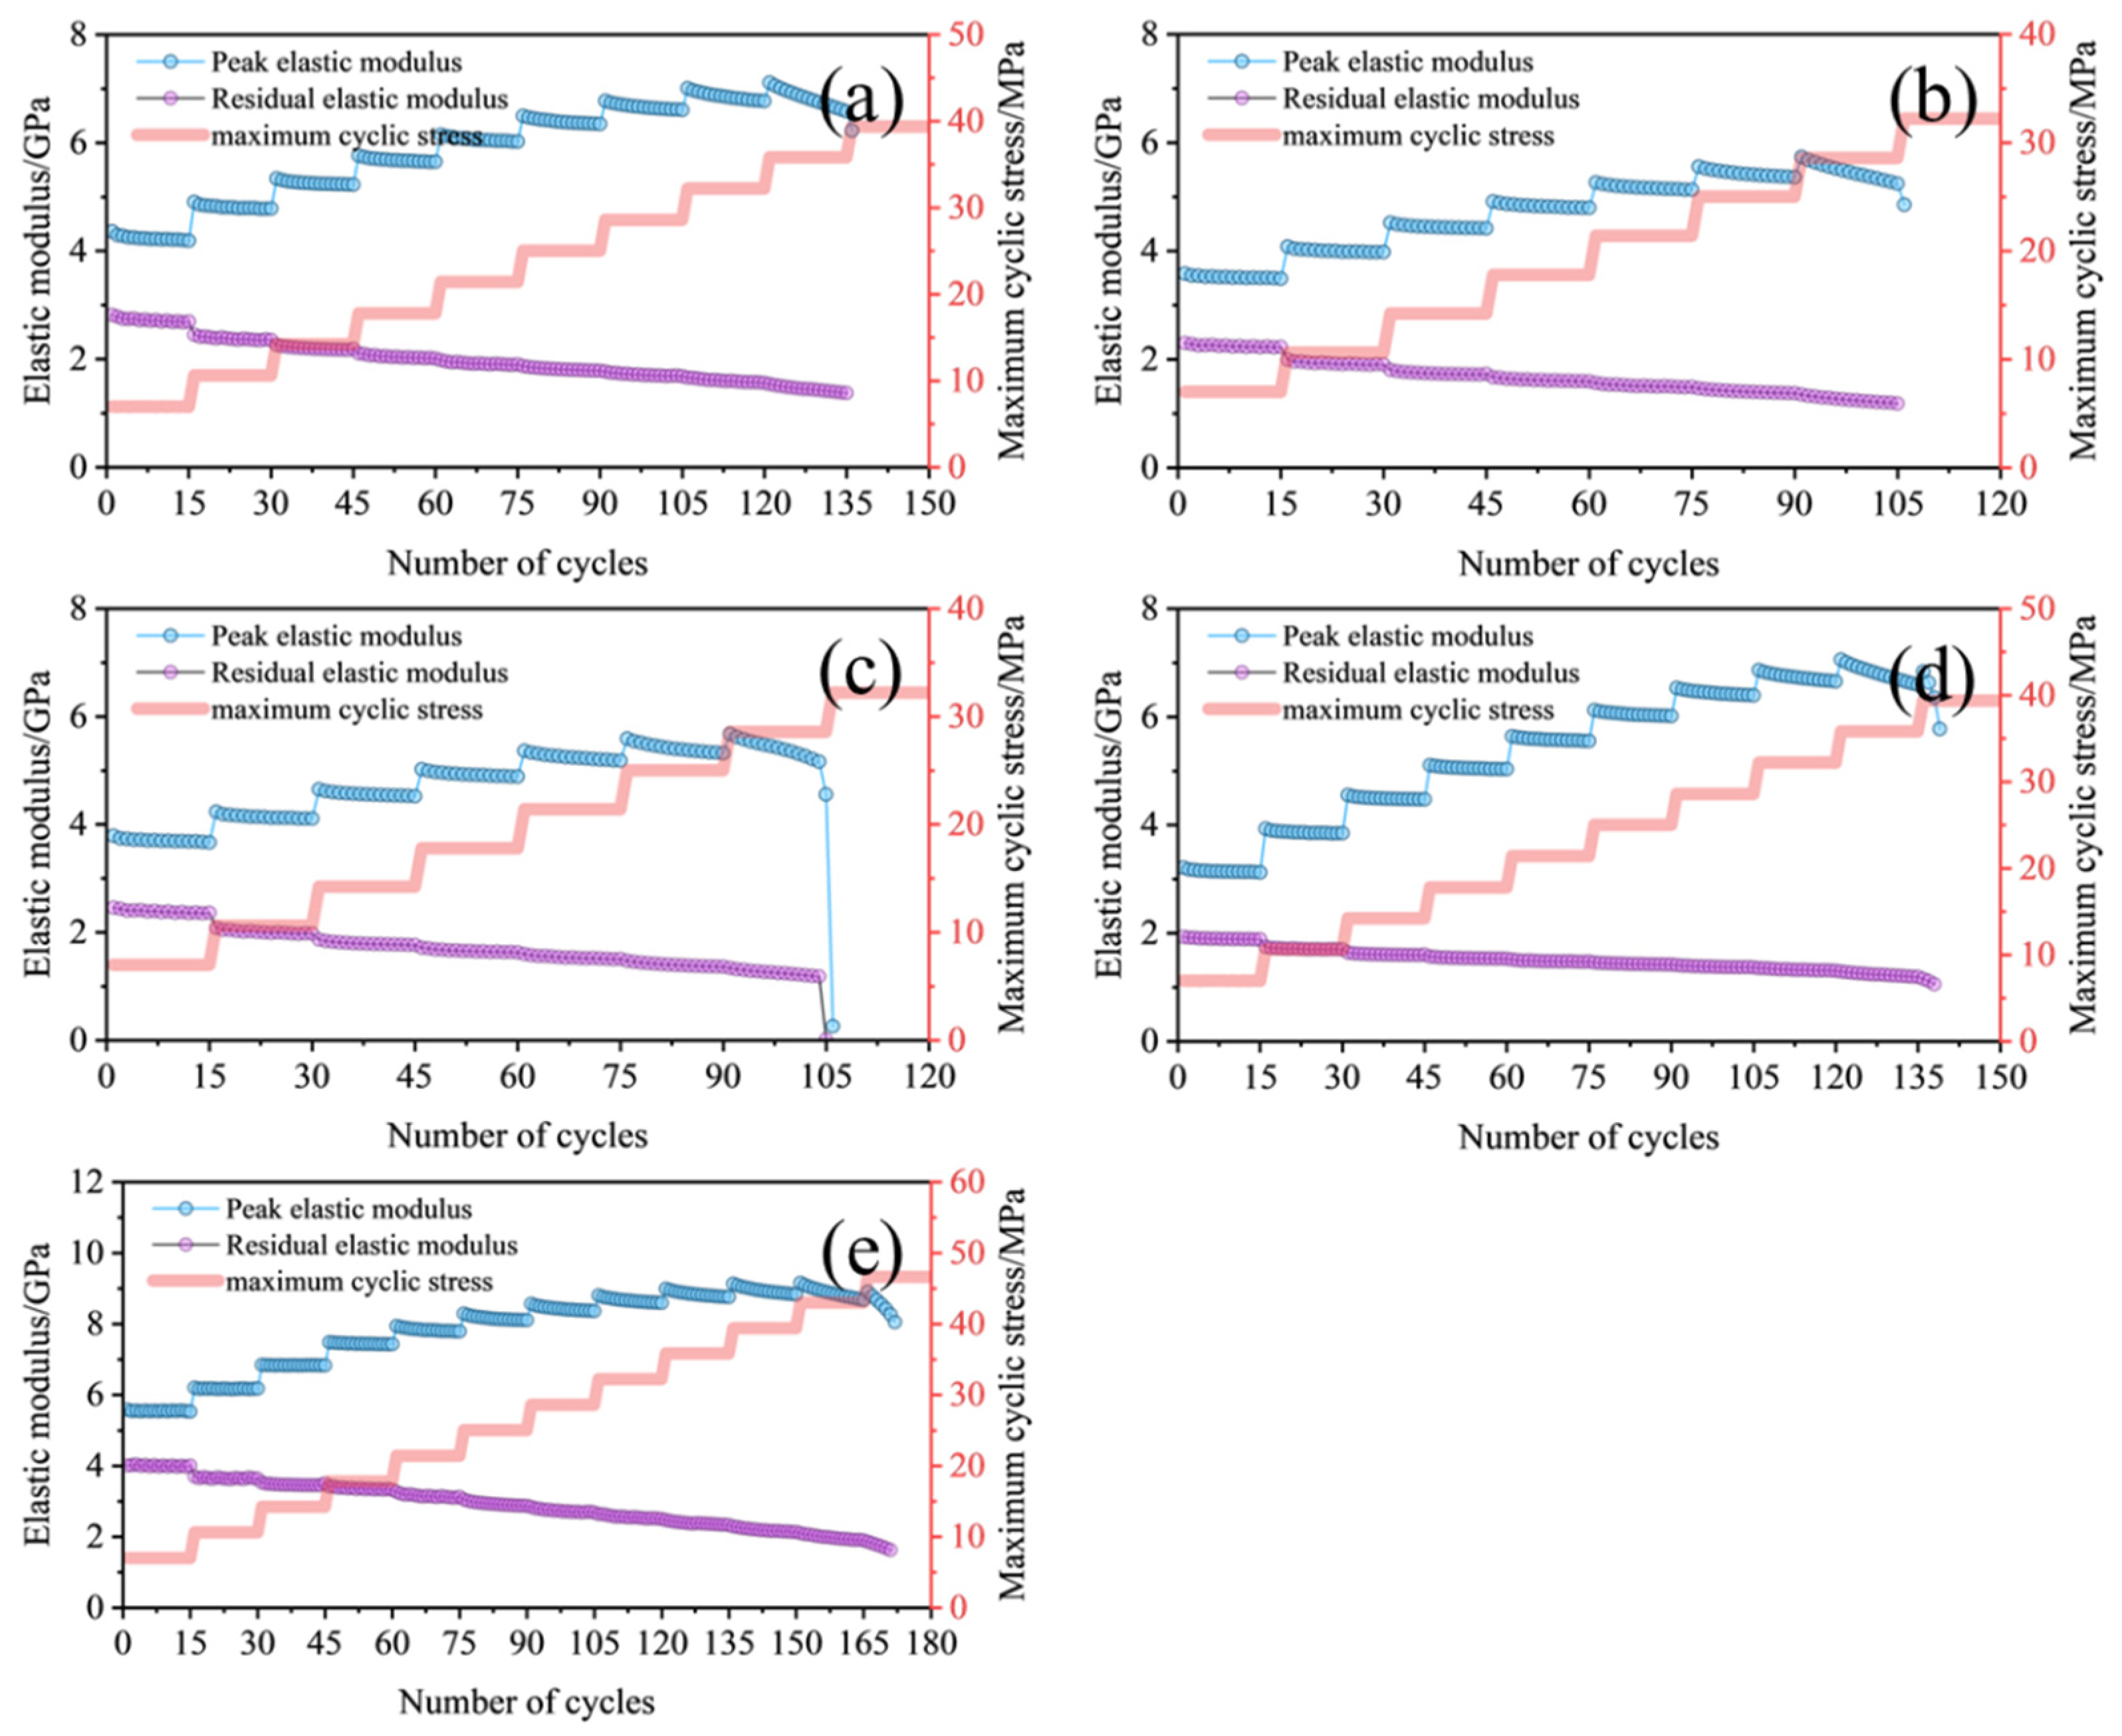
Figure 10 shows the evolution of peak elastic modulus, residual elastic modulus, and maximum cyclic stress with cycle number. For peak elastic modulus (light blue line), evolution shows “intra-level and inter-level differentiation”: within each stress level’s 15 cycles, damage accumulation (crack propagation, microcrack initiation) dominates, outweighing compaction effects (crack closure, particle rearrangement), leading to a continuous decrease, with the highest modulus in the 1st cycle and the lowest in the 15th. Across stress levels, in early low-stress levels (e.g., 2–3), stress elevation enhances crack compaction and particle rearrangement, making the first cycle modulus of a level slightly higher than the previous level’s, showing an initial “increase.” In later high-stress levels, accumulated damage surpasses compaction effects, reducing the first cycle modulus below the previous level’s, showing a “decrease.” Thus, peak elastic modulus exhibits a composite trend of “continuous intra-level decrease and inter-level initial increase followed by decrease.”
Residual elastic modulus (purple line) shows no “inter-level initial increase,” as residual deformation accumulates irreversibly, leading to continuous intra- and inter-level decreases. Both moduli show a common feature in the final stress level: a sharp acceleration in reduction rate and a sudden drop at the level’s end, reflecting critical damage with accelerated crack destabilization and coalescence, causing rapid modulus loss. Despite minor differences in modulus values and critical stress levels due to fracture inclination, the core pattern of “intra-level decrease, inter-level (peak initial) increase-then-decrease, and final sudden drop” is consistent, confirming that fracture inclination only modulates decay rates and compaction damage competition thresholds, not the fundamental evolution mechanism.

3.3. Poisson’s Ratio Evolution

Poisson’s ratio, a dimensionless parameter describing the ratio of transverse to axial strain under uniaxial stress, reflects a rock’s lateral deformation capacity and structural stability [45]. In rock mechanics, it, alongside the elastic modulus, determines compressibility and shear strength, serving as a key indicator of deformation and failure under complex stress. As an “early signal” of rock damage, Poisson’s ratio evolution reveals progressive structural deterioration under cyclic loading. In engineering, it is critical for evaluating rock mass stability and optimizing design to prevent disasters.
Figure 11 shows the evolution of peak Poisson’s ratio (red dots), residual Poisson’s ratio (green dots), and maximum cyclic stress. In early cycle levels, peak Poisson’s ratio decreases with cycle number, transitioning to logarithmic growth as stress levels increase (e.g., sample S4 at the third cycle level, S5 at the fourth). Poisson’s ratio rises in a staircase pattern across stress levels, with gentle changes initially and rapid increases near failure. Residual Poisson’s ratio follows a similar trend, with peak values exceeding residual values before failure, but in the final cycle level, residual Poisson’s ratio surpasses peak values due to critical damage accumulation, confirming the dominance of irreversible deformation.
For the cases in Figure 11c,e, where Poisson’s ratio exceeds 1/2 during the failure stage, this phenomenon reflects the transition of the sample from a “continuous medium” to a “discontinuous medium.” During the late stages of cyclic loading (near failure), a network of interconnected cracks has formed within the sample, disrupting the original continuous medium structure and transforming it into a “discontinuous system containing loosely fragmented particles.” According to continuum mechanics theory, the Poisson’s ratio of homogeneous continuous materials is typically less than 1/2 (due to lateral deformation being constrained by elasticity); however, in a discontinuous particle system, the lateral compression and displacement of loose particles are not constrained by elasticity, leading to a sharp increase in lateral strain, which in turn causes the calculated Poisson’s ratio to exceed 1/2, objectively reflecting the sample’s critical failure state. However, for different crack inclination angles, in several specimens tested in this experiment, the crack inclination angle did not significantly affect the evolution rate of Poisson’s ratio.

3.4. Damage Characteristics Analysis

Under complex cyclic loading–unloading conditions, studying the damage characteristics of sandstone with varying fracture inclination angles holds significant theoretical and practical value. As a natural geological material, sandstone’s structural integrity and stability are critical for the safety and stability assessment of underground and mining engineering projects. The presence and inclination of pre-fabricated fractures influence the mechanical response and damage evolution under cyclic loading [46].
Rock damage evolution can be precisely revealed through multidimensional analysis of strain response characteristics. Strain, a direct physical quantity reflecting internal structural changes, quantifies relative displacement and deformation under external loading. Its complex evolution under cyclic loading–unloading correlates closely with the initiation, development, and failure mechanisms of internal damage. Analyzing strain response provides a macro/micro-perspective on damage characteristics, offering critical data and theoretical support for improving the rationality, safety, and long-term stability of geotechnical engineering designs. In this study, axial strain was converted into a damage variable using the following equation [47]:
D = ε p ε ε ε 0 ε p ε 0
where D is the damage variable, ε0 is the strain at the minimum unloaded stress in the first cycle, εp is the strain at the minimum unloaded stress in the final cycle, and ε is the peak strain of each cycle.
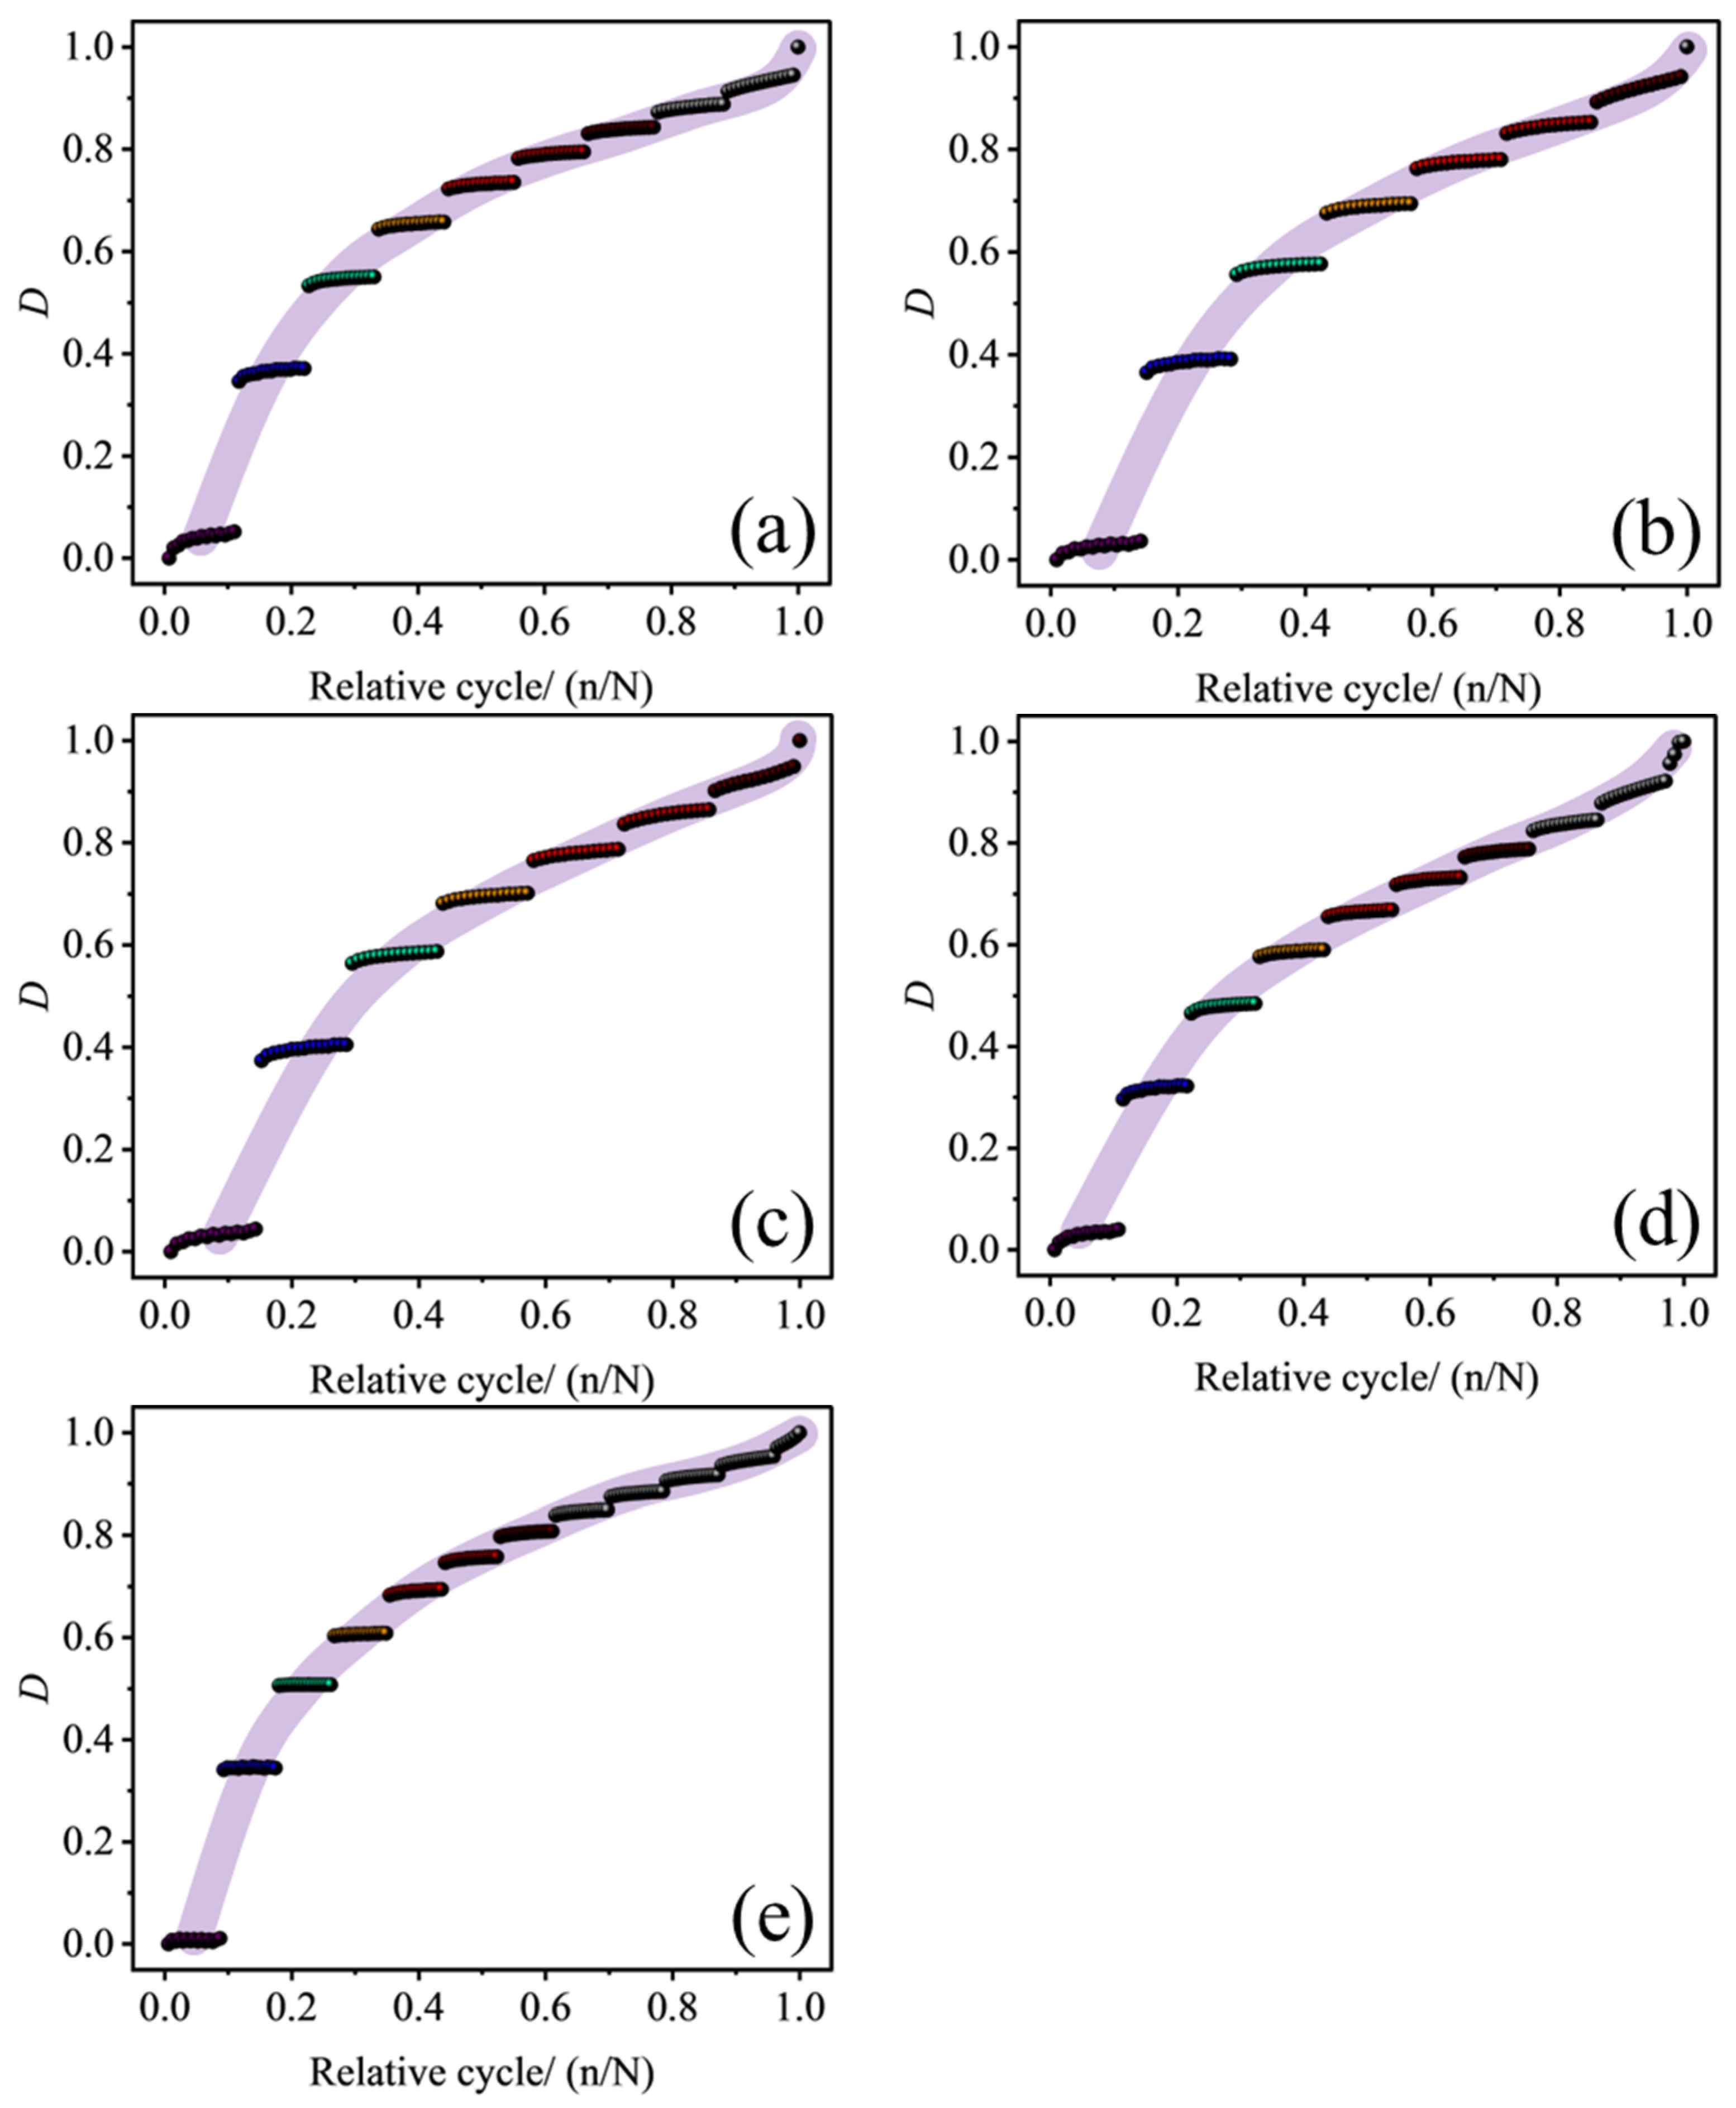
Based on the equation, Figure 12 shows the evolution of damage versus cycle number for sandstone with different fracture inclinations. The x-axis represents relative cycle number (n/N, where n is the cycle number and N is the total cycles). The damage evolution follows an S-shaped three-stage pattern: “slow increase → accelerated increase → approaching 1.”
In the initial stage (n/N < 0.3), compaction dominates crack closure and particle rearrangement, accompanied by irreversible residual deformation (e.g., permanent crack closure and fixed particle rearrangement), causing rapid D growth (steep initial curve slope). For example, sample S4 shows relative growth rates of 12.41 and 0.46 in the first two levels. In the middle stage (0.3 < n/N < 0.8), compaction saturates, and dispersed microcrack initiation/propagation dominates, with stable irreversible strain growth, maintaining a high but stable slope and reduced curvature. Steep inclination samples, with accumulated shear damage, show gradual crack coalescence along fracture planes, maintaining steep slopes but decreasing curvature. Gentle inclination samples delay crack initiation due to compaction, with concentrated crack initiation in this stage, increasing slope to match steep inclinations, transitioning the curve from “upward bending” to “linearized growth,” reflecting a “stable damage period dominated by dispersed cracks.” Near failure (n/N > 0.8), crack networks coalesce, D approaches 1, and the load-bearing system nears collapse.
Fracture inclination clearly modulates this process. Gentle inclination samples (e.g., S4) facilitate compaction, with a higher proportion of reversible deformation (e.g., crack closure retaining elastic recovery), resulting in slower initial D growth and flatter curve slopes. Steep inclination samples (e.g., S8) are prone to shear sliding, with more pronounced irreversible shear deformation (e.g., residual displacement and permanent sliding surface damage), causing rapid initial D increases and steeper curves. This aligns with Figure 11 (Poisson’s ratio), where rapid initial D growth corresponds to steeper peak Poisson’s ratio slopes. The mechanism of “compaction and damage simultaneous initiation, with compaction containing irreversible components” is confirmed by the inter-level slight increase in elastic modulus (Figure 10) and gentle peak Poisson’s ratio growth (constrained lateral deformation). As D growth accelerates, peak elastic modulus drops sharply, load-bearing capacity collapses due to crack propagation, and Poisson’s ratio surges, indicating uncontrolled lateral deformation. This confirms a critical transition from “compaction-driven irreversible” to “crack propagation-driven irreversible” damage. Ultimately, fracture inclination shapes initial D growth differences by modulating the proportion of compaction and shear-driven irreversible deformation, constructing a coupled “damage-mechanics” evolution framework under cyclic loading–unloading, redefining compaction as “deformation adjustment with damage” rather than “pure elastic recovery.”

4. Conclusions

This study conducted freeze–thaw and cyclic loading tests on sandstone samples with varying fracture inclination angles, analyzing the evolution of strain, elastic modulus, Poisson’s ratio, and damage variables. The influence mechanism of fracture inclination on fatigue damage pace through modulating compaction and shear damage proportions was revealed, yielding the following conclusions:
  • Under cyclic loading, sandstone strain exhibits a “staircase accumulation” pattern, with peak and residual strains increasing with cycle progression, the former showing larger increments. Samples with a 45° fracture inclination exhibit the fastest strain growth before failure, while those with a 90° inclination show the highest peak strength, indicating a significant influence of fracture inclination on deformation accumulation and load-bearing capacity.
  • The peak elastic modulus shows “continuous intra-level decrease and inter-level initial increase followed by decrease” (initial increase due to compaction and later decrease due to damage dominance), while residual elastic modulus decreases throughout, with both showing a sharp drop near failure, reflecting rapid load-bearing capacity deterioration.
  • Peak Poisson’s ratio decreases initially, transitions to logarithmic growth, and surges near failure. Residual Poisson’s ratio follows a similar trend, surpassing peak values in the final cycle level, reflecting dominant irreversible deformation, with fracture inclination showing minimal impact on evolution pace.
  • Damage variable evolution follows an S-shaped three-stage pattern: rapid initial growth due to irreversible compaction deformation, stable middle-stage growth due to microcrack propagation, and approaching 1 in the final stage. Steep inclination samples initiate damage earlier and grow faster, while gentle inclinations show slower initial growth, indicating fracture inclination modulates evolution pace through compaction and shear damage proportions.

Author Contributions

Conceptualization, X.Z.; methodology, J.B.; software, formal analysis, Y.W. (Yunfeng Wu); data curation, M.W.; writing—original draft preparation, X.Z.; writing—review and editing, M.W.; funding acquisition, Y.W. (Yaning Wu). All authors have read and agreed to the published version of the manuscript.

Funding

High-level Scientific Research Foundation for the introduction of talent of Qingdao Agricultural University (Grant No. 1120045 and Grant No. 1120051), Cooperation Project of Industry and School (Grant No. 2023370203002938 and Grant No. 2024370203001540).

Institutional Review Board Statement

Not applicable.

Informed Consent Statement

Not applicable.

Data Availability Statement

The original contributions presented in the study are included in the article; further inquiries can be directed to the corresponding authors.

Conflicts of Interest

Author Jiancheng Bi was employed by the company Ansteel Group Mining Co., Ltd. The remaining authors declare that the research was conducted in the absence of any commercial or financial relationships that could be construed as a potential conflict of interest.

References

  1. Zhang, H.; Meng, X.; Yang, G. A study on mechanical properties and damage model of rock subjected to freeze-thaw cycles and confining pressure. Cold Reg. Sci. Technol. 2020, 174, 103056. [Google Scholar] [CrossRef]
  2. Ali, M.; Zubair, A.; Farooq, Z.; Farooq, K.; Masoud, Z. Prediction of small-strain elastic stiffness of natural and artificial soft rocks subjected to freeze-thaw cycles. J. Rock Mech. Geotech. Eng. 2025, 17, 3546–3562. [Google Scholar] [CrossRef]
  3. Yahaghi, J.; Liu, H.; Chan, A.; Fukuda, D. Experimental and numerical studies on failure behaviours of sandstones subject to freeze-thaw cycles. Transp. Geotech. 2021, 31, 100655. [Google Scholar] [CrossRef]
  4. Wang, X.; Mu, W.; Li, L.; Yang, T.; Bai, M.; Du, S. Study on freeze-thaw damage and mechanical properties of fractured rock mass grouting reinforcement in alpine region open-pit mines. Int. J. Rock Mech. Min. Sci. 2025, 192, 106143. [Google Scholar] [CrossRef]
  5. Wang, Y.; Gu, H.; Gu, C.; Shao, C.; Jiang, Z.; Wang, Y.; Chen, X. Analysis of concrete damage evolution in cold regions under combined freeze-thaw cycle-crack effect. Constr. Build. Mater. 2024, 456, 139296. [Google Scholar] [CrossRef]
  6. Wang, J.; Li, J.; Zhou, K.; Jiang, C.; Shen, Y.; Jia, H. Fracture mechanical properties of sandstone with pre-fabricated cracks under freeze–thaw cycles. Theor. Appl. Fract. Mech. 2024, 131, 104444. [Google Scholar] [CrossRef]
  7. Zhang, J.; Chen, Y.; Du, R.; Zhao, X.; Wu, J. Macroscopic and microscopic mechanical characteristics and crack propagation behavior of sandstone-like samples with single cracks under freeze–thaw cycles: Experimental and numerical simulation. Theor. Appl. Fract. Mech. 2024, 129, 104201. [Google Scholar] [CrossRef]
  8. Zaimoğlu, A.Ş.; Kılıç, E.A.; Artuk, F. Analysis of the effect of rock salt on grout’s freeze-thaw strength with the Taguchi Method. Polar Sci. 2022, 34, 100899. [Google Scholar] [CrossRef]
  9. Li, Z.; Liu, X.; Sun, Y.; Jiang, J.; He, Z. A study of the frost heave damage mechanism and numerical simulation of earth-rock dam slope protection in cold regions under the combined effects of moisture migration and ice loads. Cold Reg. Sci. Technol. 2025, 104584. [Google Scholar] [CrossRef]
  10. Fu, X.; Zhao, G.; Wang, M.; Wang, J.; Xu, Y.; Gu, C. Comprehensive evaluation method for structural behavior of concrete dams in cold regions. Eng. Struct. 2023, 278, 115435. [Google Scholar] [CrossRef]
  11. Yu, Y.; Tang, L.; Ling, X.; Geng, L.; Wei, S.; Zhou, G. Investigation of the soil-lining interaction at a tunnel entrance during freeze-thaw cycling: Model testing and semi-empirical modeling. Tunn. Undergr. Space Technol. 2021, 115, 104028. [Google Scholar] [CrossRef]
  12. Jaiswal, A.; Sabri, M.S.; Verma, A.K.; Sardana, S.; Singh, T.N. Prediction of UCS and BTS under freeze-thaw conditions in the NW himalayan rock mass using petrographic analysis and laboratory testing. Quat. Sci. Adv. 2024, 15, 100225. [Google Scholar] [CrossRef]
  13. Liu, Y.; Zhang, Y.; Cheng, Y.; Zhou, L. Experimental investigation on non-linear flow and convective heat transfer of damaged multi-fractured rock. Appl. Therm. Eng. 2025, 264, 125466. [Google Scholar] [CrossRef]
  14. Li, J.; Shi, Z.; Yuan, F.; Guo, B.; Wang, M.; Lin, H.; Han, D.; Li, K. Mechanical properties and fracture damage behavior of thermal storage rocks under constant amplitude low cycle fatigue loading. Eng. Fract. Mech. 2025, 321, 111069. [Google Scholar] [CrossRef]
  15. Yang, D.; Gao, S.; Feng, W.; Ding, S.; Li, J.; Jiao, H. Effect of prefabricated fractured rock dip angles on mechanical properties and failure modes under dynamic and static loads. Green Smart Min. Eng. 2025, 2, 184–195. [Google Scholar] [CrossRef]
  16. Yu, M.; Wang, Z.; Xu, Y.; Chang, Y.; Wang, L.; Zhu, Y. The failure behavior of prefabricated fractured sandstone with different rock bridge inclination angles under freeze-thaw cycles. Unconv. Resour. 2025, 6, 100152. [Google Scholar] [CrossRef]
  17. Deng, Z.; Liu, S.; Wei, J.; Jiang, Z.; Hu, Q. Deformation characteristics and fracture damage model of freezing weakly cemented jointed rock masses. Comput. Geotech. 2025, 187, 107463. [Google Scholar] [CrossRef]
  18. Guler, S.; Akbulut, Z.F. A comprehensive review of concrete durability in freeze-thaw conditions: Mechanisms, prevention, and mitigation strategies. Structures 2025, 75, 108804. [Google Scholar] [CrossRef]
  19. Deng, Z.; Min, J.; Jin, J.; Liu, S.; Wei, J. The macro-meso damage model for jointed rock mass under the sequential effects of freeze–thaw cycles and compressive shear load. Comput. Geotech. 2024, 174, 106644. [Google Scholar] [CrossRef]
  20. Che, Y.; Song, Y.; Yang, H.; Guo, X. Creep properties and model of fractured sandstone under freezing environment. Geomech. Energy Environ. 2024, 38, 100554. [Google Scholar] [CrossRef]
  21. He, J.; Niu, F.; Luo, F.; Jiang, H.; He, P.; Ju, X. Mechanical properties and modified binary–medium constitutive model for red–bed soft rock subjected to freeze–thaw cycles. Cold Reg. Sci. Technol. 2023, 209, 103803. [Google Scholar] [CrossRef]
  22. Zhang, W.; Wang, L.; Song, Y.; Tan, Y. Experimental study on the mechanical properties of grouted rock bolts subjected to sulfate attack and freeze-thaw cycling. Constr. Build. Mater. 2021, 291, 123391. [Google Scholar] [CrossRef]
  23. Zhao, Y.; Zhao, Q.; Yang, T.; Chen, Y.; Zhang, P.; Liu, H. Investigation of crack propagation and acoustic emission characteristics in jointed rock under freeze–thaw cycles based on DEM. Int. J. Min. Sci. Technol. 2025, 35, 1171–1195. [Google Scholar] [CrossRef]
  24. Wang, X.; Li, L.; Mu, W.; Yang, T.; Du, Y.; Lu, J. Damage characteristics and mechanisms of shear strength at the interface between fiber-reinforced concrete and rock under freeze-thaw cycles. J. Build. Eng. 2024, 98, 111191. [Google Scholar] [CrossRef]
  25. He, K.; Wang, Q.; Liu, J.; Zhang, D.; Huang, Z.; Fang, J.; Luo, D. Study on the Deterioration Mechanisms of Basalt with Fractures Under Freeze-Thaw Cycling. Res. Cold Arid. Reg. 2025, 84, 222. [Google Scholar] [CrossRef]
  26. Lei, B.; Yu, L.; Chen, T.; Lv, Z.; Zaland, S.; Tang, Z. Experimental study on the initial damage and mechanical property evolution of recycled coarse aggregates under freeze–thaw cycles and repeated loads. Constr. Build. Mater. 2023, 375, 130972. [Google Scholar] [CrossRef]
  27. Zhang, F.; Yin, W.; Zhang, K.; Jiang, H. Study on shear creep test and nonlinear model of granite structural plane under coupled freeze-thaw cycle and chemical corrosion. Int. J. Non-Linear Mech. 2025, 170, 105012. [Google Scholar] [CrossRef]
  28. Xu, Y.; Yue, T.; Wu, B.; Wang, Q.; Cheng, C.; Xu, Z. Dynamic tensile properties of sandstone under coupling effects of water chemical corrosion and freeze-thaw cycles at sub-zero temperatures. Constr. Build. Mater. 2025, 458, 139734. [Google Scholar] [CrossRef]
  29. Xuan, Z.; Sun, Z.; Wang, J.; Sun, W.; Liang, B.; Ma, Z. Pore structure evolution and damage creep model of shale subjected to freeze-thaw treatment. J. Mater. Res. Technol. 2022, 19, 821–836. [Google Scholar] [CrossRef]
  30. Mitchell, A.; Sass, O. Rock weathering: The effects of varying rock moisture on controlled weathering cycles in low porosity limestone. Geomorphology 2024, 457, 109149. [Google Scholar] [CrossRef]
  31. Kongandembou, M.L.; Yu, Q. Blockiness and hydraulic conductivity of rocks with different fracture geometries. J. Hydrol. 2025, 661, 133700. [Google Scholar] [CrossRef]
  32. Ajami, M.; Asgari, K.; Kadkhodaie, A. Analysis of the correlation between fracture topology and mechanical properties of rocks in fractured carbonate reservoirs: In Dehram group, Fars arc Zone (Southwest Iran). Mar. Pet. Geol. 2025, 177, 107368. [Google Scholar] [CrossRef]
  33. Su, Q.; Qian, H. Dynamic mechanical properties and failure mechanisms of rock-like materials containing main and auxiliary holes with various arrangement inclinations and spacing ratios. Theor. Appl. Fract. Mech. 2024, 131, 104456. [Google Scholar] [CrossRef]
  34. Hu, C.; Li, X.; Wu, Y.; Meng, B.; Jia, B. Experimental and numerical investigation on mechanical and fracture characteristics of jointed rock with varying roughness. J. Saf. Sustain. 2025, 2, 59–71. [Google Scholar] [CrossRef]
  35. Xue, F.; Zhou, X.; Wang, X.; Wu, J.; Lin, Z.; Zhou, S. Experimental investigation of lithology-dependent response to loading rate in rock fracture: From microcracking mechanisms to macroscopic fracture characteristics. Theor. Appl. Fract. Mech. 2025, 139, 105088. [Google Scholar] [CrossRef]
  36. Guo, T.; Liu, K.; Wang, H.; Si, X.; Rui, Y.; Pu, C.; Zhang, Y.; Yuan, C. Mechanical characteristics and fracturing behavior of rock-concrete composite specimens with two pre-existing parallel flaws under uniaxial compression based on AE and DIC systems. Theor. Appl. Fract. Mech. 2025, 136, 104866. [Google Scholar] [CrossRef]
  37. Li, Z.; Hu, F.; Qi, S.; Hu, R. Strain-softening failure mode after the post-peak as a unique mechanism of ruptures in a frozen soil-rock mixture. Eng. Geol. 2020, 274, 105725. [Google Scholar] [CrossRef]
  38. Liu, M.; Ma, W.; Niu, F.; Luo, J.; Yin, G. Thermal performance of a novel crushed-rock embankment structure for expressway in permafrost regions. Int. J. Heat Mass Transf. 2018, 127, 1178–1188. [Google Scholar] [CrossRef]
  39. Yu, M.; Wang, Z.; Xu, Y.; Wang, Y.; Wang, L.; Wen, J. Study on mechanical properties and energy evolution characteristics of excavation unloading rock under freeze–thaw temperature range. Eng. Fract. Mech. 2025, 325, 111293. [Google Scholar] [CrossRef]
  40. Chen, X.; Li, Y.; Shi, X.; Liu, Q.; Xiong, T. Microstructure, seepage regimes and stress-strain analysis of bedded rock salt interface. J. Energy Storage 2025, 120, 116521. [Google Scholar] [CrossRef]
  41. Yin, Y.; Zheng, W.; Tang, X.; Xing, M.; Zhang, Y.; Zhu, Y. Test study on failure and energy supply characteristics of rock under different loading stiffness. Eng. Fail. Anal. 2022, 142, 106796. [Google Scholar] [CrossRef]
  42. Li, K.; Li, Y.; Yin, F.; Dai, F.; Wang, C.; Zhang, S.; Wang, K. Mechanical properties and failure mechanism of rock-like specimens with arc-shaped flaws under freeze–thaw cycles. Theor. Appl. Fract. Mech. 2024, 130, 104275. [Google Scholar] [CrossRef]
  43. Chang, K.W.; Ross, T.S.A. Cyclic loading–unloading impacts on geomechanical stability of multiple salt caverns for underground hydrogen storage. Int. J. Hydrogen Energy 2025, 102, 767–777. [Google Scholar] [CrossRef]
  44. Yu, X.; Tan, Y.; Song, W.; Kemeny, J.; Qi, S.; Zheng, B.; Guo, S. Damage evolution of rock-encased-backfill structure under stepwise cyclic triaxial loading. J. Rock Mech. Geotech. Eng. 2024, 16, 597–615. [Google Scholar] [CrossRef]
  45. Kallimogiannis, V.; Saroglou, C. Mechanical properties of carbonate fault rocks. Int. J. Rock Mech. Min. Sci. 2024, 176, 105681. [Google Scholar] [CrossRef]
  46. Liu, X.; Li, P.; Guo, X.; Luo, X.; Zhou, X.; Miao, L.; Zhou, F.; Wang, H. A statistical damage-based constitutive model for shearing of rock joints in brittle drop mode. Int. J. Min. Sci. Technol. 2024, 34, 1041–1058. [Google Scholar] [CrossRef]
  47. Wang, Y.; Chen, Z.; Xia, Y.; Li, P.; Cai, M. The Effect of Cyclic Disturbed Frequency on Mechanical, Acoustic Emission and Crack Pattern for Rock–Backfill Composites Exposed to Fatigue Loading Condition. Rock Mech. Rock Eng. 2025, 58, 7041–7066. [Google Scholar] [CrossRef]
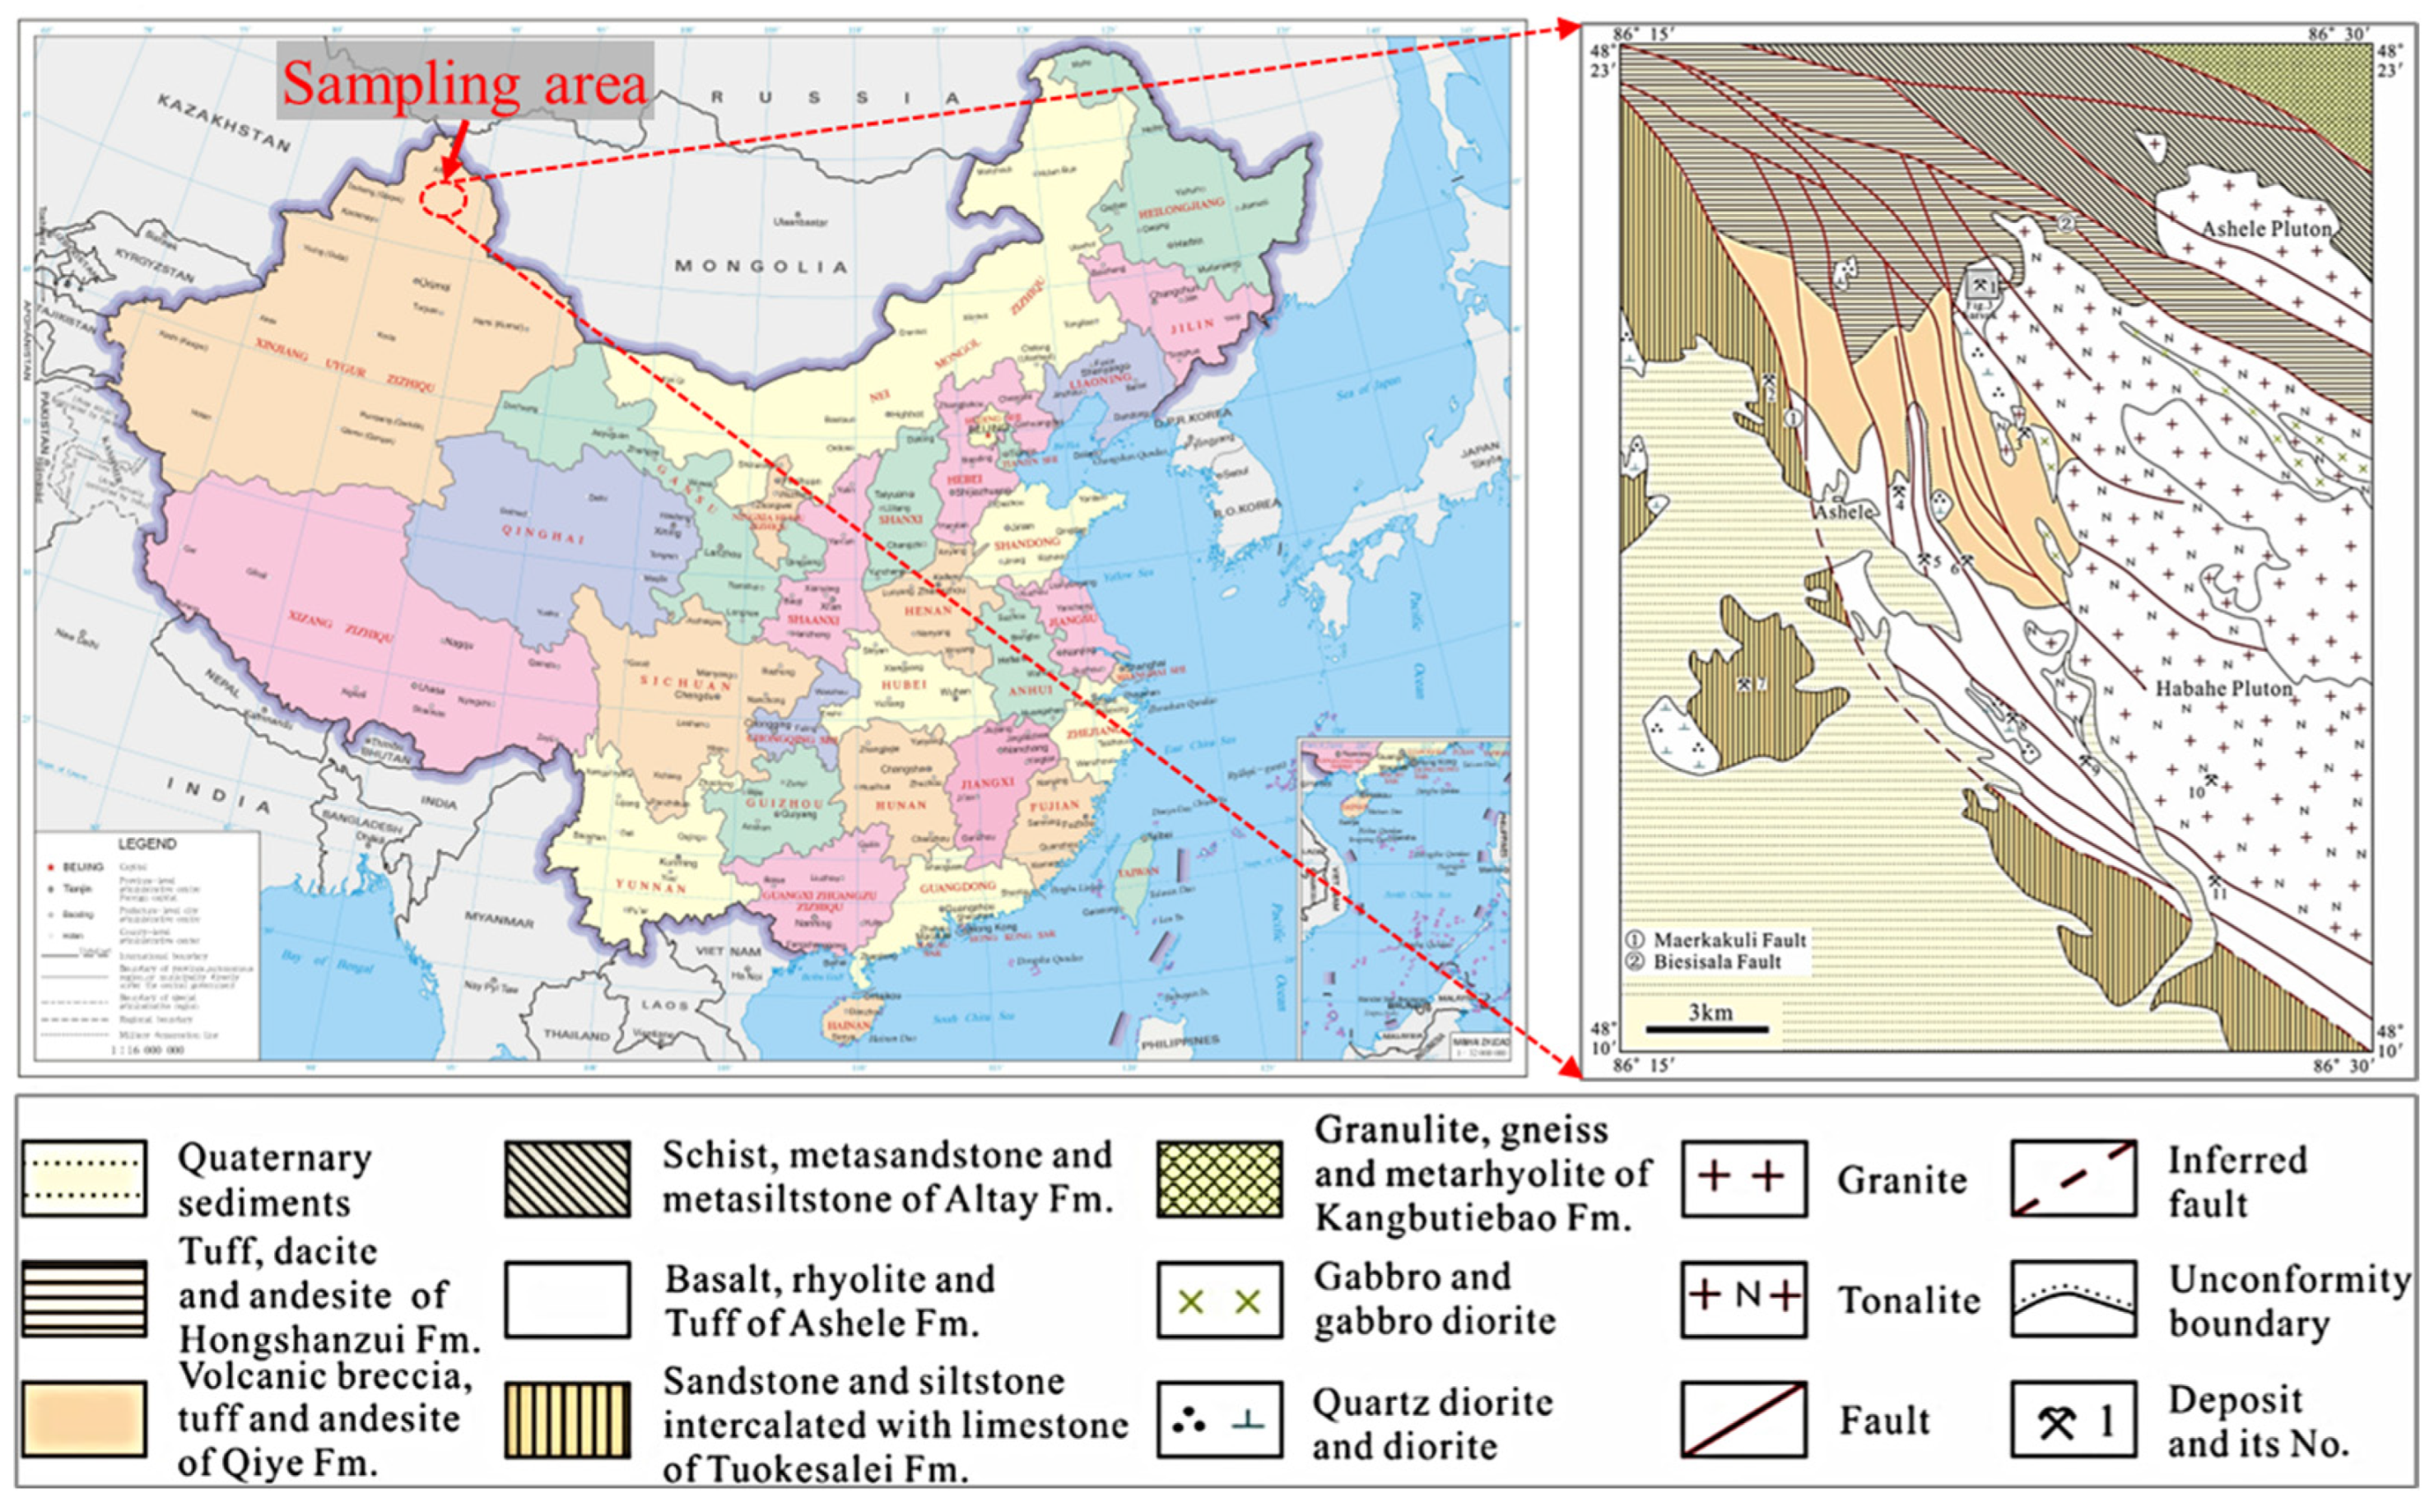
Figure 1. Sampling area location and geological conditions of the region.
Applsci 15 09757 g001
Figure 2. Physical property testing of samples: (a) sample preparation; (b) density testing; (c) wave velocity testing.
Applsci 15 09757 g002
Figure 3. Microscopic component analysis of sandstone samples: (a) binocular polarizing microscope: quartz (Q), feldspar (F), and rock fragments (D); (b) XRD component analysis.
Applsci 15 09757 g003
Figure 5. Freeze–thaw cycling process: (a) freeze–thaw timing diagram; (b) single freeze–thaw cycle flowchart.
Applsci 15 09757 g005
Figure 4. Testing equipment overview: (a) testing machine system; (b) operation interface; (c) sample deformation testing diagram.
Applsci 15 09757 g004
Figure 6. Stress loading path diagrams: (a) monotonic loading test; (b) cyclic loading test.
Applsci 15 09757 g006
Figure 7. Strain–time curve analysis: (a) sample S4; (b) sample S5; (c) sample S6; (d) sample S7; (e) sample S8.
Applsci 15 09757 g007
Figure 8. Average strain trends per cycle level: (a) sample S4; (b) sample S5; (c) sample S6; (d) sample S7; (e) sample S8.
Applsci 15 09757 g008
Figure 9. Elastic modulus calculation diagram.
Applsci 15 09757 g009
Figure 10. Elastic modulus evolution with cycle number: (a) sample S4; (b) sample S5; (c) sample S6; (d) sample S7; (e) sample S8.
Applsci 15 09757 g010
Figure 11. Poisson’s ratio evolution with cycle number: (a) sample S4; (b) sample S5; (c) sample S6; (d) sample S7; (e) sample S8.
Applsci 15 09757 g011
Figure 12. Damage evolution of samples: (a) sample S4; (b) sample S5; (c) sample S6; (d) sample S7; (e) sample S8.
Applsci 15 09757 g012
Table 1. Physical parameters of samples.
No.Mass
[g]
High
[mm]
Diameter [mm]Density [g/m3]Axial Longitudinal Wave Velocity [m/s]Radial Longitudinal Wave Velocity [m/s]
S1475.2100.4249.532.4626322155
S2474.4100.2549.632.4527372232
S3474.4100.4149.612.4426702232
S4475.699.7450.762.3620781786
S5480.8100.2650.592.3921501866
S6475.499.6150.662.3722602049
S7483.6100.1850.572.4022821894
S8479.850.66100.132.3823152083
Disclaimer/Publisher’s Note: The statements, opinions and data contained in all publications are solely those of the individual author(s) and contributor(s) and not of MDPI and/or the editor(s). MDPI and/or the editor(s) disclaim responsibility for any injury to people or property resulting from any ideas, methods, instructions or products referred to in the content.