1. Introduction
Inventory and documentation work in underground public-use facilities are being carried out on a broad scale both in Poland [
1,
2,
3,
4,
5,
6,
7,
8] and in many countries across Europe [
9,
10,
11,
12] and the world [
13,
14,
15,
16,
17,
18,
19,
20]. Their objective is to meet the requirements imposed by administrative regulations, legal provisions, and internal guidelines (including occupational health and safety regulations), which are driven by growing needs, changing trends, and evolving approaches to the development and use of such facilities.
From the architectural and construction perspective, these efforts aim to provide a diagnostic overview of available resources, identify existing potential, and propose directions for their use, such as for new workplaces, exploration sites, or educational pathways. From an urban planning perspective, they are intended to supplement information on spatial development. Workings carried out in underground facilities use available non-invasive methods and tools, primarily to supplement missing documentation—cartographic (maps and cross-sections), architectural, and construction related (reconstruction of design documentation for historical structures)—and to provide information regarding the safe use and adaptation of these spaces in accordance with applicable legal regulations.
In recent years, one of the priority tasks carried out alongside documentation workings has been the assessment of the risk of exposure to ionizing radiation from radon, as well as the determination of the annual average radon activity concentration in workplaces (dosimetric assessment). In Poland, this obligation applies to all workplaces, including those located underground. It directly results from mandatory legal regulations under the Atomic Law Act [
21], the directive for European Union Member States [
22], and is also recommended by international organizations such as the IAEA [
23,
24] and the ICRP [
25,
26,
27]. Radon is considered a source of radiological hazard, subject to assessment and probabilistic estimation of its occurrence. In mining facilities, exposure assessment is carried out by determining the amount of short-lived radon decay products or radium isotopes absorbed by the body, as well as external exposure to gamma radiation emitted by mine deposits and surrounding rock formations [
28]. The provisions of the Atomic Law [
21] are further specified by the Regulation of the Minister of Health of 18 June 2020, which designates areas where the annual average indoor radon activity concentration in a significant number of buildings may exceed the reference level [
29]. These are areas where measurements and monitoring should be prioritized. They include regions of the Lower Silesian Voivodeship, in particular Jeleniogórski County, the city of Jelenia Góra (county status), Kamiennogórski, Lwówecki, Trzebnicki, Wałbrzyski counties, the city of Wałbrzych (county status), and the counties Złotoryjski, Dzierżoniowski, Kłodzki, Polkowicki, Zgorzelecki, Ząbkowicki, and Lubański. The enforcement of legal obligations by employers is overseen by personnel from the Chief Sanitary Inspectorate. In the case of mining facilities supervision is conducted by the State Mining Authority.
The presented study is a methodological work. It describes the initial characterization of radon activity concentration level variations on an hourly, daily, and monthly cycle for the tourist route in the inactive “Aurelia” Gold Mine in Lower Silesia (Złotoryja, SW Poland). The interpretation of the results was based on the outcomes of the mapping work based on terrestrial laser scanning technology. These are the first inventory measurements conducted in this manner for this site. They can serve as a basis for delineating zones with varied geogenic potential both within the underground mining excavation itself and other underground structures located within the administrative boundaries of the town of Złotoryja.
2. Materials and Methods
Measurements in the selected underground facility were conducted in two stages. In the first stage, environmental measurements of the 222Rn activity concentration were planned and performed. In the second stage, terrestrial laser scanning of the underground excavations was carried out. The measurements were conducted with the authorization of the Director of the Złotoryja Center for Culture and Recreation, who serves as the facility’s administrator.
For the comparative analysis of outlying radon activity concentration values (anomalous values), seismic data (induced seismic shocks) related to ongoing underground mining operations in the Legnica–Głogów Copper District (LGOM) area were utilized. The data considered in assessing the causes of concentration values significantly exceeding the average were obtained from the seismic event register maintained as part of continuous monitoring of the Earth’s crust seismic activity (data sourced from seismological stations operating within the PSG_Sejs_Net seismic monitoring network). In the discussion, seismic events with a surface perceptibility threshold defined by a magnitude of M > 2.5 were used. For this purpose, the database consisting of the event register and excerpts from the seismological report available on the website of the Polish Geological Institute—National Research Institute (PIG-PIB) was consulted [
30].
In order to determine the distribution characteristics of 222Rn activity concentration data, the Shapiro–Wilk normality test was first performed. Subsequently, to identify outliers and extreme outliers within the dataset, a classification based on the interquartile range (IQR) was carried out according to Tukey’s rule.
The decision to accept or reject the null hypothesis (H0), which assumes normality of the data distribution, was based on the p-value obtained from the Shapiro–Wilk test. A p-value greater than 0.05 supported the assumption of normal distribution and provided no grounds to reject H0 in favor of the alternative hypothesis (H1). Conversely, a p-value ≤ 0.05 was taken as evidence to reject H0 and accept H1, indicating a departure from normality.
Outliers and extreme outliers were identified using Tukey’s method, supported by box-and-whisker plots generated using Statistica software version 13.3. This rule is based on the distribution of data and quartile values, and it does not require the assumption of normality. Key positional measures were used to characterize the data distribution: the first quartile (Q1), defined as the value below which 25% of the observations fall, and the third quartile (Q3), marking the point below which 75% of the observations are located. The interquartile range (IQR), calculated as Q3 − Q1, served as a robust measure of variability, focusing on the central 50% of the data. Unlike the standard deviation, the IQR is less sensitive to the presence of extreme values.
To identify outliers, the classical IQR-based criterion was applied. The range of non-outlying data was defined as the interval from Q1 − 1.5 × IQR to Q3 + 1.5 × IQR. Observations falling outside this range were classified as outliers. The range of data classified as outliers is defined as the interval from Q1 − 1.6 × IQR to Q3 + 1.6 × IQR. In addition, extreme outliers were identified using an extended IQR criterion: observations lying below Q1 − 3 × IQR or above Q3 + 3 × IQR were categorized as extreme outliers.
2.1. Object Description
The “Aurelia” Gold Mine is located on the slope of St. Nicholas Mountain in the town of Złotoryja in Lower Silesia (SW Poland). Contrary to its name, the “Aurelia” mine was not associated with gold mining but with the extraction of copper ore deposits, as evidenced by existing archival source materials as Festenberg-Packisch from 1881, Fechner from 1903, the Codex Diplomaticus Silesiae by Wutke from 1900–1901, Quiring from 1914, and Scupin from 1925 discussed in publications [
31,
32,
33].
The Aurelia mine was excavated in the metamorphic formations of the Kaczawa unit: the Kaczawa Metamorphic Complex [
34]. These formations comprise metabasites (metagabbros/diabases) and phyllites/sericitic shales, which are dated to the Ordovician–Silurian period [
30] and belong to the Złotoryja–Luboradz unit [
34].
The underground excavations are located within massive diabases (metabasalts), which occur as magmatic intrusions. These intrusions exhibit the form of sills emplaced within the surrounding country rocks, namely metasedimentary formations such as sericite schists and phyllites [
34,
35]. The diabases encountered in the adit display a predominantly massive texture; however, foliated varieties with distinct schistosity planes are also observed. The mineral assemblage of the diabases includes albite (as the principal mineral), epidote, chlorite, calcite, actinolite, and iron oxides. Calcite and quartz veins are also present within the diabase bodies.
Archival documents analyzed by Stolarczyk [
31] as well as Maciejak and Maciejak [
33] indicate that the excavation of the “Aurelia” adit on the slopes of Mount St. Nicholas took place in 1661. These mining activities resulted in the extraction of small quantities of silver and copper and also led to the discovery of older adits, most likely dating back to the late 14th or early 15th century [
31,
33].
The existence of mine workings associated with copper ore extraction and smelting was further confirmed by archaeological research conducted in 2012 as part of the scientific project Studies of Sites of Historical Copper Mining and Metallurgy. This initiative, carried out under the Cultural Heritage—Protection of Archaeological Monuments program of the Ministry of Culture and National Heritage, focused on the Kaczawskie Foothills and the Rudawy Janowickie region. The investigations were conducted by staff of the Copper Museum in Legnica in collaboration with researchers from several academic institutions, including Wrocław University of Science and Technology, the AGH University of Science and Technology in Kraków, and the University of Wrocław [
31].
Findings from the archaeological investigations suggest that the “Aurelia” workings may be remnants of the “Złote Koło” (“Golden Wheel”) mine, mentioned in early 15th-century records. Supporting evidence includes the adit’s location near the former course of a millrace. Since 1973, the “Aurelia” adit has been open to the public.
2.2. Radon Measurements
Due to the seasonal accessibility of the selected research area, radon activity concentration measurements did not cover the entire calendar year. The closure of the facility following the tourist season (in September), the absence of supervision during the off-season, and the lack of a permanent connection to the power grid—preventing continuous operation of the measuring equipment—contributed to the shortening of the measurement period. In the conducted radon measurement campaign, the results stored in the memory of the AlphaE device were read out at a frequency of 14 days.
Radon measurements were initiated on 17 March 2023 and concluded on 26 August 2023. Data were recorded at one-hour intervals throughout the measurement period. A single monitoring station was installed within the site, positioned in a lateral corridor (
Figure 1).
The measurements were conducted using the AlphaE detector S/N AE001330, manufactured by the German company Bertin (Frankfurt am Main, Germany). According to the calibration certificate, the measurement uncertainty of the device is ±10%, with a single reading accuracy of 0.1 Bq/m
3 [
36]. According to the authors’ measurements [
2], during extended exposure periods (exceeding 12 h), the AlphaE device is capable of measuring radon activity concentrations as low as below 20 Bq/m
3. The AlphaE device is equipped with a semiconductor detector utilizing a silicon diode, operating in compliance with EN/IEC standards related to electromagnetic compatibility requirements. Radon enters the detection chamber through inlet openings occupying a total area of 1.3 cm
2 on the device’s housing, which is entirely covered with a Gore-Tex membrane. Alpha particles emitted during the decay of
222Rn are registered by the detector as voltage pulses, which are amplified, counted, and converted into the appropriate units based on the device’s calibration parameters. The collected data are stored by an onboard microcontroller. Additional information is available in the literature referenced as [
2].
2.3. 3D Mapping of Underground Excavations
After the completion of tracer studies, inventory work was carried out within the tourist-accessible underground corridors of the “Aurelia” Mine. These activities took place on 16 November 2023 and involved the use of terrestrial laser scanning technology for the acquisition of spatial data.
For this purpose, a Riegl scanning system equipped with a VZ-400i (Riegl) pulsed laser head was used. During the field survey, a total of 49 scanner positions were planned (
Figure 2), ensuring full coverage of the area of interest: both the external section (the area in front of the adit entrance) and the underground workings (
Figure 1). While conducting the outdoor measurements, the scanning head was fitted with a GNSS antenna, enabling the georeferencing of the data to WGS84 coordinate system.
The preliminary processing of the acquired spatial data was carried out in two stages. The first stage involved the so-called data registration, i.e., the alignment of individual scanning positions into a single, coherent dataset. This process employed the Automatic Registration 2 algorithm implemented in the dedicated software RiScan Pro 2.9. The algorithm is based on a voxel-based approach, in which the point cloud from each scanning position is divided into cubes (voxels) of finite volume. Given the characteristics of the surveyed object, a voxel edge length of 25 cm was selected. Within each voxel, surface elements were generated based on the points contained within that volume. The surfaces generated in corresponding voxels from two adjacent scan positions were then compared. If the overlap or matching accuracy between them met the threshold of at least 30%, the scan positions were merged. The matched surfaces served as reference surfaces for establishing the spatial alignment between scans.
The second stage of data post-processing involved both automated and manual filtering, as well as point cloud decimation. Filtering was performed to eliminate erroneously measured points—for example, reflections from moist surfaces—while decimation aimed to standardize the density of the point cloud. The final product, obtained after the completion of all the aforementioned operations, contained ~72 million points.
2.4. Research Limitations
The tracer radon measurements conducted within the selected research site were associated with a number of limitations that may have influenced the interpretation of the authors’ results. The most significant of these include the following:
The lack of clear cause-and-effect evidence, despite the observation of extreme 222Rn activity concentration values during periods temporally close to mining-induced seismic events (second half of August 2023);
One observation point in the mine, in a closed area, which naturally affects the results of the study;
Insufficient knowledge of local ventilation conditions, apart from the general information that ventilation is natural and influenced by atmospheric conditions;
The limited measurement period: a short-term, six-month campaign did not allow for the identification of long-term patterns, including seasonal trends and transitional variability periods observed in other underground facilities in Poland;
The absence of simultaneously recorded geophysical data, including information on local stress conditions in the rock mass.
3. Results and Discussion
Tracer investigations were conducted from 17 March 2023 to 26 August 2023. During this six-month observation period, with a one-hour recording interval, a total of 3737 data records on 222Rn activity concentration were collected. The mean concentration value over the observation period was 860.9 Bq/m3. The results showed a wide range, with a minimum of 11.4 Bq/m3 and a maximum of 427,008 Bq/m3. Due to this substantial variability, it was deemed necessary to examine the number of outliers and extreme outliers and to identify the concentration values that dominated the overall measurement process: those located near the central region of the data distribution.
The Shapiro–Wilk normality test (
p = 0.000) clearly indicated the need to reject the null hypothesis of a normally distributed dataset. Descriptive statistics—including measures of central tendency (mean and median), dispersion (standard deviation and interquartile range), and distribution shape (skewness and kurtosis)—confirmed a right-skewed distribution and a deviation toward higher concentration values. Positive skewness indicated that the majority of
222Rn activity concentration values were clustered toward the lower end of the scale, with a tail extending toward higher concentrations. In such distributions, the mean exceeded the median (
Table 1).
The descriptive statistical measures presented in
Table 1 unambiguously demonstrate that for each month of observation, the data exhibited right skewness, indicating asymmetry with a heavy tail on the side of higher
222Rn concentration values. This pattern persisted from March through June. Skewness values obtained for July and August indicate a pronounced right skew, with long, big tails suggesting the presence of numerous outliers and extreme outliers.
The kurtosis values calculated for individual observation periods (
Table 1) highlight significant differences in data concentration around the mean and in the tails, compared to a normal distribution. Kurtosis values below 3 indicate that very few observations were concentrated around the mean, suggesting a strongly platykurtic distribution, as observed in March and May. In April and June, kurtosis values were slightly above 3, possibly indicating heavier tails and a greater number of outliers. In July and August, kurtosis values were exceptionally high, pointing to the presence of an extreme number of outlying observations.
Standard deviations calculated for each observation period revealed that the most dispersed data—relative to the mean—occurred in July and August (
Table 1). Moderate dispersion was observed in May and June. In contrast, standard deviations were lowest in March and April, suggesting that the data were closely clustered around the mean
222Rn activity concentration values (
Table 1).
Outliers and extreme outliers were identified using Tukey’s rule. For each category, only the upper boundary of the value range was reported, defined as Q3 + 1.6 × IQR for outliers and Q3 + 3 × IQR for extreme outliers.
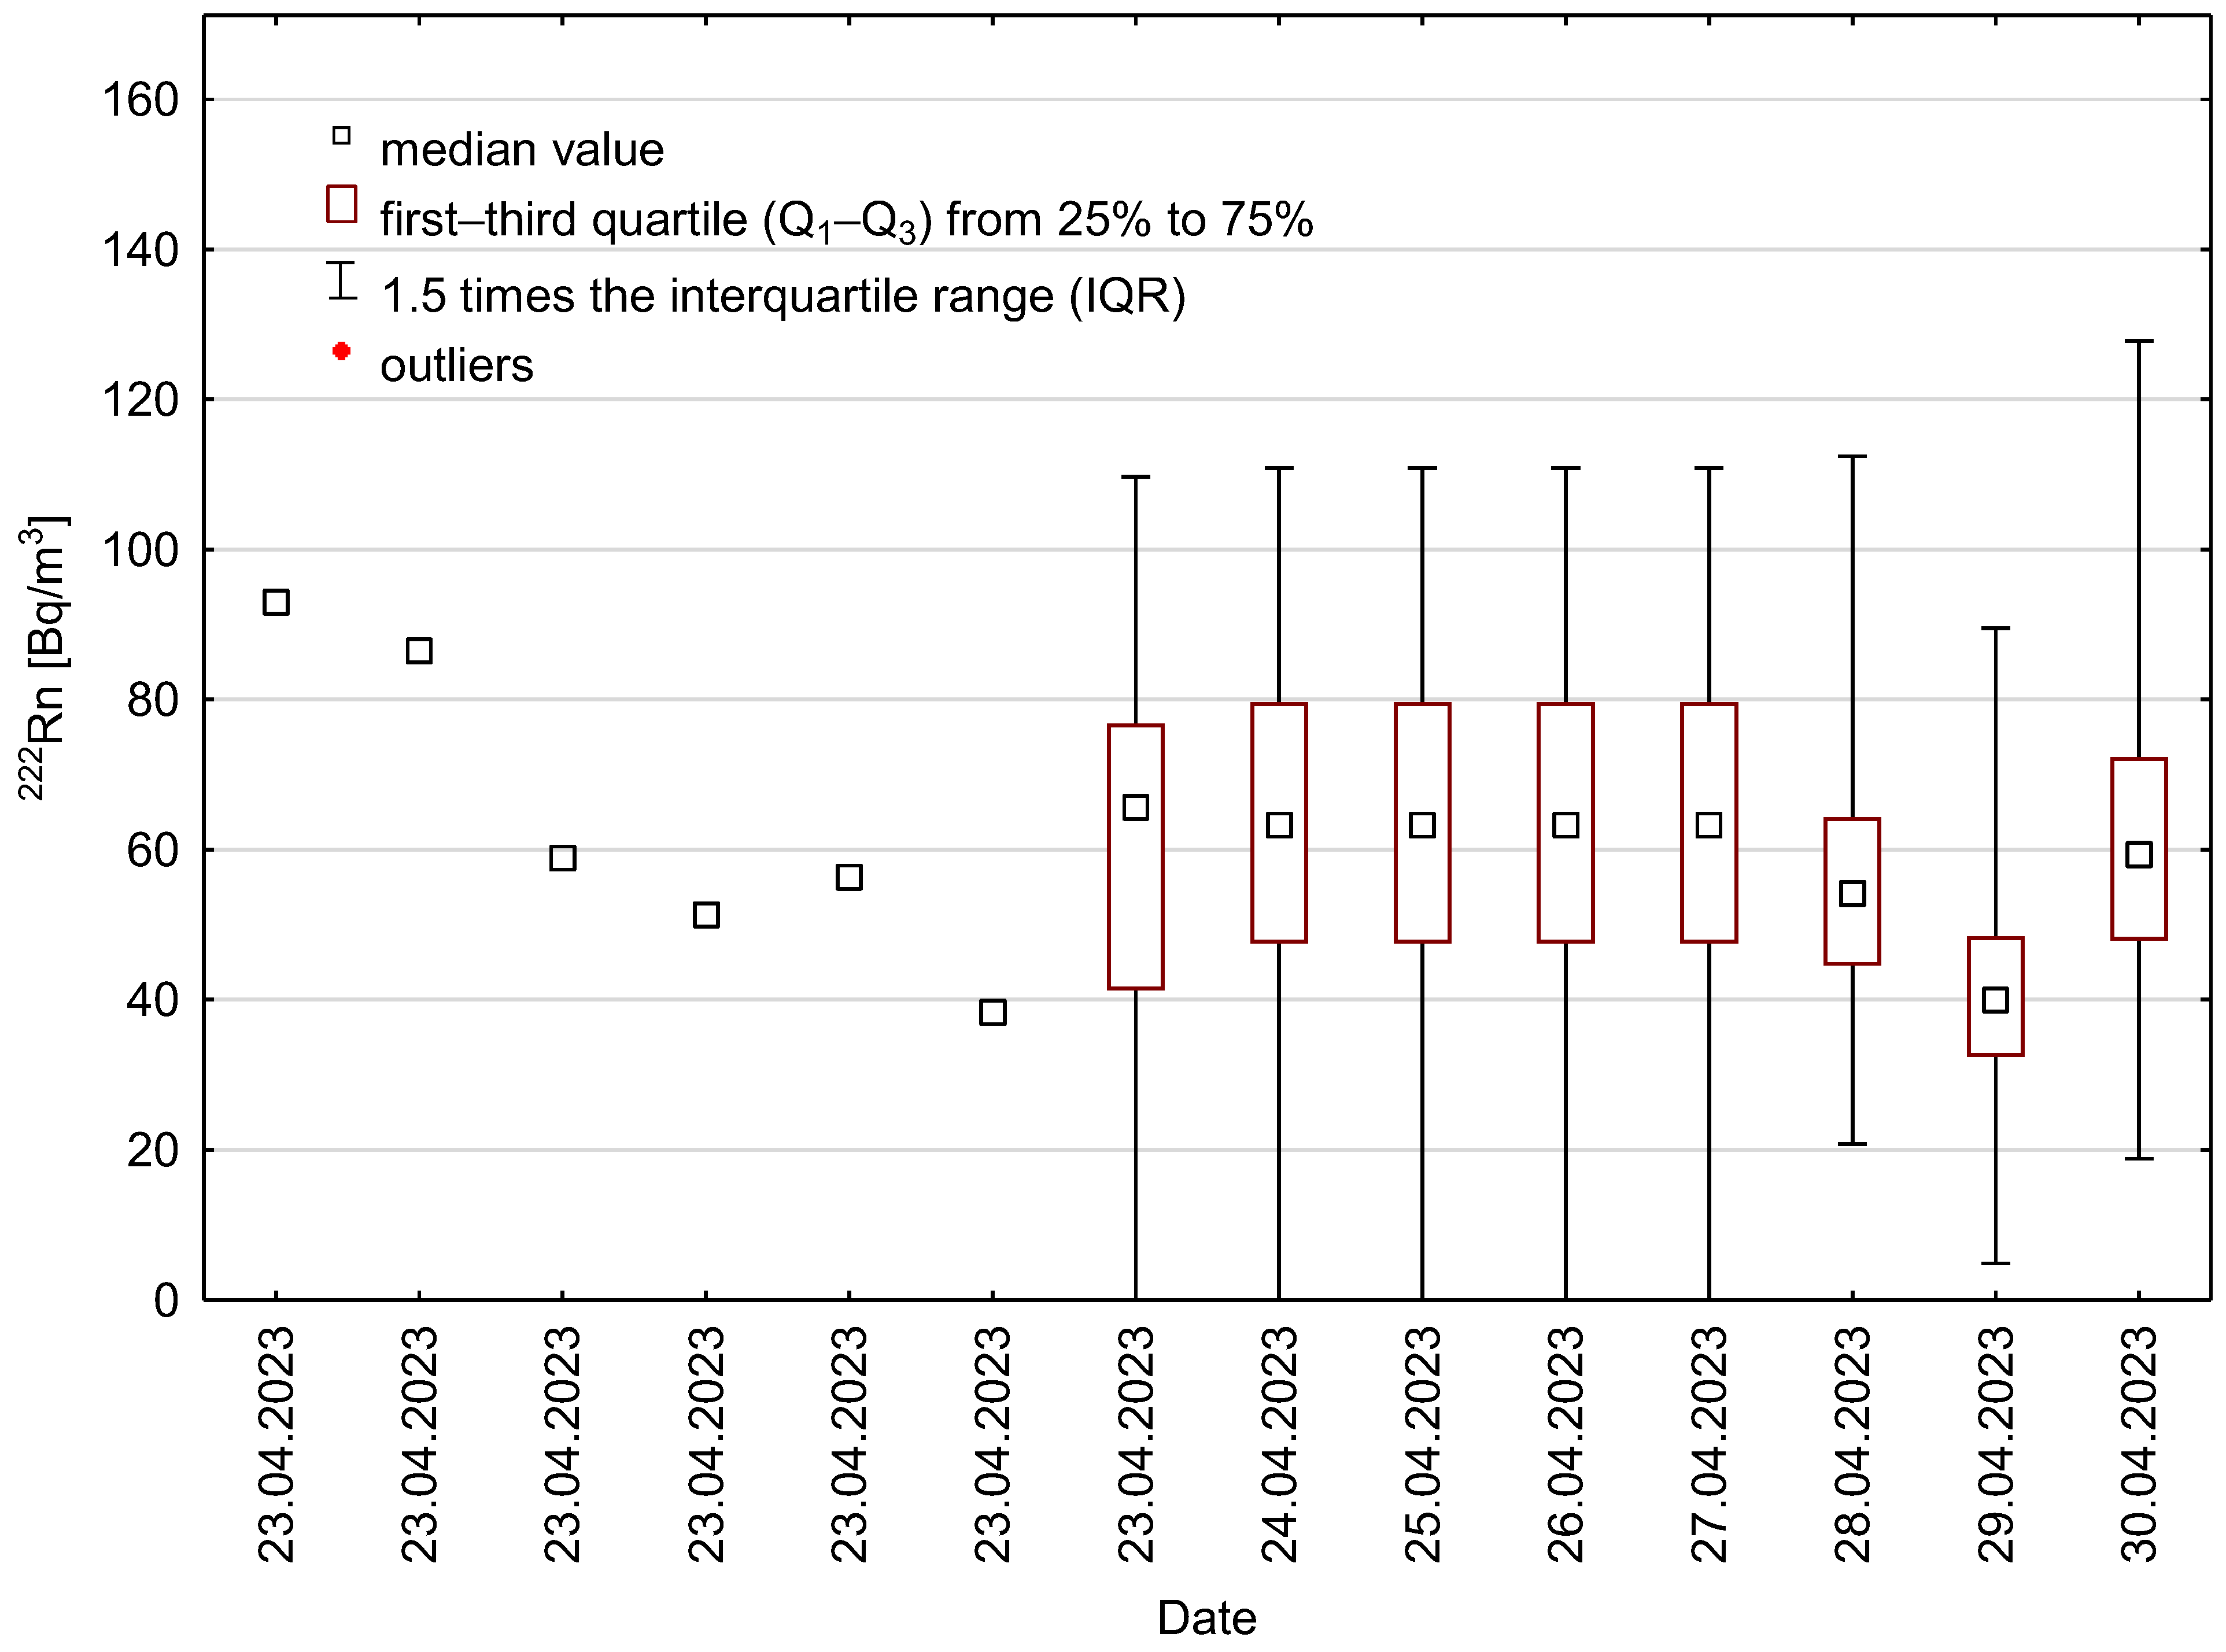
No observations classified as either outliers or extreme outliers were identified in March. In April, outliers reached values slightly below 80 Bq/m
3 and up to nearly 130 Bq/m
3, recorded on the 29 and 30 April, respectively (
Figure 3). In May, both outliers and extreme outliers were observed. Outliers were recorded throughout the measurement period, specifically on 8, 13, 17, 24, and 27 May (
Figure 4). On 8 May, outliers ranged slightly above 80 Bq/m
3; on 13 May, values exceeded 160 Bq/m
3; on 17 May, an outlier of just above 60 Bq/m
3 was noted; on 24 May, it was 120 Bq/m
3; and on 27 May, it was just below 100 Bq/m
3. Extreme outliers were recorded twice, on the 7th and 27th days of observation, with values exceeding 100 Bq/m
3 and nearly 140 Bq/m
3, respectively (
Figure 4).
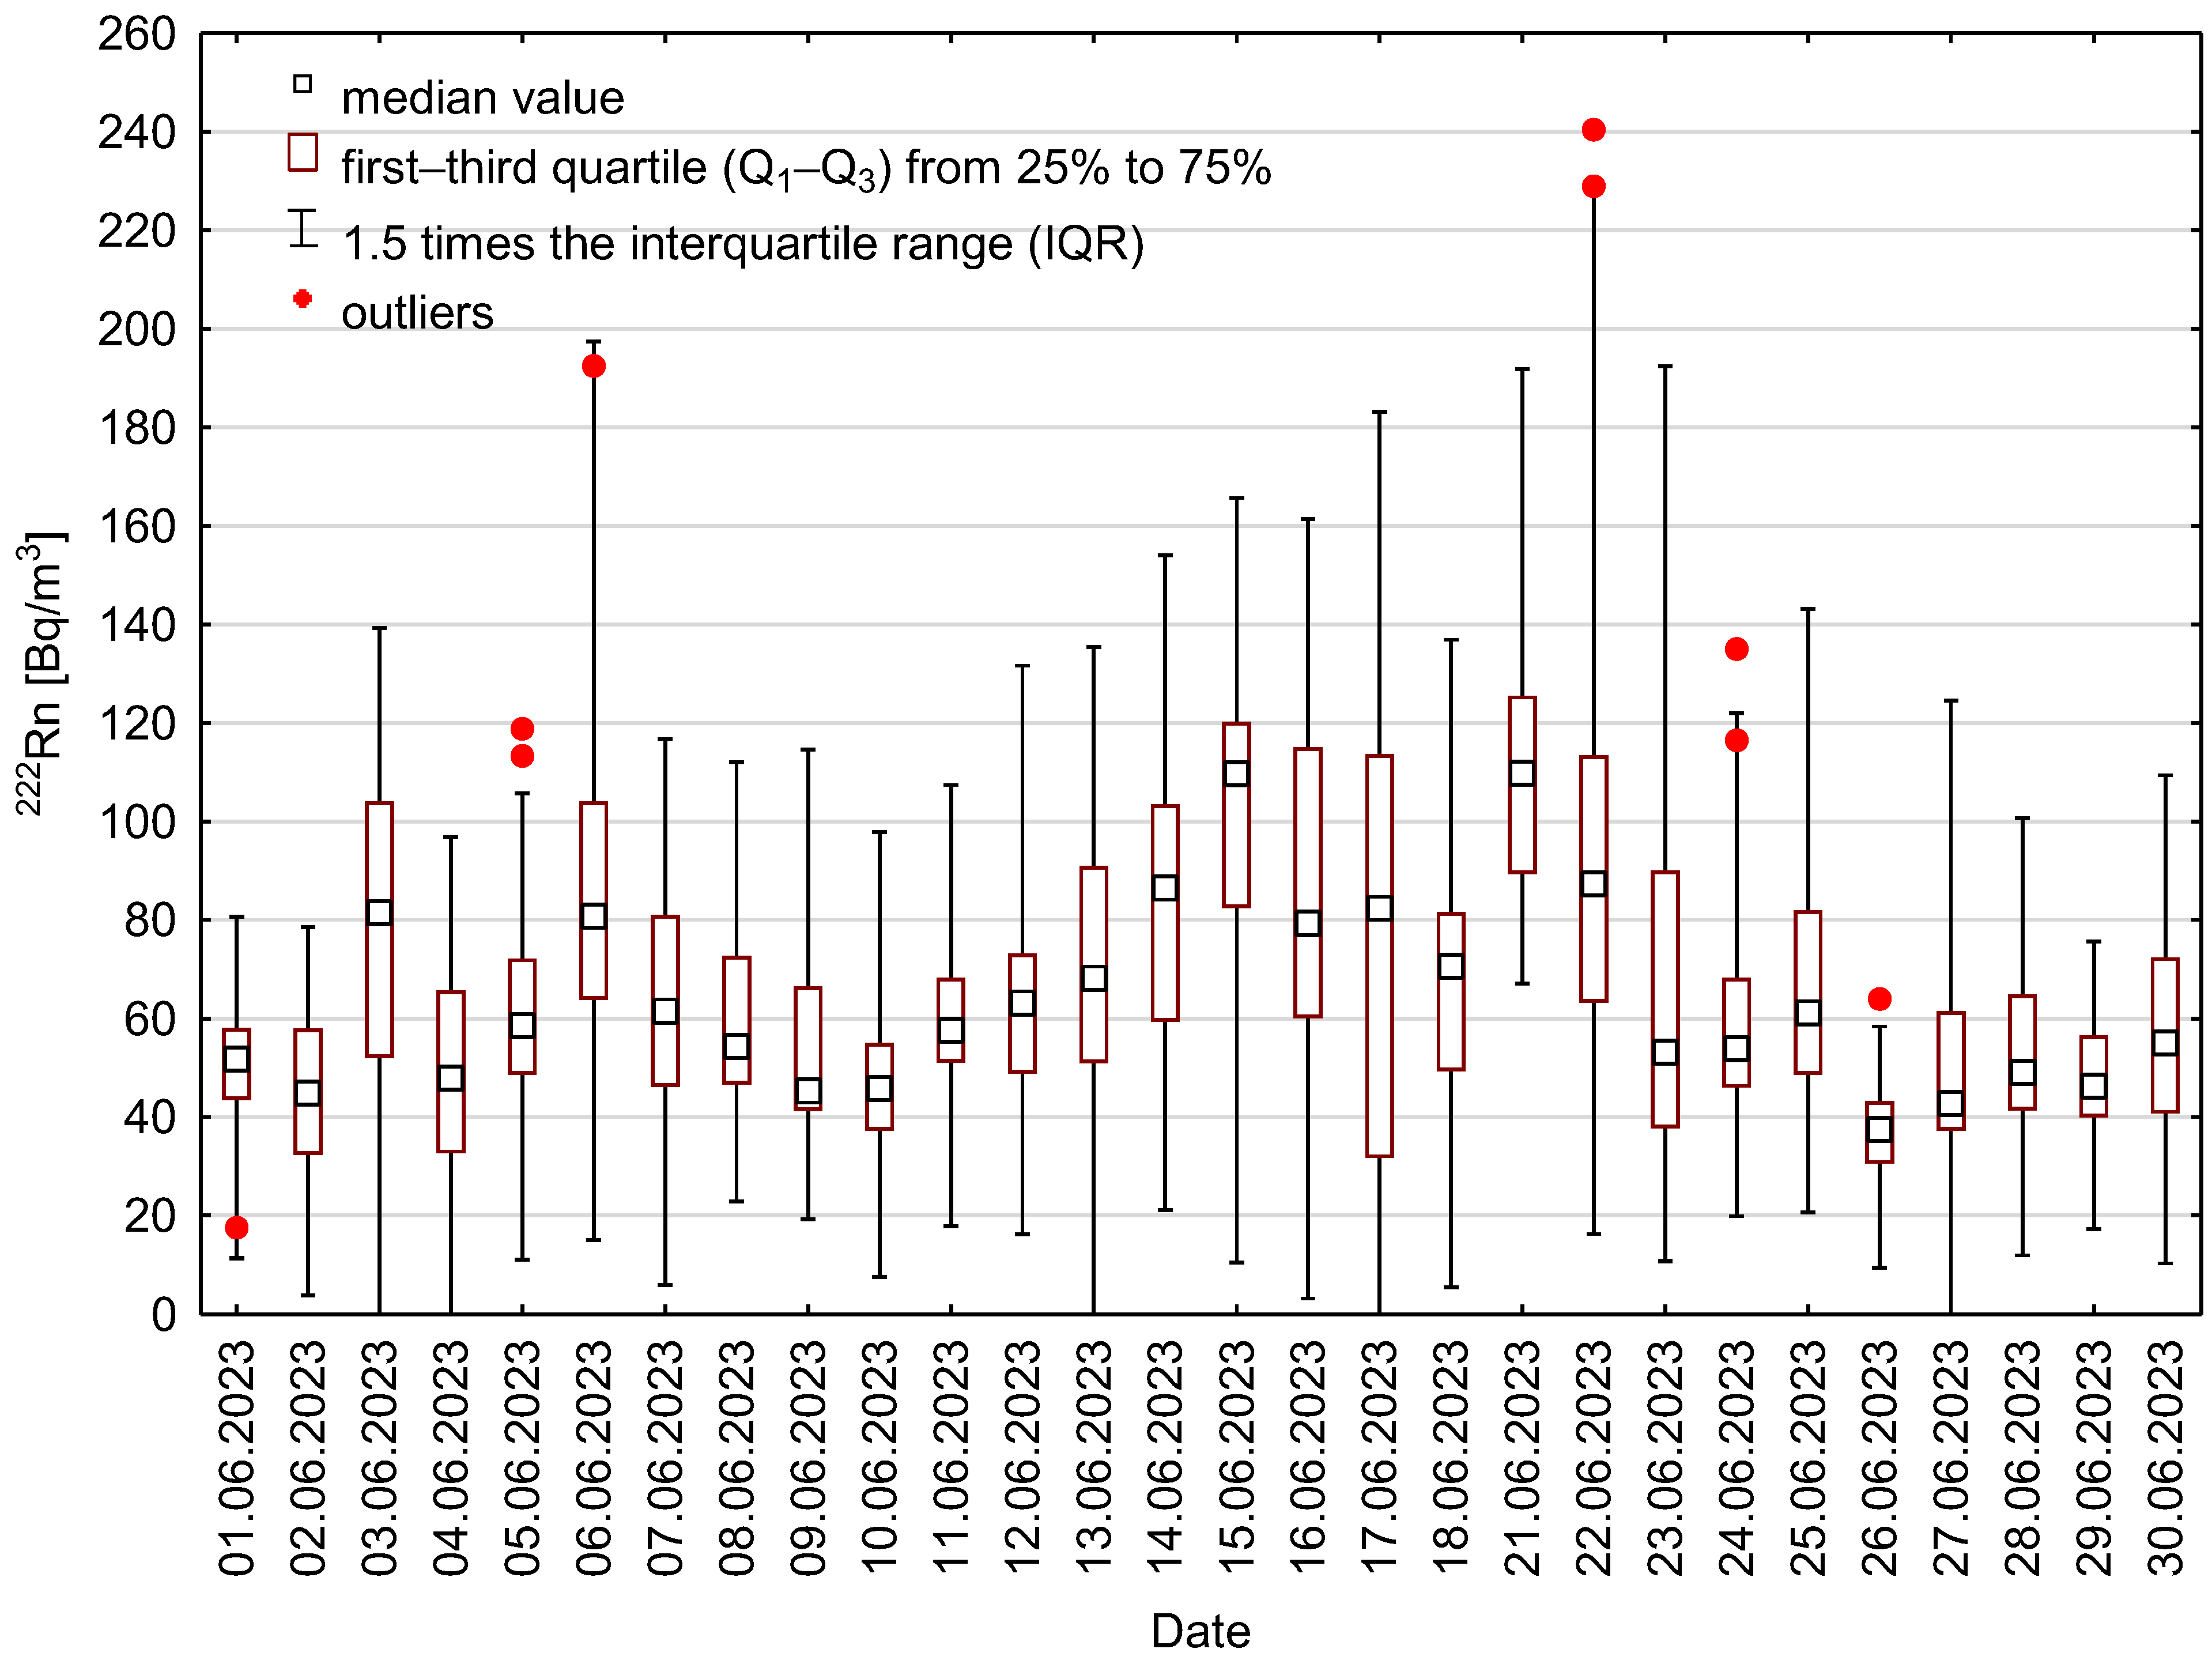
Outliers were also detected in June (
Figure 5). Their upper value range approached 120 Bq/m
3 on the 5th day, rose well above 180 Bq/m
3 on the 6th day, and was nearly 240 Bq/m
3 on the 22nd day, nearly 140 Bq/m
3 on the 24th day, and slightly above 60 Bq/m
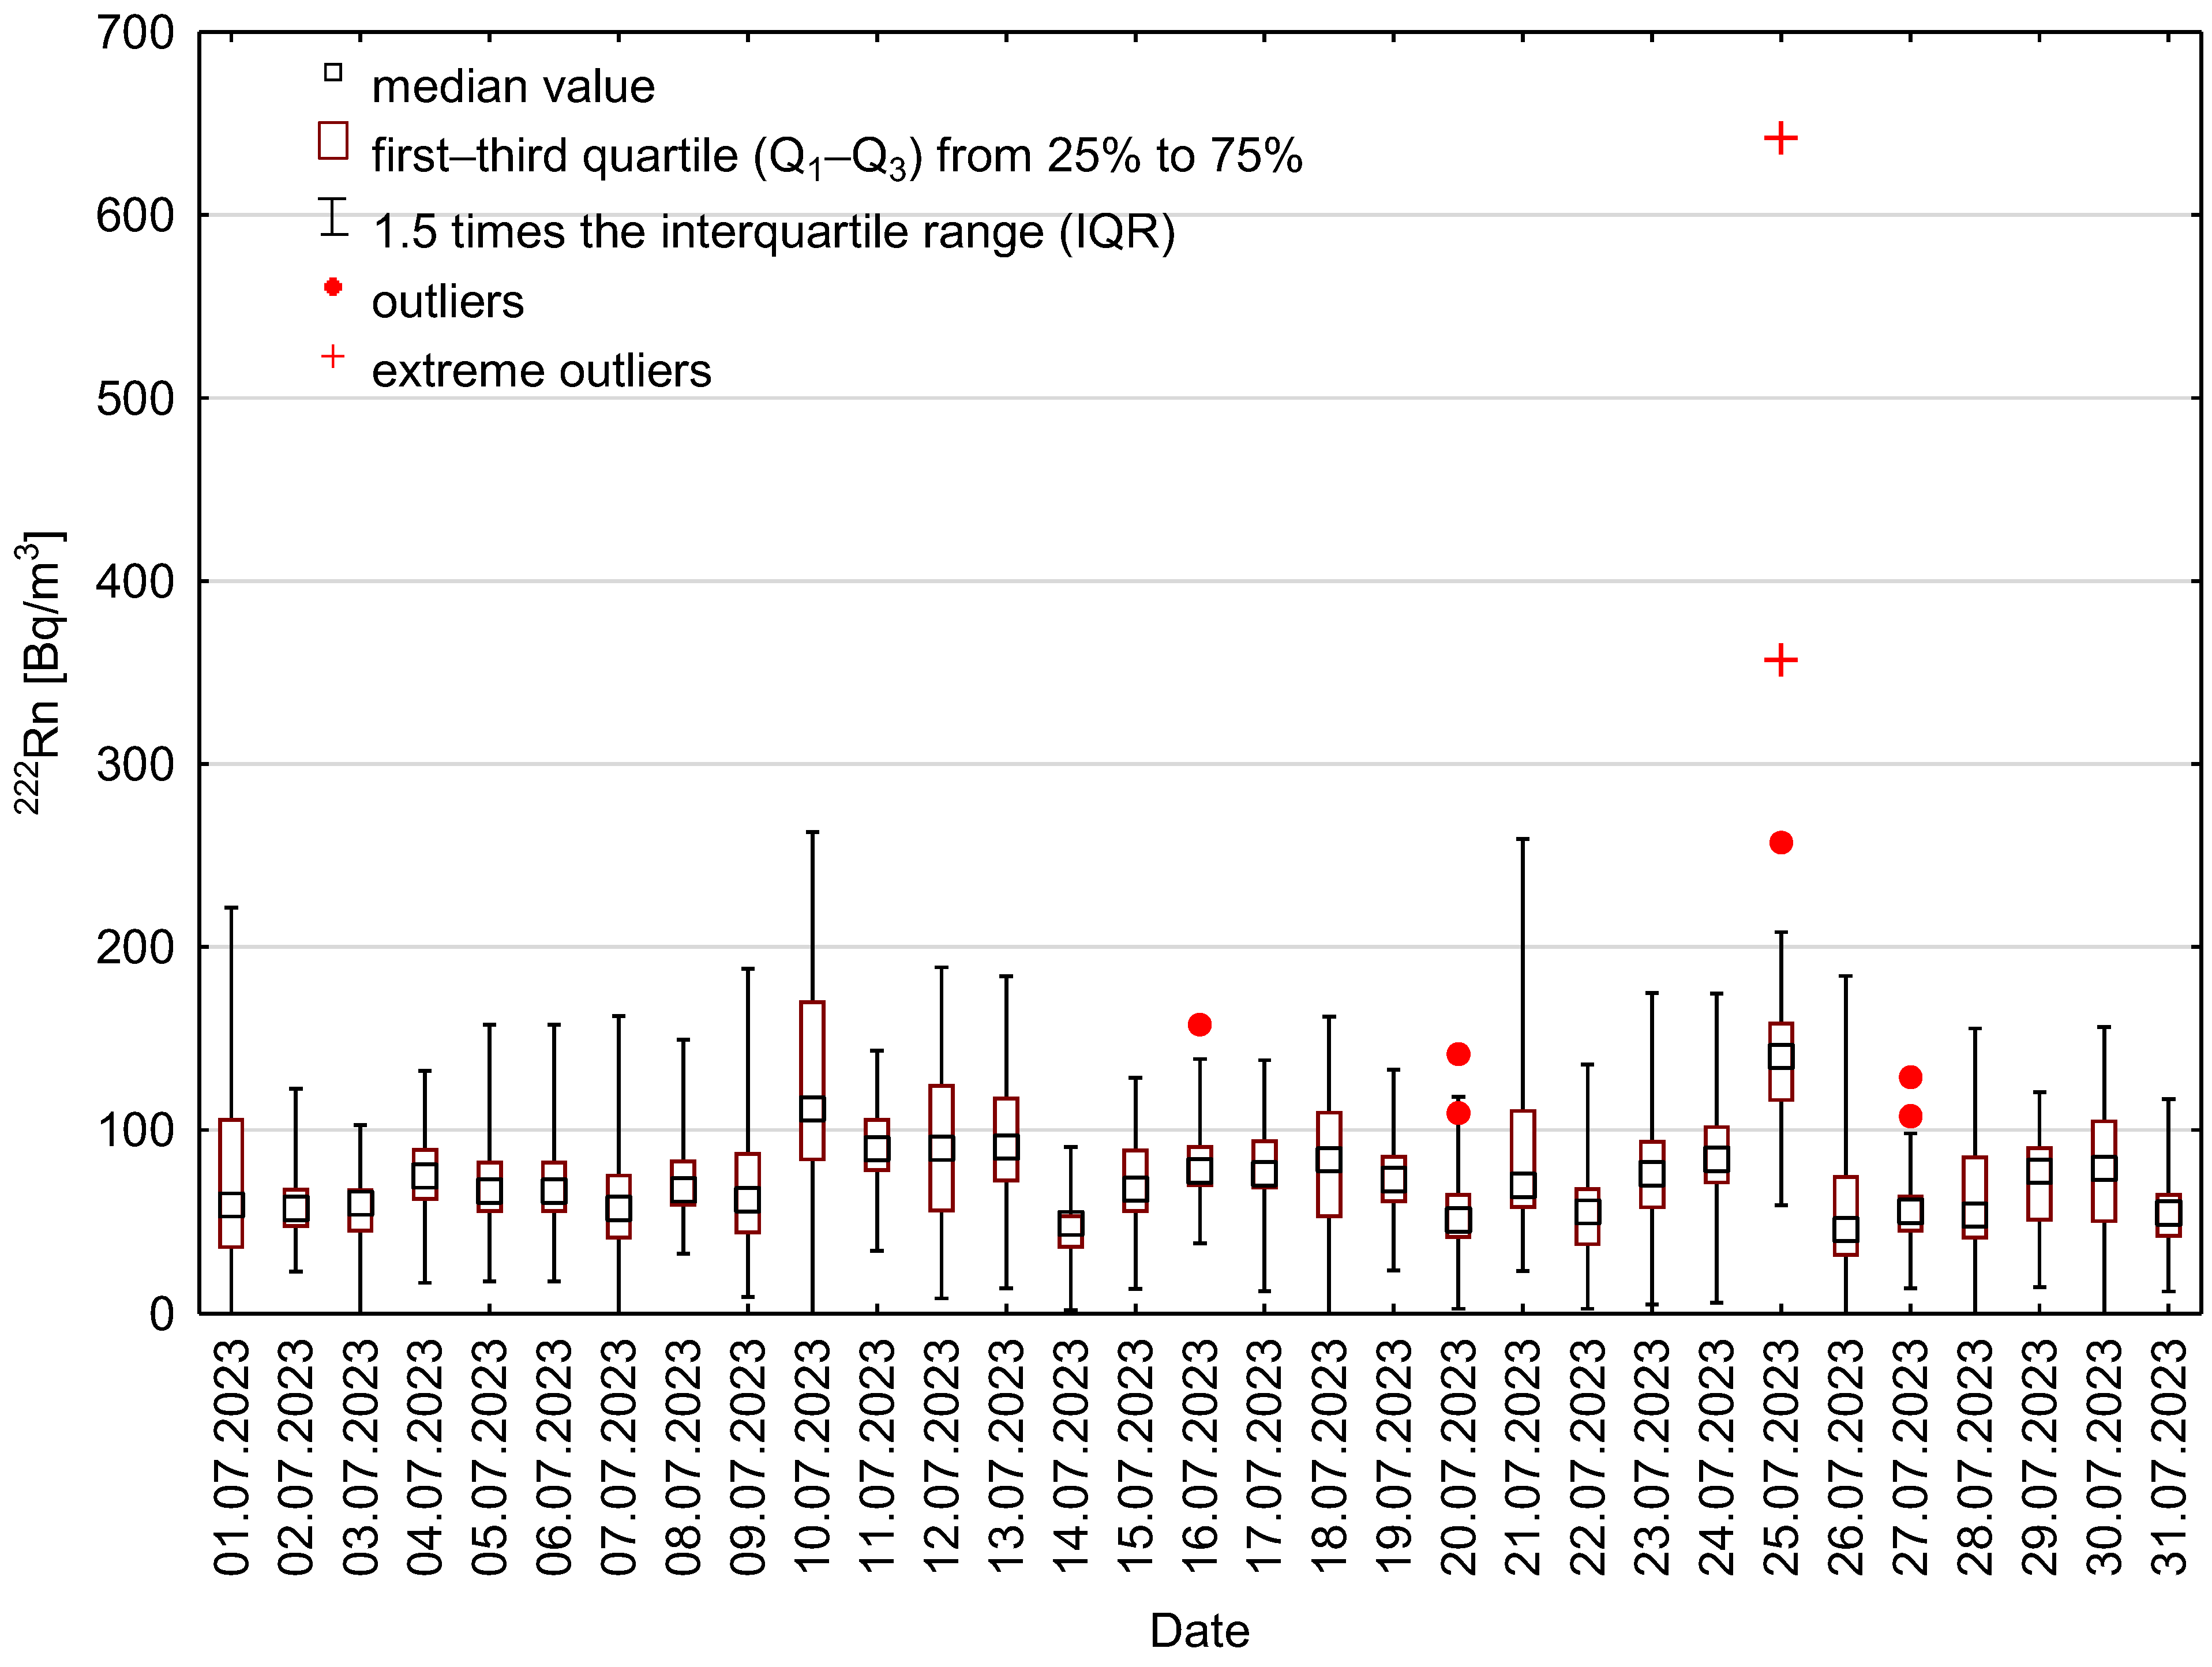
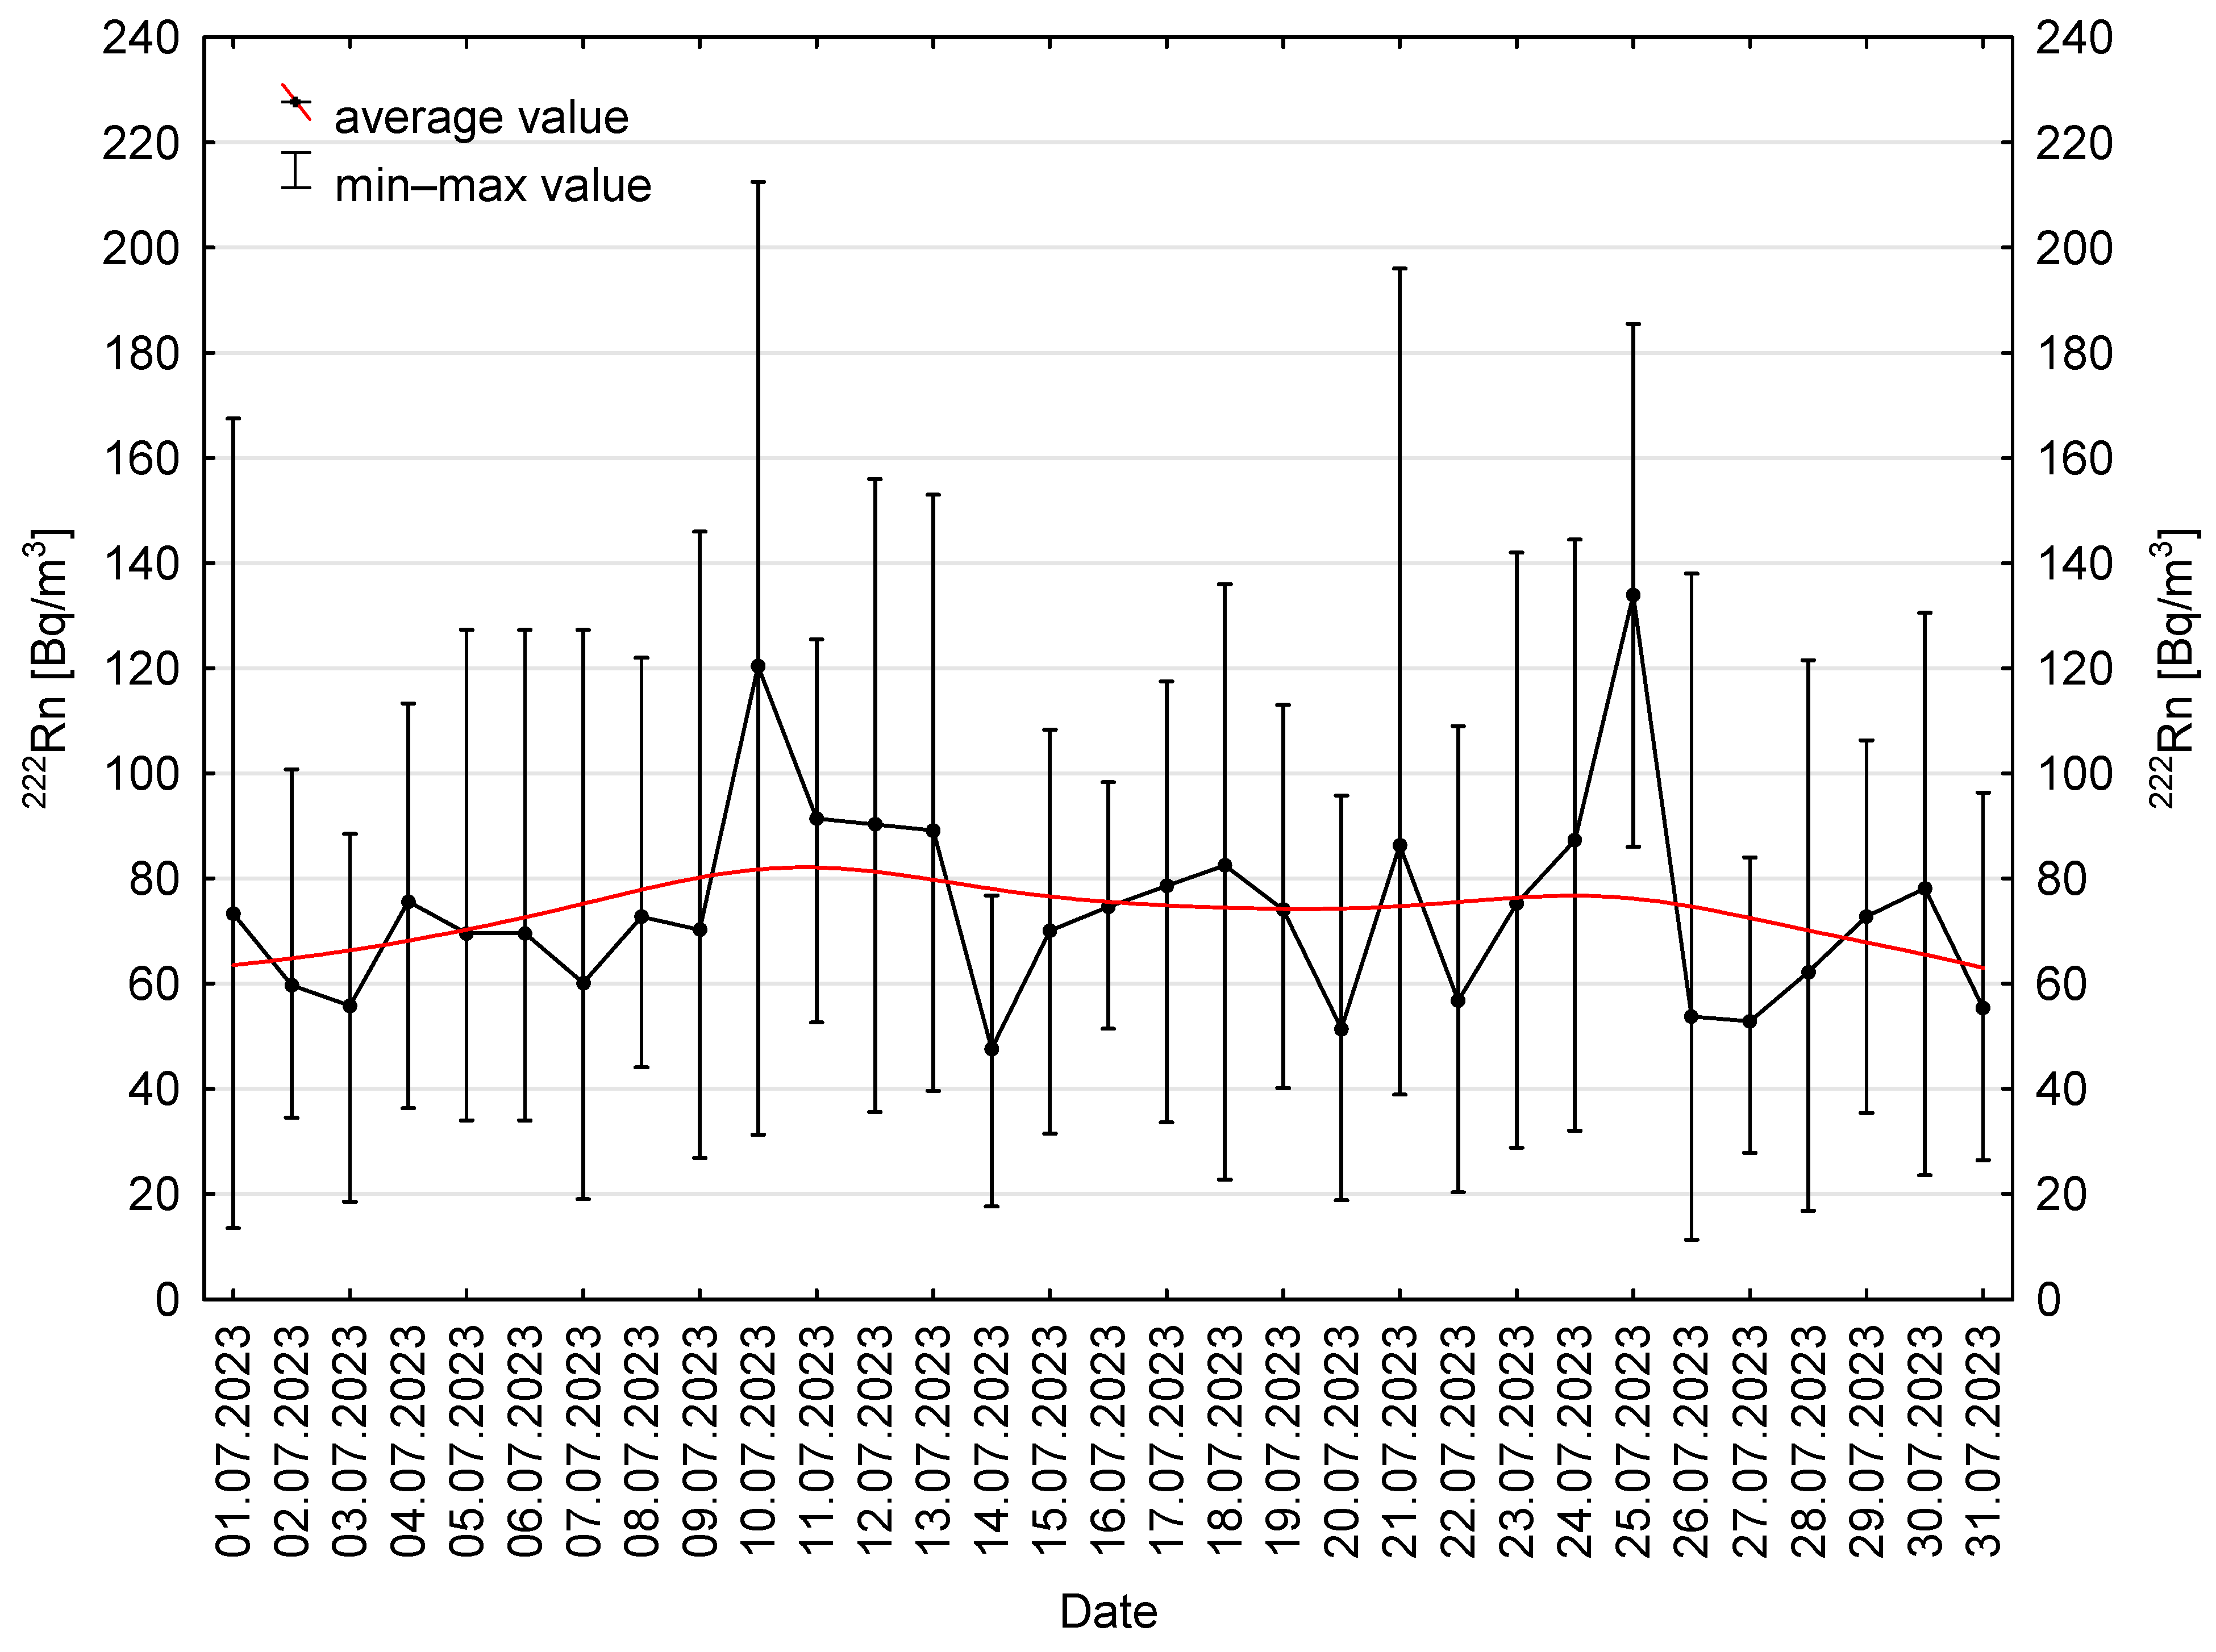
3 on the 26th day. Similarly, in July, sporadic outliers were observed during the measurement cycle (
Figure 6), occurring on the 16th, 20th, 25th, and 27th days. Additionally, extreme outliers were recorded on the 25th day of July, with an IQR spanning approximately from 350 Bq/m
3 to over 600 Bq/m
3 (
Figure 6).
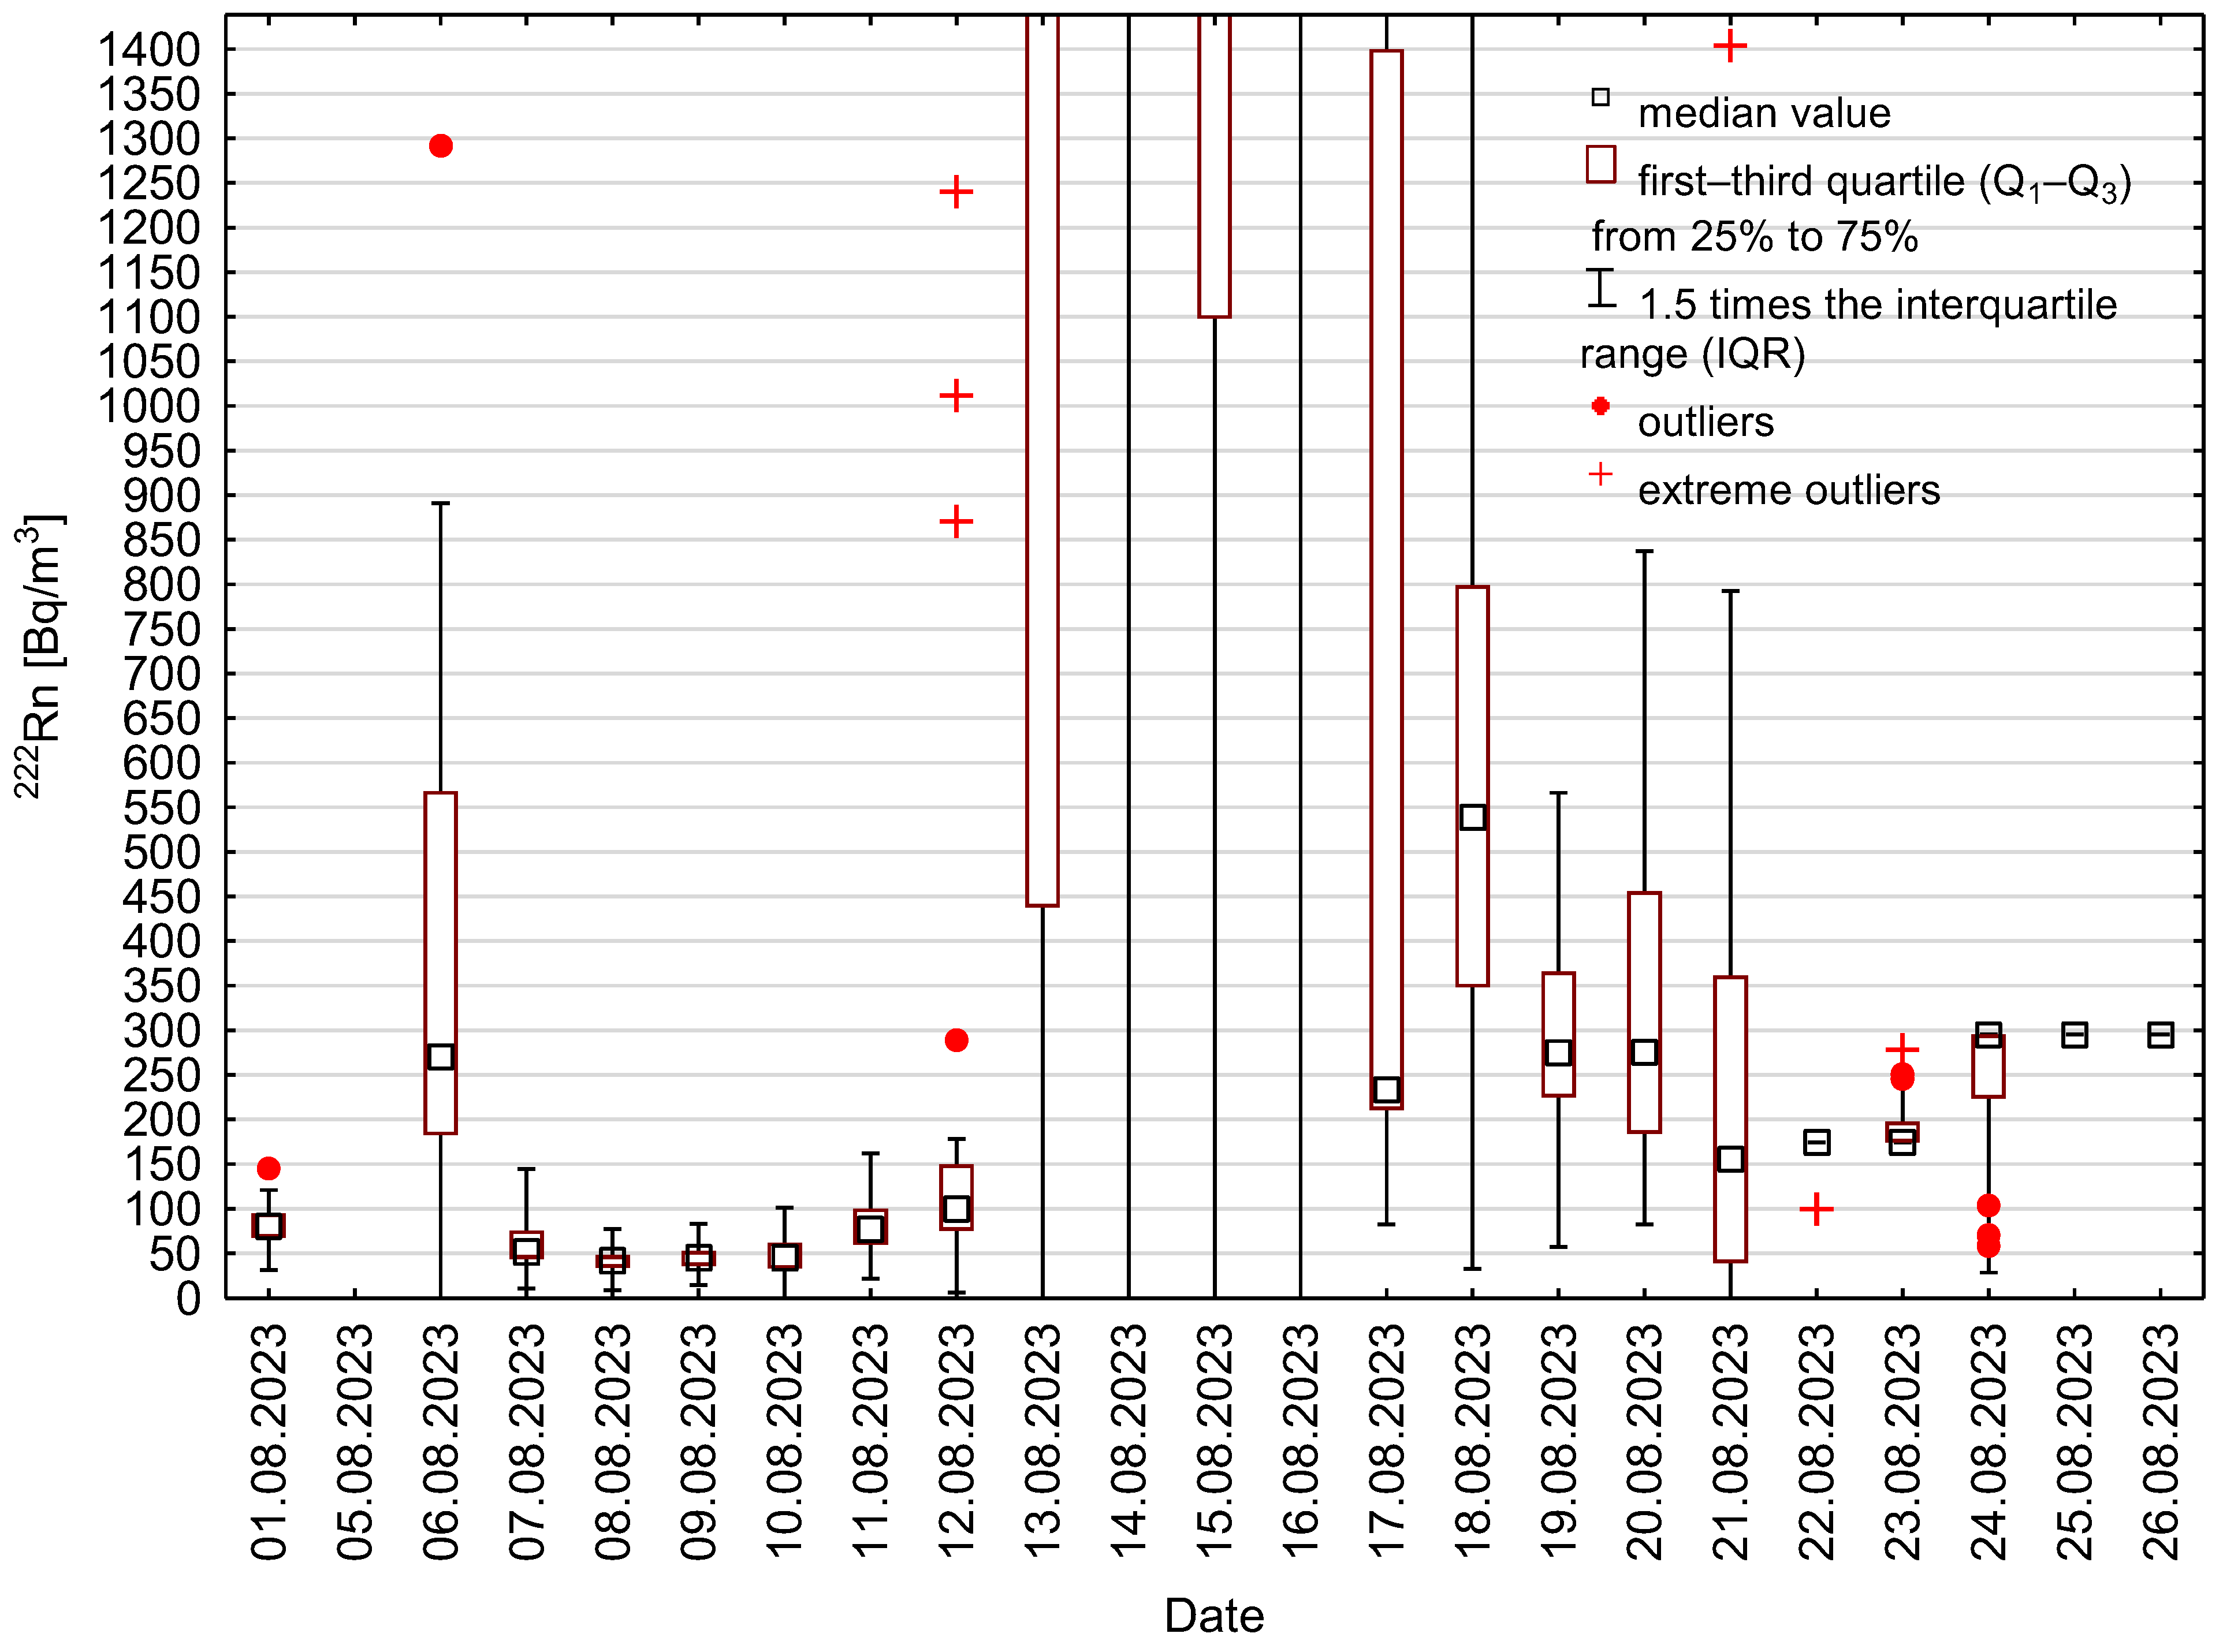
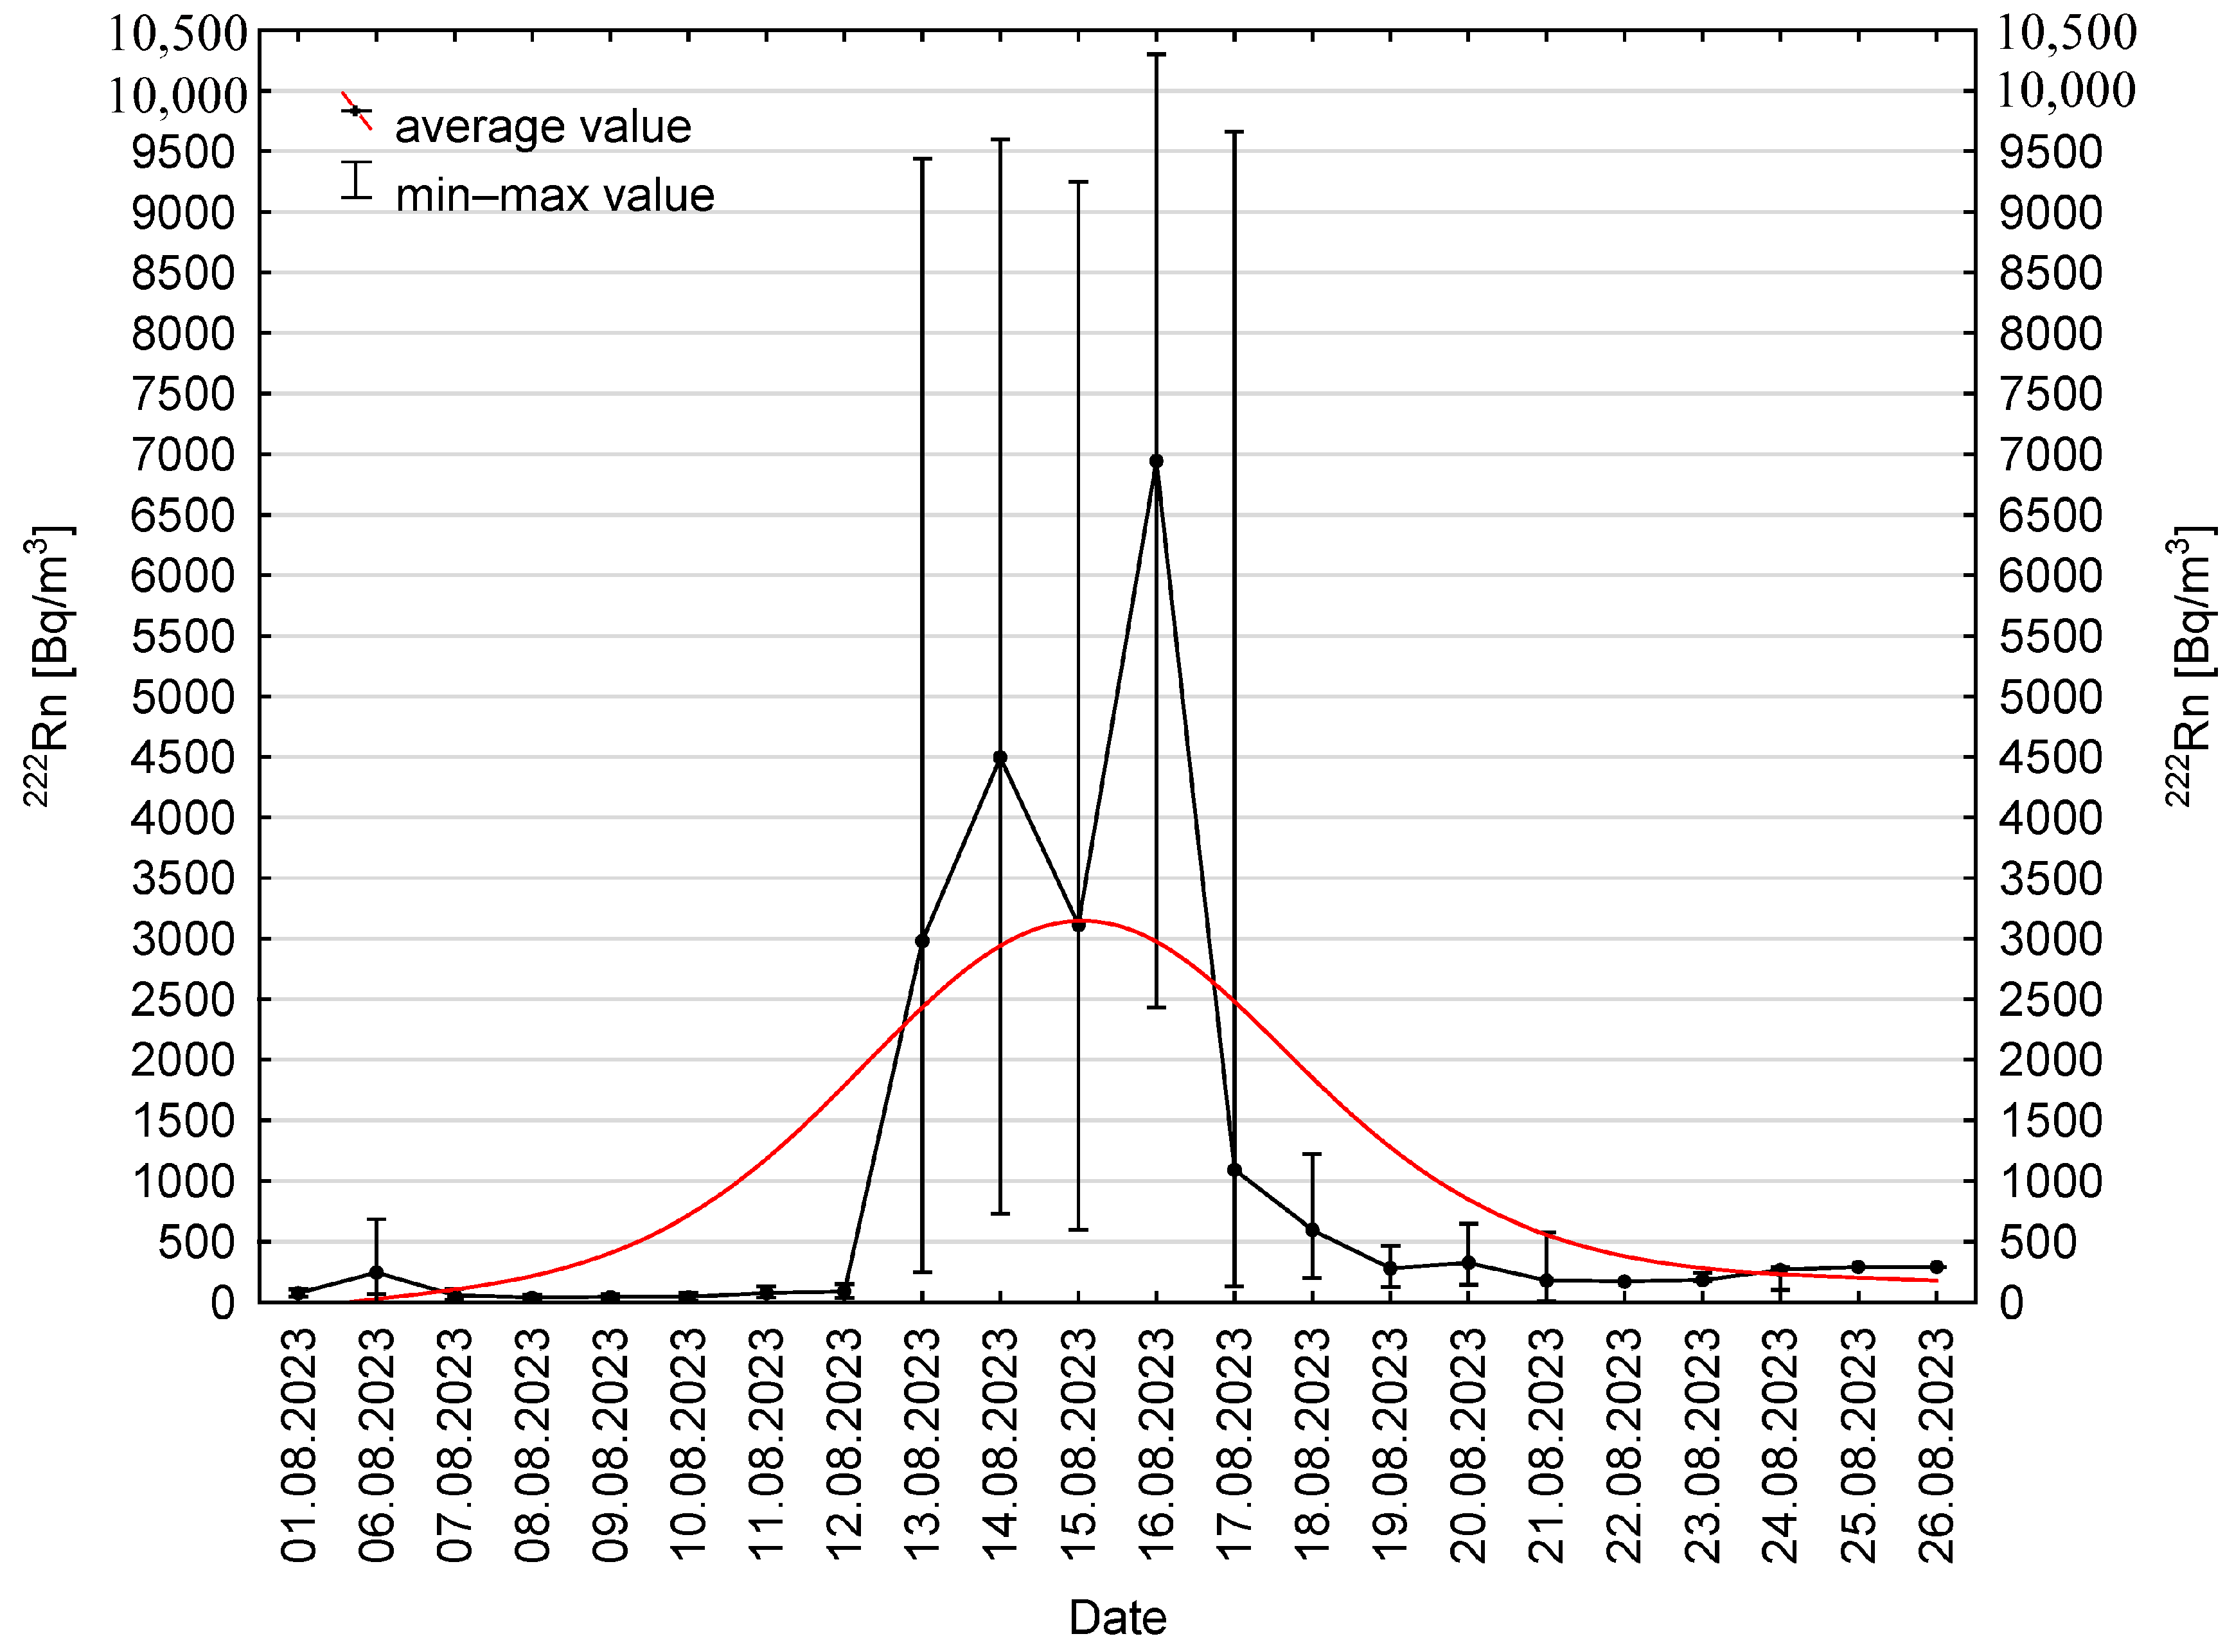
In August, data exhibited substantial dispersion, with both outliers and extreme outliers observed (
Figure 7). The majority of observations from both groups were concentrated within the range of approximately 50 to nearly 1400 Bq/m
3. Values recorded between 13 and 17 August were more closely clustered around the mean, which, during this seven-day period, reached its highest value of 171,792 Bq/m
3, while the median was 3012 Bq/m
3. This pattern confirms the presence of a considerable number of individual observations with exceptionally high radon activity concentration values.
Explanations to
Figure 3,
Figure 4,
Figure 5,
Figure 6 and
Figure 7: The range of non-outlier data is defined as the interval from Q
1 − 1.5 × IQR to Q
3 + 1.5 × IQR, where Q
1 and Q
3 denote the first and third quartiles, respectively, and IQR represents the interquartile range. The range of data classified as outliers is defined as the interval from Q
1 − 1.6 × IQR to Q
3 + 1.6 × IQR. Extreme outliers were identified as those lying outside the range from Q
1 − 3 × IQR to Q
3 + 3 × IQR. The lower threshold for non-outlier observations, calculated using Tukey’s rule (Q
1 − 1.5 × IQR), yielded a negative value. Given that the variable represents the radon activity concentration and cannot assume negative values, the data were treated as lower bounded. Accordingly, the lower limit was set to 0. Negative values were excluded from the analysis as physically non-existent. For April and August, only selected ranges of outliers and extreme outliers were presented.
Identified outliers and extreme outliers were excluded from subsequent analyses concerning the variability characteristics of radon activity concentration over time. These values exhibited considerable dispersion around the mean and caused strong to very strong right skewness in the distribution. The decision to exclude them from further analysis was based on the skewness measure of the distribution. To reduce distortion of central tendency measures and ensure the validity of subsequent inferences, outliers and extreme outliers identified in July and August were removed. The exclusion of these data points improved the data distribution. The skewness values changed from 4.6 to 0.9 in July and from 8.2 to 2.8 in August. This also positively affected the dispersion of data relative to the average value, as reflected by decreased standard deviation values. It can be inferred that the average value, particularly in August, became closer to the median, indicating reduced asymmetry of the data distribution and increased robustness against outlying observations (
Table 1).
In March, the average radon activity concentration was 51.4 Bq/m
3. In April, the mean concentration increased to 59.3 Bq/m
3, followed by 65.9 Bq/m
3 in May. June recorded an average activity concentration of 65.1 Bq/m
3, July reached 73.8 Bq/m
3, and August showed the highest monthly average at 1003.6 Bq/m
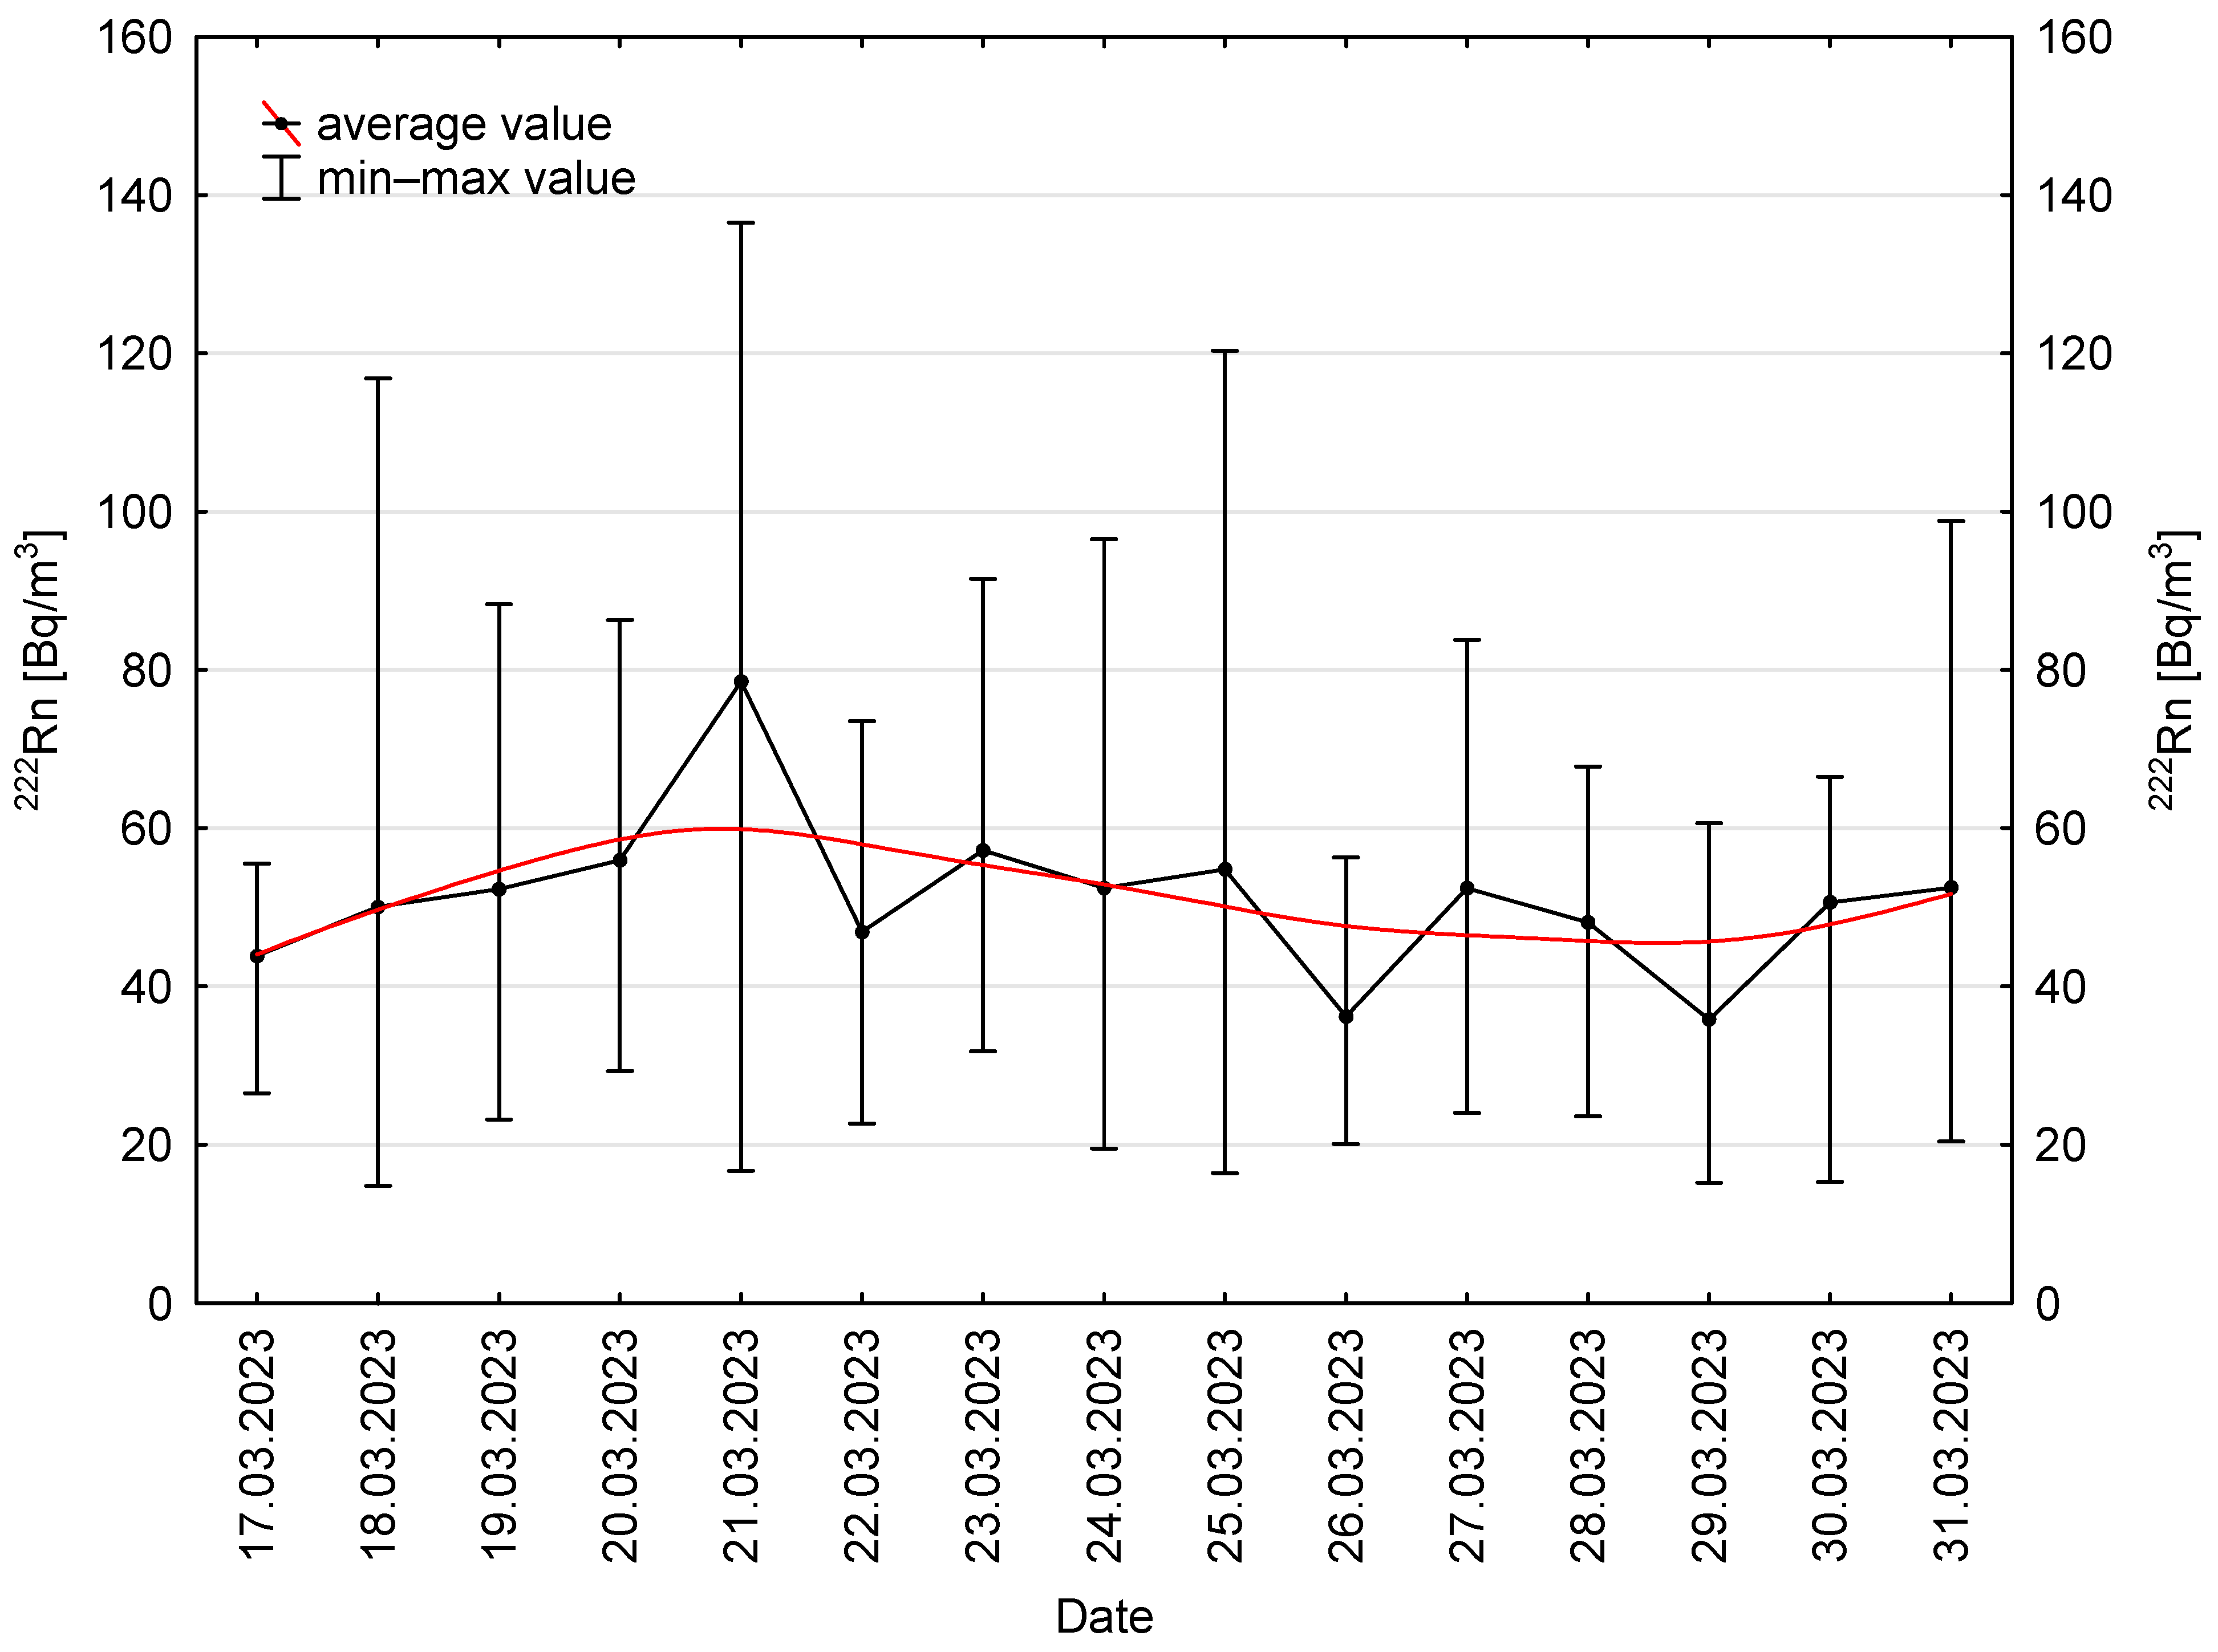
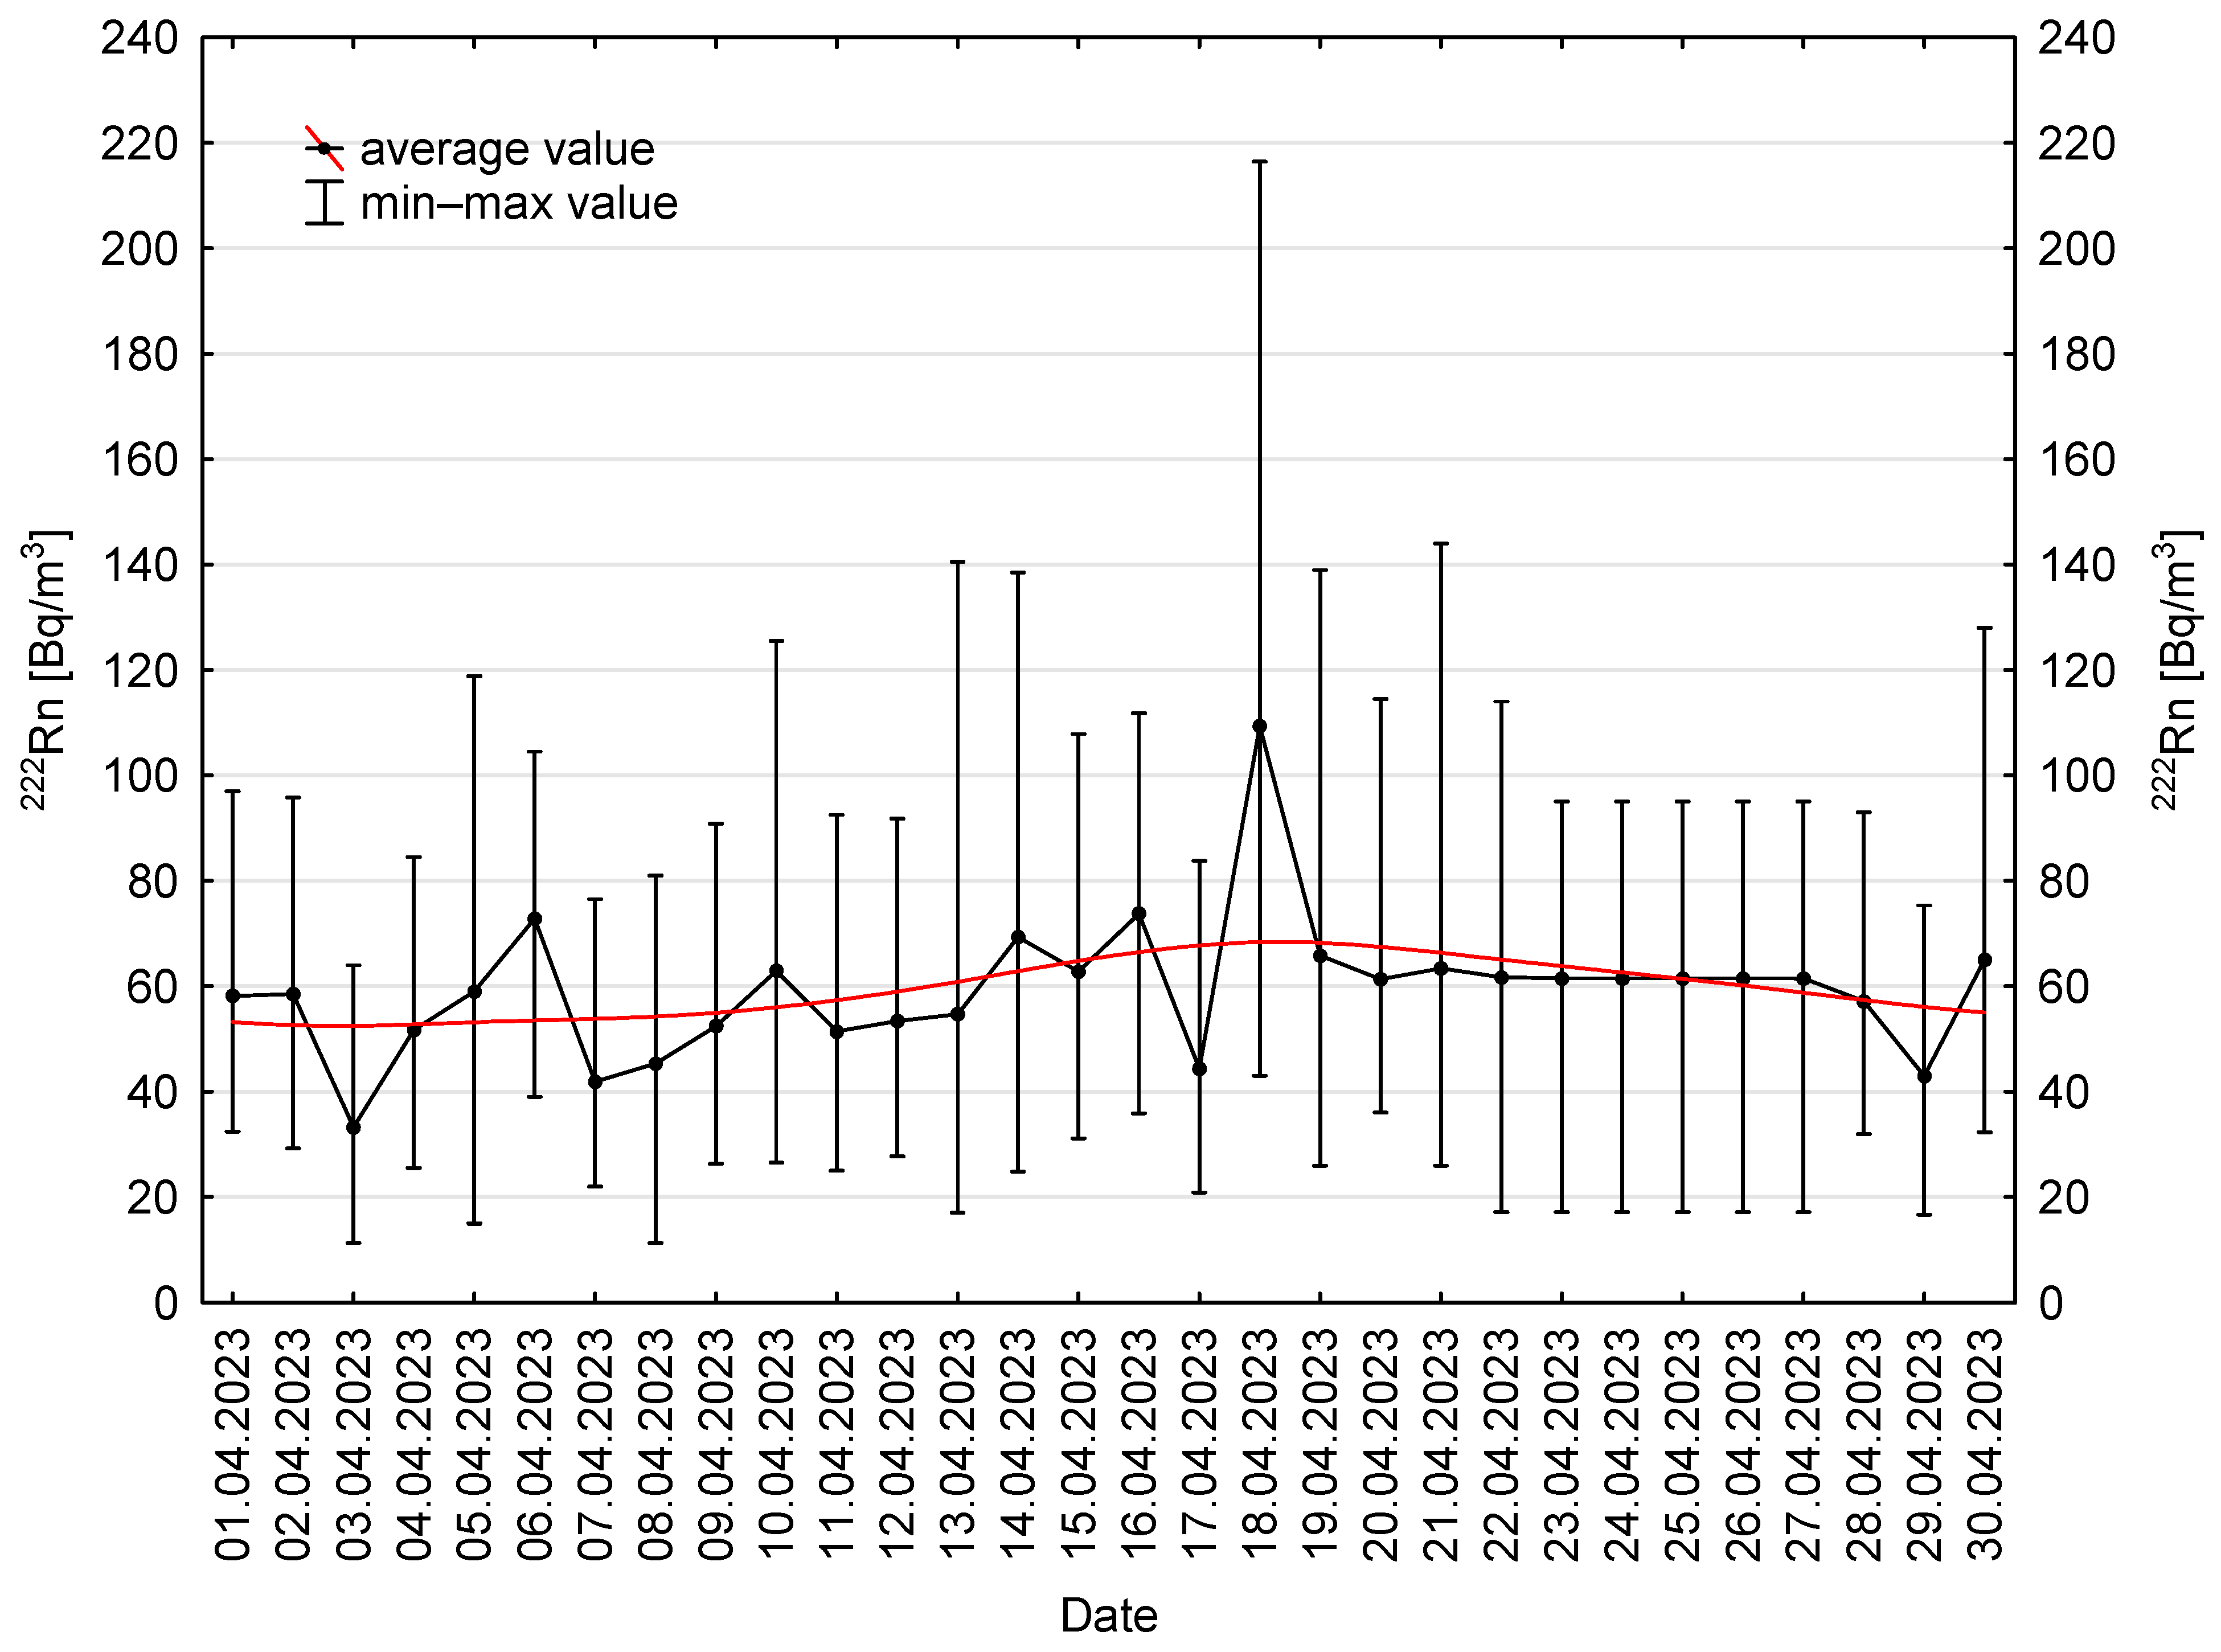
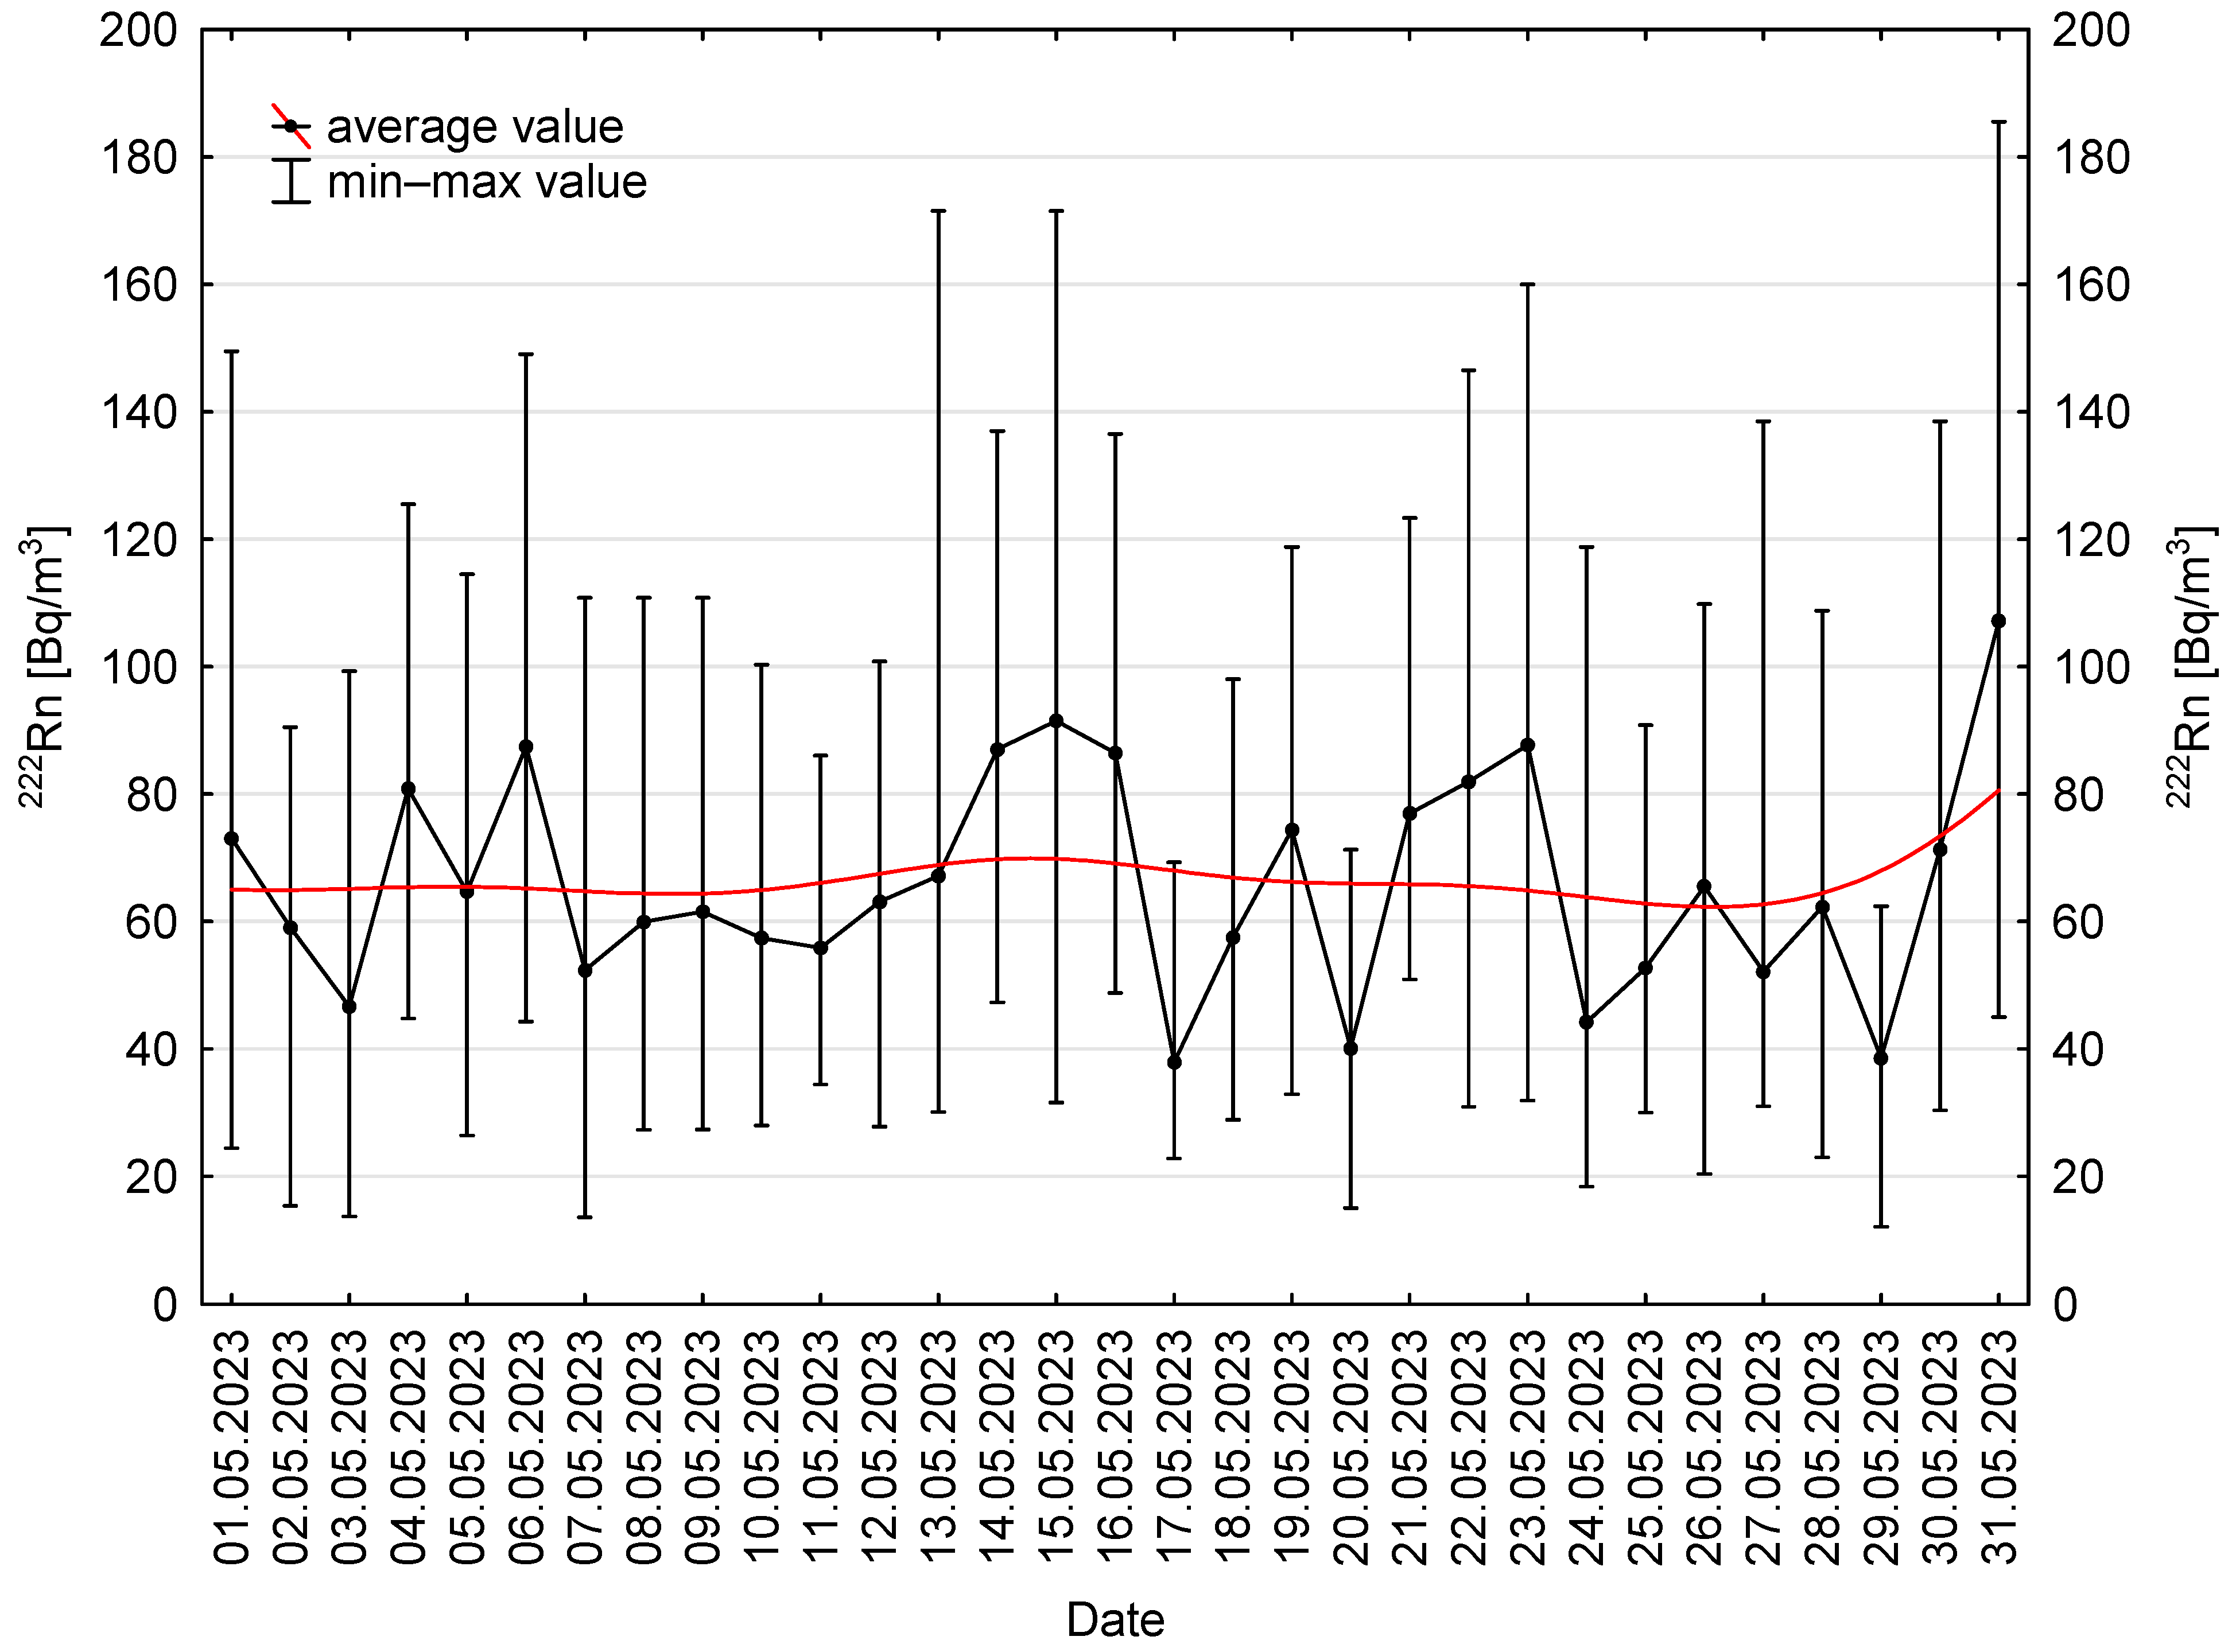
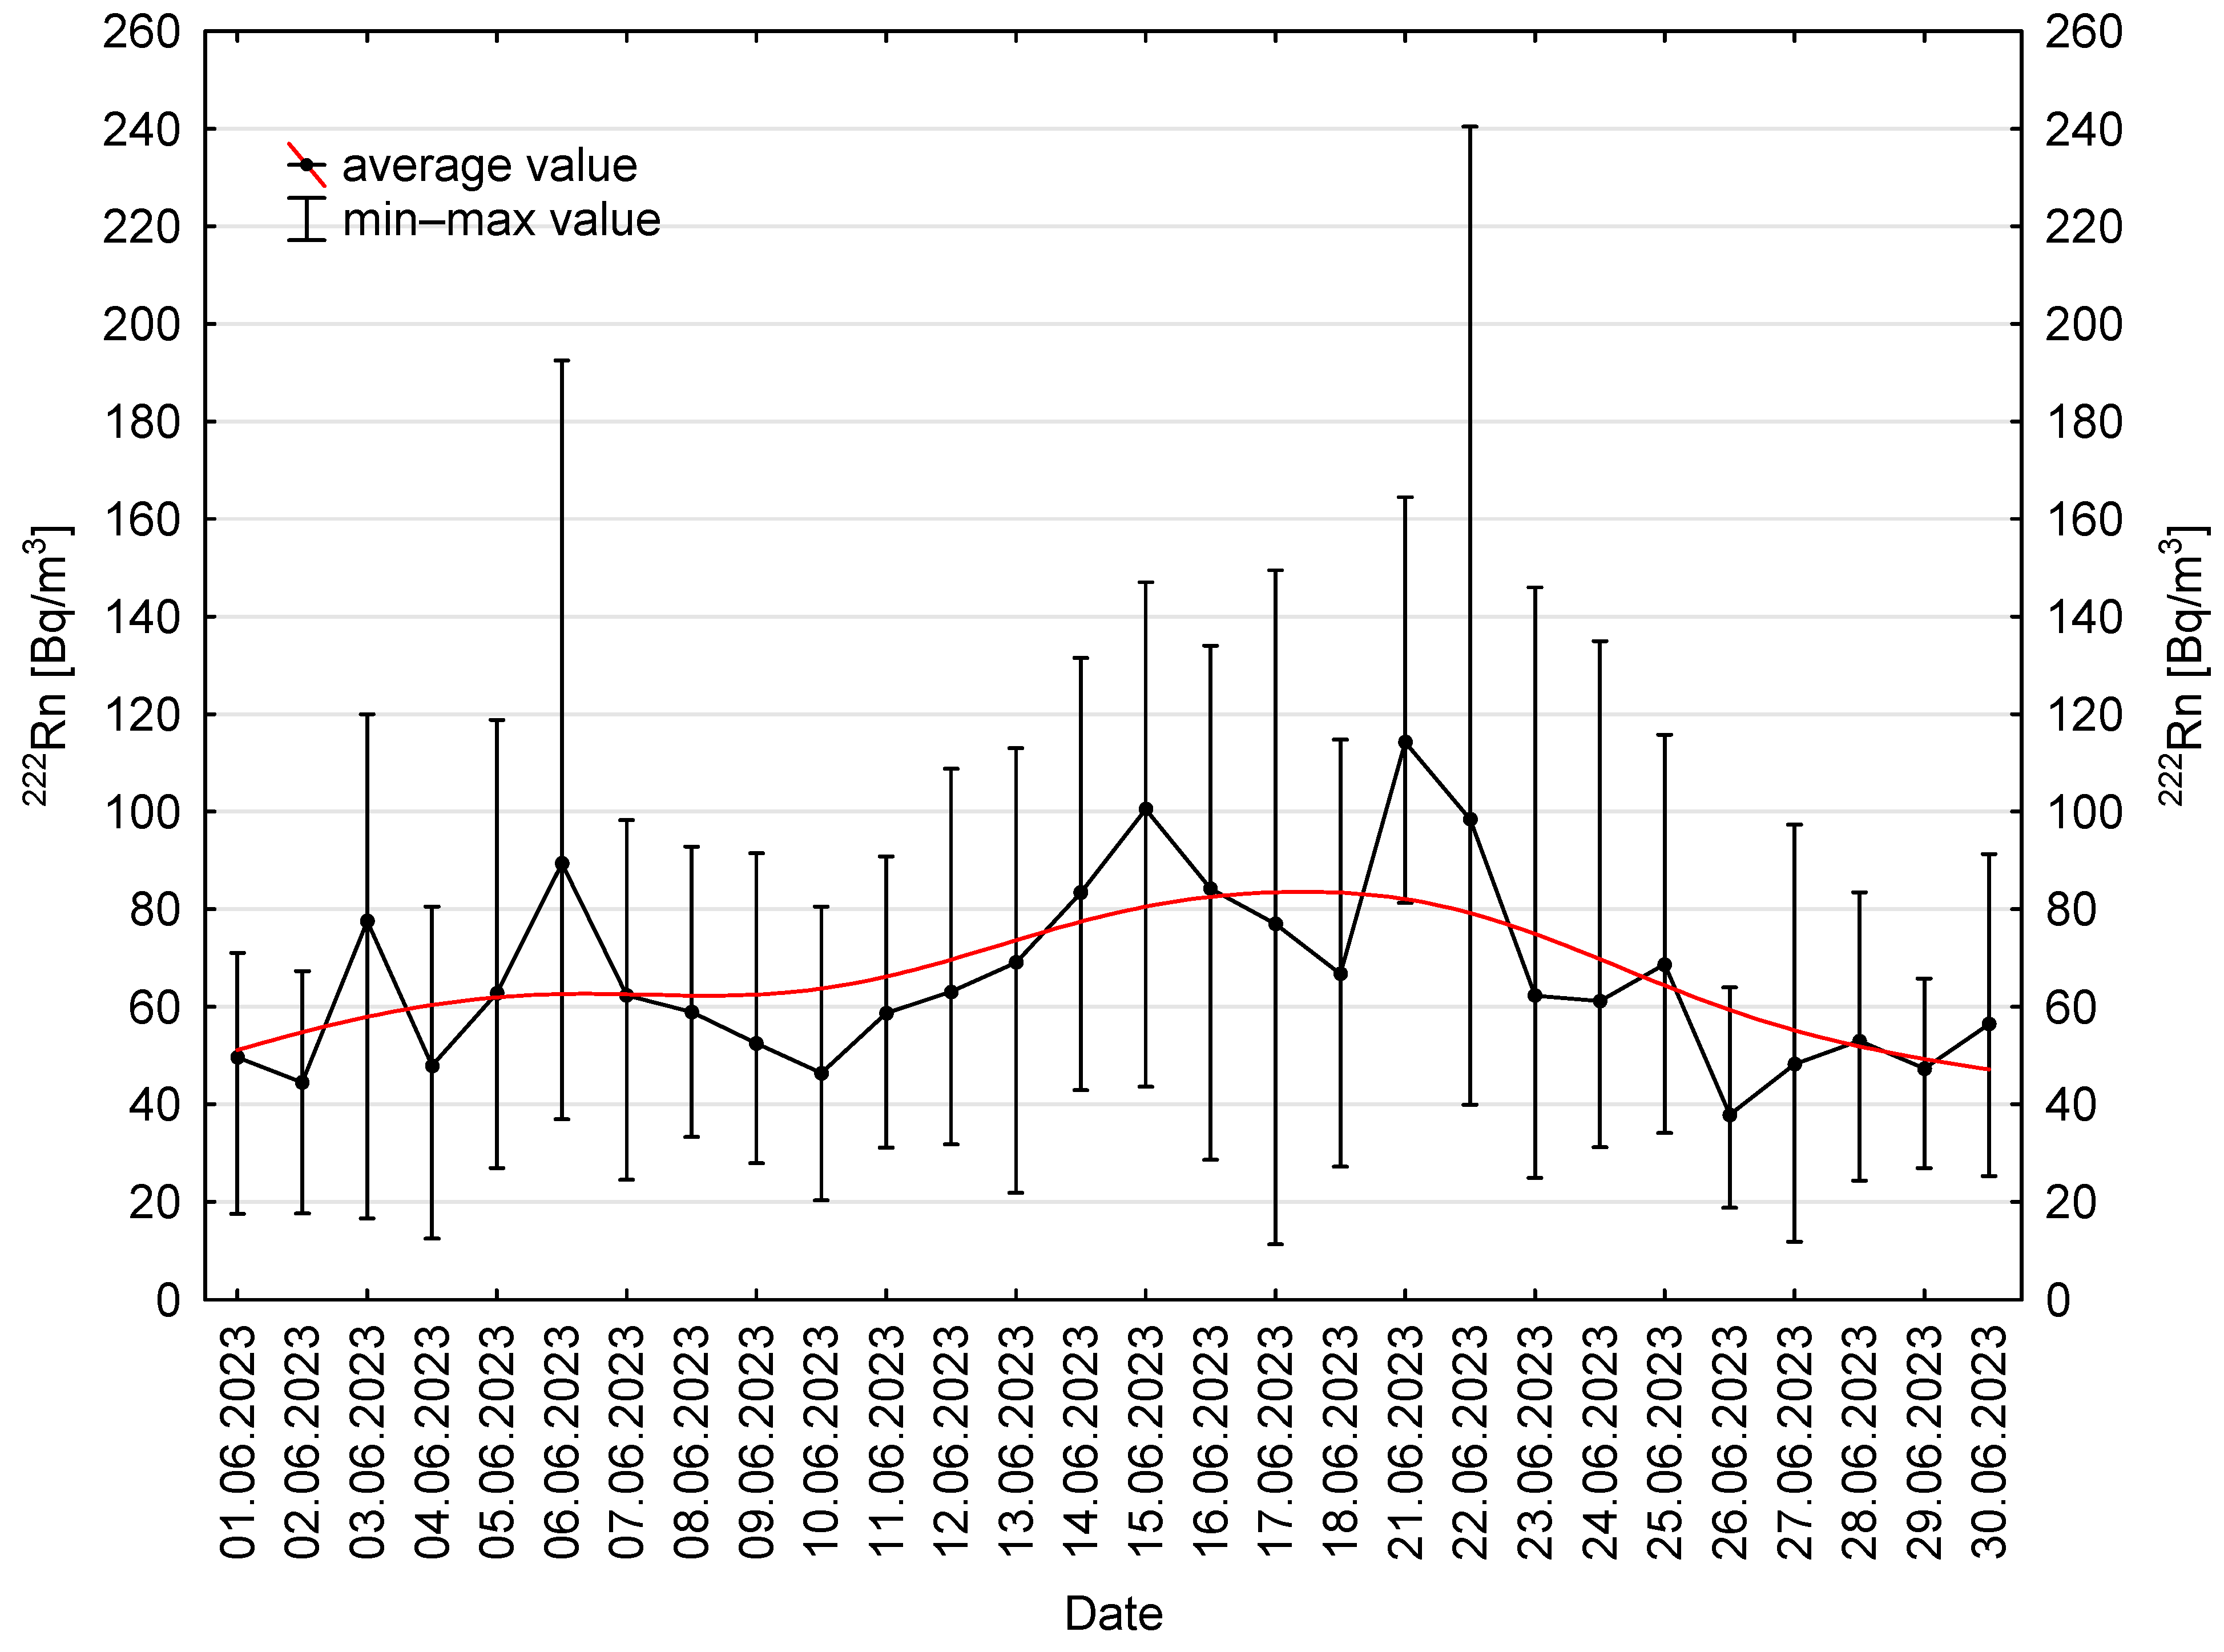
3. The daily fluctuation amplitudes exhibited slightly different patterns (
Figure 8,
Figure 9,
Figure 10,
Figure 11,
Figure 12 and
Figure 13).
In March, radon activity concentrations increased during the third week and decreased in the fourth week of observation (
Figure 8). This period also showed the largest deviations from the mean concentration, ranging from just over 10 Bq/m
3 to more than 60 Bq/m
3. In April (
Figure 9), a marked increase was observed during the second week, accompanied by a sharp rise in concentration values exceeding 100 Bq/m
3 above the mean. May (
Figure 10) exhibited minor, irregular fluctuations around the mean concentration. In June, higher activity concentrations persisted for approximately ten days between the second and third weeks of observation (
Figure 11). The diurnal variation pattern of radon activity concentration in July (
Figure 12) was comparable to that observed in May. Diurnal fluctuations were also recorded in August, being particularly pronounced between the second and third weeks of observation, i.e., from 13 August to 17 August. During this period, concentrations increased markedly, with mean values ranging from 2500 Bq/m
3 to slightly above 3000 Bq/m
3. In the remaining weeks of August, radon activity concentrations did not exhibit diurnal variability, maintaining a relatively stable level (
Figure 13).
The
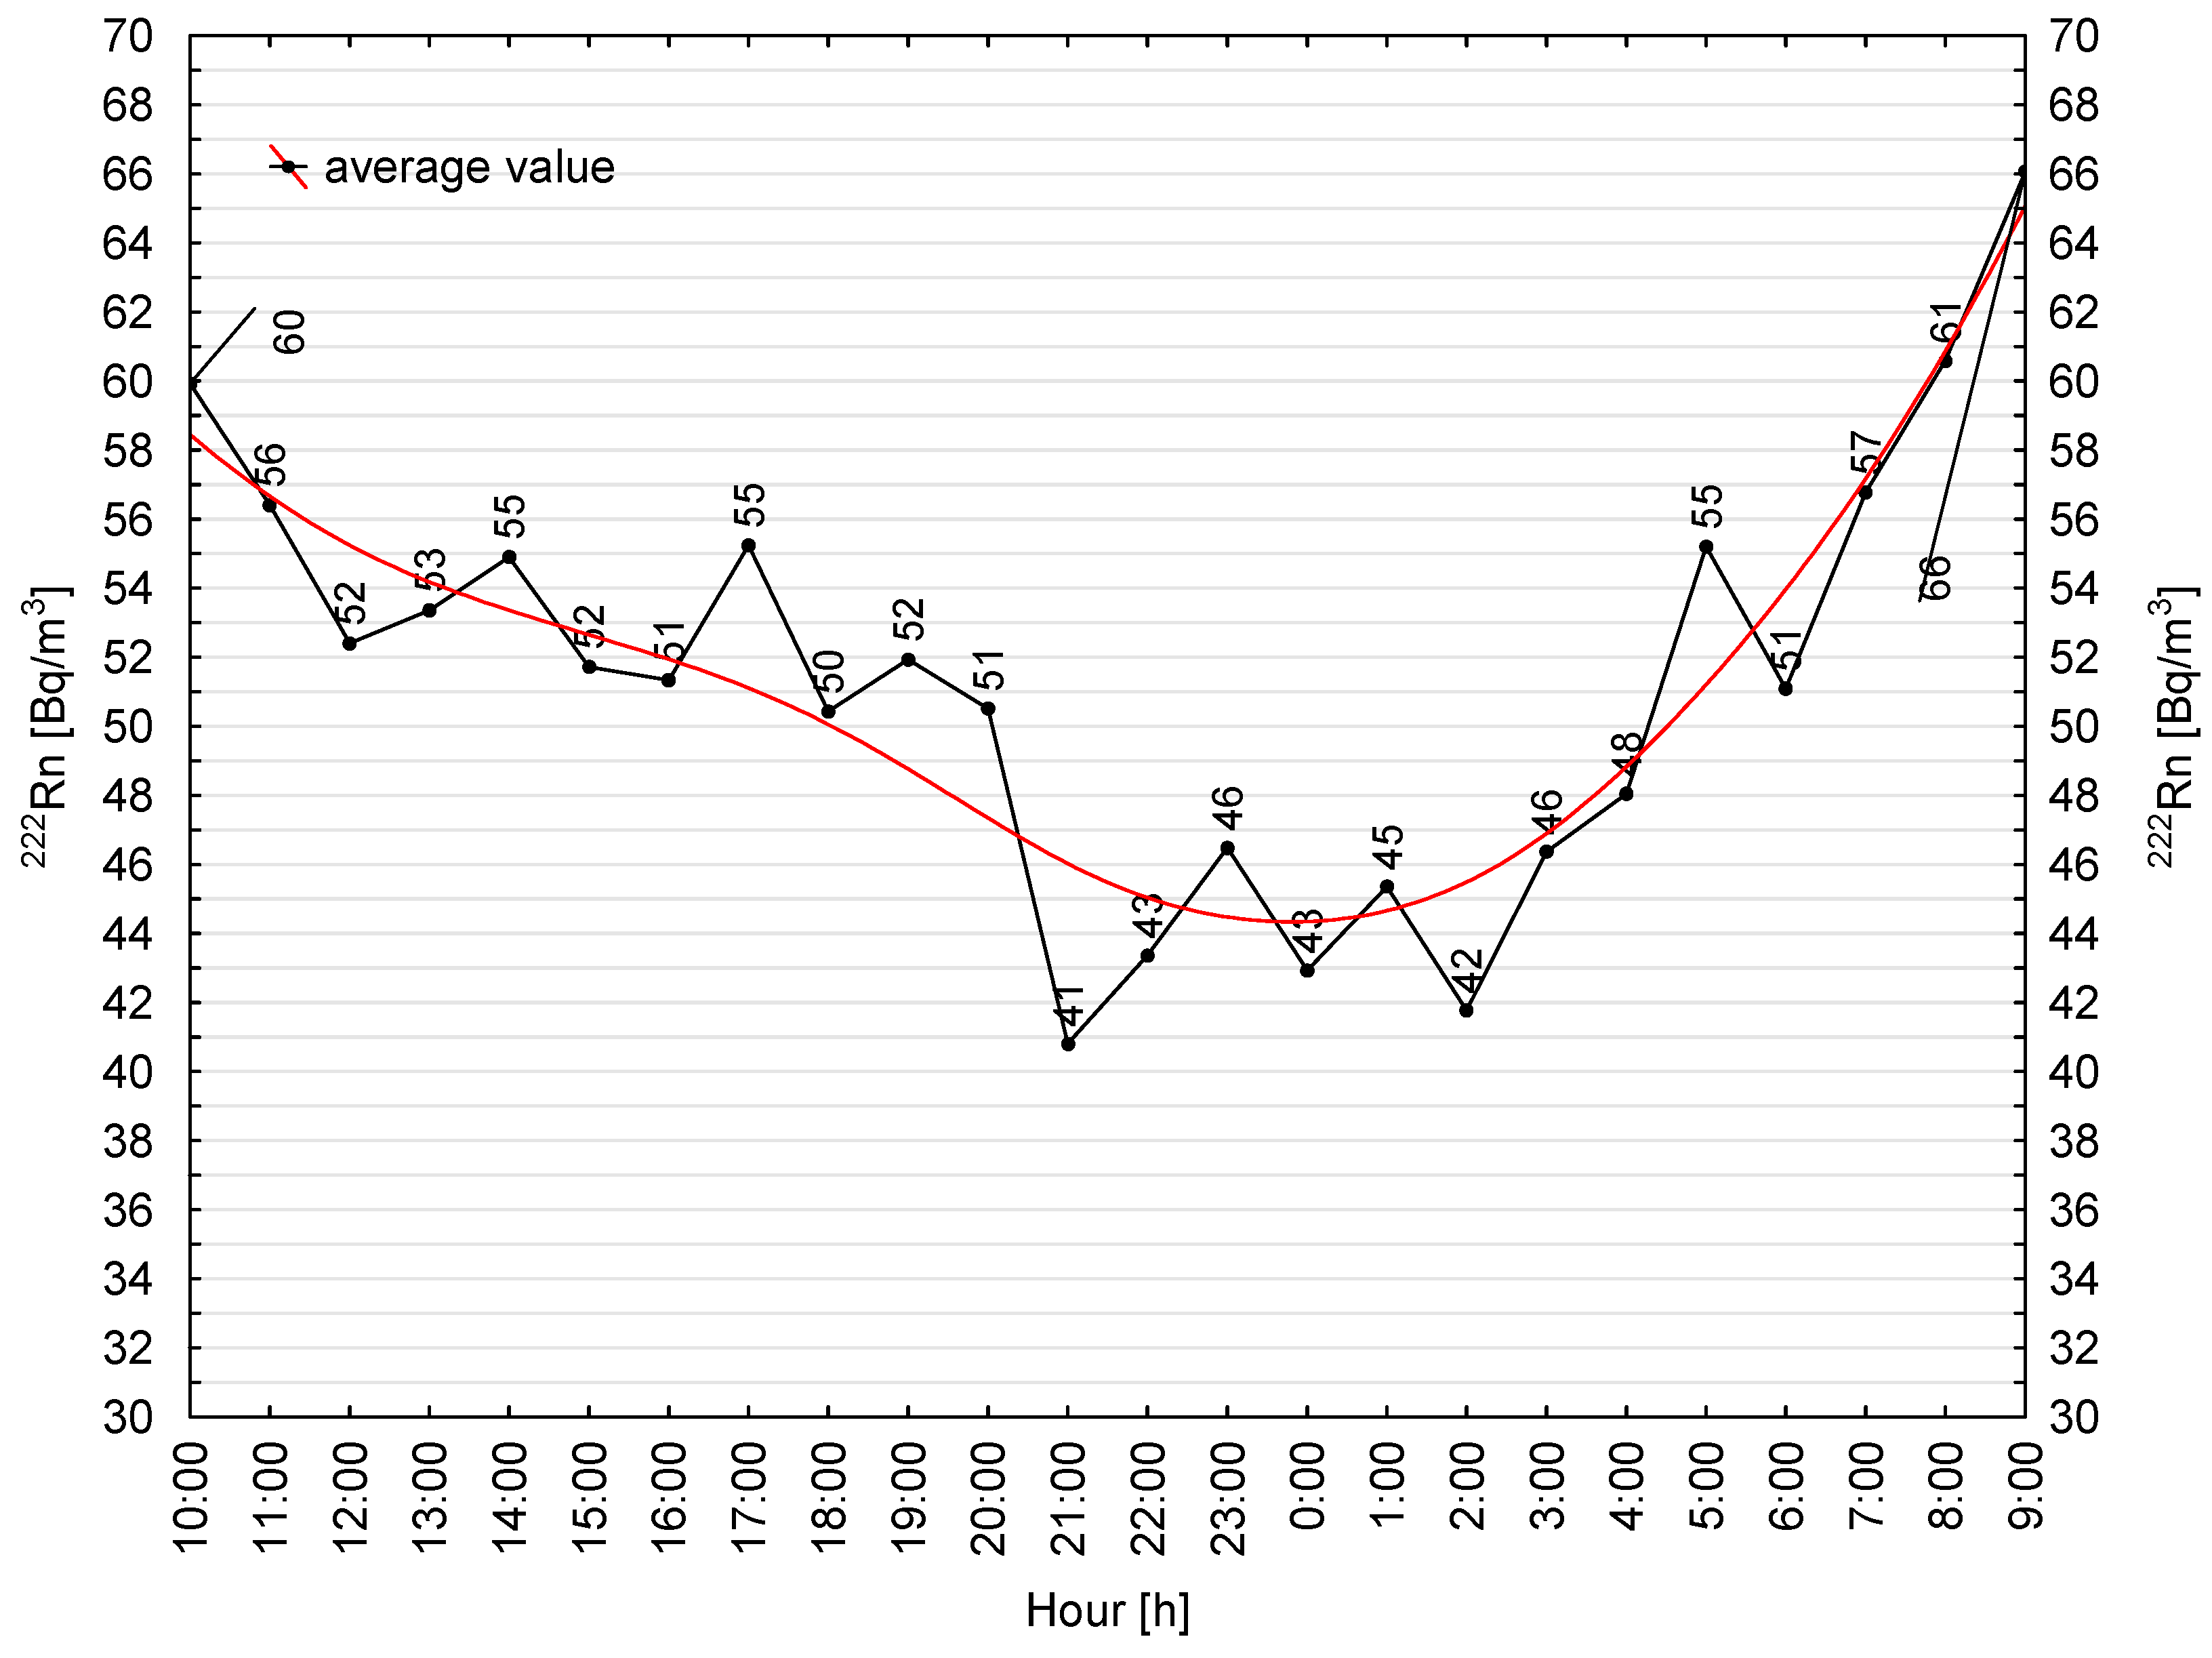
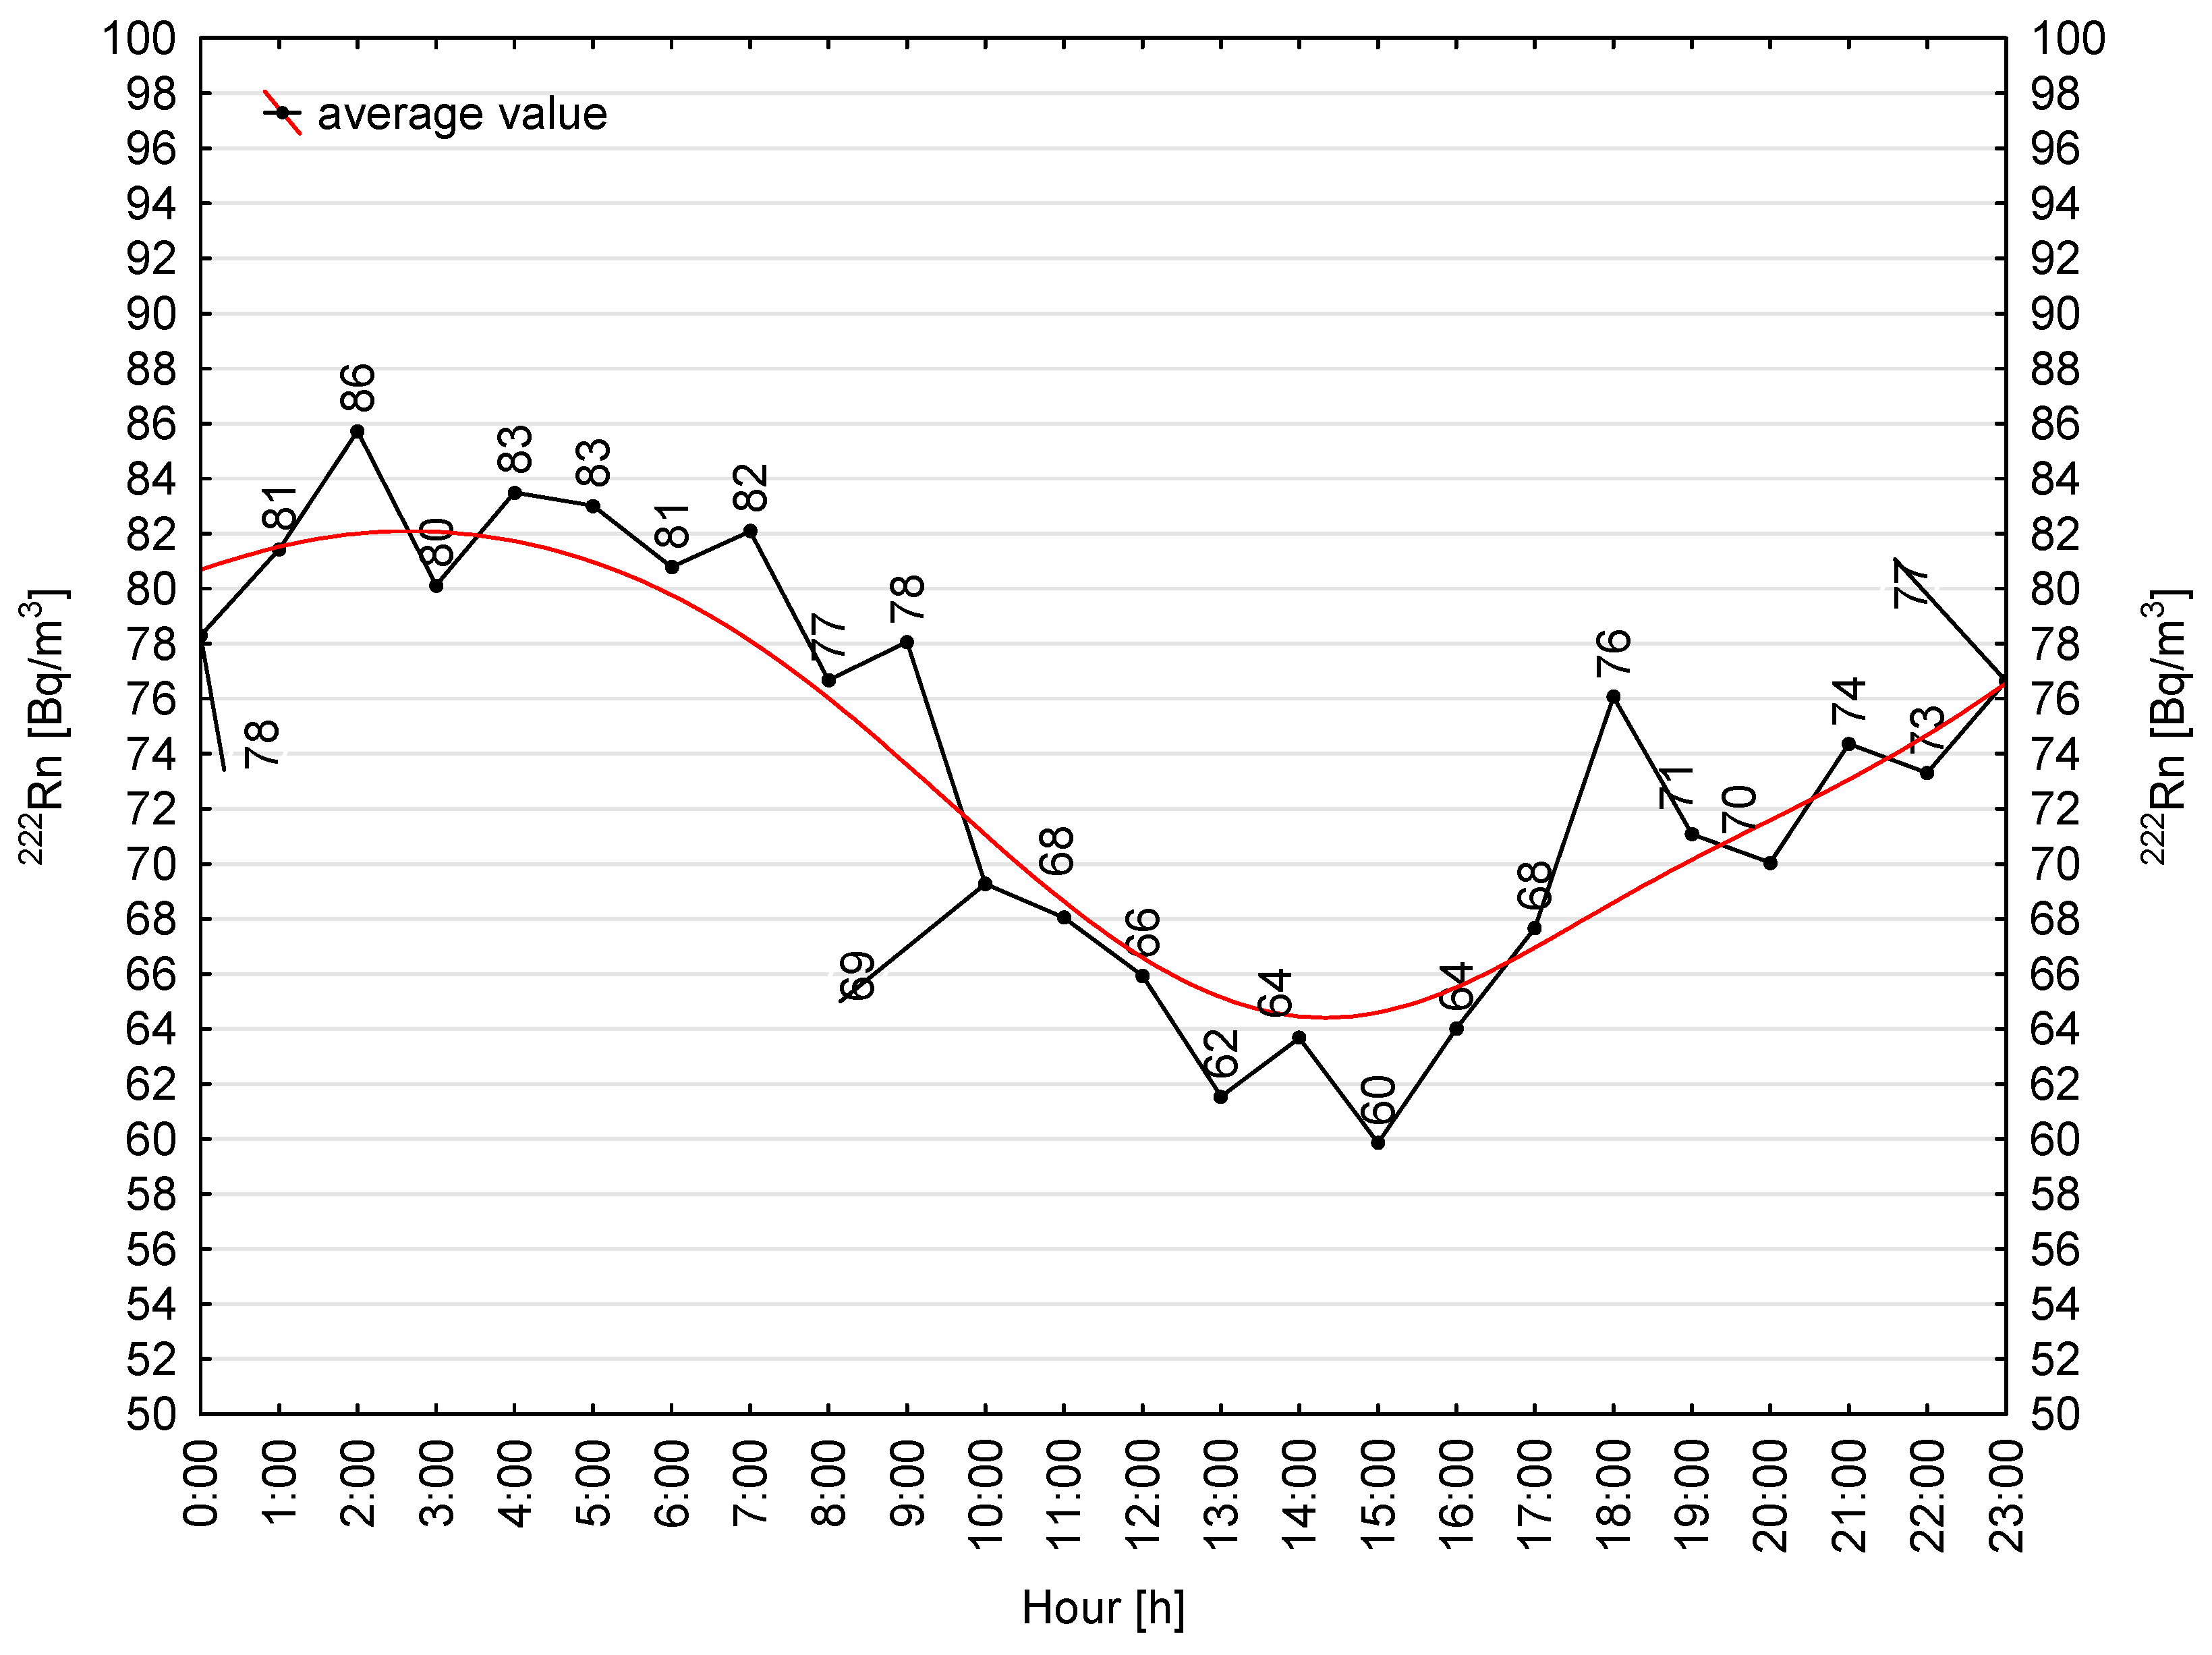
222Rn activity concentrations recorded in the “Aurelia” Mine exhibited hourly variations (
Figure 14,
Figure 15,
Figure 16,
Figure 17,
Figure 18 and
Figure 19). In March (
Figure 14), the radon concentrations decreased between 8:00 PM and 3:00 AM. In April (
Figure 15), the concentration values increased between 10:00 AM and 2:00 PM, with the rise being distinctly irregular. This pattern may be related to the equilibration of temperatures between the interior and the external environment of the site. In May (
Figure 16), a decrease in concentration was observed between 9:00 AM and 4:00 PM, with an upward trend beginning around 6:00 PM. In June (
Figure 17), the radon activity concentrations increased throughout the day, from 6:00 AM to 4:00 PM. In July (
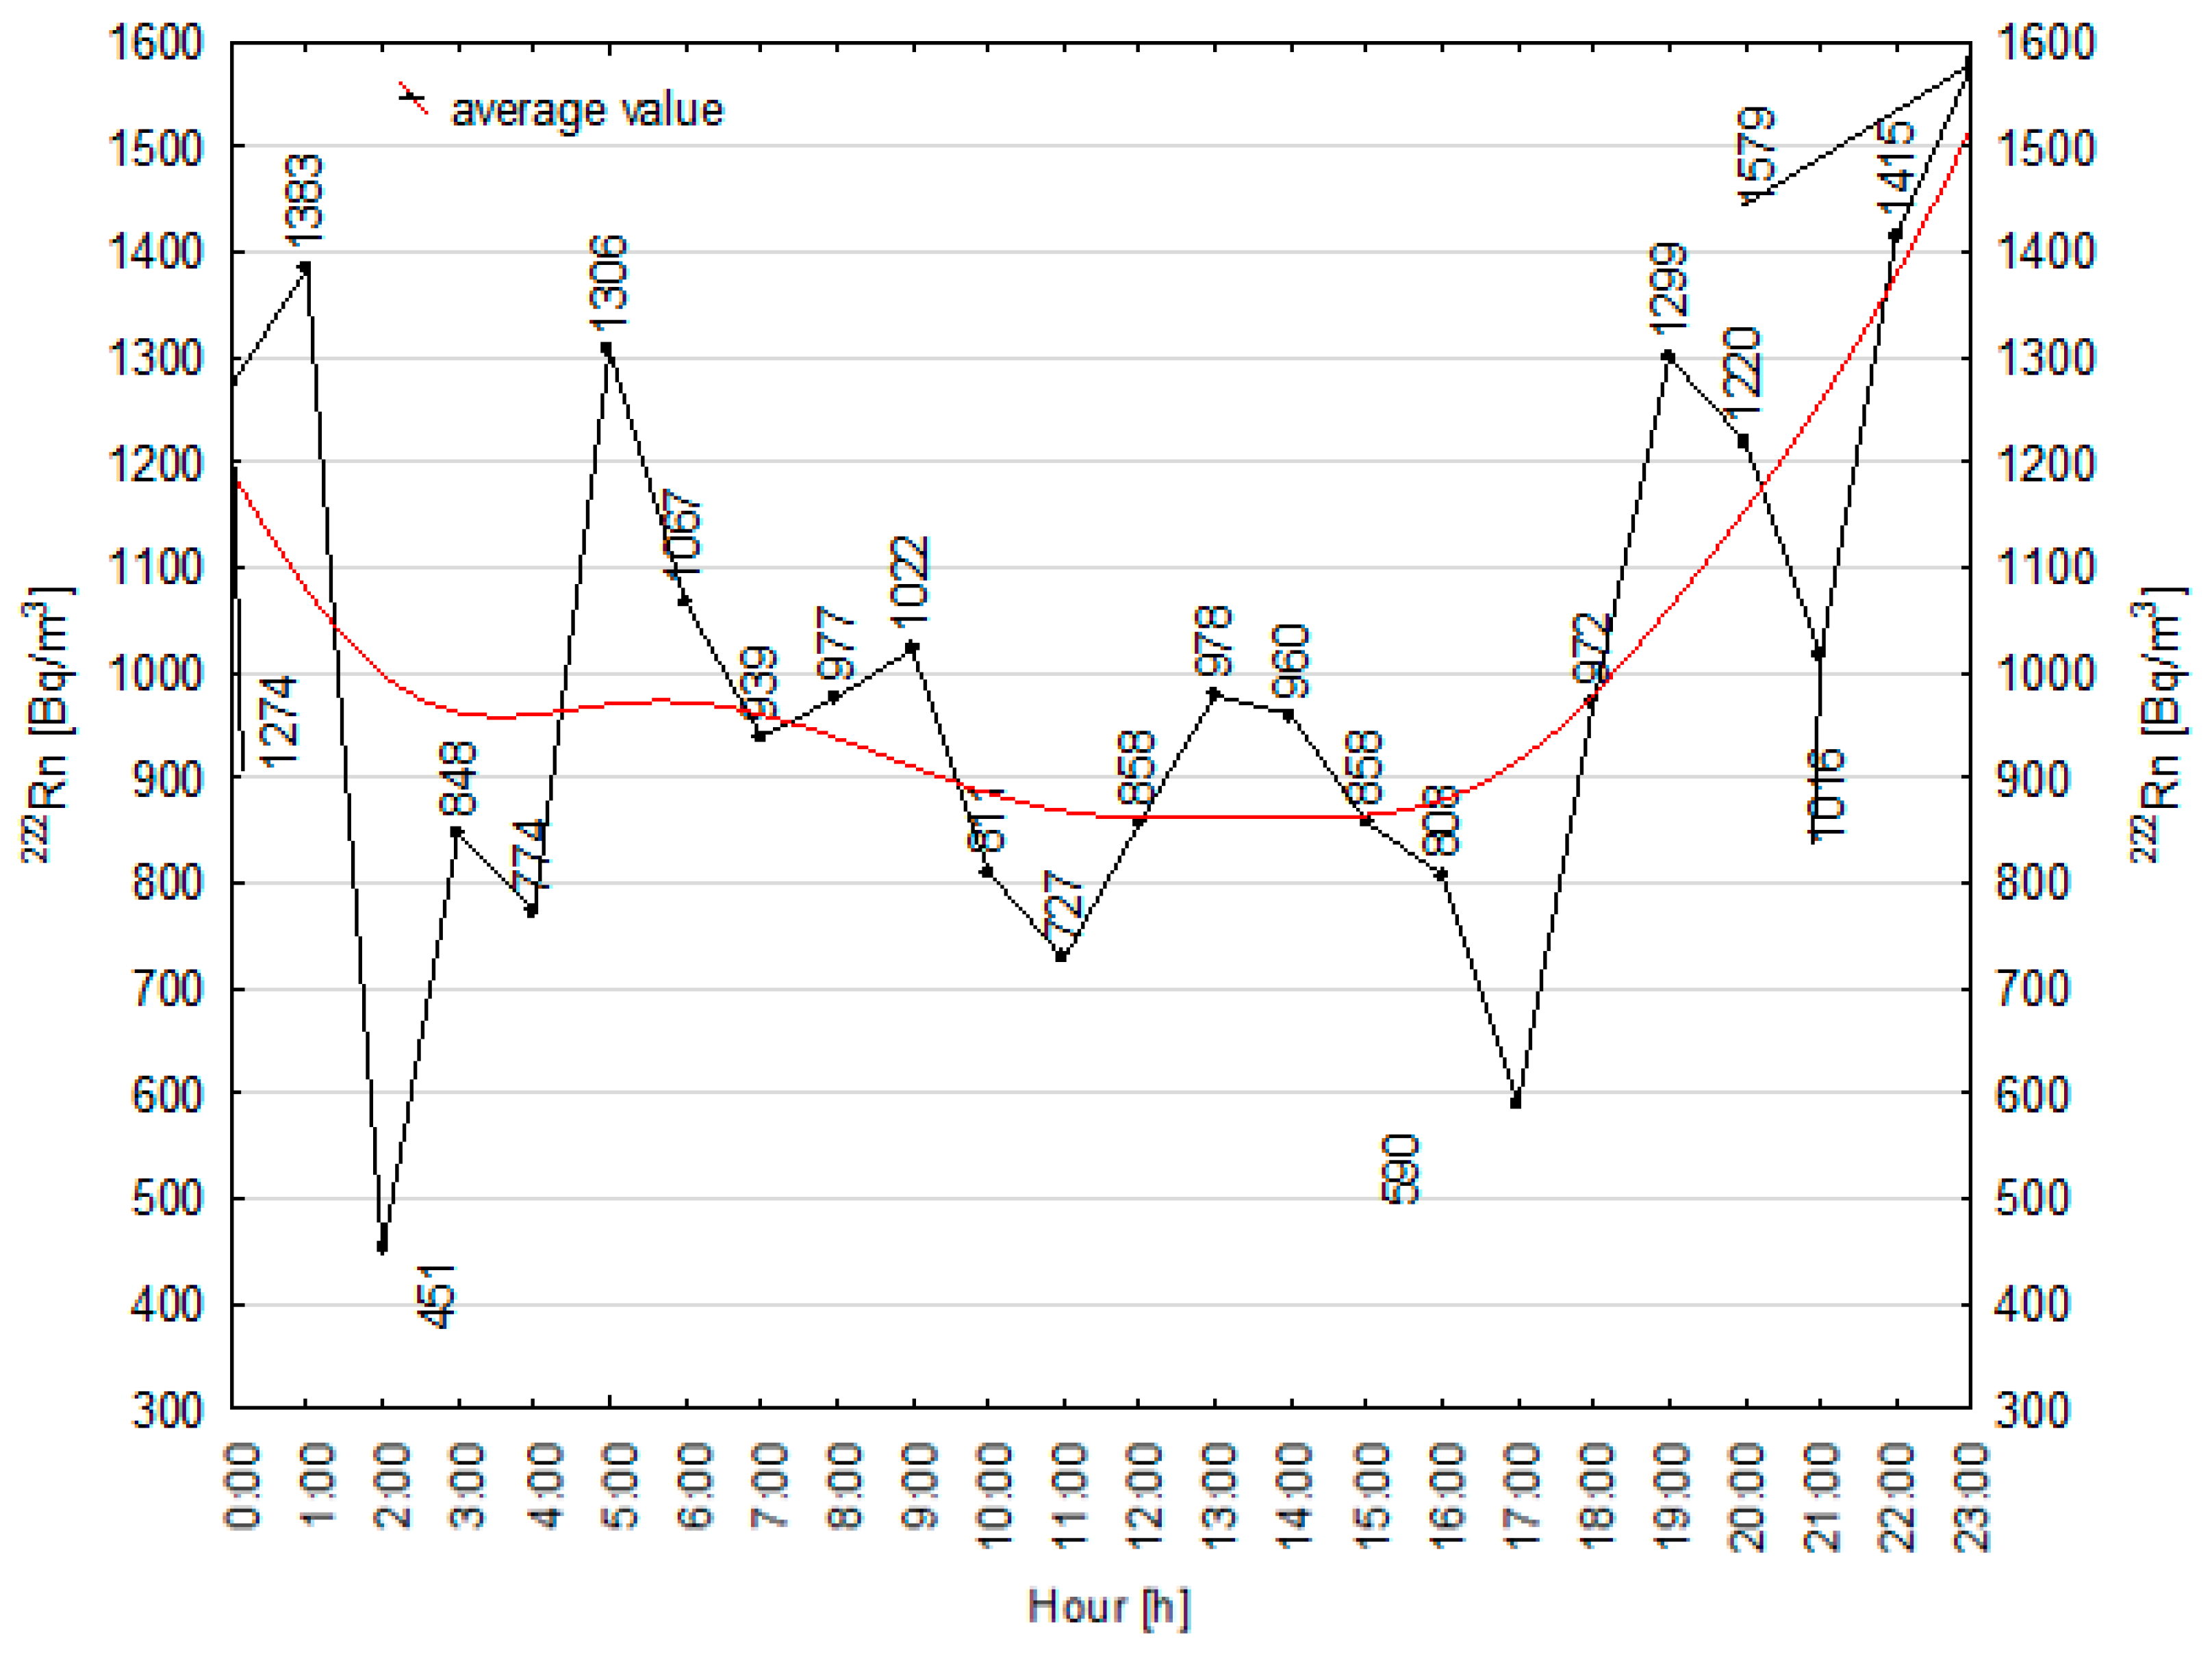
Figure 18), a noticeable decline occurred between 10:00 AM and 6:00 PM. In August, hourly fluctuations remained nearly constant, followed by an increase between 6:00 PM and midnight (
Figure 19).
The large number of outliers and extreme outliers recorded in August, particularly between the 2nd and 3rd weeks of observation (i.e., from 13 to 17 August), may indicate the presence of external, systematic factors influencing the studied phenomenon. Additionally, the increasing number of values exceeding Tukey’s boundaries disrupted the symmetry of the distribution and elevated both skewness and kurtosis coefficients. The authors suggest that the sudden and substantial increase in
222Rn activity concentration could be a response to microseismic vibrations or crustal stresses. Consequently, the values statistically classified as outliers and extreme outliers may represent early signals of geological changes (so-called precursor anomalies). This hypothesis is further supported by statistical evidence of changes in the data distribution. The strongly leptokurtic distribution of raw data indicated a pronounced concentration of values around the mean (manifested as distinct peaks), which were highly sensitive to outliers forming heavy tails with numerous extreme values (kurtosis of 71.9), compared to a kurtosis value of 6.8 reflecting natural variability (daily and hourly) in the measurements. The increase in radon concentration by several (up to several tens of) orders of magnitude relative to the mean value may have been driven by sudden changes in geological conditions, including alterations in stress within the rock mass (effects of alternating tension–compression processes and shear force systems) associated with induced seismicity resulting from intensive mining activities in the copper ore mining district (LGOM) in Lower Silesia (
Figure 20). Such correlations between variations in radon activity concentration and geodynamic phenomena have been extensively discussed in the literature [
37,
38,
39,
40,
41,
42,
43]. One notable example is the study by Przylibski et al. [
38], which demonstrated that pressure changes in the rock mass caused by tectonic activity—particularly during transitions between compressive and tensile stress regimes—can induce significant fluctuations in radon exhalation from rock surfaces into the underground atmosphere.
Taking the above interpretations into account, the periods during which anomalous values of
222Rn activity concentration were recorded—particularly pronounced between 13 and 17 August—were compared with the timing of seismic events exceeding the perceptibility threshold (M > 2.5). Data for the comparative analysis were obtained from the seismic event registry maintained by the automatic detection system PSG_Sejs_NET [
39] for the period from 1 August to 31 August 2023.
It was observed that periods of anomalous radon activity concentration coincided with the registration of two seismic shocks with magnitudes of 3.0, and 3.1, respectively. Their epicenters were located twice in the Legnica–Głogów Copper District (
Table 2). Radon activity concentrations were observed to increase both prior to and following the recorded seismic events.
For the events registered in the LGOM area, radon activity concentrations were recorded with varying lead times relative to the seismic event. In the first case (position 1 in
Table 2), radon activity concentrations clearly rose about 24 h before the event, with the increase ending approximately 11 h after the shock. In the second case (position 2 in
Table 2), both the onset and cessation of elevated radon activity concentration preceded the seismic shock. Elevated levels began roughly 10.5 h before the event and ended about 5.5 h prior to the occurrence of the shock. The observed patterns are summarized in
Table 2.
Seismic shocks occurring in mining activity zone (LGOM) may have contributed to the anomalous (outlying) 222Rn activity concentration values recorded in August at the mine in Złotoryja. The distance between the epicenter of the seismic event and the measurement site may have influenced the nature of the radon signal response (i.e., occurring either prior to or following the shock). Fluctuations in the radon activity concentration observed before or after an induced seismic event could be associated with both phases of rock mass deformation (tension and compression). However, confirming or refuting this hypothesis, as well as conclusively attributing the cause of the observed phenomenon, would require further monitoring of the spatial and temporal distributions of induced seismic shocks in relation to changes in the 222Rn activity concentration.
Laser scanning (TLS) performed at the “Aurelia” Mine was used to identify the geological structure of the underground tourist facility, construct a spatial model, determine the cross-section of the tourist route (
Figure 1), and create a spatial database. The obtained results constitute a simplified research metric—a linked data model (radon–geological structure–model)—which is a preliminary stage and requires supplementation with additional attributes (in the form of spatial, linear, or point data), to be addressed in further research. However, in this simplified form, these results form the basis for creating a GIS database of underground facilities.
4. Conclusions
The distribution of 222Rn activity concentration values recorded at the “Aurelia” Mine in Złotoryja exhibited a pronounced right skewness throughout the six-month observation period. This is evidenced by the skewness coefficient ranging from 0.9 to 8.2, alongside substantial standard deviation values, indicating significant dispersion around the average value. Outliers and extreme outliers influenced the average radon activity concentrations in April, May, June, July, and August. No outliers were detected in March, suggesting homogeneity of the data during this period, stability of the average concentration values, and an absence of data exhibiting strong asymmetry or extreme deviations.
Average values of radon activity concentrations were 51.4 Bq/m3 in March, 59.3 Bq/m3 in April, 65.9 Bq/m3 in May, and 65.1 Bq/m3 in June. In July and August, the average 222Rn activity concentrations were affected by numerous single measurements identified as outliers and extreme outliers. In both months, the average values were slightly inflated, reaching 75.8 Bq/m3 in July and 5784.8 Bq/m3 in August. To obtain a representative measure of central tendency for July and August, outliers and extreme outliers were removed, resulting in adjusted means of 73.8 Bq/m3 and 1003.6 Bq/m3, respectively. The exclusion of extreme observations in both cases reduced the skewness of the distribution (from 4.6 to 0.9 in July and from 8.2 to 2.8 in August). This indicates that the annual average 222Rn activity concentrations at the “Aurelia” Mine comply with the regulatory limits set by the Atomic Law Act (i.e., 300 Bq/m3). Values substantially exceeding the threshold of 300 Bq/m3 may be associated with atypical or rare phenomena that require statistical validation through measures of central tendency (mean and median), dispersion (standard deviation and interquartile range), as well as skewness and kurtosis coefficients.
The 222Rn activity concentrations predominantly exhibited diurnal fluctuations. In March, an increase was observed during the third week, with a decrease in the fourth week of observations. In April, radon activity concentrations rose significantly in the second week, while in June, this increase occurred between the second and third weeks. May displayed irregular daily fluctuations with no clear periods of increase or decrease. In August, a pronounced rise in concentrations was noted between the second and third weeks of the month.
Hourly variations were also observed in 222Rn activity concentrations. Elevated concentrations during daytime hours were recorded in April (for 4 h) and June (for 9 h). Conversely, lower daytime values occurred in May (for 7 h), July (for 9 h), and August (more than 8 h). Only in March did the concentrations decrease during night-time hours, specifically from 20:00 to 03:00.
August was characterized by a substantial number of outliers and extreme outliers, particularly pronounced between the 13th and 17th days of the month. The authors suggest that these anomalies may be related to actual geophysical processes, such as mining-induced tremors occurring within the LGOM mining district. Periodic transitions between tensional and compressional phases within the rock massif, consequent to such activity, could provoke rapid increases in radon activity concentrations, potentially preceding or following seismic events of magnitude M > 2.5. Nevertheless, further observations are necessary to elucidate this phenomenon. The authors’ findings may provide additional evidence for the influence of tectonic kinematic changes in the rock massif on radon exhalation into underground workings. At this stage, this hypothesis remains purely speculative.
During the radon measurement campaign (March–August 2023), a large number of seismic events were recorded, all of which were induced exclusively by anthropogenic activities conducted in two mining regions of Poland: the Legnica–Głogów Copper District and the Upper Silesian Coal Basin (GZW). However, results from the radon monitoring campaign conducted in the “Aurelia” Mine in Złotoryja demonstrated that geodynamic phenomena can selectively influence radon emission. The principal evidence of their occurrence and intensity is the short-term (within a few days before or after a tremor) high-amplitude variation in radon activity concentration, exceeding the mean value by one to two orders of magnitude. According to the authors, this effect may be related not only to the seismic event itself but also to the phase/state of the rock mass during which the seismic shock occurs (extension or compression phase of the orogen), the distance of the measurement station from the earthquake epicenter, and the travel time of seismic waves from the seismic hypocenter to the measurement location. Anomalous radon activity concentrations during the measurement campaign were observed only within a span of several days in August. This period coincided with the occurrence of two mining-induced seismic shocks exclusively in the LGOM copper district. It should be emphasized, however, that LGOM comprises three mining plants located in different areas. Therefore, it is difficult to identify the specific factors that may have caused these two, out of the many anthropogenic tremors recorded within LGOM, to potentially influence the anomalous radon behavior detected in the “Aurelia” Mine in Złotoryja.
The terrestrial laser scanning (TLS) conducted at the “Aurelia” Mine enabled the identification of the geological structure of the underground tourist facility, the development of a 3D spatial model, the determination of the tourist route’s cross-section, and the creation of an initial spatial database. The results constitute a simplified linked data model (radon–geological structure–spatial model), representing a preliminary stage that requires further enhancement through the integration of additional spatial, linear, and point attributes. Despite its preliminary nature, the developed model provides a solid foundation for future analyses and for the development of a GIS-based system dedicated to underground facilities. The conducted preliminary work confirms the feasibility of integrating tracer investigations in occupational environments with archival cartographic data and spatial information acquired through terrestrial laser scanning. This integrated approach, implemented within a GIS environment, provides a solid foundation for the development of a reliable radon risk model. Such a model can more accurately reflect real-world conditions in underground workplaces and ensure compliance with applicable legal regulations.
The authors’ study constitutes a simplified metric of the research and a model of linked data, which, when supplemented with additional attributes (in the form of spatial, linear, or point data), forms the foundation for creating a GIS database of underground tourist sites in Poland.


