1. Introduction
Carbonate fracture–cavity reservoirs are significant global oil and gas resources. Their development is primarily controlled by the connectivity of fracture–cavity units. These reservoirs, consisting of cavities, dissolution pores, and fractures that collectively function as storage and flow channels, exhibit strong heterogeneity and spatial dispersion [
1,
2,
3,
4,
5,
6]. The spatial architecture and flow capacity of fracture–cavity units directly control fluid migration, reservoir utilization, and recovery efficiency. These units are therefore critical geological factors that influence development outcomes. The S91 unit of the Tarim Oilfield was formed through shallow karstification. It is characterized by pronounced heterogeneity and complex connectivity. Previous studies have delineated its fracture–cavity system and clarified the development patterns of composite karst reservoirs. Although integrated management has enhanced recovery, substantial residual oil remains. This highlights the need for additional recovery efforts. The complex multi-scale structure of fracture–cavity systems, ranging from microscopic throats to large caves, along with their highly uncertain spatial distribution, presents significant challenges for accurate characterization and quantitative evaluation of connectivity. Conventional static geological data (e.g., core samples and well logs) provide only limited information near the wellbore, making it difficult to characterize the fracture–cavity network structure between wells [
7,
8,
9,
10]; geophysical methods, such as seismic techniques, can identify large fracture–cavity targets; however, they lack the resolution to detect small fractures and passages that govern fluid flow and provide only limited direct evidence of connectivity [
11,
12,
13]. Dynamic production data analysis methods—such as well testing, interference testing, tracer monitoring, and production response analysis—provide quantitative insights into reservoir connectivity and dynamic parameters. However, their application during the early stages of development is limited by implementation complexity, delayed data acquisition, and high operational costs [
14,
15,
16].
To address these limitations, this study proposes an integrated approach that combines multi-scale static data with dynamic response analysis to enhance the reliability and practicality of connectivity evaluations in fracture–cavity reservoirs. Structural gradient tensors and stratigraphic continuity attributes enhance the accuracy of karst boundary delineation. They also help reduce strong reflection interference. RGB fusion combines coherence, curvature, and variance attributes, thereby highlighting the spatial distribution and development of large-scale faults. Ant colony tracking and fracture simulation applied to post-stack data enable efficient and accurate identification of fracture networks and their density distributions. Three-dimensional visualization elucidates the spatial relationships between fracture–cavity units and fracture networks. Dynamic data further validate interwell connectivity. This approach synthesizes information from geological studies, well logs, seismic data, and production dynamics, establishing a comprehensive connectivity evaluation framework that integrates both static and dynamic data. The framework supports well-network design, injection–production optimization, and residual oil prediction, ultimately enhancing the development efficiency of complex fracture–cavity reservoirs.
2. Connectivity Evaluation Process
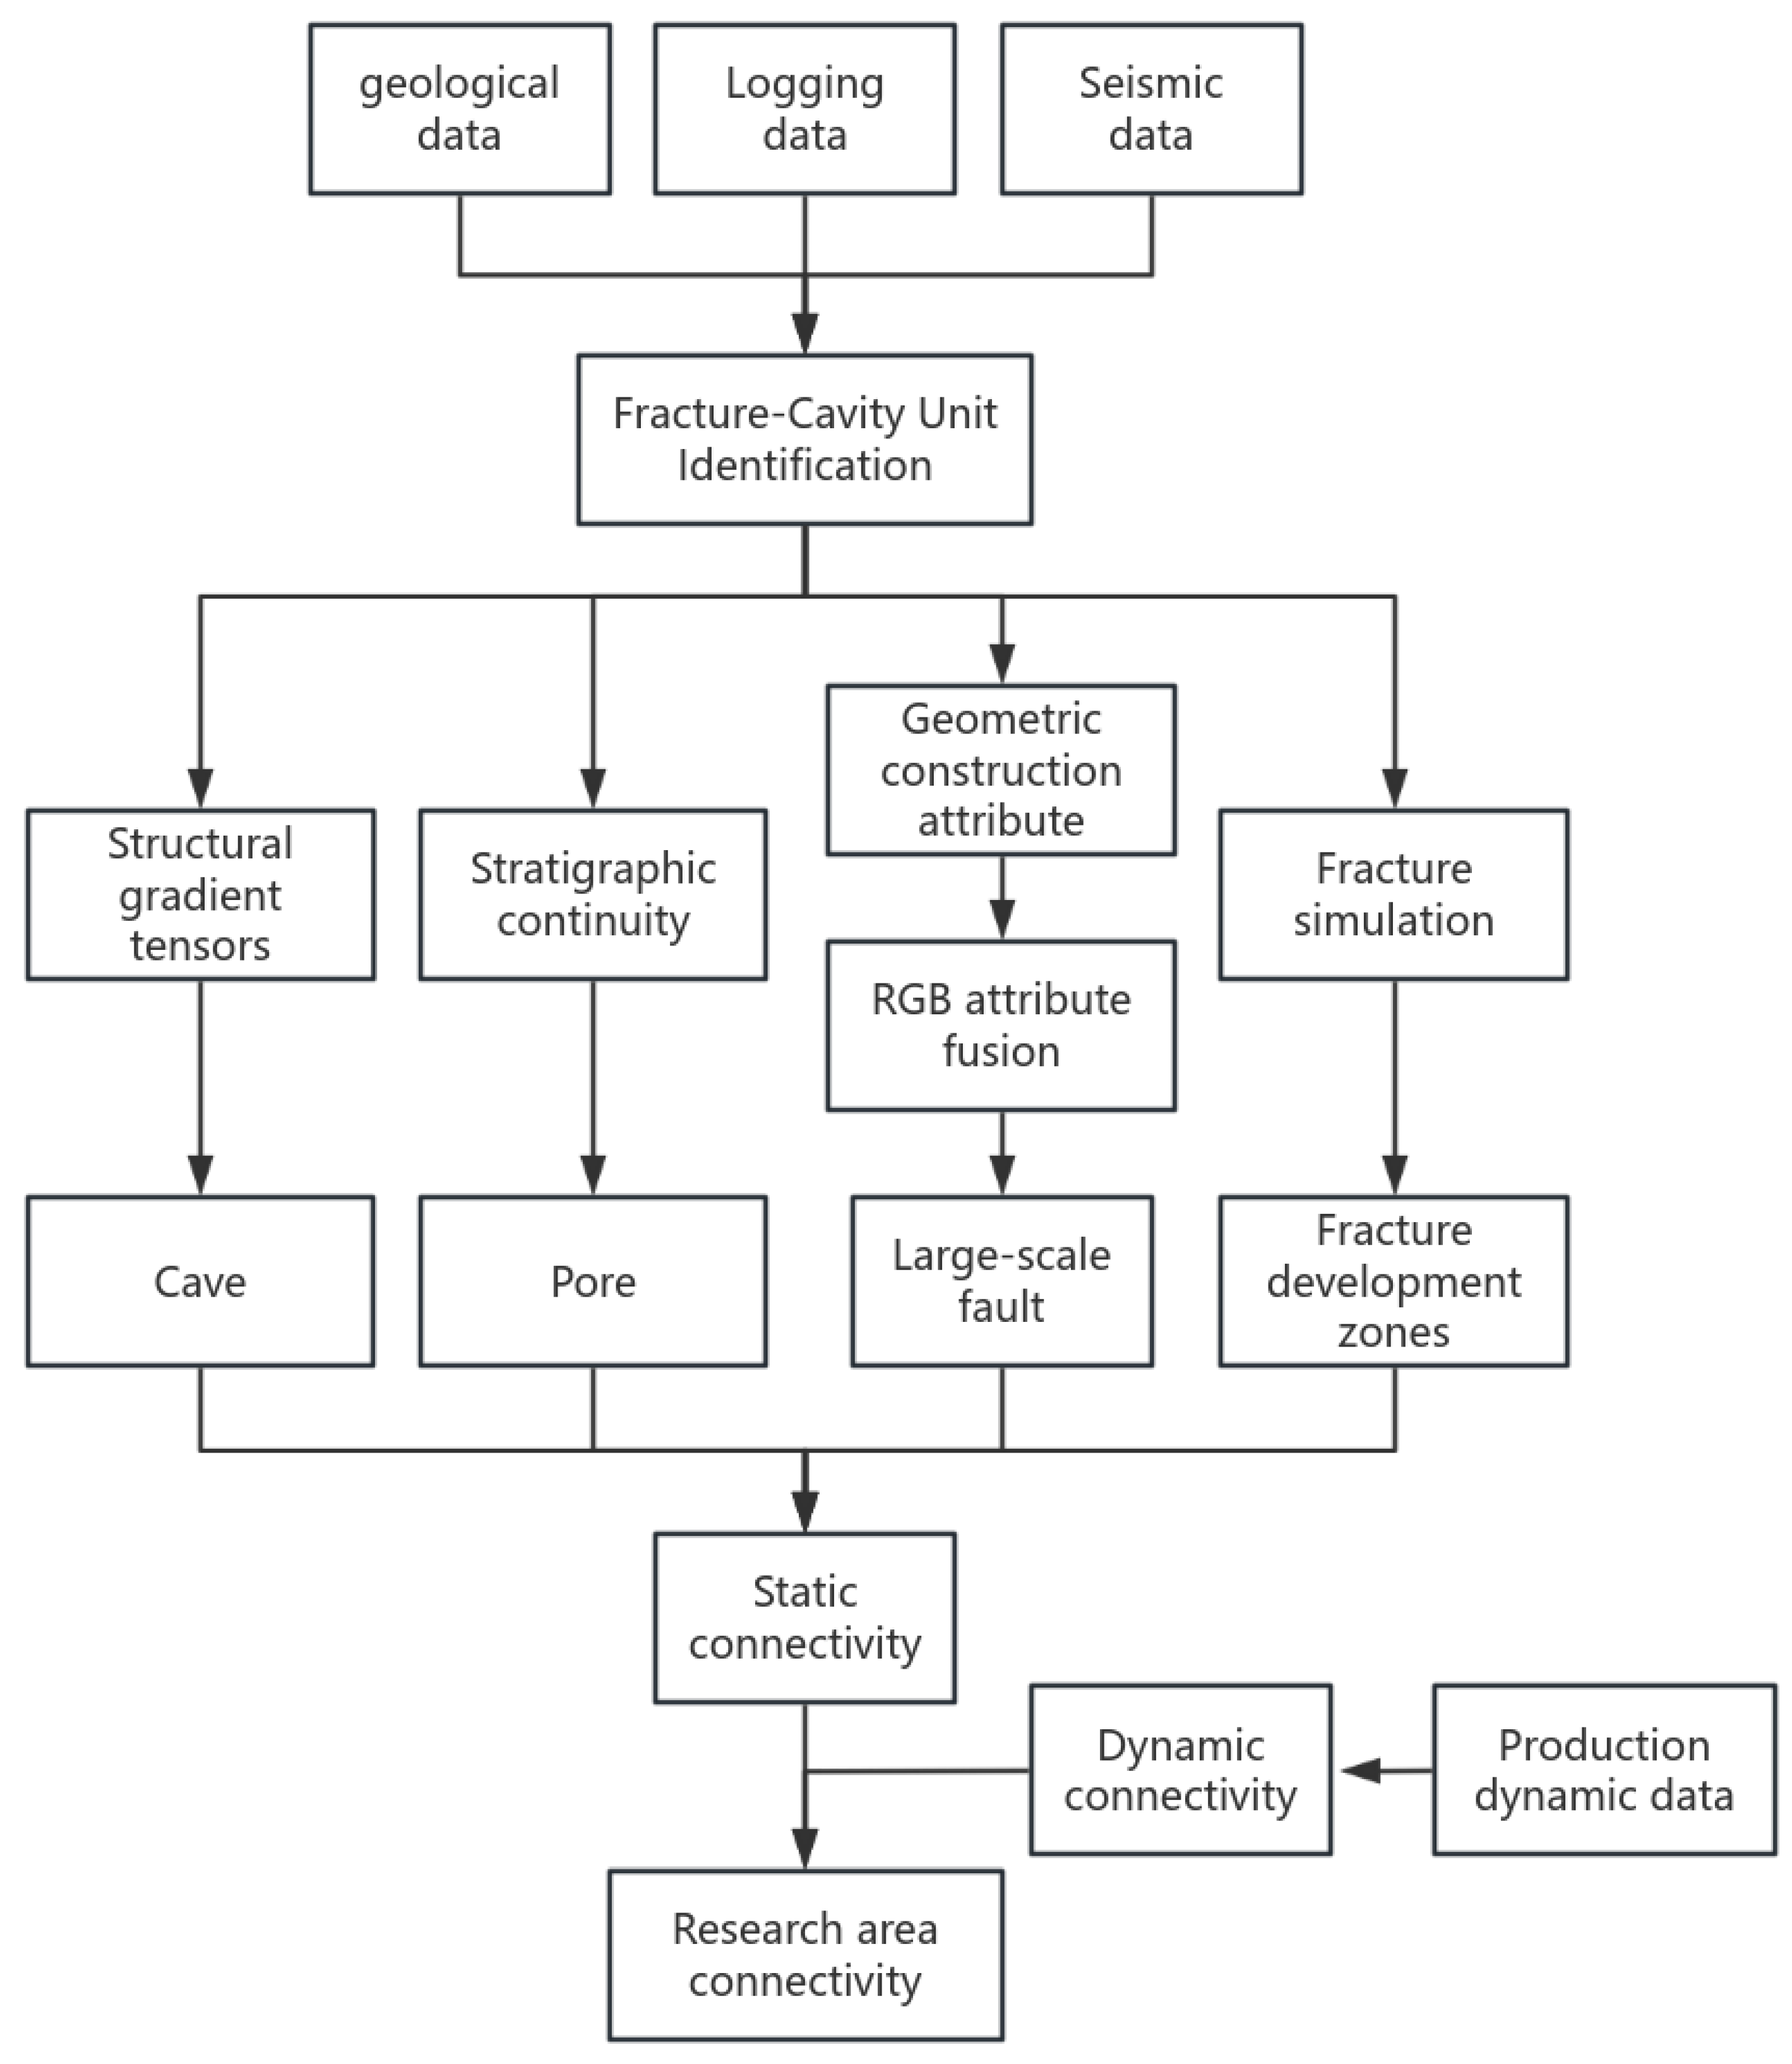
Structural gradient tensors and stratigraphic continuity properties are employed to refine the delineation of cave and pore boundaries. This approach effectively mitigates the interference of strong reflective interfaces in seismic data. Compared with traditional amplitude attributes, the present method provides greater clarity and accuracy in identifying areas containing karst caves and pores. It thereby more precisely depicts their spatial distribution. RGB attribute fusion analysis combines coherence, curvature, and variance attributes to facilitate a comprehensive assessment of large-scale fault development. These three attributes are integrated using the RGB color model. This integration complements and cross-validates structural information. It also emphasizes the comprehensive features of large-scale faults, including their spatial distribution, structural details, and development intensity. As a result, interpretation accuracy is enhanced. Ant-tracking algorithms and fracture simulation techniques are employed to identify fracture zone distributions and characterize fracture density. This method relies solely on post-stack data, avoiding the extensive effort required for pre-stack processing. It accurately depicts the spatial distribution of fracture networks and provides quantitative characterization of fracture density. The approach enhances the accuracy and reliability of fracture prediction, while dynamic data are used to evaluate connectivity between wells.
This study integrates static geological information with dynamic production data to establish a dynamic–static connectivity evaluation process tailored for heterogeneous fracture–cavity reservoirs (
Figure 1). The resulting framework supports well-network optimization, improves water and gas injection efficiency, predicts residual oil distribution, and guides adjustment strategies. Collectively, these measures enhance the development efficiency of complex reservoirs.
3. Geological Characteristics of the Study Area
The S91 unit is located in the central–western part of the eighth district of the Tarim River Oilfield (
Figure 2). This district hosts a karstic carbonate reservoir within the Tarim Basin. The S91 unit forms a highly heterogeneous system with an extensive fracture–cavity network. This network developed through multiple tectonic episodes, mainly during the Caledonian and Early Hercynian paleokarst periods. The Tarim Basin is a multi-cycle composite basin. It evolved under alternating extensional and compressional stresses, resulting in a “three ridges and four troughs” tectonic pattern. The Tarim Oilfield is situated on the Akekule Uplift, with the eighth district located on its south-west-dipping segment. Vertically, karst caves exhibit distinct layered distributions. These layers are primarily aligned with the ancient water table. The S91 unit lies within the karstic steep-slope zone of the Akekule Uplift. A near east–west-trending, nose-shaped structure defines the central part of the local upper unit. Overall, the structural high displays a gentle slope.
Unit S91 spans the Ordovician strata from bottom to top, including the Yingshan, Yijianfang, Qiaerbake, Lianglitage, and Santamu groups. The primary oil reservoir in the study area is hosted within the carbonate rocks of the Yijianfang and Yingshan groups. Reservoir spaces include five types: dissolution pores, intercrystalline pores, karst caves, weathering fractures, and tectonic fractures, with fracture–cavity systems representing the primary storage and permeability domains. The specific lithological combinations of the Ordovician strata are summarized in
Table 1.
4. Fracture–Cavity Unit Identification
Carbonate bedrock typically exhibits the “three-high” characteristics: high density, high seismic velocity, and high wave impedance. Its considerable burial depth, substantial thickness, and uniform composition result in minimal velocity variations. Consequently, seismic profiles often display weak reflection amplitudes. In contrast, fractures, dissolution cavities, and large karst cave systems reduce rock density, seismic velocity, and impedance. This reduction increases the contrast between the fracture–cavity body and the surrounding dense rock. It produces strong reflections in seismic offset data, which often appear as bead-like patterns. These patterns reflect the combined seismic response of large karst cavities and dense pore systems. Their identification and characterization typically rely on seismic attributes such as root-mean-square amplitude, reflection intensity, and amplitude variation rate [
3].
Reservoir genesis analysis indicates that fractures and fracture zones play a critical role in forming large caves and dissolution cavity systems. Fracture zones themselves, however, rarely serve as major oil and gas reservoirs. They function primarily as conduits for fluid migration and significantly enhance the connectivity of fracture–cavity networks. As a result, they strongly influence overall reservoir connectivity. This study treats large caves, dense dissolution cavity systems, and their associated fracture zones as an integrated system. To predict these targets systematically, structural gradient tensor attributes and seismic discontinuity attributes are applied. These methods enable comprehensive identification and precise characterization of fracture–cavity unit boundaries.
4.1. Cave Identification Based on Structural Gradient Tensors
Structural gradient tensors offer an effective approach for analyzing and characterizing the structural features within seismic data [
17]. The concept of structural tensors was originally developed in the field of image processing to distinguish planar regions, edges, and corners within images. In 2002, Bakker et al. introduced this method to seismic exploration, applying the structural gradient tensor algorithm to three-dimensional seismic interpretation. They also introduced an anisotropy parameter derived from this algorithm, primarily used to characterize faults and predict fractures [
18]. Subsequent studies have progressively refined the structural gradient tensor analysis method, which is now widely employed for reservoir identification and prediction.
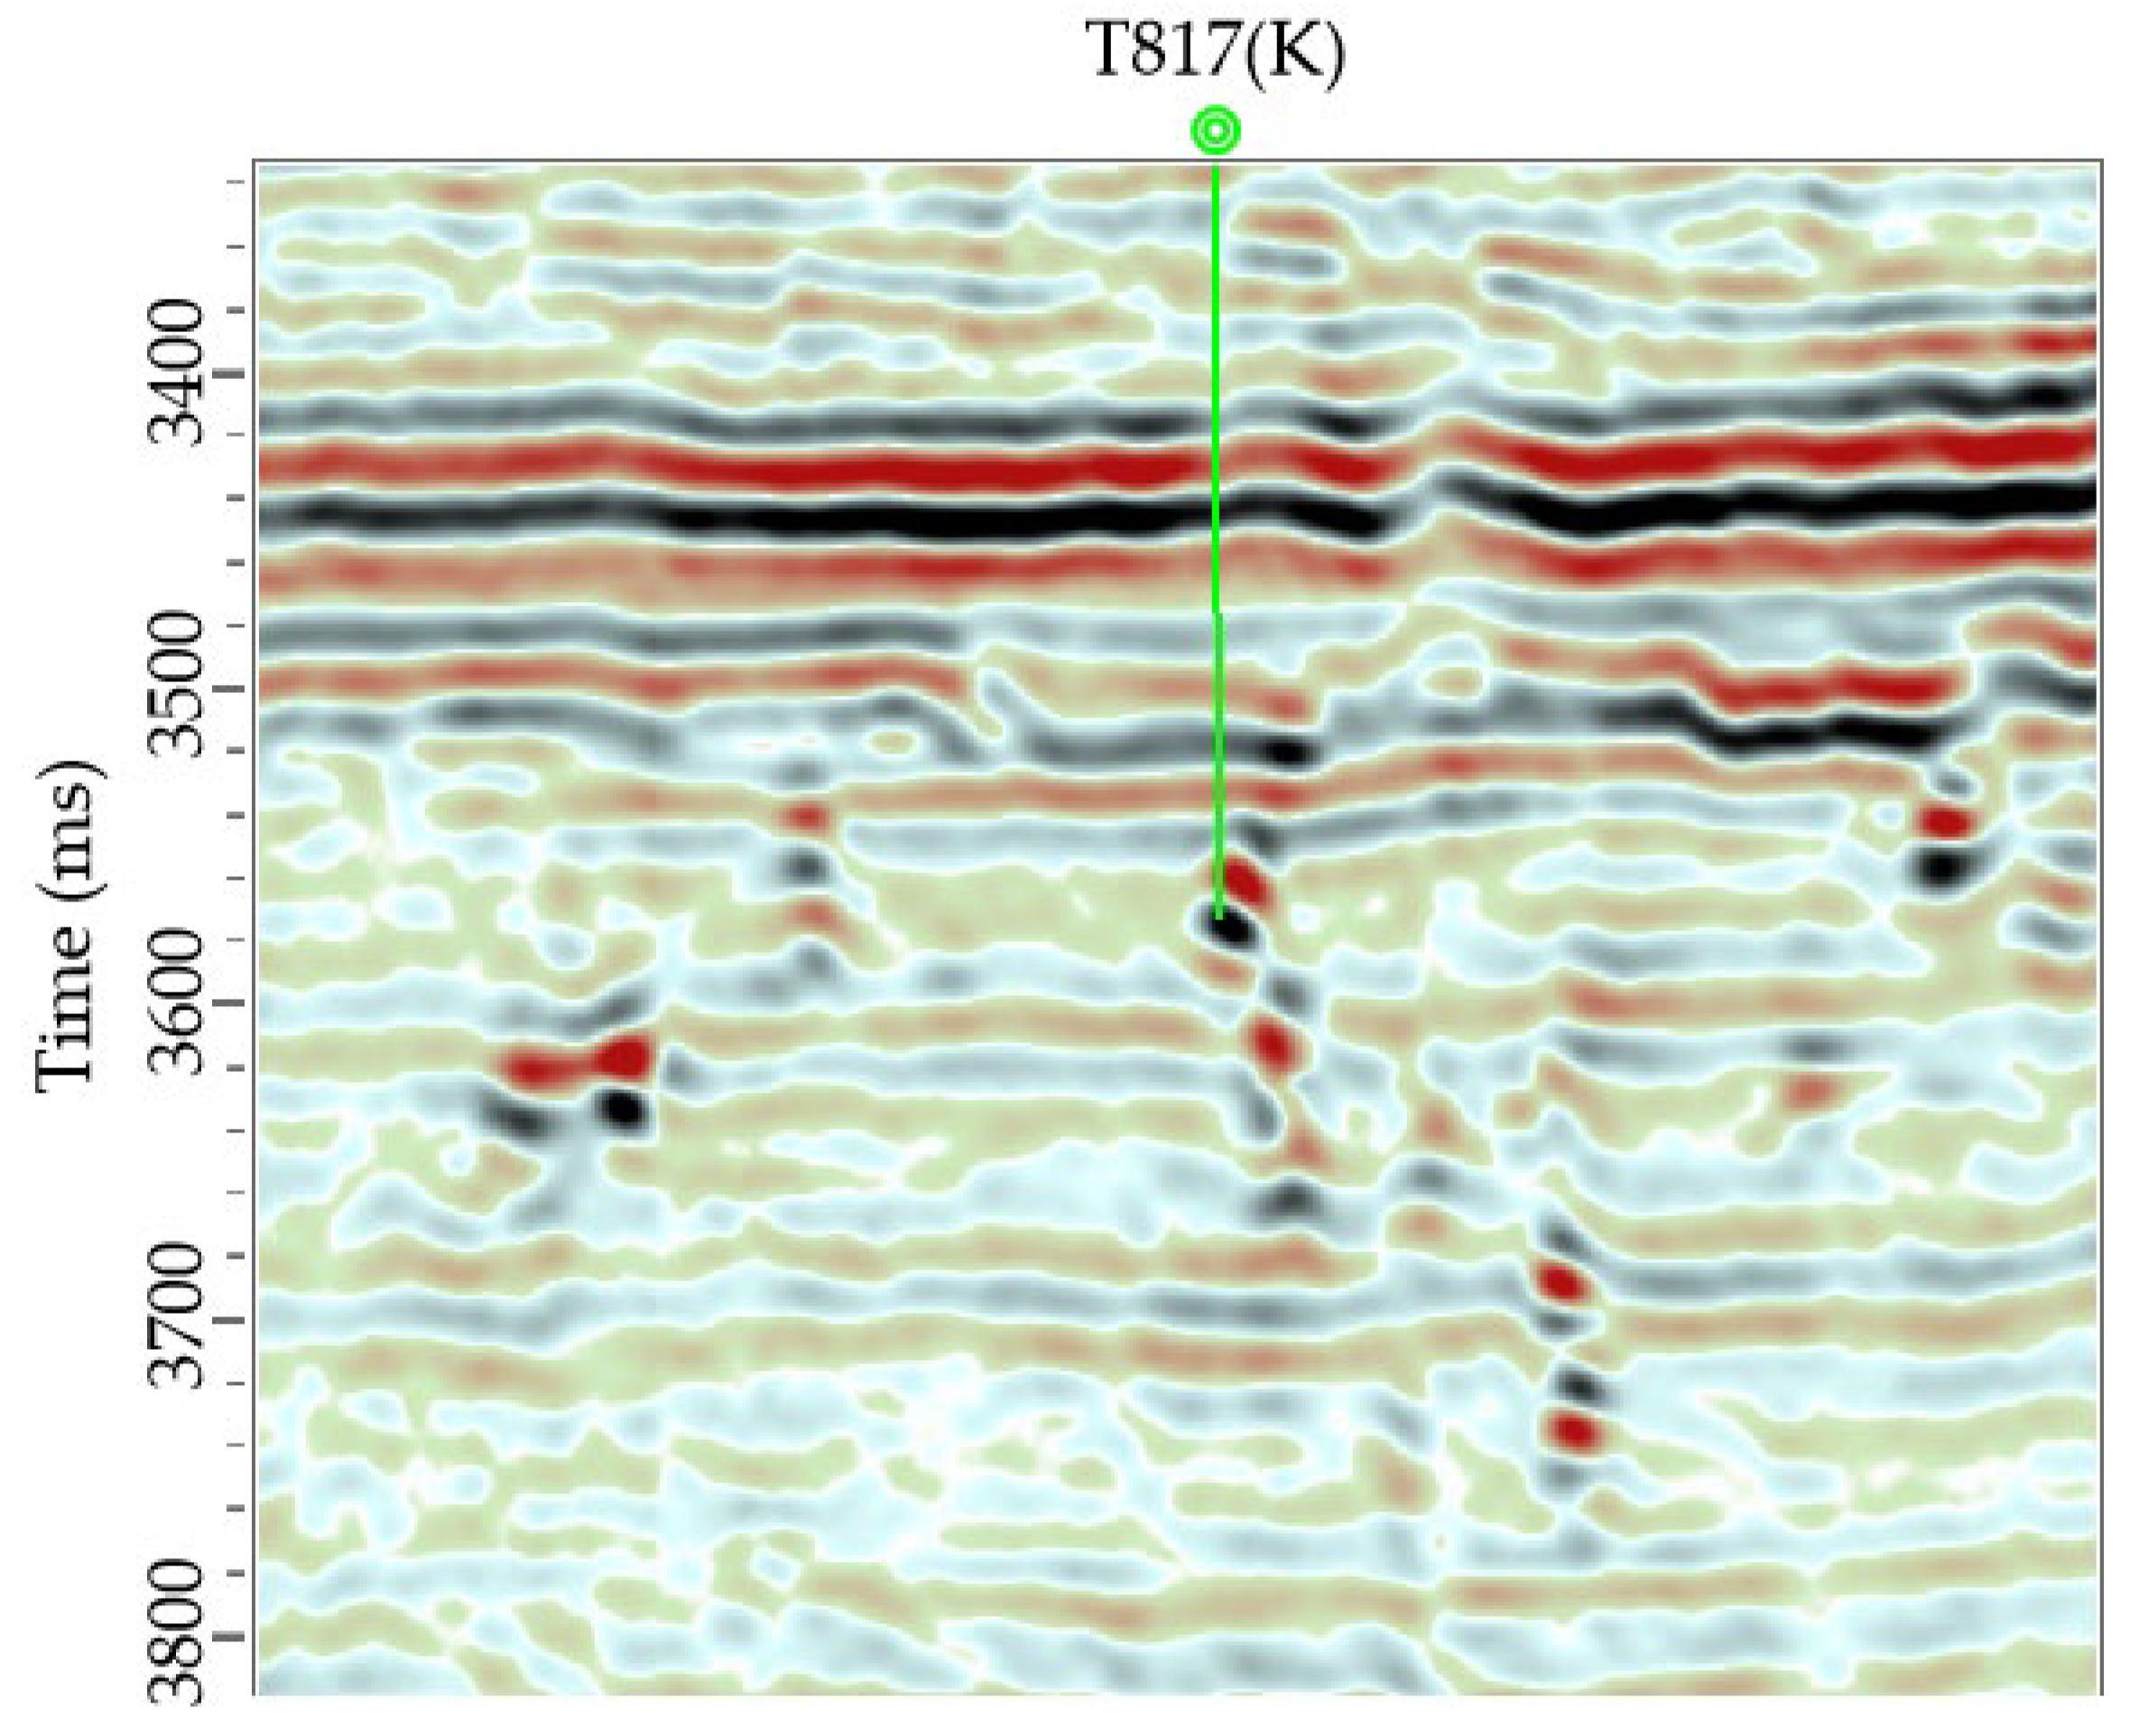
In the study area, fracture–cavity carbonate reservoirs are predominantly controlled by strike-slip fault systems. Reservoir space develops progressively. Fracture activity initially creates fracture zones. These zones are subsequently enlarged by dissolution, ultimately evolving into caves and dissolution cavities. On seismic profiles, large cave systems exhibit high-amplitude, bead-like reflections. These reflections serve as direct indicators of effective reservoirs (
Figure 3). Traditional characterization methods primarily rely on amplitude attributes. For instance, root-mean-square amplitude (RMSA) effectively highlights bead-like reflections. However, RMSA is also sensitive to continuous strong reflection axes. This sensitivity makes it difficult to distinguish bead-like reflections from horizontal reflections, hindering accurate delineation of cave boundaries. The structural gradient tensor method enhances this process by calculating gradients and constructing structural tensors from seismic data. This approach improves recognition of large cave system boundaries. It also evaluates the morphology and connectivity of fracture–cavity units and their relationship with surrounding rock. Thus, it supports accurate reservoir characterization. Drilling data from the study area were subjected to statistical analysis. Blowouts and gas anomalies identified during drilling and logging were mapped onto seismic profiles. Structural gradient tensor values were subsequently extracted at these locations. By integrating the distribution of strong bead-like reflections, a threshold value was established (
Figure 4). The results indicate that, in the Tarim S91 well area, structural gradient tensor values exceeding 3000 correspond to effective reservoir space.
4.2. Pore Identification Based on Stratigraphic Continuity
In contrast to the strong, bead-like reflections associated with large caves in seismic data, reflections from pore-type reservoirs are typically disordered or discontinuous, making them substantially more challenging to identify. These reservoirs are primarily formed through fluid-driven dissolution processes, with microscopic storage spaces comprising small-scale caves, dissolution pores, and dissolution-related fractures. Through core observations, well-log interpretations, and studies of small-scale pore distribution in outcrops, previous researchers have demonstrated that these pores preferentially develop along large caves, fault zones, or major faults, thereby forming a complex secondary reservoir network surrounding the primary reservoir space [
19].
The typically disordered or discontinuous seismic responses of pore-type reservoirs are more effectively captured by the stratigraphic continuity attribute, which provides a more accurate representation of their distribution [
6]. This study utilizes the stratigraphic continuity analysis method to detect variations in stratigraphic structure and discontinuity characteristics. This is achieved through the calculation of seismic waveform continuity parameters. The effective range of this attribute for characterizing pore-type reservoirs is calibrated using drilling and seismic data from the study area. The goal is to identify regions with well-developed pores.
Pore-type reservoirs predicted using the stratigraphic continuity attribute are predominantly located at the periphery of strong bead-like seismic reflections. They also occur along same-phase axis fault segments and within the disordered, weak-reflection zones surrounding the fault area (
Figure 5). This distribution closely corresponds to the small-scale pore development patterns reported in previous studies. This approach effectively overcomes the limitations of the structural gradient tensor method in detecting small-scale reservoir spaces. It provides critical technical support for the comprehensive characterization of fracture–cavity units. By integrating the identification results from both methods, a more precise characterization of pore locations, sizes, and distribution patterns can be achieved. This integration establishes a solid foundation for subsequent connectivity analysis.
4.3. Large-Scale Fault Identification
In fracture–cavity carbonate reservoir systems, large-scale faults do not serve as primary oil and gas storage spaces. However, they are critical structural elements that control the connectivity of the fracture–cavity unit flow network. Typical seismic responses of these fractures are characterized by discontinuities. These include co-directional axial displacement, waveform distortion, and abrupt amplitude changes. Consequently, the locations of these fractures can generally be identified through the analysis of seismic geometric structural attributes. Common techniques include coherence, curvature, and variance attributes.
Research indicates that caves in Unit S91 predominantly occur within fault zones or regions of intensive faulting. Karst features, including caves, are closely associated with faults. Large caves frequently form at the intersections of multiple fault sets. Deep, extensive regional faults also affect cave stratification. In such areas, cave depths deviate from typical layer patterns and are generally greater. Thus, regional faults strongly control both the spatial distribution and depth of cave development. In the study area, major faults are well developed. Conventional single-attribute methods are insufficient for clearly delineating fault morphology in densely faulted zones. To overcome this limitation, the RGB attribute fusion technique is employed to enhance fault recognition.
To achieve a high signal-to-noise ratio suitable for subsequent attribute calculations, the three-dimensional seismic data volume of the study area was processed using structure-oriented filtering. This method, based on the principle of anisotropic compensation, effectively preserves the edge features of geological bodies. It also significantly enhances fracture details and suppresses random seismic noise. Following the evaluation of multiple attributes, variance, coherence, and maximum curvature were selected for RGB attribute fusion. In seismic attribute analysis, the coherence algorithm highlights discontinuities between adjacent seismic traces, such as amplitude and phase variations. It thereby emphasizes boundary information associated with tectonic and geological features (
Figure 6a). Low coherence values generally indicate geological anomalies, including faults, fractures, or unconformities. The maximum curvature attribute quantifies the geometric deformation of subsurface layers. Its absolute value is positively correlated with the degree of curvature. Elevated curvature values often correspond to pronounced folds or fault zones (
Figure 6b). The variance attribute captures the lateral heterogeneity of strata or rock types by quantifying variations in the similarity of seismic signals between adjacent traces within a local range (
Figure 6c). Such heterogeneity may arise from lithological changes, small faults, or variations in pore fluids.
By employing a multi-attribute fusion approach, information from various geometric structural attributes can be comprehensively integrated. This allows fracture features to be characterized with greater accuracy. This study conducts a comprehensive attribute analysis using RGB attribute fusion technology. Also known as three-primary-color display technology, RGB attribute fusion maps three distinct types of data onto the primary colors red (R), green (G), and blue (B). Using a defined mapping function, these colors are adjusted to generate an RGB image. Each value in the fused image corresponds to a unique color. The primary advantages of this technology include high fusion speed and strong capability to extract and integrate structural and lithological information from seismic attributes. Furthermore, RGB fusion markedly enhances image integrity by providing richer and more detailed textural information. This greatly improves the discernibility of geological features. Current applications demonstrate that RGB attribute fusion technology provides outstanding performance in key areas, including small fault identification, geological anomaly detection, and reservoir prediction [
20,
21,
22]. The variance attribute (R), coherence attribute (G), and maximum curvature attribute (B) are combined to form RGB attributes. By adjusting the hue, saturation, and brightness parameters, fault information can be effectively emphasized. Parameter testing indicates that setting the hue to 80, the saturation to 50, and the brightness to 0 enhances the visual presentation of the cross-sectional structure. This adjustment makes its morphological characteristics more distinct (
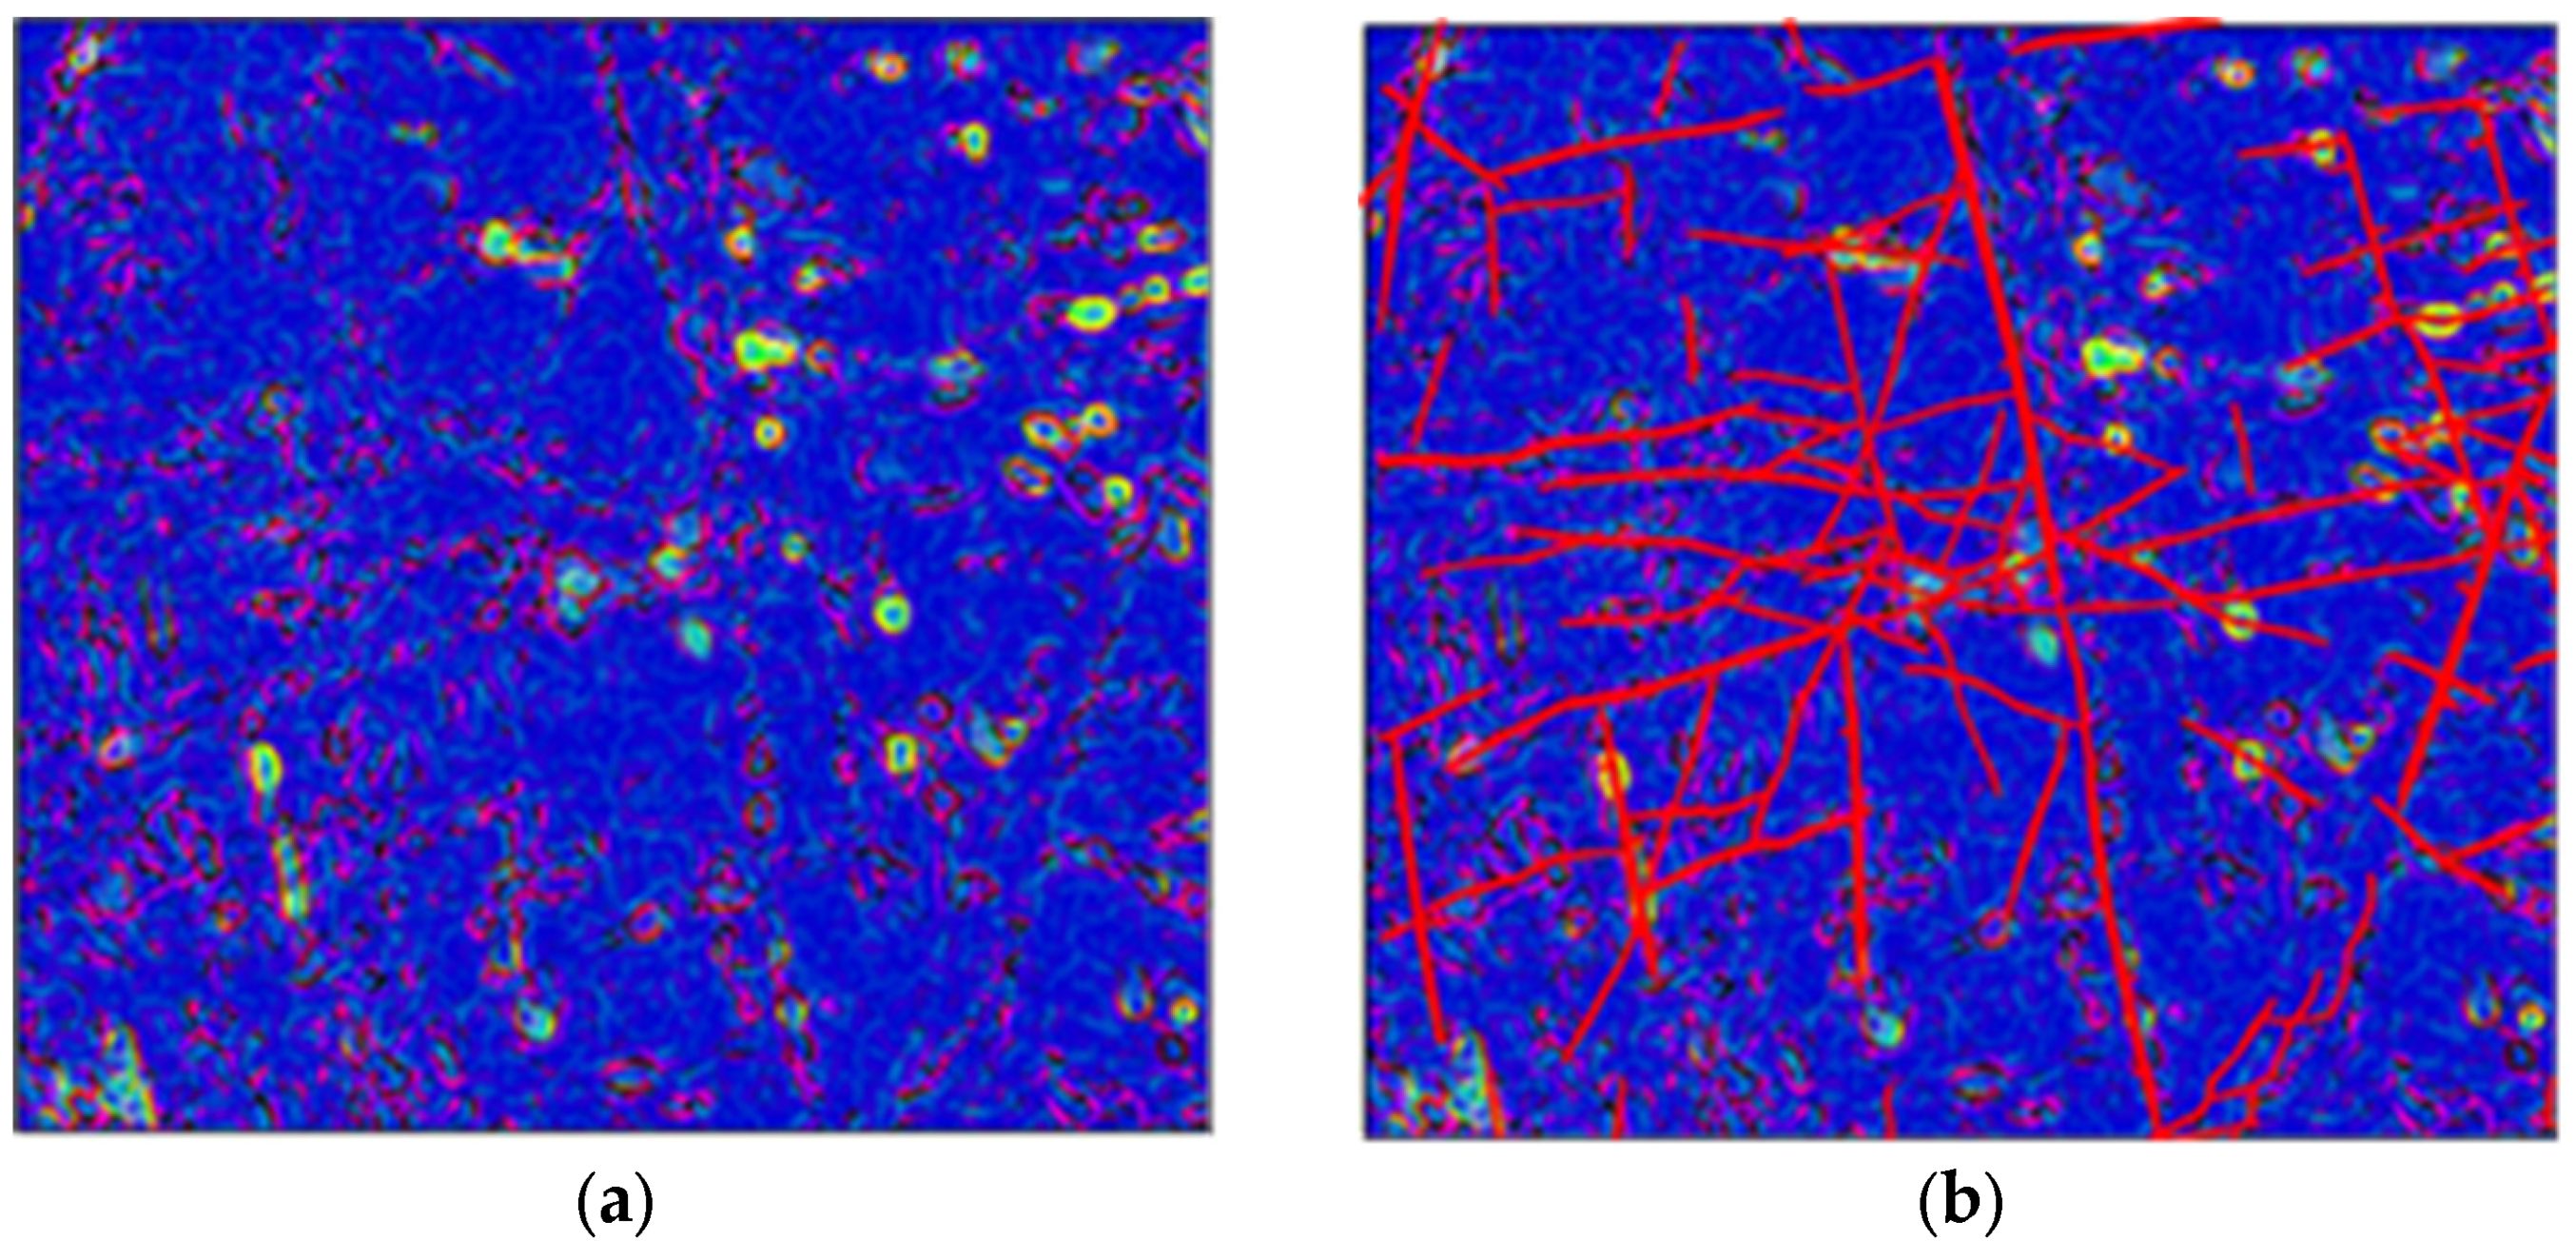
Figure 7a). This fused dataset provides a robust foundation for large-scale fault analysis. Multi-angle attribute analyses—such as cross-sections, along-strike profiles, and slices—are conducted in combination with geological feature constraints. These analyses allow thorough interpretation of the morphology, scale, and distribution of large-scale faults. As a result, detailed characterization of large-scale fault systems is enabled (
Figure 7b).
4.4. Fracture Development Zones Identification
In fracture–cavity carbonate reservoirs, accurate characterization of fracture zones is essential for oil exploration and development. These fracture-rich areas not only provide effective storage space but, when combined with caves and pores (e.g., fracture–cave networks), also significantly influence reservoir heterogeneity and effective storage capacity, directly affecting the accuracy of reserve estimates. As critical connecting channels between fracture–cavity units, the spatial distribution of small fractures provides a fundamental basis for identifying connected units and understanding communication pathways between wells. Characterizing these small fractures enables the prediction of dominant flow paths, thereby mitigating the risks of ineffective circulation and water intrusion during injection and production operations, while providing essential support for optimizing well-group injection and replacement parameters.
To accurately determine fracture distribution and density characteristics, ant-tracking and fracture simulation analyses were conducted using the previously extracted geometric structural properties. Geometric structural properties, including coherence, curvature, and variance, not only reveal large-scale fault information but also provide detailed fracture data. Ant bodies derived from geometric structural attributes can rapidly delineate fracture development locations and clearly characterize the distribution of fracture systems. By configuring active ant-tracking parameters (
Table 2), the ant bodies generated from different structural attributes were systematically analyzed and compared. By integrating the results of large-scale fault characterization, the ant colony outputs that most effectively identify fracture development zones were ultimately selected. However, because the ant-tracking algorithm relies on point-to-point tracking, its fracture identification results are susceptible to noise interference. Consequently, this method provides only qualitative fracture predictions and does not generate quantitative estimates.
Post-stack seismic data, the most commonly used type, are typically employed to qualitatively characterize fracture development through basic seismic attributes. Chen et al. proposed a quantitative fracture prediction technique based on tensor direction fields, enabling the use of post-stack seismic data for quantitative estimation [
23]. The present study applies this technique for quantitative fracture prediction.
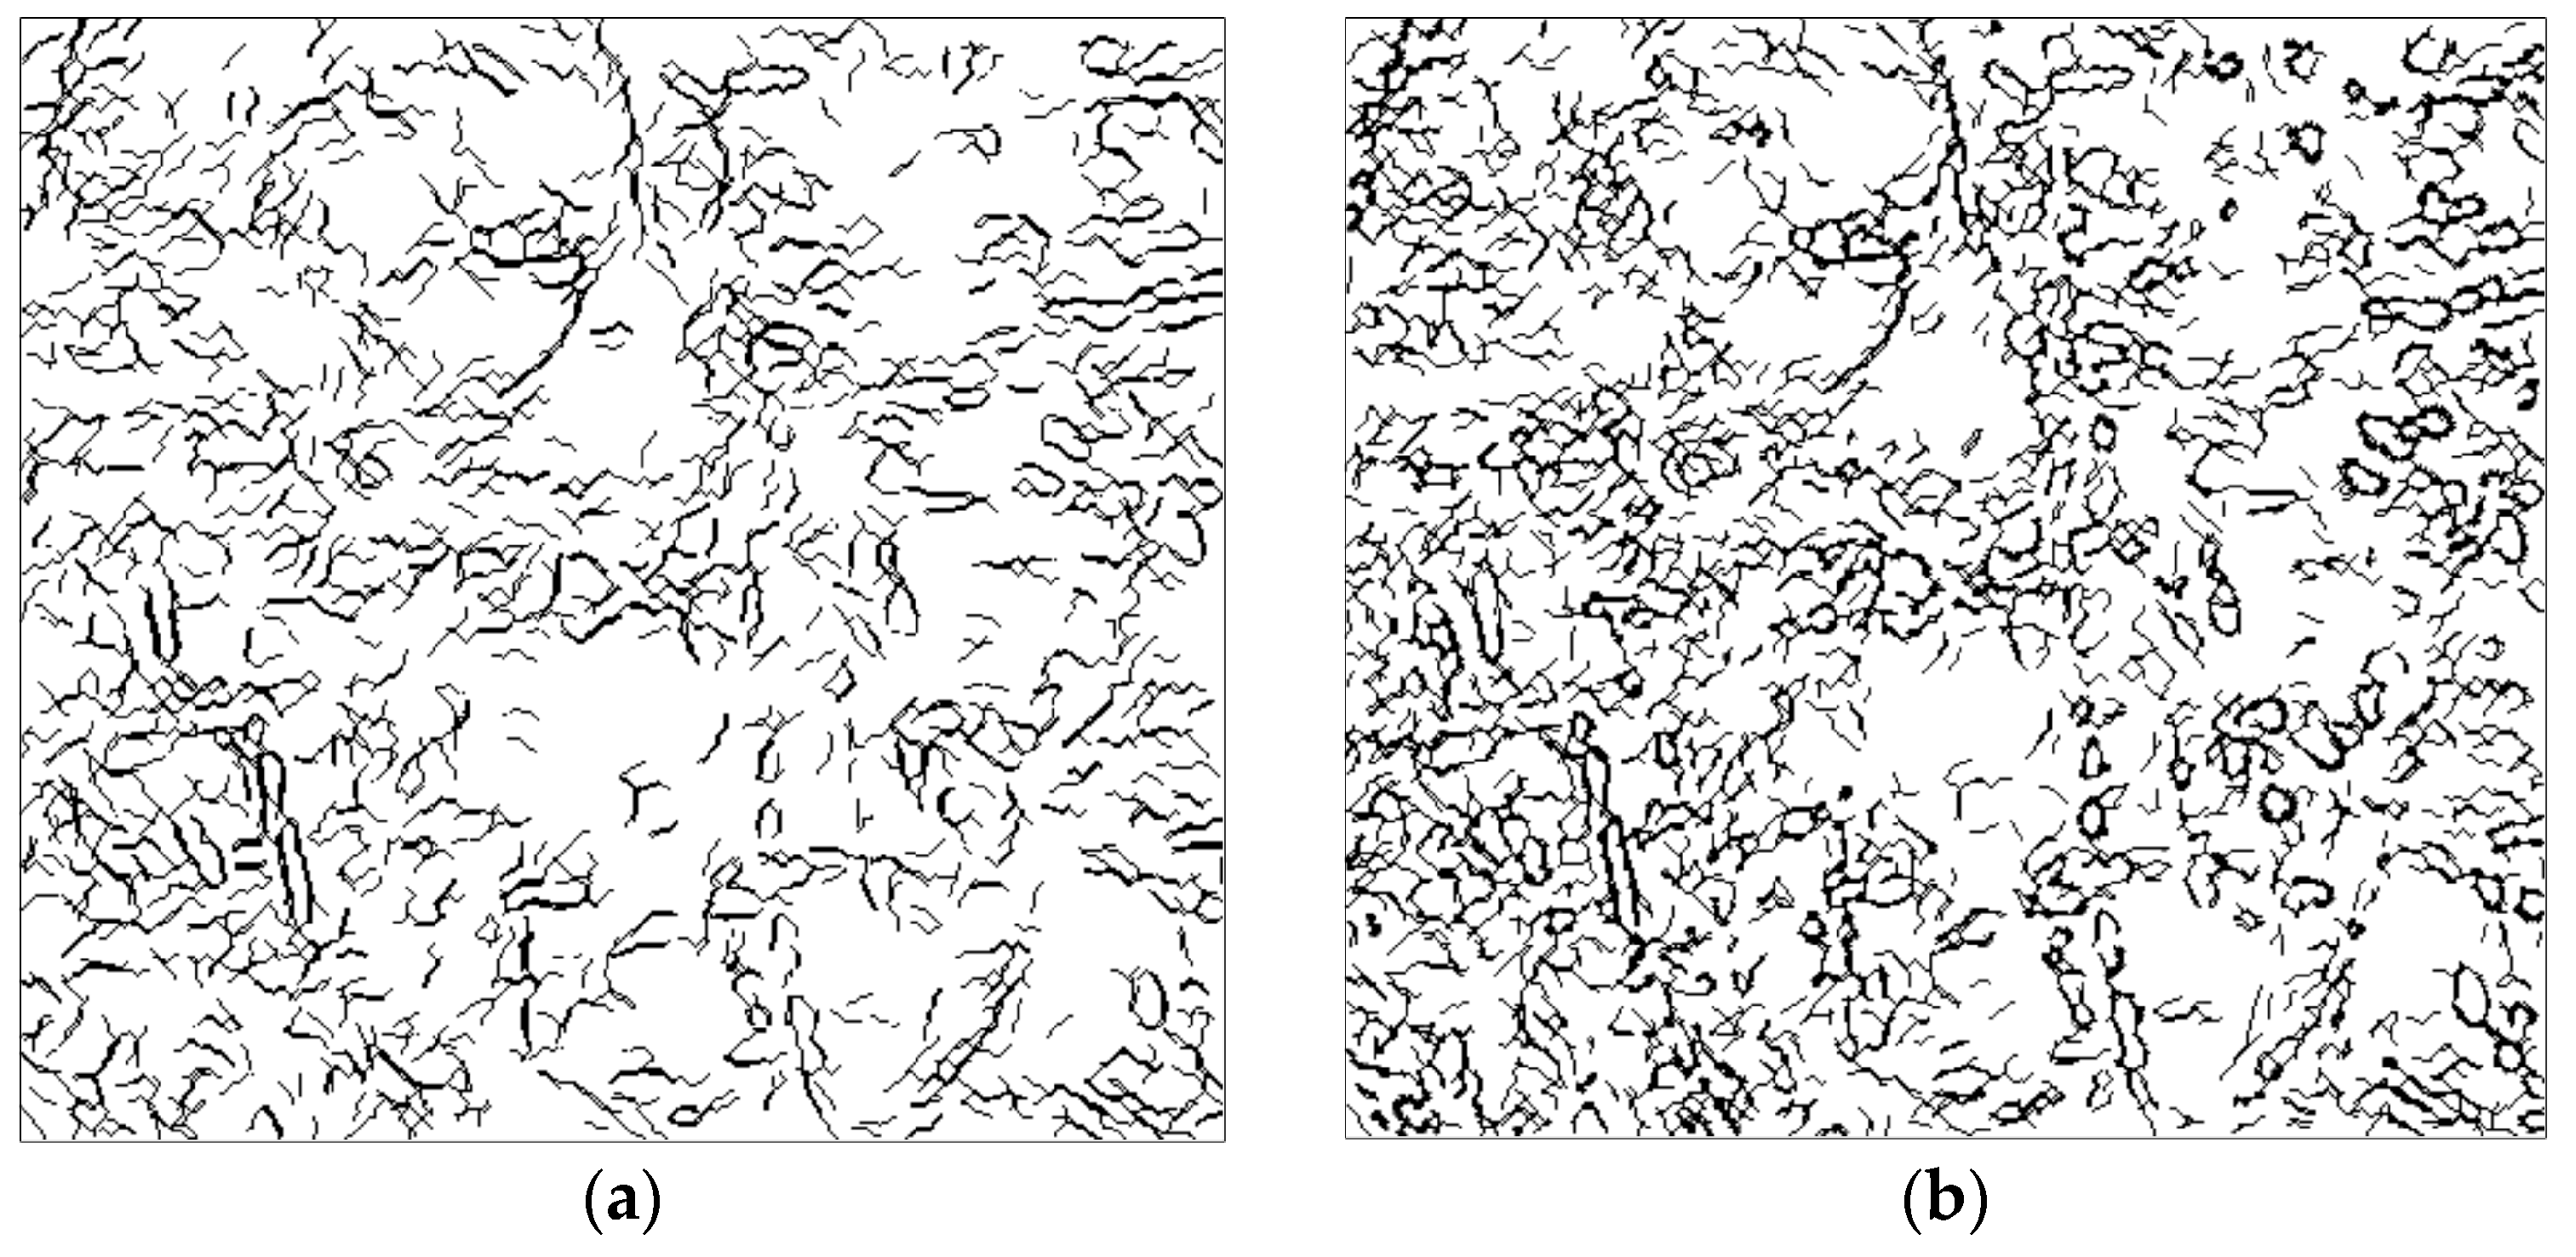
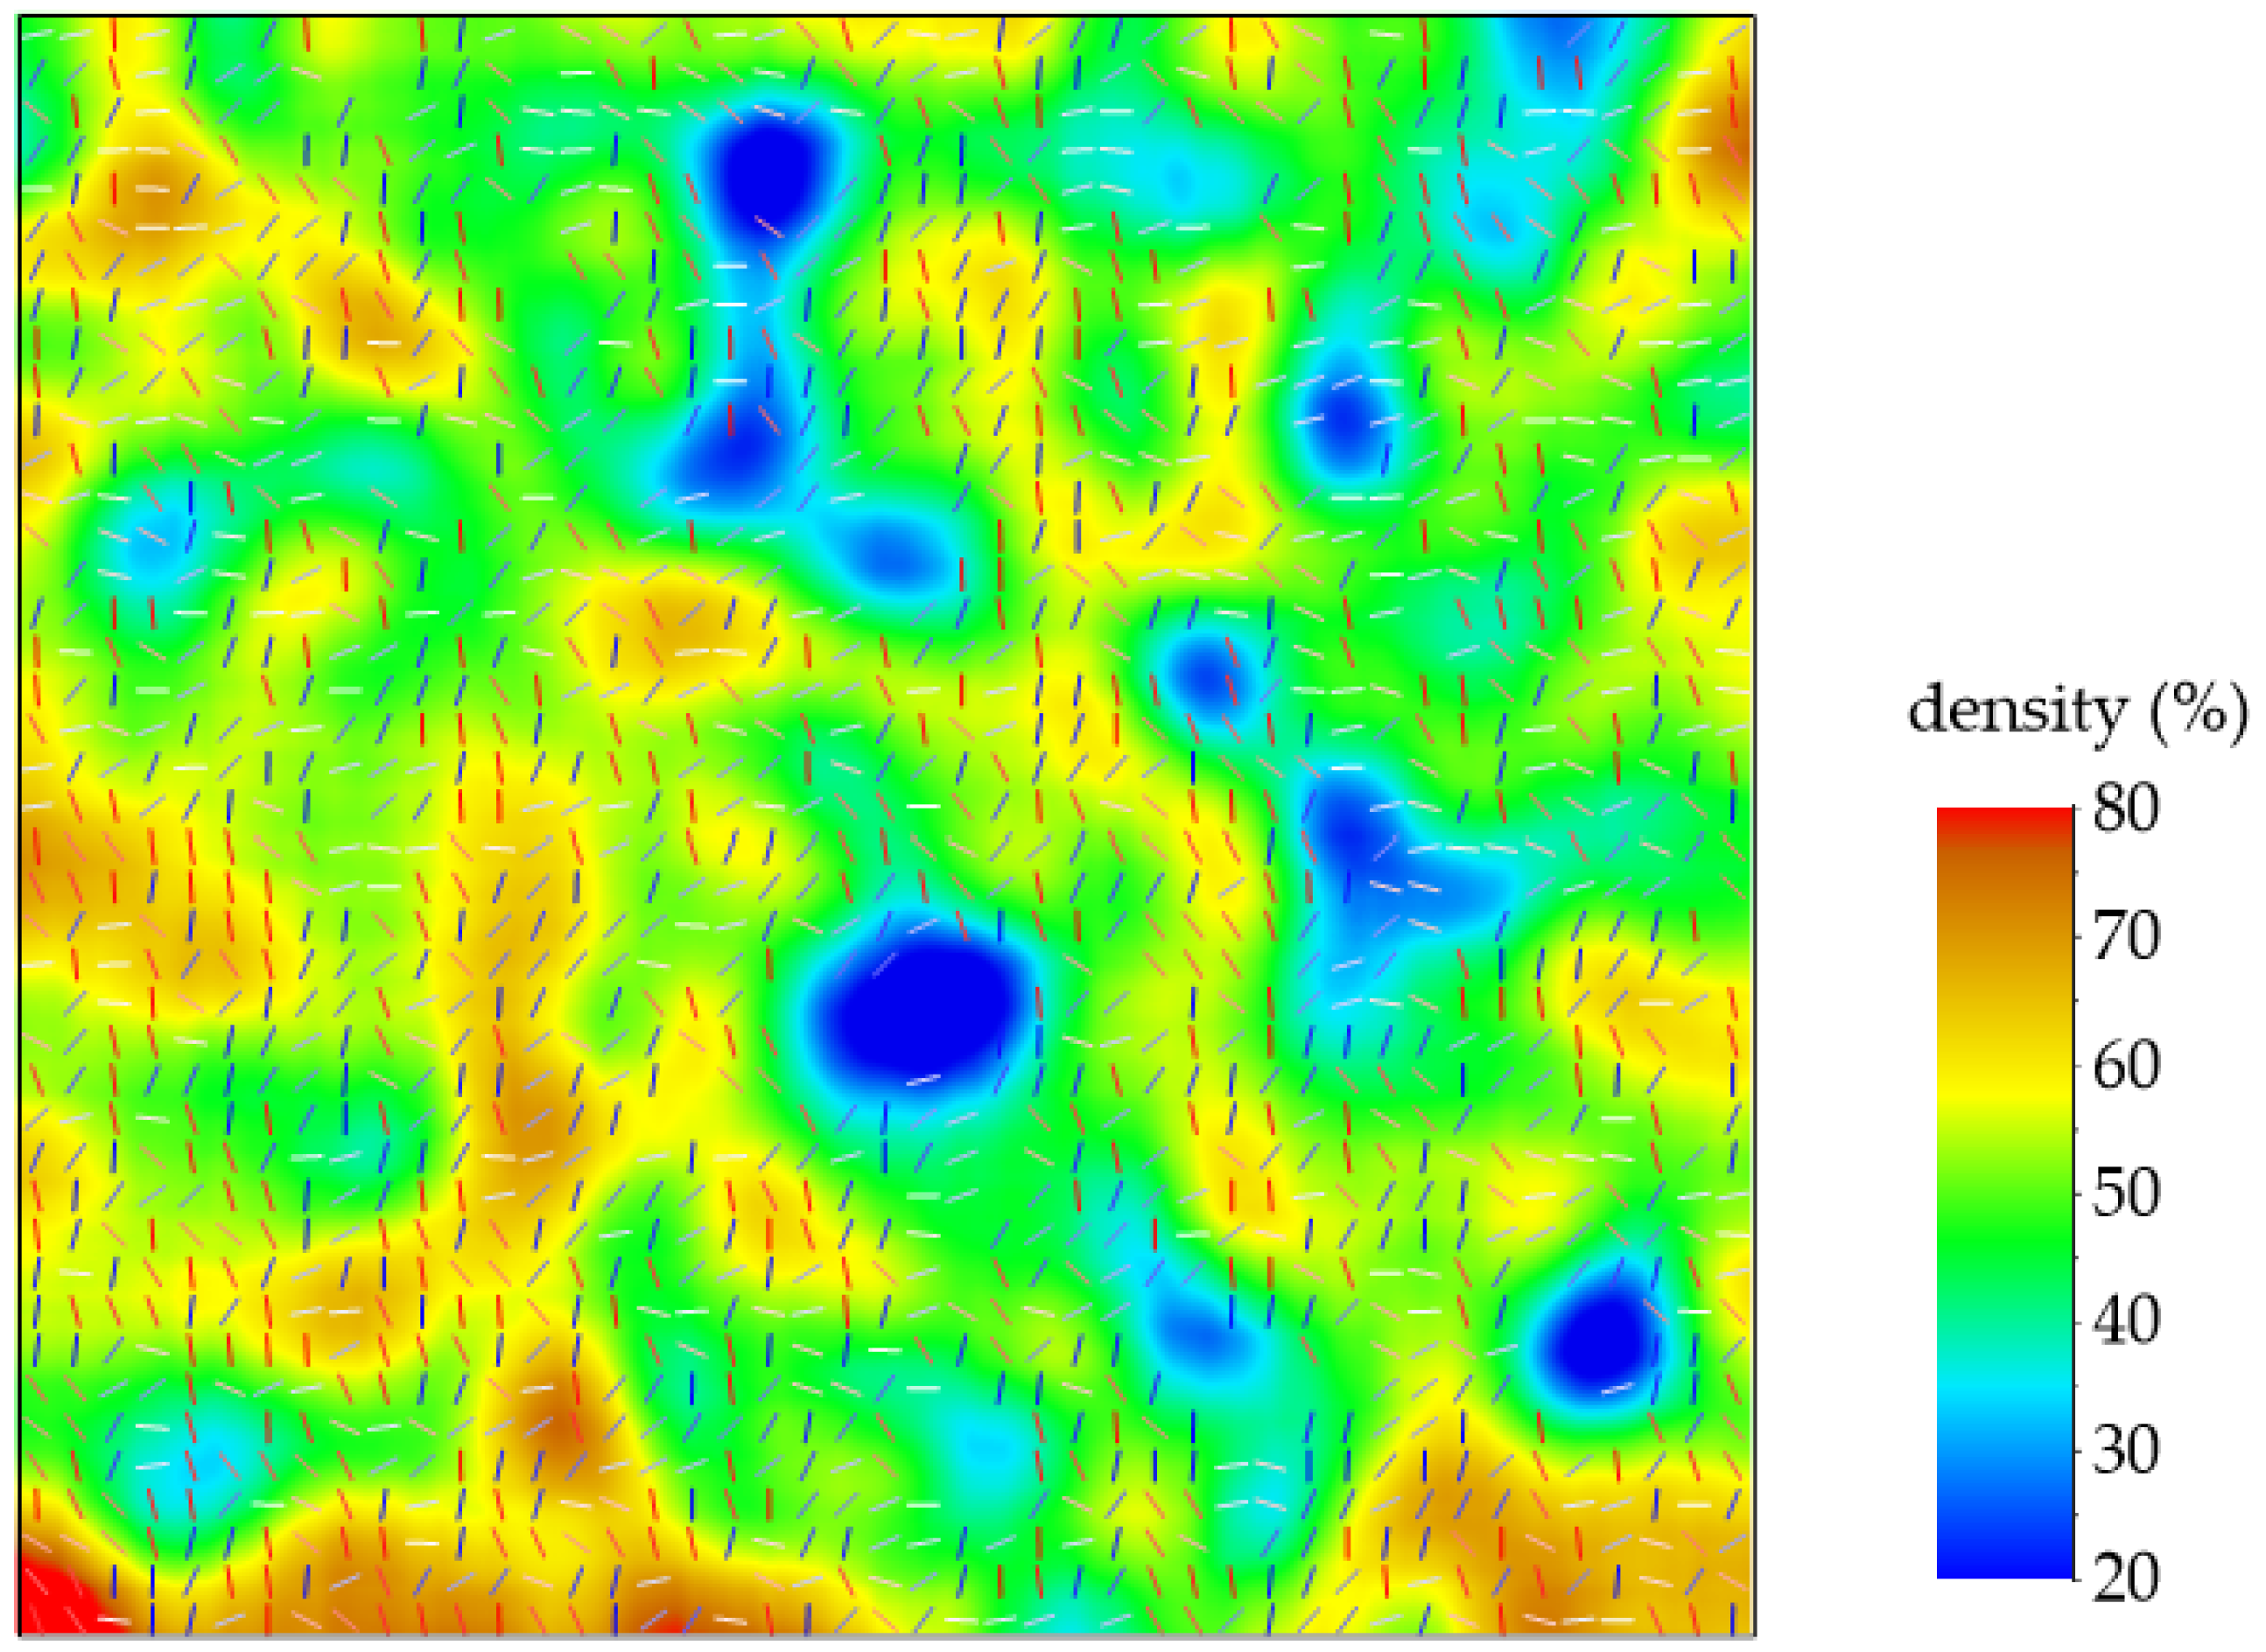
The implementation of quantitative fracture prediction comprises four main steps. (1) A high-precision coherence volume is generated from post-stack seismic data using a third-generation eigenvalue-based coherence algorithm. (2) An ant colony tracking algorithm based on directional consistency is applied, followed by post-processing of the coherence volume under ridge-line enhancement constraints to further enhance coherence. (3) Using the simulated point tensor direction field, weighting kernel functions for each direction are calculated within the neighborhood, and an optimized clustering method is applied for weighted fitting to derive fracture attribute values along the principal orientations of the simulated points. (4) The simulated fracture attribute values are used to statistically analyze the relative fracture density within a unit radius and the primary orientations of fracture development, thereby providing reliable information on relative fracture density and fracture orientation.
As shown in
Figure 8, the fracture distribution simulated using this method is consistent with the ant-tracking results regarding the overall locations and distribution patterns of fractures. The simulation results provide greater detail, indicating that this method is reliable for fracture prediction in the study area. Based on the simulation results, relative fracture density and fracture orientation can be determined (
Figure 9), with short lines representing fracture orientation. This method therefore provides a quantitative foundation for fracture prediction.
5. Fracture–Cavity Unit Connectivity Analysis
5.1. Static Connectivity
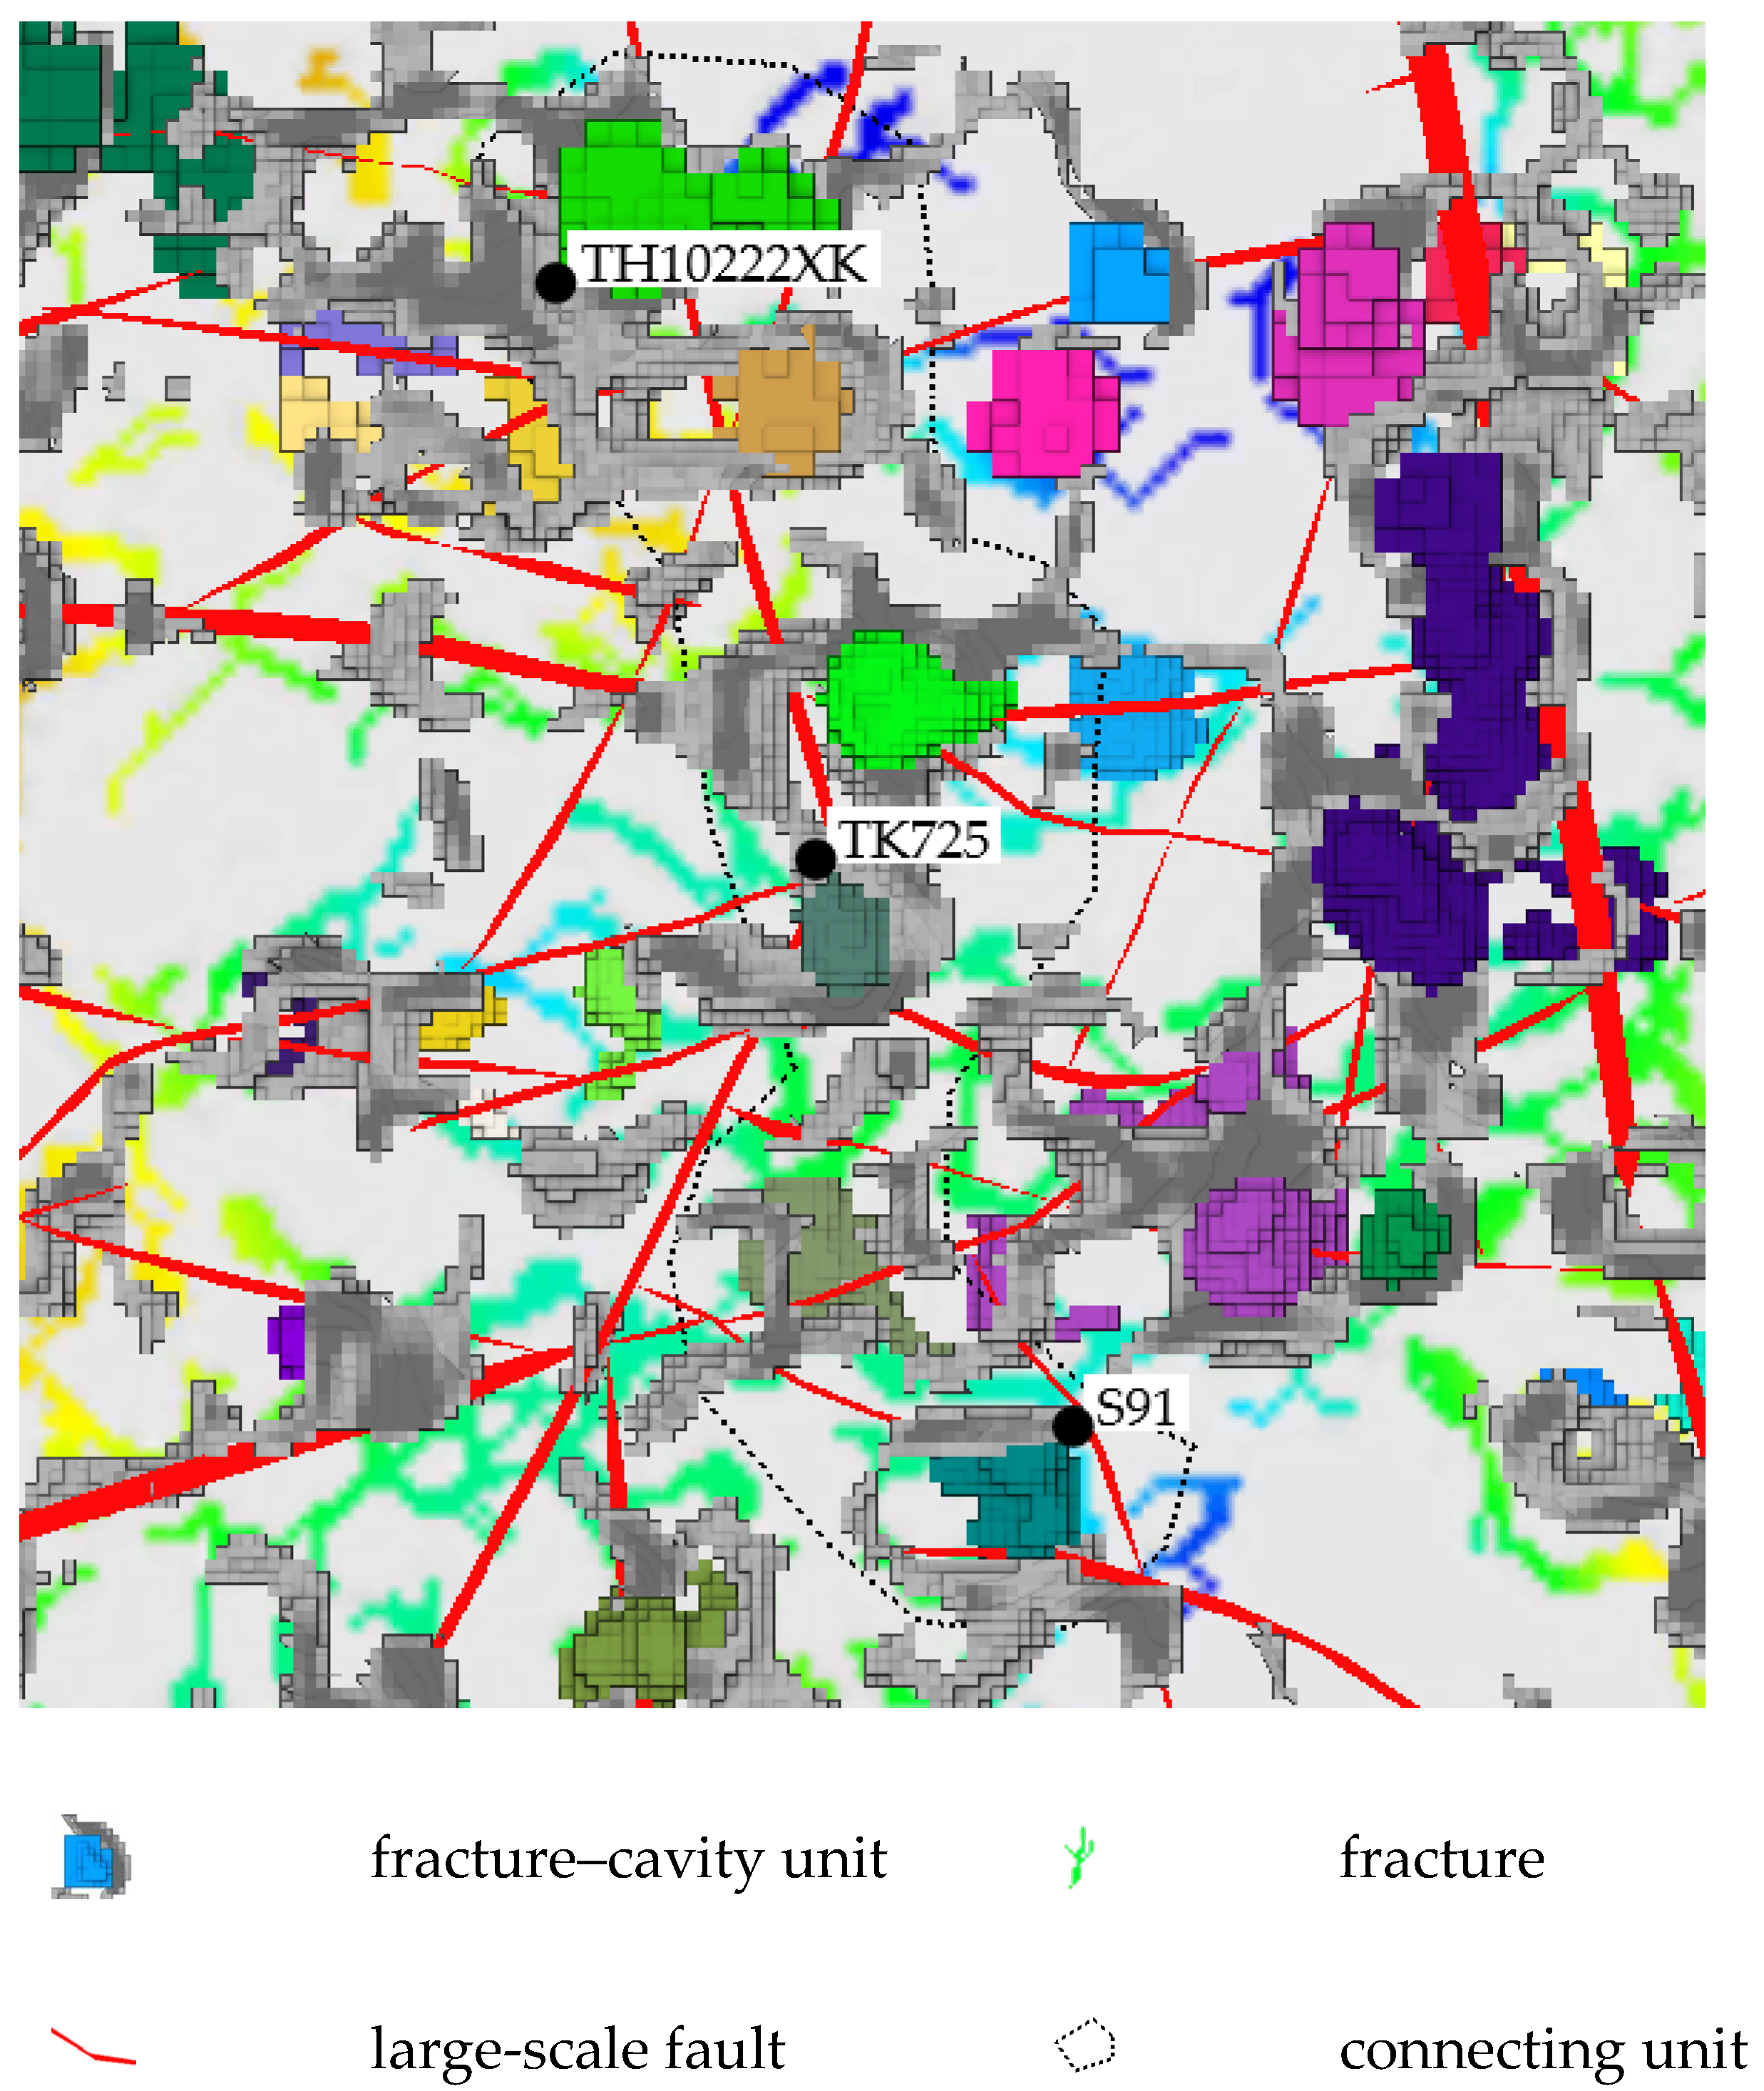
Accurately characterizing the reservoir’s internal spatial structure requires a detailed analysis. This analysis includes examining the spatial distribution and structural relationships of fracture–cavity units and fracture systems. It also involves assessing connectivity within the fracture–cavity units. Three-dimensional spatial carving is conducted on fracture–cavity units and fractures. Based on the connectivity revealed by these carving results, and in combination with actual oil-field production experience, the study area is partitioned into several connectivity units. The three-dimensional modeling results obtained through this analytical process illustrate the reservoir’s spatial structure. They also show the relationships among fracture–cavity systems. This analysis reveals potential interwell connectivity patterns.
The study area demonstrates a static connectivity relationship among wells S91, TK725, and TH10222XK. These wells are classified within the same connected well cluster. TK725 is located approximately 750 m north of TH10222XK and roughly 730 m south of S91. As shown by the three-dimensional carving results of cavities, pores, and fractures (
Figure 10), the fracture–cavity units within this well group are distributed discontinuously. Large-scale faults intersect the area, and dense fractures develop throughout. The karst cavities and pores between TH10222X(K) and TK725 are discontinuous. A large-scale north–south–oriented fault intersects both wells. Fracture density in the interwell zone exceeds 50%. A potential connectivity channel exists between TH10222X(K) and TK725 along this fault. Karst development between S91 and TK725 is discontinuous. Large-scale faults do not directly link the two wells. Pores are densely distributed between the wells, with fracture density exceeding 50%. Potential connectivity channels may exist between S91 and TK725 via fractures and pores.
5.2. Dynamic Connectivity
The “potential connectivity” indicated by static models may differ from the “effective connectivity” observed during production. Therefore, validating static model predictions using dynamic production data is essential. This validation enables accurate evaluation of reservoir fluid flow. It also supports optimization of injection and production well networks and the formulation of effective adjustment strategies. This section analyzes dynamic production responses to validate the reliability of the previously discussed static connectivity methods and results. The analysis provides a robust scientific foundation for assessing reservoir connectivity.
During the high-volume water injection at Well TH10222X(K) in 2005, the adjacent Well TK725 exhibited a notable response: well pressure increased by 1.25 MPa, daily oil production rose by 18 tons, and the pressure rise rate reached 0.57 MPa per 10 days. The tracer monitoring peak persisted for 10 days, consistent with the well’s dynamic response cycle, thereby indicating clear waterflood connectivity between Wells TH10222X(K) and TK725.
On 20 February 2012, following the resumption of a daily injection rate of 50 m3 at Well TH10222X(K), Well TK725 exhibited significant dynamic changes over 11 days, during which a cumulative total of 450 m3 of fluid was injected. By 1 March, oil pressure at TK725 had increased by 1.4 MPa, daily crude oil production had risen by 23 tons, and the water cut had decreased by 34%. The response timing corresponded with the peak observed in the previous tracer monitoring.
In 2015, a composite displacement test confirmed the connectivity between Wells S91 and TK725: from 21 August to 14 September, Well S91 was injected with 800,000 cubic meters of gas, supplemented by 3619 cubic meters of water. Eighteen days later, without any adjustments to oil nozzle parameters or dilution processes, oil pressure at Well TK725 increased by 2.1 MPa, indicating a clear dynamic response. This operation resulted in a cumulative increase in crude oil production of 601 tons.
Comprehensive dynamic monitoring data indicate that the S91–TK725–TH10222XK well group established an effective displacement channel during production. This finding is consistent with the connectivity predicted by the static fracture–cavity reservoir model (
Table 3), thereby confirming the reliability of the reservoir connectivity analysis.
5.3. Connecting Well Group Division
The results of the static and dynamic connectivity analyses for the verification well groups are consistent. This consistency demonstrates that the characterization method developed for fracture–cavity reservoirs is reliable, effective, and well-suited for evaluating interwell connectivity. Building on this conclusion, additional interwell static connectivity analyses were conducted for wells in areas lacking production dynamic data. These wells were subsequently identified and classified into multiple interconnected well groups. These findings provide a solid geological basis for predicting the distribution of remaining oil. They also support optimization of injection and production well networks and the formulation of strategies to enhance recovery rates.
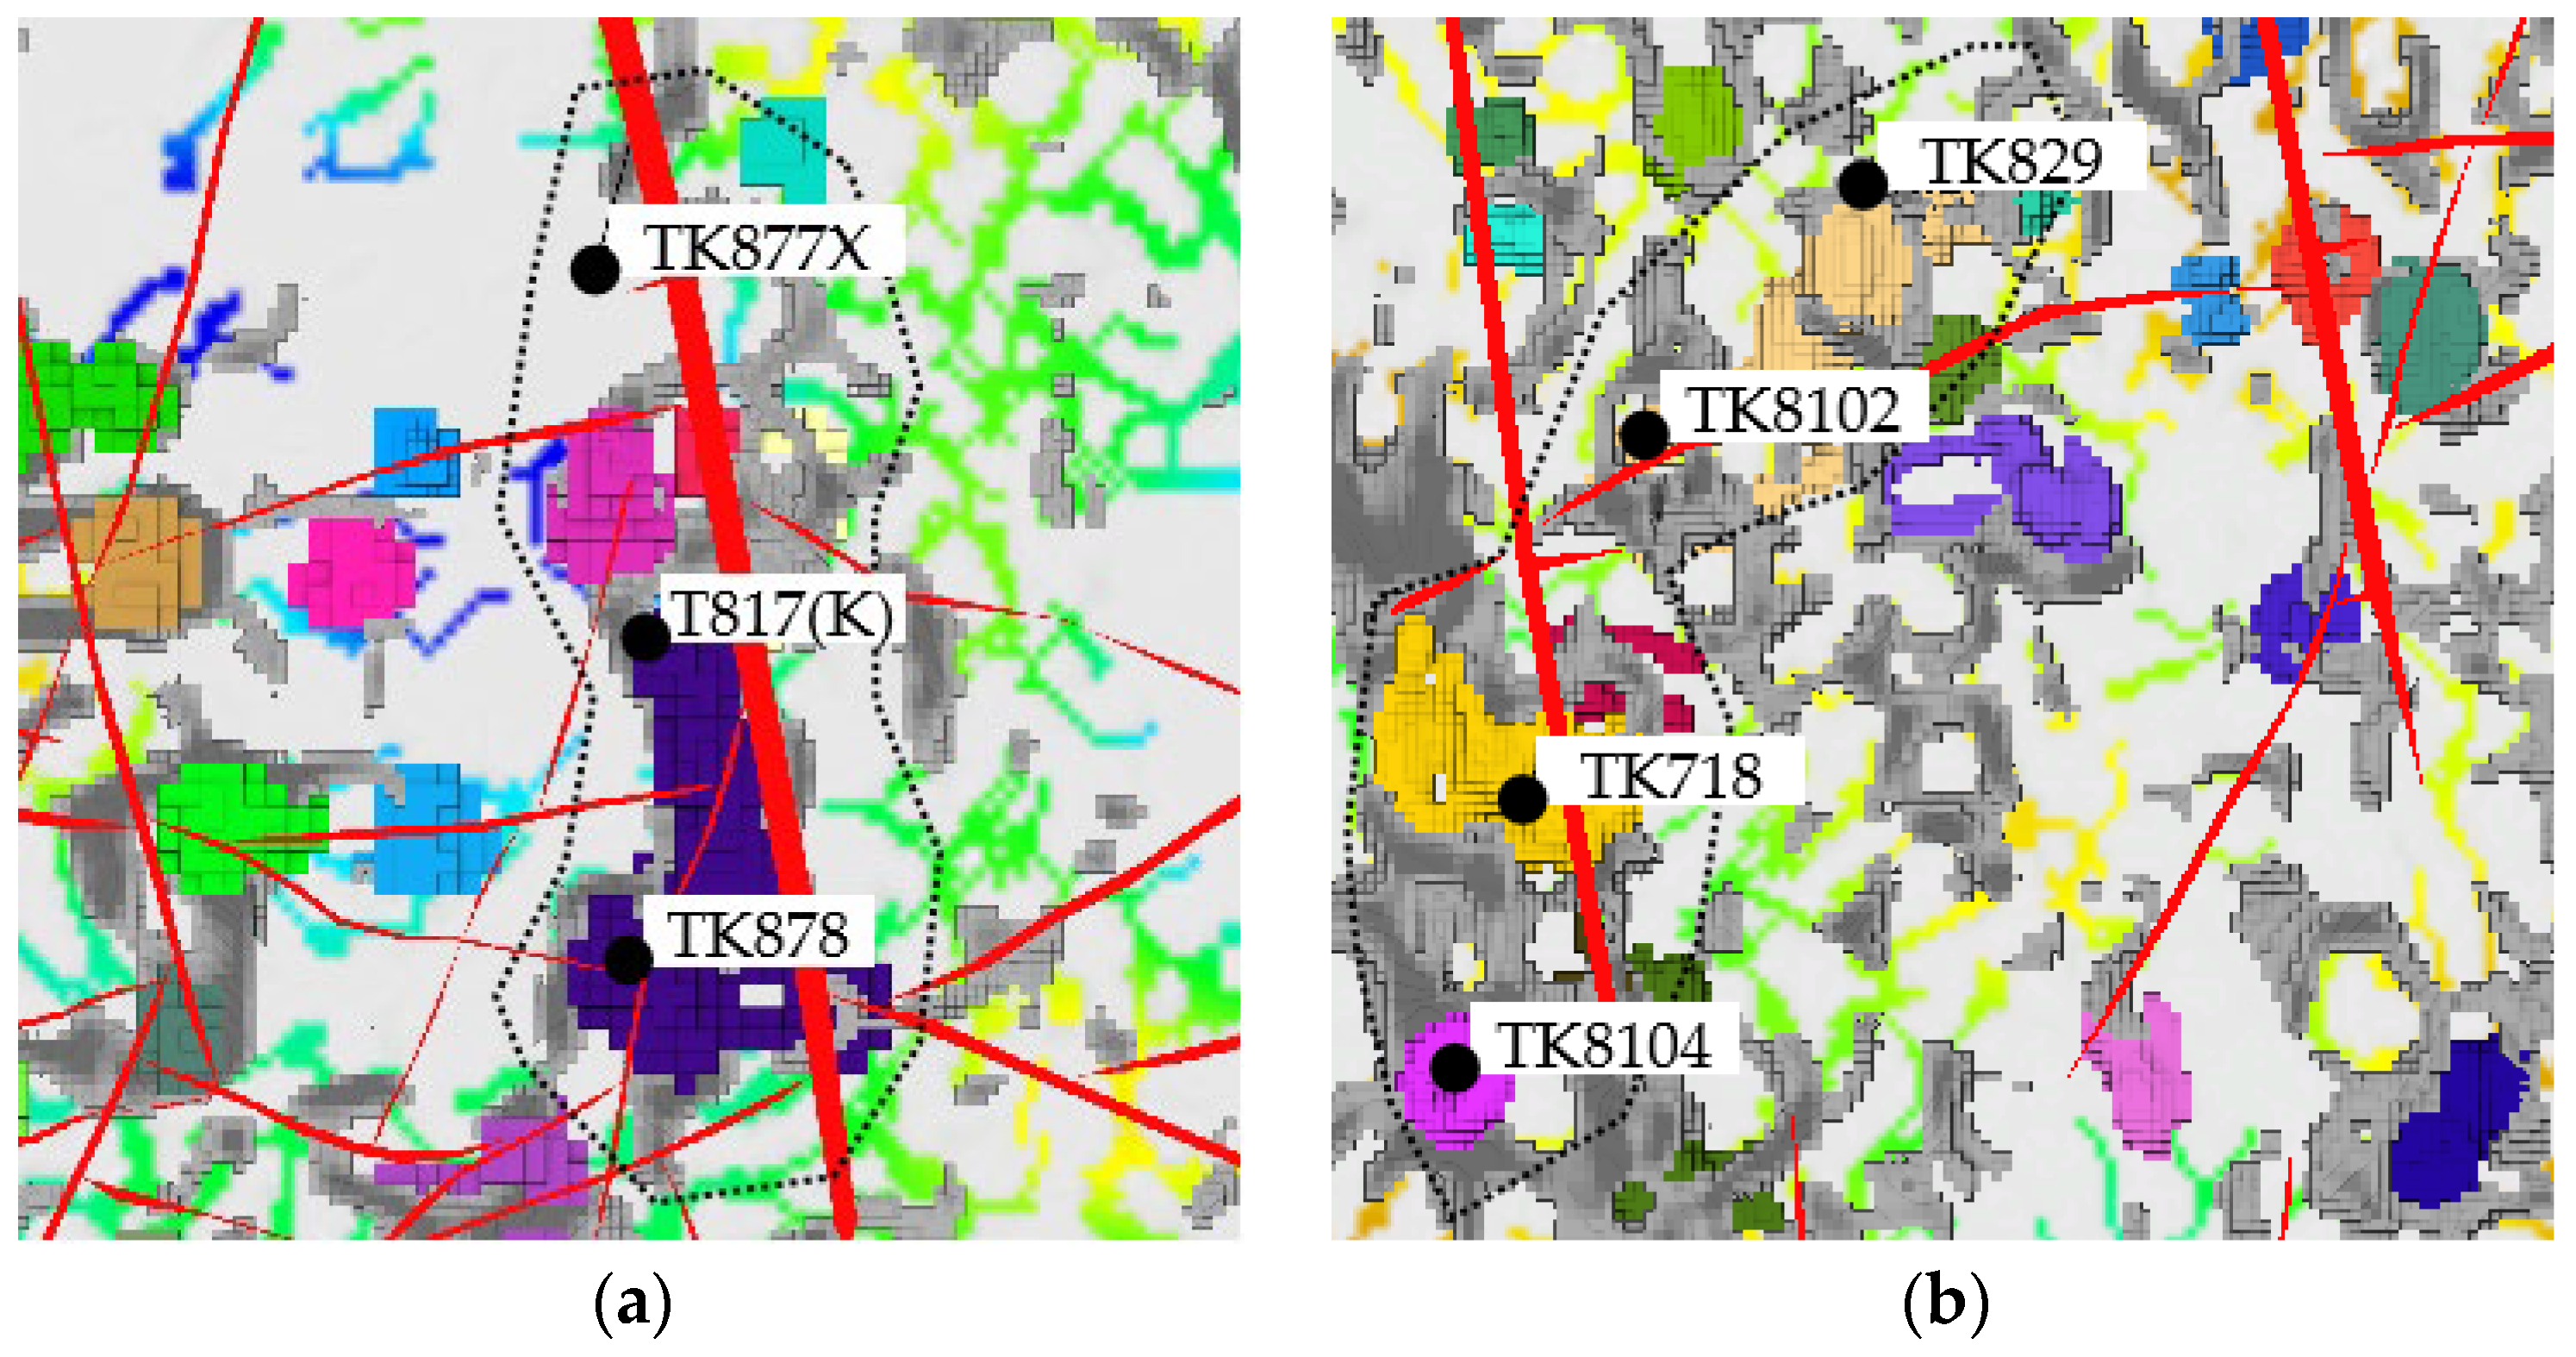
The comprehensive analysis conducted in this study reveals two typical connectivity patterns, which are primarily controlled by large-scale faults and karst–fracture complexes (
Figure 11).
Pattern 1: Fault-dominated linear connectivity
This pattern is characterized by wells arranged linearly along major faults. Both Wells T817(K) intersect the same karst cavity system, confirming their direct connectivity. This cavity system is connected to a major fault structure. The trajectory of the inclined Well TK877X directly intersects this fault. Consequently, this nearly north–south-trending fault serves as the primary pathway linking the TK877X and T817(K) well groups.
Pattern 2: Composite Connectivity Governed by the Fracture–Cavity Network
This pattern is characterized by discontinuously distributed karst cavities. These cavities are interconnected through a dense network of pores and fractures. Wells TK829 and TK8102 intersect the same karst cavity, indicating direct connectivity. Wells TK718 and TK8104 intersect distinct karst cavities. However, the abundant pores distributed between them provide effective connectivity pathways. Furthermore, two intersecting faults and a high-density fracture zone (55%) are present between Wells TK8102 and TK718. This fault–fracture system constitutes an additional potential pathway for enhanced connectivity.
6. Discussion
The S91 unit of the Tarim Oilfield represents a typical shallow-covered karst fracture–cavity reservoir. It exhibits pronounced heterogeneity and complex connectivity. These characteristics are key geological factors limiting the efficient exploitation of residual oil. This study systematically investigates the reservoir connectivity mechanisms. An integrated approach combining multi-scale static and dynamic methods is employed.
Well-logging data provide information only at specific well locations. In contrast, the three-dimensional seismic data employed in this study allow comprehensive identification of carbonate fracture–cavity reservoirs across a regional scale. This approach offers more extensive geological insights. Nevertheless, due to the resolution limitations of seismic data, the method is limited in detecting small-scale geological structures. Consequently, seismic techniques cannot accurately predict the distribution of karst cavities of all sizes. They reliably identify only larger-scale cavities that generate distinct seismic responses. Spectral analysis and property testing, combined with comparisons to logging, image logging, and production data, confirm that the structural gradient tensor and stratigraphic continuity attributes achieve sufficient accuracy in identifying karst cavities and pores to meet the practical requirements of current oilfield production.
In characterizing karst cavities and pores, multiple seismic attributes were evaluated. Among them, amplitude-based attributes—particularly root-mean-square (RMS) amplitude—are effective in highlighting the bead-like responses associated with karst cavities. However, the target interval is overlain by a strong reflection layer (3400–3500 ms,
Figure 3), whose lower boundary lies close to the underlying karst cavities. RMS amplitude emphasizes strong bead-like reflections, but it is also highly sensitive to continuous strong reflection events. This sensitivity can exaggerate the influence of the overlying layer, obscure cave boundaries near the interface, and hinder accurate delineation of cave geometry. When seismic waves propagate through fluid-bearing reservoirs, they undergo low-frequency attenuation, which reduces the dominant frequency. The resulting “low-frequency shadow” beneath fracture–cavity bodies serves as an important seismic indicator of hydrocarbon accumulation. Frequency-based attributes can therefore assist in identifying fluid-bearing fracture–cavity bodies. However, these attributes are highly susceptible to noise interference. The presence of thin interlayers may introduce tuning effects that cause misleading frequency variations. These limitations reduce the accuracy of frequency-based identification in the study area. In contrast, the application of structural gradient tensor and formation continuity attributes enables more precise characterization of cave and pore boundaries. This approach effectively suppresses interference from strong reflective layers and allows a clearer delineation of the spatial distribution of fracture–cavity units. The feasibility of this method was validated by integrating cavity and pore identification results from logging, image logging, and related datasets, with the achieved accuracy meeting practical application requirements.
RGB multi-attribute fusion technology offers a significant advantage by generating synergistic information through intuitive color mapping. This reduces the interpretational ambiguity inherent in single-attribute analyses. The seismic attributes of variance, coherence, and maximum curvature are assigned to the red, green, and blue channels, respectively, to generate a superimposed display. Compared with single-attribute analysis, which reveals only one aspect of the subsurface, this method delineates the boundary contours of geological bodies more clearly. The technique leverages the human eye’s sensitivity to color differences to emphasize subtle geological features. It also markedly enhances both the efficiency and accuracy of large-scale fault interpretation. Applied to the study area, this method significantly enhanced interpretation accuracy in zones with dense faulting.
Common seismic methods for fracture prediction include post-stack seismic attributes, pre-stack wide-angle data, and rock physics modeling. Among these, post-stack attributes are generally employed solely for qualitative characterization of fractures. In this study, a quantitative fracture prediction method based on tensor direction fields is employed. This method enables estimation of relative fracture density and orientation from post-stack seismic data. Fracture prediction using post-stack data is sensitive to factors such as signal-to-noise ratio and migration imaging, which can reduce modeling accuracy. Tests in the S91 unit indicate that the predicted fracture distributions generally align with ant-tracking results. They also provide more detailed structural information. Accordingly, this technique demonstrates strong applicability in the study area.
Dynamic production data provide direct evidence of connectivity and associated dynamic parameters. However, their application is constrained by high costs and time delays in data acquisition. In contrast, static connectivity analysis based on 3D seismic data offers broader spatial coverage. It also enables the identification of potential connectivity pathways. Integrating dynamic and static approaches allows simultaneous consideration of real-time production responses and spatial structural information. This combined approach enhances the accuracy and reliability of regional connectivity evaluations. Large-scale faults and dense fracture networks are the primary controls on the static connectivity of fracture–cavity units. These networks interconnect isolated units, forming potential pathways for fluid migration. Dynamic production data from the S91–TK725–TH10222XK well group confirm interwell fluid flow. This demonstrates that the fracture network functions as an effective displacement channel, in agreement with the static connectivity model. The consistency between dynamic production results and the static geological model validates the reliability of 3D spatial carving technology for delineating fracture–cavity systems and connectivity channels. The dynamic connectivity results align closely with the static geological model, confirming the reliability of the 3D spatial carving technique for inferring fracture–cavity relationships and connectivity pathways.
Despite the discrete spatial distribution of the reservoir, the highly heterogeneous connectivity network—controlled by the fracture–fracture system—can form locally efficient flow units. Mapping the distribution patterns of these connectivity pathways provides a critical geological basis for the targeted recovery of residual oil. These findings offer valuable guidance for optimizing injection–production strategies and enhancing overall recovery rates. In reservoir management, identifying dominant flow paths enables precise monitoring and control. This helps prevent premature breakthrough and inefficient circulation of injected fluids. Consequently, displacement efficiency and sweep volume in water- and gas-injection projects are enhanced. Based on the spatial distribution of fracture–connectivity units, the existing well network can be optimized. Directional or horizontal wells can target high-permeability channels. Water-blocking and profile-control measures can be implemented in low-efficiency zones. These measures support targeted recovery of residual oil and enhance overall recovery rates.
The connectivity evaluation framework developed in this study integrates static and dynamic data. It provides a valuable reference for similar highly heterogeneous carbonate reservoirs. This framework can inform injection–production optimization, measurement strategies, and enhanced recovery practices. Nevertheless, certain limitations exist. Seismic resolution constraints create blind spots in identifying small-scale fracture–cavity pairs. This may result in overlooked reservoir space. Fracture prediction outcomes depend on seismic data quality, with increased uncertainty in areas exhibiting low signal-to-noise ratios. Although dynamic production data were employed for validation, their representativeness is limited and influenced by production regimes. Current research integrates geological, logging, seismic, and production data. This integration improves identification accuracy and reduces multi-solution ambiguity. Future studies could incorporate higher-frequency seismic, wellbore seismic, or electromagnetic data. They could also develop multi-scale data fusion algorithms. In addition, sensitivity and risk analyses of connectivity on development dynamics could be conducted through numerical simulation. Such efforts would further enhance the robustness and predictive capability of connectivity evaluation results.
7. Conclusions
The S91 unit of the Tarim Oilfield is a fracture–cavity reservoir developed through karstification in a shallowly covered area. The reservoir exhibits high heterogeneity and complex connectivity among fracture–cavity systems. Despite high utilization and recovery levels, considerable residual oil potential remains.
Structural gradient tensor and stratigraphic continuity attributes are integrated to delineate cave–pore boundaries. They also reveal the spatial distribution of fracture–cavity units. RGB fusion is applied to identify large fractures. This approach integrates coherence, maximum curvature, and variance attributes. It substantially enhances the clarity and continuity of fracture imaging. In the study area, fracture–cavity units exhibit discontinuous spatial patterns. Connectivity is governed by large-scale faults and dense fracture networks. Ant-tracking and fracture simulation techniques are employed to identify fracture development zones. They are also used to characterize the connecting channels between fracture–cavity units.
Three-dimensional spatial carving technology is employed to visualize fracture–cavity units and associated fractures. This method effectively reveals the internal spatial structure of the reservoir. It also shows the organization of fracture–cavity systems. In the S91–TK725–TH10222XK well group, fracture–cavity units exhibit discontinuous distributions. They are intersected by extensive fracture systems and dense fractures. These fractures form a network that interconnects the fracture–cavity units. This network establishes potential static connectivity channels.
Production dynamic data from the S91–TK725–TH10222XK well group confirm interconnectivity. They also validate effective displacement pathways during production. These dynamic responses corroborate the static characterization of potential connectivity within the fracture–cavity reservoir. The consistency between dynamic and static results further reinforces the reliability of the connectivity analysis.
This study conducts a regional connectivity analysis across the study area. The area is divided into multiple connected well groups. This approach reduces the cost of acquiring production data from individual wells. It also provides a geological basis for optimizing fracturing and injection–production operations. Additionally, it supports prediction of the distribution of remaining oil.
