Abstract
Deer antler-derived medicinal materials, including antler velvet, antlers, and deer antler base, exhibit differential therapeutic efficacy across developmental stages, though their molecular mechanisms at the proteomic level remain uncharacterized. This study employed Data-Independent Acquisition (DIA) quantitative proteomics to systematically analyze protein profiles in sika deer antler velvet, antlers, and deer antler base. Comparative analysis revealed 3154 differentially expressed proteins (DEPs, 95% upregulated) between antler velvet and antlers, which were significantly enriched in Ribosome Biogenesis (e.g., Polyadenylate-binding protein), oxidative phosphorylation, and neurodegenerative disease pathways. In the comparison of deer antler base versus antlers, 1024 DEPs (92% upregulated) were identified, primarily involved in proteolysis (e.g., ACTC protein), glycolysis, and complement and coagulation cascades. Between deer antler base and antler velvet, 2749 DEPs (87% downregulated) were enriched in Thioredoxin domains, cytoskeleton regulation, and RNA-binding functions. Subcellular localization demonstrated antler velvet proteins predominantly distributed in the cytoplasm (37.6%) and nucleus (19.6%), while deer antler base proteins showed marked enrichment in extracellular regions (19.7%) and cytoskeletal components. As the first comprehensive proteomic characterization of these materials, this study identifies ribosomal proteins and complement pathway-related proteins as key biomarkers, thus establishing a scientific foundation for precise authentication, quality control, and efficacy–mechanism interpretation of deer antler-derived medicines. It further highlights antler velvet’s neuroprotective potential and deer antler base’s immunomodulatory applications.
1. Introduction
Deer antler-derived medicinal materials include antler velvet, antlers, and deer antler base. Antler velvet refers to the young antlers of male sika deer (Cervus nippon Temminck) or red deer (Cervus elaphus Linnaeus) prior to ossification, which are covered with dense hair. Antler velvet is harvested by sawing during the summer and autumn seasons. After processing, it is dried in shade or by baking. Antler velvet is sweet and salty in taste, warm in nature, and enters the kidney and liver meridians. Its functions include tonifying kidney yang, replenishing essence and blood, strengthening tendons and bones, regulating the Chong and Ren vessels, and expelling toxins to promote wound healing. Antlers and deer antler base refer to the ossified antlers or the antler bases shed in the following spring after the antler velvet harvest from red deer (Cervus elaphus Linnaeus) or sika deer (Cervus nippon Temminck). Their functions include warming kidney yang, strengthening tendons and bones, promoting blood circulation, and reducing swelling [1]. Deer antler-based medicinal materials have been extensively studied in the field of Chinese materia medica owing to their distinctive pharmacological properties and broad therapeutic potential. Current research has encompassed multiple aspects, including chemical composition, pharmacological effects, and extraction techniques.
However, it has been revealed that the material basis and pharmacological actions of deer antler base differ significantly from those of antlers.
Therefore, they are not interchangeable and necessitate distinct clinical applications. In clinical practice, deer antler base is commonly employed in the management of conditions such as mammary gland hyperplasia, breast cancer, and mastitis, owing to its purported actions in “promoting blood circulation and reducing swelling” [2]. Antlers are primarily used for osteoporosis and fracture repair, owing to their function of “strengthening tendons and bones”. Antler velvet is chiefly employed to improve hyposexuality, through its function of “tonifying kidney yang” [3]. Therefore, elucidating the material basis underlying the efficacy of these three substances holds significant implications. In recent years, proteomics technologies have provided novel research approaches for the systematic analysis of the composition and mechanisms of action of deer antler-derived medicinal materials [4].
Data-Independent Acquisition (DIA) is a novel holographic quantitative technique that integrates the advantages of traditional “shotgun” proteomics with Selected Reaction Monitoring/Multiple Reaction Monitoring (SRM/MRM) technology [5]. Compared to the traditional Data-Dependent Acquisition (DDA) technology, DIA technology has less inherent bias toward the acquisition and fragmentation of high-abundance peptides, offering significant advantages for the quantification of low-abundance peptides [6,7]. DIA technology enables ultra-high-speed scanning of all peptide precursor ions within a defined scan range, followed by their fragmentation to generate MS/MS spectra, thereby acquiring comprehensive peptide information. DIA-based quantitative proteomics has high coverage and sensitivity, superior quantitative reproducibility and accuracy, and suitability for complex samples [8,9]. Consequently, it has been widely applied in areas such as clinical biomarker research, the study of dynamic biological processes, and integrated multi-omics analysis [10,11,12,13,14,15].
In this study, DIA-based quantitative proteomics technology is employed to reveal differential protein expression in deer antler-derived medicinal materials. This work not only provides critical data to support the elucidation of these differential proteins but also lays a solid foundation for in-depth research into the mechanisms of protein interactions within these materials and for clarifying their material basis of efficacy. Furthermore, it also establishes a methodological foundation for the investigation of other horn-derived medicinal materials.
2. Materials and Methods
2.1. Sample and Reagent Information
Sika deer antlers (HLJ), antler velvet (HLR), and deer antler base (HLTP) were all collected from Shuangyang District, Changchun City, Jilin Province, China. DL-Dithiothreitol (DTT): Sourced from Solarbio Science & Technology Co., Ltd., Beijing, China; Albumin from bovine serum (BSA): Sourced from Chucheng Zhengmao Technology Engineering Co., Ltd., Wuhan, China; Ethylene Diamine Tetraacetic Acid (EDTA): Sourced from Sinopharm Chemical Reagent Co., Ltd., Shanghai, China; Coomassie Brilliant Blue G-250: Sourced from Sinopharm Chemical Reagent Co., Ltd., Shanghai, China; Iodoacetamide (IAA): Sourced from Shanghai Aladdin Biochemical Technology Co., Ltd., Shanghai, China; Phenylmethanesulfonyl fluoride (PMSF): Sourced from Chengdu Xiya Chemical Industry Co., Ltd., Chengdu, China; Sodium dodecyl sulfate (SDS): Sourced from Sinopharm Chemical Reagent Co., Ltd., Shanghai, China.
2.2. Instrumentation
Ultrasonic Cell Disruptor: Model JY92-11N (Ningbo Scientz Biotechnology Co., Ltd., Ningbo, China); Benchtop High-Speed Refrigerated Centrifuge: Model TGL-20M (Hunan Xiangyi Laboratory Instrument Development Co., Ltd., Hunan, China); Vacuum Freeze Dryer: Model CV 600 (Beijing Giam Scientific Instrument Co., Ltd., Beijing, China); Microplate Reader: Model Cmax Plus (Meigu Molecular Instrument Co., Ltd, Shanghai, China); (Molecular Devices, LLC, San Jose, CA, USA); Mass Spectrometer: Orbitrap™ Astral™ Mass Spectrometer (Thermo Fisher Scientific, Waltham, MA, USA).
2.3. Sample Handling
2.3.1. Extraction of Protein
Samples were first retrieved from the −80 °C freezer and ground into a fine powder using liquid nitrogen. An appropriate amount of this powdered material was then transferred to 1.5 mL centrifuge tubes, where it was combined with lysis buffer containing 8 M urea, 1 mM PMSF, and 2 mM EDTA. The mixtures were subsequently subjected to ultrasonic lysis for 5 min on ice. Following lysis, the samples were centrifuged at 15,000× g for 10 min at 4 °C to pellet insoluble debris, and the supernatant was carefully collected. Finally, the protein concentration of the supernatant was determined using a BCA assay kit [16].
2.3.2. Proteolytic Desalting
Based on the previously determined protein concentration, 100 μg of protein was aliquoted into a new tube. The volume of the solution was adjusted to 200 μL with 8 M urea. Reduction was performed using dithiothreitol (DTT) at a final concentration of 5 mM during a 45 min incubation at 37 °C. This was followed by alkylation with iodoacetamide at a final concentration of 11 mM, which was carried out in the dark at room temperature for 15 min. Subsequently, 800 μL of 25 mM ammonium bicarbonate solution and 2 μL of trypsin (Promega, Madison, USA) were added to the mixture for an overnight digestion at 37 °C. After digestion, the pH of the peptide mixture was adjusted to 2–3 using 20% trifluoroacetic acid (TFA). The sample was then desalted using C18 resin (Millipore, Billerica, MA, USA). Finally, the peptide concentration was determined using a Pierce™ Quantitative Peptide Assay Kit with standards (Thermo Fisher Scientific, Waltham, MA, USA).
2.4. LC-MS/MS Analysis
2.4.1. Liquid Chromatography Detection
Samples were separated using the Vanquish Neo UHPLC liquid chromatography system (Thermo Fisher Scientific, Waltham, MA, USA). The mobile phase A consisted of 0.1% formic acid aqueous solution, while the mobile phase B was acetonitrile containing 0.1% formic acid. The injection mode employed a trap-and-elute dual-column method, with a PepMap Neo Trap Cartridge (Thermo Fisher Scientific, Waltham, MA, USA) (300 μm × 5 mm, 5 μm) as the trapping column and an Easy-Spray™ PepMap™ Neo UHPLC (Thermo Fisher Scientific, Waltham, MA, USA) column (150 μm × 15 cm, 2 um) as the analytical column. The column temperature was controlled at 55 °C, with an injection volume of 200 ng, a flow rate of 2.5 μL/min, an effective gradient duration of 6.9 min, and a total runtime of 8 min.
2.4.2. Orbitrap Astral Mass Spectrometry Detection
DIA analysis utilized the Vanquish Neo system (Thermo Fisher Scientific, Waltham, MA, USA) for chromatographic separation. Samples separated by nano-flow high-performance liquid chromatography were subjected to DIA (Data-Independent Acquisition) mass spectrometry analysis using the Orbitrap Astral high-resolution mass spectrometer (Thermo Scientific, Waltham, MA, USA). The detection mode was positive ion mode, with a precursor ion scan range of 380–980 m/z, a primary mass resolution of 240,000 at 200 m/z, a Normalized AGC Target of 500%, and a Maximum IT of 5 ms. MS2 was performed using DIA data acquisition mode, with 299 scan windows, an Isolation Window of 2 Th, HCD Collision Energy of 25%, a Normalized AGC Target of 500%, and a Maximum IT of 3 ms.
2.5. Database Search
MS raw data were analyzed using DIA-NN (v1.8.1) with the library-free method [17]. The uniprotkb_taxonomy_id_9859_Cervus_genus_2025_04_12.fasta database (a total of 21,561 sequences) was used to create a spectra library with deep learning algorithms of neural networks. The option of MBR (Match Between Runs) was employed to create a spectral library from DIA data and then reanalyze using this library. The FDR (false discovery rate) of search results was adjusted to <1% at both protein and precursor ion levels; the remaining identifications were used for further quantification analysis.
2.6. Protein Quantification
2.6.1. Database Search Software Quantification
Protein quantification of DIA-NN software was performed by the MaxLFQ algorithm.
2.6.2. Standardized Processing
After the database search software completed protein quantification, the Intensity values of each protein across different samples provided in the search results were extracted. These values were then processed through within-sample normalization to obtain the relative quantitative values (R) of the proteins in the different samples.
2.6.3. Difference Analysis
After standardization, differential quantitative analysis of proteins was performed to identify differentially expressed proteins among different sample groups (where biological replicate samples belonged to the same group) in the comparative groups. Commonly used statistical methods for proteomic differential analysis included parametric and non-parametric tests, and the specific differential test method was selected based on the actual data.
For projects with biological replicates, when the comparison involved two groups, the mean ratio of quantitative values across all biological replicates for each protein was used as the fold change (FC). Differential testing was performed using a t-test on the quantitative values of each protein between the two groups, and the corresponding p-value was calculated. When the comparison involved more than two groups, differential testing was conducted using ANOVA on the quantitative values of each protein across the groups, and the relevant p-value was computed.
For projects without replicates, where the comparison involved two groups and only one biological replicate was available, only FC could be calculated, and no p-value could be derived. When hypothesis testing for p-value was required, the Benjamini–Hochberg (BH) method was typically used to calculate the false discovery rate (FDR).
2.7. Bioinformatics Analysis
To gain a comprehensive understanding of the functional characteristics of different proteins, a full range of functional annotations was performed on both the identified proteins and the differentially expressed proteins from each comparison group. These annotations included Gene Ontology (GO), KOG functional classification, KEGG pathways, protein domains, and subcellular localization.
Furthermore, enrichment analysis was conducted for the differentially expressed proteins in each comparison group across four aspects: GO classification, KOG functional classification, KEGG pathways, and protein domains. The enrichment analysis employed a hypergeometric test to calculate the significance p-value, with the aim of determining whether the differentially expressed proteins were significantly enriched in certain functional categories compared to the background set of proteins (here, all identified proteins). This approach allowed for a more comprehensive assessment of the physiological functions in which the differentially expressed proteins were involved.
3. Results
3.1. Qualitative Results for Quality Assessment of Peptides
As shown in Figure 1, the majority of peptides were distributed within the range of 7–20 amino acids. This distribution is consistent with the general patterns observed for tryptic digestion followed by mass spectrometry fragmentation, indicating that the length distribution of the peptides identified by mass spectrometry meets quality control requirements (Figure 1A,B). The peptide count distribution was evenly spread. Peptides with zero missed cleavage sites accounted for 74.58% of the total, demonstrating complete enzymatic digestion, which is beneficial for identification (Figure 1C).
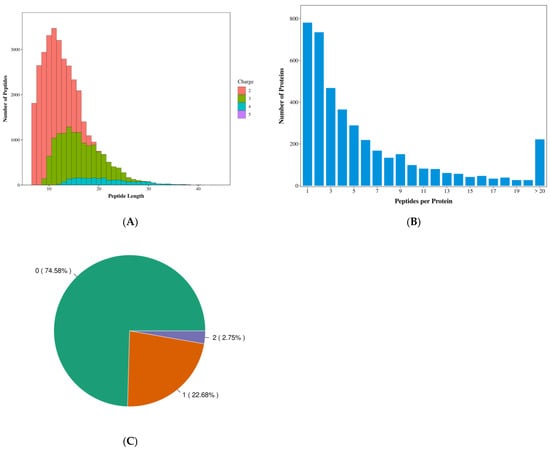
Figure 1.
Qualitative results quality assessment chart. (A) Distribution of peptide length. Note: The x-axis represents peptide length, the y-axis indicates the number of peptides of the corresponding length, and different colors denote the detected charge states of the peptides. (B) distribution of peptide count. Note: The x-axis represents the number of peptides, and the y-axis corresponds to the number of proteins associated with the respective peptides. (C) distribution of missed cleavage sites. Note: The value outside the parentheses denotes the number of missed cleavages, while the value within parentheses indicates the percentage of peptides corresponding to that specific number of missed cleavages.
3.2. Protein Screening
As shown in Figure 2, Group A analysis identified 4035 proteins, of which 3154 were differentially expressed. Compared to antlers, antler velvet had 3010 upregulated proteins (accounting for 95% of these differentially expressed proteins) and 144 downregulated proteins, indicating a significant difference in protein composition (Figure 2A,D). The top 10 most significantly differentially expressed proteins (ranked by ascending p-value) were Polyadenylate-binding protein, Voltage-dependent anion-selective channel protein 2, Tenascin-C (TNC), Fibrinogen alpha chain, Phosphatidylethanolamine-binding protein 1, Transforming growth factor-beta-induced protein ig-h3, Peptidylprolyl isomerase, Filamin-B (FLNB), Large ribosomal subunit protein uL14, ATP synthase subunit alpha (Table S1).
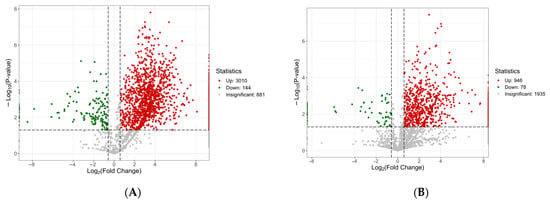
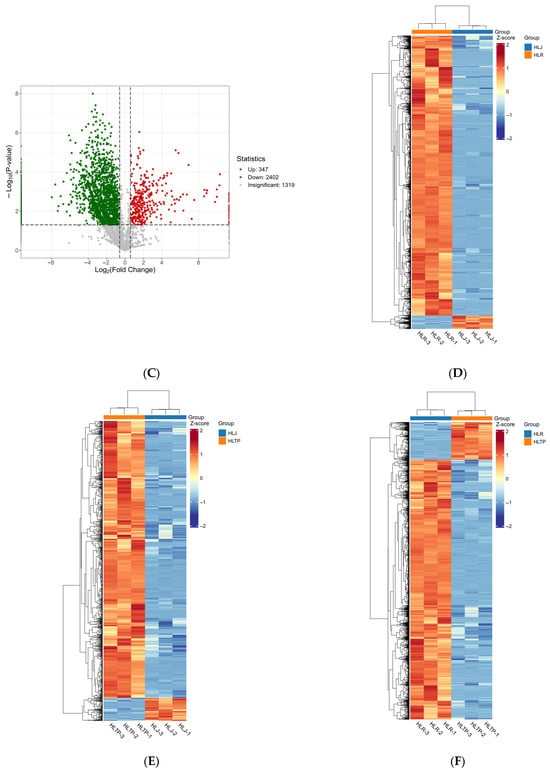
Figure 2.
Screening results of differentially expressed proteins. (A–C) Volcanic diagram of differentially expressed proteins. Note: The x-axis represents the log2-transformed fold change, the y-axis represents the -log10-transformed p-value, and the red and green scatter points denote the upregulated and downregulated differentially expressed proteins, respectively. (D–F) differential expression protein clustering heatmap. Note: Rows represent differentially expressed proteins, columns represent samples, and shorter dendrogram branches indicate higher similarity. (A,D) HLR vs. HLJ; (B,E) HLTP vs. HLJ; (C,F) HLTP vs. HLR.
Group B analysis identified 2959 proteins, including 1024 differentially expressed proteins. Compared to antlers, deer antler base had 946 upregulated proteins (92% of the differentially expressed proteins) and 78 downregulated proteins (Figure 2B,E). The top 10 most significantly differentially expressed proteins (ranked by ascending p-value) were ACTC protein (Alpha-cardiac actin), F-actin-capping protein subunit alpha, Phosphoglycerate kinase, Ezrin (EZR), Extracellular matrix protein 1 (ECM1), Profilin, Pyruvate kinase, ATP synthase subunit beta, Myosin motor domain-containing protein, Hemoglobin subunit beta (HBB) (Table S2).
Group C analysis identified 4068 proteins, of which 2749 were differentially expressed. Compared to antler velvet, deer antler base had only 347 upregulated proteins (13% of the differentially expressed proteins), while downregulated proteins numbered 2402 (Figure 2C,F). The top 10 most significantly differentially expressed proteins (ranked by ascending p-value) included Peroxiredoxin-1, Tr-type G domain-containing protein, Cytosolic fatty-acid binding proteins domain-containing protein, PDZ domain-containing protein, Serine/arginine-rich splicing factor 1 (SRSF1), Galectin, Heat shock protein 90 alpha family class B member 1 (HSP90AB1), VWFA domain-containing protein, Filamin-B (FLNB), Clathrin heavy chain (Table S3).
To summarize, in terms of protein composition, antler velvet is likely to exhibit the highest bioactivity, as its protein content and diversity were significantly higher than those of antlers and deer antler base. Next is deer antler base, while antlers have the lowest protein content and diversity.
3.3. Differentially Expressed Protein GO Functional Annotation and Enrichment Analysis
3.3.1. GO Function Annotation
Differentially expressed proteins (DEPs) from Groups A, B, and C were subjected to Gene Ontology (GO) functional annotation, as shown in Figure 3.
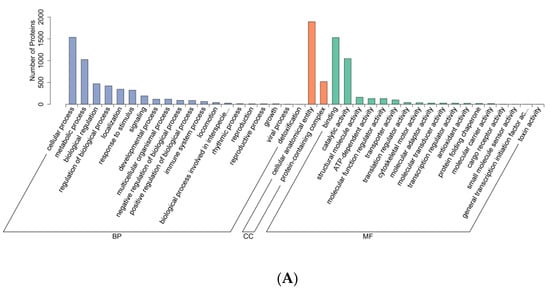
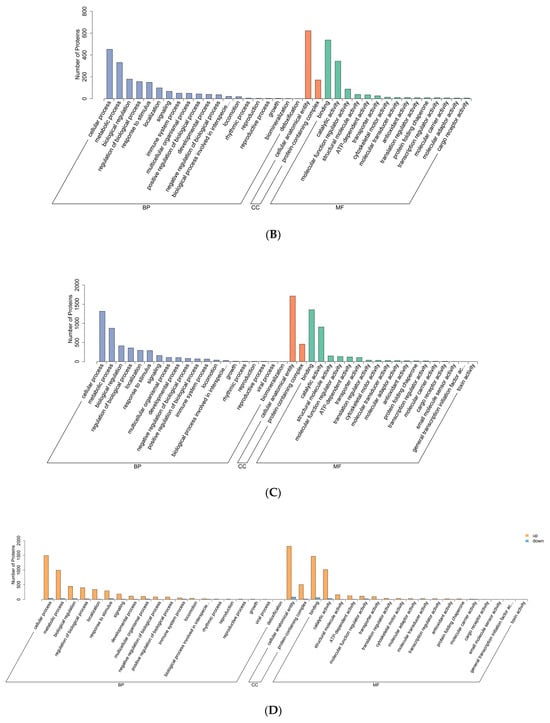
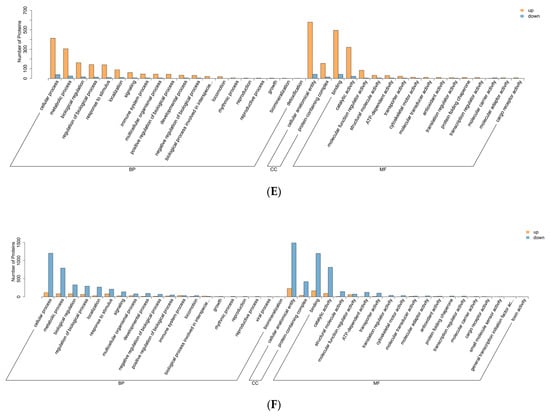
Figure 3.
GO functional annotation diagram. (A–C) Differentially expressed protein GO annotation bar chart. Note: The x-axis represents the second-level GO terms, the y-axis indicates the number of differentially expressed proteins within each GO term, and the distinct colors of the bars designate their respective first-level parent categories. (D–F) Bar chart of GO annotations for differentially expressed proteins between the upper and lower adjustments. Note: The x-axis represents the second-level GO terms, the y-axis denotes the number of differentially expressed proteins annotated to each GO term, with yellow and blue bars indicating upregulated and downregulated proteins, respectively. (A,D) HLR vs. HLJ; (B,E) HLTP vs. HLJ; (C,F) HLTP vs. HLR.
GO functional analysis revealed that the DEPs across all three groups were primarily involved in the following biological processes: cellular process, metabolic process, biological regulation, regulation of biological process, localization, response to stimulus, signaling, and developmental process (Figure 3A–C).
Regarding cellular components, DEPs in both sika deer antlers and sika deer antler velvet were predominantly associated with cellular anatomical entity and protein-containing complex (Figure 3A).
The molecular functions significantly represented among the DEPs in all three groups included binding, catalytic activity, structural molecule activity, ATP-dependent activity, molecular function regulator activity, and transporter activity (Figure 3A–C).
Since DEPs in Groups A and B were predominantly upregulated, while those in Group C were predominantly downregulated, the GO annotation bar charts for upregulated and downregulated DEPs are consistent with the annotations for the total DEPs (Figure 3D–F).
3.3.2. GO Enrichment
Biological Process (BP) Classification (Bar Chart): Group A DEPs were significantly enriched in terms such as translation, intracellular protein transport, and protein folding, indicating heightened activity in protein synthesis and processing within antler velvet, which is likely influenced by its rapid growth. Concurrently, the tricarboxylic acid cycle term enrichment suggests vigorous energy metabolism (Figure 4A). Group B DEPs showed enrichment in terms including proteolysis and glycolytic process, highlighting the specific involvement of protein degradation and glycolysis during the deer antler base stage (Figure 4B). Group C DEPs exhibited enrichment in terms like translation and cell differentiation, reflecting differences in protein synthesis capacity and cellular differentiation levels between deer antler base and antler velvet (Figure 4C).
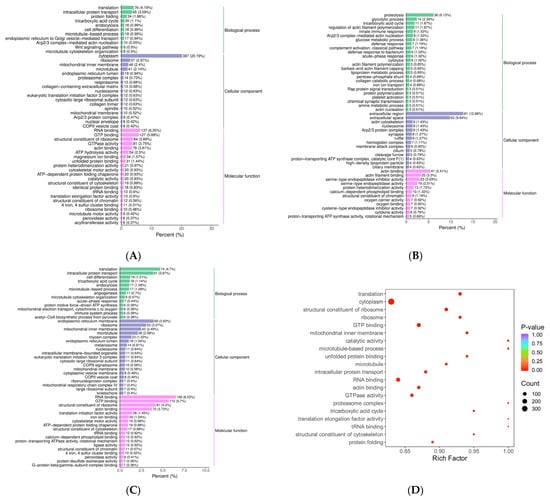

Figure 4.
GO enrichment analysis chart. (A–C) Bar graph of GO enrichment analysis of differentially expressed proteins. Note: The x-axis represents the proportion of differentially expressed proteins annotated to each term. The y-axis lists the names of the GO terms. The numbers adjacent to the bars indicate the count of differentially expressed proteins annotated to each term, with the corresponding proportion relative to the total number of annotated differentially expressed proteins provided in parentheses. The rightmost labels designate the primary GO category to which each term belongs. (D–F) Bubble plot of differentially expressed protein GO enrichment analysis. Note: The x-axis represents the fold enrichment (calculated as the ratio of the number of differentially expressed proteins enriched in the term to the number of annotated proteins), with higher values indicating greater enrichment of differentially expressed proteins. The y-axis displays the names of the GO terms. The color gradient from blue to red corresponds to decreasing p-values, where smaller p-values indicate greater statistical significance. The size of the data points reflects the number of differentially expressed proteins annotated to each corresponding term. (A,D) HLR vs. HLJ; (B,E) HLTP vs. HLJ; (C,F) HLTP vs. HLR.
Biological Process (Bubble Chart): Group A DEPs demonstrated high enrichment fold changes and low p-values in translation-related terms. This further confirms the significant differences in protein synthesis (Figure 4D). Group B DEPs showed relatively high enrichment fold changes and distinct coloration (indicating significance, e.g., red) in terms like proteolysis, statistically underscoring the importance of these processes for deer antler base (Figure 4E).
Cellular Component (CC) Classification (Bar Chart): Group A DEPs were enriched in intracellular components such as cytoplasm and ribosome, suggesting these locales play key roles in functional divergence (Figure 4A). Group B DEPs were enriched in the extracellular region and cytoskeleton-associated components, emphasizing the distinct extracellular environment and cytoskeletal features of deer antler base (Figure 4B). Group C DEPs showed enrichment in terms like endoplasmic reticulum membrane and ribosome, highlighting functional differences in these intracellular structures (Figure 4A).
Cellular Component (Bubble Chart): Group A DEPs displayed distinct coloration (e.g., red) and moderate size for points associated with cytoplasm and ribosome, indicating significant enrichment in these components (Figure 4D). Group B DEPs exhibited points positioned towards the right (high enrichment fold) with distinct coloration (e.g., red) for extracellular region-related terms, indicating high enrichment and statistical significance within these components (Figure 4E).
Molecular Function (MF) Classification (Bar Chart): Group A DEPs were enriched in functions like RNA binding and GTP binding, indicating these molecular functions are important for physiological differences. Enrichment in ribosomal structural constituents further demonstrates the enhanced protein synthesis capacity of antler velvet (Figure 4A). Group B DEPs showed enrichment in actin binding and peptidase activity, underscoring the specific roles of cytoskeletal binding and protein degradation functions in deer antler base (Figure 4B). Group C DEPs were enriched in functions including RNA binding and GTP binding, reflecting molecular functional disparities (Figure 4C).
Molecular Function (Bubble Chart): Group A DEPs exhibited points with distinct coloration (e.g., red) and broad distribution for terms like RNA binding and GTP binding, signifying significant enrichment in these molecular functions (Figure 4D). Group B DEPs displayed points positioned towards the right (high enrichment fold) with distinct coloration (e.g., red) for terms like actin binding, indicating high enrichment and statistical significance for these functions (Figure 4E).
3.4. Functional Annotation and Enrichment Analysis of Differentially Expressed Proteins in KEGG
As shown in Figure 5 and Figure 6, the differentially expressed proteins (DEPs) of antler velvet, antlers, and deer antler base were characterized by specific enrichment patterns across multiple biological pathways.
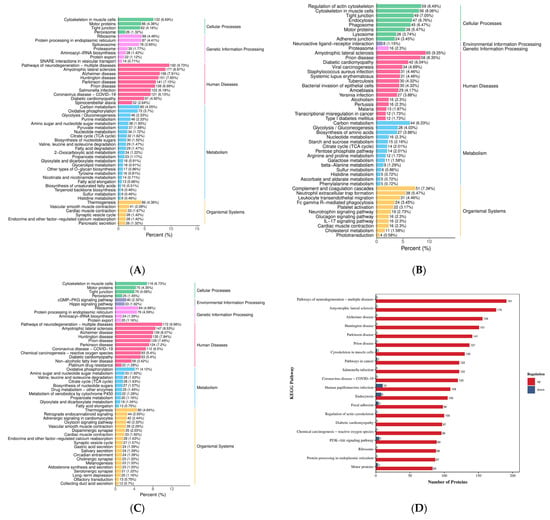
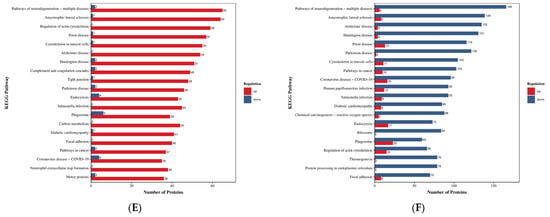
Figure 5.
KEGG function annotation. (A–C) Differentially expressed proteins KEGG classification bar graph. Note: The x-axis represents the proportion of differentially expressed proteins annotated to a given pathway relative to the total number of annotated proteins. The y-axis displays the names of the KEGG pathways. The numerical values adjacent to the bars indicate the count of differentially expressed proteins annotated to each pathway, with the corresponding proportion relative to the total annotated protein population shown in parentheses. The labels on the rightmost side designate the primary KEGG pathway categories. (D–F) Bar chart comparing KEGG classification of differentially expressed proteins between upper and lower groups. Note: The x-axis represents the number of differentially expressed proteins annotated to each functional category, while the y-axis displays the names of the KEGG functional classifications. Red and blue bars indicate upregulated and downregulated differentially expressed proteins, respectively. This figure displays only the top 20 most enriched KEGG pathways. (A,D) HLR vs. HLJ; (B,E) HLTP vs. HLJ; (C,F) HLTP vs. HLR.
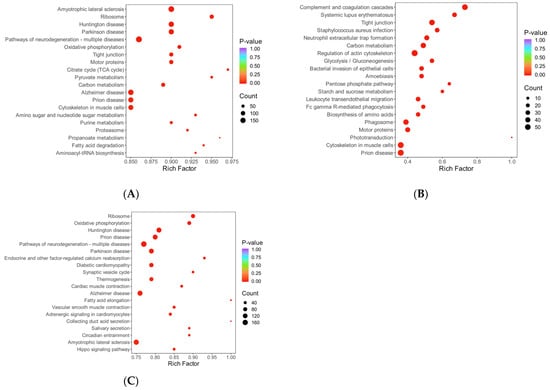
Figure 6.
Bubble diagram of KEGG enrichment analysis. Note: The x-axis represents the fold enrichment (calculated as the ratio of enriched differentially expressed proteins to annotated proteins in each term), with higher values indicating greater enrichment significance. The y-axis displays the KEGG pathways. A gradient color scheme from blue to red corresponds to decreasing p-values, where smaller values denote enhanced statistical significance. The size of the data points reflects the number of differentially expressed proteins annotated to each corresponding functional category. (A) HLR vs. HLJ; (B) HLTP vs. HLJ; (C) HLTP vs. HLR.
In cellular processes, Group A DEPs were primarily involved in pathways, including cytoskeleton in muscle cells, motor proteins, Tight junction, and Peroxisome, while Group B DEPs were significantly enriched in pathways such as regulation of actin cytoskeleton, Endocytosis, and Phagosome (Figure 5A,B). Regarding genetic information processing, Group A DEPs were concentrated in the ribosome, protein processing in endoplasmic reticulum, and proteasome pathways, whereas the DEPs of deer antler base specifically participated in proteasome-related pathways. Metabolic pathway analysis revealed that Group A DEPs were significantly enriched in glycolysis/gluconeogenesis, oxidative phosphorylation, and Pyruvate metabolism (Figure 5A), while deer antler base participated in metabolic regulation via the TCA cycle (tricarboxylic acid cycle) and biosynthesis of amino acids pathways (Figure 5B,C). Significant enrichment in pathways related to neurodegenerative diseases (pathways of neurodegeneration–multiple diseases) was observed across all three groups. Antler velvet exhibited specific regulatory roles in the Alzheimer disease, Huntington disease, and Parkinson disease pathways, suggesting its potential therapeutic intervention value and further supporting the clinical application value of deer antler-derived medicinal materials (Figure 5A–C). Conversely, the DEPs of deer antler base demonstrated unique activity in the amyotrophic lateral sclerosis (ALS) and Carbon metabolism pathways (Figure 5E,F). In the regulation of organic systems, antler velvet DEPs were mainly involved in Thermogenesis and cardiac muscle contraction (Figure 5D,F), while deer antler base DEPs exerted immunomodulatory functions through pathways such as complement and coagulation cascades and neutrophil extracellular trap (NET) formation (Figure 5E,F). The results indicate that the specific enrichment of antler velvet DEPs in the ribosome and protein processing in endoplasmic reticulum pathways was significantly higher than that of deer antler base, thereby strengthening the molecular basis for its pharmacological activity.
3.5. Functional Annotation and Enrichment Analysis of Differentially Expressed Proteins in KOG
As shown in Figure 7 and Figure 8, the functional classification of differentially expressed proteins (DEPs) in antler velvet, antlers, and deer antler base exhibited pronounced tissue specificity.
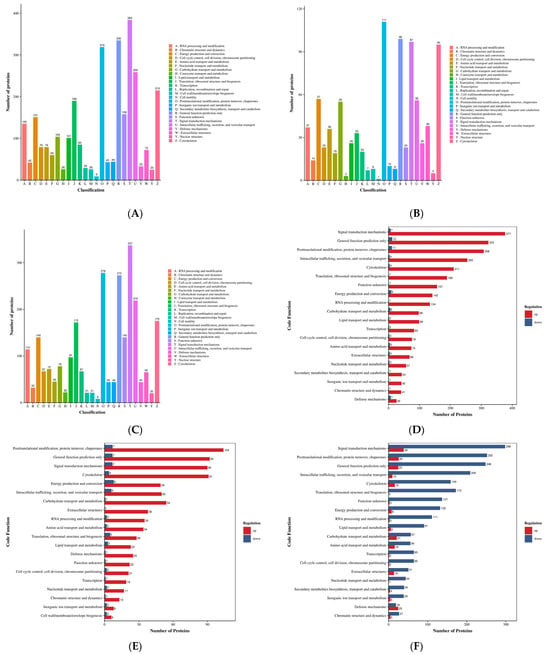
Figure 7.
Annotation diagram of KOG function. (A–C) Histogram of differentially expressed protein KOG annotation. Note: The x-axis represents the KOG functional categories, while the y-axis corresponds to the number of differentially expressed proteins annotated to each respective function. The legend on the right indicates the specific functional classification terms. (D–F) Comparison bar graph of KOG annotation of up-down and differentially expressed proteins. Note: The x-axis represents the number of differentially expressed proteins annotated to each functional category, while the y-axis displays the KOG functional classification names. Red and blue colors indicate upregulated and downregulated differentially expressed proteins, respectively. (A,D) HLR vs. HLJ; (B,E) HLTP vs. HLJ; (C,F) HLTP vs. HLR.
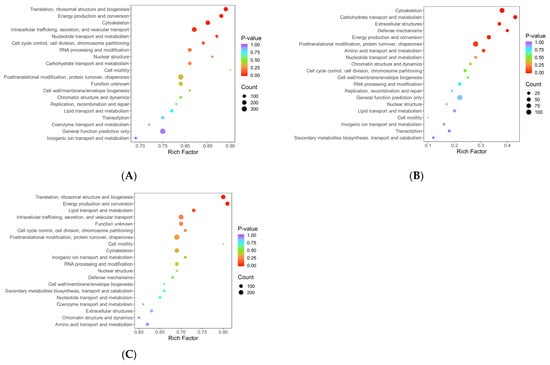
Figure 8.
Bubble diagram of KOG enrichment analysis. Note: The x-axis represents the fold enrichment (calculated as the ratio of the number of differentially expressed proteins enriched in a specific term to the number of annotated proteins), with higher values indicating greater enrichment of differentially expressed proteins. The y-axis displays the KOG functional descriptions. The color gradient from blue to red corresponds to decreasing p-values, where smaller p-values indicate greater statistical significance. The size of the data points reflects the number of differentially expressed proteins annotated to each corresponding functional category. (A) HLR vs. HLJ; (B) HLTP vs. HLJ; (C) HLTP vs. HLR.
In Group A, the annotation coverage rate reached 95%, and the top three most enriched functional categories were signal transduction mechanisms; general function prediction only; and posttranslational modification, protein turnover, chaperones; translation, ribosomal structure, and biogenesis and cytoskeleton also constituted core annotated categories, while cell motility-related proteins accounted for the lowest proportion of annotations (Figure 7A). Group B showed that 89% of DEPs were annotated, with the highest enrichment in posttranslational modification pathways, followed by energy production and conversion and cytoskeleton regulation, further reflecting its biological characteristics of metabolic remodeling and structural reorganization (Figure 7B). Group C achieved a 94% annotation coverage rate, with its core functional categories highly overlapping with those of the antler velvet–antlers comparison group (Group A); both were dominated by signal transduction and posttranslational modification pathways, suggesting greater pathway richness in antler velvet. (Figure 7C). The proportion of functionally unknown proteins was below 6% across all three groups (5% in A, 3% in B, 5% in C), significantly below conventional proteomic analysis thresholds, which indicates high reliability of the annotation data.
3.6. Functional Annotation and Enrichment Analysis of Differentially Expressed Protein Domains
As shown in Figure 9 and Figure 10, the differentially expressed proteins (DEPs) of antler velvet, antlers, and deer antler base exhibited pronounced tissue specificity in domain composition and functional module distribution.
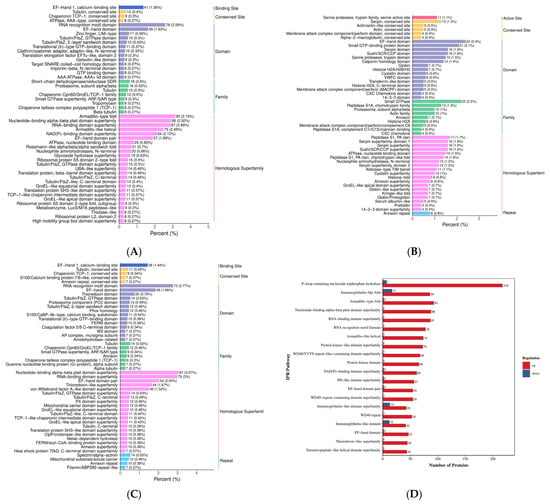
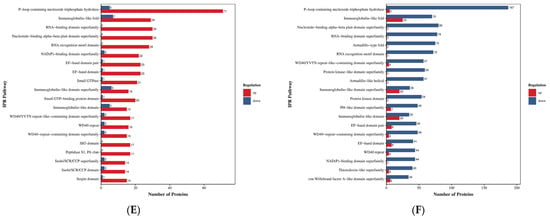
Figure 9.
Annotation diagram of domain functions. (A–C) Differentially expressed protein domain annotated bar graph. Note: The x-axis represents the relative percentage of differentially expressed proteins annotated to each IPR entry. The y-axis displays the names of the IPR entries. The numbers adjacent to the bars indicate the count of differentially expressed proteins annotated to each IPR entry, with the ratio of this count to the total number of annotated differentially expressed proteins shown in parentheses. The labels on the rightmost side designate the IPR classifications. (D–F) Comparison bar graph of annotations for up-down and differentially expressed protein domains. Note: The x-axis represents the number of differentially expressed proteins annotated to each functional category, while the y-axis displays the KOG functional classification names. Red and blue colors indicate upregulated and downregulated differentially expressed proteins, respectively. This figure displays only the top 20 IPR entries ranked by the number of differentially expressed proteins in descending order. (A,D) HLR vs. HLJ; (B,E) HLTP vs. HLJ; (C,F) HLTP vs. HLR.
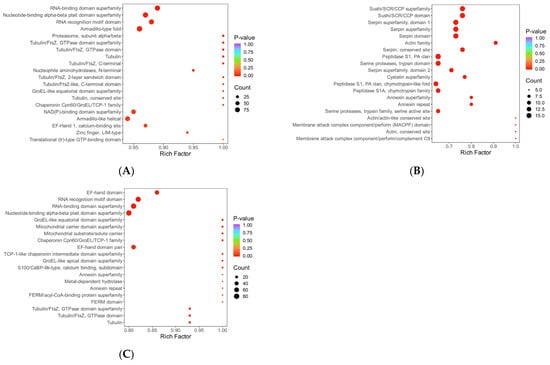
Figure 10.
Bubble plot for domain enrichment analysis. Note: The x-axis represents the fold enrichment (calculated as the ratio of enriched differentially expressed proteins to annotated proteins for each entry), with higher values indicating greater enrichment significance. The y-axis displays the InterPro (IPR) entry descriptions. A blue-to-red color gradient corresponds to decreasing p-values, where smaller values denote enhanced statistical significance. The size of the data points is proportional to the number of differentially expressed proteins annotated to each corresponding functional entry. (A) HLR vs. HLJ; (B) HLTP vs. HLJ; (C) HLTP vs. HLR.
Group A DEPs were predominantly enriched in the EF-Hand 1 calcium-binding site (Binding Site), Tubulin conserved site (Tubulin, conserved site), and RNA recognition motif domain (RNA recognition motif domain); notably, the P-loop containing nucleoside triphosphate hydrolase (P-loop containing nucleoside triphosphate hydrolase) domain had the largest number of upregulated proteins (218 proteins), with significant enrichment also observed for the Immunoglobulin-like fold (Immunoglobulin-like fold) and Armadillo-type fold (Armadillo-type fold), suggesting enhanced activities in nucleotide metabolism, immune regulation, and protein kinase activity (Figure 9A,D). In contrast, Group B DEPs showed specific enrichment in Serine proteases, trypsin family active sites (Serine proteases, trypsin family) and Serpin (Serpin) domains; the activation of the P-loop domain (71 upregulated proteins) and the RNA-binding domain superfamily (RNA-binding domain superfamily) highlighted the enhancement of proteolytic and RNA processing functions (Figure 9B,E).
In Group C, the number of downregulated proteins containing the P-loop domain reached 187. When combined with the enrichment of the group-specific Thioredoxin domain (Thioredoxin domain) and Tubulin/FtsZ, GTPase domain (Tubulin/FtsZ, GTPase domain), this pattern revealed specific regulation of redox homeostasis and cytoskeletal dynamics. Cross-group comparison demonstrated that the Nucleotide-binding alpha-beta plait domain superfamily (Nucleotide-binding alpha-beta plait domain superfamily) and the RNA recognition motif domain were significantly upregulated across all three groups, indicating the pivotal role of RNA metabolism and energy conversion pathways in deer-derived tissues. Furthermore, the differential distribution of the Tubulin family (Tubulin), Chaperonin TCP-1 family (Chaperonin TCP-1), and Annexin repeat (Annexin repeat) domains indicates functional differences among antler velvet, antlers, and deer antler base in cytoskeletal remodeling, protein folding, and calcium signaling (Figure 9C,F).
3.7. Subcellular Localization of Differentially Expressed Proteins
As shown in Figure 11, a total of 3153 differentially expressed proteins (DEPs) in subcellular structures were annotated for Group A, which were localized across 14 entries; the top three subcellular compartments by localization proportion were the cytoplasm (1187 proteins, comprising 1156 upregulated and 36 downregulated proteins), the nucleus (619 proteins, comprising 592 upregulated and 27 downregulated proteins), and the extracellular space (455 proteins, comprising 405 upregulated and 50 downregulated proteins) (Figure 11A,D).
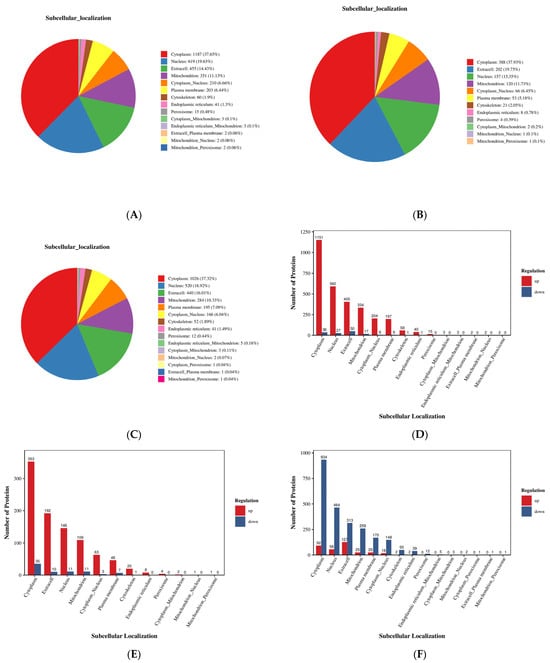
Figure 11.
Subcellular localization results. (A–C) Pie chart of subcellular localization of differentially expressed proteins. Note: Different colors represent distinct subcellular structures. The numbers outside the parentheses indicate the count of differentially expressed proteins annotated to each corresponding subcellular location, while the values inside the parentheses represent the ratio of this count to the total number of differentially expressed proteins with subcellular localization annotations. (D–F) Histogram comparing the subcellular localization results of up-down and differentially expressed proteins. Note: The x-axis represents the subcellular structures, while the y-axis indicates the number of differentially expressed proteins annotated to each subcellular location. Red and blue colors denote upregulated and downregulated differentially expressed proteins, respectively. (A,D) HLR vs. HLJ; (B,E) HLTP vs. HLJ; (C,F) HLTP vs. HLR.
For Group B, 1023 DEPs in subcellular structures were annotated, which were localized across 12 entries; the top three subcellular compartments were the cytoplasm (388 proteins, comprising 353 upregulated and 35 downregulated proteins), the extracellular space (202 proteins, comprising 192 upregulated and 10 downregulated proteins), and the nucleus (157 proteins, comprising 146 upregulated and 11 downregulated proteins) (Figure 11B,E).
In Group C, 2749 DEPs in subcellular structures were annotated, which were localized across 15 entries; the top three subcellular compartments were the cytoplasm (1026 proteins, comprising 92 upregulated and 934 downregulated proteins), the nucleus (520 proteins, comprising 56 upregulated and 464 downregulated proteins), and the extracellular space (440 proteins, comprising 127 upregulated and 313 downregulated proteins) (Figure 11C,F).
4. Discussion
The pharmacological effects of antler velvet are largely attributed to its antioxidant and immunomodulatory properties [18]. Proteomic analysis had identified 259 differentially expressed proteins between the tip and middle sections of antler velvet, predominantly associated with antioxidant metabolic mechanisms, suggesting the critical role of antioxidant proteins in velvet regeneration under the high-metabolic state of the tip region [19]. In terms of immunomodulation, network pharmacology analysis suggests that bioactive components in antler velvet mediate their effects via four key substances targeting 130 genes. These mechanisms include modulation of T-cell function through the PI3K–Akt signaling pathway and immunoregulatory interactions between MAPK3–17 and β-estradiol complexes [20].
Antler velvet exhibits therapeutic effects on cardiovascular diseases, including cardiac arrhythmias, ischemic disorders, and heart failure. Its underlying mechanisms are through reducing endothelin release, enhancing superoxide dismutase activity, decreasing serum malondialdehyde levels, and increasing nitric oxide and calcitonin gene-related peptide content [21,22]. Additionally, antler velvet proteins and polypeptides exhibit protective effects in conditions such as myocardial infarction and hypoxic-ischemic encephalopathy. For example, the novel polypeptide PNP1 has been shown to ameliorate cerebral injury in mice following ischemia–reperfusion [23,24,25].
Further studies indicate that antler velvet polypeptides attenuate hepatic lipid accumulation, systemic oxidative stress, and inflammation by remodeling gut microbiota and restoring intestinal barrier function. Specifically, intervention downregulates the abundance of genera like Lachnospiraceae NK4A136 while upregulating genera such as Ruminiclostridium_5, thereby suppressing inflammatory responses through reduced serum lipopolysaccharides and inflammatory cytokines, as well as maintenance of intestinal barrier integrity [21,26]. Additionally, antler velvet proteins reverse ischemic-hypoxic damage to cardiac microvascular endothelial cells by regulating the expression of Bcl-2, Bax, and Caspase-3 via the PI3K/Akt signaling pathway [23,27].
Antler velvet stem cells possess the capacity for self-renewal and multidirectional differentiation. Their secreted exosomes have been shown to mitigate senescence in human mesenchymal stem cells and attenuate osteoarthritis progression via involvement in signaling pathways such as HIF-1α and PI3K–AKT [28,29,30,31,32]. In its anti-osteoarthritic mechanisms, antler velvet extract downregulates inflammatory factors, including matrix metalloproteinases (MMPs), and maintains chondrocyte homeostasis by regulating chromatin structure, transcription and translation, and signal transduction, thereby promoting cartilage repair [33,34,35,36,37]. Additionally, antler velvet polypeptides improve bone mineral density, regulate bone metabolism-associated proteins (e.g., Tropomyosins, WD repeat-containing protein 1), and stimulate osteogenesis through the PI3K/Akt and MAPK pathways. These compounds also ameliorate gut dysbiosis in ovariectomized mice—for instance, by enriching beneficial microbiota such as Akkermansia and Lactobacillus—exerting osteoprotective effects via modulation of amino acid and phospholipid metabolism and activation of bone formation-related signaling pathways [38,39,40,41].
Antler velvet polypeptides have further been shown to ameliorate aging-associated cognitive decline and confer neuroprotection by enhancing the activity of antioxidant enzymes such as superoxide dismutase and glutathione peroxidase, reducing lipid peroxidation accumulation, and modulating gut microbiota (e.g., increasing lactobacilli) [42,43,44]. Tip extracts alleviate fatigue in mice by regulating glucose and energy metabolism pathways, including the insulin signaling pathway and citrate cycle (TCA cycle) [45]. Aqueous extracts improve colitis through modulation of gut microbiota (e.g., Gemella, Ruminococcaceae_UCG_014) and metabolites (e.g., L-carnitine, γ-aminobutyric acid) [46]. Antler velvet blood peptide hydrogels accelerate wound healing by activating the PI3K/AKT/mTOR and SIRT1/NF-κB pathways [47,48]. Additionally, antler velvet proteins and stem cell-derived exosomes exhibit anticancer activity by inducing tumor cell cycle arrest, promoting apoptosis, and enhancing anti-tumor immune responses, involving 66 cancer-related target genes [20,49,50].
This study employed DIA quantitative proteomics to systematically analyze protein differences in sika deer antler velvet, antlers, and deer antler base. The results demonstrated marked tissue specificity among these three materials in terms of protein abundance, functional pathway engagement, and subcellular localization.
The comparison between antler velvet and antlers identified the highest number of differentially expressed proteins (3154). These proteins were primarily enriched in pathways related to ribosomal synthesis, oxidative phosphorylation, and neurodegenerative diseases. This enrichment highlights active protein synthesis and energy metabolism characteristics within antler velvet, reflecting its traditional function of “tonifying kidney yang”.
In contrast, differentially expressed proteins between deer antler base and antlers were significantly enriched in pathways related to proteolysis, glycolysis, and immunomodulation. This expression profile indicates a functional emphasis on structural remodeling and immune responses, which is consistent with the traditional use of deer antler base in “promoting blood circulation and reducing swelling”.
Subcellular localization analysis demonstrated that differentially expressed proteins in antler velvet were predominantly distributed in the cytoplasm and nucleus. In contrast, deer antler base showed significant enrichment of extracellular matrix-associated proteins. These distinct localization patterns further corroborate the physiological functional differences among the three materials.
The findings of this study clarify the material basis underlying antler velvet’s traditional use as a Yang-tonifying agent. Its highly expressed ribosomal proteins and energy metabolism-related enzymes (e.g., ATP synthase subunit beta) may be associated with its efficacy in promoting cell proliferation and tissue repair. This finding is consistent with previous reports on the growth-promoting effects of antler velvet [34,51].
This investigation also revealed that differentially expressed proteins in deer antler base were significantly enriched in pathways such as complement and coagulation cascades and neutrophil extracellular trap formation. These insights offer a new perspective for understanding its empirical clinical application in treating mammary gland disorders, consistent with its traditional function of “promoting blood circulation and reducing swelling”.
Notably, all three sample groups showed enrichment in pathways related to neurodegenerative diseases (e.g., Alzheimer disease, Parkinson disease pathways). The potential association of this result with neural regulatory mechanisms during antler regeneration in cervids requires further validation through pharmacological experiments [52,53].
By leveraging proteomic profiling, this study delineates molecular differences among antler velvet, antlers, and deer antler base, thereby supplementing the material basis for the concept of “identical medicinal species at distinct developmental stages” within deer antler-derived medicines. These results provide a scientific rationale for the independent inclusion of deer antler base in the Pharmacopoeia of the People’s Republic of China.
From an applied perspective, key functional proteins identified via differential protein analysis—such as Polyadenylate-binding protein in antler velvet and ACTC protein (Alpha-cardiac actin) in deer antler base—serve as potential quality markers. These markers can be utilized to establish protein fingerprinting for the authentication and quality assessment of these medicinal materials.
Furthermore, the enrichment of antler velvet proteins in neurodegenerative disease-related pathways implies potential neuroprotective effects, suggesting novel targets for anti-aging or neurorestorative drug development. Meanwhile, immunomodulatory proteins identified in deer antler base provide a foundation for exploring immune-related mechanisms in mammary gland disorders and developing innovative treatment strategies.
5. Conclusions
This study employed Data-Independent Acquisition (DIA) quantitative proteomics to systematically characterize the proteomic profiles of sika deer antler velvet, antlers, and deer antler base. A total of 3154, 1024, and 2749 differentially expressed proteins were identified among the three sample groups, revealing significant differences in pathways associated with protein synthesis, energy metabolism, and immunomodulation. These results provide essential data support for precise authentication, quality control, and mechanistic investigation of the efficacy of deer antler-derived medicinal materials. The findings further validate the traditional Chinese medicine theory that “variations in developmental stages determine differential therapeutic effects” and furnish molecular-level evidence supporting the scientific rationale for the independent medicinal use of deer antler base.
Future research could focus on the following: (1) Integrating multi-omics data to construct molecular regulatory networks of deer antler-derived medicines; (2) verifying biological functions of key differential proteins through animal models to clarify neuroprotective mechanisms of antler velvet and immunomodulatory mechanisms of deer antler base; (3) expanding studies to additional cervid species to establish a comprehensive proteomic database for antler-derived medicinal materials, thereby providing references for standardized development of traditional Chinese medicine resources.
In summary, this DIA-based proteomic study deciphers the stage-specific molecular landscapes of sika deer antler-derived medicines, providing a robust protein-level foundation for their distinct therapeutic functions. The findings not only validate the TCM theory of “variations in growth stages determine differential therapeutic effects” but also establish a scientific basis for the precise use and quality control of deer antler base. These insights open new avenues for biomarker development and advanced applications in neuroprotection and immunomodulation.
Supplementary Materials
The following supporting information can be downloaded at: https://www.mdpi.com/article/10.3390/app15179737/s1, Table S1: Differential protein information for HLR vs HLJ (with functional annotation information); Table S2: Differential protein information for HLTP vs HLJ (with functional annotation information); Table S3: Differential protein information for HLTP vs HLR (with functional annotation information); Table S4: Differential expression protein GO enrichment analysis information between HLR and HLJ; Table S5: Differential expression protein GO classification information between HLR and HLJ; Table S6: Differential expression protein GO enrichment analysis information between HLTP and HLJ; Table S7: Differential expression protein GO classification information between HLTP and HLJ; Table S8: Differential expression protein GO enrichment analysis information between HLTP and HLR; Table S9: Differential expression protein GO classification information between HLTP and HLR; Table S10: KEGG analysis of differentially expressed proteins between HLR and HLJ; Table S11: KEGG analysis of differentially expressed proteins between HLTP and HLJ; Table S12: KEGG analysis of differentially expressed proteins between HLTP and HLR; Table S13: Differential expression protein KOG analysis information between HLR and HLJ; Table S14: Differential expression protein KOG analysis information between HLTP and HLJ; Table S15: Differential expression protein KOG analysis information between HLTP and HLR; Table S16: Enrichment analysis information of differentially expressed protein domains between HLR and HLJ; Table S17: Enrichment analysis information of differentially expressed protein domains between HLTP and HLJ; Table S18: Enrichment analysis information of differentially expressed protein domains between HLTP and HLR; Table S19: Subcellular Localization Analysis of Differentially Expressed Proteins between HLR and HLJ; Table S20: Subcellular Localization Analysis of Differentially Expressed Proteins between HLTP and HLJ; Table S21: Subcellular Localization Analysis of Differentially Expressed Proteins between HLTP and HLR.
Author Contributions
Methodology, Y.J., L.L., Z.H., Z.D. and Z.Y.; validation, Y.J.; formal analysis, Y.J.; investigation, Y.J., L.L., Z.H., Z.D. and Z.Y.; resources, Z.Y.; Data curation, L.L. and Z.Y.; writing—original draft, L.L. and Z.Y.; project administration, Y.J. and Z.Y. All authors have read and agreed to the published version of the manuscript.
Funding
This research received no external funding.
Institutional Review Board Statement
Not applicable.
Informed Consent Statement
Not applicable.
Data Availability Statement
The mass spectrometry proteomics data have been deposited to the ProteomeXchange Consortium (https://proteomecentral.proteomexchange.org (accessed on 2 September 2025)) via the iProX partner repository with the dataset identifier PXD066121.
Acknowledgments
The authors thank Wuhan Metware Biotechnology Co., Ltd. for the testing services.
Conflicts of Interest
The authors declare no conflict of interest.
References
- Wu, F.; Li, H.; Jin, L.; Li, X.; Ma, Y.; You, J.; Li, S.; Xu, Y. Deer antler base as a traditional Chinese medicine: A review of its traditional uses, chemistry and pharmacology. J. Ethnopharmacol. 2013, 145, 403–415. [Google Scholar] [CrossRef]
- Sun, S.; Zhang, K.; Wang, Y.; Zhou, Z.; Wang, L.; Zhao, H.; Zhang, Y. Pharmacodynamic structure of deer antler base protein and its mammary gland hyperplasia inhibition mechanism by mediating Raf-1/MEK/ERK signaling pathway activation. Food Funct. 2023, 14, 3319–3331. [Google Scholar] [CrossRef]
- Sun, S.; Qiu, H.; Wang, C.; Zhang, K.; Zhao, H.; Zhao, H.; Shen, Y.; Wang, Y.; Zhang, Y. Antler base (Cervus nippon Temminck) peptides modulate the NLRP3 inflammatory pyroptosis and Nrf2/HO-1/NQO1 signaling pathways to ameliorate osteoarthritis: A structural and mechanistic study. J. Ethnopharmacol. 2025, 351, 120149. [Google Scholar] [CrossRef]
- Liu, R.; Zhang, P.; Bai, J.; Zhong, Z.; Shan, Y.; Cheng, Z.; Zhang, Q.; Guo, Q.; Zhang, H.; Zhang, B. Integrated Transcriptomic and Proteomic Analyses of Antler Growth and Ossification Mechanisms. Int. J. Mol. Sci. 2024, 25, 13215. [Google Scholar] [CrossRef] [PubMed]
- Prianichnikov, N.; Koch, H.; Koch, S.; Lubeck, M.; Heilig, R.; Brehmer, S.; Fischer, R.; Cox, J. MaxQuant Software for Ion Mobility Enhanced Shotgun Proteomics. Mol. Cell. Proteom. 2020, 19, 1058–1069. [Google Scholar] [CrossRef] [PubMed]
- Fernandez-Costa, C.; Martinez-Bartolome, S.; McClatchy, D.B.; Saviola, A.J.; Yu, N.-K.; Yates, J.R., III. Impact of the Identification Strategy on the Reproducibility of the DDA and DIA Results. J. Proteome Res. 2020, 19, 3153–3161. [Google Scholar] [CrossRef] [PubMed]
- Joshua, K.A.; Wang, M.; Cavallero, G.J.; Chang, D.; Nalehua, M.R.; Hackett, W.E.; Morrison, L.; Zaia, J. Comparison of DDA, scanning window DIA, and HDMSE for assigning and quantifying glycopeptides. Mol. Cell. Proteom. 2022, 21, S86. [Google Scholar] [CrossRef]
- Ludwig, C.; Gillet, L.; Rosenberger, G.; Amon, S.; Collins, B.C.; Aebersold, R. Data-independent acquisition-based SWATH-MS for quantitative proteomics: A tutorial. Mol. Syst. Biol. 2018, 14, e8126. [Google Scholar] [CrossRef]
- Pino, L.K.; Just, S.C.; MacCoss, M.J.; Searle, B.C. Acquiring and Analyzing Data Independent Acquisition Proteomics Experiments Without Spectrum Libraries. Mol. Cell. Proteom. 2020, 19, 1088–1103. [Google Scholar] [CrossRef]
- Bai, Y.; Yan, T.; Fang, F.; Li, X.; Wang, S.; Li, J.; Hou, C.; Zhang, D. DIA-based quantitative proteomic analysis on porcine meat quality at different chilling rates. Food Sci. Hum. Wellness 2024, 13, 2573–2583. [Google Scholar] [CrossRef]
- Li, L.; Lu, X.; Dai, P.; Ma, H. DIA-Based Quantitative Proteomics in the Flower Buds of Two Malus sieversii (Ledeb.) M. Roem Subtypes at Different Overwintering Stages. Int. J. Mol. Sci. 2024, 25, 2964. [Google Scholar] [CrossRef]
- Song, Y.; Huang, F.; Li, X.; Zhang, H.; Liu, J.; Han, D.; Rui, M.; Wang, J.; Zhang, C. DIA-based quantitative proteomic analysis on the meat quality of porcine Longissimus thoracis et lumborum cooked by different procedures. Food Chem. 2022, 371, 131206. [Google Scholar] [CrossRef] [PubMed]
- Ding, R.; Liu, Z.; Wang, J.; Xia, T.; Li, L. DIA-based quantitative proteomics analysis of plasma exosomes in rat model of allergic rhinitis. Anal. Biochem. 2024, 688, 115463. [Google Scholar] [CrossRef] [PubMed]
- Chen, X.; Wang, Y.; Dou, X.; Wan, J.; Zhou, J.; Li, T.; Yu, J.; Ye, F. Integrative metabolomics and proteomics reveal the effect and mechanism of Zi Qi decoction on alleviating liver fibrosis. Sci. Rep. 2024, 14, 28943. [Google Scholar] [CrossRef] [PubMed]
- Ross, P.L.; Huang, Y.L.N.; Marchese, J.N.; Williamson, B.; Parker, K.; Hattan, S.; Khainovski, N.; Pillai, S.; Dey, S.; Daniels, S.; et al. Multiplexed protein quantitation in Saccharomyces cerevisiae using amine-reactive isobaric tagging reagents. Mol. Cell. Proteom. 2004, 3, 1154–1169. [Google Scholar] [CrossRef]
- Wu, J.; An, Y.; Pu, H.; Shan, Y.; Ren, X.; An, M.; Wang, Q.; Wei, S.; Ji, J. Enrichment of serum low-molecular-weight proteins using C18 absorbent under urea/dithiothreitol denatured environment. Anal. Biochem. 2010, 398, 34–44. [Google Scholar] [CrossRef]
- Yu, F.; Haynes, S.E.; Teo, G.C.; Avtonomov, D.M.; Polasky, D.A.; Nesvizhskii, A.I. Fast Quantitative Analysis of timsTOF PASEF Data with MSFragger and IonQuant. Mol. Cell. Proteom. 2020, 19, 1575–1585. [Google Scholar] [CrossRef]
- Meng, F.; Wang, Y.; Liu, Y.; Hao, Z.; Li, F.; Wang, Y.; Ding, Y.; Li, Y.; Jiang, Y. Naturally Occurring New Peptides from Velvet Antler of Cervus nippon Temminck: Structural Characterization and Organic Synthesis, Antioxidant and Anti-melanogenic Effects Using In Vitro Cell Models and In Vivo Zebrafish Models. Chem. Biodivers. 2025, e00288. [Google Scholar] [CrossRef]
- Lopez-Pedrouso, M.; Lorenzo, J.M.; Landete-Castillejos, T.; Chonco, L.; Perez-Barberia, F.J.; Garcia, A.; Lopez-Garrido, M.-P.; Franco, D. SWATH-MS Quantitative Proteomic Analysis of Deer Antler from Two Regenerating and Mineralizing Sections. Biology 2021, 10, 679. [Google Scholar] [CrossRef]
- Liu, L.; Jiao, Y.; Yang, M.; Wu, L.; Long, G.; Hu, W. Network Pharmacology, Molecular Docking and Molecular Dynamics to Explore the Potential Immunomodulatory Mechanisms of Deer Antler. Int. J. Mol. Sci. 2023, 24, 10370. [Google Scholar] [CrossRef]
- Ni, Y.; Wang, Z.; Ma, L.; Yang, L.; Wu, T.; Fu, Z. Pilose antler polypeptides ameliorate inflammation and oxidative stress and improves gut microbiota in updates hypoxic-ischemic injured rats. Nutr. Res. 2019, 64, 93–108. [Google Scholar] [CrossRef] [PubMed]
- Shao, M.-J.; Wang, S.-R.; Zhao, M.-J.; Lv, X.-L.; Xu, H.; Li, L.; Gu, H.; Zhang, J.-L.; Li, G.; Cui, X.-N.; et al. The Effects of Velvet Antler of Deer on Cardiac Functions of Rats with Heart Failure following Myocardial Infarction. Evid.-Based Complement Altern. Med. 2012, 2012, 825056. [Google Scholar] [CrossRef] [PubMed]
- Xiao, X.; Xu, S.; Li, L.; Mao, M.; Wang, J.; Li, Y.; Wang, Z.; Ye, F.; Huang, L. The Effect of Velvet Antler Proteins on Cardiac Microvascular Endothelial Cells Challenged with Ischemia-Hypoxia. Front. Pharmacol. 2017, 8, 601. [Google Scholar] [CrossRef] [PubMed]
- Wu, T.; Yang, L.; Chen, Y.; Ni, Y.; Jiang, J.; Zhang, W.; Zhou, Q.; Zheng, X.; Wang, Q.; Fu, Z.; et al. Pilose antler polypeptides ameliorates hypoxic-ischemic encephalopathy by activated neurotrophic factors and SDF1/CXCR4 axis in rats. Acta Biochim. Biophys. Sin. 2018, 50, 254–262. [Google Scholar] [CrossRef]
- Pei, H.; Du, R.; He, Z.; Yang, Y.; Wu, S.; Li, W.; Sheng, J.; Lv, Y.; Han, C. Protection of a novel velvet antler polypeptide PNP1 against cerebral ischemia-reperfusion injury. Int. J. Biol. Macromol. 2023, 247, 125815. [Google Scholar] [CrossRef]
- Xia, P.; Liu, D.; Jiao, Y.; Wang, Z.; Chen, X.; Zheng, S.; Fang, J.; Hao, L. Health Effects of Peptides Extracted from Deer Antler. Nutrients 2022, 14, 4183. [Google Scholar] [CrossRef]
- Gustafsson, A.B.; Gottlieb, R.A. Bcl-2 family members and apoptosis, taken to heart. Am. J. Physiol.-Cell Physiol. 2007, 292, C45–C51. [Google Scholar] [CrossRef]
- Sui, Z.; Sun, H.; Weng, Y.; Zhang, X.; Sun, M.; Sun, R.; Zhao, B.; Liang, Z.; Zhang, Y.; Li, C.; et al. Quantitative proteomics analysis of deer antlerogenic periosteal cells reveals potential bioactive factors in velvet antlers. J. Chromatogr. A 2020, 1609, 460496. [Google Scholar] [CrossRef]
- Qin, T.; Zhang, G.; Zheng, Y.; Li, S.; Yuan, Y.; Li, Q.; Hu, M.; Si, H.; Wei, G.; Gao, X.; et al. A population of stem cells with strong regenerative potential discovered in deer antlers. Science 2023, 379, 840–847. [Google Scholar] [CrossRef]
- Wang, D.; Berg, D.; Ba, H.; Sun, H.; Wang, Z.; Li, C. Deer antler stem cells are a novel type of cells that sustain full regeneration of a mammalian organ-deer antler. Cell Death Dis. 2019, 10, 443. [Google Scholar] [CrossRef]
- Dong, Z.; Ba, H.; Zhang, W.; Coates, D.; Li, C. iTRAQ-Based Quantitative Proteomic Analysis of the Potentiated and Dormant Antler Stem Cells. Int. J. Mol. Sci. 2016, 17, 1778. [Google Scholar] [CrossRef]
- Lei, J.; Jiang, X.; Li, W.; Ren, J.; Wang, D.; Ji, Z.; Wu, Z.; Cheng, F.; Cai, Y.; Yu, Z.-R.; et al. Exosomes from antler stem cells alleviate mesenchymal stem cell senescence and osteoarthritis. Protein Cell 2022, 13, 220–226. [Google Scholar] [CrossRef] [PubMed]
- Qi, T.; Gao, H.; Dang, Y.; Huang, S.; Peng, M. Cervus and cucumis peptides combined umbilical cord mesenchymal stem cells therapy for rheumatoid arthritis. Medicine 2020, 99, e21222. [Google Scholar] [CrossRef] [PubMed]
- Yao, B.; Zhao, Y.; Wang, Q.; Zhang, M.; Liu, M.; Liu, H.; Li, J. De novo characterization of the antler tip of Chinese Sika deer transcriptome and analysis of gene expression related to rapid growth. Mol. Cell. Biochem. 2012, 364, 93–100. [Google Scholar] [CrossRef]
- Yao, B.; Zhang, M.; Liu, M.; Wang, Q.; Liu, M.; Zhao, Y. Sox9 Functions as a Master Regulator of Antler Growth by Controlling Multiple Cell Lineages. DNA Cell Biol. 2018, 37, 15–22. [Google Scholar] [CrossRef]
- Yao, B.; Zhang, M.; Leng, X.; Zhao, D. Proteomic analysis of the effects of antler extract on chondrocyte proliferation, differentiation and apoptosis. Mol. Biol. Rep. 2019, 46, 1635–1648. [Google Scholar] [CrossRef]
- Yao, B.; Zhao, Y.; Zhang, H.; Zhang, M.; Liu, M.; Liu, H.; Li, J. Sequencing and de novo analysis of the Chinese Sika deer antler-tip transcriptome during the ossification stage using Illumina RNA-Seq technology. Biotechnol. Lett. 2012, 34, 813–822. [Google Scholar] [CrossRef]
- Guo, K.; Wang, T.; Luo, E.; Leng, X.; Yao, B. Use of Network Pharmacology and Molecular Docking Technology to Analyze the Mechanism of Action of Velvet Antler in the Treatment of Postmenopausal Osteoporosis. Evid.-Based Complement Altern. Med. 2021, 2021, 7144529. [Google Scholar] [CrossRef]
- Li, N.; Zhao, L.; Lin, Z.; Li, J.; Li, H.; Sun, J.; Zhu, K.; Yu, Z.; Xu, K.; Yang, Q.; et al. Metabonomics Study of the Anti-Osteoporosis Effect of Velvet Collagen Hydrolysate Using Rapid Resolution Liquid Chromatography Combined with Quadrupole Time-of-Flight Tandem Mass Spectrometry. J. Liq. Chromatogr. Relat. Technol. 2015, 38, 117–122. [Google Scholar] [CrossRef]
- Dong, Z.; Coates, D. Bioactive Molecular Discovery Using Deer Antlers as a Model of Mammalian Regeneration. J. Proteome Res. 2021, 20, 2167–2181. [Google Scholar] [CrossRef]
- Pan, W.; Du, J.; An, L.; Xu, G.; Yuan, G.; Sheng, Y.; Sun, J.; Wang, M.; Zhao, N.; Guo, X.; et al. Sika deer velvet antler protein extract modulater bone metabolism and the structure of gut microbiota in ovariectomized mice. Food Sci. Nutr. 2023, 11, 3309–3319. [Google Scholar] [CrossRef]
- Yang, Q.; Lin, J.-N.; Sui, X.; Li, H.; Kan, M.; Wang, J.-F.; Li, J.; Zhang, Z.; Liu, X.-R.; Ming, S.-T.; et al. Antiapoptotic effects of velvet antler polypeptides on damaged neurons through the hypothalamic-pituitary-adrenal axis. J. Integr. Neurosci. 2020, 19, 469–477. [Google Scholar] [CrossRef]
- Liu, X.; Yang, Q.; Li, H.; Lan, X.; Kan, M.; Lin, J.; Wang, J.; Zhang, Z.; Ming, S.; Li, Z.; et al. The anti-aging effect of velvet antler polypeptide is dependent on modulation of the gut microbiota and regulation of the PPARα/APOE4 pathway. J. Integr. Neurosci. 2021, 20, 573–583. [Google Scholar] [CrossRef] [PubMed]
- Zhang, T.; Liang, Y.; Zhang, J. Natural and synthetic compounds as dissociated agonists of glucocorticoid receptor. Pharmacol. Res. 2020, 156, 104802. [Google Scholar] [CrossRef]
- Chen, J.-C.; Hsiang, C.-Y.; Lin, Y.-C.; Ho, T.-Y. Deer Antler Extract Improves Fatigue Effect through Altering the Expression of Genes Related to Muscle Strength in Skeletal Muscle of Mice. Evid.-Based Complement Altern. Med. 2014, 2014, 540580. [Google Scholar] [CrossRef]
- Hung, Y.-K.; Ho, S.-T.; Kuo, C.-Y.; Chen, M.-J. Multiomics Strategy Reveals the Mechanism of Action and Ameliorating Effect of Deer Velvet Antler Water Extracts on DSS-Induced Colitis. Biomedicines 2023, 11, 1913. [Google Scholar] [CrossRef] [PubMed]
- Zhang, G.; Wang, D.; Ren, J.; Sun, H.; Li, J.; Wang, S.; Shi, L.; Wang, Z.; Yao, M.; Zhao, H.; et al. Velvet Antler Peptides Reduce Scarring via Inhibiting the TGF-β Signaling Pathway During Wound Healing. Front. Med. 2022, 8, 799789. [Google Scholar] [CrossRef]
- Hao, M.; Peng, X.; Sun, S.; Ding, C.; Liu, W. Chitosan/Sodium Alginate/Velvet Antler Blood Peptides Hydrogel Promoted Wound Healing by Regulating PI3K/AKT/mTOR and SIRT1/NF-κB Pathways. Front. Pharmacol. 2022, 13, 913408. [Google Scholar] [CrossRef]
- Xu, G.; Zhao, H.; Xu, J.; Zhang, Y.; Qi, X.; Shi, A. Hard antler extract inhibits invasion and epithelial-mesenchymal transition of triple-negative and Her-2+ breast cancer cells by attenuating nuclear factor-κB signaling. J. Ethnopharmacol. 2021, 269, 113705. [Google Scholar] [CrossRef]
- Cao, T.-Q.; An, H.-X.; Ma, R.-J.; Dai, K.-Y.; Ji, H.-Y.; Liu, A.-J.; Zhou, J.-P. Structural characteristics of a low molecular weight velvet antler protein and the anti-tumor activity on S180 tumor-bearing mice. Bioorg. Chem. 2023, 131, 106304. [Google Scholar] [CrossRef]
- Zheng, K.; Li, Q.; Lin, D.; Zong, X.; Luo, X.; Yang, M.; Yue, X.; Ma, S. Peptidomic analysis of pilose antler and its inhibitory effect on triple-negative breast cancer at multiple sites. Food Funct. 2020, 11, 7481–7494. [Google Scholar] [CrossRef]
- Sun, H.; Xiao, D.; Liu, W.; Li, X.; Lin, Z.; Li, Y.; Ding, Y. Well-known polypeptides of deer antler velvet with key actives: Modern pharmacological advances. Naunyn-Schmiedeb. Arch. Pharmacol. 2024, 397, 15–31. [Google Scholar] [CrossRef]
- Li, L.; Wang, L.; Ding, W.; Wu, J.; Liu, F.; Liu, J.; Zhang, J.; Wang, J. The Improvement Effects of Sika Deer Antler Protein in an Alzheimer’s Disease Mouse Model via the Microbe-Gut-Brain Axis. Food Sci. Nutr. 2025, 13, e4656. [Google Scholar] [CrossRef]
Disclaimer/Publisher’s Note: The statements, opinions and data contained in all publications are solely those of the individual author(s) and contributor(s) and not of MDPI and/or the editor(s). MDPI and/or the editor(s) disclaim responsibility for any injury to people or property resulting from any ideas, methods, instructions or products referred to in the content. |
© 2025 by the authors. Licensee MDPI, Basel, Switzerland. This article is an open access article distributed under the terms and conditions of the Creative Commons Attribution (CC BY) license (https://creativecommons.org/licenses/by/4.0/).