Article

Comparative Study of Force and Deformation Characteristics of Closed Cavity Thin-Walled Components in Prefabricated Metro Station

1
College of Civil Engineering and Architecture, Shandong University of Science and Technology, Qingdao 266590, China
2
Shandong Provincial Key Laboratory of Civil Engineering Disaster Prevention and Mitigation, Shandong University of Science and Technology, Qingdao 266590, China
*
Author to whom correspondence should be addressed.
Appl. Sci. 2025, 15(17), 9674; https://doi.org/10.3390/app15179674
Submission received: 8 July 2025 / Revised: 20 August 2025 / Accepted: 1 September 2025 / Published: 2 September 2025

Abstract

The increased use of prefabricated assembly technology promotes the transformation of urban subway construction in the lightweight direction, in which the closed cavity thin-walled component is increasingly widely used in underground structures due to its excellent material efficiency benefits. In order to investigate the effect of closed cavity thin-walled components, numerical models of a seven-ring solid structure and cavity structure were constructed based on the four-block prefabricated metro station of Qingdao Metro Line 9, Chengzi Station. This study considers the longitudinal effect between rings and compares the nonlinear force and deformation characteristics of both structures under the load of self-weight and use stage. The study indicates that incorporating closed cavities within structures reduces internal forces in most sections while increasing principal strain, displacement, and stress. As the applied load increases, the rate of internal force reduction diminishes, and the increment of displacement deformation also decreases. Shear lag effects occur in closed cavity sections, leading to a non-uniform normal stress distribution, with maximum shear stress appearing at rib intersections. The cavity location, mortise–tenon joints, and columns represent critical locations for deformation and force transmission within cavity structures. Optimization design must prioritize ensuring their deformation resistance and load-bearing capacity to enhance the overall structural integrity, safety, and reliability.

1. Introduction

In order to adapt to the development needs of industrial building construction, prefabricated assembly technology has transformed the conventional mode of construction that must be carried out on site into a construction method that produces the necessary prefabricated components in factories and transports them to the site for assembly. This method overcomes the problems of material waste, noise pollution, and complicated safety management generated by conventional cast-in-place construction [1,2]. This green and sustainable construction method has seen increased adoption in urban underground projects, attributable to its merits of a high construction efficiency, minimal material consumption, and reduced environmental impact [3,4].
In the 1980s, in order to solve the problem of difficult concrete cast-in-place construction in winter, the former Soviet Union pioneered the utilization of prefabricated components in conjunction with cast-in-place concrete, resulting in a combined assembly structure employed in open-cut metro construction [5]. In 2012, China pioneered the adoption of fully prefabricated assembly technology for the Changchun Metro Line 2, employing a dry connection method for each component. Considering the construction stability, the structural design of the station is mostly rectangular or arch-shaped, and the structure is divided into multiple standard rings longitudinally and then split into several standard components in the ring direction [6]. The Changchun Metro divided the standard ring into seven pieces. The Qingdao Metro Phase II divided the ring into five pieces and merged the three bottom slabs into one. The Shenzhen and Qingdao Metro Phase III continued to merge the two top slabs into one on this basis, and adjusted the high arch into a flat arch, forming a four-piece program [7,8]. With the decrease in the number of pieces, the weight of a single component became larger, bringing certain difficulties to the transportation, lifting, and assembly operations. For the lightweight construction of prefabricated metro station, an innovative approach involves the use of closed cavity thin-walled components. This method involves setting up cavities in the interior of the prefabricated components to ensure that the overall assembly meets the requirements of the load-bearing capacity, which at the same time achieves the purpose of reducing the self-weight of the components, reducing the amount of materials, and reducing the cost of the project [9].
Presently, the field of research concerning prefabricated metro stations is predominantly centered on two primary categories: fully assembled metro stations and assembled monolithic metro stations [10,11,12,13]. The fully assembled metro station structural type is mostly single-arch large-span structures, where each component has mortise and tenon joints and other types of splicing to form a dry connection. The assembled monolithic metro station has mostly rectangular structures, with prefabricated components using wet connection that is, through bar welding, bar lap, or sleeve grouting and other ways to connect, which takes place in cast-in-place concrete [14,15]. Many scholars have conducted in-depth research on these two types of subway stations. The research content is primarily concentrated on four aspects: sectional structure type [16,17], joint performance research [18,19,20,21], static deformation characteristic analysis [22,23,24], and seismic performance analysis [25,26,27,28]. Research on the static deformation characteristics of prefabricated metro stations focuses on the mechanical properties after assembling into a ring [29], force deformation research in the normal use stage [6,30], and research on the structural stress performance in the construction stage [31,32,33]. Extant research on the closed cavity thin-walled components employed in the assembly of the fully assembled metro station is not sufficiently comprehensive.
The structural form, stress, and force transmission path of closed cavity thin-walled components are complex due to the existence of an internal cavity. In order to ensure safe and lightweight construction, some scholars have studied the applicability and design parameters of closed cavity thin-walled components. However, the load type and structural type of the members are relatively limited. For example, Yang et al. investigated the mechanical properties and primary construction technologies of prefabricated metro stations, proposed lightweight closed cavity thin-walled components, and demonstrated that the bearing capacity and deformation of the novel prefabricated structure are within the allowable range [34]; Ding et al. proposed an optimization scheme for the closed cavity structure based on the prefabricated metro station of Changchun Metro, and analyzed the mechanical properties of the two stations with a solid and cavity ratio of 18.5% after the structure was assembled into a ring through numerical simulation. In order to study the influence of a closed cavity layout on structural performance [35], Tao et al. studied the mechanical and deformation properties of four models of one row, two rows, three rows of cavities and no cavities under vertical load under the condition of the same cavity rate of 18% [36]. The aforementioned results show that the assembled structure has a good bearing and deformation capacity. However, it should be noted that these studies were conducted on a single-ring structure model of the prefabricated metro station, with the primary objective being to assess the bearing capacity of the structure under vertical loading conditions. They did not encompass the transfer of forces between adjacent rings, nor did they address the deformation characteristics of the closed cavity thin-walled components under the loading conditions of the normal use phase.
Han et al. established a numerical model of a flat closed cavity thin-walled component, and conducted a comprehensive analysis of various structural parameters, including the closed cavity and the end plate [37]. It was found that the dimensions of the end plate would affect the stress transfer path, and the component demonstrated optimal performance when the thickness-to-height ratio was 0.43. Taking the prefabricated station of Changchun Metro Line 2 as an example, Yang and Han et al. studied the stress distribution law of the flat closed cavity component and the actual station closed cavity thin-walled structure, and proposed reasonable structural parameters for the cavity ratio, flange, and rib plate [38,39,40]. Huang also took Changchun subway as an example, analyzing and summarizing its mechanical characteristics, joint structure, joint waterproofing, and durability [41]. In addition, she proposed specifications and standards that could serve as a valuable reference for the design and construction of closed cavity thin-walled structures. However, in all the above studies, the structural type of the station has focused on a seven-block scheme of the double-component top arch, neglecting to consider the overall mechanical properties of the cavity structure under different block modes.
Based on the prefabricated metro station in Qingdao Metro Phase III, this paper establishes a large-span four-block metro station model with a flat arch using a finite element method. Assuming the column ring as the central ring, three rings are positioned anteriorly and posteriorly, resulting in a total of seven rings that comprise the multi-ring structure. This design takes into account the longitudinal effects between rings in order to restore the longitudinal continuity of the actual station. A comparative analysis was conducted between a solid structure and a closed cavity, thin-walled structure under two load conditions: self-weight and use stage load. The analysis covers structural load scenarios throughout the entire lifecycle, from construction to operation. Additionally, this study focuses on the nonlinear deformation characteristics of closed cavity thin-walled components under use stage loads, addressing the limitation of previous research, which primarily focused on vertical loads. This study quantifies the influence of the shear lag effect, enabling a systematic assessment of the stress–deformation characteristics of closed cavity thin-walled components. This facilitates engineers’ enhanced comprehension of structural responses to load variations, thereby circumventing redundancies in design or safety hazards stemming from load estimation inaccuracies. Consequently, this enhances engineering efficiency and cost-effectiveness, while propelling the evolution of underground engineering towards more environmentally sustainable and efficient paradigms.

2. Materials and Methods

2.1. Overview of Prefabricated Metro Station

Chengzi Station of the Qingdao Metro Line 9 was constructed using prefabricated assembly technology. It is located on the west side of the intersection of Zhengyang Middle Road and Xiucheng Road. The station runs east–west along Zhengyang Middle Road. It is a two-layer underground island station. The platform is 11 m wide, the station is 210 m long, and the thickness of the roof covering soil is 3.6 m. The station was constructed using the open excavation method. The main body and auxiliary structure of the station are shown in Figure 1.
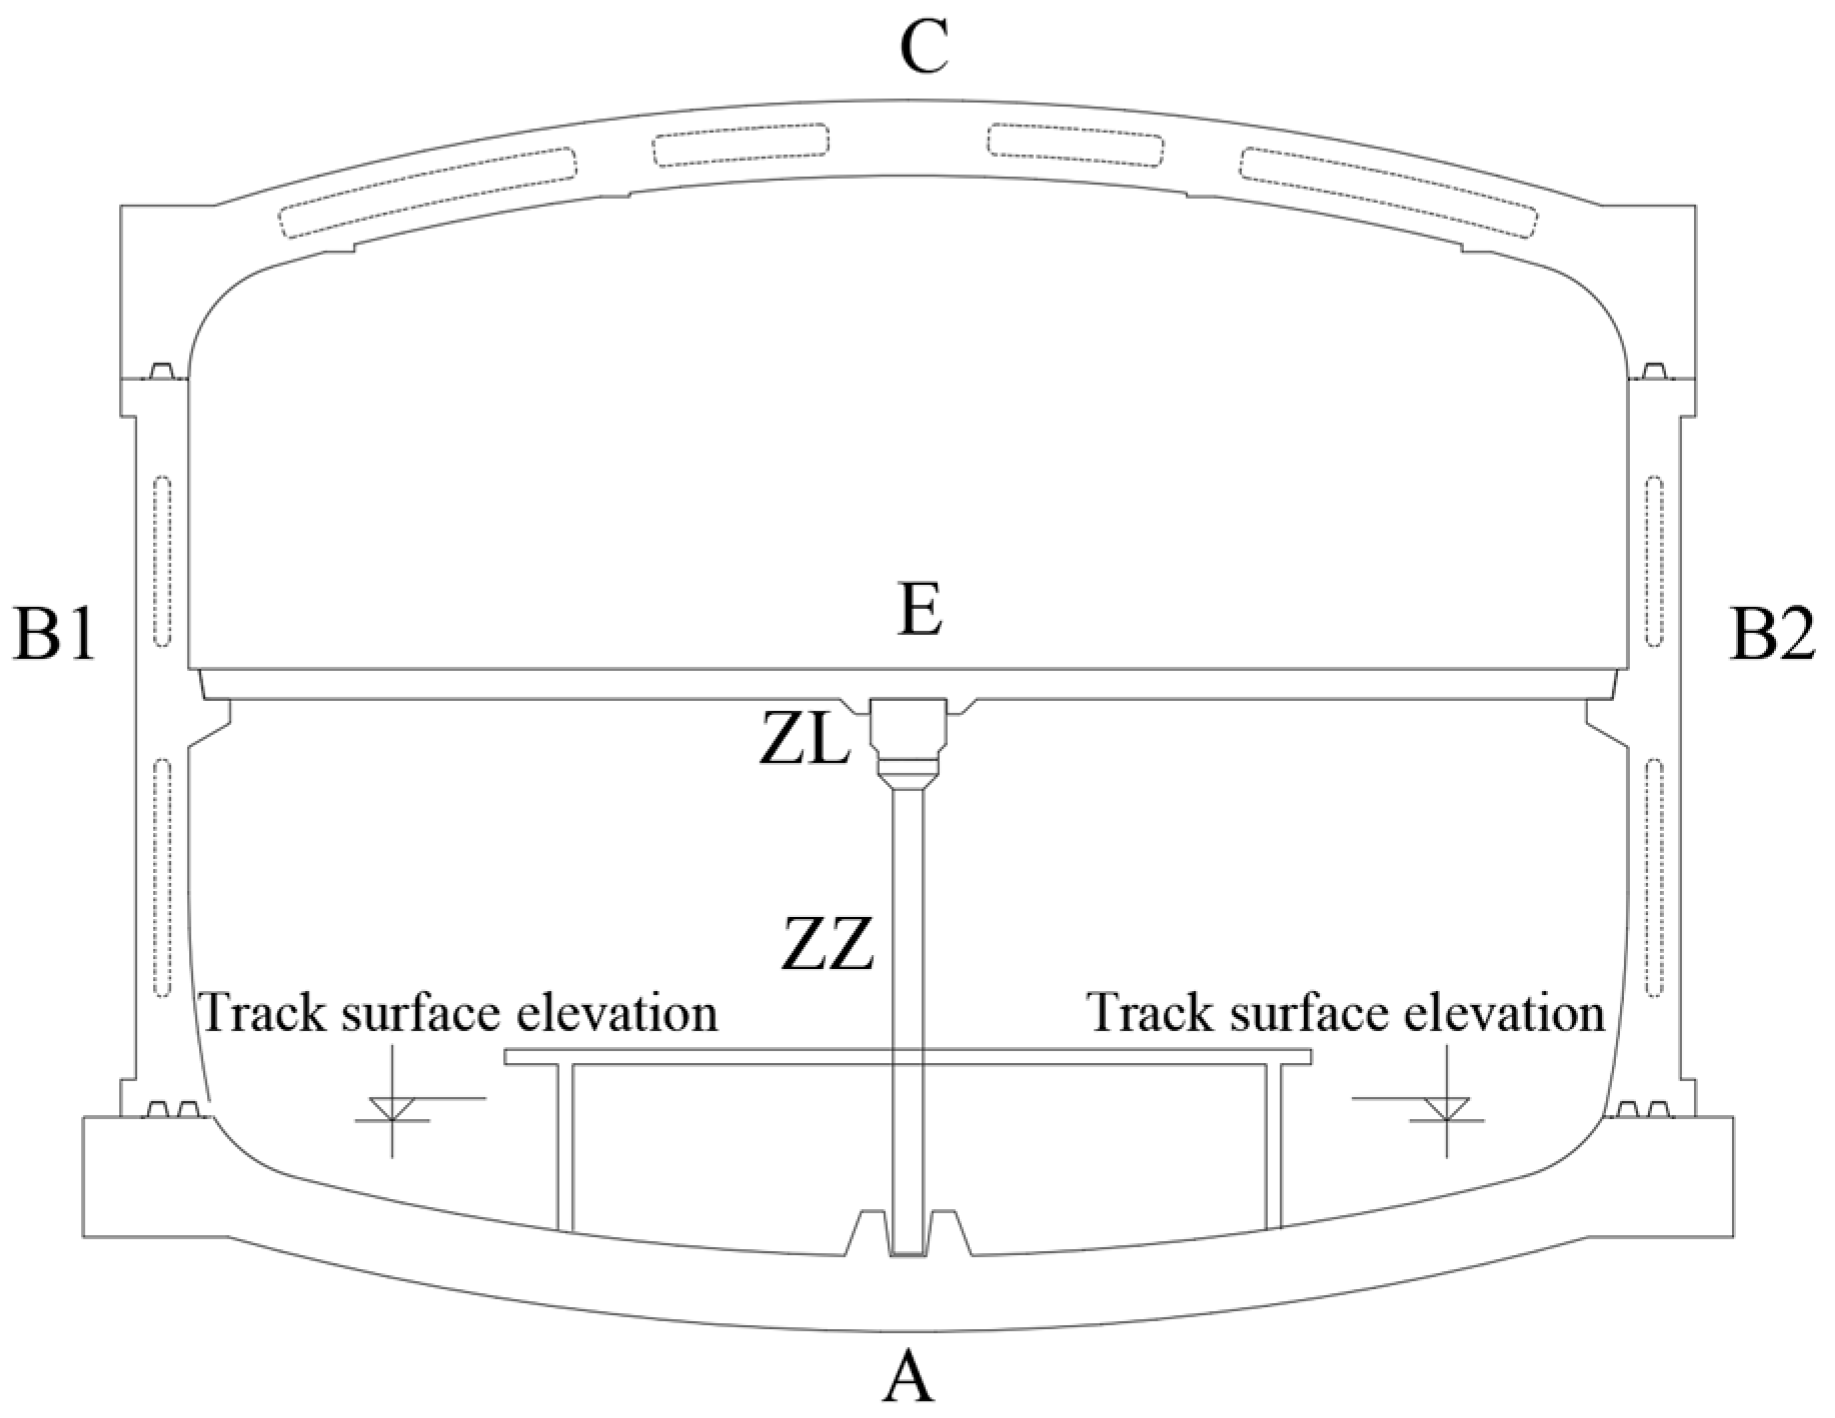
The prefabricated metro station is a large-span, single-arch structure with a 2 m ring width and a middle column set every 8 m. A total of 71 rings were designed, 63 of which are standard and 8 of which are for entrances and exits. Each prefabricated standard ring can be split into four blocks: the vault structure C, the left side wall B1, the right side wall B2, and the floor A. The floor A is a cast-in-place construction and the other sub-blocks are prefabricated components. The C block is a top arch component. In addition, there is the medium plate E, middle column ZZ, and longitudinal beam ZL. The prefabricated standard ring sub-blocks are shown in Figure 2. The vault structure (C) is 20.9 m long and 3.7 m high, the floor (A) is 21.9 m long and 16.35 m high, the medium plate (E) is 18.8 m long and 0.4 m thick, the middle column (ZZ) is 0.5 m wide and 6.55 m high, and the longitudinal beam (ZL) has a cross-section that is 1 m long, 0.8 m wide, and 14 m long.
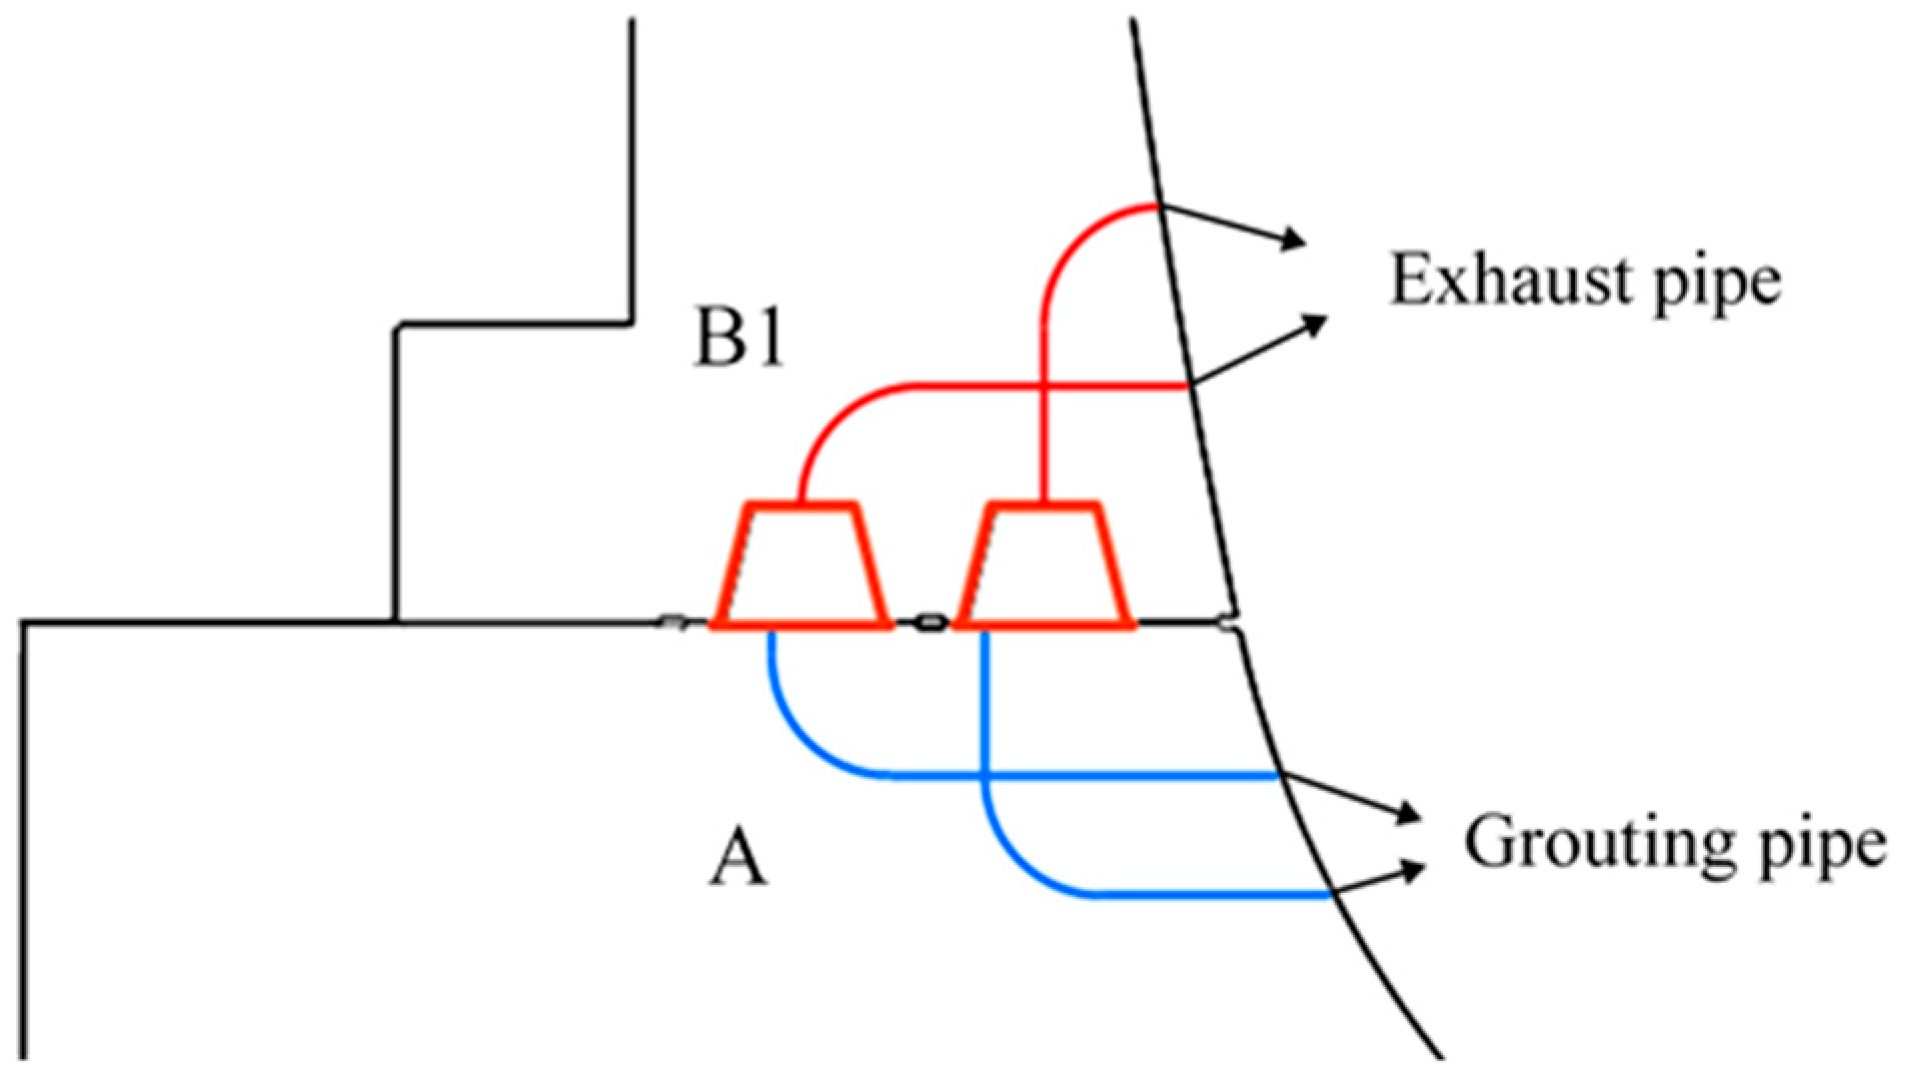
The prefabricated metro station is assembled using longitudinal through-seam assembly. The four components are connected by grouted mortise and tenon joints. In other words, a mortise is set at one end of each prefabricated component and a tenon groove is set at the other end. After aligning and assembling the two components, grout is poured through the grouting holes in the joints to reinforce them. This effectively fills the gaps between the prefabricated components. The grouting process for the prefabricated components’ mortise–tenon joints is initiated from the bottom up. Grouting and exhaust pipes are embedded in the components at the ends of the tenon and mortise, respectively. The grouting pipes are arranged at the bottom and the exhaust pipes at the top. Figure 3 shows a schematic diagram of the tenon groove grouting pipe layout. The grout used is a modified epoxy resin. During operation, grouting is performed under pressure through the grouting pipes. The exhaust pipes gradually release air until grout begins to seep out, which indicates that the joint is fully filled with grout.
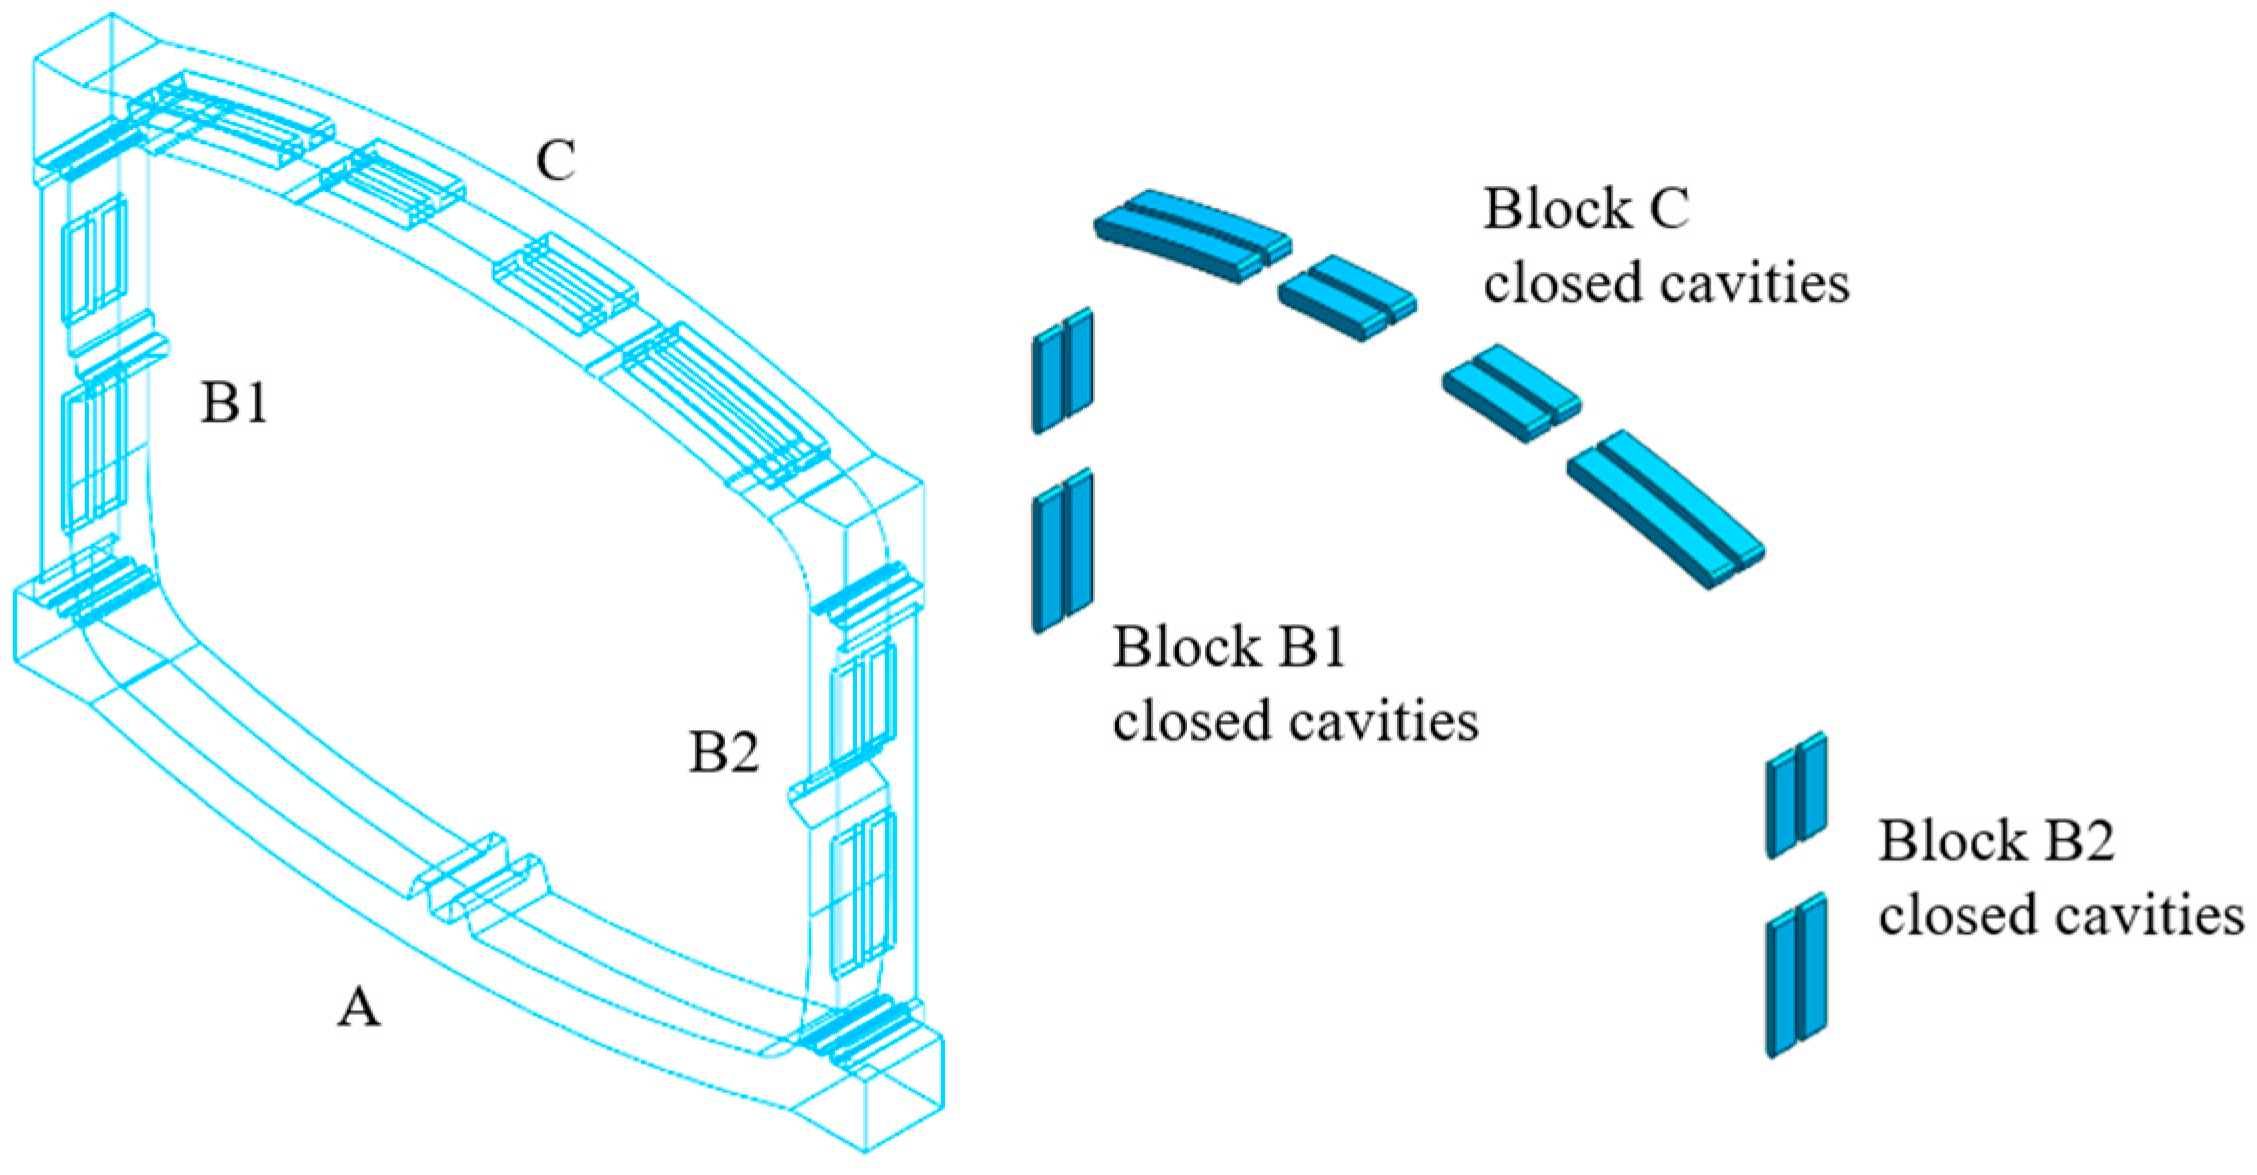
The vault structure (C) and the left and right side walls (B1 and B2) are made of closed cavity thin-walled components with internal closed cavities and chamfered corners with a radius of 100 mm at the ends of the cavities. The internal cavity arrangement is shown in Figure 4. The single-ring structure has sixteen closed cavities with a total volume of 8.16 m3, and the total volume of the three solid, closed cavity, thin-walled prefabricated components is 84 m3, with a hollowing rate of 9.71%. The parameters of the single-ring solid prefabricated components are shown in Table 1.

2.2. Three-Dimensional Modeling

2.2.1. Key Elements of Solid Structure and Cavity Structure Modeling

In order to ensure the accuracy and reliability of the finite element model, it is imperative that the model dimensions and prefabricated component parameters comply with the actual engineering data of Qingdao Metro Line 9 Chengzi Station. Furthermore, the soil layer parameters must be determined based on the results of on-site geological surveys. The material parameters, load calculations, and boundary constraints employed in this study are in strict compliance with the Code for Construction of Concrete Structures (GB 50666-2011 [42]) and relevant standards for underground engineering. The present study utilizes a modeling method that controls for a single variable, with “whether a closed cavity is set” as the sole variable. With the exception of the closed cavity configuration, the two models demonstrate complete consistency with regard to materials, meshes, connections, loads, and boundary conditions. This ensures that the observed differences in stress deformation are exclusively attributable to the lightweight design, thereby circumventing the confounding effects of multiple variables on the reliability of the conclusions.

2.2.2. The Finite Element Modeling

In order to explore the force and deformation characteristics of solid and cavity structures, three-dimensional load–structure models of multi-ring solid and cavity structures are established, respectively. In the process of assembling prefabricated components, it is first necessary to erect the column and longitudinal beam. Subsequently, the remaining prefabricated components should be assembled in sequence. Each longitudinal beam component is 14 m in length, with columns positioned at intervals of 8 m. The width of a standard ring is 2 m; thus, seven rings form a group. Consequently, when modeling, the intermediate rings with columns are selected, along with the three rings preceding and following them, to establish a prefabricated metro station structure consisting of seven rings. This approach is characterized by its comprehensive consideration of the longitudinal effects between station rings, thereby ensuring a more precise alignment with the structural form of multi-ring assembly in actual stations.
The prefabricated metro station is principally subject to gravity and soil and water pressure. The adoption of a lightweight design in prefabricated components contributes to a reduction in the structure’s gravitational forces. The periphery of the pit is supported by diaphragm walls, ensuring that the force and deformation of the station structure remain within the linear elastic range. This prevents the occurrence of plastic damage. To simulate the mechanical behavior of each component, the elastic intrinsic model is employed. The vault structure, the floor, and side walls are composed of C45 concrete, the medium plate and longitudinal beam are composed of C35 concrete, and the middle column is composed of C50 concrete. The structural material parameters are derived from Code for Construction of Concrete Structures (GB 50666-2011), as illustrated in Table 2.
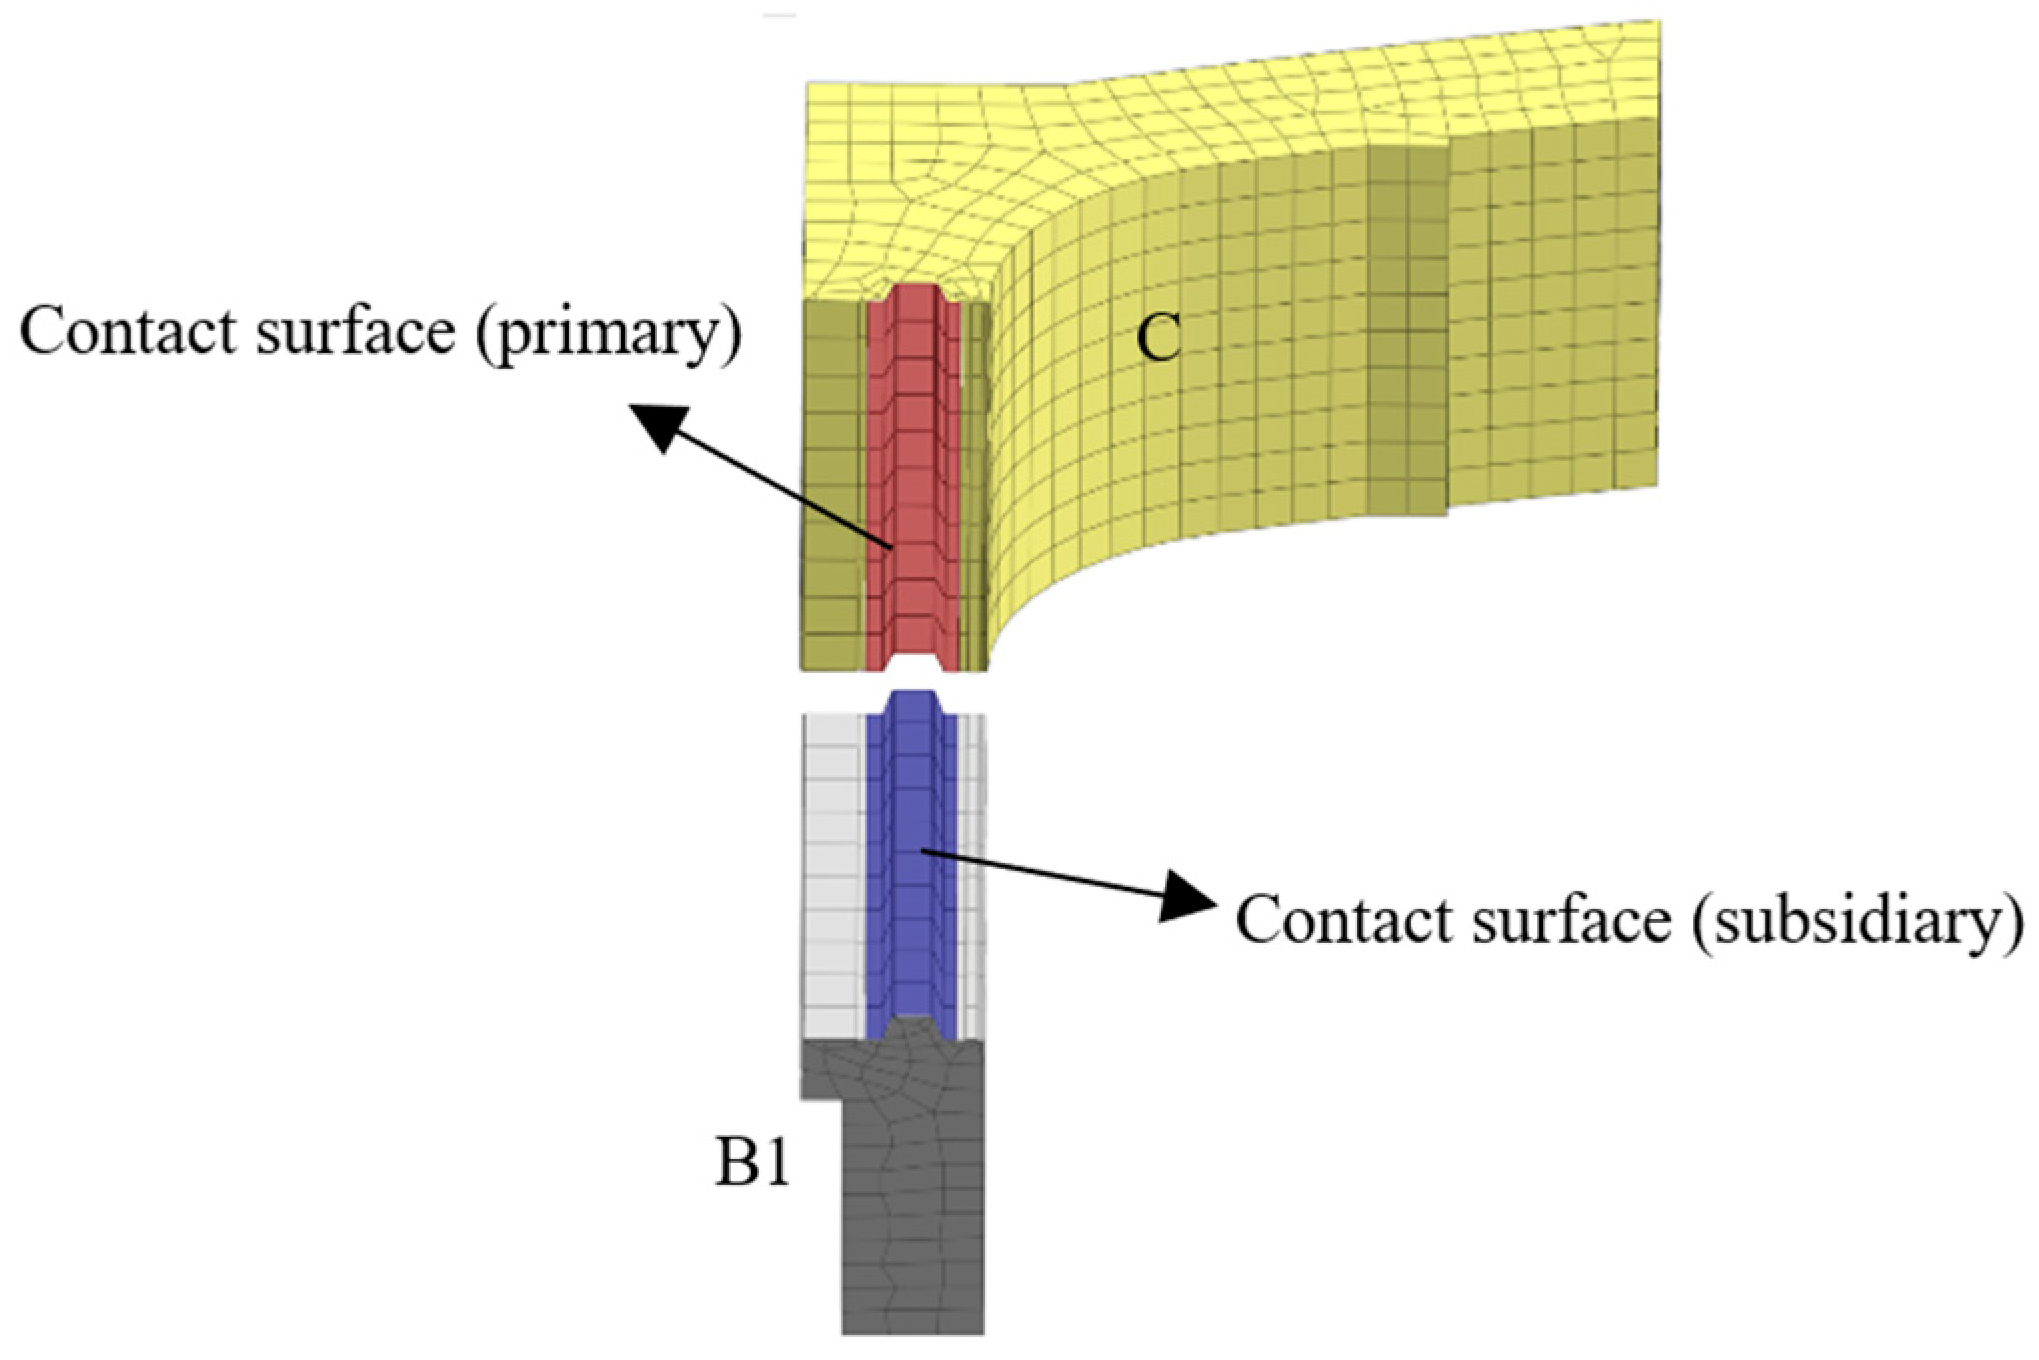
Grouted mortise–tenon joints were simulated using contact pairs, taking the C-B1 joint as an example, see Figure 5. The adjustment subsidiary nodes were set to eliminate internal penetrations, with no intrusion between units. The tangential stiffness scaling factor of the contact surfaces between members was 1/10 of the normal stiffness scaling factor. The friction coefficient was set tangentially and took the value of 0.55 [43]. This study did not take into account nonlinear behaviors such as joint slippage and damage. Rather, it simplified them into contact elements for simulation for the following reasons: The focal point of this study is a comparative analysis of the disparities between a solid structure and a cavity structure, as opposed to an examination of the failure mechanisms of joints. The sole variable that requires management is the determination of whether to set closed cavities. In order to circumvent the nonlinear effects of joints on structural internal forces and stress distributions, and to ensure consistency in the force transmission characteristics of joints between Models M-1 and M-2, the current model employs isotropic Coulomb friction contact to simulate joints. The parameters of this model are referenced from existing experimental studies on grouted mortise–tenon joints in prefabricated metro stations. Subsequent research endeavors may involve the incorporation of a concrete plastic damage model to investigate the local failure characteristics of the joint, thereby leading to the proposal of novel joint forms.
In order to explore the differences in the deformation and mechanical properties between a solid structure and a cavity structure, two models, M-1 and M-2, were set up and two working conditions were set for comparative analysis, as shown in Table 3. The structural dimensions, material properties, mesh types, loads, and boundary conditions of the two models were kept consistent, and the prefabricated components were connected using grouted mortise–tenon joints. The only variable was whether there were closed cavities inside. Model M-1 is a solid structure without closed cavities inside, and all prefabricated components are solid. Model M-2 is a cavity structure, and the vault (C) and side walls (B1, B2) of the prefabricated components are closed cavity thin-walled components. Only two rows of closed cavities are added to Model M-1, for a total of 16, each with a width of 600 mm and a cavity rate of 9.71%. The rest of the settings are completely consistent.
In finite element models, to account for the spatial effects of thin-walled closed cavity components, 3D solid elements are used for calculations. When generating the mesh, both models employ a hybrid mesh generator, resulting in a mesh predominantly composed of hexahedrons. This approach enhances computational efficiency while improving the accuracy of the results. The mesh refinement accuracy for M-1 and M-2 is uniformly set to 0.2 m to avoid calculation result deviations caused by differences in element types or mesh density. However, due to differences in internal structure, Model M-1 (the cavity structure) contains a greater number of elements to accurately simulate the stress distribution around the closed cavities.
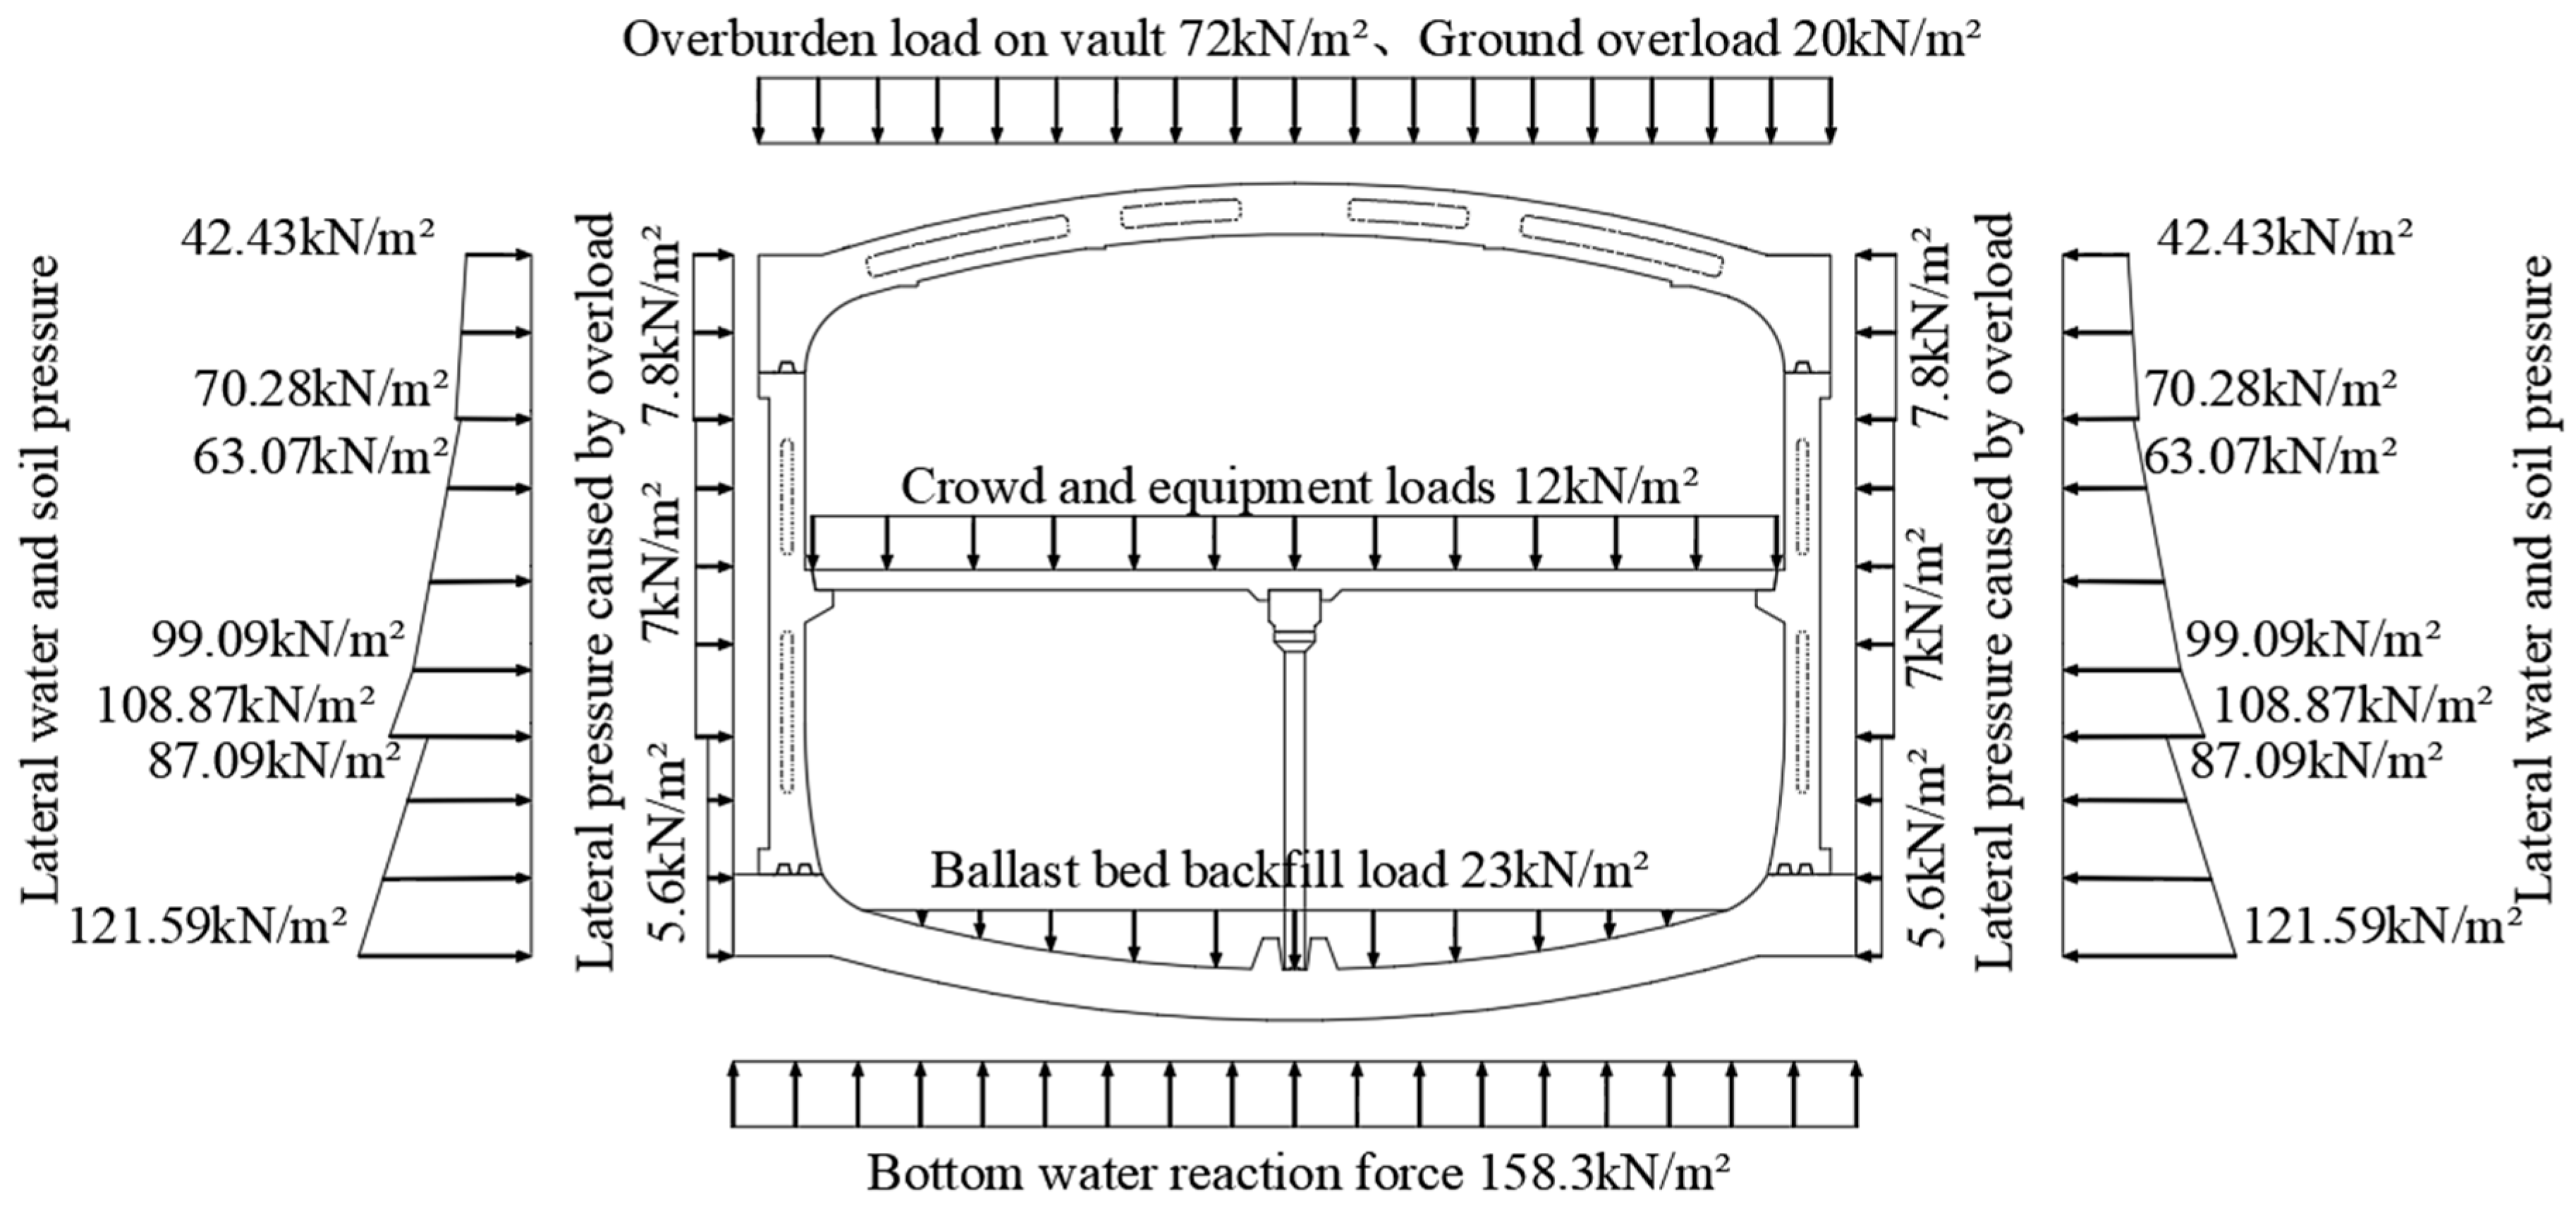
Condition 1 considers the deformation and mechanical properties of the prefabricated metro station only under self-weight, which is selected because self-weight is a permanent load and has a higher impact on the structural performance of the station than incidental loads. Condition 2 selects the loads encountered by stations during long-term use, including dead weight, backfill, soil and water pressure, crowd and equipment loads, and bottom water reaction forces. The two conditions encompass the entire life cycle of the structure, from its construction to its operation. The applied load is calculated based on the parameters of the soil layer and other considerations. The load schematic diagram is depicted in Figure 6.
In order to thoroughly examine the relationship between the ground resistance and the deformation of the station structure, the restraining effect of the soil on the station structure is simulated using curved springs. The elastic connection is selected to be compressed only, and the corresponding spring stiffness is automatically calculated by inputting the bed coefficients of the different soil strata. The fixed constraints are automatically generated. The structural configuration of the station is constrained along the longitudinal direction (y-direction) by two degrees of freedom, designated as TY and RY. The stratigraphic lithology of the station, ranging from the topmost to the lowest stratum, comprises plain fill, silty clay, medium sand, coarse sand, strongly weathered muddy siltstone, and moderately weathered muddy siltstone. The geological conditions and parameters are delineated in Table 4.

2.3. On-Site Monitoring Plan

Subsequent to the assembly of the section structure, the structure will undergo slight deformation due to its own weight and the impact of the vault soil covering construction. In order to guarantee the safety and reliability of the assembly section structure, structural monitoring of the prefabricated components of the assembly section will be conducted from the completion of assembly to the stabilization of structural deformation. The monitoring instrument selected for this study was the TS09 total station. A monitoring section was established at intervals of five rings along the longitudinal direction of the station, with measurement points positioned at the summit of the vault (C) and the side wall (B1). The monitoring content encompassed the vertical and horizontal displacement of prefabricated components. The monitoring work is divided into two phases, contingent on the construction sequence of the assembly section. The first phase encompasses the process from the completion of component assembly to the completion of vault backfilling, corresponding to condition 1 in the finite element simulation. The second phase encompasses the process from the completion of roof slab backfilling to the stabilization of component deformation. The first phase (condition 1) is to be monitored at a frequency of 1–2 times per day. The control criteria for vertical displacement at the midspan of the roof slab are set at 7 mm per day, while the criteria for horizontal displacement at the top of the side walls are established at 2 mm per day.

3. Results

3.1. Comparative Analysis of Structural Internal Forces

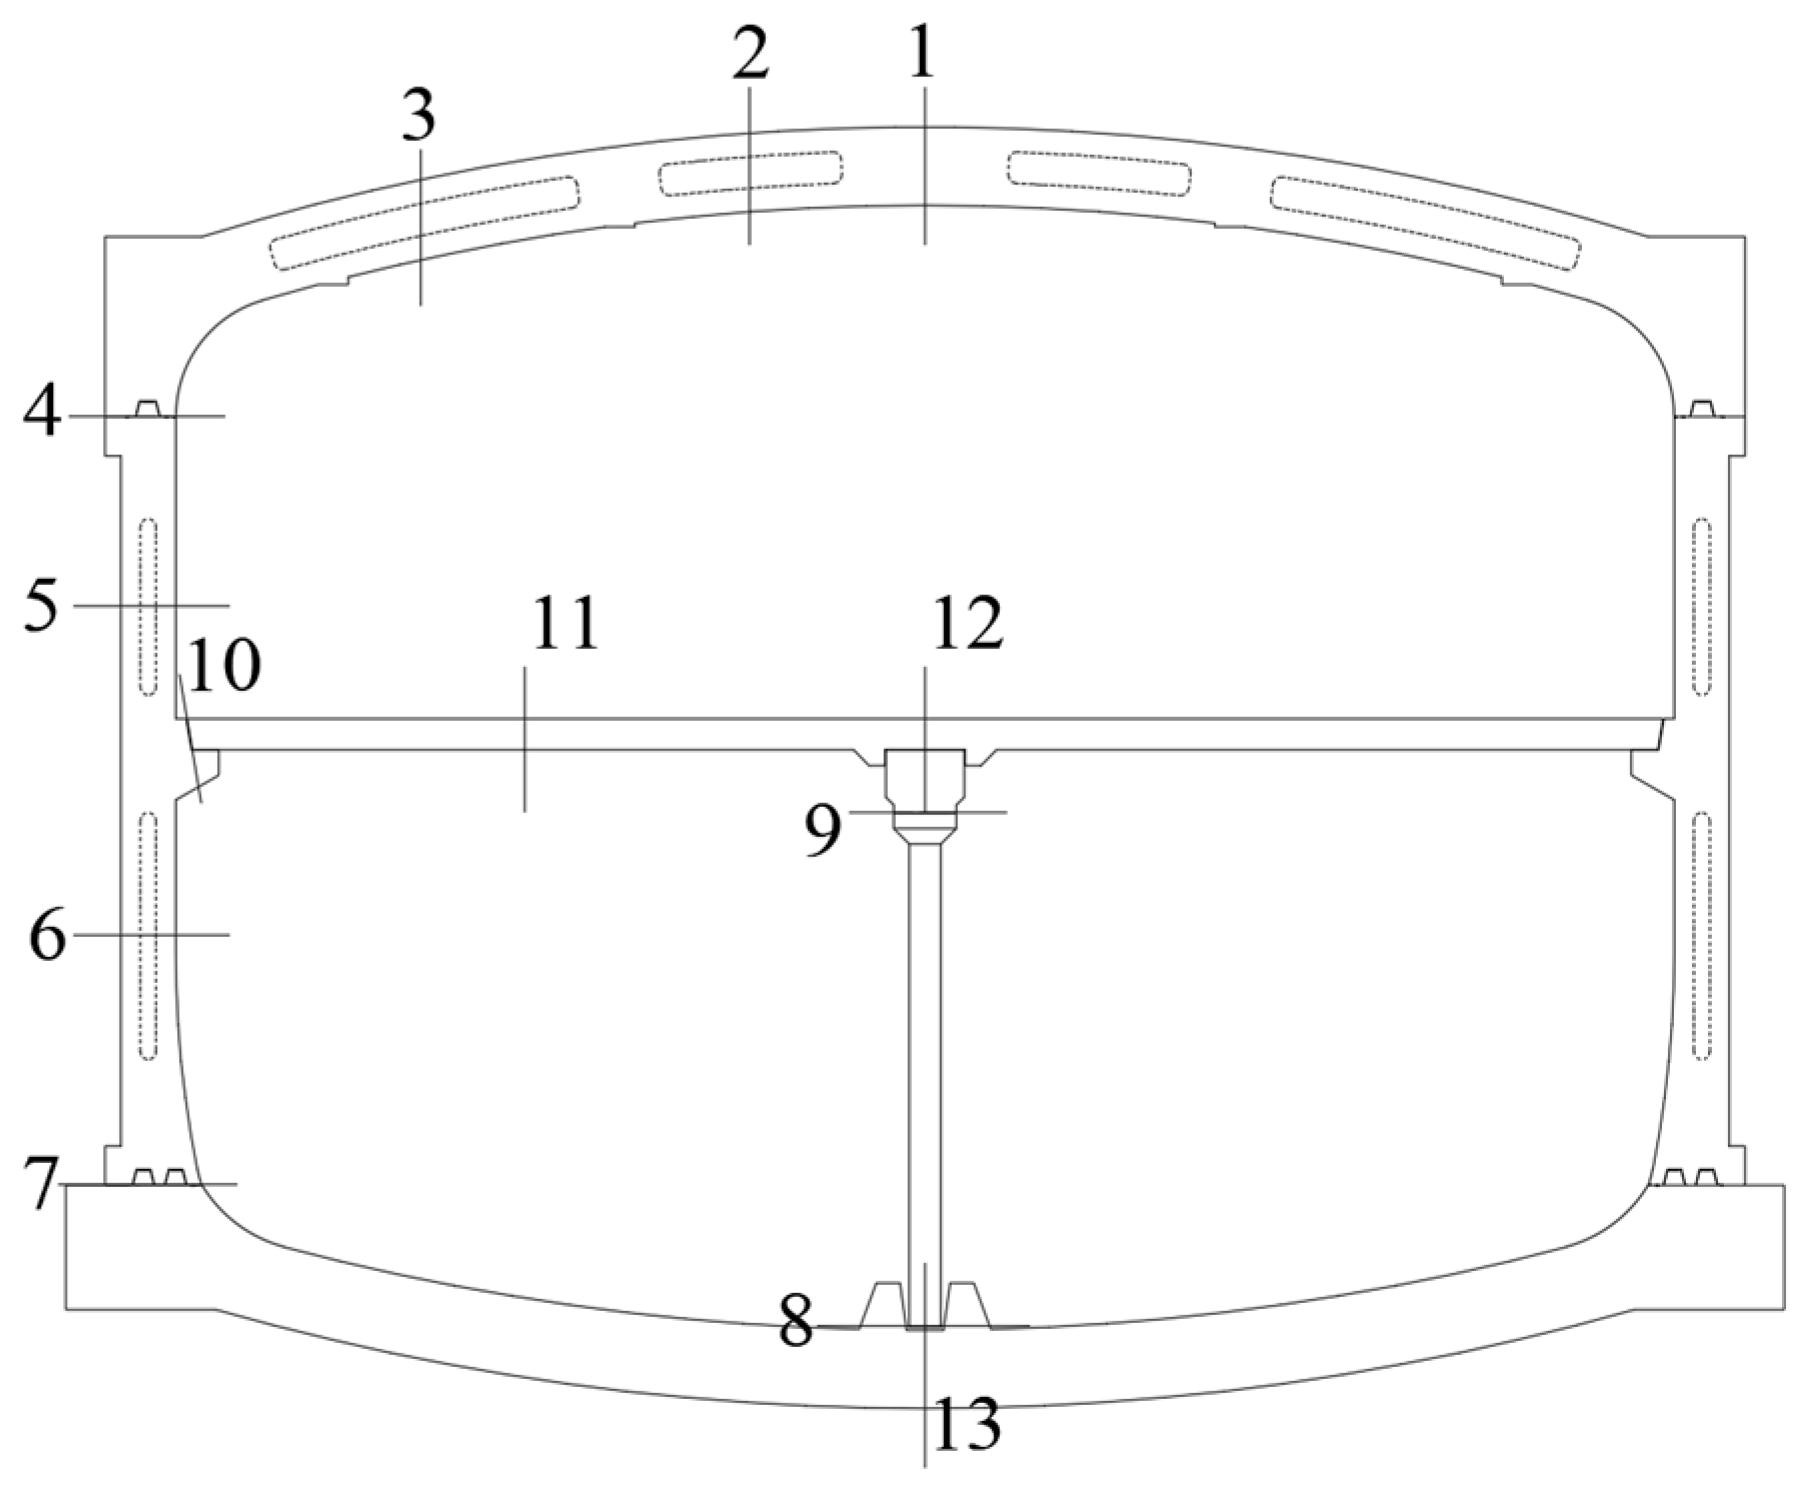
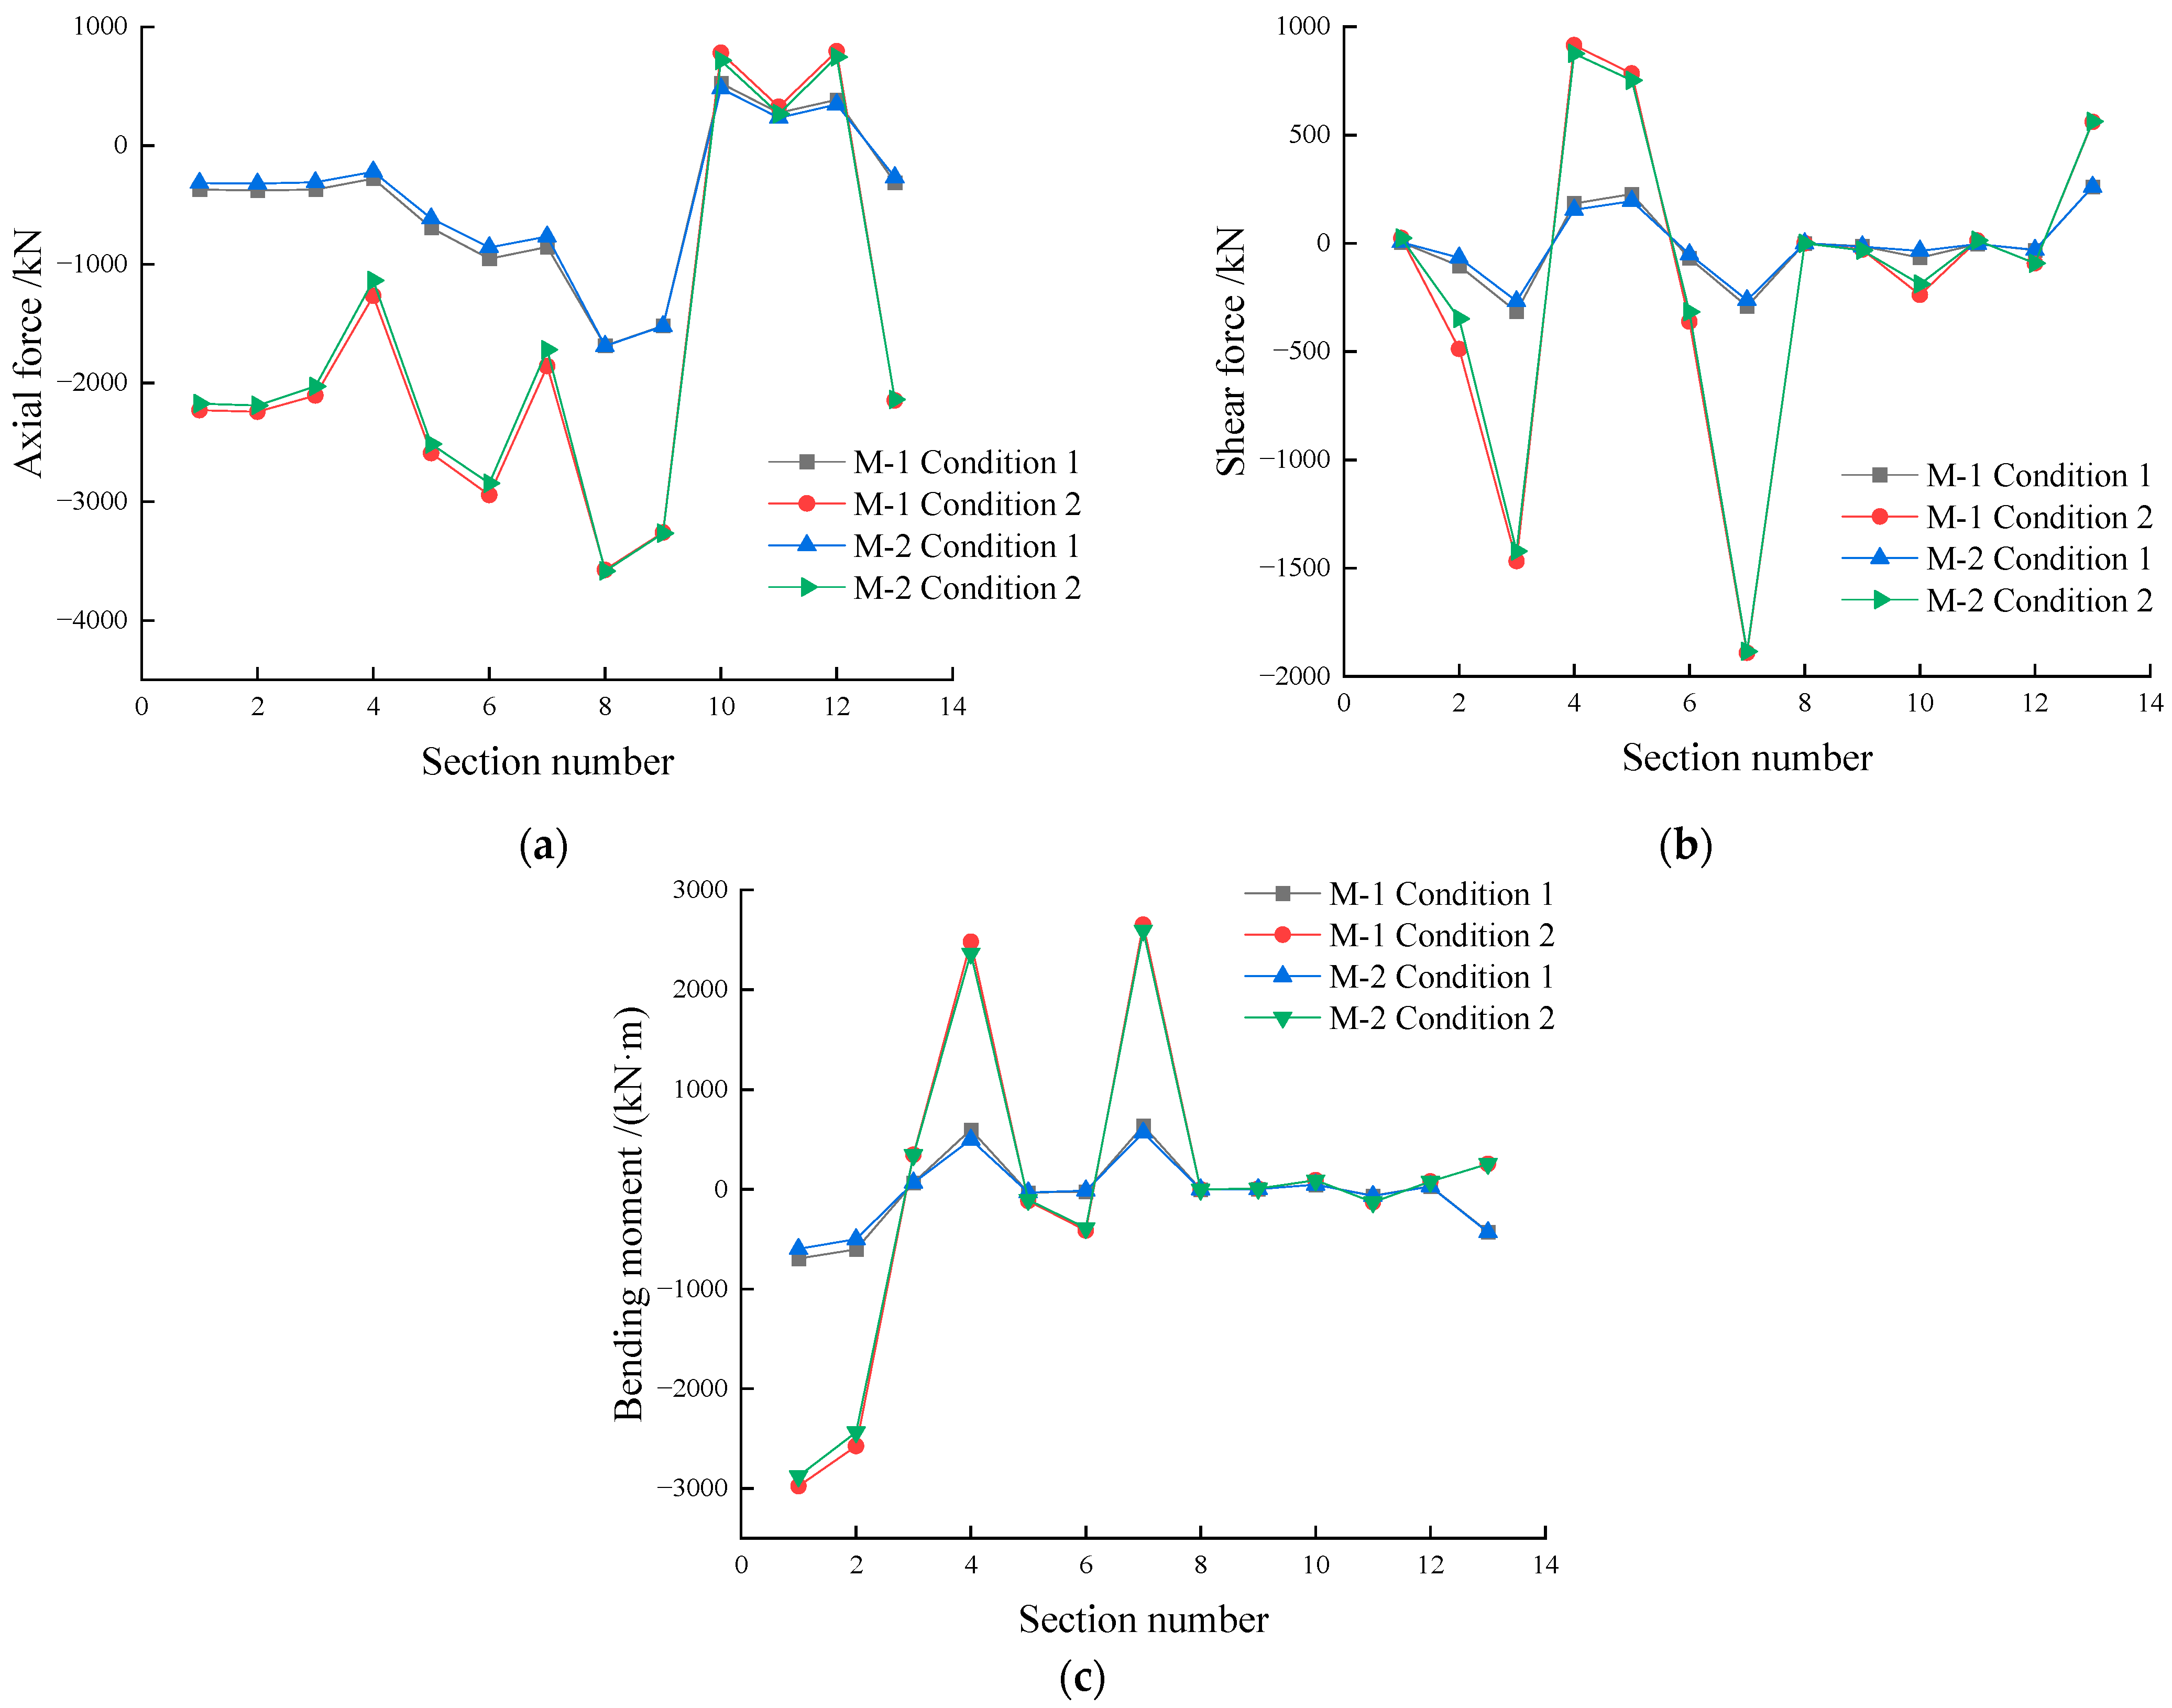
In accordance with the force characteristics of the structure and the location of the closed cavity, 13 cross-sections were selected for the purpose of analyzing the internal force of the middle ring. The structural internal force is extracted by the “Local Direction Combined Force” in the software post-processing, and the plane where the combined force is to be extracted is set at the corresponding cross-section position. The internal force observation cross-section is shown in Figure 7. As illustrated in Figure 8, the figure displays the values of the internal forces in the cross-sections of Models M-1 and M-2 for the two working conditions.
As illustrated in Figure 8a, the axial force values of each observed section for Models M-1 and M-2 are presented under two distinct loading conditions. The Model M-1, characterized by its solid structure, exhibits analogous curve patterns in both working conditions. Specifically, axial forces in sections 1–9 are all in compression, while sections 10–12 experience tension. However, the values are generally higher under the service stage loading conditions of case 2. For instance, in the interval of sections 4–8, the axial forces in case 2 (e.g., approximately −3000 kN at section 6) are considerably smaller than those in case 1. This suggests that the axial compression of the structure is more pronounced in case 2. The axial force curves of the cavity structure in Models M-2 and M-1 exhibit a similar trend, suggesting comparable behavior in the two models. However, a notable difference emerges in the values of the axial forces, with Model M-2 demonstrating a lower force magnitude compared with Model M-1. In cross-section 6, under condition 2, the axial force of M-2 is measured at 2843.4 kN, while the axial force of M-1 is recorded at 2943.6 kN. This indicates that the axial force of M-1 is 100.2 kN greater than that of M-2.
As illustrated in Figure 8b, the shear force values of each observed section for Models M-1 and M-2 are presented under two distinct loading conditions. Models M-1 and M-2 exhibit a similar trend, with the absolute value of the shear force for case 2 exceeding that of case 1. Additionally, the fluctuation of the shear force is more pronounced under case 2 conditions. In the sections designated as 4 and 7, the maximum observed shear forces were recorded, reaching a peak of 1891.1 kN under specific conditions. Conversely, sections 8–13 exhibited minimal variation in shear force, approaching a state of zero force.
As illustrated in Figure 8c, the bending moment values of each observed cross-section for Models M-1 and M-2 are represented under two distinct loading conditions. In a manner analogous to the change rule of axial force and shear force, the bending moment of case 2 is greater than that of case 1. Furthermore, the positive and negative bending moments of sections 1–8 undergo frequent changes and stabilize in sections 8–13. The bending moment of most sections of Model M-2 is also smaller than that of Model M-1. For example, the bending moment of section 2 of Model M-2 under condition 2 is 2434.6 kN, while the bending moment of section 2 of Model M-1 is 2573.8 kN. This is about 139 kN larger than the bending moment of section 2 of Model M-2.
To ascertain the disparities in internal forces between the solid structure (M-1) and the cavity structure (M-2), the values of the internal forces of Models M-1 and M-2 were enumerated. As illustrated in Table 5, a comparative analysis of the internal forces in various sections of Models M-1 and M-2 under condition 2 reveals notable distinctions. As illustrated in Table 6, a comparison of the maximum values of internal forces is presented in the first seven sections (the interval exhibiting the most significant fluctuations in internal forces) of Models M-1 and M-2 for the two working conditions.
As illustrated in Table 5, the internal forces in the majority of the cross-sections are diminished for a cavity rate of 9.71% with closed cavities within the structure. Under identical working conditions, the substantial disparities in internal forces are concentrated in the initial seven sections, i.e., the regions where the closed cavities and the joints of the prefabricated components are situated. For instance, the axial force, shear force, and bending moment reductions at the location where the vault structure meets the left wall (section 4) are 10.2%, 4.2%, and 4.7%, respectively. Correspondingly, the reductions at the location where the left wall meets the floor (section 7) are 7.5%, 5.6%, and 2.2%. However, the rate of change in the internal force in the floor (section 13) is only 0.3%.
As illustrated in Table 6, the maximum axial force, shear force, and bending moment values for the cavity structure are reduced in both condition 1 and condition 2. Furthermore, the rate of reduction in internal forces decreases with increasing applied load. This trend is advantageous for structural safety, as evidenced by the reduction rates of axial force, shear force, and bending moment, which are 10.19%, 15.12%, and 14.14%, respectively, in condition 1. In condition 2, the reduction rates are 3.40%, 3.12%, and 3.37%, respectively.

3.2. Comparative Analysis of Structural Deformation

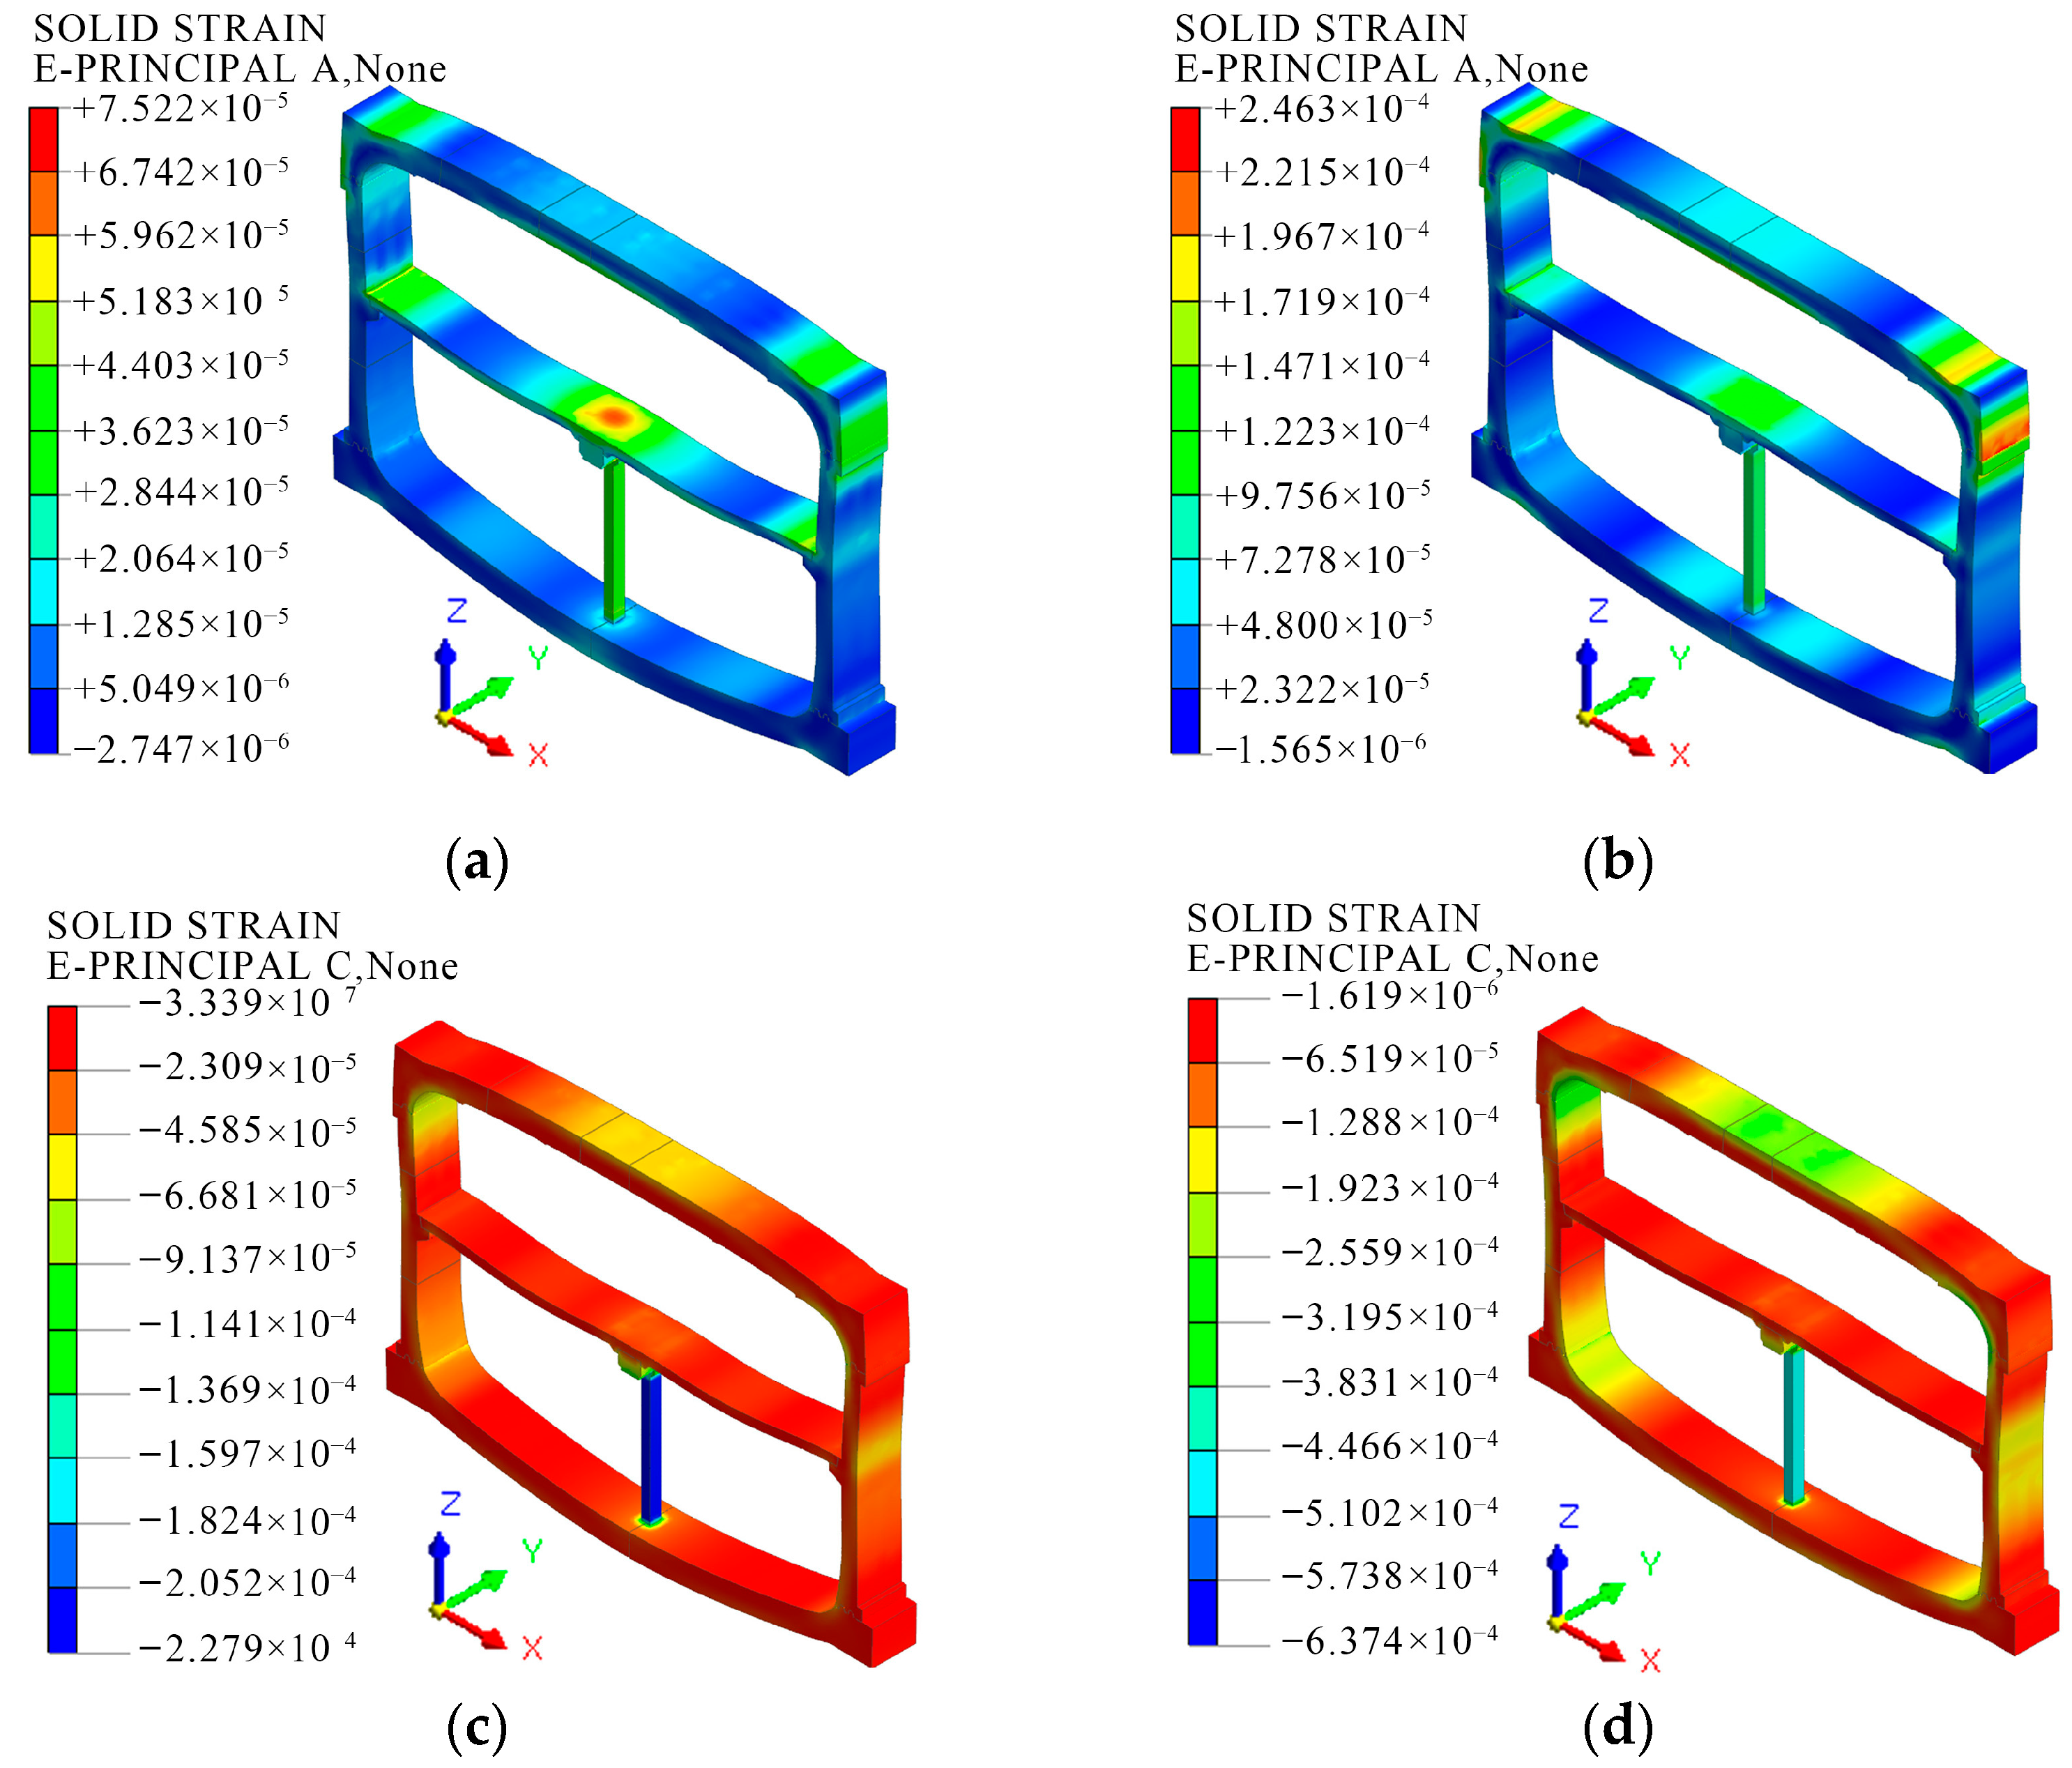
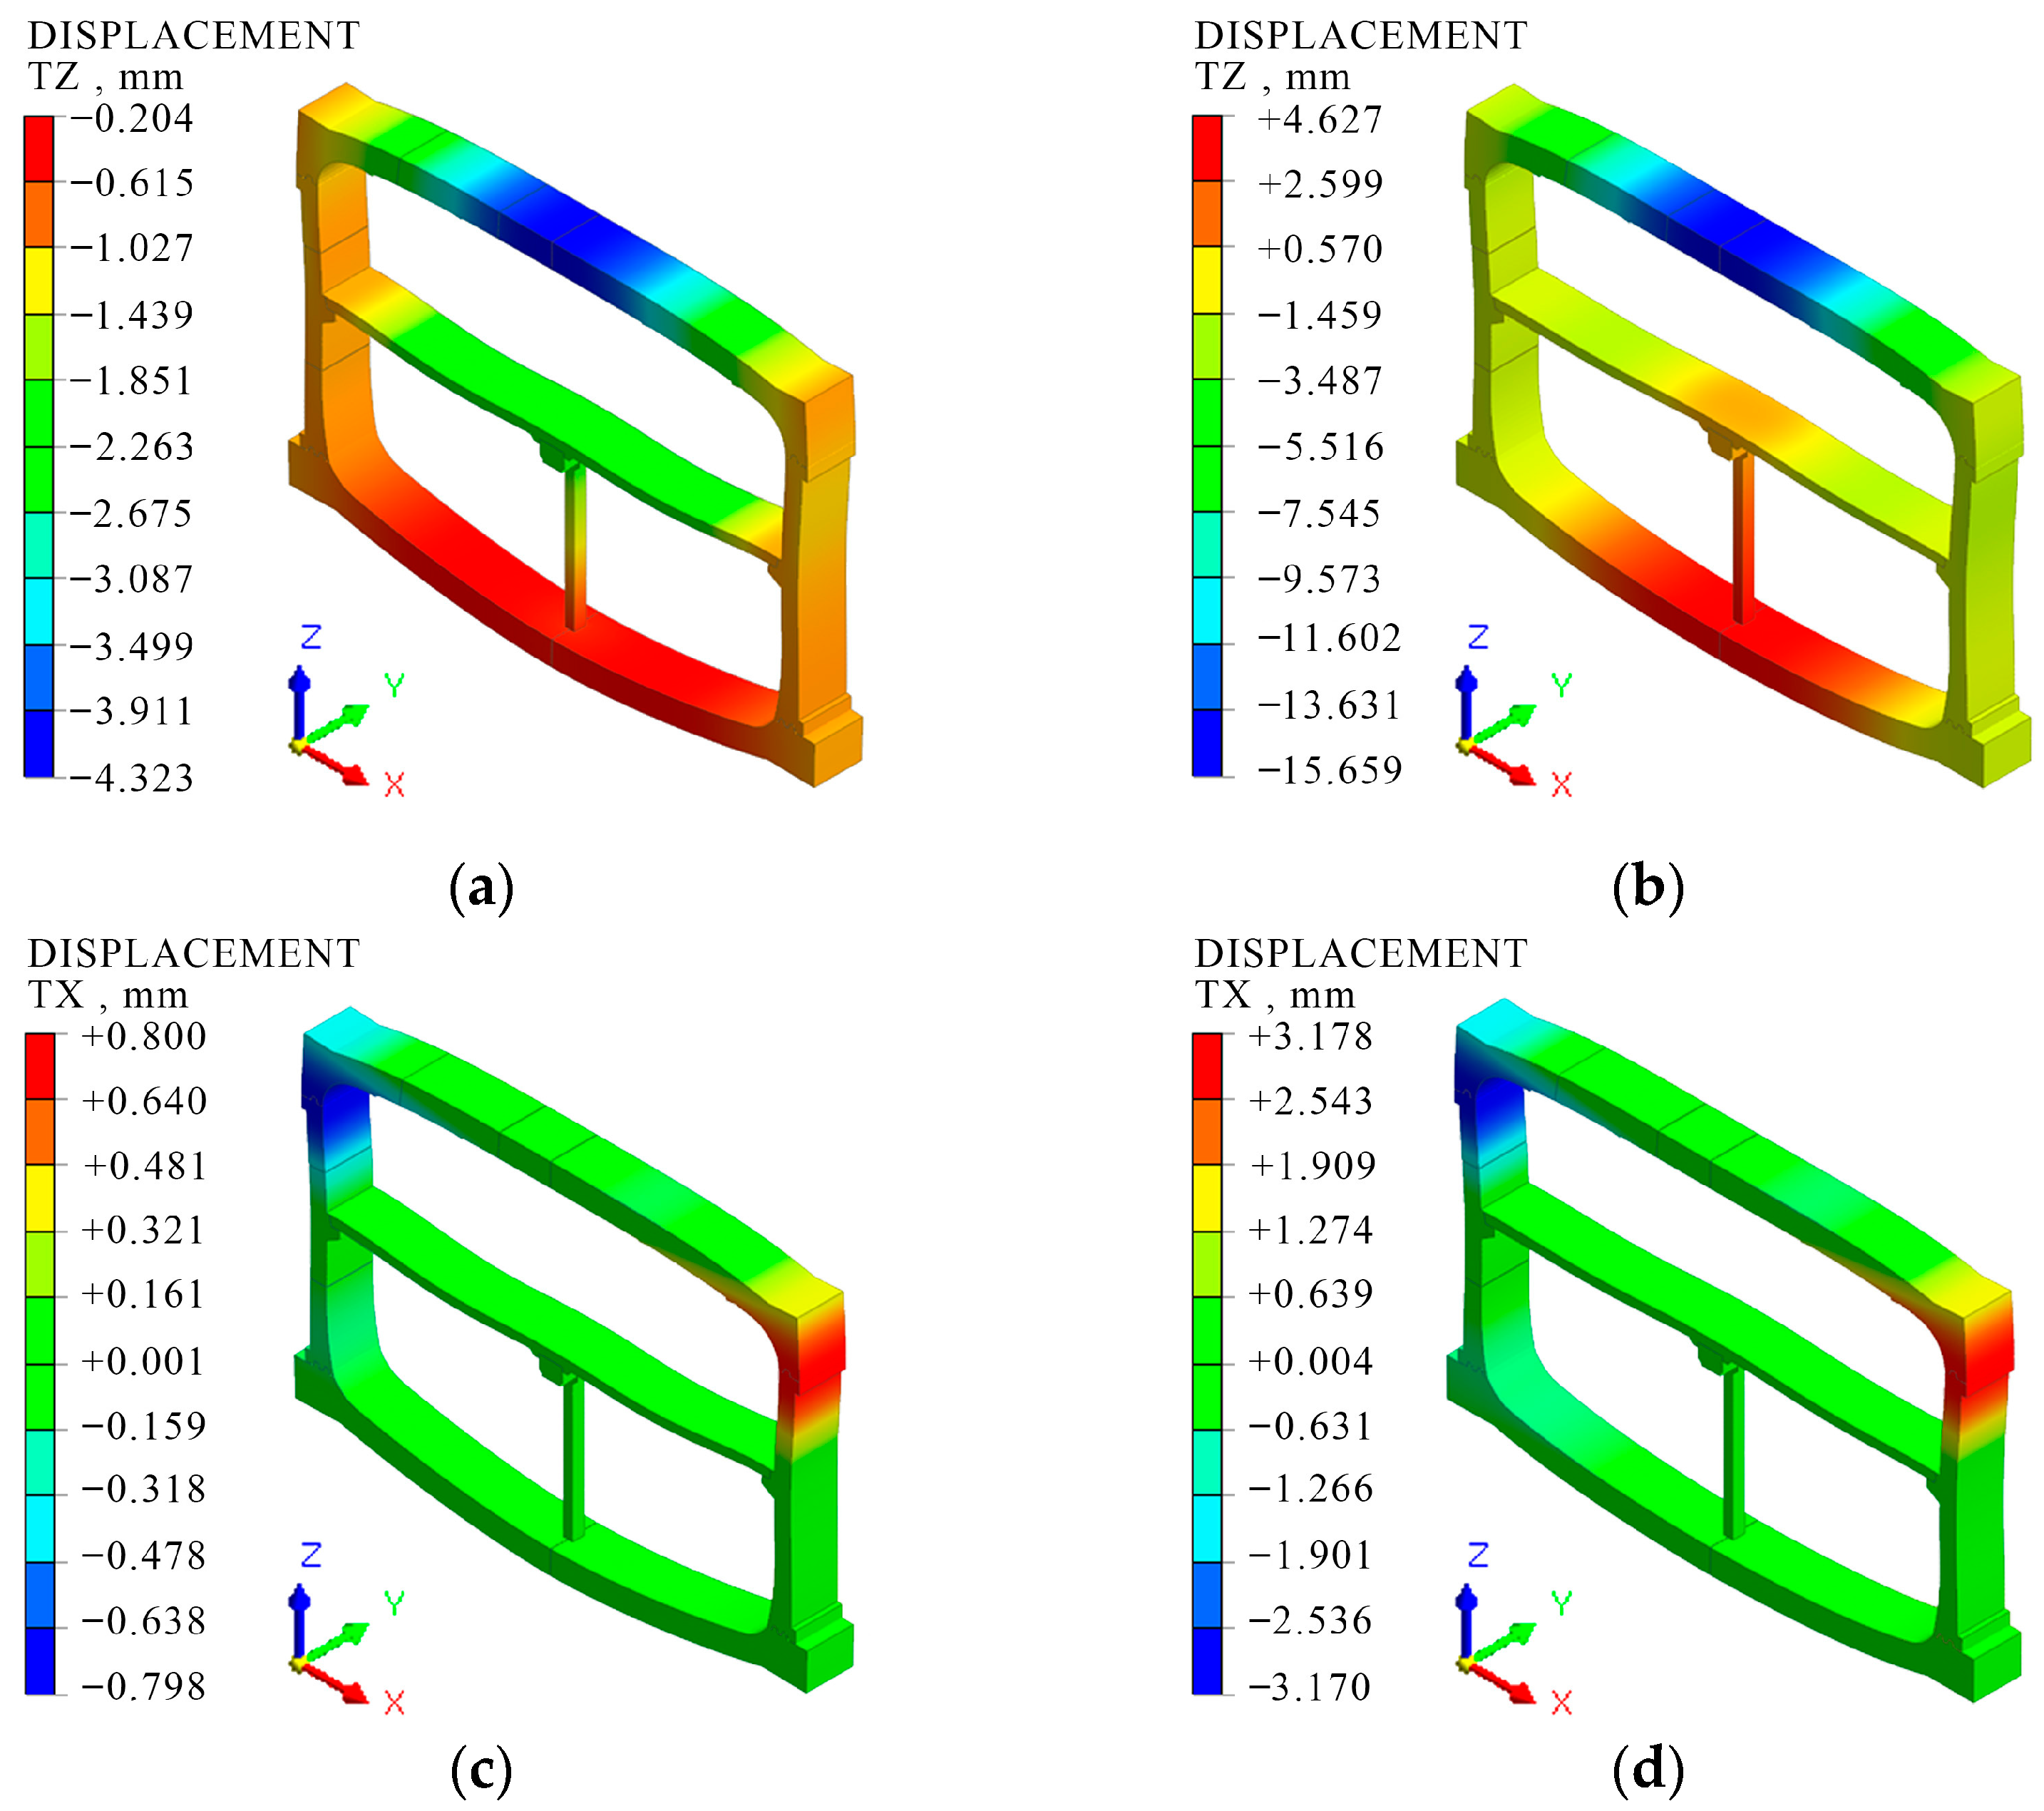
To ascertain the deformation characteristics of the structure, a comparative analysis is conducted of the strain and displacement of the station structure. The maximum principal strain indicates the maximum tensile deformation that has occurred in the structure, while the minimum principal strain indicates the maximum compressive deformation that has occurred in the structure. As illustrated in Figure 9 and Figure 10, the principal strain and displacement clouds of the middle ring of Model M-2 are depicted under two distinct working conditions. Table 7 and Table 8 present a comparison of the maximum principal strain and displacement, as well as the location of occurrence.
From Figure 9 and Table 7, it can be seen that the principal strain of the structure increases after the addition of the closed cavity, and the principal strain of M-2 is slightly larger than that of M-1. In condition 1, the column undergoes substantial tensile and compressive deformation. The maximum principal strain peak is 7.52 × 10⁻⁵, and the maximum tensile position is at the junction of the column and longitudinal beam; the minimum principal strain peak is −22.79 × 10⁻⁵, and the maximum compressive position is at the bottom end of the column. It is important to note that, in condition 2, the applied load becomes more complex, influenced by factors such as soil and water pressure, as well as ground overload. The upper mortise–tenon joint undergoes the most significant tensile and compressive deformation, with tension occurring on the soil-facing side and compression on the soil-backing side. The maximum principal strain peaks at 24.63 × 10⁻⁵ and the minimum principal strain peaks at −63.74 × 10⁻⁵. Notably, the principal strain of M-2 is considerably higher than that of M-1 under condition 2 compared with condition 1.
Figure 10 and Table 8 reveal a striking similarity between the maximum displacement locations of M-1 and M-2. In consideration of the vertical displacement, the station structure in condition 1 is characterized by settlement displacement deformation, with the maximum downward displacement occurring at the vault structure. The maximum vertical displacement of M-2 is approximately 4.32 mm, while that of M-1 is approximately 3.84 mm. This indicates that the settlement displacement deformation generated by the cavity structure is 0.48 mm greater than that of the solid structure. In condition 2, the maximum vertical displacement is observed to be generated at the vault in the downward direction. The maximum vertical displacement of M-2 is approximately 15.66 mm, and the maximum vertical displacement of M-1 is approximately 15.61 mm. M-2 is 0.05 mm larger than M-1, indicating that the settlement displacement produced by the cavity structure is slightly larger than that of the solid structure. The difference from condition 1 is that the middle of the floor rises upward, and the medium plate also exhibits a slight bulge, accompanied by “upward arch” deformation. In the context of horizontal displacement, the maximum displacements are observed to occur within the configuration of the B-C joints. This configuration involves the left wall undergoing a leftward deformation, the right wall undergoing a rightward deformation, and the left and right deformations exhibiting a symmetrical expansion outward. In condition 1, the maximum horizontal displacement of the cavity structure (M-2) is 0.8 mm, while that of the solid structure (M-1) is 0.68 mm. That is to say, the former is larger than the latter by 0.12 mm. In condition 2, the maximum horizontal displacement of M-2 is 3.18 mm, and that of M-1 is 3.11 mm. The maximum horizontal displacement of the cavity structure is found to be greater than that of the solid structure by 0.07 mm.
In summary, regardless of the vertical displacement or horizontal displacement, the addition of closed cavities will result in a modest enhancement in structural displacement. This increase in displacement is negligible when considering the overall deformation of the structure. Furthermore, with an increase in the bearing load, the incremental displacement and deformation decrease: vertical displacement decreases from 0.48 mm to 0.05 mm, and horizontal displacement decreases from 0.12 mm to 0.07 mm.

3.3. Comparative Analysis of Structural Stresses

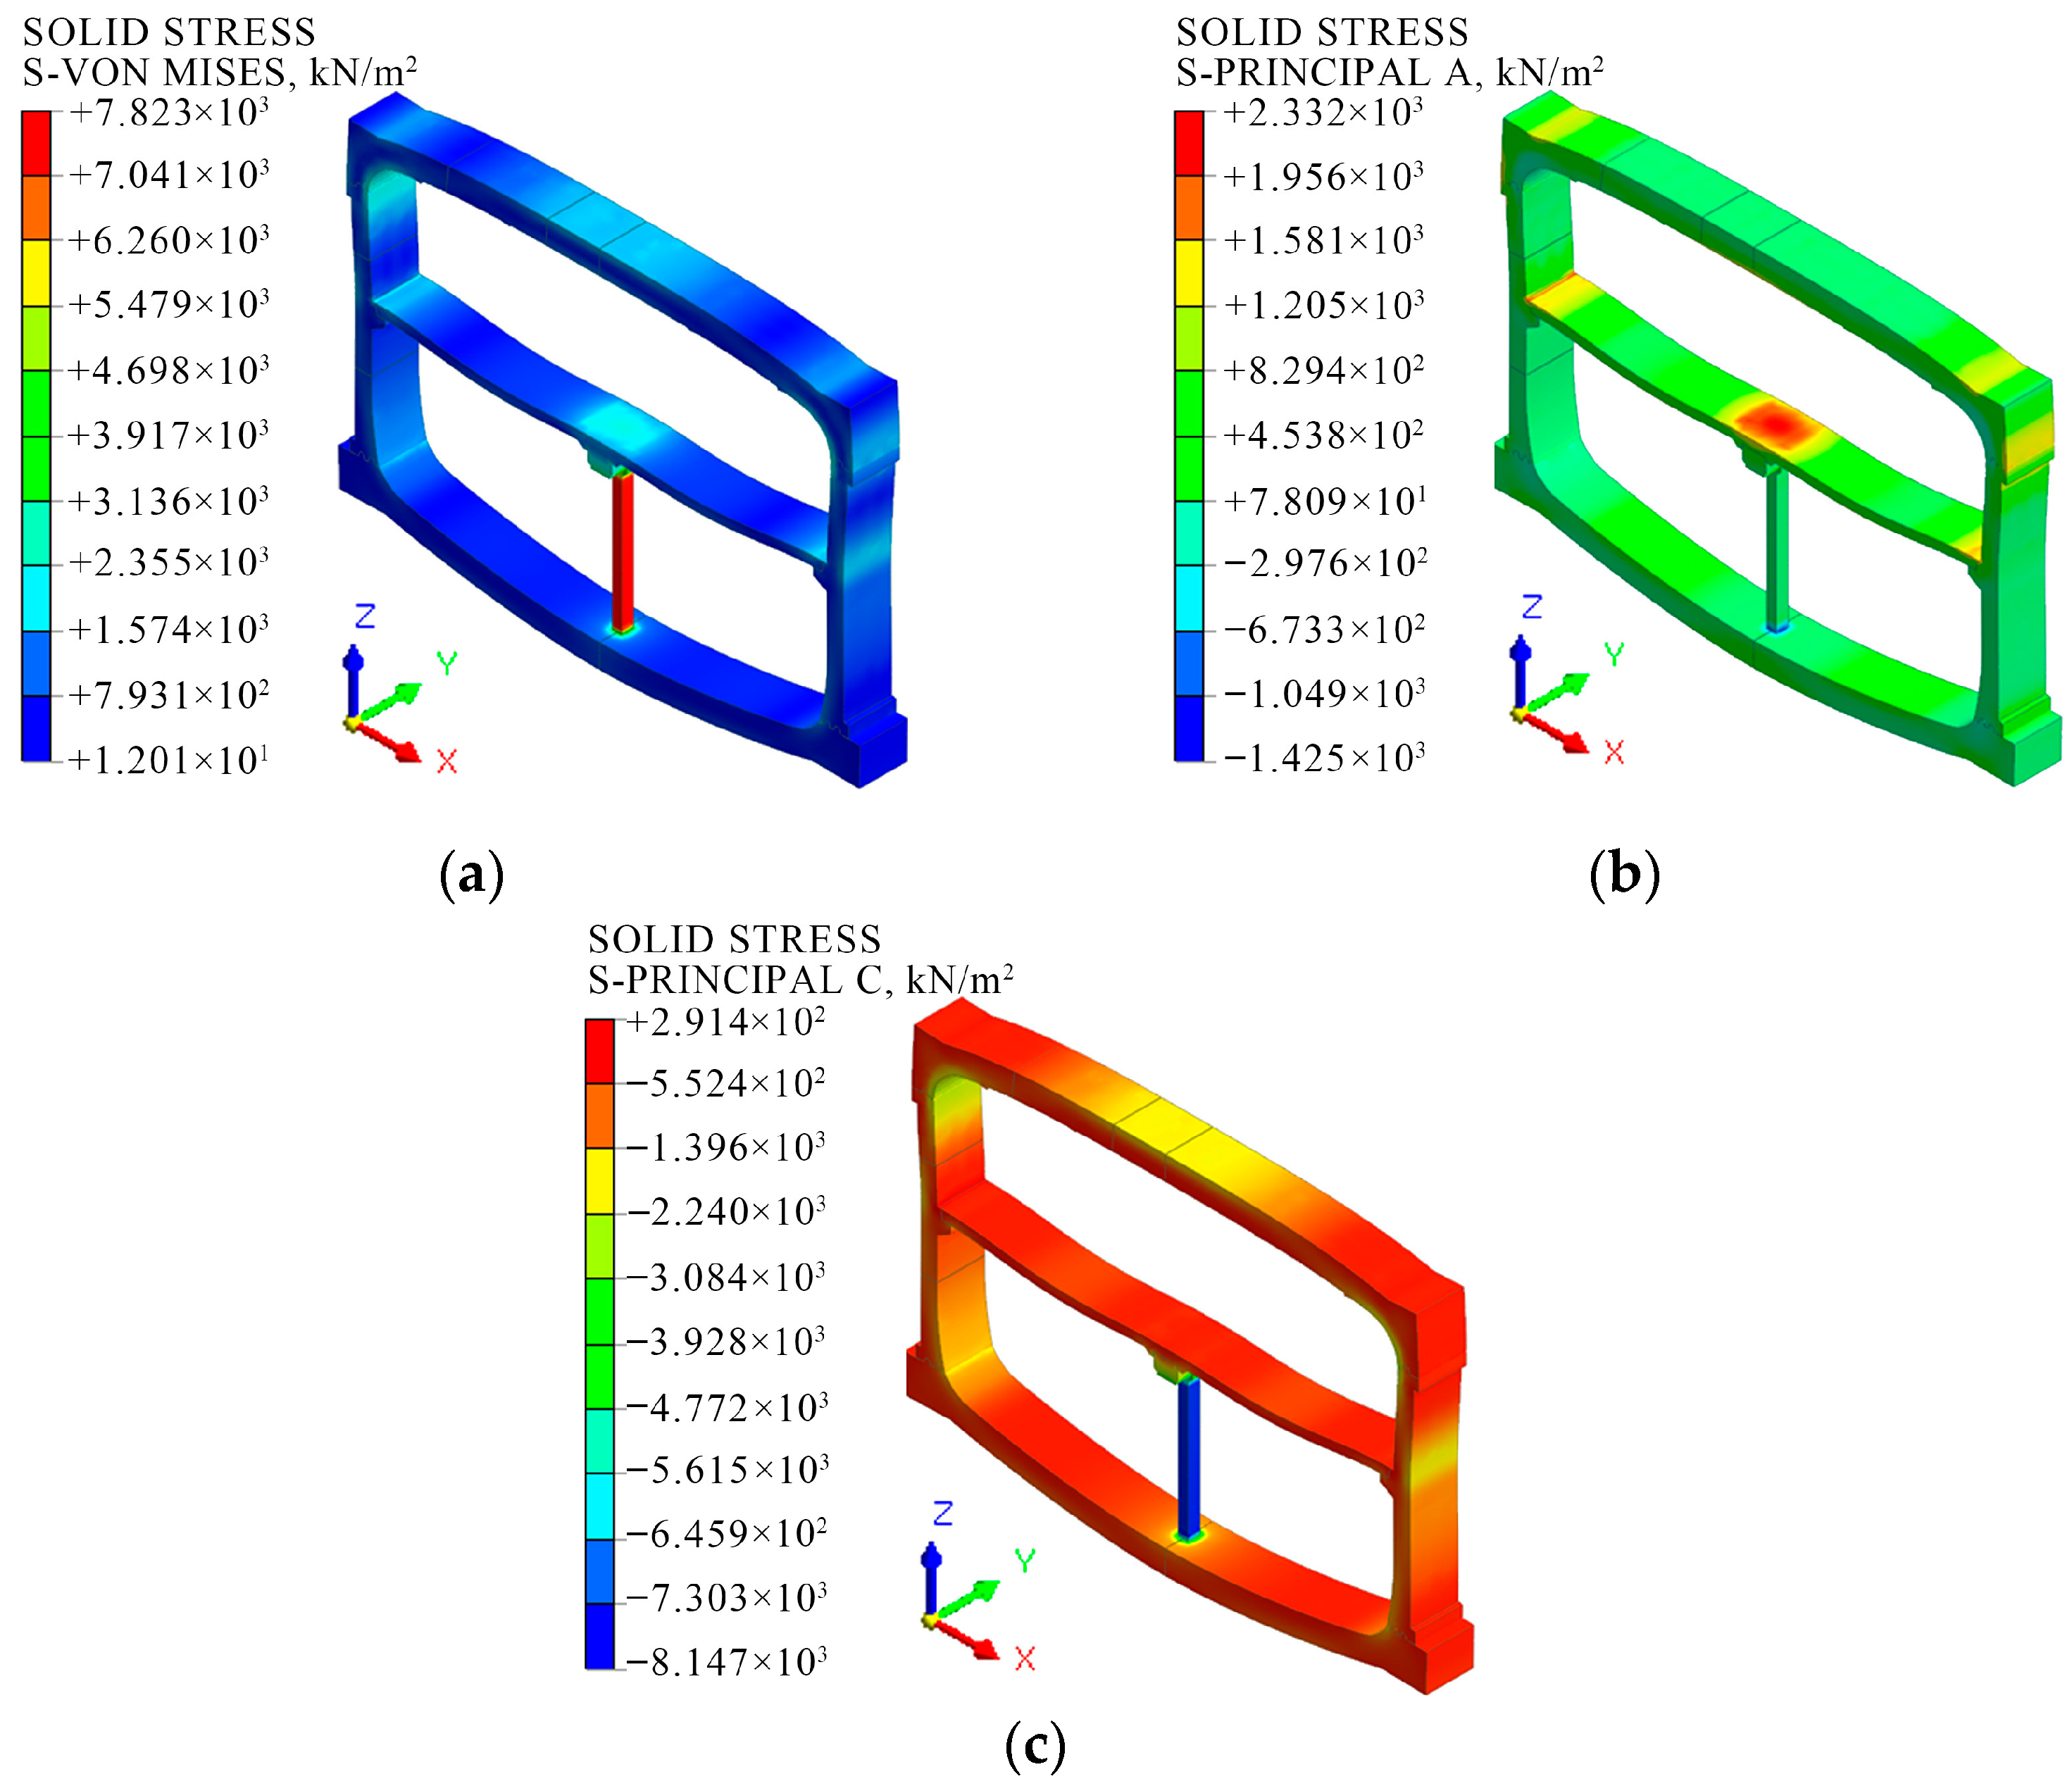
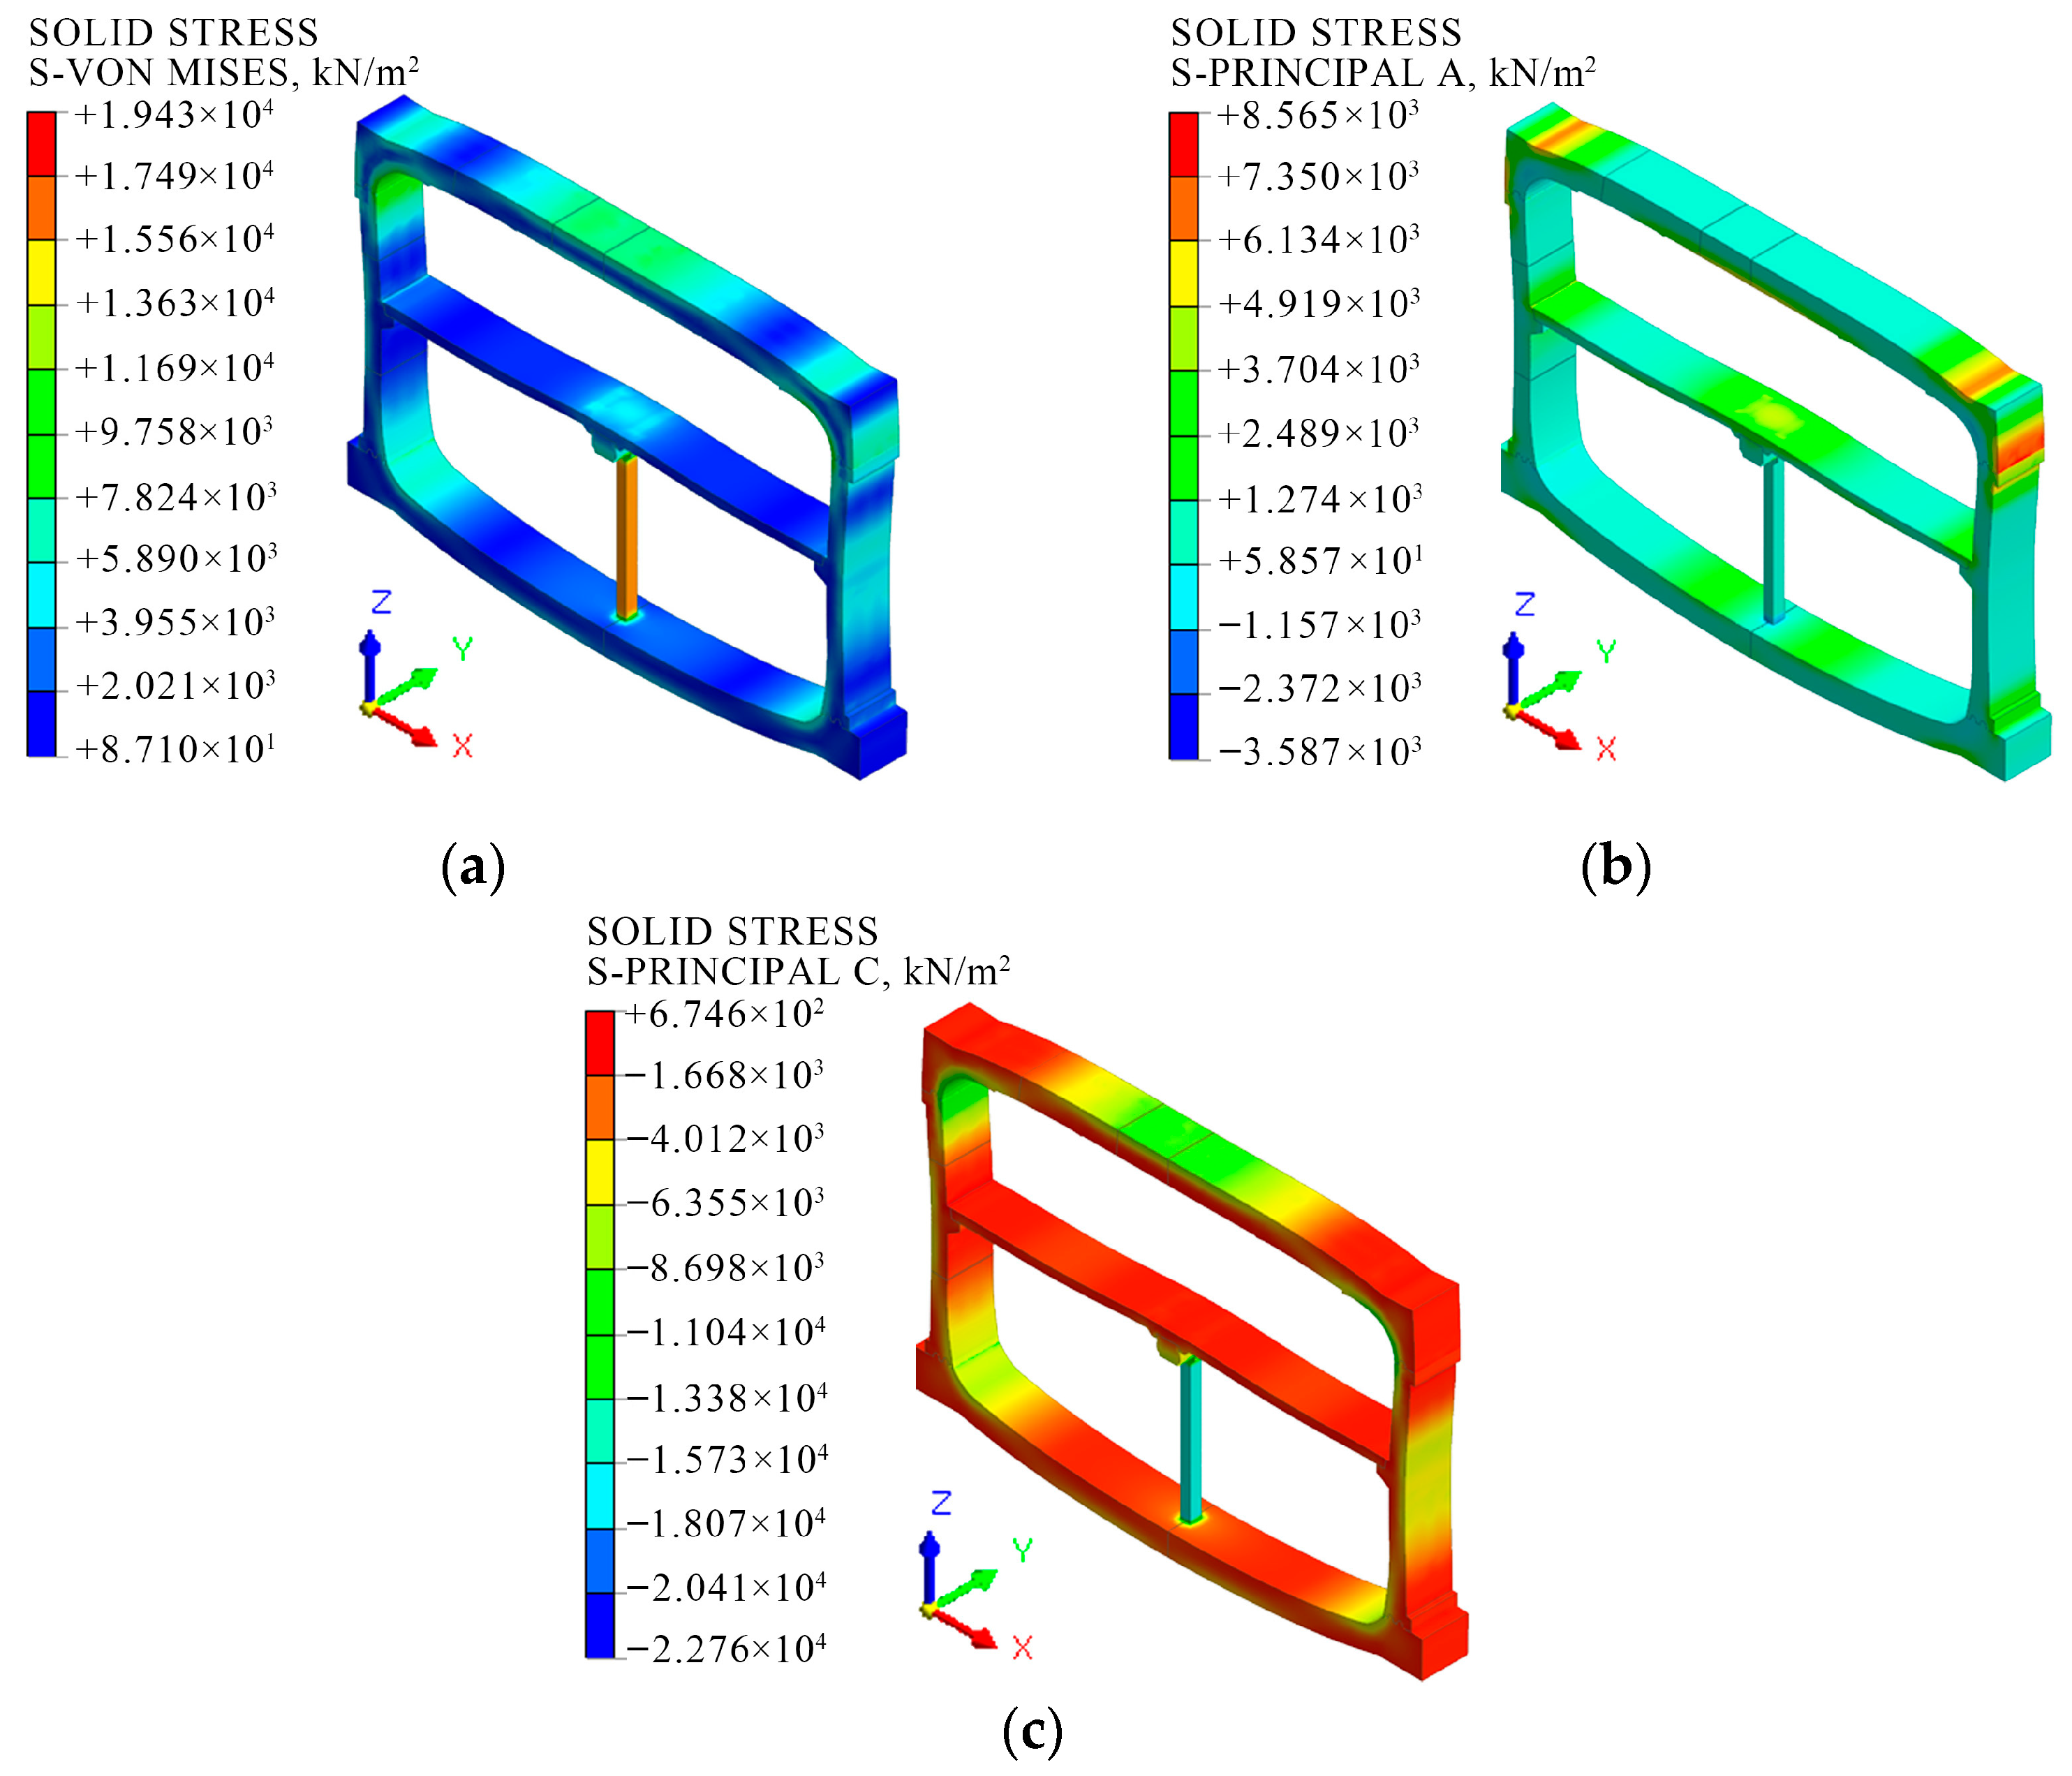
MISES stress reflects the deformation level of the structure under the complex stress state, thereby reflecting the comprehensive stress situation of the material. According to its distribution, the potential hazardous area of the structure can be determined. The maximum principal stress and the minimum principal stress indicate the maximum tensile and compressive capacity of the structure, respectively. Therefore, the three indexes of maximum value of MISES stress, maximum principal stress value, and minimum principal stress value of the middle ring of the structure were extracted for comparative analysis, as shown in Table 9. Figure 11 and Figure 12 illustrate the stress clouds of the intermediate ring of Model M-2 under two working conditions.
As illustrated in Table 9 and Figure 11 and Figure 12, there is a significant difference in the most unfavorable location of the structure under different loading conditions. However, the inclusion of closed cavities does not demonstrate a significant impact on the structural stress distribution.
As illustrated in Figure 11a, when the structural self-weight is taken into account under condition 1, the peak MISES stresses of Models M-1 and M-2 are both 7.8 MPa. This indicates that the column is subjected to the largest MISES stresses, and the structural risk locations are concentrated at the intersection locations of each prefabricated component. Figure 11b demonstrates the maximum principal stress cloud and the tensile risk zone, i.e., the red zone is concentrated in the upper part of the medium plate span and at the intersection with the side wall. The peak stress distribution of the two structures is approximately 2.3 MPa. According to Figure 11c, the blue concentration area is the compression risk area, which is concentrated in the column. The minimum peak principal stresses of both models, M-1 and M-2, are approximately 8.2 MPa.
When considered in conjunction with the findings presented in Table 9 and Figure 12, it becomes evident that the maximum stress points for condition 2 are consistently observed at the mortise–tenon joints, where the vault structure intersects with the side wall. The joints exhibit tensile forces on the exterior surfaces and compressive forces on the interior surfaces. Compared with Model M-1, the maximum MISES stress value of Model M-2 increased by 0.95 MPa, the maximum principal stress increased by 0.87 MPa, and the minimum principal stress increased by 0.39 MPa. In summary, the difference between the stress extremes of the solid structure and the cavity structure is smaller in the two working conditions.
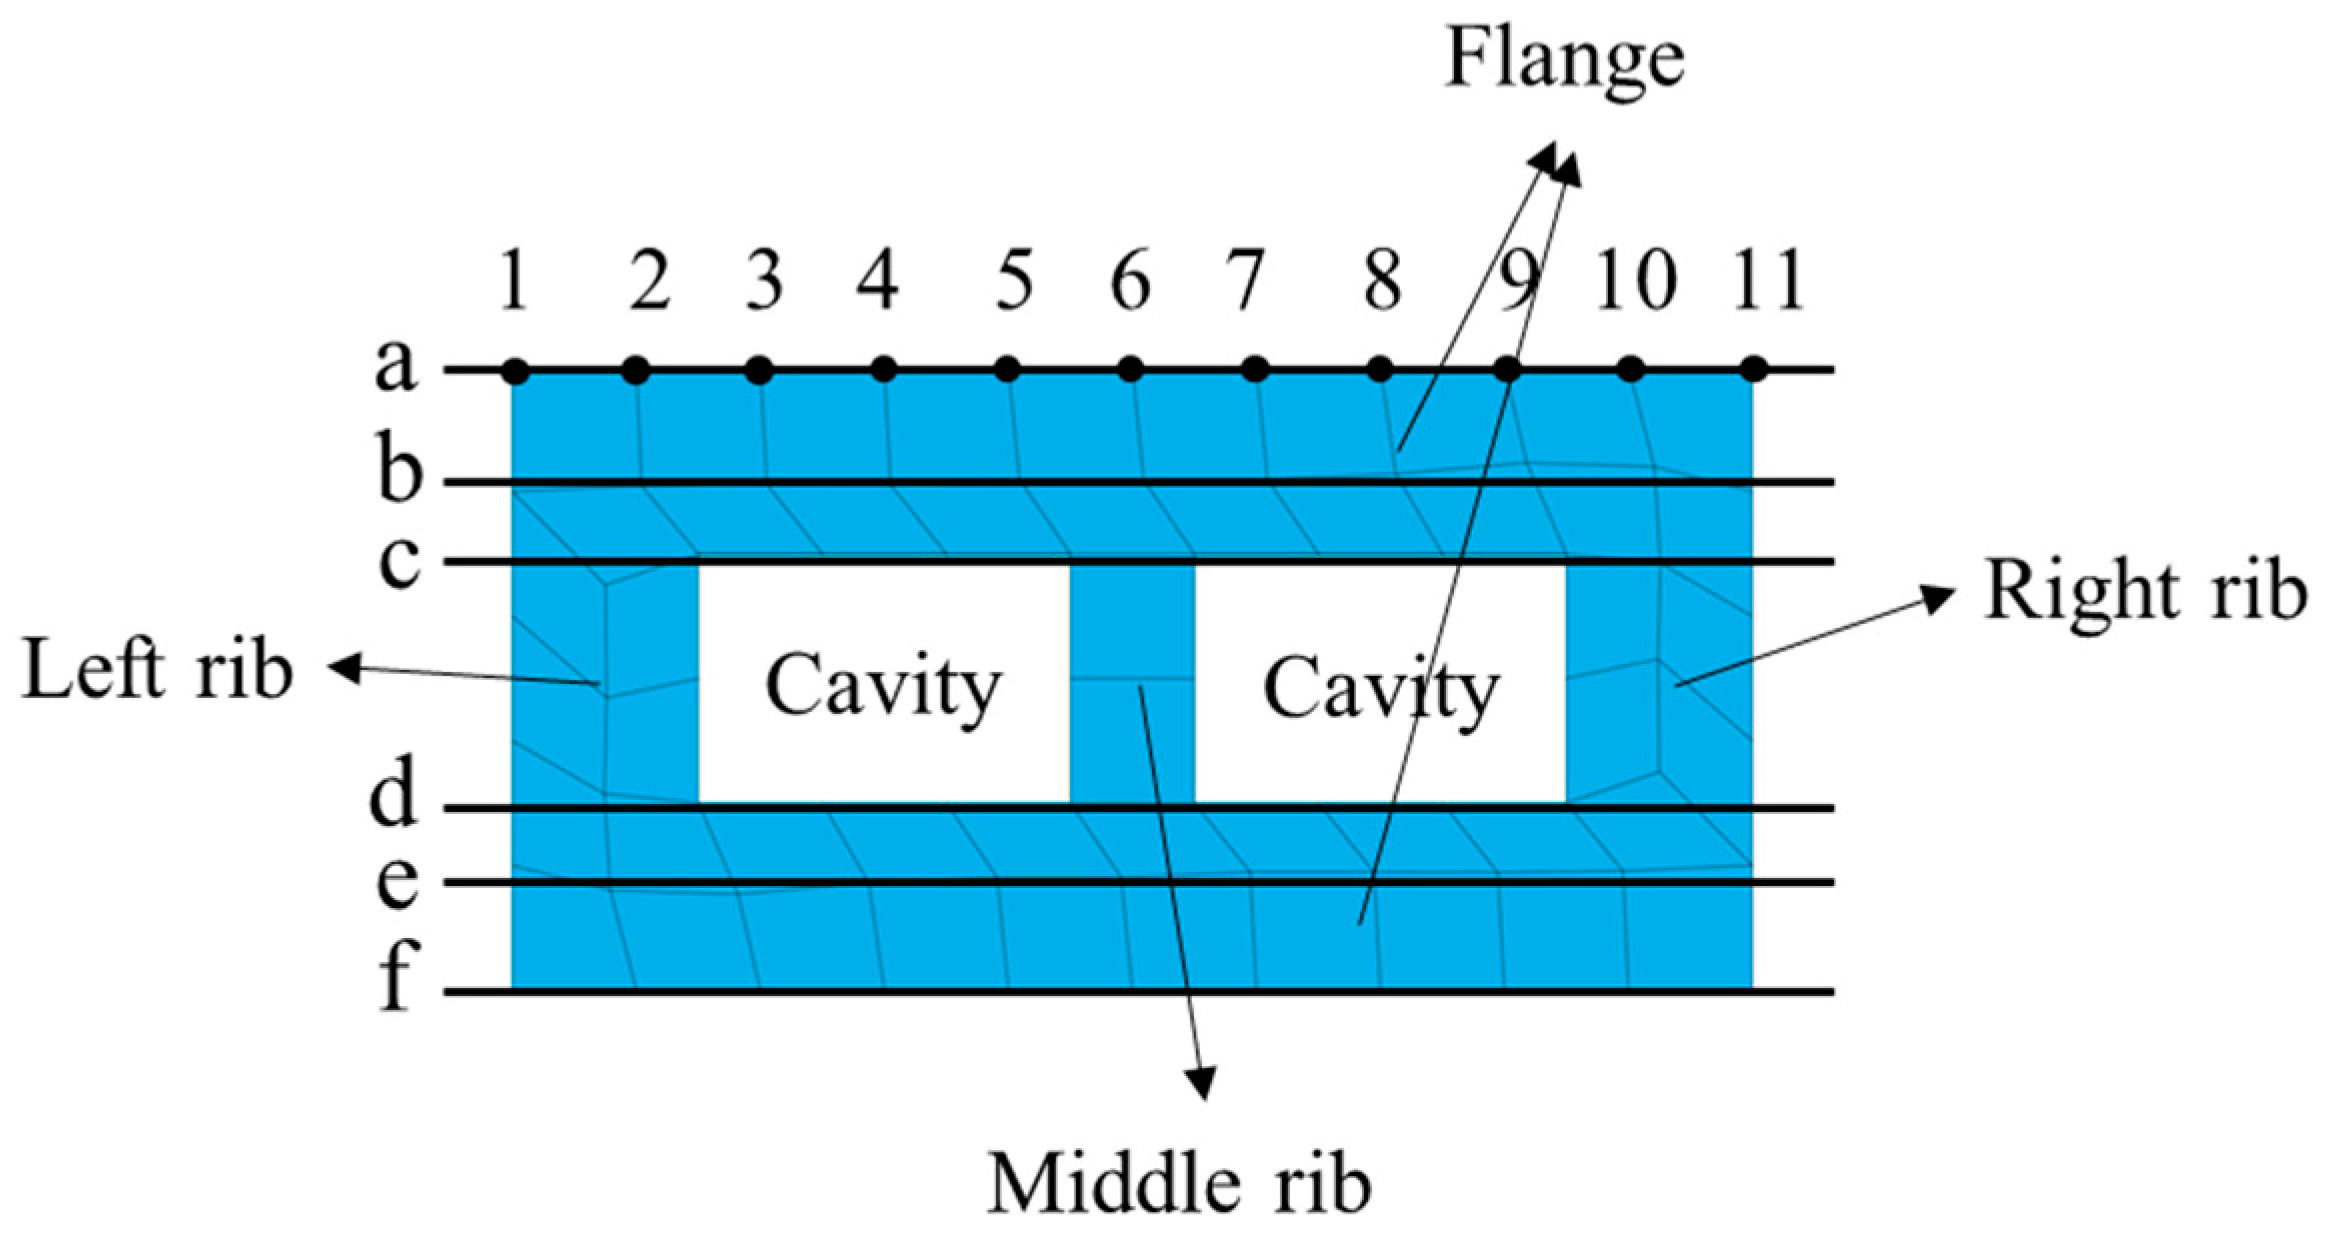
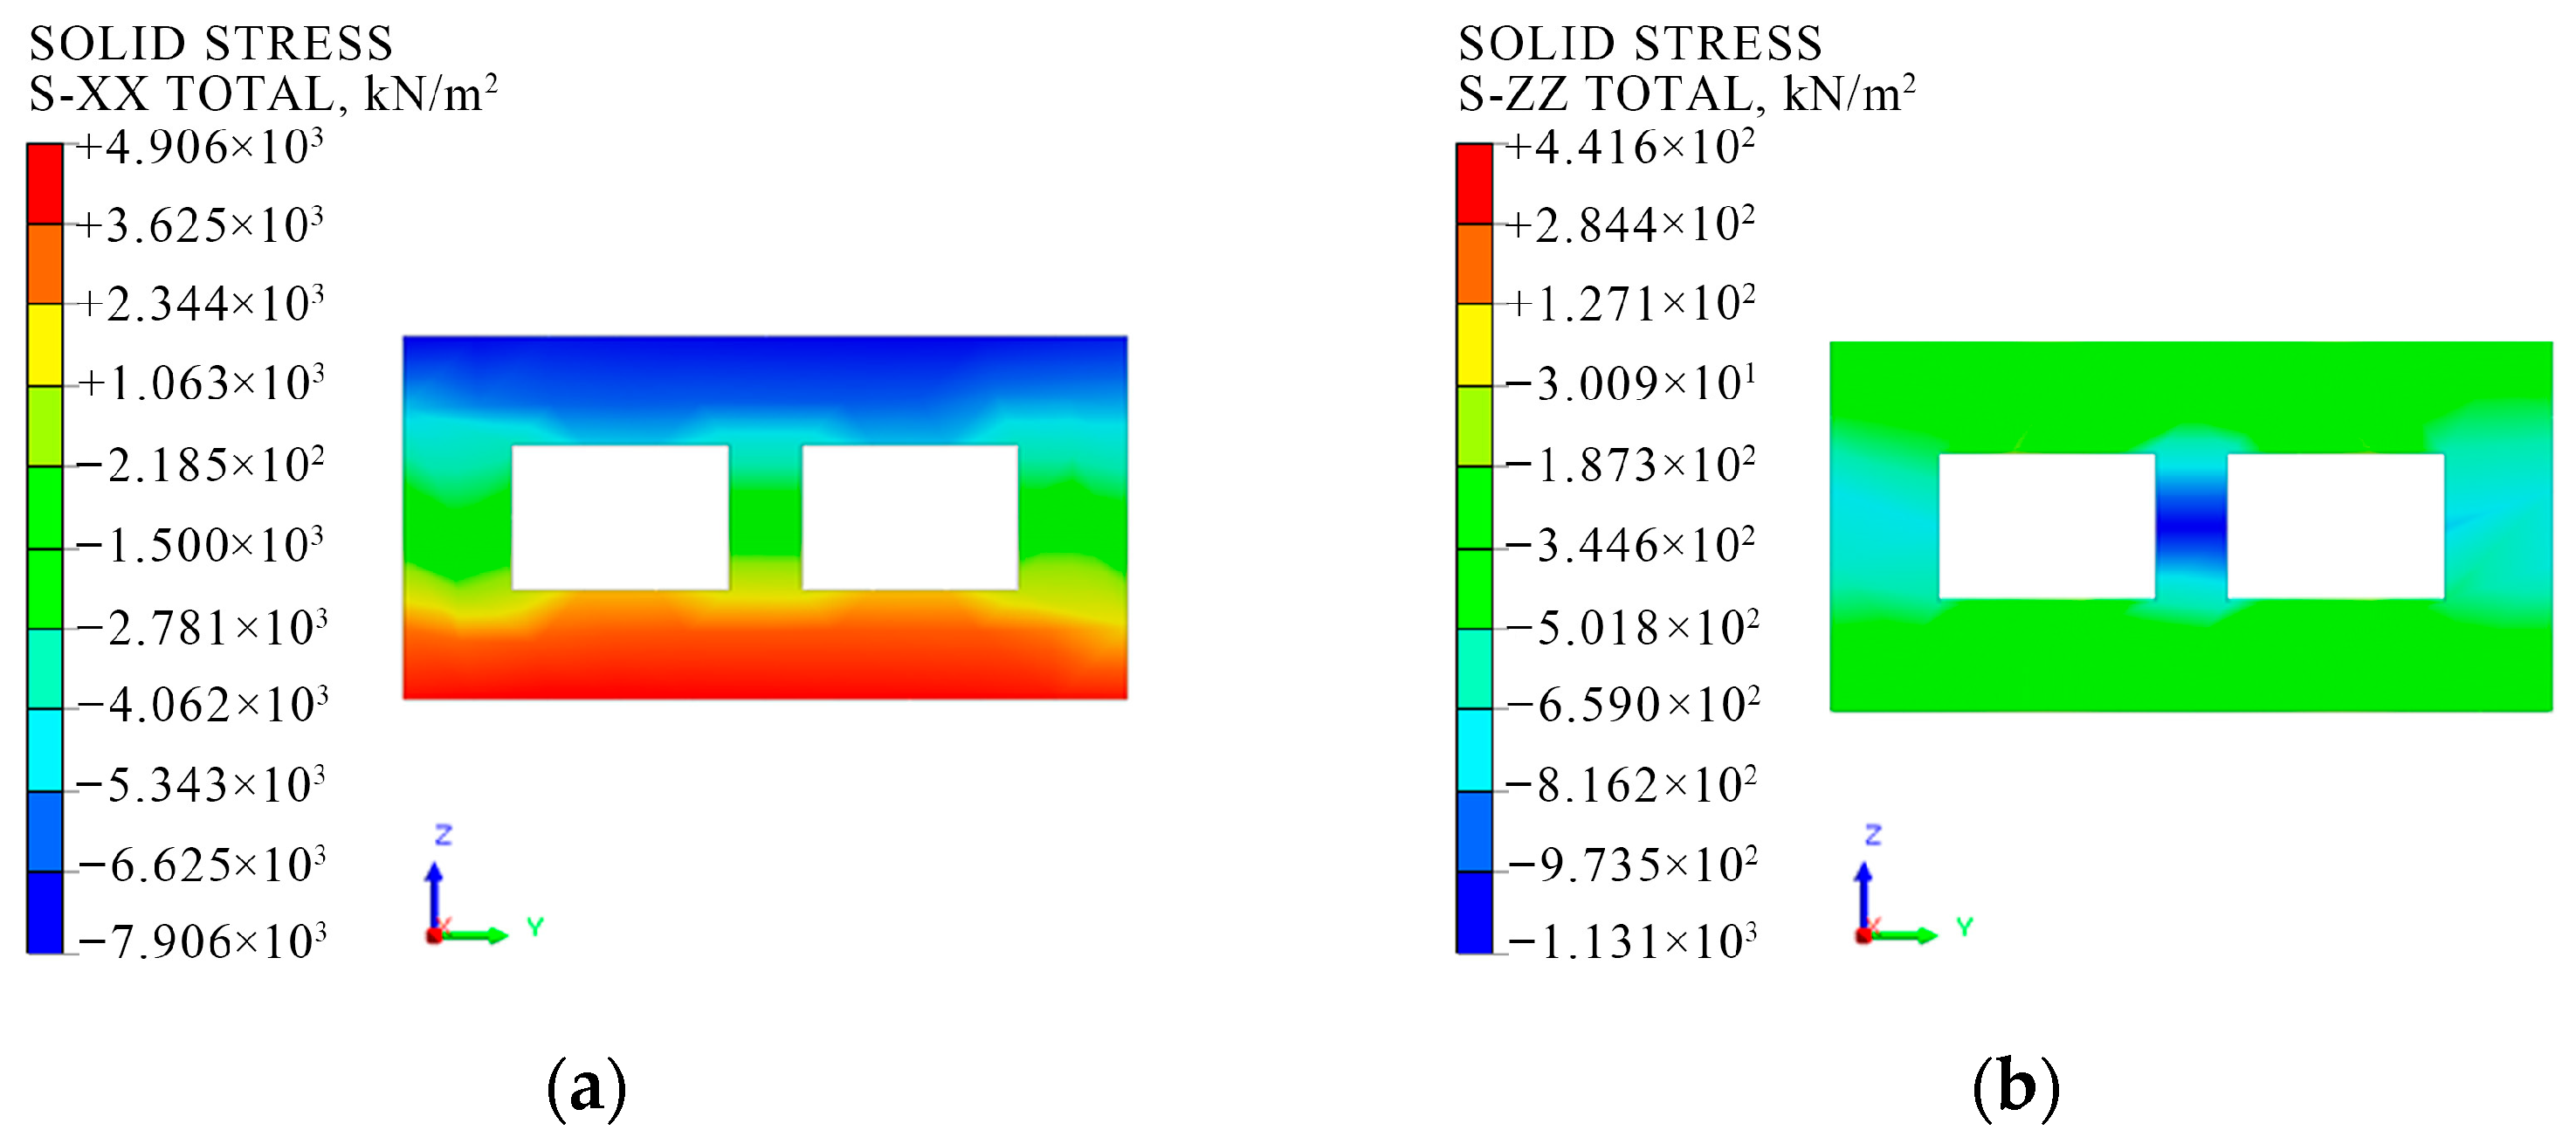
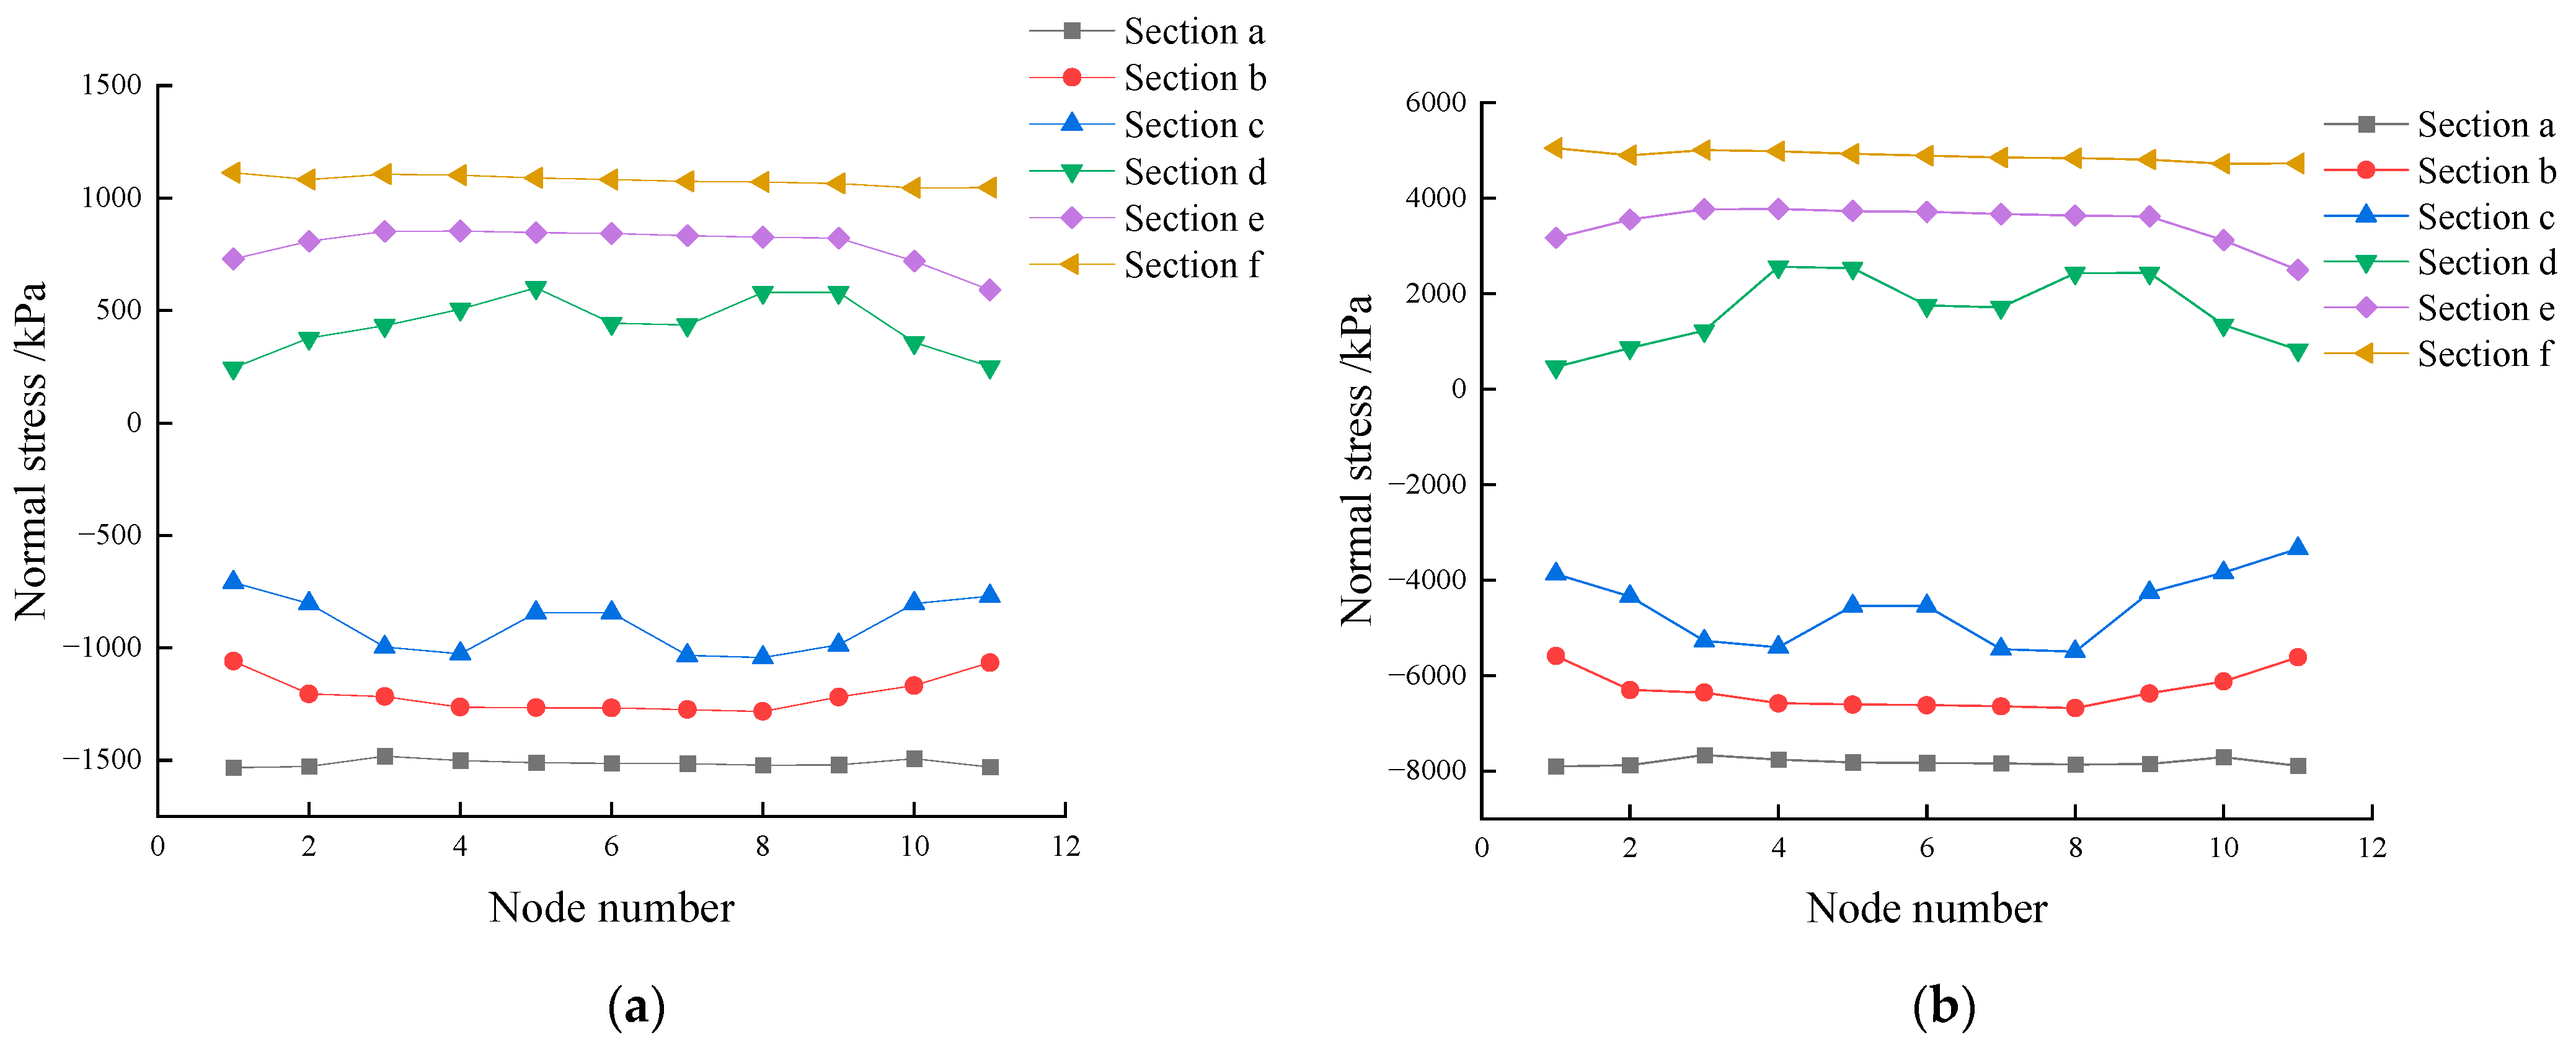
Given the complexity of the stresses in Models M-1 and M-2 and the heightened visibility of stress changes under condition 2, the MISES stresses in the span of the vault structure exhibit a heightened concentration. To thoroughly investigate the impact of closed cavities on structural stress paths, the closed cavity thin-walled component in the vault structure (i.e., Section 2) is intercepted for an analysis of stress distribution. To facilitate the study of the stress changes from the upper and lower flanges to the near closed cavities, six positions (a–f) at the flanges, in the middle and near the closed cavities, were selected. The stress values at 11 points were extracted sequentially from left to right, as shown in Figure 13. As illustrated in Figure 14, a schematic representation of the stress distribution within the closed cavity section under condition 2 is provided. As illustrated in Figure 15, the distribution of normal stresses in the closed cavity cross-section is depicted under two distinct working conditions.
As illustrated in Figure 14, the upper and lower flanges exhibit negligible shear stresses. Conversely, the maximum shear stress is observed in the middle rib. This indicates that the shear force of the closed cavity section is predominantly supported by the rib. With regard to normal stress, the structure is subject to compression at the upper flange and tension at the lower flange under compressive bending loads during the use phase. The maximum stress value is observed at the upper and lower flanges. Combined with Figure 15, it is found that the normal stresses of the cavity structure are unevenly distributed under the two working conditions: the normal stresses on both sides of the flanges (section a and f) are essentially equivalent, while the normal stresses in the middle of the flanges (section b and e) are slightly larger than those on both sides, and they are distributed in an arch shape. The distribution of the normal stresses in the vicinity of closed cavity positions (section c and d) exhibits notable undulations, with the smallest at both sides, and the largest at the middle rib, showing a W-shaped distribution.

3.4. Validation of On-Site Monitoring

In order to verify the reliability of the finite element results, after the assembly segment was assembled, 10 sets of monitoring data from the vault and the side wall were extracted from the first phase of monitoring work. The monitoring data obtained from the designated monitoring points were compared with the displacement deformation of the finite element model under condition 1. The comparison table between the simulated values and the field monitoring values is shown in Table 10. As demonstrated in Table 10, following the assembly of the segment into a ring, the finite element calculation yielded a vertical displacement of 4.3 mm at the arch crown. The maximum on-site monitoring value was 5.2 mm, and the average value was 3.93 mm. The finite element calculation yielded a horizontal displacement of 0.8 mm at the top of the side wall, while the maximum on-site monitoring value was 1.2 mm and the average value was 0.72 mm. The findings of the present study demonstrate a high degree of concordance between the finite element simulation results and the on-site monitoring data.

4. Discussion

4.1. Analysis of Mechanism of Structural Internal Force Changes

The analysis of the results indicates that the use of prefabricated components in the structure of a metro station, with these components installed within closed cavities, results in a significant reduction in the majority of the cross-sections of the internal forces. This finding suggests that the cavity rate of the structure exerts a notable influence on the internal forces of the structure. Furthermore, it is evident that a substantial reduction in the structural self-weight leads to a considerable decrease in the maximum value of the internal forces. This phenomenon is analogous to the Ding et al. study on the cavity rate of 18.35% of the seven-block prefabricated metro station of the closed cavity internal force change rule [35]. A comparison of condition 1 to condition 2 reveals a decline in the maximum axial force reduction rate from 10.19% to 3.40%. Similarly, the maximum shear force reduction rate experiences a decrease from 15.12% to 3.12% and the maximum bending moment reduction rate shows a decline from 14.14% to 3.37%. The findings indicate that as the load capacity is augmented, the rate of reduction in internal force diminishes. This observation aligns with the conclusions of Tao et al. concerning the mechanical performance of the closed cavity thin-walled component employed in the Changchun prefabricated metro station with seven blocks [36].
Furthermore, this study found that the locations of closed cavities and prefabricated component joints are structural weak points and the key to the structural stability of the prefabricated metro station. The first seven observed sections, which function as the key nodes for transverse and vertical load transfer, exhibited a significant influence from the closed cavities on their internal forces. In contrast, the floor, due to its cast-in-place construction, lacked closed cavities and consequently experienced a uniform distribution of loads, resulting in minimal alterations to the internal forces. In comparison with condition 1, which is subject only to self-weight, condition 2 incorporates lateral soil pressure, water pressure, and ground overload. This results in a significant change in the shear force at the mortise–tenon joint locations (sections 4 and 7). These sections correspond to the extreme value points of the bending moment change curve and the position of the sudden change in the shear change curve. This conforms to the differential relationship between shear force and bending moment and verifies that the model conforms to the basic theory of structural mechanics.

4.2. Exploration of Structural Deformation Performance and Safety

The presence of closed cavities in the structure results in several notable effects. Firstly, it leads to a reduction in the self-weight of the structure. Secondly, it causes a decrease in local stiffness. Thirdly, the configuration of the closed cavities results in the concentration of stress in specific areas, thereby increasing the principal strain. However, in condition 2, the principal strain of M-2 remains within the allowable range of the specification, although it exceeds that of M-1. This finding suggests that the closed cavity structure exhibits enhanced deformation coordination within a specific range of load and possesses the capacity to adapt to variations in load without excessive deformation. This finding aligns with the conclusions of Tao et al., who posited that when a solid structure is configured with a closed cavity, the stress distribution within the structure becomes relatively centralized [36]. Consequently, the load-bearing capacity and stiffness are diminished, yet the internal force within the cross-section is reduced, thereby enhancing the ductility performance.
Under identical loading conditions, the maximum principal strain and minimum principal strain concentration locations of the solid structure and the cavity structure exhibit a high degree of consistency, coinciding at the point of intersection between the structural geometric mutations. Condition 2 involves modifications to the loading pattern when compared with condition 1. The addition of lateral horizontal loads, such as soil and water pressure, results in the heightened tensile and compressive deformation of the structure. Furthermore, the incorporation of vertical loads, including ground overload and crowd equipment, leads to an exacerbation of the compressive deformation of the metro station structure. The hazardous area of the structure was altered from the columns to the joint locations of the prefabricated members due to the combined effect of these bending deformations and vertical loads. This also demonstrates that in the joints of prefabricated components, i.e., the geometrically discontinuous intersection, it is easy to produce stress concentration phenomena, which are potential risk points of structural tensile damage. In structural design, it is therefore essential to optimize the form of joints, such as increasing reinforcement in the connection position or setting stiffening ribs, so as to improve the integrality and stability of the structure.
With regard to displacement and deformation, the incorporation of closed cavities will result in a modest augmentation of structural displacement, irrespective of whether the displacement is vertical or horizontal. In condition 2, the vault structure is subjected to self-weight and overburden pressure, and the maximum settlement displacement occurs at the top of the arch. In contrast to condition 1, the floor of the station is subject to the action of water, resulting in an upward movement. This, in turn, causes the medium plate to rise slightly and the deformation of the “upper arch” through the force transmission of the columns. Horizontal displacement is indicative of the deformation response of the structure under lateral load; thus, it is the core index by which the lateral stiffness and overall stability of the structure are determined. Condition 2 exerts lateral soil and water pressure, thereby reducing the lateral stiffness of the subway station structure and increasing the horizontal displacement. The joint position where the stiffness changes suddenly is susceptible to damage, and the grouted mortise–tenon joints that connect the vault with the side walls become the position where the maximum horizontal displacement occurs. However, the increment of displacement deformation decreases with the increase in load, indicating that the existence of closed cavities helps to stabilize the deformation of the structure when subjected to a large load, thereby slowing the deformation growth of the structure. This is beneficial to the long-term stability and safety of the structure. Furthermore, a comparison of the on-site monitoring data extracted from the corresponding locations with the simulation results revealed a high degree of consistency between the two sets of data. Specifically, a vertical displacement difference of 0.37 mm was observed at the arch crown, and the horizontal displacement at the top of the side wall differed by only 0.08 mm. The errors may stem from the simplified material constitutive model and idealized boundary conditions, which can be influenced by the on-site construction environment and construction processes. This has the potential to lead to discrepancies between actual operations and design expectations. However, the small peak deviations suggest that the finite element model is reliable, thereby enhancing the credibility of the research conclusions.

4.3. Structural Stress Distribution and Optimization Design Recommendations

Despite the simplification of the joint modeling, this study’s conclusions are deemed reliable. The current model is capable of identifying the mortise–tenon joint as a weak point in the structural load-bearing capacity, thus providing a framework for future research in this area. Furthermore, the current model calculates the maximum stress at the joint to be 19.43 MPa, which is below the design value for the axial compressive strength of C45 concrete. Notwithstanding the consideration of the local stress increase caused by slippage, which the simplified model does not account for, a conservative estimate suggests an increase of no more than 10%, resulting in a maximum stress of 21.37 MPa. This is close to but does not exceed the code limit. This finding suggests that the stress calculation results of the current model are conservative. Subsequent research will build on the current study by introducing a concrete plastic damage model to conduct localized investigations on grouted mortise–tenon joints and analyze the influence of different structural parameters on the joint’s load-carrying capacity. These structural parameters may include the length of the tenon and mortise, and the thickness of the grout layer. This research will provide designers with more precise guidance for optimizing joint construction.
The result that the closed cavity does not have a substantial effect on the stress distribution of the structure may be due to the fact that the size and shape of the closed cavity are relatively small in the overall structure, with a cavity ratio of only 9.71%, which has a limited effect on the stress transfer path and distribution pattern of the structure. This finding aligns with the conclusion that the mechanical properties of closed cavity thin-walled components are analogous to those of ribbed T-shaped, I-shaped, and box-shaped sections, but with a low degree of influence by Huang, who selected the seven-block fully prefabricated metro station of Changchun Metro as the research object [41].
The W-shaped distribution of normal stress in the closed cavity section is indicative of a shear lag effect, which is attributable to the presence of closed cavities. The formation of normal stress is attributed to the bending of the cross-section, resulting in the shear deformation of the longitudinal rib plate and subsequent transfer to the upper and lower flanges. The shear force is transferred vertically through the middle rib, resulting in the concentration of shear stress at the intersection of the flanges and the ribs. Concurrently, the shear force transferred decreases, and hysteresis occurs in the transverse flange, resulting in the minimum stress on both sides. The rib plate, as the main shear part of the cross-section, bears the majority of the shear force, while the upper and lower flanges primarily carry the axial force and bending moment, which contribute comparatively less to the shear force transfer process. This finding aligns with the conclusions of Yang and Han et al., who, through a comparative analysis of flat members and actual closed cavity thin-walled components utilizing finite element methods, found that the shear stress distribution of closed cavity thin-walled components existed very different from that of conventional solid structures and showed a non-uniform distribution [9,37].
In light of the aforementioned research, the distribution of normal stress in the closed cavity section demonstrates a substantial discrepancy attributable to the shear lag effect. The stress values recorded were 2560 kPa at the upper extremity of the middle rib and 465 kPa on the lateral ribs. This discrepancy has been shown to result in elevated levels of stress. Consequently, when designing closed cavity sections, it is imperative to investigate the influence of rib plate quantity and width on stress pathways to mitigate shear lag phenomena. Furthermore, given that the maximum stress peak in the cavity structure is 19.43 MPa and is concentrated at the joint, it is advisable to avoid closed cavities in weak areas where components intersect to enhance structural safety.

4.4. Research Limitations and Application Value

By comparing and analyzing the internal forces, deformation, and stress change laws of a solid structure and a cavity structure, the current study reveals the mechanical response law of a four-block prefabricated metro station with a cavity rate of 9.71%, and puts forward optimization measures for the design of the cavity structure to promote the research and development of a more lightweight prefabricated metro station. However, there are still some limitations.
In condition 1, the stress on the middle rib is 2.47 times that of the side ribs. In the context of condition 2, the stress on the middle rib is observed to be 5.51 times that of the side ribs. A thorough analysis indicates that the ribs of closed cavity thin-walled components can exert a significant influence on stress paths, resulting in the formation of localized stress concentrations and the subsequent amplification of stress within the cross-section. It is necessary to systematically investigate the effects of the geometric parameters of the closed cavity, such as the height-to-width ratio of the closed cavity and the number and thickness of the ribs, on the redistribution of internal forces and stress concentration within the component. This will provide quantitative criteria for the optimized design of closed cavity thin-walled components.
Furthermore, it has been determined that the stresses and strains of condition 2 are significant. This suggests that the deformation characteristics of the structure are contingent upon the complexity of the loading. Meanwhile, the results of this study indicated that the maximum strain, maximum displacement, and maximum stress were concentrated in the mortise–tenon joints and columns. Liu et al. established a soil structure finite element model and concluded that columns were the key supporting members of the prefabricated metro station [27]. They investigated the load-bearing capacity of the connecting nodes of the prefabricated components through low load-bearing capacity, weekly repeated tests and determined that the strength and stiffness of the connections between the components were the key to the seismic performance. Consequently, it is imperative to explore the load-bearing capabilities of cavity structures when subjected to dynamic loads, such as seismic waves and train vibrations, in subsequent studies. Furthermore, to improve the durability of the station structure, FE-SMA can be innovatively used to reinforce the joints. FE-SMA reinforcement bars could be embedded in the columns and the tenons of mortise and tenon joints. The active pre-compressive stress applied would effectively offset part of the tensile stress and reduce stress concentration. Additionally, the shape memory properties of FE-SMA facilitate automatic recovery from deformation, effectively suppressing micro-cracks and enhancing load-bearing stability. This renders it suitable for long-term dynamic load environments in underground structures.

5. Conclusions

The seven-ring structure of the Qingdao prefabricated metro station was selected as the object of study. Through the implementation of numerical simulation, three-dimensional finite element models were developed for the solid structure and cavity structure. These models were utilized to analyze the force and deformation characteristics of both structures under two distinct conditions. The following conclusions were derived from this analysis:
  • When closed cavities are set within the structure, the internal forces in most cross-sections decrease, particularly at the mortise–tenon joint, where the axial force decreases by approximately 10.2%. Furthermore, as the applied load increases, the reduction rate of internal forces in the cavity structure also decreases. The maximum reduction rate for the axial force decreases from 10.19% to 3.4%, the maximum reduction rate for the shear force decreases from 15.12% to 3.12%, and the maximum reduction rate for the bending moment decreases from 14.14% to 3.37%.
  • After adding the closed cavities, the principal strain, displacement, and stress of the structure slightly increase. As the applied load increases, the incremental vertical displacement deformation decreases from 0.48 mm to 0.05 mm, and the incremental horizontal displacement deformation decreases from 0.12 mm to 0.07 mm, which is beneficial for the overall stability of the structure. When subjected only to self-weight, the column functions as the primary load-bearing component at the midspan, with a significant stress concentration and a peak stress magnitude of 7.8 MPa. As the load increases, the location of maximum tensile and compressive deformation shifts from the column to the upper mortise–tenon joint, with the peak stress increasing to 19.43 MPa.
  • For closed cavity sections, a substantial shear lag effect is observed. The shear force is transmitted through the rib plate, resulting in the maximum shear stress in the middle rib. Since the shear force decreases as it is transmitted laterally toward both sides of the flange, the maximum normal stress occurs near the middle rib, while the minimum normal stress is found at the side ribs, resulting in an uneven distribution. Under self-weight conditions alone, the stress in the middle rib is found to be 2.47 times greater than that observed in the side ribs. As the load increases, the stress difference between the middle rib and the side ribs increases to 5.51 times, with the shear lag effect becoming more pronounced.
  • The maximum stress observed at the mortise–tenon joint reaches 19.43 MPa. As this is an unfavorable location for load bearing, novel connection technologies and joint types can be developed to prevent collapse and ensure overall stability. The internal space of the closed cavity can be filled with self-healing lightweight materials, which can serve both insulating and structural strengthening purposes. These cavities can also be embedded with sensors for real-time intelligent monitoring. Alternatively, the space can be used as a pipeline channel to improve space utilization and promote the development of prefabricated metro stations in the direction of more lightweight, intelligent, and sustainable designs.

Author Contributions

D.C.: The author assumes responsibility for the following: conceptualization, original draft, review, and editing. D.K.: The author is responsible for the conceptualization, original draft, and review and editing of the text. All authors have read and agreed to the published version of the manuscript.

Funding

This research received no external funding.

Institutional Review Board Statement

Not applicable.

Informed Consent Statement

Not applicable.

Data Availability Statement

The experimental data used to support the findings of this study are included in the article.

Conflicts of Interest

The authors declare no conflicts of interest.

References

  1. Baghchesaraei, O.R.; Lavasani, H.; Baghchesaraei, A. Behavior of Prefabricated Structures in Developed and Developing Countries. In Bulletin de la Société Royale des Sciences de Liège; Société Royale des Sciences de Liège: Liège, Belgium, 2016. [Google Scholar]
  2. Zhu, M.; Rao, W.; Hong, C.Y.; Chen, X.S.; Dai, J.; Wu, C.G.; Li, M.T. Displacement measurement of underground prefabricated metro stations by computer vision technology. Measurement 2024, 231, 114500. [Google Scholar] [CrossRef]
  3. Qiu, T.; Chen, X.S.; Su, D.; Zhang, J.Q.; Xu, Z.Y. Multi-hazard vulnerability for single-walled full-assembled underground stations. Structures 2023, 48, 602–615. [Google Scholar] [CrossRef]
  4. Huang, M.Q.; Chen, X.L.; Ninic, J.; Bai, Y.; Zhang, Q.B. A framework for integrating embodied carbon assessment and construction feasibility in prefabricated stations. Tunn. Undergr. Space Technol. 2023, 132, 104920. [Google Scholar] [CrossRef]
  5. Yang, X.R.; Lin, F. Research and application of prefabrication and assembly construction technology for metro station structures. In Proceedings of the ITA-AITES World Tunnel Congress (WTC)/49th General Assembly of the International-Tunnelling-and-Underground-Space-Association (ITA-AITES), Athens, Greece, 12–18 May 2023; pp. 1101–1109. [Google Scholar]
  6. Lin, F.; Yang, X.R. Mechanical properties analysis of joints for prefabricated metro station structure based on Whole-process in-situ monitoring. Tunn. Undergr. Space Technol. 2023, 138, 105202. [Google Scholar] [CrossRef]
  7. Xiuren, Y.; Meiqun, H.; Zhiyong, P.; Fang, L. Calculation of dynamic assembly and tensioning loads at multiple points of prefabricated structure. Tunn. Undergr. Space Technol. 2022, 126, 104564. [Google Scholar] [CrossRef]
  8. Li, Q.L.; Li, Y.Z.; Tan, Z.S.; Li, L.F.; Cao, Y.X. Research on the Mechanism of Load Transfer Structures in the Construction Process of “Internal Support-Large Block” Prefabricated Subway Stations. Sustainability 2024, 16, 10594. [Google Scholar] [CrossRef]
  9. Yang, X.R.; Lin, F. Research on prefabricated metro station structure and key assembly technologies. Tunn. Undergr. Space Technol. 2024, 153, 106029. [Google Scholar] [CrossRef]
  10. Yang, X.R.; Shi, Z.H.; Lin, F. Research on Shear Capacity and Checking Method of MT•G-Joint for Application in Prefabricated Underground Structures. Adv. Mater. Sci. Eng. 2019, 2019, 4065301. [Google Scholar] [CrossRef]
  11. Tao, L.J.; Ding, P.; Yang, X.R.; Lin, P.; Shi, C.; Bao, Y.; Wei, P.C.; Zhao, J. Comparative study of the seismic performance of prefabricated and cast-in-place subway station structures by shaking table test. Tunn. Undergr. Space Technol. 2020, 105, 103583. [Google Scholar] [CrossRef]
  12. Qiu, T.; Sun, X.H.; Chen, X.S.; Su, D.; Zhang, J.Q.; Xu, Z.Y.; Song, R.; Wang, X.Y. Experimental study and resilience modeling for prefabricated hollow diaphragm walls of full-assembled underground stations under urban multi-disturbance conditions. Tunn. Undergr. Space Technol. 2023, 135, 105044. [Google Scholar] [CrossRef]
  13. Liu, Z.H.; Ma, X.F.; Wang, J.J.; Lu, L.H.; Zhang, H.H.; Han, H.; Zhou, D.Y.; Wang, W.D. Evaluation of seismic performance of novel prefabricated metro station roof-to-wall connection nodes. J. Build. Eng. 2025, 105, 112508. [Google Scholar] [CrossRef]
  14. Liu, T.J.; Lu, J.D.; Wang, D.; Liu, H.Y. Experimental Investigation of the Mechanical Behaviour of Wall-Beam-Strut Joints for Prefabricated Underground Construction. Int. J. Concr. Struct. Mater. 2021, 15, 2. [Google Scholar] [CrossRef]
  15. Wu, J.Y.; Ma, S.; Wang, R.; Ou, F.Q.; Liang, Y.; Zhao, W.G.; Xie, K.Z.; Wang, S.P. A novel technique for constructing prefabricated subway stations under open excavation with inner support. Proc. Inst. Civ. Eng.-Eng. Sustain. 2023, 177, 299–308. [Google Scholar] [CrossRef]
  16. Cao, K.; Wan, Y.C.; Zhou, X.H. Application and research progress of prefabricated assembly technology in underground engineering. Chin. J. Undergr. Space Eng. 2023, 19, 2055–2071. [Google Scholar]
  17. Wu, C.G.; Li, M.T.; Peng, Z.Y. Cross-section structure selection of prefabricated station in Shenzhen metro line 16. Tunn. Constr. 2022, 42, 320–327. [Google Scholar]
  18. Yang, X.R.; Lin, F.; Huang, M.Q. Experimental Analysis of Bending Stiffness Characteristics of Grouted Double Mortise-Tenon Joint for Prefabricated Metro Station Structure. Adv. Civ. Eng. 2021, 2021, 9958436. [Google Scholar] [CrossRef]
  19. Yang, X.R.; Lin, F.; Huang, M.Q. Experimental Research on Bending Bearing Capability of Grouted Double Mortise-Tenon Joint for Prefabricated Metro Station Structure. Adv. Civ. Eng. 2021, 2021, 6635409. [Google Scholar] [CrossRef]
  20. Yang, X.R.; Shi, Z.H.; Lin, F. Influence of Geometrical Parameters on Performance of Grouted Mortise and Tenon Joints for Application in Prefabricated Underground Structures. Adv. Civ. Eng. 2019, 2019, 3747982. [Google Scholar] [CrossRef]
  21. Xiang, B.Q.; Cui, L.Z.; Ding, W.T.; Tang, W.D.; Yue, T.S.; Qin, W. Study on the Influence of Geometric Parameters and Shape Optimization of Single Tenon Joint in Assembled Subway Station. Adv. Civ. Eng. 2023, 2023, 278404. [Google Scholar] [CrossRef]
  22. Qiu, T.; Chen, X.S.; Su, D.; Zhang, J.Q.; Song, R.; Wang, J.; Meng, D. Full-scale experimental study and mechanical model for beam-wall joints of prefabricated enclosure structure. Eng. Struct. 2023, 294, 116807. [Google Scholar] [CrossRef]
  23. Qiu, T.; Zhang, J.Q.; Chen, X.S.; Xu, Z.Y.; Su, D.; Song, R.; Cui, T. Experimental investigation and mechanical model for assembled joints of prefabricated two-wall-in-one diaphragm walls. Eng. Struct. 2023, 275, 115285. [Google Scholar] [CrossRef]
  24. Yang, X.R.; Lin, F.; Huang, M.Q. Analysis of the Law of Joint Deformation for Grouted Mortise-Tenon Joint. Adv. Civ. Eng. 2022, 2022, 2909993. [Google Scholar] [CrossRef]
  25. Ding, P.; Tao, L.J.; Yang, X.R.; Zhao, J.; Shi, C. Three-dimensional dynamic response analysis of a single-ring structure in a prefabricated subway station. Sustain. Cities Soc. 2019, 45, 271–286. [Google Scholar] [CrossRef]
  26. Tao, L.J.; Shi, C.; Ding, P.; Yang, X.R.; Bao, Y.; Wang, Z.G. Shaking table test of the effect of an enclosure structure on the seismic performance of a prefabricated subway station. Tunn. Undergr. Space Technol. 2022, 125, 104533. [Google Scholar] [CrossRef]
  27. Liu, H.T.; Xu, C.S.; Du, X.L. Seismic response analysis of assembled monolithic subway station in the transverse direction. Eng. Struct. 2020, 219, 110970. [Google Scholar] [CrossRef]
  28. Chen, J.N.; Xu, C.S.; El Naggar, H.M.; Du, X.L. Study on seismic performance and index limits quantification for prefabricated subway station structures. Soil Dyn. Earthq. Eng. 2022, 162, 107460. [Google Scholar] [CrossRef]
  29. Tao, L.J.; Li, Z.Y.; Yang, X.R.; Ding, P.; Shan, X.Y. Research of the mechanical behaviors of subway station structure assembled with prefabricated elements based on ABAQUS. Mod. Tunn. Technol. 2018, 55, 115–123. [Google Scholar] [CrossRef]
  30. Khakimov, A.; Kutumova, G.; Mirzaeva, Z. Current trends in the development of automation surveying support in the construction of subways. In Proceedings of the 2nd International Scientific Conference on Essays of Mining Science and Practice, Dnipro, Ukraine, 22–24 April 2020. [Google Scholar]
  31. Ding, X.L.; Zhang, Z.G.; Wang, X.X.; Wang, R.; Huang, R.J.; Zhao, W.G.; Gao, S.; Xie, K.Z.; Wang, S.P. Three-dimensional analysis of a prefabricated subway station during construction. Proc. Inst. Civ. Eng.-Civ. Eng. 2023, 177, 89–102. [Google Scholar] [CrossRef]
  32. Hong, C.Y.; Rao, W.; Qiu, T.; Chen, X.S.; Dai, J.; Wu, C.G.; Li, M.T.; Chen, W.B. Monitoring and assessment of mechanical response of large-scale prefabricated structures in underground subway stations during construction process. Measurement 2024, 235, 115015. [Google Scholar] [CrossRef]
  33. Qiu, T.; Chen, X.S.; Song, R.; Su, D.; Zhang, R.X.; Zhang, J.Q.; Xu, Z.Y.; Cui, T.; Wang, X.Y. Experimental investigation and modeling for assembled precast hollow components in full-assembled underground station application. Tunn. Undergr. Space Technol. 2024, 144, 105543. [Google Scholar] [CrossRef]
  34. Yang, X.R.; Lin, F. Prefabrication technology for underground metro station structure. Tunn. Undergr. Space Technol. 2021, 108, 103717. [Google Scholar] [CrossRef]
  35. Ding, P.; Tao, L.J.; Yang, X.R.; Zhao, J.; Liu, C.X.; Li, S.C. Optimum design of closed cavity structure for prefabricated metro station. J. Beijing Univ. Technol. 2019, 45, 946–955. [Google Scholar]
  36. Tao, L.J.; Shi, C.; Ding, P.; Li, S.C.; Wu, S. Study on the influence of thin-walled closed cavity on the mechanical properties of the prefabricated subway station. Chin. J. Undergr. Space Eng. 2021, 17, 776–785. [Google Scholar]
  37. Han, Y.Z.; Zhang, L.; Nie, X.F.; Zhang, L.W.; Pan, H. Study on the Stress Transfer Principle of Closed Cavity Thin-Walled Components in Assembled Underground Structures. In Proceedings of the 22nd COTA International Conference of Transportation Professionals (CICTP)—Intelligence, Connectivity, and Mobility, Changsha, China, 8–11 July 2022; pp. 2363–2373. [Google Scholar]
  38. Yang, X.R. Theory and Application of Prefabricated Open-Cut Metro Station Structure. Ph.D. Thesis, Beijing Jiaotong University, Beijing, China, 2020. [Google Scholar]
  39. Han, Y.Z.; Zhang, L.; Nie, X.F.; Pan, H.; Zhang, L.W. Study on Shear Lag Effect of Closed Cavity Thin-Walled Components in Assembled Underground Structures. In Proceedings of the 22nd COTA International Conference of Transportation Professionals (CICTP)—Intelligence, Connectivity, and Mobility, Changsha, China, 8–11 July 2022; pp. 2315–2320. [Google Scholar]
  40. Han, Y.Z.; Zhang, L.; Nie, X.F.; Pan, H.; He, J.Z. Study on Shear Sharing Principle of Closed Cavity Thin-Walled Components in Assembled Underground Structures. In Proceedings of the 22nd COTA International Conference of Transportation Professionals (CICTP)—Intelligence, Connectivity, and Mobility, Changsha, China, 8–11 July 2022; pp. 2321–2328. [Google Scholar]
  41. Huang, M.Q. Key technology for design of closed-cavity thin-walled precast components of underground structures. Tunn. Constr. 2022, 42, 471–477. [Google Scholar]
  42. GB 50666-2011; Code for Construction of Concrete Structures. China Architecture & Building Press: Beijing, China, 2011.
  43. Zan, Z.H.; Wang, R. Research on mechanical properties of assembled subway stations based on new connection joints. Chin. J. Undergr. Space Eng. 2024, 20, 518–526. [Google Scholar] [CrossRef]
Figure 1. Main body and auxiliary structure of Chengzi Station.
Applsci 15 09674 g001
Figure 2. Prefabricated standard ring block diagram.
Applsci 15 09674 g002
Figure 3. Schematic diagram of tenon groove grouting pipe layout.
Applsci 15 09674 g003
Figure 4. Internal cavity layout schematic diagram.
Applsci 15 09674 g004
Figure 5. Schematic diagram of C-B1 grouted mortise–tenon joint.
Applsci 15 09674 g005
Figure 6. Schematic diagram of loads during the use phase.
Applsci 15 09674 g006
Figure 7. Schematic diagram of internal force observation section.
Applsci 15 09674 g007
Figure 8. Graph of variation in internal force in critical section: (a) axial force diagram; (b) shear diagram; (c) bending moment diagram.
Applsci 15 09674 g008
Figure 9. Principal strain clouds for Model M-2: (a) maximum principal strain for condition 1; (b) maximum principal strain for condition 2; (c) minimum principal strain for condition 1; (d) minimum principal strain for condition 2.
Applsci 15 09674 g009
Figure 10. Displacement clouds for Model M-2: (a) vertical displacement for condition 1; (b) vertical displacement for condition 2; (c) horizontal displacement for condition 1; (d) horizontal displacement for condition 2.
Applsci 15 09674 g010
Figure 11. Stress clouds of Model M-2 for condition 1: (a) MISES stress; (b) maximum principal stress; (c) minimum principal stress.
Applsci 15 09674 g011
Figure 12. Stress clouds of Model M-2 for condition 2: (a) MISES stress; (b) maximum principal stress; (c) minimum principal stress.
Applsci 15 09674 g012
Figure 13. Schematic diagram of the extraction location of normal stress in the closed cavity section.
Applsci 15 09674 g013
Figure 14. Clouds of stress distribution in closed cavity section for Condition 2: (a) normal stress; (b) shear stress.
Applsci 15 09674 g014
Figure 15. Normal stress distribution curve of Model M-2 closed cavity section: (a) condition 1; (b) condition 2.
Applsci 15 09674 g015
Table 1. Parameters of single-ring solid structure.
Physical ParameterSingle-Ring Solid Structure (C+B1+B2)Total
CB1B2
Volume/m348.7617.6217.6284
Mass/t121.8944.0644.06210.01
Table 2. Structural material parameters.
Prefabricated ComponentsStrength GradeCapacity/(kN/m3)Poisson’s RatioModulus of Elasticity/MPa
E, ZLC35250.23.15 × 104
A, B, CC45250.23.35 × 104
ZZC50250.23.45 × 104
Table 3. Finite element model main parameters and working condition settings.
ModelStructural TypeLayout of Closed CavitiesWidth of
Single Closed Cavity/mm
Cavity Rate/%Number of UnitsGrouted
Mortise–Tenon Joints
Contact PairsType of Load
Condition 1Condition 2
M-1Solid structureNone00200,564YesYesDead weightUse phase load
M-2Cavity structure2 rows6009.71246,021YesYesDead weightUse phase load
Table 4. Soil physical parameters.
Name of Soil LayerThickness/mVolumetric Weight/(kN/m3)Lateral
Pressure
Coefficient
Vertical Bed
Coefficient/
(MPa/m)
Horizontal Bed Coefficient/
(MPa/m)
Plain fill1.99200.651010
Silty clay3.2200.471816
Medium sand3.4210.391515
Coarse sand4.9210.355045
Strongly weathered muddy siltstone1.321.50.35160135
Moderately weathered muddy siltstone12.66220.28220200
Table 5. Comparison of internal forces in different sections of Models M-1 and M-2 for condition 2.
Cross-SectionVault StructureSide WallFloorMedium PlateGrouted
Mortise–Tenon Joints
1235613101247
Axial force/kNM-1−2229.6−2241.8−2104.8−2590.9−2943.6−2146.6780.06794.1−1266−1859.7
M-2−2173.6−2189.5−2028.8−2514.3−2843.4−2139.8716.5746.65−1136.3−1720
Reduction rate/%2.52.33.62.93.40.38.15.910.27.5
Shear force/kNM-123.494−487.7−1468.1783.9−361.72560.45−238.87−92.145914.11−1891.1
M-224.367−348.12−1422.3751.81−316.65562.13−188.25−92.861875.7−1784.6
Reduction rate/%−3.728.63.14.112.5−0.321.2−0.84.25.6
Bending moment/(kN·m)M-1−2976.2−2573.8348.78−113.11−409.48257.9393.67380.7162480.12652.8
M-2−2876−2434.6346.43−103.24−385.53257.6292.38580.07723632594.3
Reduction rate/%3.35.40.78.75.80.11.40.84.72.2
Table 6. Comparison of maximum values of internal forces in sections.
Internal ForcesCondition 1Condition 2
M-1M-2Reduction Rate %M-1M-2Reduction Rate %
Axial force/kN954.97857.6610.192943.62843.43.40
Shear force/kN315.5267.315.121468.11422.33.12
Bending moment/(kN·m)693.74595.6714.142976.228763.37
Table 7. Comparison of the maximum values and locations of principal strain.
Principal Strain and LocationCondition 1Condition 2
M-1M-2M-1M-2
Maximum principal strain/10−57.417.5222.3624.63
LocationZZ-ZL junctionOutside of B-C joints
Minimum principal strain/10−5−22.74−22.79−61.73−63.74
LocationLower end of ZZInside of B-C joints
Table 8. Comparison of displacement maximum values and locations.
Displacement and LocationCondition 1Condition 2
M-1M-2M-1M-2
Maximum vertical displacement/mm−3.84−4.32−15.61−15.66
LocationThe vault structure (C)
Maximum horizontal displacement/mm0.680.803.113.18
LocationB-C Joints
Table 9. Stress maxima and locations.
Stress and LocationCondition 1Condition 2
M-1M-2M-1M-2
Maximum MISES stress/MPa7.87.818.4819.43
Locationcolumn (ZZ)Inside of B-C joints
Maximum principal stress/MPa2.352.337.698.56
LocationMedium plate (E)Outside of B-C joints
Minimum principal stress/MPa−8.12−8.15−22.37−22.76
Locationcolumn (ZZ)Inside of B-C joints
Table 10. Comparison of simulated values and field monitoring values.
Data CategoriesVertical Displacement of Vault/mmHorizontal Displacement at the Top of the Side Wall/mm
Simulated values4.30.8
Monitoring values 13.40.4
Monitoring values 22.70.4
Monitoring values 33.60.6
Monitoring values 44.60.6
Monitoring values 54.40.5
Monitoring values 65.20.8
Monitoring values 73.80.7
Monitoring values 84.51.1
Monitoring values 93.60.9
Monitoring values 103.51.2
Disclaimer/Publisher’s Note: The statements, opinions and data contained in all publications are solely those of the individual author(s) and contributor(s) and not of MDPI and/or the editor(s). MDPI and/or the editor(s) disclaim responsibility for any injury to people or property resulting from any ideas, methods, instructions or products referred to in the content.